
Submitted:
09 December 2025
Posted:
11 December 2025
You are already at the latest version
Abstract
Introduction: World Health Organization (WHO) through its current Global Benchmarking Tools (cGBT) used in the self-assessment of regulatory authorities, found that regulatory functions in general and laboratory testing in particular in countries with low regulation are not compliant with ISO/IEC 17025:2017 and WHO Trs No. 957, 2010. It was noted that, to date, in sub-Saharan Africa, fewer than 10 countries have authorities that have reached at least Maturity Level 3.
Objective: This study aimed to verify pharmacopeial methods in the detection of falsified medicines in accordance with ICH Q2(R1) requirements at in the D.R. Congo through a laboratory compliant with the ISO standard, estimated at maturity level 3.
Methodology: Five concentration levels were prepared: 110%, 100%, 90%, and 80%, from the stock solution corresponding to 120% for the APIs (6 antimalarials and 1 antibiotic) allowed to identify non-compliant samples during the period from 2021 to 2024.
Results: The methods, verified in compliance with ICH and WHO normative requirements, were deemed compliant and applicable under the applied conditions. And the non-compliant products were detected: 7/41 (17.1%) for Artemether & Lumefantrine, 3/11 (27.3%) for Sulfadoxine & Pyrimethamine, 1/46 (2.2%) for injectable Artesunate and 5/41 (12.2%) for Artemether & Lumefantrine (without any active ingredient).
Conclusion: This research aimed to verify the relevance of pharmacopeial methods currently used in DR Congo for quality control to the ICH and WHO requirements with perspective of tackling medicines falsification. The obtained results showed the compliance of studied methods and allowed to identify substandard products for Artemether-Lumefantrine and Sulfadoxine and Pyrimethamine combinations. Also, they allowed the detection of lower concentration of Artesunate within injectable formulations. Which confirmed the real existence of the announced issue related to the falsified drugs circulation in developing countries.
Keywords:
falsification
; pharmacopeial methods
; substandard
; verification
; medicines
1. Introduction
The lack of an accredited drug quality control laboratory in the Democratic Republic of Congo (DRC) and the surrounding sub-region such as Central Africa remains a serious problem that must be addressed to fulfill its mandate and mission. This should include nationally and internationally recognized expertise, in controlling drugs and other health products circulating on the market and thus guaranteeing the quality of the presumed products for the benefit of the end users, i.e. Congolese population and abroad as well.
In 2017, the report of the Pharmaceutical Regulatory Authority of the Ministry of Public Health indicated statistics from four quality control laboratories approved by the Ministry of Health report that 0.5% of medicines and health products entering the DRC through customs are non-compliant. Of the 0.5% of non-compliant products reported, 45% are counterfeit medicines with no active ingredient, 45% are products with non-compliant labeling, and 10% are products that do not comply with intrinsic specifications [1,2,3,4]. Which are particularly dangerous for drugs such anti-infective (antibiotics, antivirals, antimalarials and antifungals), which can lead to development and emergence of resistant mutant pathogens. When such drugs are counterfeited and do not achieve their intended effectiveness, antimicrobial resistance occurs [5,6]. Nowadays, this situation represents one of the greatest health challenges, becoming a major cause of the epidemic’s worldwide resurgence. It poses a growing threat regarding to One-Health since potential transmission from animal to human, as well as to livelihoods and food security worldwide.
To address this challenge, the DRC Ministry of Public Health has prioritized strengthening the quality control of medicines in the country [7,8]. In 2012, a request was submitted to the WHO to conduct a feasibility study for the establishment of a national laboratory for the quality control of medicines (LNCQ). The objective was to help strengthen the quality assurance system for medicines in the DRC by exploring all aspects for the implementation of a quality control mechanism, including creation of a national laboratory for the quality control of medicines and other health products. The laboratory was created six years later under Ministerial decree 1250/CAB/MIN/S/020/GKK/SECMIN/2018 of 07/30/2018 as amended and supplemented to date by Order No. 1250/CAB/MIN/S/001/GKK/SECMIN/2019 of 01/23/2019. The laboratory got support from the United States Pharmacopoeia (USP) in its application for accreditation under the ISO/IEC 17025/2017 standard, and for support the Congolese Pharmaceutical Regulatory Authority in its mission of post-marketing surveillance of medicines, particularly for the detection of falsified and substandard medicines.
In this context, some pharmacopeial methods were verified before their routine application as recommended by the ISO/IEC 17025/2017 standard. The analyses were performed according to ICH Q2(R1) requirements in relation to the criteria applicable to new analytical methods to be validated or standard methods to be verified [9,10]. The quality control laboratory, being national, an instrument of the State, mainly performs routine analyses for the purpose of either granting marketing authorizations (MA) or post-MA quality assurance control (Risk-based post-market surveillance = RB-PMS). As such, the manufacturers' or pharmacopeias' methods are used to help the regulatory authority or control inspections to make informed decisions.
In this study, we aimed to verify the applicability of four analytical methods most used in the laboratory, including three for antimalarials (injectable of Artesunate, tablets of Artemether and Lumefantrine combination, tablets of Sulfadoxine and Pyrimethamine combination) and one for antibiotics (tables of Sulfamethoxazole and Trimethoprim). The verification of these methods was followed by their application to analyze samples marketed in the DRC with specific focus on falsified or substandard products.
The verified assay methods were based on the International Pharmacopeia for Artesunate, Artemether, and Lumefantrine, and from the USP for Sulfadoxine and Pyrimethamine, Sulfamethoxazole and Trimethoprim (current editions from 2021 to 2024). These antimalarial drugs are used in the treatment regimens for simple (uncomplicated) malaria, which is known to cause widespread damage in tropical countries [13-16]. However, Sulfamethoxazole and Trimethoprim is a widely consumed combination antibiotic, in self-medication and especially in combination with antiretrovirals. It should be noted that the used monographs did not undergo any changes after comparing the editions. Tablet and injectable powder forms were prioritized based on the frequency of their analysis requests.
2. Experimentation
2.1. Reagents
Dihydrogen phosphate (Na), Potassium dihydrogen phosphate, phosphoric acid (85%), acetonitrile (LC-grade), 1-propanol R, sodium hexanesulfonate, sodium dihydrogen phosphate, triethylamine, sodium hydroxide, and glacial acetic acid were supplied from Merck Laboratory (Darmstadt, Germany). Sulfadoxine (Batch R099P0-05/2034), Pyrimethamine (Batch R130F0-05/2034), Trimethoprim (Batch L0M053-05/2035), Sulfamethoxazole (Batch J1F148-05/2035) and Lumefantrine (Batch R041X0-05/2031) were supplied from the USP (Washington, USA), whereas Artesunate (Batch 3/ ICRS1409), Artemether (Batch 3 /ICRS1408), Artenimol (Batch 2/ ICRS1410) and impurity B (artemisinin, Batch 1/ ICRS 43857) were supplied from the International Pharmacopoeia (Bern, Switzerland).
Ultrapure water was produced using a water purification system ECN171-1095 (VWR, France). The various samples analyzed were provided by the Congolese Pharmaceutical Regulatory Authority.
2.2. Equipment
The qualitative and quantitative analyses of the active ingredients were performed using an Agilent 1290 Infinity II HPLC-DAD system (Washington, USA), operating on an automated system classified as Ultra HPLC (1300 bar with quaternary pumps). L1 (10 cm × 4.6 mm × 5 µm), L1 (15 cm × 3.9 mm × 5 µm), and L11 (Washington, USA) stainless steel columns were used.
2.3. Methods
2.3.1. Preparation of Solutions
2.3.1.1. Solutions for Artesunate Analysis (Int. Ph. Method A)
Carry out the test as described under 1.14.1 Chromatography, High-performance liquid chromatography, using a stainless-steel column (10cm × 4.6 mm) packed with particles of silica gel, the surface of which has been modified with chemically bonded octadecyl silyl groups (3 μm). As the mobile phase, use a mixture of 44 volumes of acetonitrile R and 56 volumes of buffer pH 3.0.
Prepare the buffer pH 3.0 by dissolving 1.36 g of potassium dihydrogen phosphate R in 900 mL of water R, adjust the pH to 3.0 with phosphoric acid (~1440g/l) TS and dilute to 1000 mL with water R.
Prepare the following solutions in acetonitrile R. For solution (1) weigh and powder 20 tablets. Shake or sonicate a quantity of the powder containing about 40 mg of Artesunate, accurately weighed, for 15 minutes with 10 mL of acetonitrile R. Filter the resulting solution through a 0.45 μm filter, discarding the first few mL of the filtrate. For solution (2) dissolve 40 mg of artesunate RS, accurately weighed, and dilute to 10 mL. For solution (3) dissolve about 1 mg of artenimol RS, about 1 mg of artemisinin RS and about 10 mg of artesunate RS in 10 mL.
Operate with a flow rate of 1.0 mL per minute. Maintain the column temperature at 30 °C and use as detector an ultraviolet spectrophotometer set at a wavelength of about 216 nm.
Inject separately 20 μl each of solutions (1), (2) and (3). Record the chromatograms for about 4 times the retention time of artesunate. In the chromatogram obtained with solution (3) the following peaks are eluted at the following relative retention with reference to artesunate (retention time about 9 minutes): 10-epi-artenimol about 0.58; artenimol about 0.91; and impurity B (artemisinin) about 1.30. The test is not valid unless the peak-to-valley ratio (Hp/Hv) is at least 5.0, where Hp is the height above the extrapolated baseline of the peak due to artenimol and Hv is the height above the extrapolated baseline at the lowest point of the curve separating the peak due to artenimol from the peak due to artesunate. The chromatogram obtained with solution (1) may show a peak due to impurity C eluting at a relative retention of about 2.7 with reference to artesunate.
Measure the areas of the peak responses obtained in the chromatograms from solutions (1) and (2) and calculate the content of artesunate (C19H 28O8) in the tablets, using the declared content of C19H28O8 in artesunate RS.
2.3.1.2. Solutions for the Analysis of Lumefantrine and Artemether (Ph Int)
Carry out the test as described under 1.14.1 Chromatography, High-performance liquid chromatography, using a stainless-steel column (15 cm x 3.9 mm) packed with particles of silica gel, the surface of which has been modified with chemically bonded octadecylsilyl groups (5 μm).
Use the following conditions for gradient elution:
Mobile phase A: 700 volumes of ion pair reagent and 300 volumes of acetonitrile R.
Mobile phase B: 300 volumes of ion pair reagent and 700 volumes of acetonitrile R.
Prepare the ion pair reagent by dissolving 5.65 g of sodium hexanesulfonate R and 2.75 g of sodium dihydrogen phosphate R in about 900 mL of water R. Adjust the pH to 2.3 using phosphoric acid (~105 g/l) TS, dilute to 1000 mL and filter through a 0.45-µm filter.
Prepare the following solutions in the solvent which is obtained by mixing 200 mL of ion pair reagent, 60 mL of water R and 200 mL of 1-propanol R and diluting to 1000 mL with acetonitrile R. Prepare and keep both solutions at a temperature not below 20°C. For solution (1), weigh and powder 20 tablets. Transfer a quantity of the powder containing about 20 mg of Artemether (about 120 mg of Lumefantrine), accurately weighed, to a 100-mL volumetric flask. Add approximately 85 mL of the solvent, sonicate for 20 minutes, allow to cool to room temperature and dilute to volume with the solvent. Filter through a 0.45 µm-filter, discarding the first few mL of the filtrate. For solution (2), accurately weigh 20 mg of artemether RS and 120 mg of lumefantrine RS in a 100 mL volumetric flask. Add approximately 85 mL of solvent, sonicate until dissolved, allow to cool to room temperature and dilute to volume.
Operate with a flow rate of 1.3 mL per minute. As a detector use an ultraviolet spectrophotometer set at a wavelength of about 210 nm for the first 28 minutes and then switch to about 380 nm.
Inject alternately 20 µl each of solutions (1) and (2). (The peak for artemether is eluted at a retention time of approximately 19 minutes, and that for lumefantrine at a retention time of approximately 34 minutes.)
Measure the areas of the peak responses obtained in the chromatograms from solutions (1) and (2), and calculate the content of artemether (C16H26O5) and lumefantrine (C30H32Cl3NO) in the tablets.
2.3.1.3. Preparation of Solutions for Sulfadoxine and Pyrimethamine Analysis (USP)
Procedure
Solution A:1 mL of phosphoric acid in 1000 mL of water
Mobile phase: Acetonitrile and Solution A (17:83)
Standard solution:0.4 mg/mL of USP Sulfadoxine RS and 0.02 mg/mL of USP Pyrimethamine RS prepared as follows. Transfer suitable amounts of USP Sulfadoxine RS and USP Pyrimethamine RS to a suitable volumetric flask. Dissolve in acetonitrile using about 17% of the final flask volume, then dilute with Solution A to volume.
Sample stock solution: Transfer an equivalent of about 200 mg of sulfadoxine and 10 mg of pyrimethamine from NLT 10 finely powdered Tablets to a 100-mL volumetric flask. Add about 28 mL of acetonitrile and sonicate for about 30 min. Allow to cool and dilute with Solution A to volume.
Sample solution: Nominally 0.4 mg/mL of sulfadoxine and 0.02 mg/mL of pyrimethamine in Mobile phase from Sample stock solution. Pass through a PVDF filter of 0.45-µm pore size. Discard the first 5 mL and use the remaining filtrate.
Analysis
Samples: Standard solution and Sample solution
Calculate the percentage of the labeled amounts of sulfadoxine (C12H14N4O4S) and pyrimethamine (C12H13ClN4) in the portion of Tablets taken:
Result = (rU/rS) × (CS/CU) × 100
rU = peak response of sulfadoxine or pyrimethamine from the Sample solution
rS = peak response of sulfadoxine or pyrimethamine from the Standard solution
CS = concentration of USP Sulfadoxine RS or USP Pyrimethamine RS in the Standard solution (mg/mL)
CU = nominal concentration of sulfadoxine or pyrimethamine in the Sample solution (mg/mL). Acceptance criteria:90.0%–110.0% each for sulfadoxine and pyrimethamine
2.3.1.4:. Preparation of Solutions for the Analysis of Sulfamethoxazole and Trimethoprim
- Stock Solution Sample: Transfer finely ground tablets (NLT20), equivalent to 160 mg of sulfamethoxazole, into a 100 mL volumetric flask. Add 50 mL of methanol and sonicate, shaking intermittently, for 5 min. Allow to equilibrate at room temperature, dilute with methanol to volume, and filter. Use the filtrate in the preparation of the sample solution.
- Sample Solution:
- Standard Solution Preparation
- Standard Stock Solution: 0.32 mg/mL of Trimethoprim RS USP and 0.32 mg/mL of Sulfamethoxazole RS USP in methanol, is the ratio of the labeled amount, in mg, of Sulfamethoxazole to the labeled amount, in mg, of trimethoprim in the dosage form.
- Standard Stock Solution: 0.032 mg/mL of Trimethoprim RS USP per mL and 0.032 mg/mL of Sulfamethoxazole RS USP per mL in the mobile phase of the standard stock solution.
2.3.2. Calibration Solution Preparation and Method Verification
For each active molecule, 5 concentration levels were prepared. For all samples (test solutions), the concentrations of 110%, 100%, 90%, and 80% were obtained from the stock solution (corresponding to 120%) in accordance with the specific monographs listed above.
2.3.3. Chromatographic Conditions
The various chromatographic conditions are indicated in Table 1.
2.4. Data Processing
Statistical treatment was performed using Excel 2016 and evaluating the following reliability criteria for each analysis according to ICH Q2 (R1) [9,10]:
- Linearity: was assessed to demonstrate the ability, within 80% - 120% assay interval to provide directly proportional to the concentrations (amounts) of the substance present in the samples, with an R2 greater than or equal to 0.998 as an SST.
- Accuracy: was evaluated to assess the closeness of agreement between the value accepted as conventionally true at each point in the interval (80% - 120.0%), by comparing the reference values and the values found (= the mean value obtained by applying the analytical procedure three times). Systematic errors are identified in terms of bias without exceeding 2% for finished products.
- Precision: was assessed in terms of repeatability and determined as the closeness of agreement (here relative standard deviation) between series of measurements on the same homogeneous samples (results of independent tests) under conditions prescribed by standards (relative standard deviation not more than 2%).
- Selectivity: this criterion was evaluated as first since its cruciality. Indeed, finished products to be analyzed are often accompanied by other ingredients such as excipients or adjuvants that may be different from a manufacturer to another and may disturb detection of the peak of interest. The test will demonstrate that routinely used analytical procedures have the ability to unequivocally establish the existence of the analyte in the presence of other potentially present components (the different chromatographic peaks at the retention times of the active ingredients will be evaluation indicators).
3. Results and Discussion
3.1. Verification of Analytical Methods
Verifications of these four analytical methods for the analysis of seven molecules were performed at five concentration levels in three replicates.
System suitability tests were verified for each method before proceeding to the stage of demonstrating the applicability of these methods. Table 2 shows the system suitability and Table 3 shows the results for these methods.
The results obtained for the repeatability (precision) test show that all concentration levels had coefficient of variation values below 2.0%, with the exception of two values of 2.3% and 2.1%, respectively, for artesunate at the 90% concentration and lumefantrine at the 110% concentration, which slightly exceed the ICH compliance limit [9].
This table reveals very interesting results, with coefficient of determination (R2) values close to 1 for artesunate and lumefantrine (0.9996) and 1 for the other molecules. All R2 values are well above the expected 0.998.
Regarding the accuracy of the verified methods, it appears that the relative biases across the entire verified concentration range are well below the 1% specification for all the verified molecules [9,10].
Given that repeatability and accuracy are consistent across all values and at each concentration step, the verified methods are accurate.
Even the recoveries are acceptable and deemed compliant in all cases.
3.2. Application of the Verified Analytical Methods
The verified methods were applied to 107 samples marketed in the DRC.
3.2.1. Samples Identification Results and Quantification Results of Active Ingredients
Figure 1 and Figure 2 show the chromatograms of reference chemicals obtained under the conditions defined by the various pharmacopoeias.
A comparison of the retention times of the controls and the sample was used to identify the active ingredients in the samples. Table 4 shows the samples identification results and quantification results of active ingredients. It shows that 5 out of 107 samples (4.7%) did not contain the declared ingredients, namely Artemether and Lumefantrine.
Figure 3 illustrates the composition of these 5 counterfeit samples; they are all from a single brand but different batches.
3.2.2. Quantification of Active Ingredients in the Samples
The quantification results of the active ingredients in the samples are shown in Table 5.
Quantification of active ingredients shows that some products lack active ingredients, such as the antimalarials Lumefantrine and Artemether (0%/0%), and we also observed substandard samples containing low levels of Sulfadoxine and Pyrimethamine and very low levels of Artesunate (83.6%).
The dosage standard is 93.0 to 107.0% for the Sulfamethoxazole & Trimethoprim combination and 90.0 to 110.0% for the other molecules (Artesunate, Lumefantrine & Artemether, Sulfadoxine & Pyrimethamine).
3.3. Discussion
To lead the discussion, it is appropriate to consider the results of Table 3 where, 5/41 (or 12.2%) samples do not contain any active pharmaceutical ingredient of a part. And on the other hand, for the same Artemether-Lumefantrine combination, 7/41 (or 17.1%) samples are not compliant. And when we consider the results of the Sulfadoxine & Pyrimethamine combination, 3/11 samples (or 27.3%) are not compliant. This large scale of falsification or underdosage could be due to the fact that antimalarials constitute a major issue in the trade of these drugs very frequently used against simple malaria (Artemether-Lumefantrine) for the entire population except pregnant women who are treated prophylactically using the Sulfadoxine & Pyrimethamine combination. These results could also reflect the weak control of the supply chain and the lack of laboratories capable of detecting substandard or falsified medicines. This confirms the WHO report (WHO, 2017) according to which 1 in 10 medicines in the world are of substandard quality, including approximately 70% in Africa [10,11].
The DRC pharmacy management in 2022, estimated that approximately 21.7% of antimalarial drugs were circulating without Marketing Authorization, which partly corroborates the situation described (PNDS-PS 2024-2033) [8].
We can see this by highlighting the incessant warnings from the WHO and regulatory authorities that do not discourage these illicit trafficking networks. In the DRC, the Congolese Pharmaceutical Regulatory Authority, through its risk-based post-marketing surveillance reports (Summary Reports: Round 1 April 2022, Rounds 2 and 3, September 2024), has constantly alerted the public to the poor quality of certain products such as the Artemether-Lumefantrine combination, quinine drops and tablets, as well as the Sulfadoxine & Pyrimethamine combination.
4. Conclusion
This study was to verify four pharmacopoeial methods designed to analyze seven molecules and apply these methods to samples marketed in the DRC with the aim of detecting falsified products and protecting the health of the population. After reviewing the various parameters verified: the suitability of the chromatographic system, linearity, precision (repeatability), accuracy and specificity, the quality control laboratory demonstrated its compliance with the aforementioned ICH and WHO requirements for validation and verification of analytical methods.
A concentration range of 80%, 90%, 100%, 110% and 120% for 7 molecules (6 antimalarials: Artesunate, Lumefantrine and Artemether, Sulfadoxine and Pyrimethamine) and one (1) antibiotic combination (Sulfamethoxazole and Trimethoprim). And as results obtained for all the analytical methods tested, the system's suitability was compliant. This attests also, good selectivity/specificity of the analytical methods tested (Fig1 & Fig 2).
The lowest coefficient of determination recorded is R2 = 0.9996 for Artesunate and Lumefantrine, respectively. The method demonstrated that linearity in this result range (area under the curve) is consistent (greater than 0.998), and accuracy is effective when considering the conformity of the relative bias and the recovery rate, the lowest of which is 98.8% for Artesunate.
Ultimately, the application of these verified methods made it possible to identify substandard and falsified finished pharmaceutical products for the Artemether-Lumefantrine and Sulfamethoxazole-Pyrimethamine combinations, respectively. Also, low levels of Artesunate powder for injection were detected.
These results further confirm the problem of the circulation of falsified and substandard medicines in developing countries.
References
- Wada, Y. H.; Abdulrahman, A.; Muhammad, M. Ibrahim; Owanta, V. C.; Chimelumeze, P. U.; Khalid, G. M. Falsified and substandard medicines trafficking: A wakeup call for the African continent. Public Health in Practice 2022, vol. 3, 100240. [Google Scholar] [CrossRef] [PubMed]
- Cavany, S.; Nanyonga, S.; Hauk, C.; Lim, C.; Tarning, J.; Sartorius, B.; Dolecek, C.; Caillet, C.; Newton1, P.N.; Cooper, B.S. The uncertain role of substandard and falsified medicines in the emergence and spread of antimicrobial resistance. Nat Commun 2023, vol. 14(no. 1), 6153. [Google Scholar] [CrossRef] [PubMed]
- World Health Organization. WHO Global Surveillance and Monitor-ing System for Substandard and Falsified Medical Products; World Health Organization, 2017. [Google Scholar]
- McManus, D.; Naughton, B. D. A systematic review of substandard, falsified, unlicensed and unregistered medicine sampling studies: a focus on context, prevalence, and quality. BMJ Glob Health 2020, vol. 5(no. 8), e002393. [Google Scholar] [CrossRef] [PubMed]
- El-Dahiyat, F.; Fahelelbom, K. M. S.; Jairoun, A. A.; Al-Hemyari, S. S. Combatting Substandard and Falsified Medicines: Public Awareness and Identification of Counterfeit Medications. Front. Public Health 2021, vol. 9, 754279. [Google Scholar] [CrossRef] [PubMed]
- Internal Standard ISO/IEC 17025: 2017.
- Ozawa, S.; Evans, D.R.; Bessias, S.; Haynie, D. G.; Yemeke, T. T.; Laing, S. K.; Herrington, J. E. Prevalence and estimated economic burden of substandard and falsified medicines in low- and middle-income countries: a systematic review and meta-analysis. JAMA Netw. Open 2018, 1(10), 1-22. e181662–e181662. [Google Scholar] [CrossRef] [PubMed]
- Ministère de la santé congolais. Plan national de développement sanitaire et de prévoyance sociale (PNDS-PS) 2024-2033 sur la vision du gouvernement en matière de santé. Available online: https://environews-rdc.net/2024/09/10/sante-le-plan-national-de-developpement-sanitaire-2024-2033-de-la-rdc-devoile/.
- Plan stratégique national pour la couverture sante universelle en Réplique Démocratique du Congo 2020-2030. 2020. Available online: https://santenews.info/wp-content/uploads/2020/04/PLAN-STRATEGIQUE-NATIONAL-CSU_FINANCEMENT.pdf.
- Abraham, J. “International Conference on Harmonisation Of Technical Requirements For Registration Of Pharmaceuticals For Human Use,” in Handbook of Transnational Economic Governance Regimes; Tietje, C., Brouder, A., Eds.; Brill | Nijhoff, 2010; pp. 1041–1053. [Google Scholar] [CrossRef]
- OMS_ Règles OMS de bonnes pratiques applicables par les laboratoires de contrôle qualité pharmaceutique. Série de Rapports techniques 2010, N° 957.
- United States Pharmacopeia; 2024.
- Pharmacopée Internationale, Xe et XIe Editions.
- Debrus, B.; Lebrun, P.; Mbinze, J.K.; Lecomte, F.; Ceccato, A.; Caliaro, G.; Mavar Tayey Mbay, J.; Marini, R.D.; Boulanger, B.; Rozet, E.; Hubert, Ph. Innovative HPLC method development for the screening of 19 antimalarial drugs based on a generic approach, using design of experiments and design space. Journal of Chromatography A 2011, 1218, 5205–5215. [Google Scholar] [CrossRef] [PubMed]
- Mbinze, J.K.; Sacré, P.-Y.; Yemoa, A.; Mavar Tayey Mbay, J.; Habyalimana, V.; Kalenda, N.; Hubert, Ph.; Marini, R.D.; Ziemons, E. Development, validation and comparison of NIR and Raman methods for the identification and assay of poor-quality oral quinine drops. Journal of Pharmaceutical and Biomedical Analysis 2015, 111, 21–27. [Google Scholar] [CrossRef]
- Ciza, PH.; Sacre, PY.; Kanyonyo, M.R.; Waffo, C.T.; Borive, M.A.; Mbinze, J.K.; Hubert, Ph.; Ziemons, E.; Marini, R.D. Application of NIR handheld transmission spectroscopy and chemometrics to assess the quality of locally produced antimalarial medicines in the Democratic Republic of Congo. Talanta 3(2021), 100025. [CrossRef]
- Mavungu Landu, D.J.; Frédérich, M.; Kuwekit, J. Manzambi; Nswe, C. Bongo-Pasi; Mbinze, J.K.; Liégeois, S.; Kalenda Tshilombo, N.; Kwete Minga, M.; Ciza Hamuli, P.; Hubert, Ph.; Marini, R.D. Quality of antimalarials in Kinshasa peri-urban areas with regard to local pharmaceutical legislation and regulation. International Health Journal 2019, 00. [Google Scholar] [CrossRef] [PubMed]
- Rapports synthèses de la surveillance post marketing des médicaments antipaludiques disponibles en République Démocratique du Congo, Tour 1 Avril 2022, Tours 2 et 3. 2024.
Figure 1.
A) Chromatograms of Sulfamethoxazole and Trimethoprim B) Chromatograms of Sulfadoxine and Pyrimethamine.
Figure 1.
A) Chromatograms of Sulfamethoxazole and Trimethoprim B) Chromatograms of Sulfadoxine and Pyrimethamine.
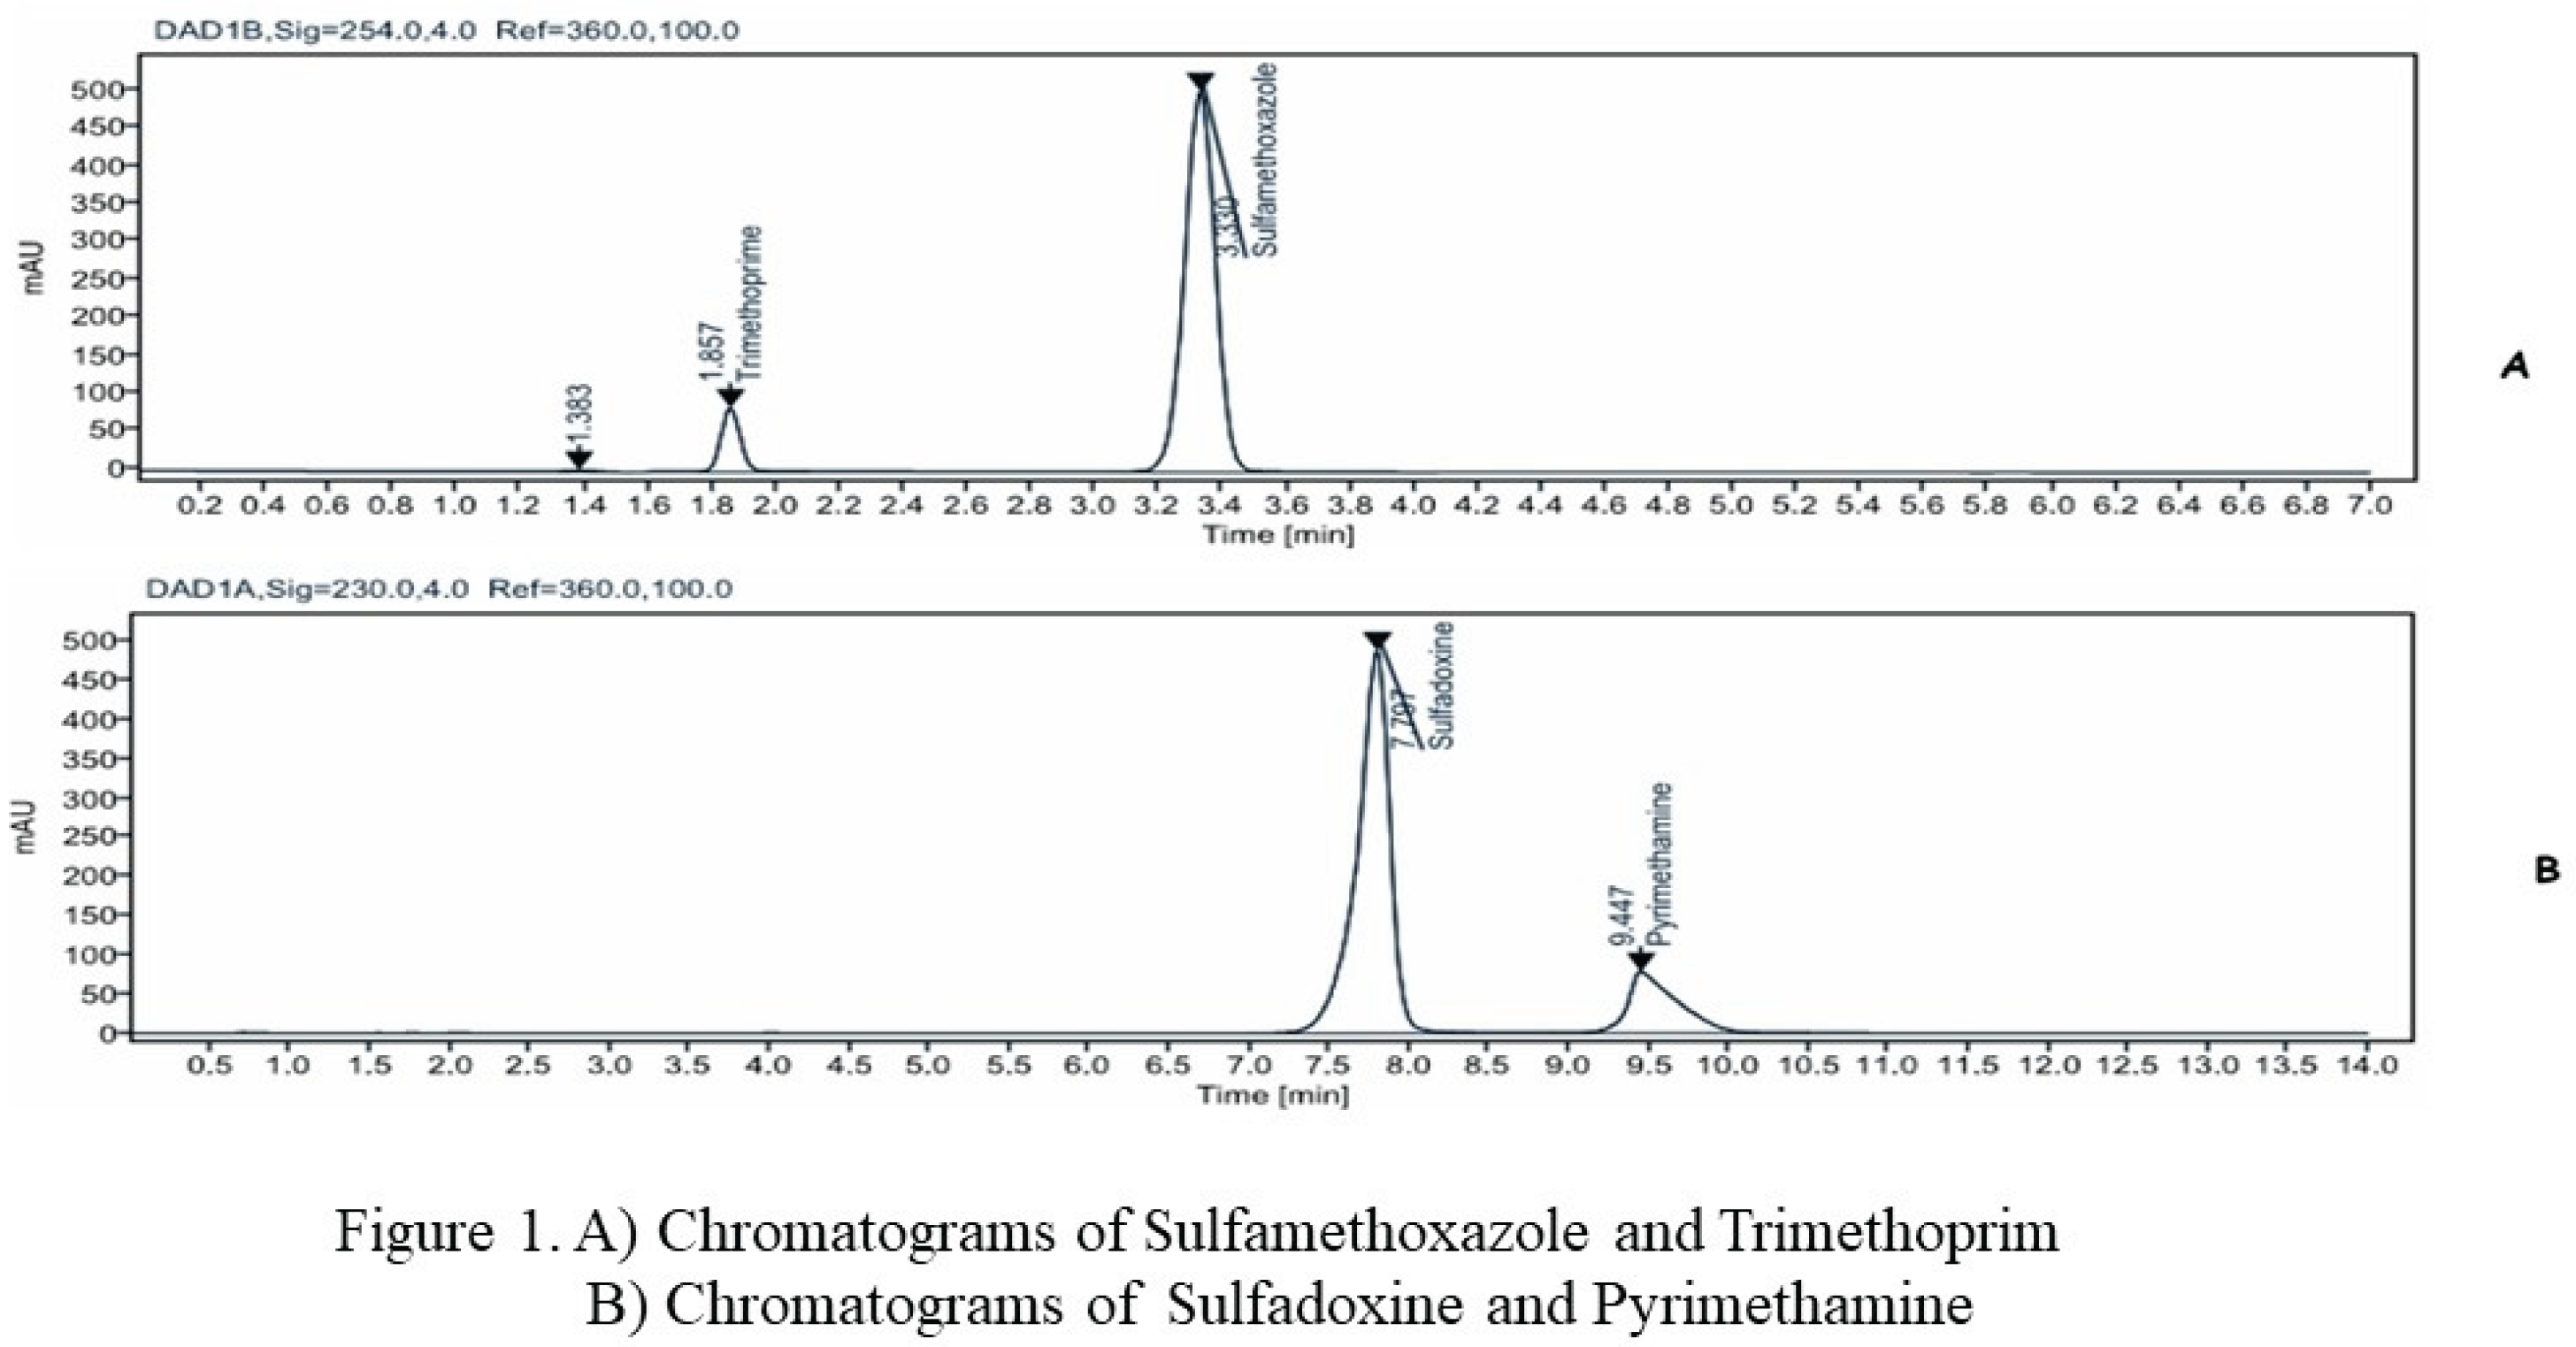
Figure 2.
C) Chromatograms of artemether and lumefantrine D) Chromatograms of artesunate.
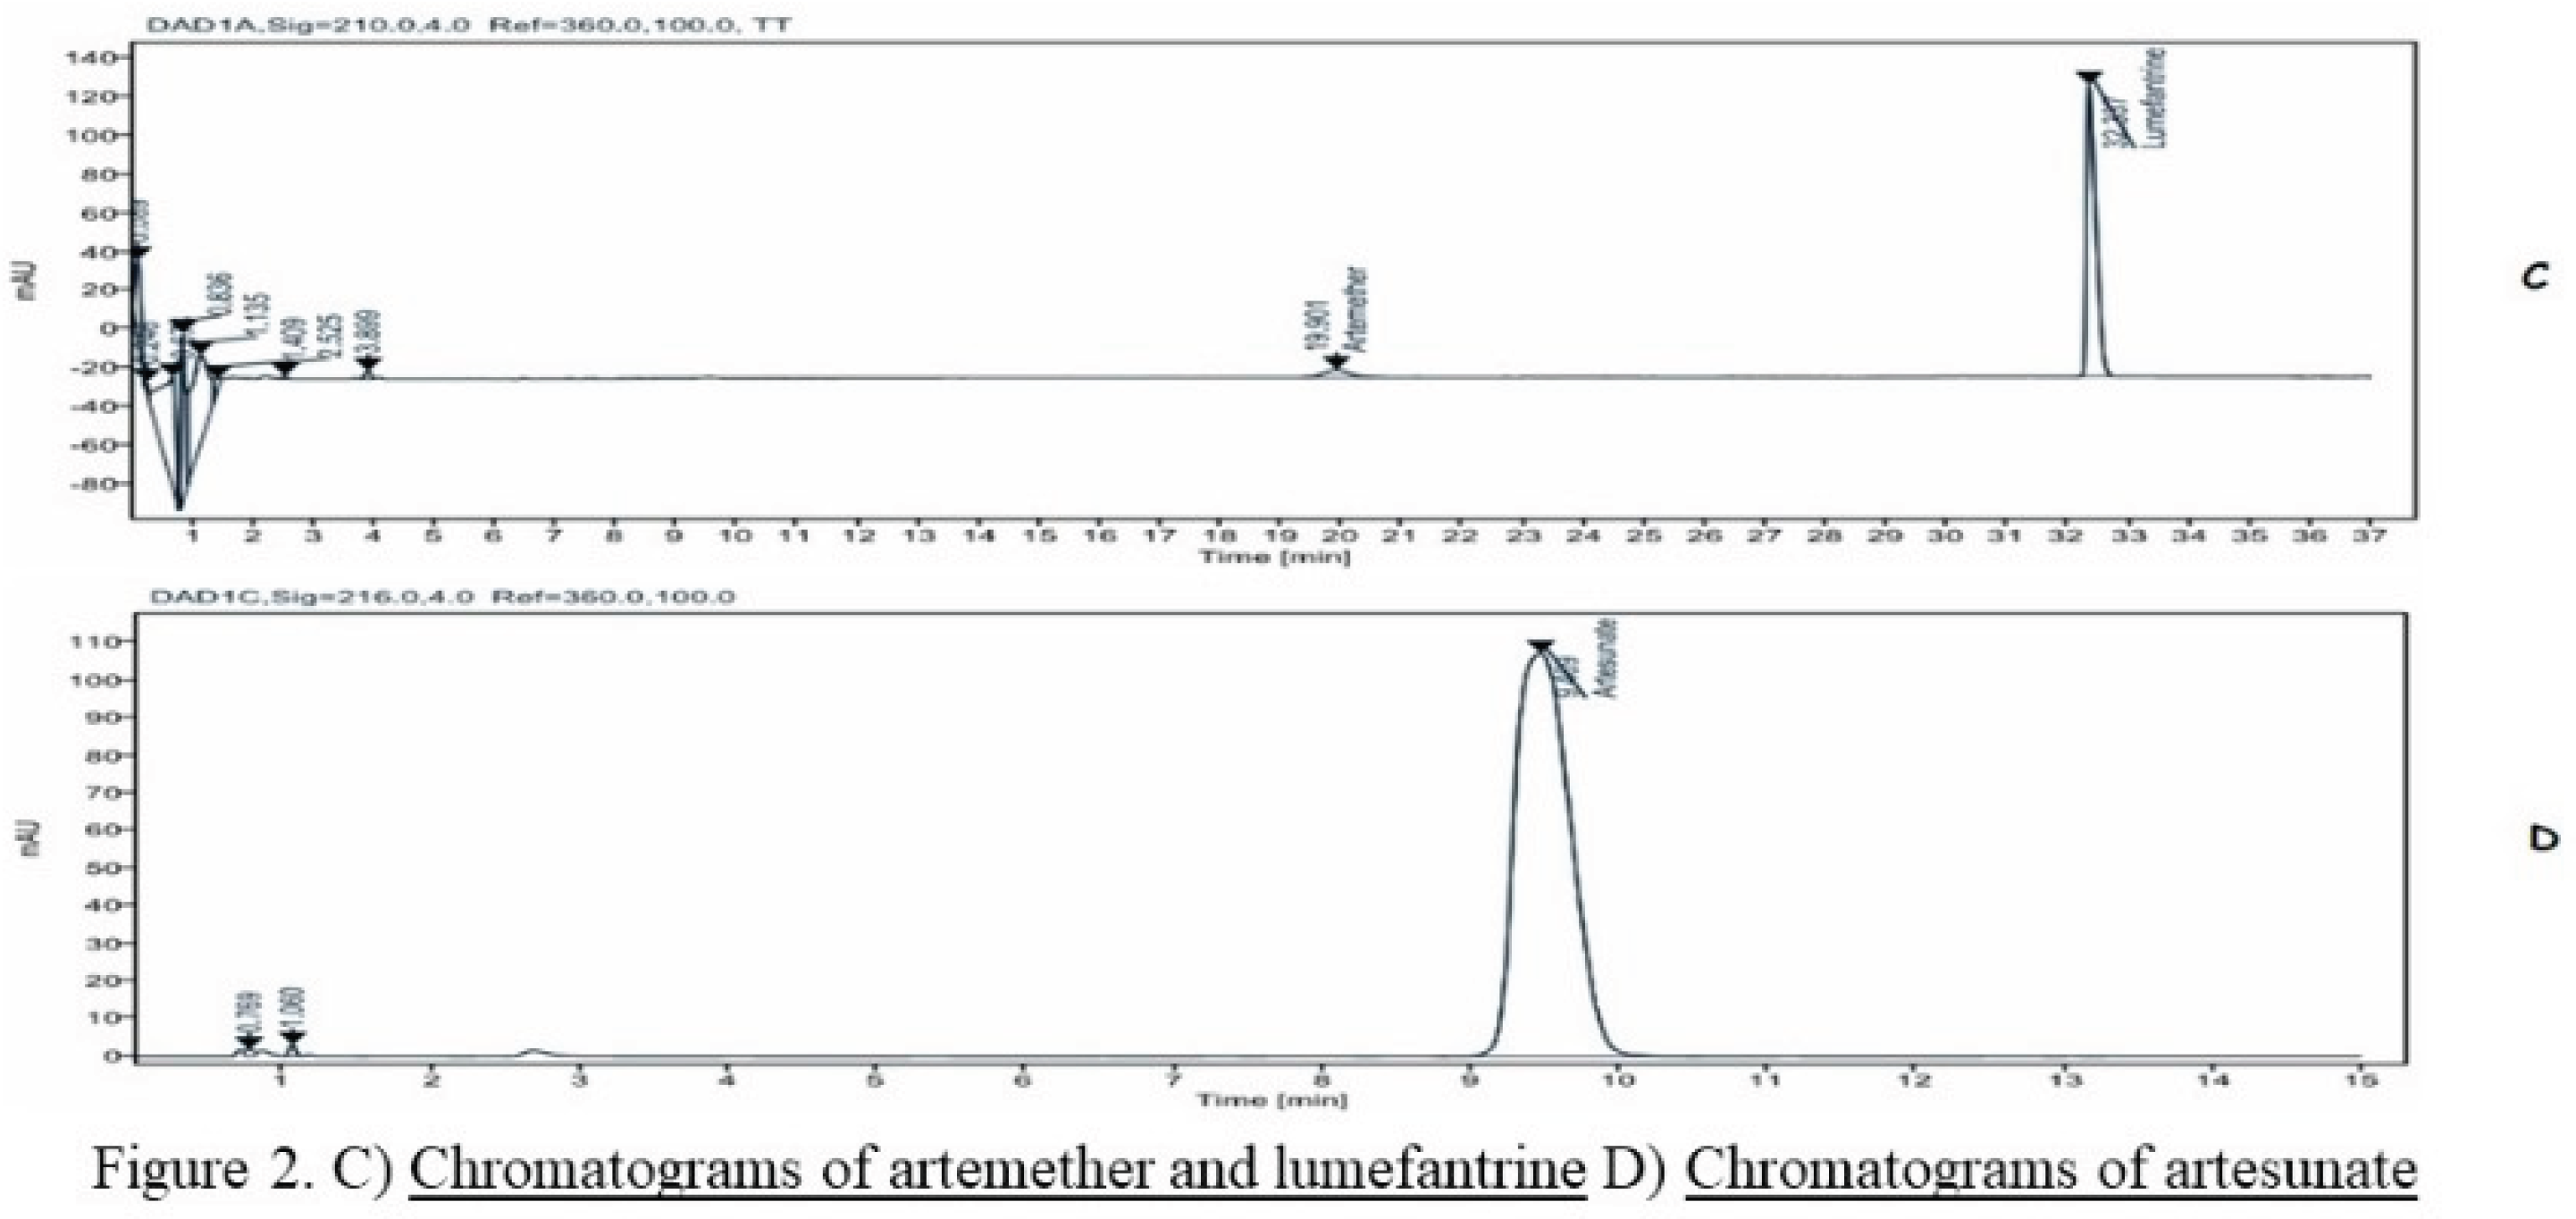
Figure 3.
Counterfeit products picture.
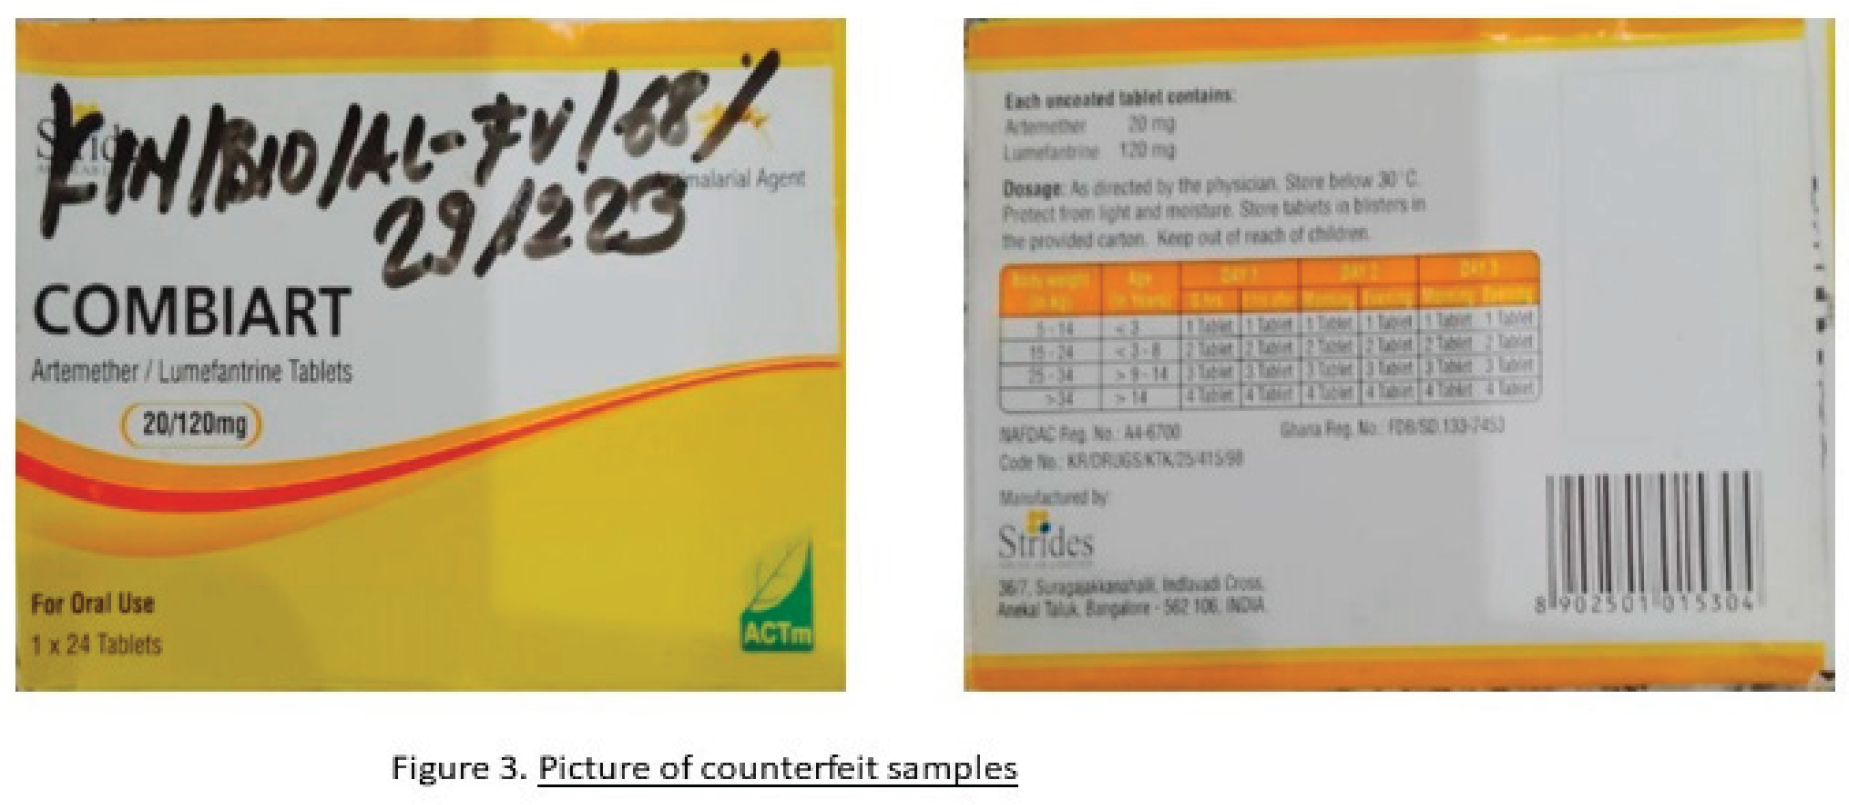

Table 1.
Chromatographic Conditions Used.
| Parameters | Artésunate | Lumefantrine and Artemether | Sulfadoxine and Pyrimethamine | Sulfamethoxazole and Trimethoprim | ||
|---|---|---|---|---|---|---|
| Column | C18,10cm ×4.6mm, 3μm | C18, 15 cm × 3.9 mm, 5μm | C18, 2.0 mm × 10 cm, 3 µm | C18, 3.9 mm × 30 cm, 10 µm | ||
| Mobile phase | 44 volumes of acetonitrile + 56 volumes of buffer pH 3.0. | Time (min) | Mobile Phase A : 700 volumes of ion pair reagent + 300 volumes of acetonitrile. |
Mobile phase B (300 volumes of ion pair reagent and 700 volumes of acetonitrile. | Acetonitrile and solution A (1 mL of phosphoric acid in 1000 mL of water) (17:83). | 1400 mL of water, 400 mL of acetonitrile, and 2.0 mL of triethylamine in a 2000 mL volumetric flask, adjusted to pH 5.9 with 0.2 N sodium hydroxide or dilute glacial acetic acid (1 in 100). |
| 0-28 | 60 | 40 | ||||
| 28-29 | 60 à 0 | 40 à 100 | ||||
| 29-45 | 0 | 100 | ||||
| 45-46 | 0 à 60 | 100 à 40 | ||||
| 46-55 | 60 | 40 | ||||
| Flow rate | 1.0 mL/min | 1.3 mL/min | 0.3 mL/min | 2.0 mL/min | ||
| Injection Volume | 20 μL | 20 μL | 5μL | 20 μL | ||
| Column Temperature | 30°C | N/A | N/A | N/A | ||
| Wavelength | 216nm | 210 nm for the first 28 minutes then 380nm | 230 nm | 254nm | ||
| Suitability test | ||||||
| Resolution : |
N/A |
N/A |
NLT 1.5 between pyrimethamine and sulfadoxine | NLT 5.0 between Sulfamethoxazole and trimethoprim | ||
| Tailing Factor (asymmetry) | N/A | N/A | NMT 1.6 for sulfadoxine; NMT 2.0 for pyrimethamine | NMT 2.0 for sulfamethoxazole and trimethoprim | ||
| Relative standard deviation : | N/A | N/A | NMT2.0% for sulfadoxine and pyrimethamine | NMT 2.0% for repeated injections | ||
Legend : NLT = Not less than NMT = Not more than N/A: Not applicable.
Table 2.
System suitability test results.
| SYSTEM SUITABILITY | ||||
|---|---|---|---|---|
| ACTIVE PHARMACEUTICAL INGREDIENT | Resolution | Asymmetry (Tailing Factor) of Peaks | RSD | REFERENCE |
| ARTESUNATE | N/A | N/A | N/A | Ph Int 10th and 11th edition |
| ARTEMETHER | N/A | N/A | N/A | Ph Int 10th and 11th edition |
| LUMEFANRTINE | N/A | N/A | N/A | Ph Int 10th and 11th edition |
| SULFADOXINE | 1.5 ≤ between pyrimethamine and sulfadoxine | ≤ 1.6 for sulfadoxine; | ≤ 2.0% for sulfadoxine and pyrimethamine | USP-NF/2021 - 2024 |
| PYRIMETHAMINE | ≤ 2.0 for pyrimethamine | |||
| RESULTS OBTENED | 3.7 | 0.8 and 1.7 | 0.1% and 0.2% | |
| SULFAMETHOXAZOLE | 5.0 ≤ between Sulfamethoxazole and trimethoprim | ≤ 2.0 for Sulfamethoxazole and trimethoprim | ≤ 2.0% for both | USP-NF/2021 - 2024 |
| PYRIMETHAMINE | ||||
| RESULTS OBTAINED | 10.2 | 1.1 and 1.0 | 0.2% and 0.4% | |
Table 3.
Accuracy results, Linearity, Repetability and Recovery rate.
| Active Pharmaceutical Ingredient (API) | 80% | 90% | 100% | 110% | 120% | Linearity R² ≥0.998 |
|---|---|---|---|---|---|---|
| Accuracy (relative bias in %) | ||||||
| ARTESUNATE | 1.10 | 0.08 | 0.00 | 0.03 | -0.80 | 0.9996 |
| ARTEMETHER | -0.10 | -0.11 | 0.00 | -0.09 | 0.08 | 1 |
| LUMEFANRTINE | -0.80 | 0.51 | 0.90 | -0.43 | 0.93 | 0.9996 |
| SULFADOXINE | -0.07 | -0.26 | 0.08 | 0.05 | 0.05 | 1 |
| PYRIMETHAMINE | -0.05 | 0.00 | 0.00 | 0.00 | 0.00 | 1 |
| SULFAMETHOXAZOLE | 0.04 | 0.01 | 0.08 | 0.03 | 0.01 | 1 |
| Trimethoprim | -0.046 | -0.002 | 0.064 | 0.002 | -0.004 | 1 |
| Repetability (RSD in %) | ||||||
| Artesunate | 0.2 | 2.3 | 0.0 | 0.7 | 0.1 | |
| Artemether | 0.2 | 0.1 | 0.2 | 0.1 | 0.0 | |
| Lumefanrtine | 0.0 | 0.6 | 0.1 | 2.1 | 0.0 | |
| Sulfadoxine | 0.0 | 0.0 | 0.0 | 0.0 | 0.0 | |
| Pyrimethamine | 0.0 | 0.0 | 0.0 | 0.0 | 0.0 | |
| Sulfamethoxazole | 0.0 | 0.0 | 0.1 | 0.0 | 0.0 | |
| Trimethoprim | 0.1 | 0.0 | 0.1 | 0.0 | 0.0 | |
| Recovery rate in % | ||||||
| Artesunate | 101.1 | 98.8 | 100.1 | 100.2 | 99.2 | |
| Artemether | 99.9 | 99.9 | 100.0 | 99.9 | 100.1 | |
| Lumefanrtine | 99.2 | 100.5 | 100.9 | 99.6 | 100.9 | |
| Sulfadoxine | 99.9 | 99.7 | 100.1 | 100.1 | 100.0 | |
| Pyrimethamine | 100.0 | 100.0 | 100.1 | 100.0 | 100.0 | |
| Sulfamethoxazole | 100.0 | 100.0 | 100.1 | 100.0 | 100.0 | |
| Trimethoprim | 100.0 | 100.0 | 100.1 | 100.0 | 100.0 | |
Table 4.
Samples identification results and Quantification results of active ingredients.
| N° | Active Pharmaceutical Ingredient (API) | Number of Samples analyzed | Identification Results | Quantification results | ||||
|---|---|---|---|---|---|---|---|---|
| Presence of active ingredient | Without active ingredient | Without API Percentage (%) |
Compliant | Non-compliant | Non-compliant Percentage (%) |
|||
| 1 | Artésunate | 46 | 46 | 0 | 0,0 | 45 | 1 | 2,2 |
| 2 | Artémether - Luméfantrine | 41 | 36 | 5 | 12,2 | 34 | 7 | 17,1 |
| 3 | Sulfadoxine - Pyriméthamine | 11 | 11 | 0 | 0,0 | 8 | 3 | 27,3 |
| 4 | Sulfaméthoxazole- Triméthoprime | 9 | 9 | 0 | 0,0 | 9 | 0 | 0 |
| Total | 107 | 102 | 5 | 4,7 | 96/107 | 11/107 | 10,3 | |
Disclaimer/Publisher’s Note: The statements, opinions and data contained in all publications are solely those of the individual author(s) and contributor(s) and not of MDPI and/or the editor(s). MDPI and/or the editor(s) disclaim responsibility for any injury to people or property resulting from any ideas, methods, instructions or products referred to in the content. |
© 2025 by the authors. Licensee MDPI, Basel, Switzerland. This article is an open access article distributed under the terms and conditions of the Creative Commons Attribution (CC BY) license (http://creativecommons.org/licenses/by/4.0/).
Copyright: This open access article is published under a Creative Commons CC BY 4.0 license, which permit the free download, distribution, and reuse, provided that the author and preprint are cited in any reuse.


