Submitted:
09 December 2025
Posted:
11 December 2025
You are already at the latest version
Abstract
Rotifers, cladocerans, and copepods constitute the bulk of zooplankton biomass in freshwater ecosystems. An increase in salinity levels due to evaporation from fresh-water bodies affects species richness and zooplankton abundance. We exposed zoo-plankton in mesocosms to sub-oligohaline salt concentrations (0, 50, 100, or 200 µg/L of NaCl) for 18 days. We also measured selective physicochemical water parameters. Our results showed that pH, phosphates and chlorophyll a levels of the medium in the test jars decreased with time. However, conductivity values did not show any clear trends with time. The initial zooplankton composition consisted of 13 rotifer, 1 cladoceran and 2 copepod species. After being exposed to 200 mg/L salinity level for three weeks, only 5 rotifer species and 1 cyclopoid species survived, and in terms of densities, naupliar stages dominated. The densities of Brachionus calyciflorus, Keratella cochlearis, and Polyarthra vulgaris decreased with increasing salinity level and expo-sure time, while Brachionus angularis and Brachionus budapestinensis were eliminated. The low levels of salt used in this work had also adverse effects on species richness and abundances of zooplankton, over just a few days. Therefore sub-oligohaline lev-els of salinity may pose a threat to species richness and abundances of zooplankton in natural waterbodies.
Keywords:
rotifers
; nauplii
; sub-oligohaline
1. Introduction
The Temperature, pH and salinity are some of the limiting abiotic factors in aquatic ecosystems and whose interaction at suboptimal levels can alter the tolerance capacity of organisms [1]. Beyond the tolerance limits, aquatic organisms are unable to survive, grow or reproduce optimally [2]. One of the environmental factors that regulates the distribution, abundance and development of planktonic organisms in aquatic ecosystems is salinity due to the presence of ions at various concentrations [3]. Species have particular adaptations that allow them to compete and survive, thus resulting in unique species composition and abundances [4].
With global warming, excessive use of agrochemicals from intensive agriculture and road salt applications etc., world trends indicate salinization of inland water bodies is on the rise [5,6,7]. There are also natural causes, which occur through seasons with changes in the chemical components of water (increase or decrease in salts) as a result of evaporation, rains, or melting of ice [8]. These influence population dynamics in planktonic communities that are more sensitive to salinity [9].
Salinity tolerance is the capacity of a species to withstand salt stress without experiencing harmful effects on survival, reproduction or abundance. This tolerance is species-specific, so different species of the same genus may have different ranges of tolerance to salinity [10]. Freshwater zooplankton species are mainly composed of rotifers, cladocerans and copepods, of which the first two groups are truly freshwater inhabitants. The phylum Rotifera (with about 2100 species) has more than 140 genera of which the genus Brachionus is well-studied with reference to both basic and applied aspects, including salinity tolerances [11]. Brachionus has some species such as B. dimidiatus, B. rotundiformis and B. plicatilis, which can tolerate salinities greater than 50 g/L, while others such as B. calyciflorus are generally oligohaline [12,13].
Freshwater waterbodies are usually oligohaline 500 mg/L to 5000 mg/L. However, due evaporation, even the sub-oligohaline temporary rain-fed waterbodies could become mesohaline (5 to 18 g/L) or even polyhaline (>18 g/L) [14,15]. Therefore, plankton living in such waterbodies experience gradual stress from low levels especially during the initial stages of pond evaporation.
Most laboratory tests are based on exposing freshwater species to high levels of salinity, usually above 5 g/L [16,17]. In many cases, the responses of rotifers to high salinity is to offset osmotic pressure and during this process, effects such as reduction in feeding rates, lower survival, reduced somatic growth, decreased offspring production, and decreased rate of population growth are observed [18]. These changes occur usually within a few days. However, at very low salt concentrations, for single species tests, these changes are not evident or at least not quantifiable using the available ecological tools [19].
Compared to single species tests, exposure of many species to sub-oligohaline (<500 mg/L) concentrations permits detection of changes at the community level [20]. This is because a few species in a zooplankton community respond to low levels of salinity and this leads quantifiable consequences in the composition and structure of coexisting taxa [21]. Further, in a zooplankton community species represent different taxonomic groups, from rotifer to crustaceans. Within the crustaceans, copepods have different naupliar stages, all of which respond differently leading to subtle changes in the community composition [22]. In addition, the phytoplankton species present in the plankton when exposed to low concentrations of salt, also respond differentially depending on their relative sensitivities [23]. These further affect the feeding rate of zooplankton. Therefore, community level exposure of plankton to sub-oligohaline salt levels show responses, which cannot be obtained by exposing individual species to the same salinity stress concentrations [24].
The aim of this work was to expose the plankton community to different sub-oligohaline levels and to record changes in the relative abundances of different species over a period, under laboratory conditions.
2. Materials and Methods
Plankton for experiments was collected from a freshwater shallow lake (Xochimilco located in the Mexico City (20.5° N 86.9° W). 50 liters of lake water was filtered using a 20 µm mesh. To remove large organisms such as insect larvae and plant twigs we used different mesh sizes progressively from 5000 to 200 µm. Finally, the filtered lake water contained predominantly phytoplankton and zooplankton.
The tests were carried out in transparent circular glass containers each with 3-liter filtered lake water, randomly added. To each test container we added pure NaCl solution so as to obtain final salt levels of 0 (no salt), 50 mg/L, 100 mg/L and 200 mg/L. For each salt concentration we set up 4 replicates. Thus in all we used 16 (= 4 salt levels X 4 replicates) test containers. The test containers were maintained at 23±1°C temperature with photoperiod 12:12 L:D. Following the start of the experiment and after every 3 day-interval, we measured selective physicochemical parameters (temperature, pH, dissolved oxygen and Chl a) [25]. For plankton analysis, we collected three 50 ml samples from each replicate. Whole sample analysis was carried out under stereomicroscope to quantify the abundances of rotifers, cladocerans, copepods and copepod nauplii. The experiments were terminated after 18 days by which time a clear shift from rotifers to copepods in the zooplankton community was observed in the test containers.
Shannon’s species divesity index was calculated using the following formula [26]: H′ = ̵ Σpi ln(pi), where, pi is the proportion of a given species density in the total abundance of a sample.
Evenness (J′) was calculated using the following formula [27]:
where, H′ is Shannon index; S is species richness in the sample.
J′ = H′/(ln S),
In order to determine differences in the abundances of rotifers and crustaceans, among the treatments we performed two way ANOVA.
3. Results
Data on the selective physico-chemical variables are presented in Table 1. Since the test containers were placed inside the laboratory, temperature did not vary considerably (21±2°C). Similarly dissolved oxygen levels remained similar throughout the test period (around 6 mg/L). However, other measured parameters varied. Regardless of salt levels, pH, phosphates and chlorophyll a levels of the medium in the test jars decreased with time. However, conductivity values did not show any clear trends with time.
Initial zooplankton composition consisted of 13 rotifer, 1 cladoceran, and 2 copepod species (Table 2). In addition, there were many copepod nauplii, which could not be identified to species. However, after exposure to 200 mg/L salinity level for 18 days, only 5 rotifer species and 1 cyclopoid species survived. Relative abundances of zooplankton varied in treatments over the test period. The maximal rotifer abundances (mean±standard error, 1162±122 ind./L) were recorded in controls after nine days, while the lowest values (47±18 ind./L) were observed in the highest salinity treatment (200 mg/L) after 18 days of zooplankton exposure. There was a distinct change from rotifers to crustaceans, mainly copepods when exposed to different salinity levels. In all treatments and in controls towards the end of experimental period, naupliar stages dominated (Figure 1).
The densities of Brachionus calyciflorus, Keratella cochlearis and Polyarthra vulgaris decreased with increasing salinity level and exposure time, while Brachionus angularis and Brachionus budapestinensis were completely eliminated within two weeks (Figure 2). The total densities of rotifers and cladocerans in relation to different salinities and exposure periods were statistically significant. The interaction of salinity and the exposure time was also significant (p<0.001, Two-way ANOVA) (Table 3).
Shannon’s species diversity index varied from 1.17 to 2.51, depending on the salinity level and the duration of exposure of zooplankton to salt concentration. In general, the zooplankton species diversity decreased with increasing salt level and the duration of exposure (Figure 3). Pielou’s evenness ranged from 0.56 to 0.89 depending on the treatment. The evenness decreased with increase in salt level and exposure time (Figure 4).
4. Discussion
The experiments conducted using sub-oligohaline levels showed significant effects on some physicochemical parameters, such as Chl a levels, even though variables such as temperature and dissolved oxygen showed little variation due the presence of salt up to 18 days. However, pH, phosphates and Chl a levels showed no significant relation (Pearson’s correlation) with zooplankton abundances during the test period. Therefore, multivariate analysis between abiotic factors with zooplankton could not be carried out. In many microcosm experiments, usually abiotic factors often fail to correlate with plankton in the presence of stressors such as toxins [28,29]. Duration of test conducted in this work was 18 days and at low salt levels, therefore some abiotic factors were not significantly correlated with zooplankton.
Species with a greater salinity tolerance can avoid the harmful effects of high salt concentrations on survival, development and/or reproduction [30]. Salinity tolerance is usually species-specific [31]. Different species of the same genus may have wide ranges of tolerances [10]. For example, B. plicatilis and B. rotundiformis are euryhaline while some such as B. calyciflorus and B. havanaensis have low range of salinity tolereance [12,13]. Because of these differences, freshwater zooplankton community structure is strongly influenced by salinity and when the salinity is > 2 g/L, quantifiable changes in the species richness and abundances take place. However, sub-oligohaline levels also cause changes in the abundance dynamics of zooplankton including community composition, but these changes are not easily detectable and quantifiable. For example, Sarma et al. [16] cultured 10 species of freshwater zooplankton (rotifers and cladocerans) different concentrations of NaCl (375 mg/L to 4500 mg/L). Their resulted showed that salt had negative effects on the population densities of the rotifer species B. calyciflorus and B. havanaensis only at or beyond 1500 mg/L. On the other hand, salt level of 1500 mg/L had significant effect on the population abundances of the cladoceran Ceriodaphnia dubia, while Moina macrocopa was unaffected. This suggests that relative tolerances of freshwater zooplankton to salt stress is possibly species-specific and due to this community responses of freshwater rotifers, cladocerans and copepods to salinity are considered as unpredictable [20]. In the present work too, at very low salt level (50 mg/L), the total rotifer abundances showed a stimulatory response until day 12, thereafter declined. For crustaceans, mainly copepods, their abundances began to increase up to 100 mg/L of salt level and only at the highest salt level (200 mg/L), they had negative effects. Freshwater copepods have usually higher levels of tolerances to salt than rotifers and cladocerans ([32]. Further, compared to single species tests of zooplankton, in mesocosm tests, zooplankton appear to be more sensitive to salt stress [20]. This is because, salt even at sub-oligohaline levels, has adverse effects on phytoplankton in micro or mesocosm tests, which eventually structure the zooplankton species composition [24]. This is possibly the reason why in our experiments, some rotifer species, such as B. angularis and B. budapestinensis, which can tolerate salt concentrations higher than 2000 mg/L [33] were completely eliminated at the salinity level as low as 50 mg/L. Our study highlights the importance of single species experiments and mixed-species microcosm studies in extrapolating findings from experimental studies to nature.
Species richness is highly vulnerable to salinity. Increase in concentration of salts, causes reduced number of species in any freshwater ecosystem. This decrease in species richness is delayed at oligohaline levels. However, within a few weeks, the species richness decreases even in sub-oligohaline conditions [34], as also observed in this work. Decrease in species richness is not necessarily a result of a decrease in total abundance of zooplankton. For example, when several sensitive species decline under salinity stress, the tolerant species utilizing the existing resources may proliferate. We also observed that sensitive rotifer species decreased in both numbers and richnness, the relatively more resistant copepods proliferated in abundances. Regardless of the treatment and the duration of exposure to salinity, the maximal abundance (1490±165 ind./L) of all zooplankton species including copepod nauplii was in the controls on the 9th day. Zooplankton abundances in lake Xochimilco from which the test species were obtained are usually >1000 ind./L and in some cases, rotifer species alone may reach up to 28,000 ind./L [35]. The richness and abundance of rotifer species are characterized by their tolerances to widely fluctuating environmental conditions in shallow water bodies [36]. However, the presence of rotifer species such as the members of the genus Brachionus (B. budapestinensis, B. calyciflorus, B. quadridentatus, B. havanaensis and B. caudatus) generally indicate favourable environmental conditions including low salinity. In our test containers, these species were present initially. With time, these brachionids disappeared, first- and -, followed by the others. When exposed to salinity, gradually these species were eliminated in accordance with their tolerances. Salt concentration and exposure time may have synergistic effects on zooplankton [37]. This is evident from the statistical evaluation of the data where the interaction of salt level and exposure time had significant effect.
Species diversity data decreased with time in all salinity treatments including controls. However, at salinity concentrations of 200 mg/L, Shannon diversity index was reduced to about 50% of its initial value. Reduction in Chl a levels from day 9 onwards was due to a decrease in phytoplankton density. Yet, rotifer abundances continued to increase until day 9. During this period, brachionid rotifers possibly fed on detritus as an alternative food source. We did not measure the detritus levels in our test jars. There is evidence that the rotifer species B. budapestinensis and B. caudatus feed on smaller detritus particles [19], which was possibly the case here. The decrease in Shannon index values in the test containers may have been due to reduced phytoplankton, which serves as food for zooplankton. However, this was accelerated by the salt level, especially at 200 mg/L. Pielou’s evenness also decreased with salt concentration and duration of exposure. For example, at 200 mg/L of salinity level, the evenness was lower by about 32% during 18 days of exposure as compared to the initial value. In terms of abundances, when a few species dominate the community, evenness decreases [38]. Under stressful conditions, sensitive species become less abundant than the resistant species and hence the evenness values decrease.
5. Conclusions
Our study showed that sub-oligohaline levels of NaCl had adverse effects on abiotic factors such as Chl a, which decreased with increase in salt levels. Further, the effects were not visible during the first two weeks. Thus, the effects of sub-oligohaline levels of salt can only be quantified over a period of time. The low levels of salt used in this work had also adverse effects on both species richness and abundances of zooplankton, over just a few days. Therefore sub-oligohaline levels of salinity may pose a threat to species richness and abundances of zooplankton in natural waterbodies.
Author Contributions
Conceptualization, SSSS, JLGF; formal analysis, SSSS, JLGF, SN; investigation, JLGF, MEHS; resources, FLGF, MEHF, SSSS, SN; writing—original draft preparation JLGF, SSSS, SN. All authors have read and agreed to the published version of the manuscript.
Funding
This research was funded PAPCA (2022-55), PAPIIT (IN211425; IN211525) and CONAHCyT (CVU-18723; CVU-20250).
Data Availability Statement
Data will be available to anyone on reasonable request.
Acknowledgments
We thank the authorities of FES-I for support.
Conflicts of Interest
The authors declare no conflicts of interest.
References
- Heugens, E.H.; Hendriks, A.J.; Dekker, T.; van Straalen, N.M.; Admiraal, W. A review of the effects of multiple stressors on aquatic organisms and analysis of uncertainty factors for use in risk assessment. Crit Rev Toxicol 2001, 31(3), 247-84. [Google Scholar] [CrossRef] [PubMed]
- Sexton, J.P.; McIntyre, P.J.; Angert, A.L.; Rice, K.J. Evolution and ecology of species range limits. Ann Rev Ecol Syst 2009, 40, 415–436. [Google Scholar] [CrossRef]
- Jeppesen, E.; Canedo-Arguelles, M.; Entrekin, S.; Sarma, S.S.S.; Padisák, J. Effects of induced changes in salinity on inland and coastal water ecosystems. Hydrobiologia 2023, 850(20), 4343–4688. [Google Scholar]
- Ersoy, Z.; Abril, M.; Cañedo-Argüelles, M.; Espinosa, C.; Vendrell-Puigmitja, L.; Proia, L. Experimental assessment of salinization effects on freshwater zooplankton communities and their trophic interactions under eutrophic conditions. Environmental Pollution 2022, 313, 120127. [Google Scholar] [CrossRef] [PubMed]
- Gao, L.; Yuan, Z.; Mao, X.; Ma, T. Salinity levels, trends and drivers of surface water salinization across China’s river basins. Water Research 2025, 281, 123556. [Google Scholar] [CrossRef]
- Hall, C.A.M.; Henry, N.; Canals, O.; Consing, G.; Rodríguez-Ezpeleta, N.; Lewandowska, A.M. DNA Metabarcoding as a tool to study plankton responses to warming and salinity change in mesocosms. Ecology and Evolution 2025, 15, e72125. [Google Scholar] [CrossRef]
- Tang, X.; Loewen, C.J.G.; Jackson, D.A. Zooplankton diversity in highly urbanized ponds: The role of road salt is not reflected by watershed impervious cover. Limnol Oceanogr in press, 2025, 1–15. [Google Scholar] [CrossRef]
- Verbrugge, L.N.H.; Schipper, A.M.; Huijbregts, M.A.J.; Van der Velde, G.; Leuven, R.S.E.W. Sensitivity of native and non-native mollusc species to changing river water temperature and salinity. Biol Invasions 2012, 14, 1187–1199. [Google Scholar] [CrossRef]
- Green, J. Zooplankton associations in East African lakes spanning a wide salinity range. In Saline Lakes V. Developments in Hydrobiology 87; Hurlbert, S.H., Ed.; Springer: Dordrecht, 1993. [Google Scholar] [CrossRef]
- Eckert, R.; Randall, D.; August ines, G. Fisiología animal. Mecanismos y Adaptaciones. Interamericana; McGraw-Hill, 1989; p. 650 p. [Google Scholar]
- Wallace, R.L.; Snell, T.W.; Walsh, E.J.; Sarma, S.S.S.; Segers, H. Chapter 8. Phylum Rotifera. Keys to Palaearctic Fauna. In Thorp and Covich’s Freshwater Invertebrates. Volume IV. Fourth Edition; Academic Press/Elsevier, 2019; pp. 219–267. [Google Scholar] [CrossRef]
- Koste, W. Rotatoria. Die Rädertiere Mitteleuropas. Ein Bestimmungswerk begründet von Max Voigt Textband 673 pp., Vol. 2: Tafelband 234 pp; Bornträger: Stuttgart, 1978; Vol. 1. [Google Scholar]
- Sarma, S.S.S.; Elguea-Sánchez, B.; Nandini, S. Effect of salinity on competition between the rotifers Brachionus rotundiformis Tschugunoff and Hexarthra jenkinae (De Beauchamp) (Rotifera). Hydrobiologia 2002, 474, 183–188. [Google Scholar] [CrossRef]
- Williams, D.D. The biology of temporary ponds; Oxford University Press: London, 2006. [Google Scholar]
- Cunillera-Montcusí, D.; Beklioğlu, M.; Cañedo-Argüelles, M.; Jeppesen, E.; Ptacnik, R.; Amorim, C.A.; Arnott, S.E.; Berger, S.A.; Brucet, S.; Dugan, H.A.; et al. Freshwater salinisation: A research agenda for a saltier world. Trends in Ecology & Evolution 2022, 37, 440–453. [Google Scholar] [CrossRef]
- Sarma, S.S.S.; Nandini, S.; Morales-Ventura, J.; Delgado-Martínez, I.; González-Valverde, L. Effects of NaCl salinity on the population dynamics of freshwater zooplankton (rotifers and cladocerans). Aquatic Ecology 2006, 40, 349–360. [Google Scholar] [CrossRef]
- Cañedo-Argüelles, M.; Kefford, B.; Schäfer, R. Salt in freshwaters: Causes, effects and prospects - introduction to the theme issue. Philos Trans R Soc Lond B Biol Sci. 2018, 374(1764), 20180002. [Google Scholar] [CrossRef] [PubMed] [PubMed Central]
- Bielańska-Grajner, I.; Cudak, A. Effects of salinity on species diversity of rotifers in anthropogenic water bodies. Pol J Environ Stud 2014, 23, 27–34. [Google Scholar]
- Sarma, S.S.S.; Nandini, S. Comparative population dynamics of six brachionid rotifers (Rotifera) fed seston from a hypertrophic, high altitude shallow waterbody from Mexico. Hydrobiologia 2019, 844(1), 55–65. [Google Scholar] [CrossRef]
- Arnott, S.E.; Fugère, V.; Symons, C.C.; Melles, S.J.; Beisner, B.E.; Cañedo-Argüelles, M.; Hébert, M.-P.; Brentrup, J.A.; Downing, A.L.; Gray, D.K.; et al. Widespread variation in salt tolerance within freshwater zooplankton species reduces the predictability of community-level salt tolerance. Limnology and Oceanography Letters 2023, 8, 8–18. [Google Scholar] [CrossRef]
- Kholssi, R.; Stefanova, S.; González-Ortegón, E.; Araújo, C.V.M.; Moreno-Garrido, I. Population and functional changes in a multispecies co-culture of marine microalgae and cyanobacteria under a combination of different salinity and temperature levels. Marine Environmental Research 2024, 193, 106279. [Google Scholar] [CrossRef] [PubMed]
- Huys, R.; Boxshall, G.A. Copepod Evolution. Ray Society Monographs 1991, 159, 468 pages. [Google Scholar]
- McClymont, A.; Arnott, S.E.; Rusak, J.A. Interactive effects of increasing chloride concentration and warming on freshwater plankton communities. Limnology and Oceanography Letters 2023, 8, 56–64. [Google Scholar] [CrossRef]
- Ligorini, V.; Garrido, M.; Malet, N.; Simon, L.; Alonso, L.; Bastien, R.; Aiello, A.; Cecchi, P.; Pasqualini, V. Response of phytoplankton communities to variation in salinity in a small Mediterranean coastal lagoon: Future management and foreseen climate change consequences. Water 2023, 15(18), 3214. [Google Scholar] [CrossRef]
- APHA. Standard Methods for the Examination of Water and Wastewater, 20th ed.; Washington, DC, 1998. [Google Scholar]
- Shannon, C.E. A mathematical theory of communication. The Bell System Technical Journal 1948, 27, 379–423. [Google Scholar] [CrossRef]
- Pielou, E.C. The measurement of diversity in different types of biological collections. Journal of Theoretical Biology 1996, 13, 131–144. [Google Scholar] [CrossRef]
- Karmakar, S.R.; Hossain, M.B.; Sarker, M.M.; Nur, A.-A.U.; Habib, A.; Paray, B.A.; Al-Sadoon, M.K.; Gulnaz, A.; Arai, T. Diversity and community structure of zooplankton in homestead ponds of a tropical coastal area. Diversity 2022, 14(9), 755. [Google Scholar] [CrossRef]
- Jiang, Z.; Wan, X.; Bai, X.; Chen, Z.; Zhu, L.; Feng, J. Cd indirectly affects the structure and function of plankton ecosystems by affecting trophic interactions at environmental concentrations. Journal of Hazardous Materials 2024, 480, 136242. [Google Scholar] [CrossRef]
- Bos, D.G.; Cumming, B.F.; Watters, C.E.; Smol, J.P. The relationship between zooplankton, conductivity and lake water ionic composition in 111 lakes from the Interior Plateau of British Columbia. Canadian International Journal Salt Lake Research 1996, 5, 1–15. [Google Scholar] [CrossRef]
- Echaniz, S.; Vignatti, A.; José de Paggi, S.; Paggi, J.; Pilati, A. Zooplankton seasonal abundance of South American saline shallow lakes. International Review of Hydrobiology 2006, 91, 86–100. [Google Scholar] [CrossRef]
- Lewandowska, A.M.; Hall, C.A.M. Zooplankton dominance shift in response to climate-driven salinity change: A mesocosm study. Frontiers in Marine Science 2022, 9, 861297. [Google Scholar] [CrossRef]
- Indy, J.R.; Delgadillo, S.P.; Rodriguez, L.A.; Couturier, G.M.; Segers, H.; González, C.A.Á.; Sánchez, W.M.C. Freshwater rotifer: (part II) a laboratory study of native freshwater rotifers Brachionus angularis and B. quadridentatus brevispinus from Tabasco. Kuxulkab’ Revista de Divulgación 2012, 1, 31–38. [Google Scholar] [CrossRef]
- Zorina-Sakharova, K.; Liashenko, A.; Marchenko, I. Effects of Salinity on the Zooplankton Communities in the Fore-Delta of Kyliya Branch of the Danube River. Acta Zoologica Bulgarica 2014, 129–133. [Google Scholar]
- Jiménez-Contreras, J.; Nandini, S.; Sarma, S.S.S. Diversity of Rotifera (Monogononta) and egg ratio of selected taxa in the canals of Xochimilco (Mexico City). Wetlands 2018, 38, 1033–1044. [Google Scholar] [CrossRef]
- Smolak, R.; Walsh, E.J. Rotifer species richness in Kenyan waterbodies: Contributions of environmental characteristics. Diversity 2022, 14, 583. [Google Scholar] [CrossRef]
- Hintz, W.D.; Jones, D.K.; Relyea, R.A. Evolved tolerance to freshwater salinization in zooplankton: Life-history trade-offs, cross-tolerance and reducing cascading effects. Phil Trans R Soc Lond B Biol Sci 2018, 374(1764), 20180012. [Google Scholar] [CrossRef]
- Kvålseth, T.O. Evenness indices once again: Critical analysis of properties. SpringerPlus 2015, 4, 232. [Google Scholar] [CrossRef]
Figure 1.
Changes in the abundances of rotifers (A) and crustaceans (B) (cladocerans and copepods) in relation to salinity levels and time. Shown are mean±standard error based on 3 replicates.
Figure 1.
Changes in the abundances of rotifers (A) and crustaceans (B) (cladocerans and copepods) in relation to salinity levels and time. Shown are mean±standard error based on 3 replicates.
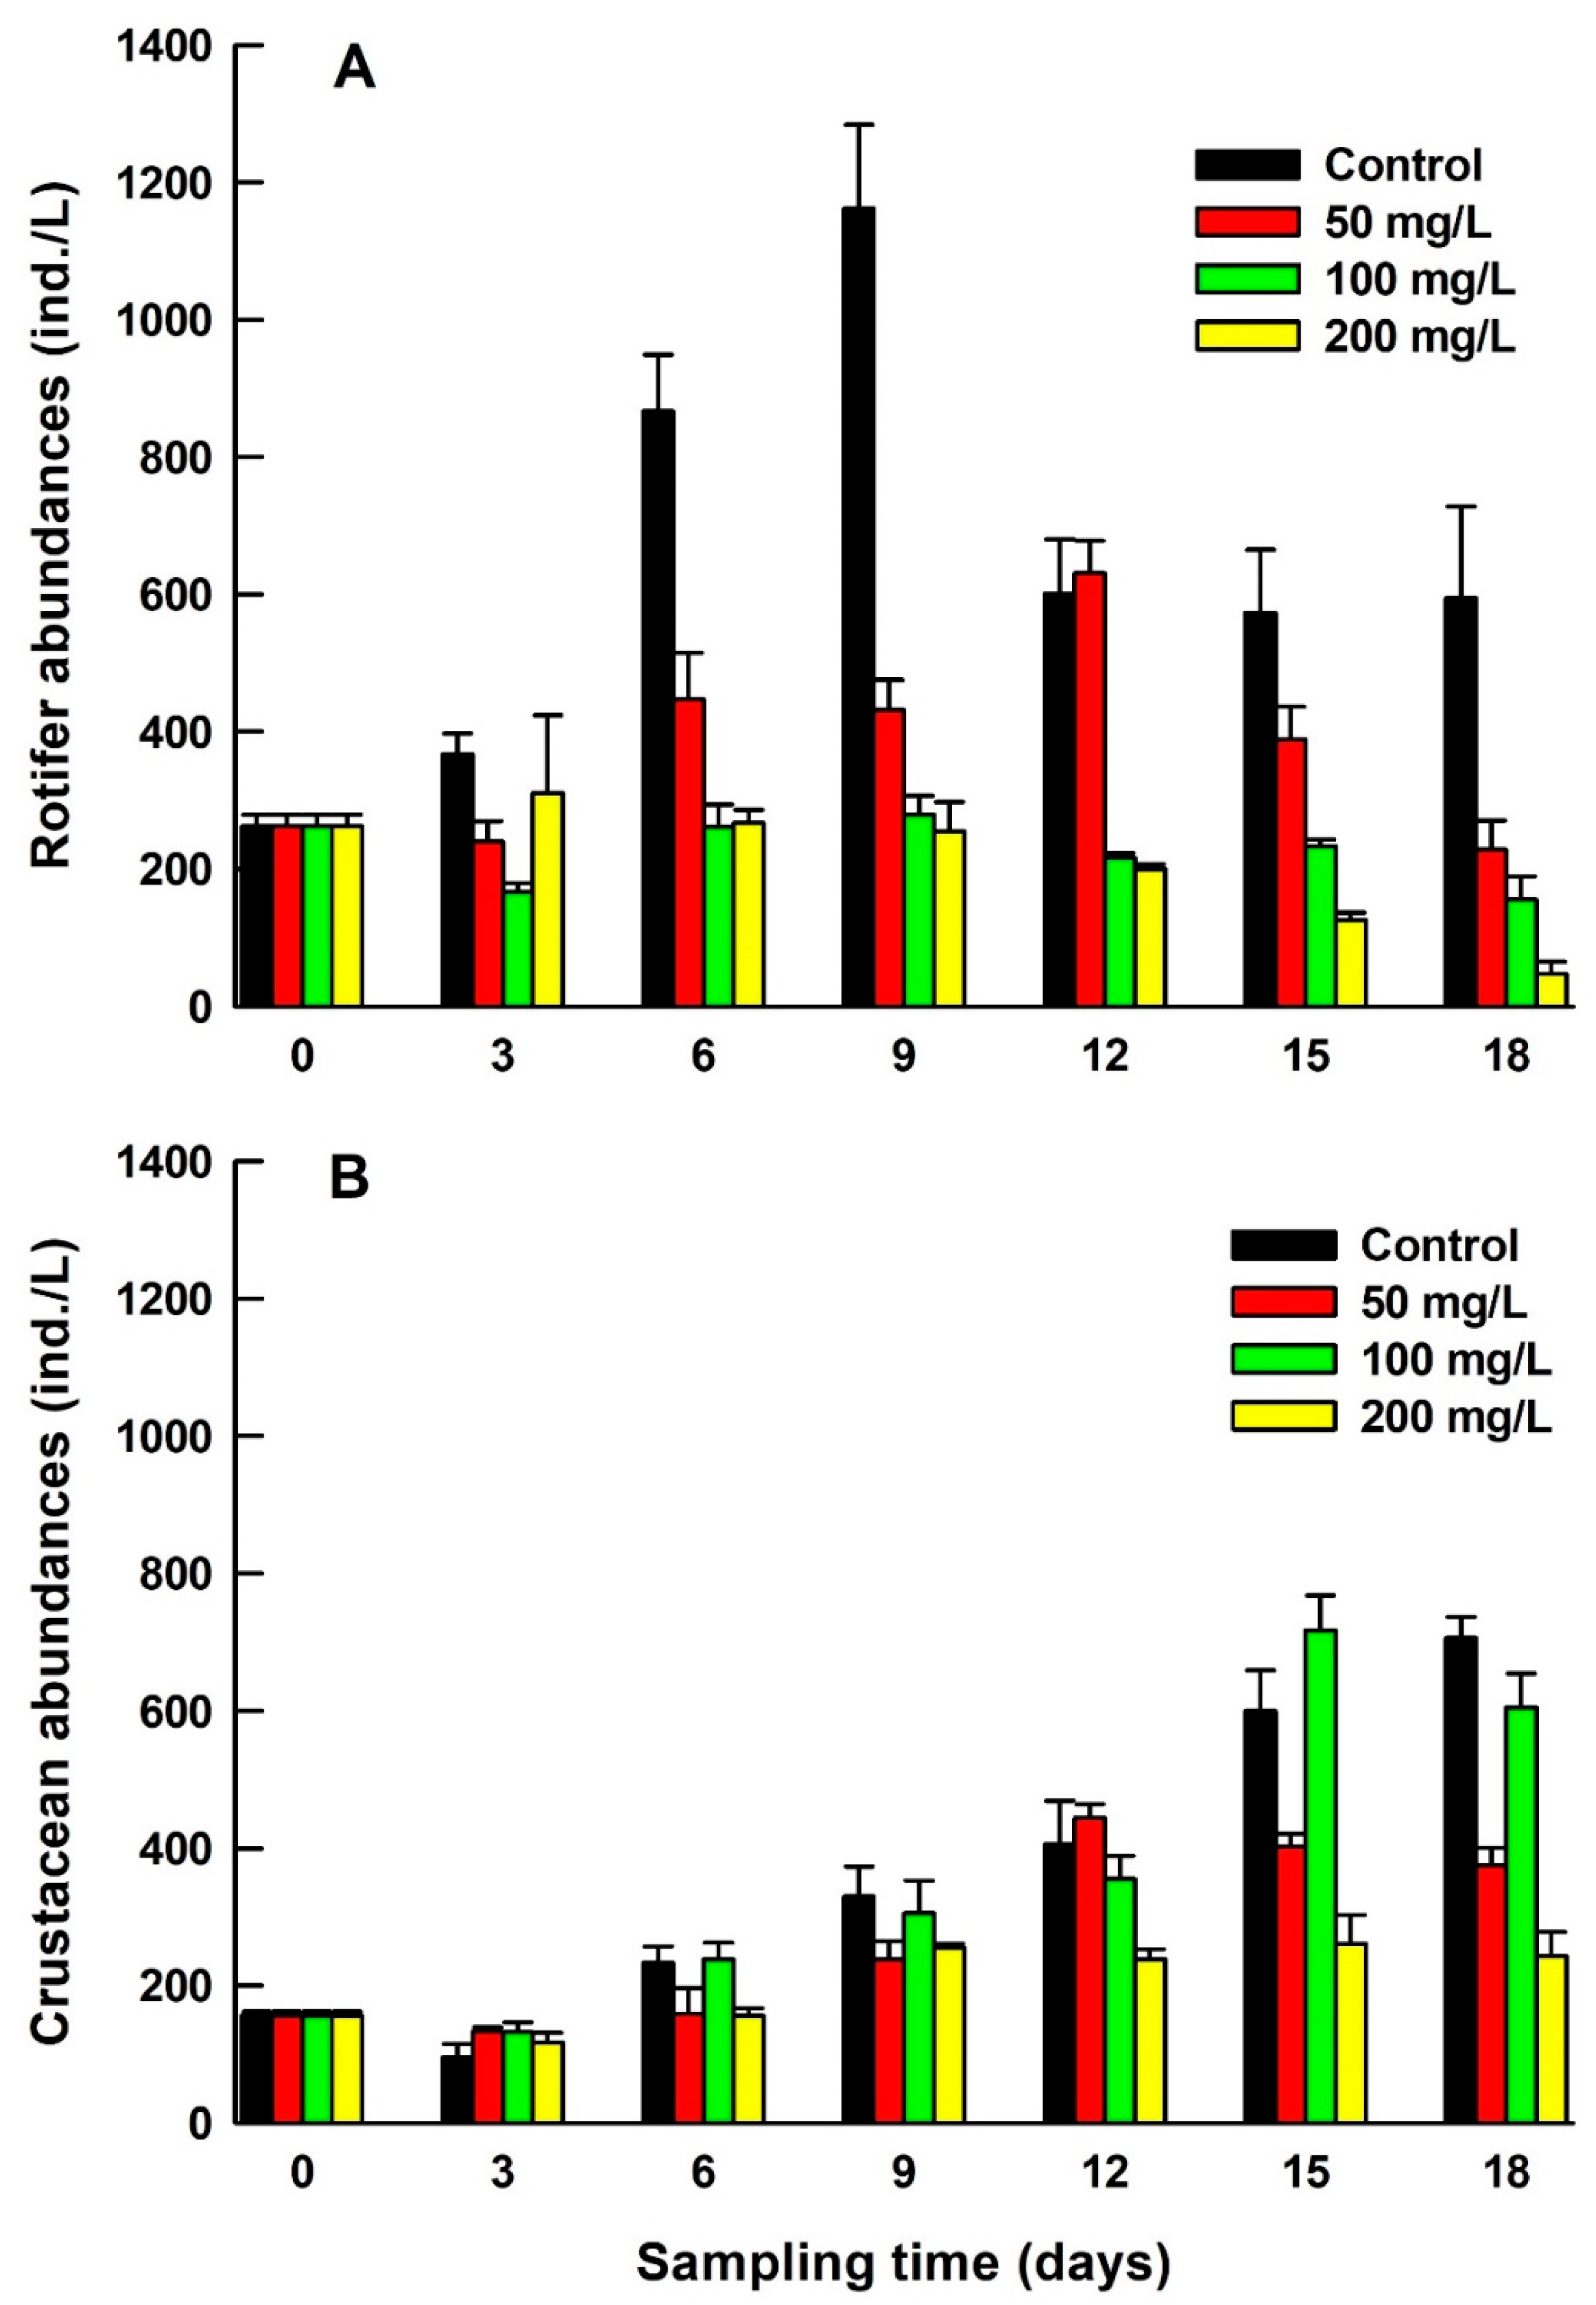
Figure 2.
Changes in the species abundances of zooplankton under different concentrations of salt in relation to duration of exposure.
Figure 2.
Changes in the species abundances of zooplankton under different concentrations of salt in relation to duration of exposure.
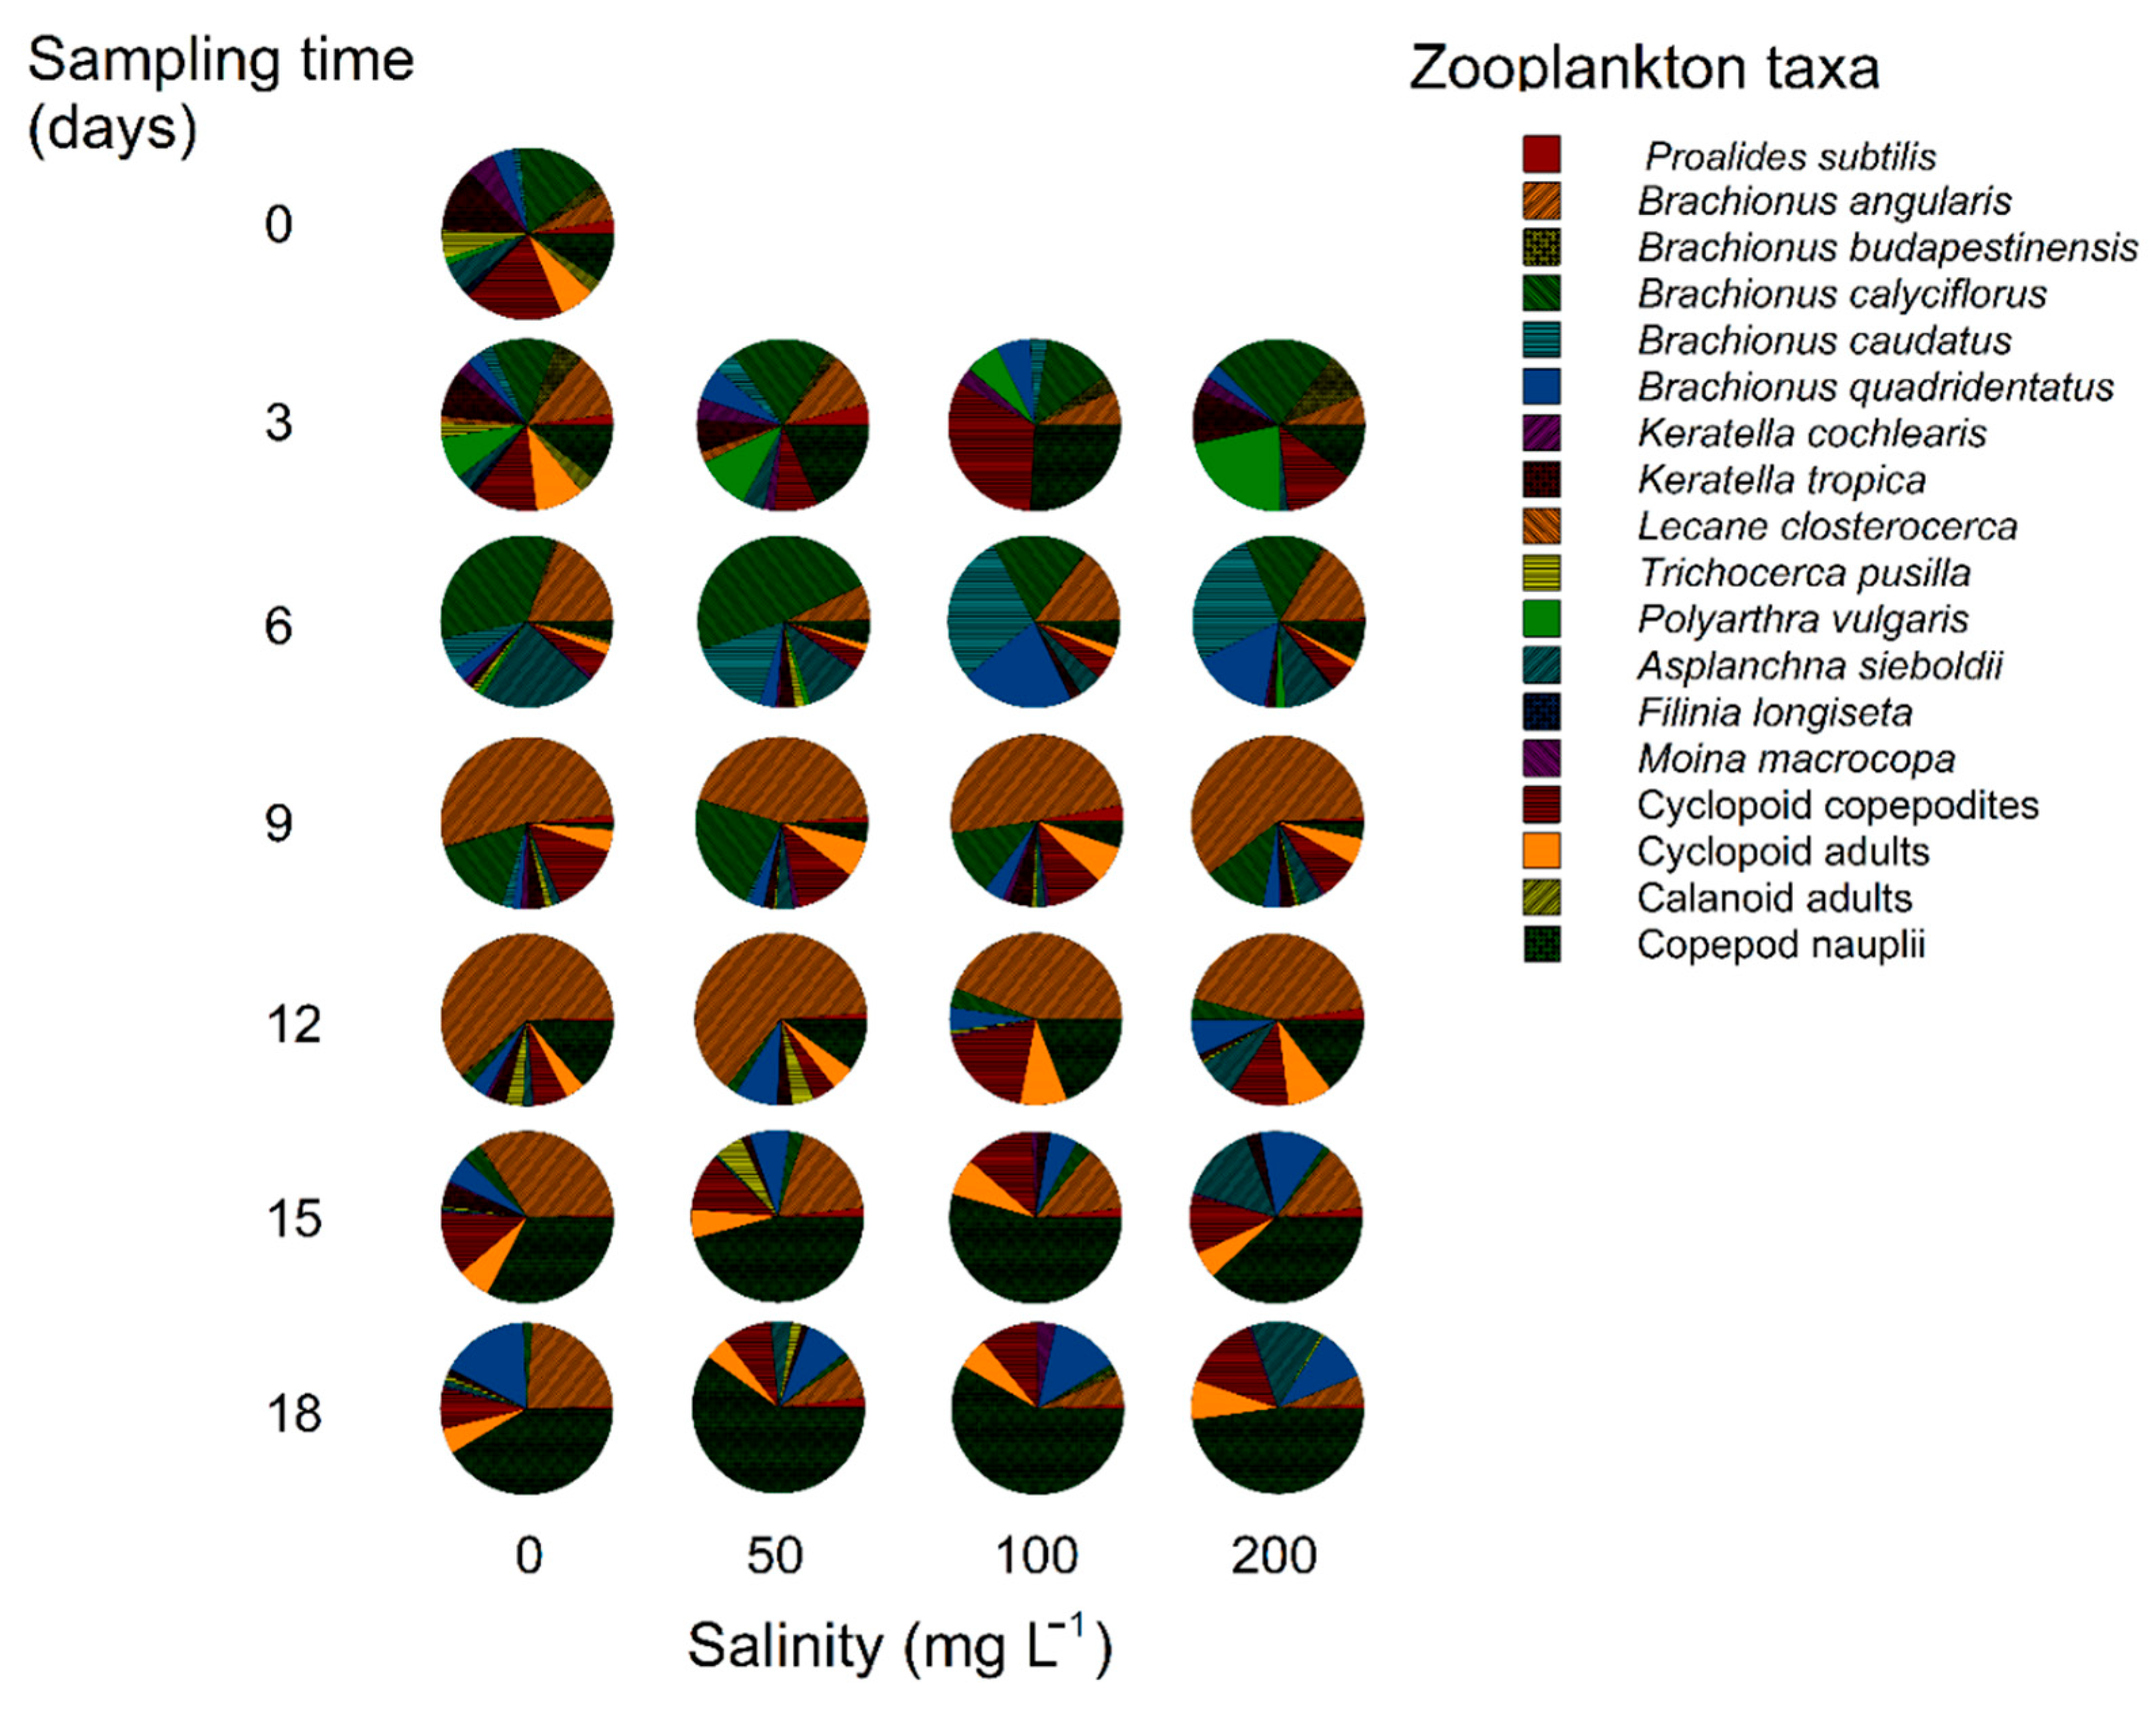
Figure 3.
Shannon diversity index of zooplankton under different concentrations of salt in relation to duration of exposure.
Figure 3.
Shannon diversity index of zooplankton under different concentrations of salt in relation to duration of exposure.
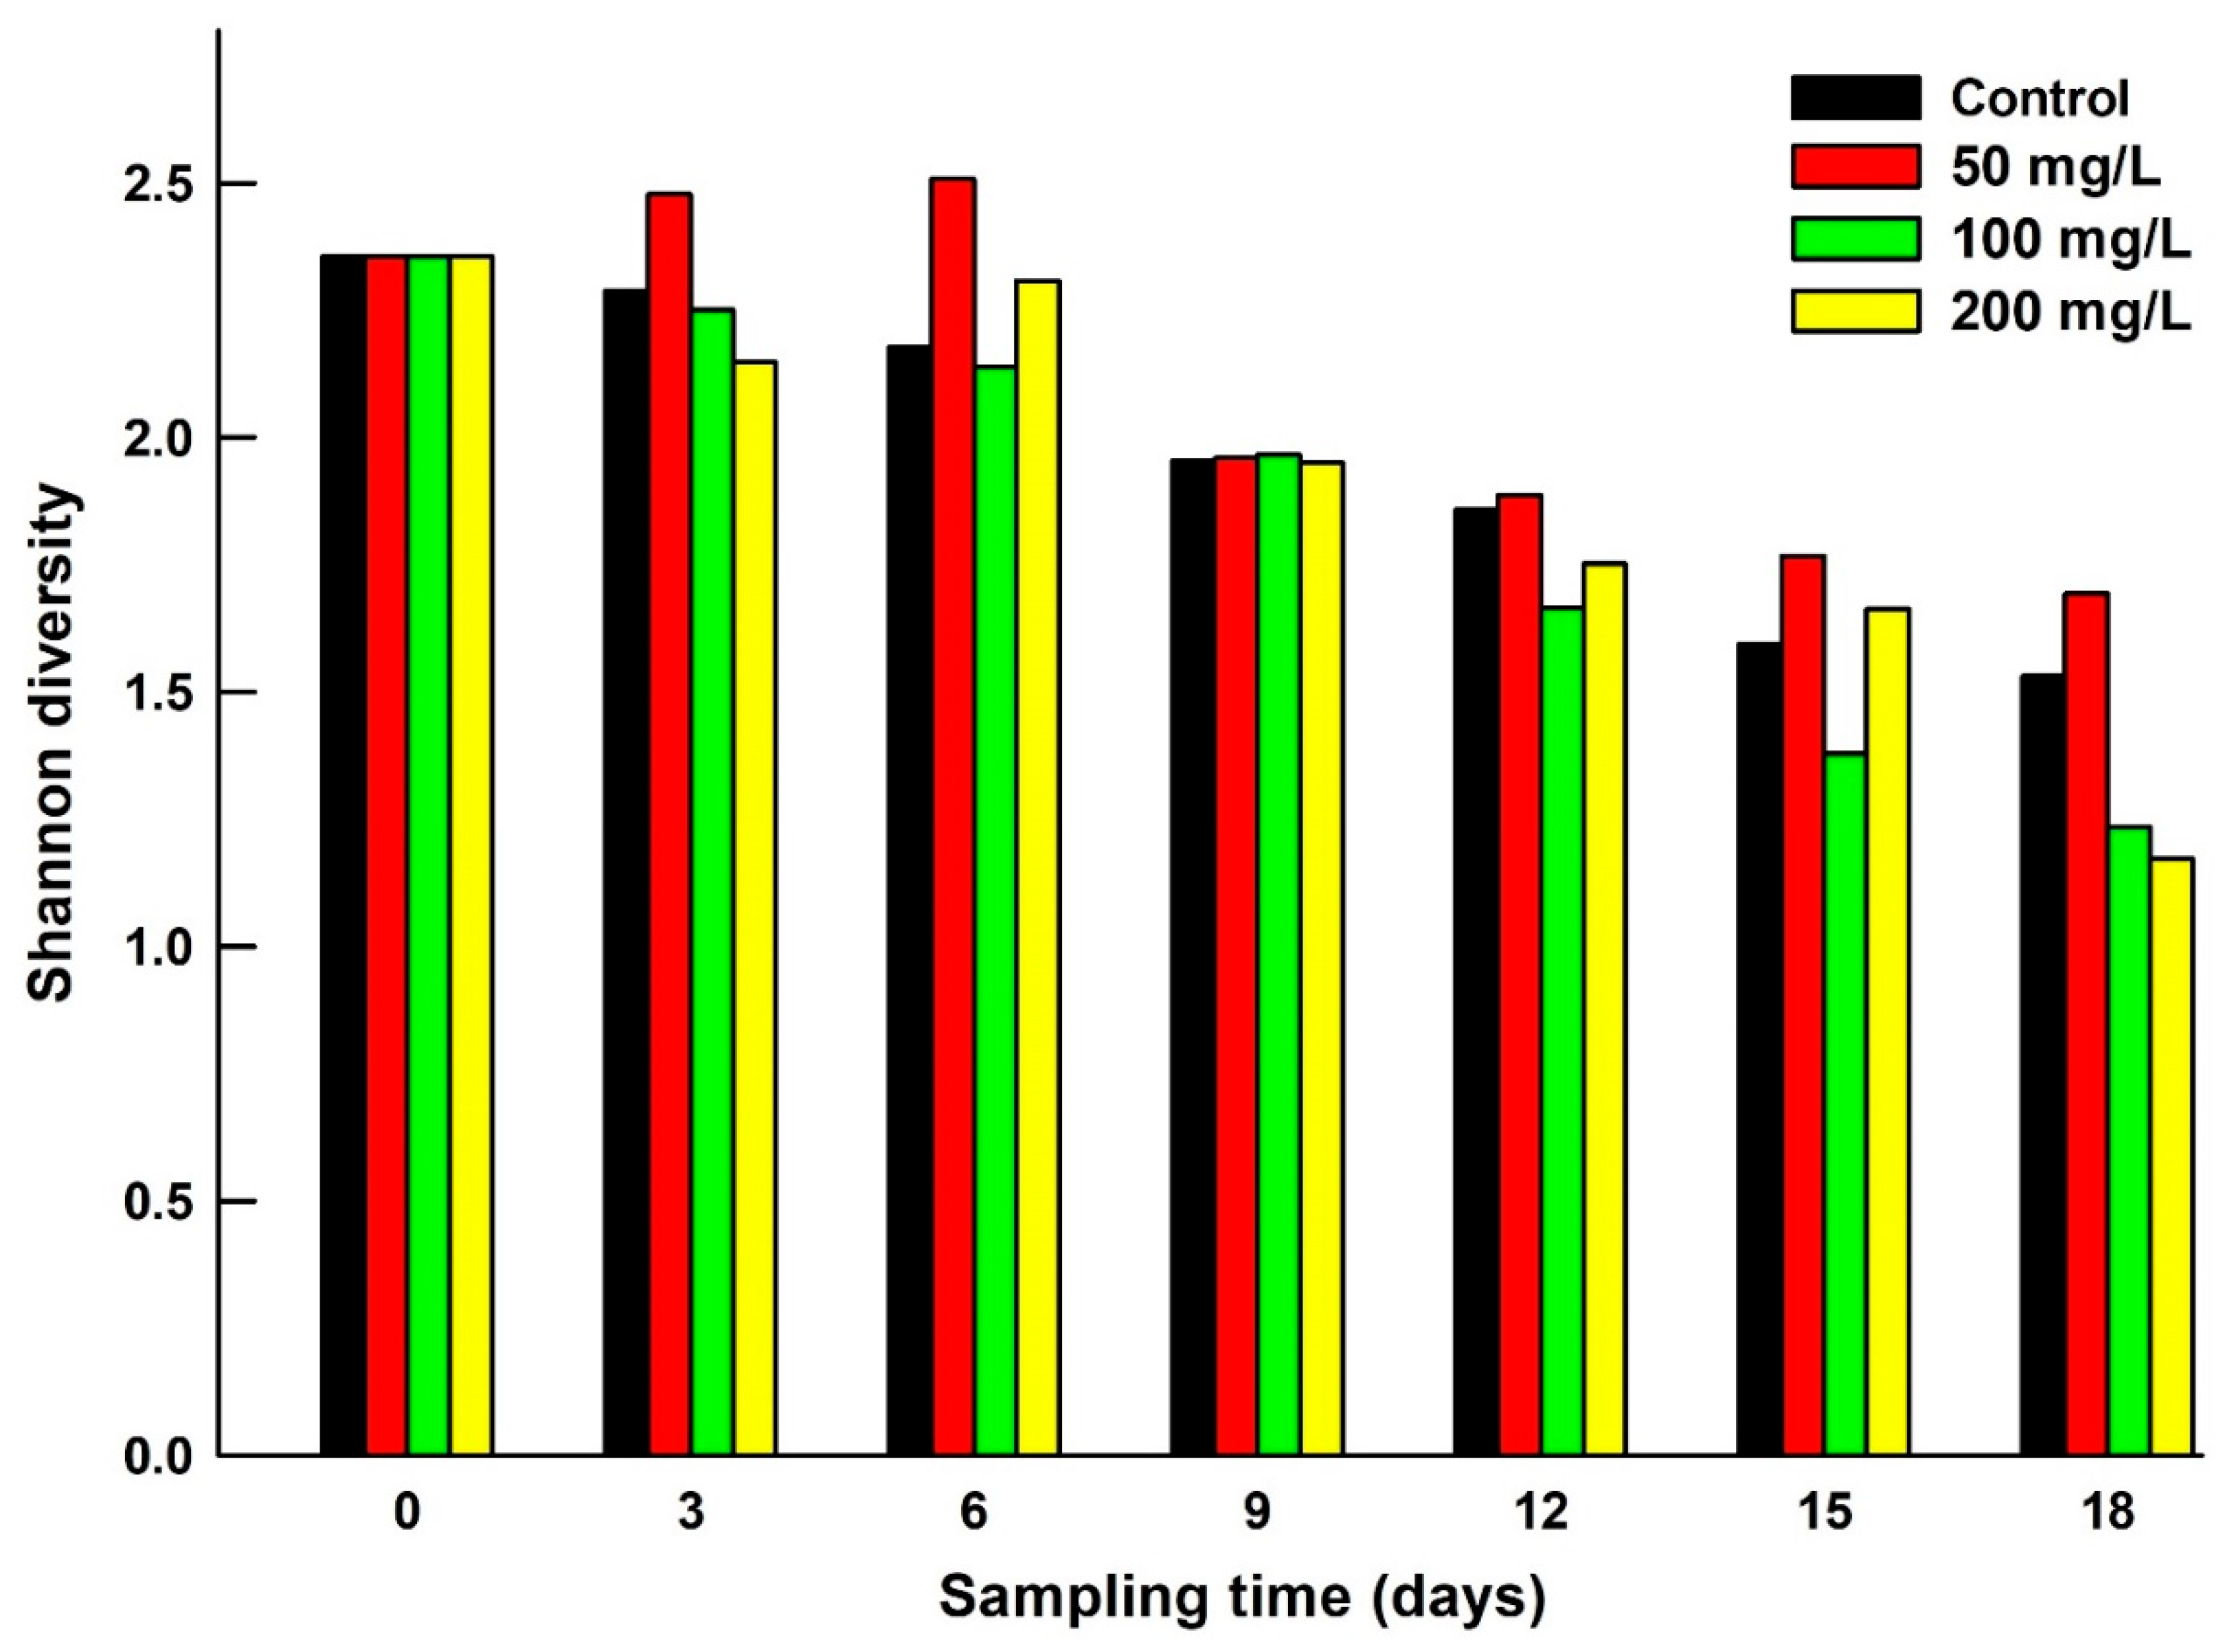
Figure 4.
Evenness values of zooplankton community under different concentrations of salt in relation to duration of exposure.
Figure 4.
Evenness values of zooplankton community under different concentrations of salt in relation to duration of exposure.
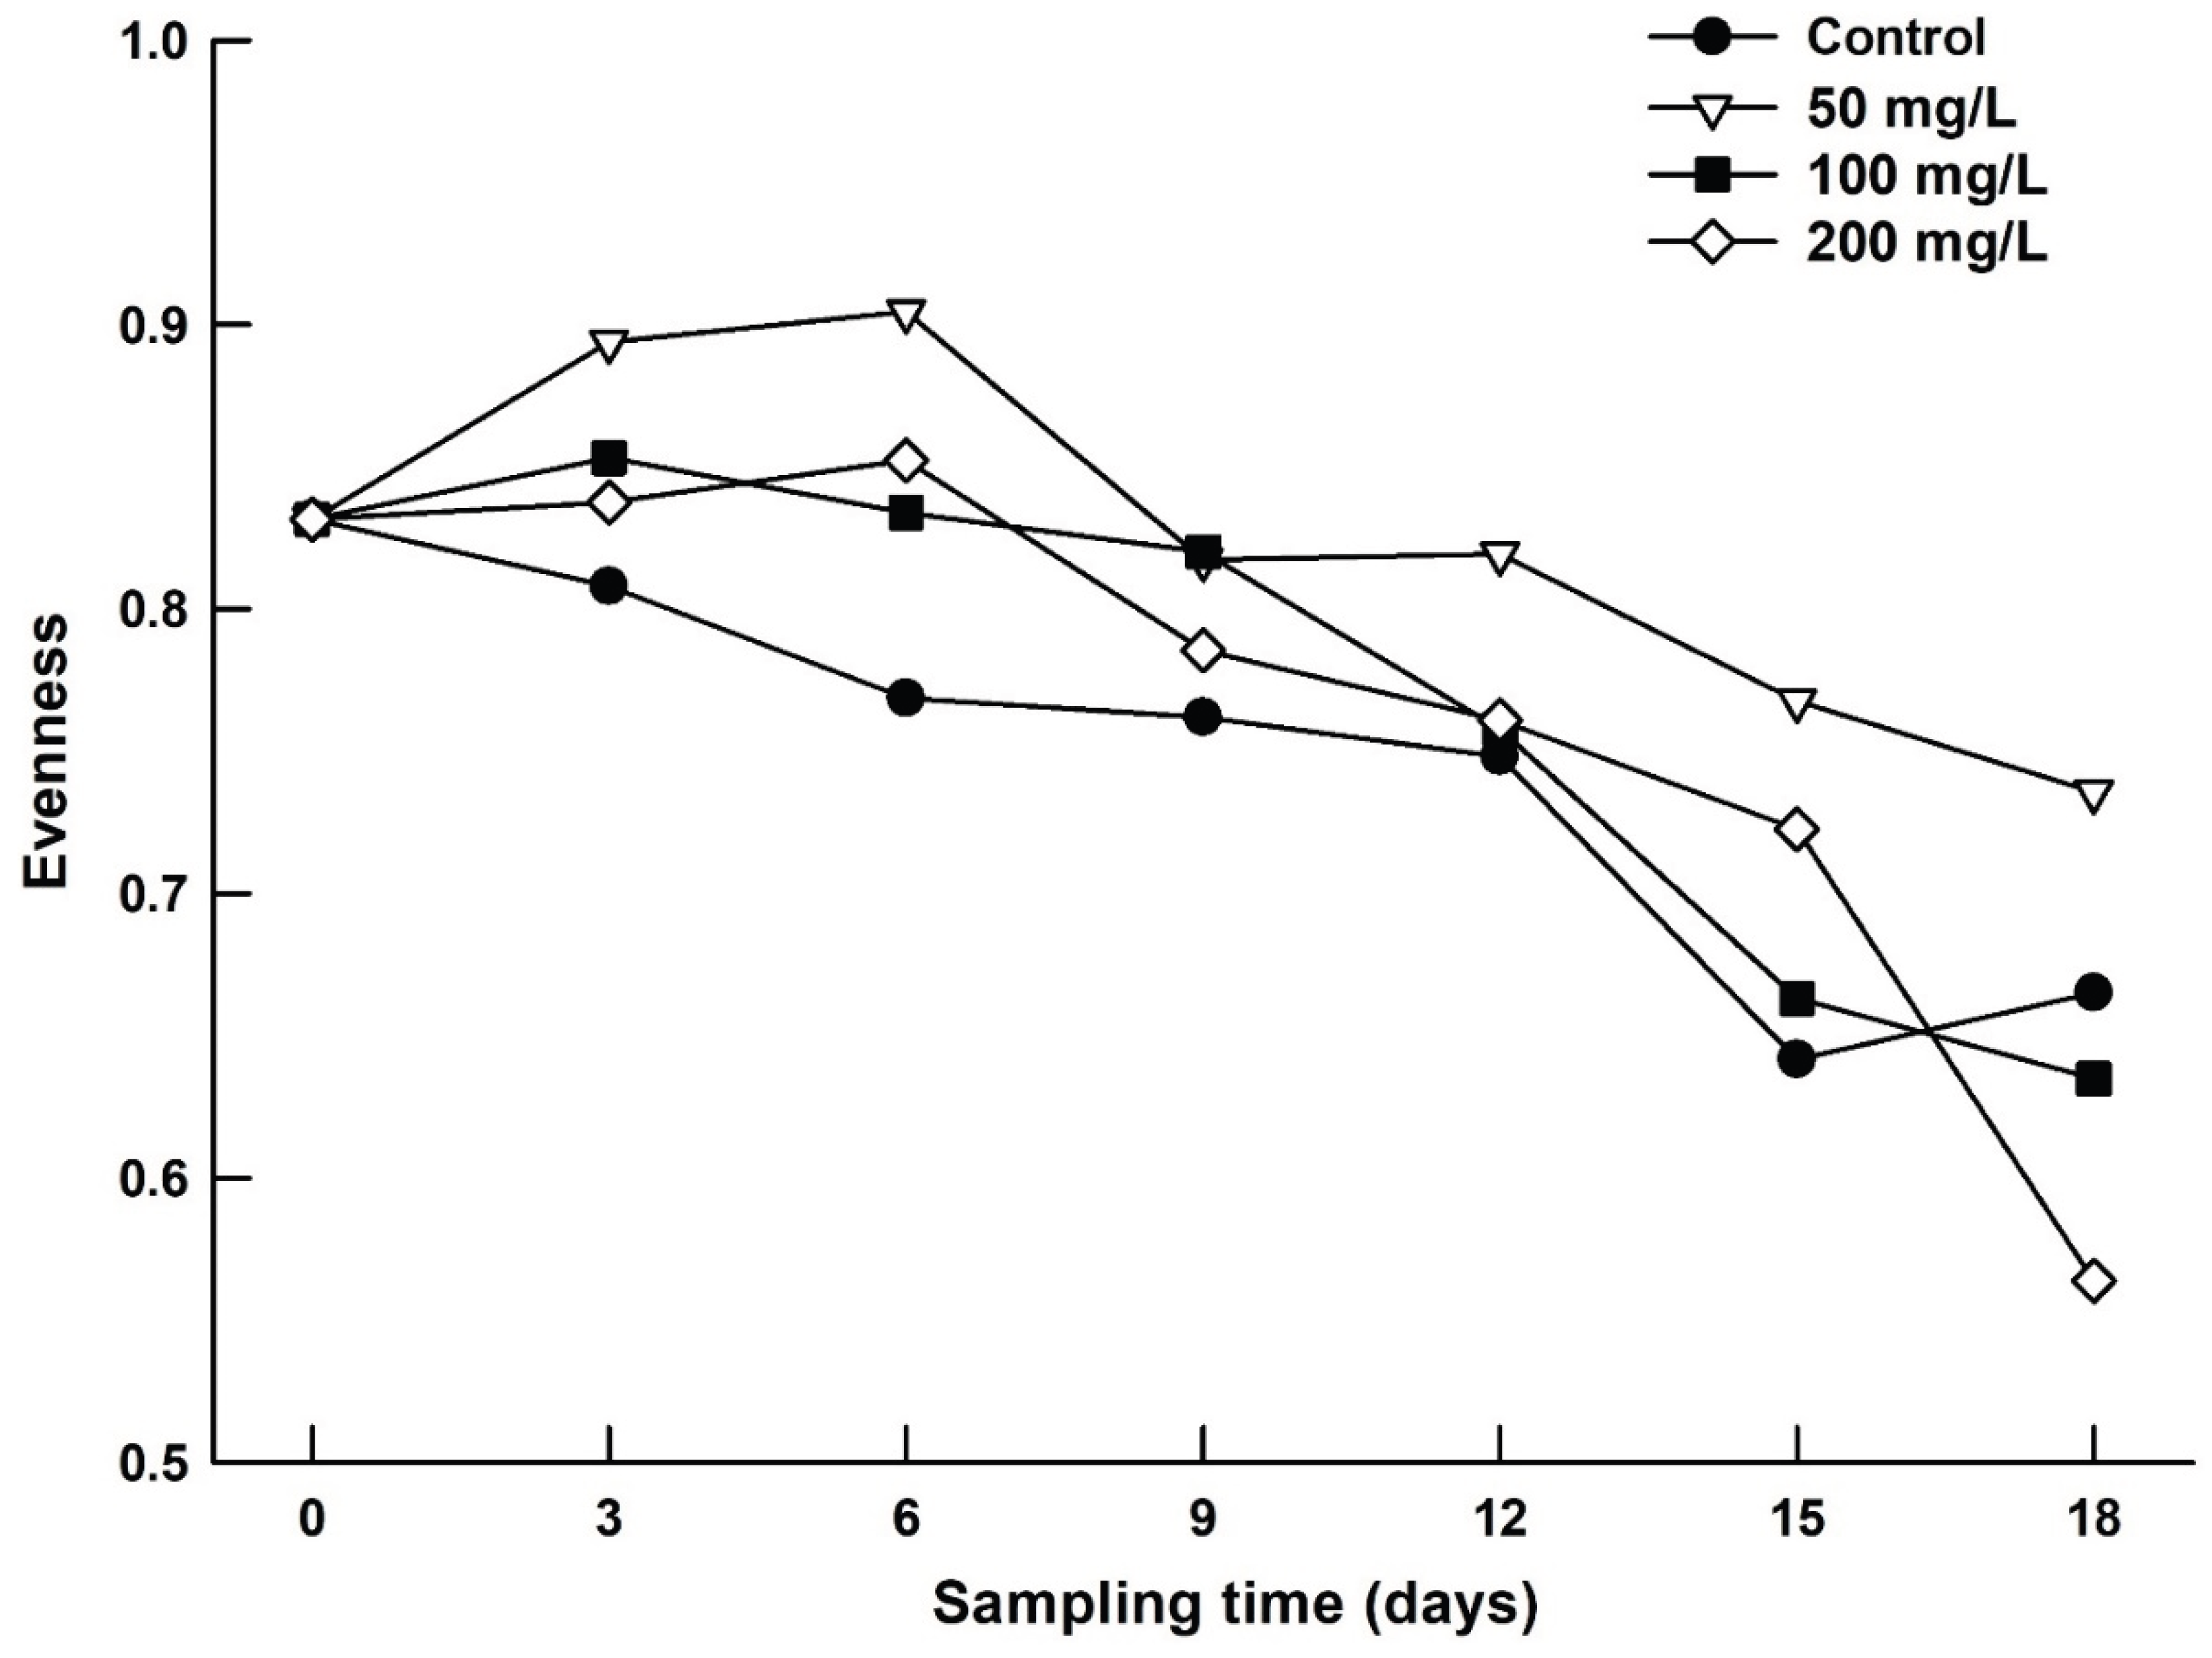

Table 1.
Selected physicochemical variables (pH, conductivity (µS/cm), PO4 (mg/L) and Chlorophyll a (µg/L)). For each variable, data represent mean±SE based on 3 replicates.
Table 1.
Selected physicochemical variables (pH, conductivity (µS/cm), PO4 (mg/L) and Chlorophyll a (µg/L)). For each variable, data represent mean±SE based on 3 replicates.
| Sampling | Variable | Control | 50 mg/L | 100 mg/L | 200 mg/L |
|---|---|---|---|---|---|
| 0 days | pH | 9.23±0.07 | 9.23±0.07 | 9.23±0.07 | 9.23±0.07 |
| Cond. | 1749.80±15.7 | 1749.80±15.7 | 1749.80±15.7 | 1749.80±15.66 | |
| PO4 | 1.17±0.07 | 1.17±0.07 | 1.17±0.07 | 1.17±0.07 | |
| Chl a | 119.74±16.5 | 119.74±16.5 | 119.74±16.5 | 119.74±16.5 | |
| 3 days | pH | 9.53±0.03 | 9.53±0.03 | 9.37±0.03 | 9.43±0.03 |
| Cond. | 456.33±22.34 | 813.67±17.32 | 1101.00±2.65 | 1538.00±43.1 | |
| PO4 | 1.35±0.03 | 1.30±0.20 | 0.80±0.01 | 0.50±0.12 | |
| Chl a | 85.01±31.92 | 99.12±8.90 | 120.58±26.28 | 100.60±16.47 | |
| 6 days | pH | 9.23±0.07 | 9.10±0.06 | 9.13±0.03 | 9.17±0.03 |
| Cond. | 586.00±26.50 | 910.00±7.21 | 1336.00±44.2 | 1926.33±19.75 | |
| PO4 | 0.65±0.10 | 0.78±0.01 | 0.86±0.10 | 0.99±0.29 | |
| Chl a | 113.51±17.37 | 120.52±15.95 | 123.65±21.41 | 101.09±27.06 | |
| 9 days | pH | 9.03±0.03 | 8.90±0.06 | 8.83±0.03 | 9.00±0.80 |
| Cond. | 627±35.68 | 940.00±6.43 | 1528.67±29.2 | 1740.00±87.18 | |
| PO4 | 0.30±0.03 | 0.52±0.02 | 0.53±0.03 | 0.50±0.02 | |
| Chl a | 47.24±6.76 | 85.82±29.75 | 56.30±10.10 | 63.46±6.80 | |
| 12 days | pH | 8.43±0.17 | 8.47±0.03 | 8.47±0.03 | 8.57±0.03 |
| Cond. | 626.33±45.69 | 954.33±40.99 | 1498.67±62.3 | 1850.00±90.47 | |
| PO4 | 0.20±0.03 | 0.22±0.15 | 0.33±0.04 | 0.33±0.13 | |
| Chl a | 25.37±5.68 | 53.24±13.21 | 32.43±7.38 | 58.55±13.82 | |
| 15 days | pH | 8.47±0.09 | 8.47±0.03 | 8.47±0.03 | 8.50±0.75 |
| Cond. | 788.00±31.53 | 1201±25.32 | 1990.00±10.0 | 2000.00±35.00 | |
| PO4 | 0.20±0.03 | 0.21±0.01 | 0.33±0.04 | 0.33±0.13 | |
| Chl a | 23.92±10.85 | 53.99±11.94 | 44.22±6.19 | 40.43±6.52 | |
| 18 days | pH | 7.76±0.03 | 7.83±0.03 | 7.83±0.03 | 7.70±0.06 |
| Cond. | 735.00±21.03 | 1115.00±43.4 | 1757.67±53.7 | 1900.00±100.0 | |
| PO4 | 0.35±0.07 | 0.54±0.06 | 0.34±0.02 | 0.41±0.02 | |
| Chl a | 23.92±10.85 | 54.00±12.00 | 44.00±6.20 | 40.42±65.24 |
Table 2.
List of zooplankton species encountered during the test period.
| Rotifera Family: Epiphanidae Proalides subtibilis Rodewald, 1940 Family: Brachionidae Brachionus angularis Gosse, 1851 B. budapestinensis Daday, 1885 B. calyciflorus Pallas, 1766 B. caudatus Barrois & Daday, 1894 B. quadridentatus Hermann, 1783 Keratella cochlearis (Gosse, 1851) K. tropica (Apstein, 1907) Family: Lecanidae Lecane closterocerca (Schmarda, 1859) Family: Trichocercidae Trichocerca pusilla (Hauer, 1929) Family: Synchaetidae Polyarthra vulgaris Carlin, 1943 Family: Asplanchnidae Asplanchna sieboldii (Leydig, 1854) Filiniidae Filinia longiseta (Ehrenberg, 1834) Cladocera Family: Moinidae Moina macrocopa (Straus, 1820) Copepoda Family: Cyclopidae Acanthocyclops americanus (Marsh, 1893) Family: Diaptomidae Arctodiaptomus dorsalis (Marsh, 1907) |
Table 3.
Two-way analysis of variance between total zooplankton abundance (rotifers and crustaceans, separately) and salinity level and exposure time. DF: degrees of freedom; SS: sum of squares; MS: mean square; F ratio; p: probability.
Table 3.
Two-way analysis of variance between total zooplankton abundance (rotifers and crustaceans, separately) and salinity level and exposure time. DF: degrees of freedom; SS: sum of squares; MS: mean square; F ratio; p: probability.
| Source of Variation | DF | SS | MS | F | P |
|---|---|---|---|---|---|
| Total rotifer abundances | |||||
| Salinity level (A) | 3 | 2419573.99 | 806524.66 | 85.05 | <0.001 |
| Exposure time (B) | 6 | 859321.67 | 143220.27 | 15.1 | <0.001 |
| Interaction of A x B | 18 | 1365595.73 | 75866.43 | 8.00 | <0.001 |
| Error | 56 | 531012.33 | 9482.36 | ||
| Total crustacean abundances | |||||
| Salinity level (A) | 3 | 358356.75 | 119452.25 | 40.32 | <0.001 |
| Exposure time (B) | 6 | 1670145.45 | 278357.57 | 93.97 | <0.001 |
| Interaction of A x B | 18 | 521186.87 | 28954.82 | 9.77 | <0.001 |
| Error | 56 | 165871.51 | 2961.99 | ||
Disclaimer/Publisher’s Note: The statements, opinions and data contained in all publications are solely those of the individual author(s) and contributor(s) and not of MDPI and/or the editor(s). MDPI and/or the editor(s) disclaim responsibility for any injury to people or property resulting from any ideas, methods, instructions or products referred to in the content. |
© 2025 by the authors. Licensee MDPI, Basel, Switzerland. This article is an open access article distributed under the terms and conditions of the Creative Commons Attribution (CC BY) license (https://creativecommons.org/licenses/by/4.0/).
Copyright: This open access article is published under a Creative Commons CC BY 4.0 license, which permit the free download, distribution, and reuse, provided that the author and preprint are cited in any reuse.


