
Submitted:
09 December 2025
Posted:
11 December 2025
You are already at the latest version
Preprints on COVID-19 and SARS-CoV-2
Abstract
The implementation of COVID-19 vaccination in the United States has revealed substantial disparities driven by geography, socioeconomic status, and political ideology. This study explores how these factors were associated with vaccination intake across 360 counties within four U.S.-Mexico border states with distinct socio-political traits. Using regression analysis and GIS mapping, it evaluates the effects of income, education, employment, age, race, ethnicity, occupation, metro status, border status, and political affiliation on first-dose, full vaccination, and booster rates. First-dose rates were found to be significantly higher in border counties (β = 11.184, p < 0.001) and metropolitan areas (β = 2.246, p = 0.040). Democratic population (β = 0.644, p < 0.001) and per capita income (β = 0.950, p = 0.002) were positively associated with the vaccination. Complete-dose vaccination showed significant results similar to those of the first-dose model. Booster was positively associated with Democratic affiliation (β = 0.206, p < 0.001), high school graduation level (β = 0.172, p = 0.007), and the proportion of individuals aged 65 plus (β = 0.484, p < 0.001). In contrast, it was negatively associated with unemployment rates (β = −0.410, p < 0.001). Race and ethnicity also were related to vaccination outcomes: A higher Black population share was linked to lower first-dose vaccination rates (β = −0.386, p < 0.001), whereas Native American population share was associated with increased vaccination. Booster intake increased with a higher Asian population (β = 0.383, p = 0.001) but slightly declined with a higher White population (β = −0.071, p = 0.019).
Keywords:
COVID-19 vaccination
; U.S.-Mexico border counties
; socioeconomic determinants
; political affiliation
; race and ethnicity
1. Introduction
The COVID-19 pandemic has posed unprecedented global challenges. It has prompted an urgent global response centered on widespread vaccination efforts to reduce the virus’s spread and mitigate its health impacts. However, vaccination rates have varied significantly across regions and demographic groups in the United States, shaped by a complex socio-economic, political, and demographic connection [1,2,3,4]. These challenges are evident in the U.S.-Mexico border region, a geographically and socio-politically distinct area marked by high cross-border mobility, economic interdependence, immigration-related vulnerabilities, and historical healthcare disparities [5,6,7,8,9].
The border states, comprising Arizona, California, New Mexico, and Texas across mid- and west-U.S., provide a unique understanding of how border counties react to the call for vaccination. At the same time, its implementation was observed facing multifaceted barriers. Despite federal and state-level COVID-19 vaccination mandates, vaccination uptake remained inconsistent. As of April 2023, full vaccination rates differed notably across these states, with 75.4% in New Mexico, 75.2% in California, 68.2% in Arizona, and 64.2% in Texas [10]. Such disparities were even more pronounced within the border counties. For instance, in Texas, its border-county vaccinations dropped as low as 50%, suggesting the need for targeted public health interventions. Primarily, it is attributed to limited healthcare access, lower levels of economic opportunity, and higher public health risks, making residents susceptible to the compounding effects of misinformation, vaccine hesitancy, and systemic inequities [11]. Meanwhile, border governance measures such as port closures and travel restrictions, while slowing the spread of COVID-19, produce unintended socio-economic disruptions, further complicating public health interventions [12].
Recent studies have highlighted the various aspects of socio-political conditions, including immigration status, historical distrust in the healthcare system, political ideologies, and economic disparities, which influenced vaccination outcomes in border communities [13,14]. However, despite the growing relevant literature, there remains a high need for more targeted and data-driven research on the U.S.–Mexico border. Therefore, this study aims to fill the gap by examining socio-political and economic factors influencing COVID-19 vaccinations along the U.S.-Mexico border. It seeks to answer how border policies, socio-economic conditions, and political preferences were related to vaccine accessibility and acceptance. It extends prior research by [4] by analyzing vaccination data across 360 counties in the U.S.-Mexico border, including the first-dose, second-dose, and booster-dose vaccinations as of September 14, 2022. The study employs regression analysis and GIS mapping technique to examine the relationship between demographic characteristics, personal income, employment status, education, race, age, occupation, residential area, political preference, metro status, and vaccination rates. The analysis focuses on three key indicators of vaccination coverage: the percentage of individuals receiving at least one vaccine dose, those completing a primary vaccination series, and those who received a booster dose.
The COVID-19 pandemic emphasized the connection between public health, socio-political structures, and economic disparities [4,14]. In the U.S.-Mexico border, as also appearing in other areas, vaccine acceptance is associated with civilian trust in healthcare, misinformation, vaccine hesitancy, systemic disparities, historical inequalities, and border policies. Here, a literature review covering the socio-political and economic factors related to COVID-19 vaccination is summarized.
1.1. The COVID-19 Pandemic and the Border Paradox
The COVID-19 pandemic has reignited critical discussions about the function of borders related to public health governance. As the virus rapidly spread globally, many governments implemented international border closures as a primary containment strategy. However, these measures had complex consequences; while ostensibly enacted to control the transmission, they disproportionately impacted marginalized populations and cross-border communities, thereby deepening existing healthcare disparities [12]. Instead of serving purely epidemiological purposes, border restrictions were often operated as political and economic tools, limiting healthcare access for vulnerable groups rather than effectively curbing the virus. U.S. border counties had higher standardized mortality ratios than the national average, while Mexican border states reported slightly lower rates; a negative correlation was also identified between mortality rates and the Human Development Index (HDI) across the U.S. border states [14]. Similarly, a Texas border study on geographical locations during the COVID-19 pandemic found that border counties experienced more fatalities than interior counties [15].
Recent studies focused on the unique vulnerabilities faced by border populations during the pandemic. A community-based COVID-19 testing program in a predominantly Latino neighborhood near the U.S.–Mexico border points out the importance of culturally tailored health interventions to address testing inequities [16]. Another study on cross-border truck drivers revealed the logistical and communicative challenges in reaching mobile populations with prevention messaging [17]. In response to healthcare disruptions, researchers proposed post-pandemic strategies to improve healthcare access for U.S.-Mexican migrants using the Mexican health system [6]. Furthermore, analysis of vaccine uptake in a border community revealed sociocultural and economic factors influencing vaccination rates, shedding light on persistent disparities in public health engagement [7].
Further studies have shown that the COVID-19 pandemic deepened health inequities across the U.S.–Mexico border region, disproportionately affecting Hispanic and Latino communities. Among Mexican and Central American immigrants, factors such as undocumented status, lack of health insurance, and fear of engaging with healthcare systems significantly hindered access to essential services during the pandemic [18]. These barriers contributed to delayed treatment and worsened outcomes, especially for Latinx patients hospitalized with COVID-19 [9]. Beyond physical health, the pandemic also had severe psychological impacts. Latinx residents in the Rio Grande Valley experienced high levels of anxiety, depression, and post-traumatic stress symptoms, reflecting the emotional burden of health risks, economic instability, and social disruption during this period [19]. In El Paso, Texas, pre-existing disparities such as limited healthcare access, chronic disease prevalence, and socioeconomic vulnerability intensified the pandemic’s toll on Hispanic communities, increasing their susceptibility to COVID-19 infection and adverse outcomes [20]. Additionally, restrictive border policies and reduced cross-border mobility further complicate access to health services and vital resources for transborder populations, revealing the critical intersection between public health and mobility in borderland contexts [13].
1.2. Public Perception of COVID-19 and Vaccine Acceptance
Public perception of COVID-19 and attitudes toward vaccination have significantly influenced the course of the pandemic response. Misinformation contributes to vaccine hesitancy, mainly through social media platforms, which serve as conduits for misleading narratives [1,21,22,23]. The willingness to get vaccinated tends to increase among communities with stronger trust in government and science, reduced safety concerns, lower costs, and access to reliable vaccine-related information [24,25,26,27]. Conversely, misinformation about vaccine safety and the speed of vaccine development has fueled hesitancy in various populations, especially those with historical skepticism toward public health authorities [28,29]. Throughout the United States, perceptions of the virus’s severity and trust in health institutions have varied across demographic, geographic, and political lines, influencing vaccine acceptance and uptake [30,31]. Trust in local versus federal authorities also matters. In border regions, where policy enforcement and communication often reflect state and federal dynamics, inconsistencies can weaken public confidence [32,33]. Moreover, the prevalence of misinformation and a long-standing skepticism towards institutions and the healthcare system add to the challenges of acceptance, especially among socially marginalized border communities and among Black and Indigenous communities in Canada and the United States [34,35,36]. Additional research across various vaccine platforms has underlined unique advantages and limitations [37,38,39] while broader studies emphasize the health, economic, and social benefits of vaccination, supporting widespread immunization [40,41].
1.3. Economic and Socio-Political Impacts on Vaccination Efforts
The COVID-19 pandemic has had far-reaching socio-economic and political consequences, which, in turn, have influenced vaccination across the U.S.–Mexico border region. Higher infection and mortality rates among racial and ethnic minorities, including Black and Hispanic communities, have revealed a gap in vaccination efforts [38,42,43,44]. Low-income populations, particularly in rural and underserved areas, have encountered logistical and financial challenges accessing vaccination sites. These challenges include limited transportation options, inability to take time off work, and lack of nearby health infrastructure [4,45,46,47]. At the county level, variations in political ideology have influenced public health messaging and vaccine uptake. Studies have found that counties with higher proportions of conservative voters had lower vaccination rates, reflecting skepticism toward federal public health initiatives and resistance to vaccine mandates [1,2,3,4,48,49]. This political schism has resulted in inconsistent implementation of public health strategies and uneven risk communication, which hampers efforts to increase vaccine coverage, particularly in communities with strong political polarization. Similar trends emerged in the European Union, where supporters of far-right or populist political parties were significantly more likely to exhibit COVID-19 vaccine hesitancy [50]. Concurrently, economic disparities influenced vaccine uptake, where individuals in higher income brackets were substantially more likely to receive the COVID-19 vaccination compared to lower-income groups [51]. For example, per capita income is positively correlated with vaccination rates in Turkey, with lower-income populations exhibiting greater hesitancy [52]. Furthermore, education played a crucial role; individuals with only a secondary education or those who had discontinued their academic studies exhibited greater vaccine hesitancy, whereas those with higher education levels were more likely to get vaccinated.
1.4. Theoretical Linkage
Vaccination study across borders can be linked to the theoretical structures as follows. In the Theory of Border (ToB) by Thomas Nail, it is characterized as a geographical, geopolitical, and cross-socioeconomic space with interdependence, complexity, and hybridity, which is supported by and created from people of diversified countries of origin, cultures, and communities [53]. The US-Mexico border’s economic landscape uniquely creates an interdependence, where the US side offers immigrant-filled jobs and higher living standards, while the Mexican side provides cheaper labor for lower-cost production. The movement-oriented ‘kinopolitics’ across the U.S.-Mexico border states infused the hybridity of the bi-national workforce, added by the complexity of culture and society. In the presence of COVID, different social and cultural groups, therefore, may act differently in their vaccination willingness and acceptance.
Rational Choice Theory (RCT), originated by Adam Smith, summarizes a person’s choice and decision based on rationality, analyzing the cost and benefit of an event to maximize his/her benefit or utility. In a society, RCT may result in a collective behavior when the individuals, known as ‘rational actors’, perceive the societal benefit by amassing and acting aggregately [54]. As shown in Figure 1, in the presence of pandemic, the U.S.-Mexico border potentially exposes to higher risks of cross-border virus spread, inhabitants may act to choose and take the vaccination for their individual and communal health protection.
2. Materials and Methods
2.1. Data Sources and Variables
County-level COVID-19 vaccination rates, containing percentage people who were fully vaccinated with at least one dose, percent of people who have completed a primary series (have second dose of a two-dose vaccine or one dose of a single-dose vaccine), and percent of people who completed a primary series and have received a booster as of September 14, 2022, were analyzed in this study. This cutoff date was chosen to capture approximately one year of booster uptake following the initial booster recommendation for adults 65 years and older issued in September 2021 [55]. The characteristics of each vaccine type are summarized in Table A1 of the Appendix A.
The analyses are based on multiple data sources, encompassing an aggregated dataset of 360 counties across the four-border states (AZ, CA, NM, and TX) in the Mid- and Southwest regions since the outbreak of COVID-19 until mid-2022. Various independent variables from socio-economic and political aspects at the county level, with respective data sources, are described below and summarized in Table 1.
- Variable Description
State: Refers to the four U.S.–Mexico border states: Arizona, California, New Mexico, and Texas.
Employment status: Based on the county-level unemployment rate in 2019 from the Bureau of Economic Analysis (BEA). Higher unemployment is hypothesized to correlate with lower vaccination rates due to reduced economic incentive and fewer workplace mandates.
Political choice: County-level results from the 2020 U.S. presidential election (Politico) are used to represent political ideology [56]. Counties with a higher share of Democratic voters are expected to show higher vaccination rates
Age: Age classification follows CDC’s Advisory Committee on Immunization Practices (ACIP) phases, and its groupings align with the County Population by Characteristics: 2010–2019 dataset [57].
Occupation: Derived from 2019 BEA data, representing the percentage of county residents employed in farm labor. Higher farmworker representation is hypothesized to relate to lower vaccination rates.
Urban and Rural Area: Based on the 2010 U.S. Census, counties with >50% rural population are classified as rural; others as urban. Lower vaccination rates are expected in rural areas due to reduced access, as noted in CDC’s recent Morbidity and Mortality Weekly Report (MMWR)
Border Area: Defined per the La Paz Agreement, including 44 counties within 100 km of the U.S.–Mexico border. These are designated as “border counties,” with the remaining 316 classified as non-border. Eight non-border counties in California were excluded due to missing data, resulting in 352 observations [58].
Metro Area: Metropolitan areas follow the U.S. Office of Management and Budget definition of areas as counties with over 50,000 people residents with economic integration. The CDC includes each country’s distinguished metro and non-metro statuses and the vaccination rate. Prior studies show that non-metro areas have lower vaccine access and uptake [59],[60]. We assume that the non-metropolitan countries would have less access to the vaccine.
Education: Education levels are based on the percentage of residents aged ≥18 with at least a high school diploma (Federal Reserve Economic Data). It is projected that lower education is linked to greater vaccine hesitancy.
Income: County-level per capita income is drawn from BEA data. Lower-income counties are predicted to have lower vaccination rates due to financial and access-related barriers.
Race and ethnicity: Racial and ethnic composition is used to assess disparities in vaccine uptake. CDC notes systemic inequities affecting vaccine access among minority populations, with counties predominantly composed of Black, Hispanic, Asian, and Native American residents expected to have lower vaccination rates.
2.2. Statistical Methods
ArcGIS (version 10.8) was employed to visualize the spatial distribution of vaccination rates and to examine how socioeconomic and political variables influenced COVID-19 vaccination patterns across counties and states (see Figure 2 and Figure 3). The spatial distribution below (Figure 2) shows that Dose 1 and Dose 2 vaccination rates are generally higher in border counties than in non-border counties. Booster uptake, however, shows less consistent differences between the two groups, with some border counties having lower rates than their non-border counterparts
Figure 3 illustrates how socioeconomic and demographic factors influence vaccination uptake across U.S. counties, as analyzed in Figure 2. Higher rates of first and complete-dose vaccination are associated with greater per capita income and stronger Democratic affiliation. Booster uptake follows a similar pattern, showing a positive association with Democratic-leaning counties and a negative association with higher unemployment. Racial and ethnic patterns reveal that counties with a larger Black population tend to have lower first-dose coverage. At the same time, those with a higher share of Hispanic residents show increased vaccination uptake. Booster coverage slightly decreases in counties with a higher percentage of White residents.
Using linear regression analysis, this study examines associations of socio-economic factors with county-level vaccination rates. Based on the multicollinearity detection using variance inflation factors (VIF) and correlation plot (see Figure 4), nine variables were selected for inclusion in a default model (Model 1, M1) as follows:
Three types of vaccination rates (i = Dose 1, Dose 2, Booster) are described by the following models:
M1
: vaccination ratei = β0 + β1 state + β2 metro status + β3 border county + β4 unemployment + β5 democrat_pct + β6 farmworker + β7 rural_pct + β8 HS graduate + β9income,
where β0 refers to the intercept of the vaccination rate and #x03B2;j denotes to the coefficients associated with the covariates (j = 1, 2, …, 9). We then added each age variable (Age_1417, Age_1864, Age_65over, Age_14over, Age_18over, Age_median) to Model 1 to examine the adjusted effects by population percent of various age groups. Age_65over was included in Model 2 as the most significant age variable. Model 2 has the following formula:
M2
: vaccination ratei = β0 + β1 state + β2 metro status + β3 border county + β4 unemployment + β5 democrat_pct + β6 farmworker + β7 rural_pct + β8 HS graduate + β9income + β10age_65over.
To account for vaccination rates by race/ethnicity, we included a variable for each race (percentage of White/Black/Asian/Native American/Hispanic population) in Model 2. The formula for Model 3, including each race variable (M3.1-M3.5), is:
M3: vaccination ratei = β0 + β1 state + β2 metro status + β3 border county + β4 unemployment + β5 democrat_pct + β6 farmworker + β7 rural_pct + β8 HS graduate + β9income + β10age_65over + β11race/ethnicity.
All statistical analyses were conducted using Stata (version 16) and R (version 4.1.0). The level of significance was set at a p-value of < 0.05.
3. Results
Table 2 summarizes the descriptive statistics for socioeconomic characteristics and vaccination rates for all 352 counties in four states and each county per state. As of September 14, 2022, the average percentage of fully vaccinated individuals was 52.61%, with Texas having the lowest (47.64%) and California the highest (65.87%) of the four border states. The rate of booster-dose vaccination was also the lowest (37.56%) in Texas and the highest (53.54%) in California. California and Texas are two of the largest and most populous states in the United States, but they differ significantly in terms of demographics, political leanings, and industries. California has a higher percentage of racial minorities, including large Asian (9.10%) and Black (4.02%) communities, while Texas has a diverse population with a higher percentage of White (88.61%), Black (6.88%), and Hispanic (35.46%). California counties had the highest Democratic voter turnout (55.04%), while Texas counties had the lowest Democratic population (24.53%). California is more urbanized, with large metropolitan areas (74% in CA vs. 32.3% in TX). Texas has a mix of urban and vast rural areas (rural percentage: 55.52% in TX vs. 20.57% in CA), with the highest percentage of farm workers (6.39%) among the four states. New Mexico and Arizona had higher rates of at least one dose of vaccine (76.46% in NM, 76.31% in AZ). The unemployment rate was the highest in Arizona (6.64%), and both states had a higher percentage of population aged ≥ 65 years (22.15% in NM, 21.70% in AZ) and lower income per capita ($40,855 for NM, $40,592 for AZ) than CA and TX. Arizona and New Mexico have a significant presence of the Native American population (15.10% in AZ, 9.32% in NM).
The associations of county-level characteristics obtained from the regression models for the three types of vaccination rates (Dose 1, Dose 2, and Booster) are described in Table 3, Table 4 and Table 5, respectively. In Model 1 for Dose 1 vaccination, where age and race variables were not included, the county’s state, border status, percentage of Democrats, and income per capita were found to be significantly related to the Dose 1 vaccination rate of the county (R2=0.792; see M1 in Table 3). Rates of at least one vaccination were higher in border counties than in non-border counties, and increases in vaccination rates were associated with increased Democrat vote percent and per capita income.
In addition to the significant factors found in M1, the metro status variable was also significant in a model (M2) that included the percentage of county population aged 65 and older (R2=0.793). The Dose 1 vaccination rates were higher in metro counties than in non-metro counties β2=2.246, p=0.040) and also in border counties than in non-border counties β3=11.184, p<0.001). The vaccination rates increase by 0.644% for 1% increase in the Democratic population (p<0.001) and by 0.950% for $10,000 increase in per capita income in the county (p=0.002).
The models M3.1-M3.5 in Table 3 show that the vaccine rates increased with decreasing rates of the Black population β11=−0.386, p<0.001) and increasing percentages of Native Americans β11=0.330, p<0.001). Unlike the other models, the percentage of rural population in M3.4 was significantly associated with vaccination rates. The White, Asian, and Hispanic population percentages were not significant in predicting the county’s Dose 1 vaccination rate.
Model 1 for vaccination rates of complete doses (Dose 2) showed the same significance result as M1 for Dose 1 (see Table 4). The county’s state, border state, percentage of Democrats, and per capita income were significant factors in M1 (R2=0.760), while the metro variable was not significant in M2 (R2=0.760). In M2, the Dose 2 vaccination rate was higher in border counties than in non-border counties β3= 8.936, p<0.001). The vaccination rates increase by 0.611% for 1% increase in the Democratic population (p<0.001) and by 1.107% for $10,000 increase in per capita income in the county (p<0.001). The race/ethnicity variable was significant in the Black population (M3.2) and Native American models (M3.4), with a 1% increase in the black population associated with a 0.378% decrease in fully vaccinated rates and a 1% increase in the Native American population associated with a 0.364% increase. In the model M3.4, metropolitan status was found to be significant, with higher vaccination rates in metro counties than in non-metro counties (β_2=2.412, p=0.022).
The regression models for booster vaccination rates showed different associations than the Dose 1 or Dose 2 models. For the model that included Age ≥ 65 years old (M2, Table 5), a county’s state, unemployment rate, percentage of Democrats, percentage of high school graduates, and percentage of people 65 and older were significantly associated with receiving a booster vaccine (R2=0.744). The booster vaccination rate increased by 0.484% per one percent increase in the elderly population in the county (p<0.001). The model shows that for every 1% increase in the unemployment rate, the booster vaccine rate decreases by 0.410%, while a 1% increase in the Democratic population and the high school graduate population increases the rate by 0.206% and 0.172%, respectively.
White and Asian population percentages were significant in explaining the county’s booster vaccination rate in Model 3 (M3). The White model, M3.1 in Table 5, with R2=0.749 shows that the booster rate decreased by 0.071% with a 1% increase in the White population (p=0.019). On the other hand, model M3.3 shows that a 1% increase in the Asian population is associated with a 0.383% increase in booster vaccination rates. Another thing to note is that the unemployment rate was not significant in the Asian model
4. Discussion
The county’s State, the percentage of Democrats, and per capita income were all important factors that were consistently associated with vaccination rates, regardless of the type of vaccination (Dose 1 & Dose 2), which was a finding also observed in a previous study, examining full vaccination rates in counties in five states (Arizona, Colorado, New Mexico, Oklahoma, and Texas) [4]. However, unlike the previous study, the current study found that the percentage of the elder aged 65 and over did not present a significant impact on Dose 1 and Dose 2 vaccination rates.
Notably, it was found that border status was a significant factor contributing to both Dose 1 and Dose 2 vaccination rates, indicating higher vaccination rates in border counties than in non-border counties. While people in metropolitan counties tended to receive at least one dose of COVID-19 vaccine than people living out of metropolitans, the rate of full vaccination completion did not differ significantly between them. Targeted strategies such as removing barriers to vaccine access may be implemented to increase the vaccination completion rate in non-border and nonmetropolitan counties.
Our findings suggest different approaches for full-series vaccine uptake from booster vaccination. In the booster model, the county’s unemployment rate, percentage of high school graduates, and percentage of the population aged 65 years or older were significant factors besides the percentage of Democrats. In contrast, per capita income was not associated with the rates of booster vaccination. No significant metro or border status effects were observed when determining booster vaccination rates.
As summarized in Table A1, booster doses are administered after completion of the primary vaccine series to help maintain immunity over time and address emerging variants. Unlike the initial vaccine rollout, booster distribution began later in the pandemic, in fall 2021, when vaccine hesitancy, pandemic fatigue, and shifts in public health messaging had become more prominent. These contextual differences likely contributed to changes in the predictor significance. For example, the CDC’s September 2021 recommendation prioritized adults aged 65 and older for booster doses, with eligibility gradually expanding to younger age groups by November 2021 [55]. This policy explains the strong positive association between the percentage of older adults and booster vaccination rates observed in the regression model.
Regarding the effects of county-based racial composition on vaccination for Dose 1 and Dose 2, vaccination rates increased with an increase in the percentage of Native Americans, but a decrease in the percentage of the black population in a county, while the rates stayed neutral around the Hispanic population. Furthermore, the booster model showed that its vaccination rate increased with the increasing percentages of the Asian population and the decreasing percentages of the White population. It is essential to consider the potential for selection bias when interpreting booster vaccination patterns, as individuals receiving booster doses constitute a selected subgroup—those who have already completed the primary vaccine series. This distinction may influence the observed relationships between racial composition and vaccination.
Given that new COVID-19 variants still evolve in the post-pandemic period, threatening public health, to support and improve its booster vaccination when needed, policy response and implementation would need to consider all of the above factors to reach effective vaccination coverage.
5. Conclusions
In conclusion, this study on COVID-19 vaccination rates in four border states reveals complex patterns of vaccine uptake were associated with various county-level factors. It was found that political affiliation and per capita income consistently showed strong relationships with vaccination rates across dose types, aligning with our previous research [4]. Nonetheless, unlike prior studies, the percentage of the older population (aged ≥65 years) presented a significant impact only on receiving the booster vaccination. Border counties demonstrated higher vaccination rates for initial dose and full vaccination completion, while metropolitan counties showed higher rates for first doses, let alone the other. The factors influencing booster vaccination differed from those of initial doses and full doses, suggesting the need for vaccine-type fitted approaches over each vaccination stage. The county’s racial demographics also played a role, with varying vaccination effects depending on the specific racial group and dose type. These findings underline the importance of developing targeted strategies to face different demographic, socioeconomic, and political factors and other disparities to achieve or improve overall vaccination rates.
Forward looking the post-COVID era, although the urgency of broad-based COVID vaccinations is eased, owing to the potential health threat still imposed by some COVID variants, many state-governments seemingly tacitly agrees to include its vaccinations into the regular vaccination schedule as that of the influenzas, encouraging their citizens, especially the elder and the vulnerable, to take them to protect their health. From this study, the empirical findings indicate vaccination behavior responding to political, socio-economic, racial, and cultural aspects, whereas its analysis across the four border-states with their counties was not found elsewhere, promising the intellectual contribution in the public health research and field practices. It is paramount for policymakers to realize that routine immunization is often the first and key step to safeguard the health of the public, as it can collectively reach the benefits of societal herd immunity. It is also crucial for them to understand the difference between these factors that influence vaccination and strategize timely and effective vaccination plans for any unforeseen public medical uncertainty.
Given that typically no research is done with perfection, the possible shortcomings in this study may include the fact that it is observational and therefore cannot establish causality between variables. Additionally, there may be a temporal mismatch between datasets. For example, with different timelines and data frequencies, COVID data were collected daily when it started in 2019. Still, the U.S. Presidential Election in 2020 was annual-based, showing a suboptimal data alignment. Another shortcoming may occur with omitted variable bias and unmeasured confounding. In this analysis, we tried to include all relevant and key variables in politics, socio-economics, race, and culture with their specifications. However, possible variable(s) may still be overlooked and unmeasurable in our models, which may lead to different empirical outcomes. Our recommendation for future research will therefore include viable corrections of such shortcomings. Additionally, this study was based on aggregated county-level data, which limits the ability to make inferences at the individual level. Future studies should incorporate individual-level data to more precisely examine these factors and their implications for public health and vaccination policy.
Institutional: Review Board Statement
Not applicable. This study uses only secondary data analyses from publicly available data sources without any personal information. No individual data on human beings were used.
Informed: Consent Statement
Not applicable.
Conflicts: of Interest
The authors declare no conflict of interest.
Funding
This research received no external funding.
Author Contributions. Conceptualization
K.K., S.J. and Y.-F.L.; methodology, S.J and K.K.; software, K.K.; formal analysis, S.J. and K.K.; investigation, K.K, S.J., and Y.-F.L.; resources, K.K. and Y.-F.L.; writing—original draft preparation, KK, SJ. and Y.-F.L.; writing—review and editing, K.K, S.J., and Y.-F.L. All authors have read and agreed to the published version of the manuscript.
Data Availability Statement
The dataset supporting the conclusions of this article is available in the Mendeley Data repository, https://data.mendeley.com/drafts/2wddk5rn9g.
Appendix A

Table A1.
Comparison of COVID-19 Vaccination Dose Types.
| Characteristic | First Dose | Second Dose | Booster Dose |
|---|---|---|---|
| Definition | Initial COVID-19 vaccine | Completion of the primary vaccination series | Additional dose post-primary vaccination |
| Eligibility | All eligible individuals | Only those who received the first dose | Only those fully vaccinated |
| Timing | Late 2020 (14 December 2020) | Mid–late 2021 | Late 2021 forward (updated as variants emerged) |
| Population Coverage | Broadest | Subset of first-dose recipients | Subset of fully vaccinated individuals |
| Sample Selection Implication | Represents the full target population | Filtered by initial compliance | Self-selected, high-engagement population |
| Analytical Implication | Broad determinants of uptake | Dependent on dose 1 behavior | Selection bias, influenced by the evolving pandemic context |
In this study, we define the first dose as the initial COVID-19 vaccination administered to an eligible individual, marking entry into the vaccination program. The second dose refers to the completion of the primary vaccination series, typically for mRNA vaccines (e.g., Pfizer or Moderna). The booster dose, by contrast, is administered after the primary series, intended to maintain immunity over time or address variant-specific challenges.
As shown in Table A1, these three stages of vaccination occurred during distinct phases of the pandemic and involved different policy environments and public attitudes. Notably, booster recipients are a self-selected subset of the vaccinated population, making booster uptake subject to greater sample selection effects and potentially different predictor relationships than those observed for initial doses. Furthermore, the administration of booster doses occurred during a different phase of the pandemic, characterized by evolving public health communication, reduced policy enforcement, and widespread pandemic fatigue, conditions that differentiate booster uptake from initial vaccine doses.
References
- Albrecht, D. Vaccination, Politics and COVID-19 Impacts. BMC Public Health 2022, 22, 96. [Google Scholar] [CrossRef]
- Agarwal, R.; Dugas, M.; Ramaprasad, J.; Luo, J.; Li, G.; Gao, G. Socioeconomic Privilege and Political Ideology Are Associated with Racial Disparity in COVID-19 Vaccination. Proc. Natl. Acad. Sci. 2021, 118, e2107873118. [Google Scholar] [CrossRef]
- Nguyen, K.H.; Anneser, E.; Toppo, A.; Allen, J.D.; Parott, J.S.; Corlin, L. Disparities in National and State Estimates of COVID-19 Vaccination Receipt and Intent to Vaccinate by Race/Ethnicity, Income, and Age Group among Adults≥ 18 Years, United States. Vaccine 2022, 40, 107–113. [Google Scholar] [CrossRef]
- Jeon, S.; Lee, Y.-F.; Koumi, K. COVID-19 Vaccination: Sociopolitical and Economic Impact in the United States. Epidemiologia 2022, 3, 502–517. [Google Scholar] [CrossRef]
- Pillai, D.; Artiga, S. Health and Health Care in the US-Mexico Border Region. 2022. [Google Scholar]
- Bastida, E.; Brown, H.S., III; Pagán, J.A. Persistent Disparities in the Use of Health Care along the US–Mexico Border: An Ecological Perspective. Am. J. Public Health 2008, 98, 1987–1995. [Google Scholar] [CrossRef]
- Shin, D.Y.; Chang, J.; Ramamonjiarivelo, Z.H.; Medina, M. Does Geographic Location Affect the Quality of Care? The Difference in Readmission Rates between the Border and Non-Border Hospitals in Texas. Risk Manag. Healthc. Policy 2022, 1011–1023. [Google Scholar] [CrossRef] [PubMed]
- Homedes, N.; Ugalde, A. Globalization and Health at the United States–Mexico Border. Am. J. Public Health 2003, 93, 2016–2022. [Google Scholar] [CrossRef] [PubMed]
- Quenzer, F.C.; Coyne, C.J.; Ferran, K.; Williams, A.; Lafree, A.T.; Kajitani, S.; Mathen, G.; Villegas, V.; Kajitani, K.M.; Tomaszewski, C. ICU Admission Risk Factors for Latinx COVID-19 Patients at a US-Mexico Border Hospital. J. Racial Ethn. Health Disparities 2023, 10, 3039–3050. [Google Scholar] [CrossRef]
- Johns Hopkins Coronavirus Resource Center COVID-19 Vaccine Data at the State Level; Internet, 2023.
- Santangelo, O.E.; Provenzano, S.; Di Martino, G.; Ferrara, P. COVID-19 Vaccination and Public Health: Addressing Global, Regional, and Within-Country Inequalities. Vaccines 2024, 12, 885. [Google Scholar] [CrossRef]
- Brunet-Jailly, E.; Carpenter, M.J. Introduction to the Special Issue: Borderlands in the Era of COVID-19. Bord. Glob. Rev. 2020, 2, 7–11. [Google Scholar] [CrossRef]
- Blue, S.A.; Ruiz, M.P.; McDaniel, K.; Hartsell, A.R.; Pierce, C.J.; Devine, J.A.; Johnson, M.; Tinglov, A.K.; Yang, M.; Wu, X.; et al. Im/Mobility at the US–Mexico Border during the COVID-19 Pandemic. Soc. Sci. 2021, 10, 47. [Google Scholar] [CrossRef]
- Filosa, J.N.; Botello-Mares, A.; Goodman-Meza, D. COVID-19 Needs No Passport: The Interrelationship of the COVID-19 Pandemic along the US-Mexico Border. BMC Public Health 2022, 22, 1081. [Google Scholar] [CrossRef]
- Gonzalez-Gorman, S. Does Geographical Location Matter During a Pandemic? Implications of COVID-19 on Texas Border Counties When Compared to Interior Counties. J. Borderl. Stud. 2024, 39, 757–779. [Google Scholar] [CrossRef]
- Reyes, BJ; Calvillo, ST; Escoto, AA; Lomeli, A; Burola, ML; Gay, L; Cohen, A; Villegas, I; Salgin, L; Cain, KL; Pilz, D. Community Utilization of a Co-Created COVID-19 Testing Program in a US/Mexico Border Community. BMC Public Health 2024, 24(1), 3194. [Google Scholar] [CrossRef] [PubMed]
- Evans, S; Rubio, B; Piat, C; Kamara, H; Owen, P; Duff, B; Chavez, A; Bligh, LR. Improving Public Health Emergency Communication Along the US Southern Border: Insights From a COVID-19 Pilot Campaign With Truck Drivers. Health Promotion Practice 2024. [Google Scholar] [CrossRef] [PubMed]
- Rangel Gómez, M.G.; Alcocer Varela, J.; Salazar Jiménez, S.; Olivares Marín, L.; Rosales, C. The Impact of COVID-19 and Access to Health Services in the Hispanic/Mexican Population Living in the United States. Front. Public Health 2022, 10, 977792. [Google Scholar] [CrossRef]
- Villalobos, B.T.; Hernandez Rodriguez, J. How Did Latinxs near the US-Mexico Border Fare during the COVID-19 Pandemic? A Snapshot of Anxiety, Depression, and Posttraumatic Stress Symptoms. Front. Psychol. 2023, 14, 1241603. [Google Scholar] [CrossRef]
- Cione, C.; Vetter, E.; Jackson, D.; McCarthy, S.; Castañeda, E. The Implications of Health Disparities: A COVID-19 Risk Assessment of the Hispanic Community in El Paso. Int. J. Environ. Res. Public. Health 2023, 20, 975. [Google Scholar] [CrossRef] [PubMed]
- Lee, Y.-F. COVID-19 Crisis and International Business and Entrepreneurship: Which Business Culture Enhances Post-Crisis Recovery? Glob. J. Entrep. GJE 2021, 5. [Google Scholar]
- De Coninck, D.; Frissen, T.; Matthijs, K.; d’Haenens, L.; Lits, G.; Champagne-Poirier, O.; Carignan, M.-E.; David, M.D.; Pignard-Cheynel, N.; Salerno, S. Beliefs in Conspiracy Theories and Misinformation about COVID-19: Comparative Perspectives on the Role of Anxiety, Depression and Exposure to and Trust in Information Sources. Front. Psychol. 2021, 12, 646394. [Google Scholar] [CrossRef]
- Miller, B.L. Science Denial and COVID Conspiracy Theories: Potential Neurological Mechanisms and Possible Responses. Jama 2020, 324, 2255–2256. [Google Scholar] [CrossRef]
- Machingaidze, S.; Wiysonge, C.S. Understanding COVID-19 Vaccine Hesitancy. Nat. Med. 2021, 27, 1338–1339. [Google Scholar] [CrossRef]
- Cerda, A.A.; García, L.Y. Willingness to Pay for a COVID-19 Vaccine. Appl. Health Econ. Health Policy. 2021, 19, 343–351. [Google Scholar] [CrossRef]
- García, L.Y.; Cerda, A.A. Authors’ Reply to Sprengholz and Betsch:Willingness to Pay for a COVID-19 Vaccine. Appl. Health Econ. Health Policy. 2021, 19, 623–624. [Google Scholar] [CrossRef]
- Cerda, A.A.; García, L.Y. Hesitation and Refusal Factors in Individuals’ Decision-Making Processes Regarding a Coronavirus Disease 2019 Vaccination. Front. Public Health 2021, 9, 626852. [Google Scholar] [CrossRef]
- Loomba, S.; De Figueiredo, A.; Piatek, S.J.; De Graaf, K.; Larson, H.J. Measuring the Impact of COVID-19 Vaccine Misinformation on Vaccination Intent in the UK and USA. Nat. Hum. Behav. 2021, 5, 337–348. [Google Scholar] [CrossRef]
- Dubé, E.; Laberge, C.; Guay, M.; Bramadat, P.; Roy, R.; Bettinger, J.A. Vaccine Hesitancy: An Overview. Hum. Vaccines Immunother. 2013, 9, 1763–1773. [Google Scholar] [CrossRef] [PubMed]
- Latkin, C.A.; Dayton, L.; Yi, G.; Konstantopoulos, A.; Boodram, B. Trust in a COVID-19 Vaccine in the US: A Social-Ecological Perspective. Soc. Sci. Med. 2021, 270, 113684. [Google Scholar] [CrossRef] [PubMed]
- Woko, C.; Siegel, L.; Hornik, R. An Investigation of Low COVID-19 Vaccination Intentions among Black Americans: The Role of Behavioral Beliefs and Trust in COVID-19 Information Sources. In Vaccine Communication in a Pandemic; Routledge, 2023; pp. 80–87. [Google Scholar]
- Gollust, S.E.; Nagler, R.H.; Fowler, E.F. The Emergence of COVID-19 in the US: A Public Health and Political Communication Crisis. J. Health Polit. Policy Law 2020, 45, 967–981. [Google Scholar] [CrossRef] [PubMed]
- Gadarian, S.K.; Goodman, S.W.; Pepinsky, T.B. Pandemic Politics: How COVID-19 Exposed the Depth of American Polarization. 2022. [Google Scholar]
- Polack, F.P.; Thomas, S.J.; Kitchin, N.; Absalon, J.; Gurtman, A.; Lockhart, S.; Perez, J.L.; Pérez Marc, G.; Moreira, E.D.; Zerbini, C. Safety and Efficacy of the BNT162b2 mRNA Covid-19 Vaccine. N. Engl. J. Med. 2020, 383, 2603–2615. [Google Scholar] [CrossRef] [PubMed]
- Hostetter, M.; Klein, S. Understanding and Ameliorating Medical Mistrust among Black Americans. Commonw. Fund 2021, 10. [Google Scholar]
- Matini, K. Exploring the Healthcare Experiences of African Immigrant Women in Winnipeg, Manitoba. 2023. [Google Scholar] [CrossRef]
- Kaur, S.P.; Gupta, V. COVID-19 Vaccine: A Comprehensive Status Report. Virus Res. 2020, 288, 198114. [Google Scholar] [CrossRef]
- Wu, C. Racial Concentration and Dynamics of COVID-19 Vaccination in the United States. SSM-Popul. Health 2022, 19, 101198. [Google Scholar] [CrossRef]
- Wu, Q.; Dudley, M.Z.; Chen, X.; Bai, X.; Dong, K.; Zhuang, T.; Salmon, D.; Yu, H. Evaluation of the Safety Profile of COVID-19 Vaccines: A Rapid Review. BMC Med. 2021, 19, 1–16. [Google Scholar] [CrossRef]
- Rodrigues, C.M.; Plotkin, S.A. Impact of Vaccines; Health, Economic and Social Perspectives. Front. Microbiol. 2020, 11, 1526. [Google Scholar] [CrossRef]
- Adhikari, B.; Cheah, P.Y.; von Seidlein, L. Trust Is the Common Denominator for COVID-19 Vaccine Acceptance: A Literature Review. Vaccine X 2022, 12, 100213. [Google Scholar] [CrossRef]
- Boserup, B.; McKenney, M.; Elkbuli, A. Alarming Trends in US Domestic Violence during the COVID-19 Pandemic. Am. J. Emerg. Med. 2020, 38, 2753. [Google Scholar] [CrossRef]
- Njoku, A.; Joseph, M.; Felix, R. Changing the Narrative: Structural Barriers and Racial and Ethnic Inequities in COVID-19 Vaccination. Int. J. Environ. Res. Public. Health 2021, 18, 9904. [Google Scholar] [CrossRef] [PubMed]
- Tai, D.B.G.; Shah, A.; Doubeni, C.A.; Sia, I.G.; Wieland, M.L. The Disproportionate Impact of COVID-19 on Racial and Ethnic Minorities in the United States. Clin. Infect. Dis. 2021, 72, 703–706. [Google Scholar] [CrossRef]
- Hamel, L.; Artiga, S.; Safarpour, A.; Stokes, M.; Brodie, M. KFF COVID-19 Vaccine Monitor: COVID-19 Vaccine Access, Information, and Experiences among Hispanic Adults in the US Https://Www. Kff. Org/Coronavirus-Covid-19/Poll-Finding/Kff-Covid-19-Vaccine-Monitor-Access-Information-Experiences-Hispanic-Adults. Publ 2021, 13. [Google Scholar]
- Ben-Umeh, K.C.; Kim, J. Income Disparities in COVID-19 Vaccine and Booster Uptake in the United States: An Analysis of Cross-Sectional Data from the Medical Expenditure Panel Survey. PLoS One 2024, 19, e0298825. [Google Scholar] [CrossRef]
- Gertz, A.; Rader, B.; Sewalk, K.; Brownstein, J.S. Emerging Socioeconomic Disparities in COVID-19 Vaccine Second-Dose Completion Rates in the United States. Vaccines 2022, 10, 121. [Google Scholar] [CrossRef]
- Fridman, A.; Gershon, R.; Gneezy, A. COVID-19 and Vaccine Hesitancy: A Longitudinal Study. PloS One 2021, 16, e0250123. [Google Scholar] [CrossRef] [PubMed]
- Murthy, B.P. Disparities in COVID-19 Vaccination Coverage between Urban and Rural Counties—United States, December 14, 2020–April 10, 2021. MMWR Morb. Mortal. Wkly. Rep. 2021, 70. [Google Scholar] [CrossRef]
- Backhaus, I.; Hoven, H.; Kawachi, I. Far-Right Political Ideology and COVID-19 Vaccine Hesitancy: Multilevel Analysis of 21 European Countries. Soc. Sci. Med. 2023, 335, 116227. [Google Scholar] [CrossRef] [PubMed]
- Żuk, P.; Żuk, P. The Impact of Coronavirus Disease 2019 (COVID-19) Pandemic Experiences on Attitudes towards Vaccinations: On the Social, Cultural and Political Determinants of Preferred Vaccination Organization Models in Poland. Health Res. Policy Syst. 2024, 22, 128. [Google Scholar] [CrossRef]
- Cengiz, O.; Manga, M.. Impact of COVID-19 Pandemic on Exports: New Evidence from Selected European Union Countries and Turkey. Asia-Pac. J. Reg. Sci. 6, 1195–1219. [CrossRef]
- Nail, T. Theory of the Border; Oxford University Press, 2016; ISBN 0-19-061867-1. [Google Scholar]
- Smith, A. The Wealth of Nations. In Inq. Nat. Causes Wealth Nations Adam Smith Electron.; 1776. [Google Scholar]
- Myrtue Medical Center. CDC Recommends Pfizer Booster Dose for Adults 65+ and Specific At-Risk Groups 2021.
- Politico 2020 Elections 2022.
- Dooling, K. The Advisory Committee on Immunization Practices’ Updated Interim Recommendation for Allocation of COVID-19 Vaccine—United States, December 2020. MMWR Morb. Mortal. Wkly. Rep. 2021, 69. [Google Scholar] [CrossRef] [PubMed]
- US Department of Health and Human Services U.S.-Mexico Border Health Observatory. Internet; 2025.
- Economic Resaerch Service; U.D. of A. Rural Classifications - What Is Rural? Internet, 2025. [Google Scholar]
- Bowers, L.; Holmes, W. Evaluating Metro and Non-Metro Differences in Uninsured Populations. US Census Bur. Small Area Estim. Branch Wash. DC Available Http1 Usa Gov1VzUTCy; 2013. [Google Scholar]
Figure 1.
Rational Choice Theory (RCT) Application to COVID Vaccination and Impact. Source: Authors’ design.
Figure 1.
Rational Choice Theory (RCT) Application to COVID Vaccination and Impact. Source: Authors’ design.
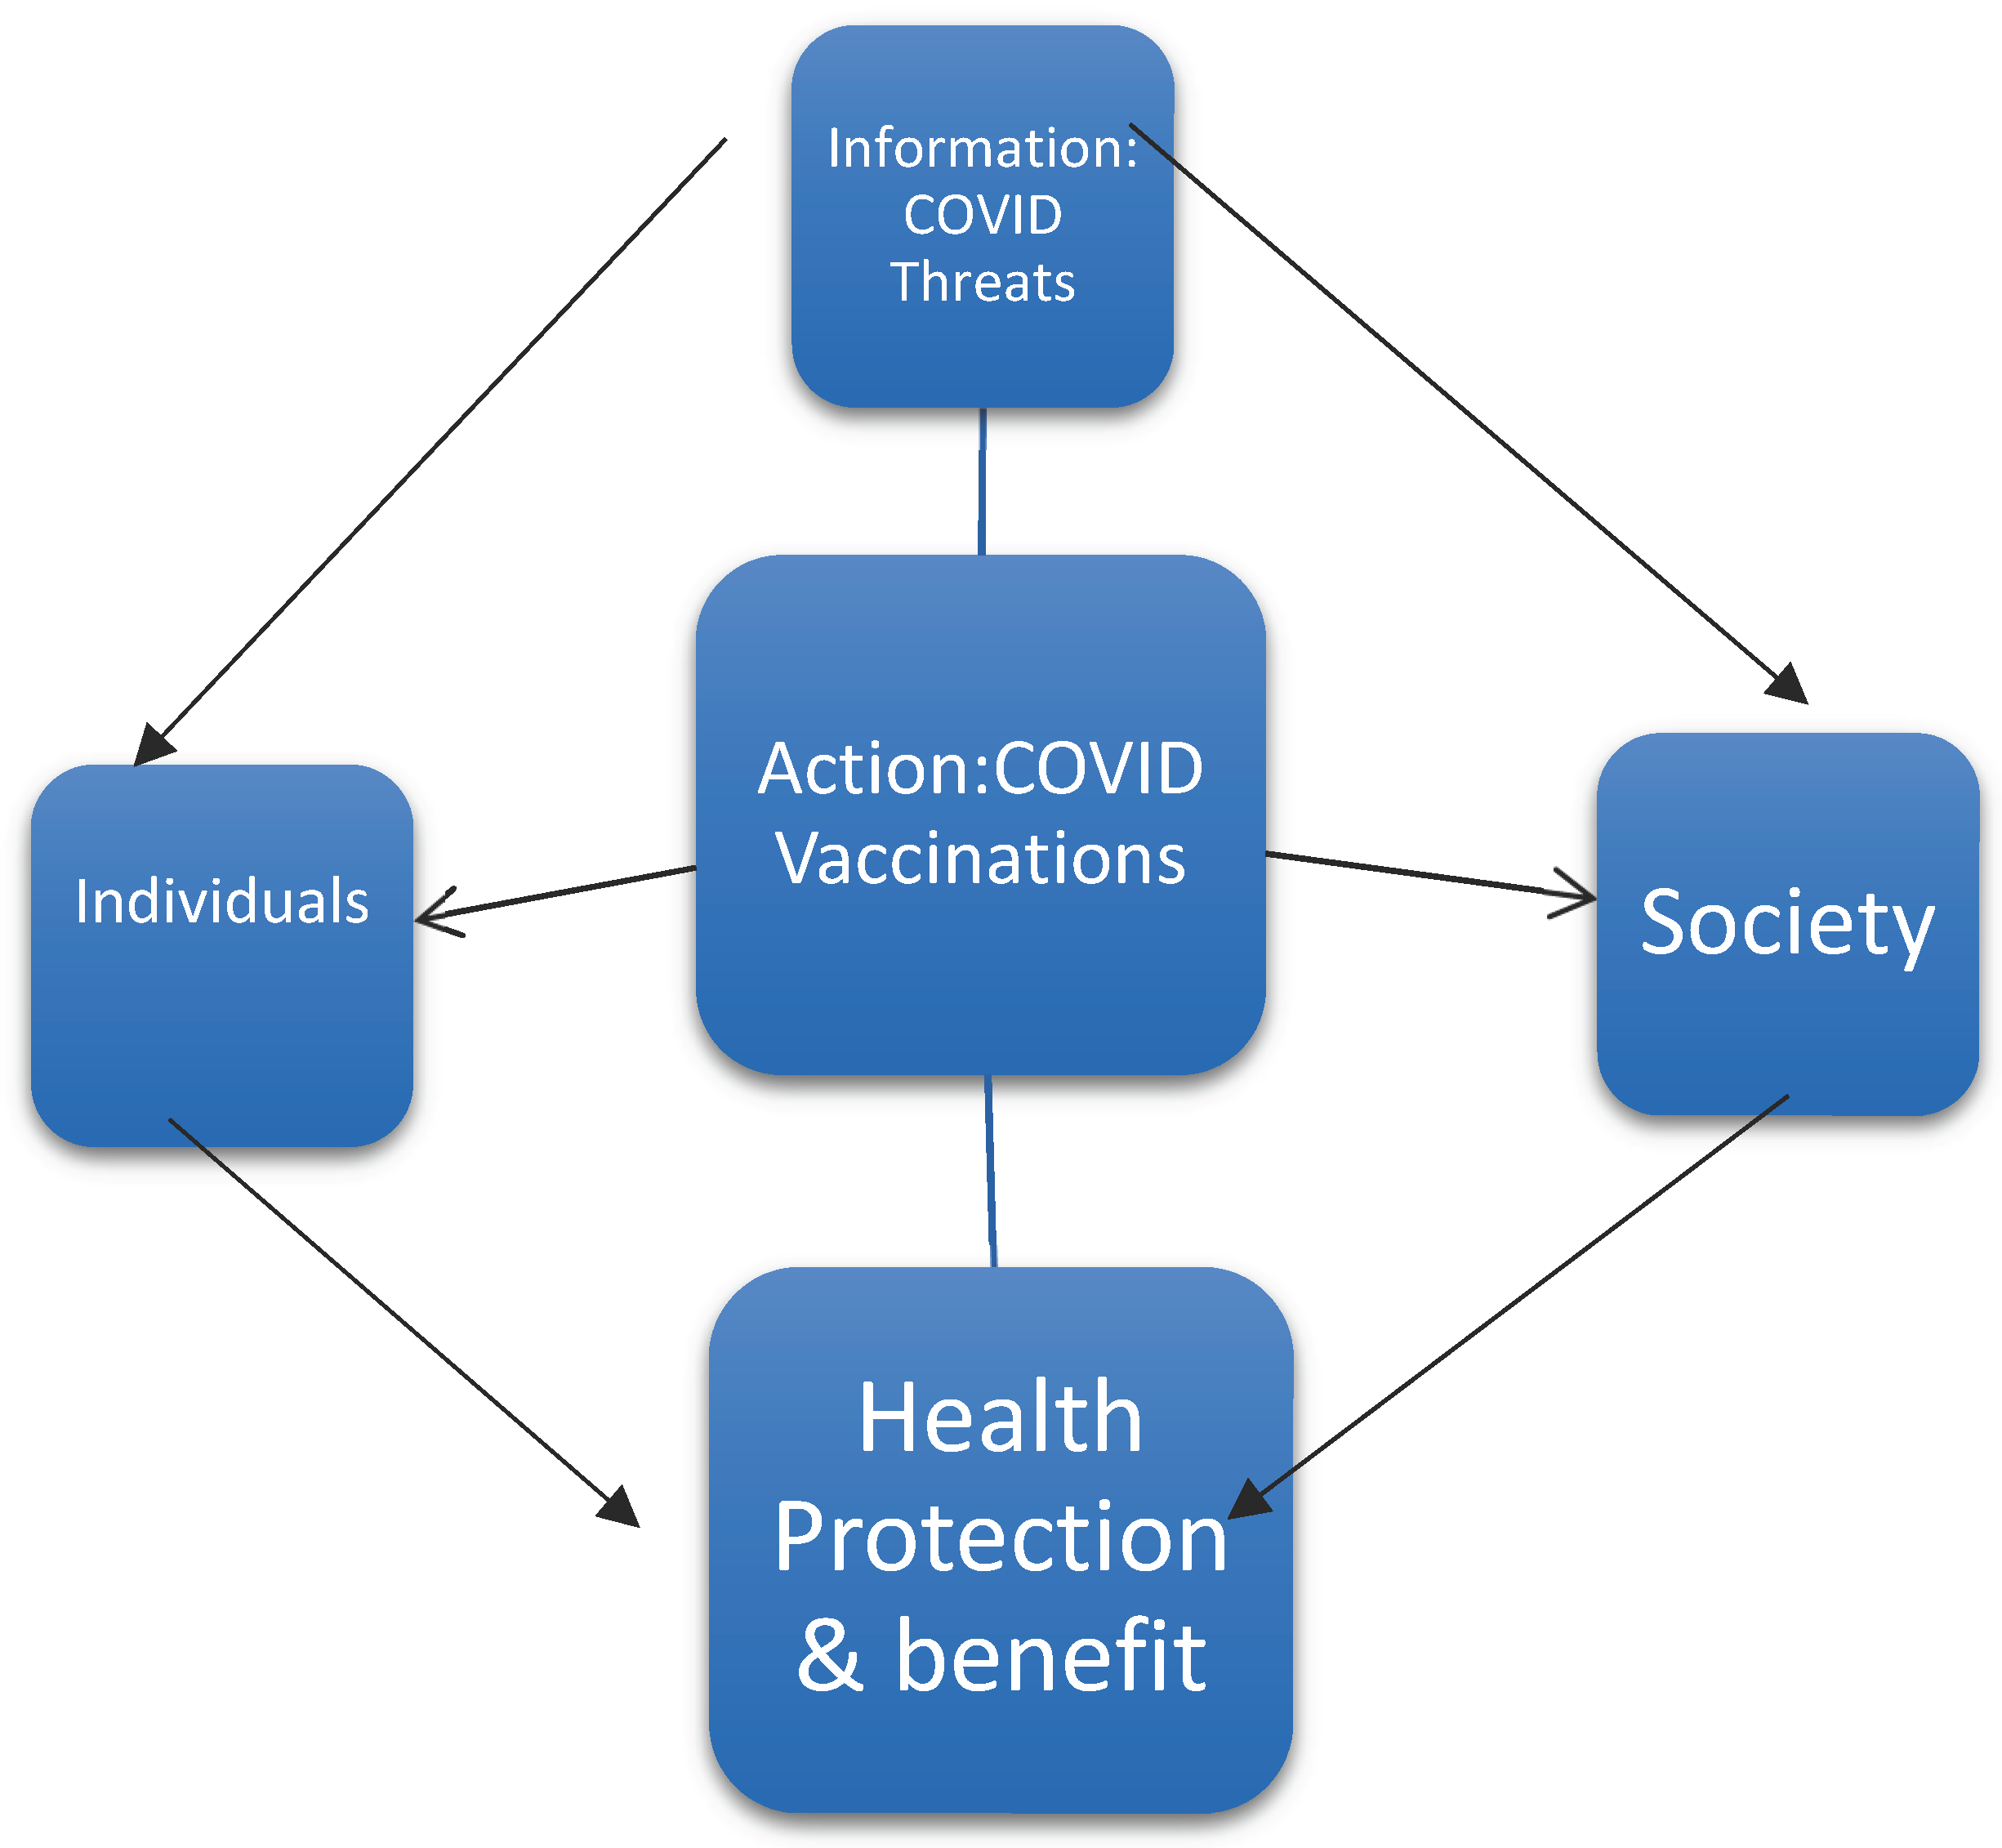
Figure 2.
Geographic distribution of COVID-19 vaccination rate as of September 14, 2022; (a) Dose 1, (b) Dose 2, and (c) Booster. Border Counties are outlined in black. Source: Authors’ design using ArcGIS (Version 10.8).
Figure 2.
Geographic distribution of COVID-19 vaccination rate as of September 14, 2022; (a) Dose 1, (b) Dose 2, and (c) Booster. Border Counties are outlined in black. Source: Authors’ design using ArcGIS (Version 10.8).
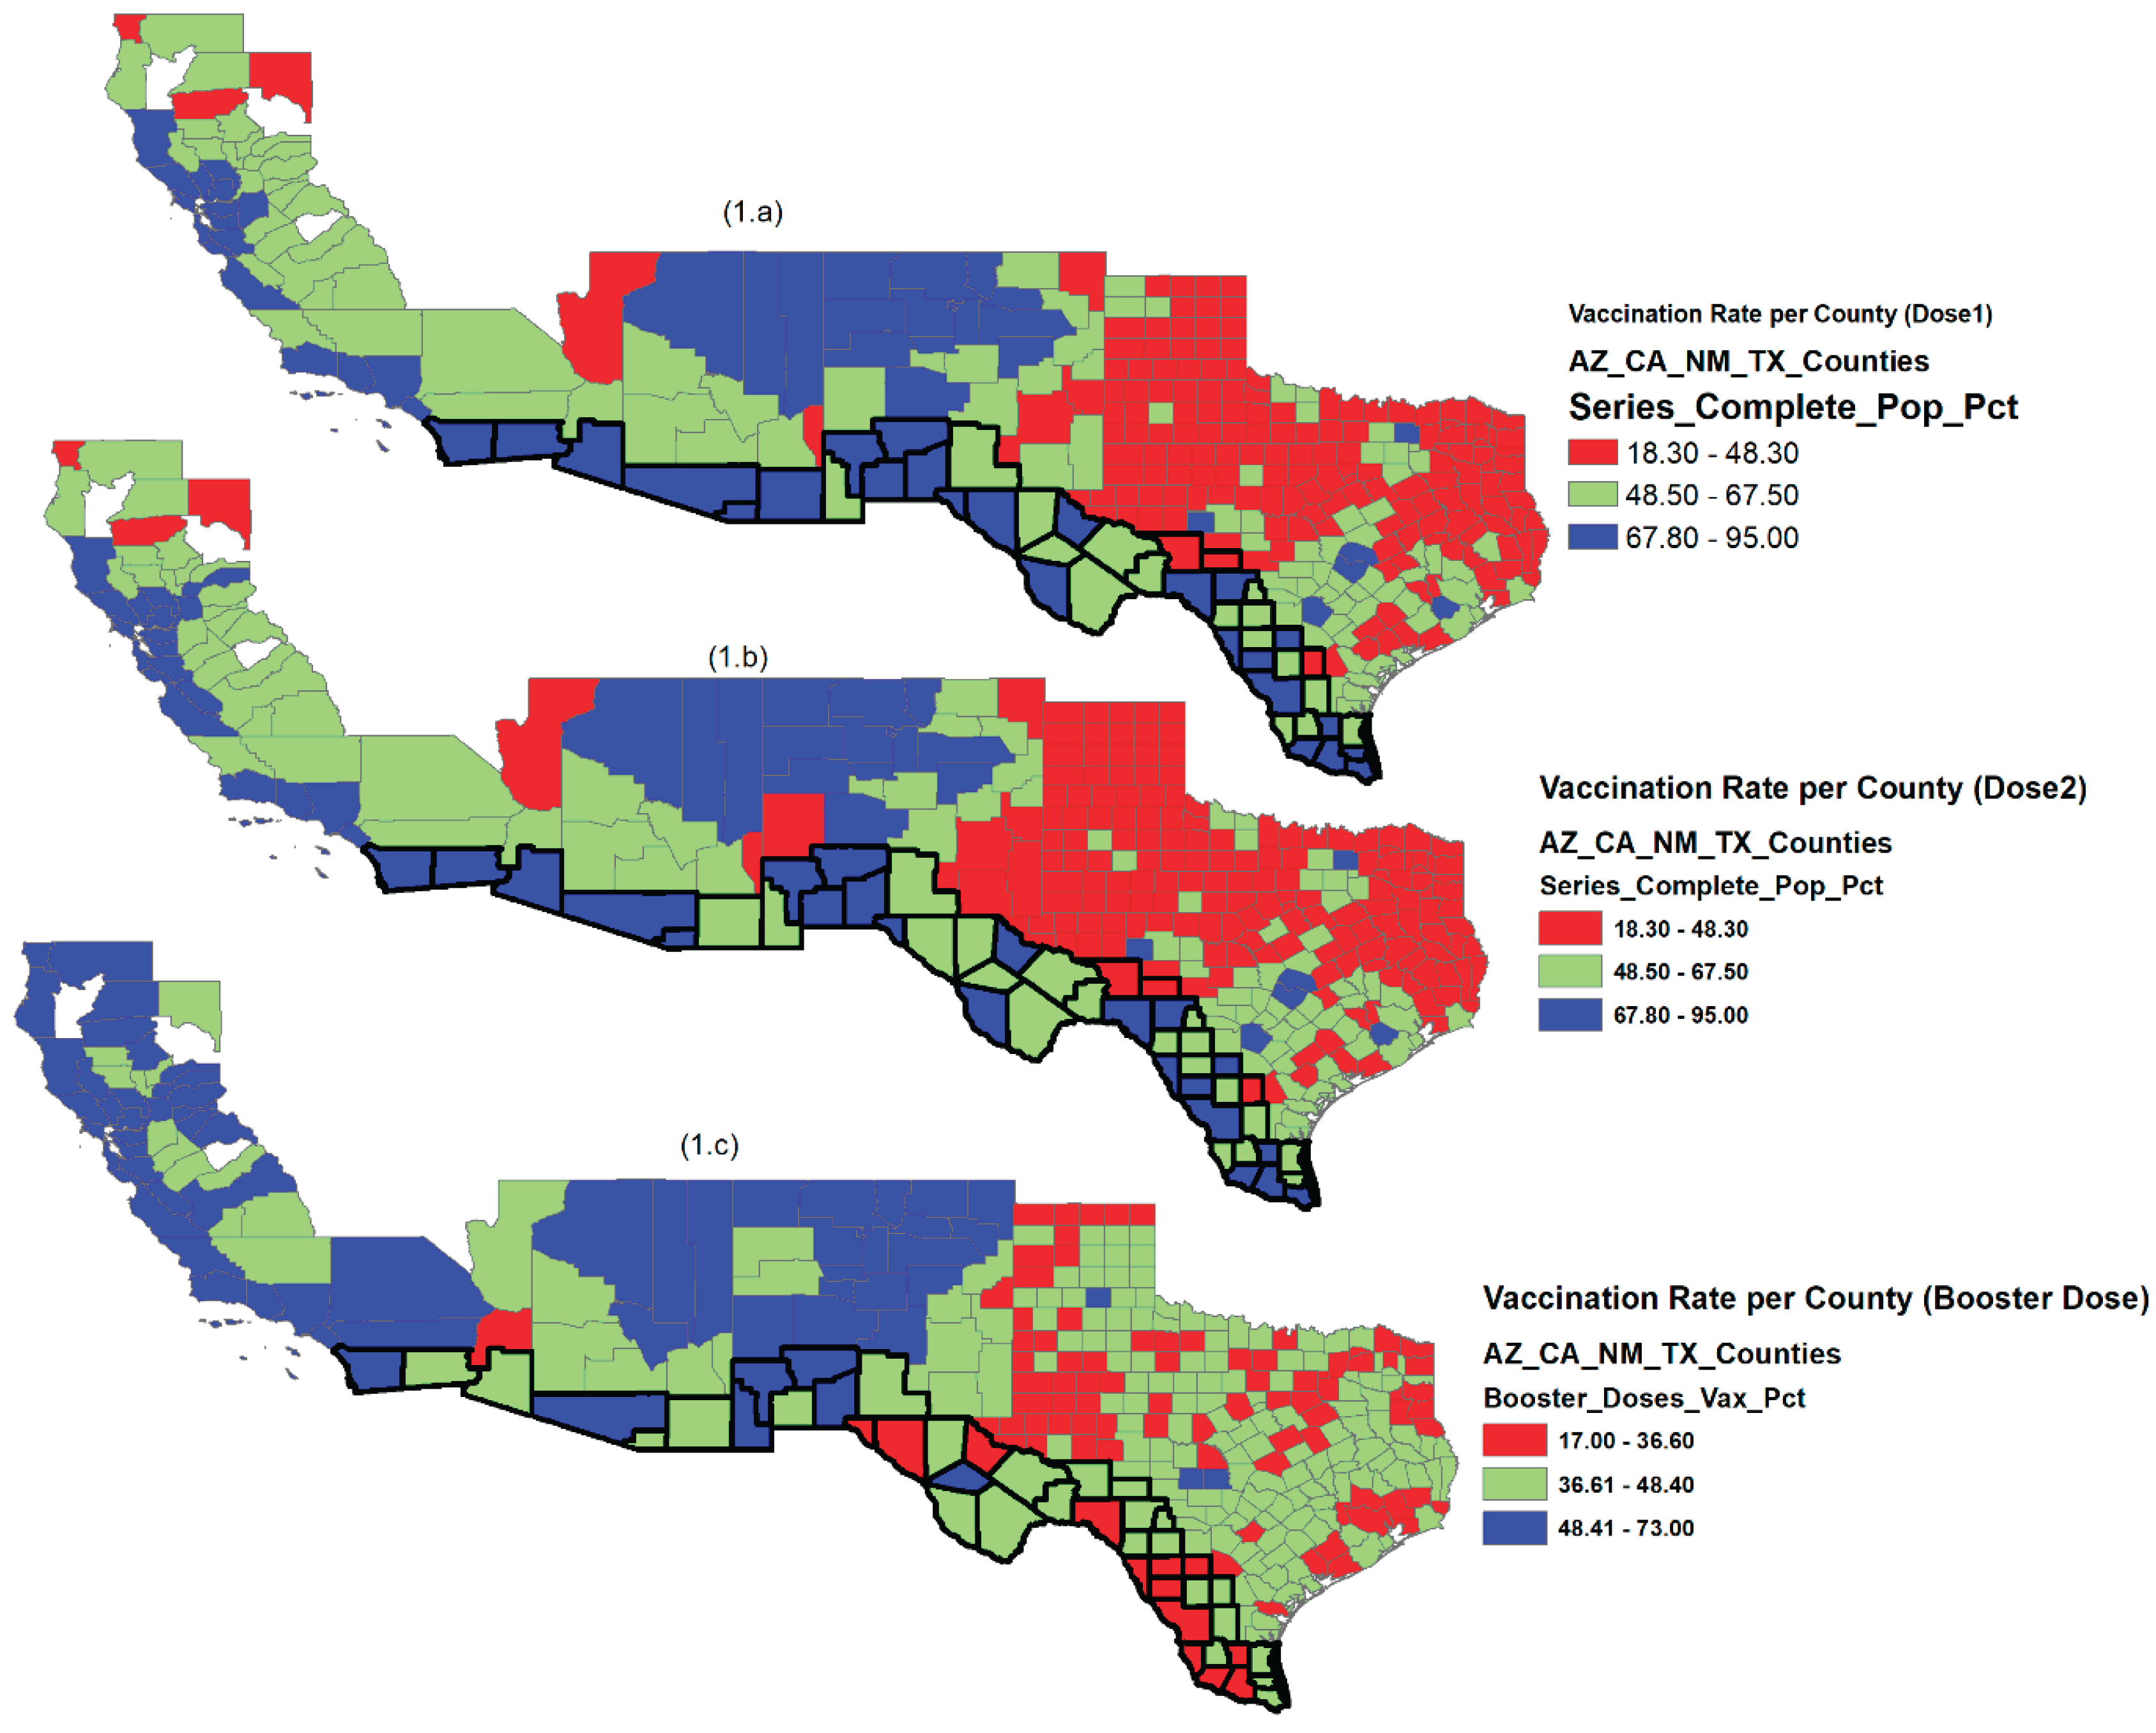
Figure 3.
Geographic distribution COVID-19 vaccination rate (Dose1, Dose2 and Booster doses as of September 14, 2022, economic status described by (a) income per capita, (b) unemployment rate, (c) political affiliation, and racial and ethnicity effects described by (d) percent of White population, (e) percent of Black population, and (f) percent of Hispanic population. Source: Authors’ design using ArcGIS.
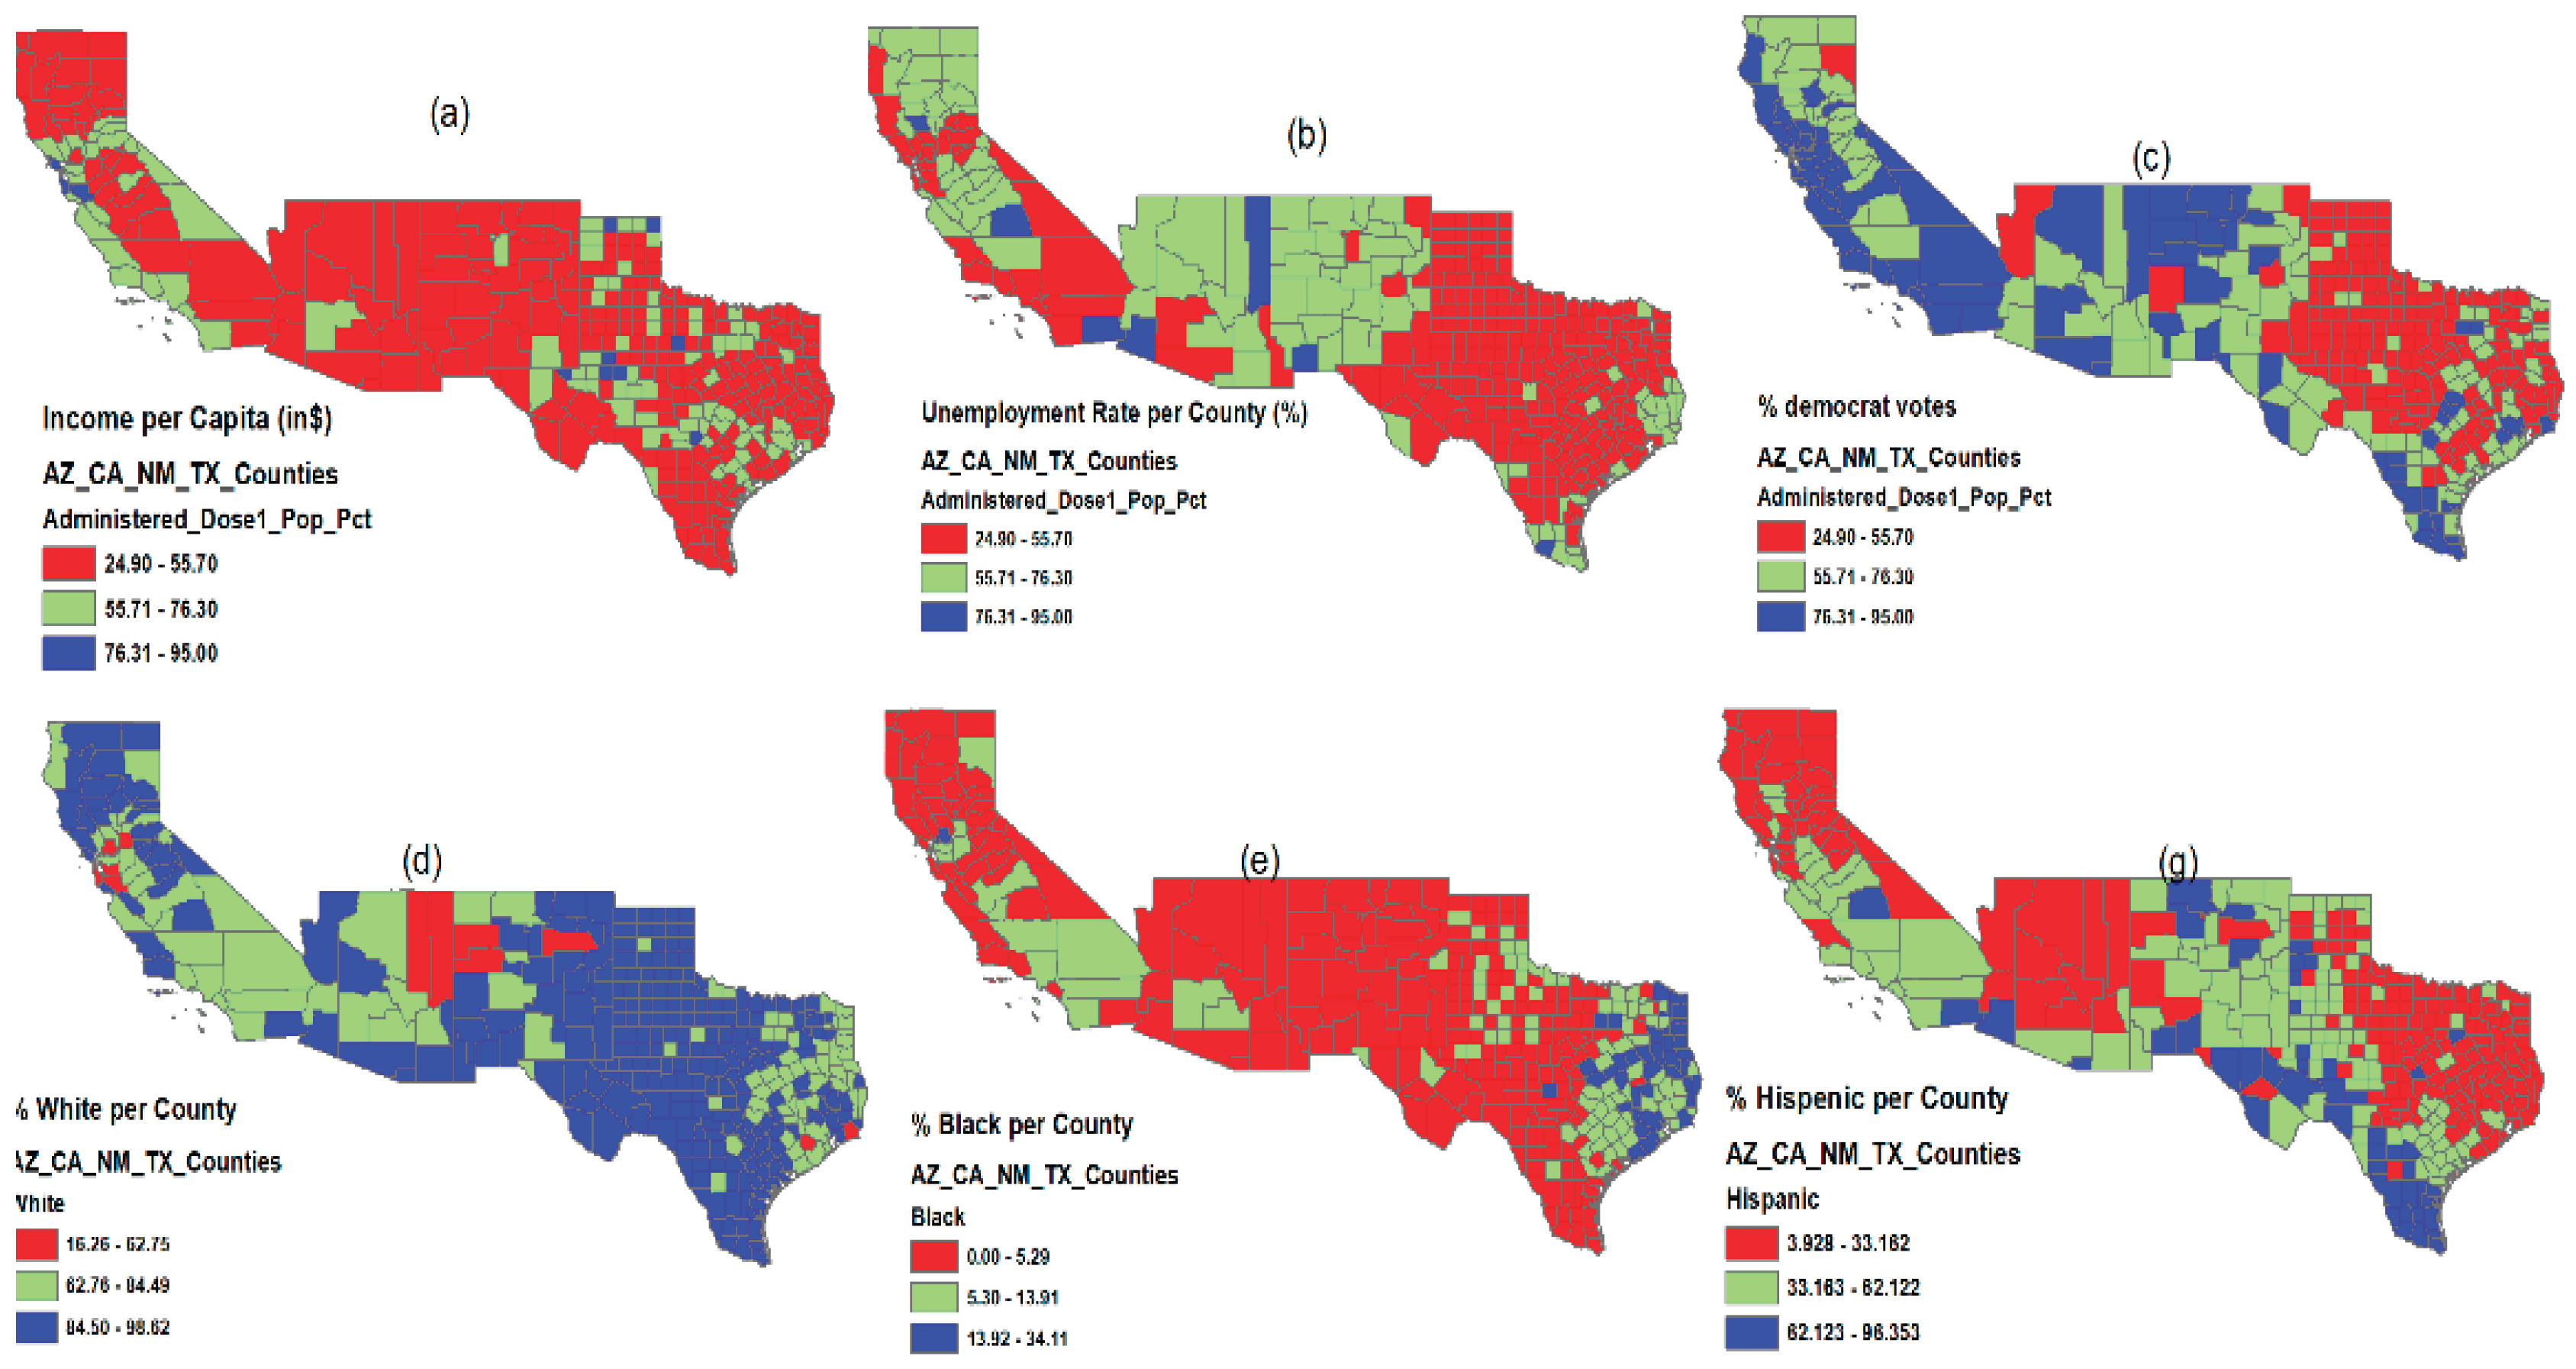
Figure 4.
Pairwise correlation among socioeconomic variables.
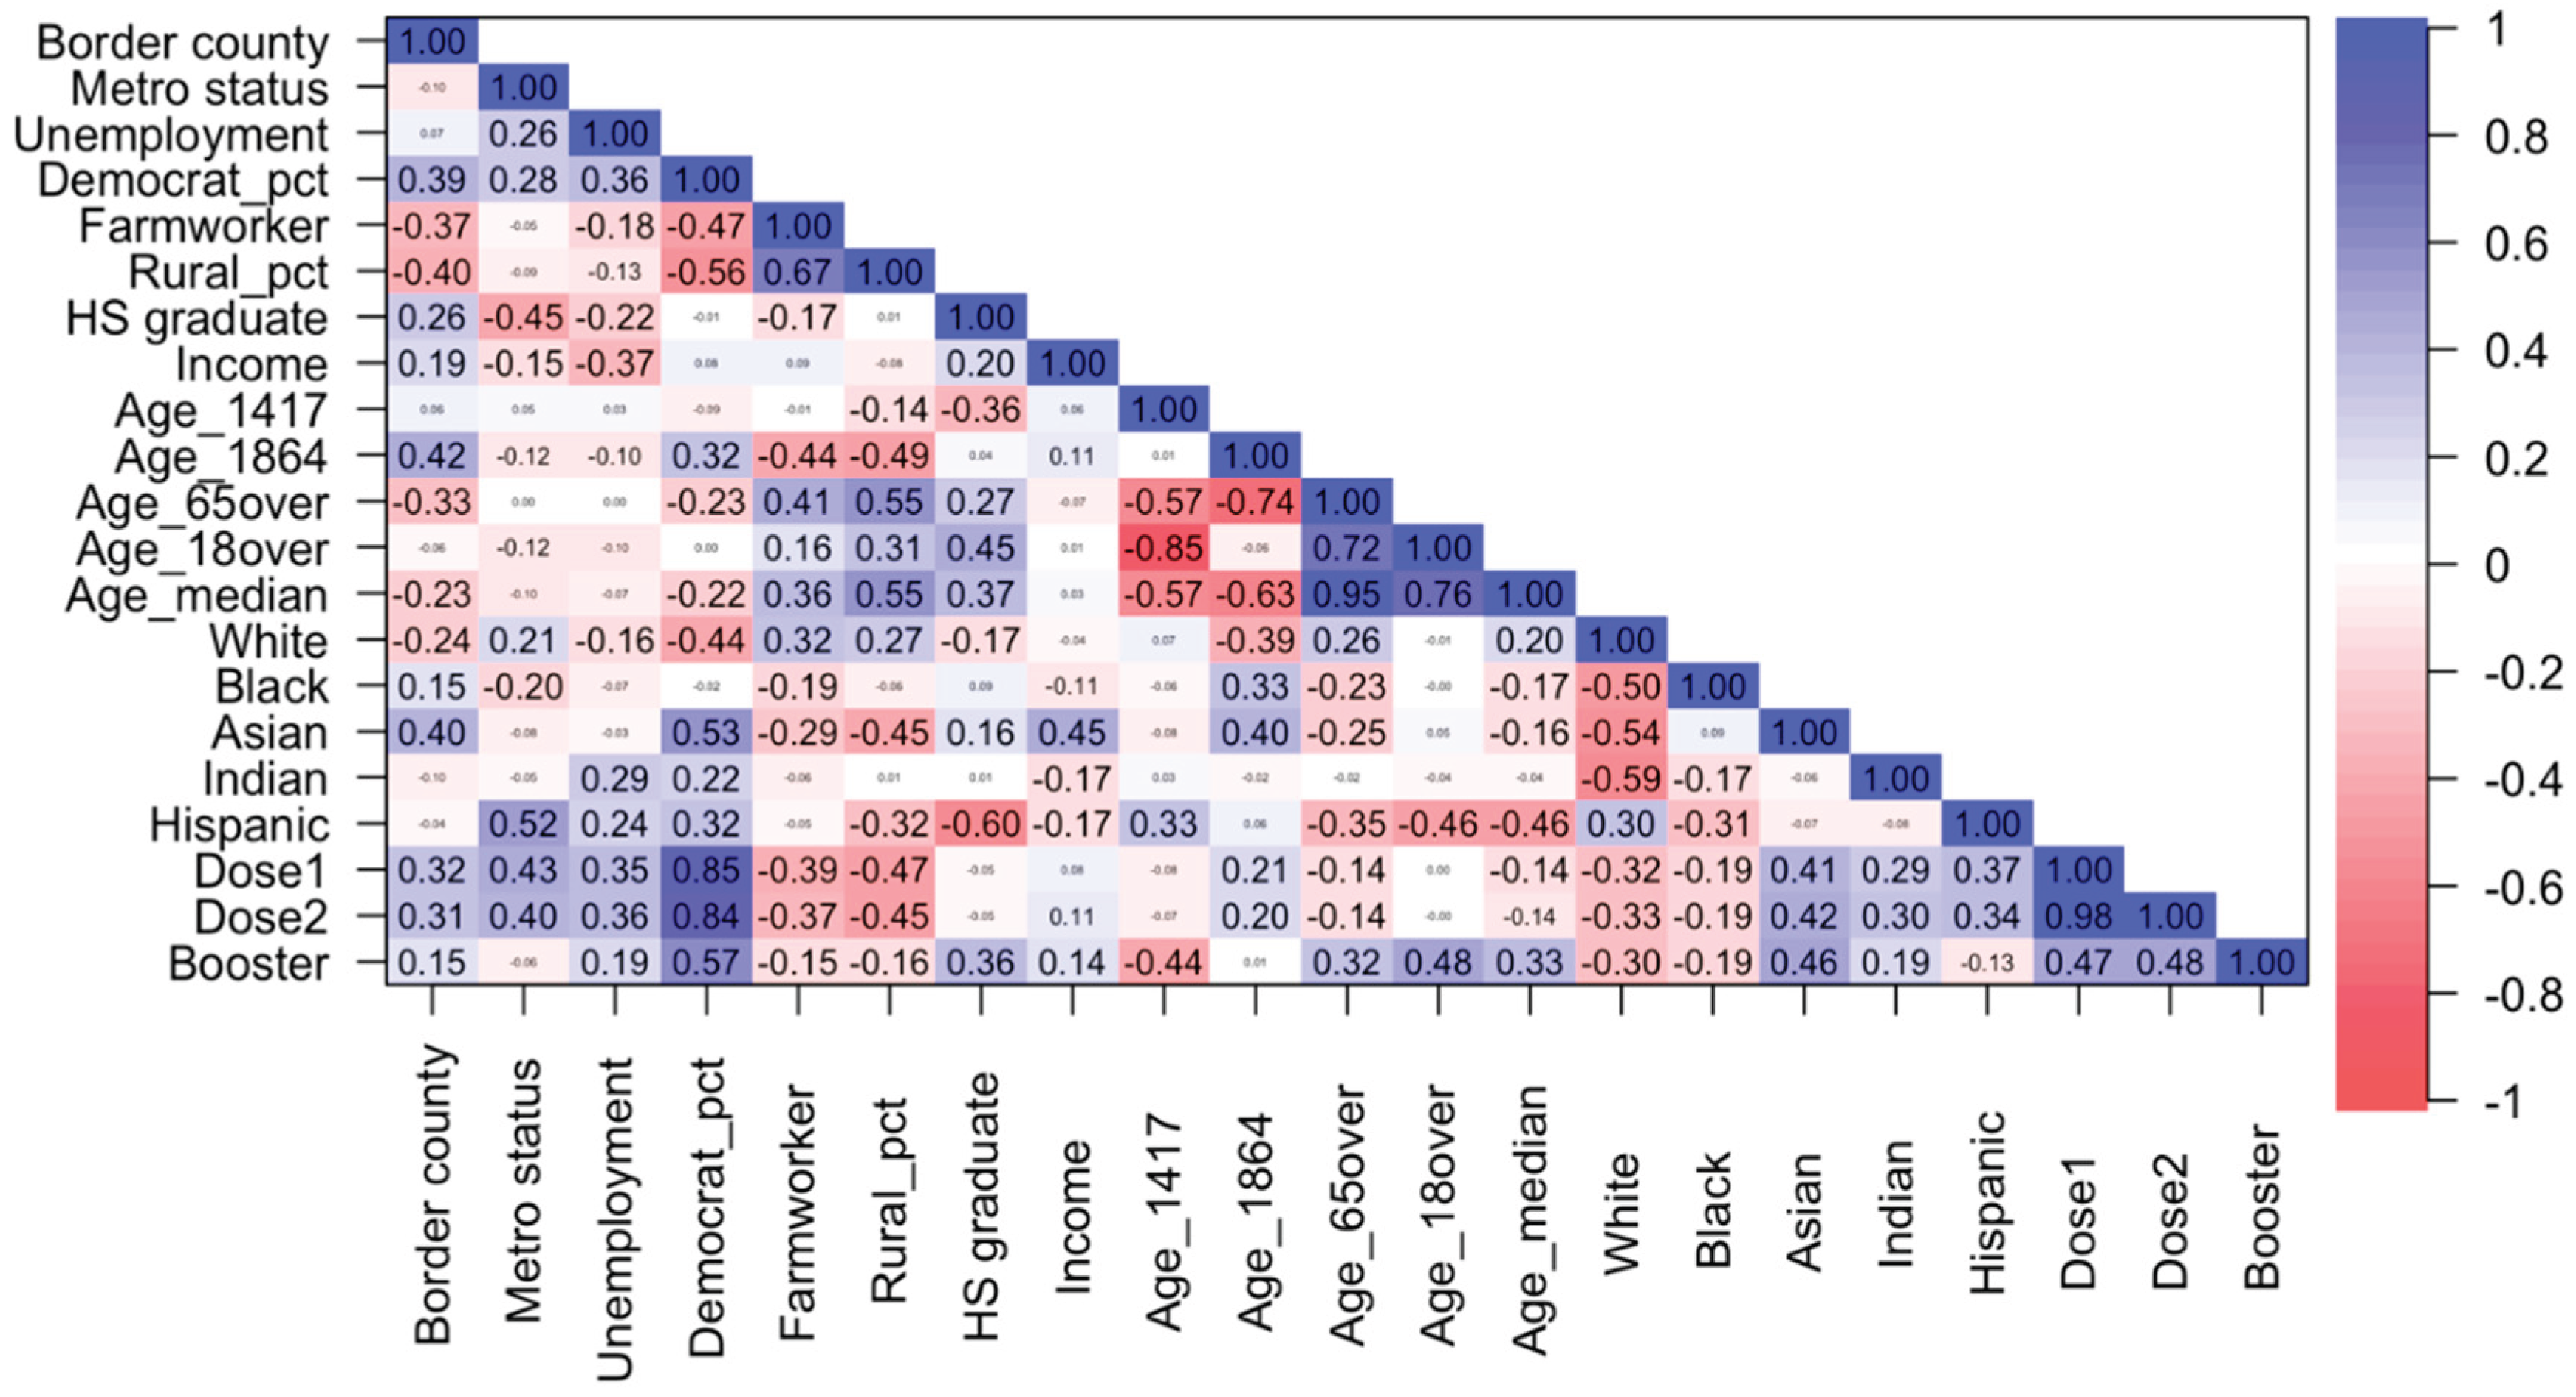
Table 1.
Variables and data sources used in the study of COVID-19 vaccination rate.
| Factor | Variable | Description | Data Source |
|---|---|---|---|
| State | State | States (AZ, CA, NM, TX) | |
| Metro area | Metro status |
Metro status=1, Non-metro status=0 |
CDC https://data.cdc.gov/Vaccinations/COVID-19-Vaccinations-in-the-United-States-County/8xkx-amqh |
| Border area | Border county |
Border county=1, Non-Border county=0 |
US Department of Health and Human Services https://www.hhs.gov/about/agencies/oga/about-oga/what-we-do/international-relations-division/americas/border-health-commission/observatory/index.html |
| Employment status |
Unemployment | Unemployment rate in 2019 | Bureau of Labor Statistics published by Economic Research Service of USDA https://data.ers.usda.gov/reports.aspx?ID=17828 |
| Political choice |
Democrat_pct | Percent of democrat votes, 2020 election result | Politico https://www.politico.com/2020-election/results/ |
| Democrat_1 | Democrat=1, Republican=0 | ||
| Occupation | Farmworker | Percent of workers hired for farm labor | Bureau of Economic Analysis 2019 https://apps.bea.gov/iTable/iTable.cfm?reqid=70&step=1&acrdn=6 |
| Area of residence |
Rural_pct | Percent of the county population living in rural areas | 2010 US Census https://apps.bea.gov/iTable/iTable.cfm?reqid=70&step=1&acrdn=6 |
| Urban status | Urban if Rural_pct ≤ 50, Rural if Rural_pct > 50 | ||
| Education | HS graduate | Percent of county population who is a high school graduate or higher (5-year estimate) for the population 18 years old and over | Federal Reserve Economic Data 2019 https://fred.stlouisfed.org/release/tables?rid=330&eid=391443 |
|
Income |
Income | Per capita personal income | Bureau of Economic Analysis 2019 https://apps.bea.gov/iTable/iTable.cfm?reqid=70&step=1&acrdn=6 |
| Age | Age_1417 | Percent of county resident population aged between 14 and 17 | 2010 US Census (April 1, 2010 to July 1, 2019) https://www.census.gov/data/tables/time-series/demo/popest/2010s-counties-detail.html |
| Age_1864 | Percent of county resident population aged between 18 and 64 | ||
| Age_65over | Percent of county resident population aged 65 years and over | ||
| Age_18over | Percent of county resident population aged 18 years and over | ||
| Age_median | Median age of county resident population | ||
| Race/ethnicity | White | Percent of country population by race (White) | 2010 US Census https://www.census.gov/data/tables/time-series/demo/popest/2010s-counties-detail.html |
| Black | Percent of country population by race (Black) | ||
| Asian | Percent of county population by race (Asian) | ||
| Indian | Percent of county population by race (Indian) | ||
| Other | Percent of county population by race (other) | ||
| Hispanic | Percent of county population by Hispanic origin (Hispanic) | ||
| Non-Hispanic | Percent of county population by non-Hispanic origin (non-Hispanic) | ||
| Vaccination | Administered_Dose1_Pop_Pct (Dose1) | Percent of Total Population with at least one Dose by State of Residence as of September 14, 2022 | CDC https://data.cdc.gov/Vaccinations/COVID-19-Vaccinations-in-the-United-States-County/8xkx-amqh |
| Series_Complete_Pop_Pct (Dose2) | Percent of people who have completed a primary series (have second dose of a two-dose vaccine or one dose of a single-dose vaccine) based on the jurisdiction and county where vaccine recipient lives as of September 14, 2022 | ||
| Booster_Doses_Vax_Pct (Booster) | Percent of people who completed a primary series and have received a booster (or additional) dose as of September 14, 2022 |
Table 2.
Summary statistics (count [%]; mean ± sd) of counties (N=352) and the information by state.
Table 2.
Summary statistics (count [%]; mean ± sd) of counties (N=352) and the information by state.
| All | AZ | CA | NM | TX | |
|---|---|---|---|---|---|
| N | 352 | 15 | 50 | 33 | 254 |
| (NA*) | 8 | 0 | 8 | 0 | 0 |
| Metro County | 134 [38.1%] | 8 [53.3%] | 37 [74%] | 7 [21.2%] | 82 [32.3%] |
| Border County | 44 [12.5%] | 4 [26.6%] | 2 [4%] | 6 [18.2%] | 32 [12.6%] |
| Unemployment (%) | 4.07 ± 1.94 | 6.64 ± 3.28 | 5.22 ± 3.11 | 5.44 ± 1.64 | 3.51 ± 1.09 |
| Democrat_pct (%) | 31.57 ± 18.63 | 43.61 ± 14.34 | 55.04 ± 15.06 | 44.79 ± 16.91 | 24.53 ± 14.15 |
| Farmworker (%) | 5.37 ± 5.74 | 1.57 ± 1.83 | 1.81 ± 1.99 | 4.67 ± 5.91 | 6.39 ± 5.99 |
| Rural_pct (%) | 48.98 ± 32.33 | 34.11 ± 19.75 | 20.57 ± 20.00 | 48.42 ± 30.54 | 55.52 ± 31.90 |
| HS graduate (%) | 81.74 ± 8.05 | 84.48 ± 5.32 | 83.74 ± 7.19 | 84.36 ± 5.42 | 80.85 ± 8.46 |
| Income ($) | 49,375 ± 16,205 | 40,592 ± 5,580 | 57,759 ± 24,555 | 40,855 ± 9,238 | 49,351 ± 14,391 |
| Age (%) | |||||
| 14-17 years old | 5.36 ± 0.92 | 5.02 ± 0.88 | 5.09 ± 0.86 | 4.93 ± 0.97 | 5.48 ± 0.90 |
| 18-64 years old | 57.88 ± 4.14 | 55.95 ± 5.31 | 60.32 ± 3.39 | 56.40 ± 4.28 | 57.70 ± 4.00 |
| ≥ 65 years old | 18.83 ± 5.91 | 21.70 ± 7.98 | 17.19 ± 4.73 | 22.15 ± 7.67 | 18.55 ± 5.53 |
| ≥ 18 years old | 76.71 ± 3.96 | 77.65 ± 4.03 | 77.51 ± 4.01 | 78.55 ± 4.29 | 76.25 ± 3.82 |
| Median (years old) | 39.77 ± 6.25 | 41.23 ± 8.35 | 38.72 ± 5.38 | 42.65 ± 8.06 | 39.52 ± 5.92 |
| Race/ethnicity (%) | |||||
| White | 86.57 ± 10.40 | 78.32 ± 19.40 | 79.76 ± 11.04 | 84.94 ± 15.84 | 88.61 ± 7.49 |
| Black | 5.82 ± 5.92 | 2.36 ± 1.85 | 4.02 ± 3.23 | 1.96 ± 1.32 | 6.88 ± 6.46 |
| Asian | 2.45 ± 7.76 | 1.57 ± 1.15 | 9.10 ± 9.28 | 1.24 ± 1.12 | 1.35 ± 2.08 |
| Indian | 2.80 ± 7.32 | 15.10 ± 20.69 | 2.53 ± 1.65 | 9.32 ± 16.14 | 1.28 ± 0.51 |
| Hispanic | 36.31 ± 22.07 | 31.71 ± 20.83 | 33.85 ± 18.20 | 48.69 ± 17.05 | 35.46 ± 22.97 |
| Vaccination rate (%) | |||||
| Dose 1 | 60.52 ± 16.89 | 76.31 ± 16.64 | 74.05 ± 12.98 | 76.46 ± 15.31 | 54.85 ± 14.20 |
| Dose 2 | 52.61 ± 15.38 | 65.81 ± 16.69 | 65.87 ± 12.91 | 64.82 ± 14.01 | 47.64 ± 12.90 |
| Booster | 41.58 ± 8.96 | 45.33 ± 4.91 | 53.54 ± 8.42 | 52.66 ± 7.14 | 37.56 ± 5.34 |
*NA indicates the number of counties for which vaccination information is not available.
Table 3.
Associations between vaccination rate and the counties’ characteristics in the regression analyses (Dose 1).
Table 3.
Associations between vaccination rate and the counties’ characteristics in the regression analyses (Dose 1).
| (M1) | (M2) | (M3.1) | (M3.2) | (M3.3) | (M3.4) | (M3.5) | |
|---|---|---|---|---|---|---|---|
| Model1 | Model1+ Age_65over | Model1+Age_65over +White | Model1+Age_65over +Black | Model1+Age_65over +Asian |
Model1+Age_65over +Indian |
Model1+Age_65over +Hispanic |
|
| R-squared | 0.792 | 0.793 | 0.793 | 0.806 | 0.793 | 0.806 | 0.793 |
| State (NM*) | |||||||
| AZ | -1.356 | -1.495 | -1.788 | -1.416 | -1.534 | -4.029 | -1.196 |
| (0.588) | (0.551) | (0.483) | (0.560) | (0.541) | (0.106) | (0.642) | |
| CA | -10.388 | -10.407 | -10.432 | -10.150 | -10.883 | -8.294 | -10.084 |
| (<0.001) | (<0.001) | (<0.001) | (<0.001) | (<0.001) | (<0.001) | (<0.001) | |
| TX | -8.465 | -8.254 | -8.324 | -5.286 | -8.314 | -6.429 | -8.033 |
| (<0.001) | (<0.001) | (<0.001) | (0.004) | (<0.001) | (<0.001) | (<0.001) | |
| Metro Status | 2.035 | 2.246 | 2.322 | 2.366 | 2.176 | 3.357 | 2.253 |
| (0.054) | (0.040) | (0.035) | (0.026) | (0.047) | (0.002) | (0.039) | |
| Border County | 11.479 | 11.184 | 11.565 | 9.223 | 11.282 | 12.779 | 10.904 |
| (<0.001) | (<0.001) | (<0.001) | (<0.001) | (<0.001) | (<0.001) | (<0.001) | |
| Unemployment | 0.160 | 0.154 | 0.140 | 0.268 | 0.180 | 0.007 | 0.155 |
| (0.583) | (0.598) | (0.632) | (0.345) | (0.539) | (0.981) | (0.596) | |
| Democrat_pct | 0.644 | 0.644 | 0.633 | 0.684 | 0.635 | 0.599 | 0.641 |
| (<0.001) | (<0.001) | (<0.001) | (<0.001) | (<0.001) | (<0.001) | (<0.001) | |
| Farmworker | 0.024 | 0.004 | 0.008 | -0.060 | 0.003 | -0.010 | -0.011 |
| (0.827) | (0.968) | (0.941) | (0.579) | (0.976) | (0.927) | (0.926) | |
| Rural_pct | -0.017 | -0.023 | -0.025 | -0.015 | -0.021 | -0.041 | -0.020 |
| (0.393) | (0.282) | (0.245) | (0.482) | (0.327) | (0.050) | (0.378) | |
| HS graduate | 0.023 | -0.003 | -0.009 | 0.031 | -0.005 | -0.017 | 0.014 |
| (0.734) | (0.968) | (0.905) | (0.666) | (0.951) | (0.817) | (0.863) | |
| Income | 9.33e-05 | 9.50e-05 | 9.55e-05 | 7.18e-05 | 8.65e-05 | 10.48 e-05 | 9.69e-05 |
| (0.003) | (0.002) | (0.002) | (0.018) | (0.008) | (0.001) | (0.002) | |
| Age_65over | 0.081 | 0.099 | 0.024 | 0.084 | 0.187 | 0.093 | |
| (0.431) | (0.354) | (0.808) | (0.415) | (0.068) | (0.378) | ||
| Race/ethnicity | -0.035 | -0.386 | 0.106 | 0.330 | 0.016 | ||
| (0.502) | (<0.001) | (0.426) | (<0.001) | (0.596) |
*refers to reference category. All significant estimates are expressed in bold and p-value in parentheses.
Table 4.
Associations between vaccination rate and the counties’ characteristics in the regression analyses (Dose 2).
Table 4.
Associations between vaccination rate and the counties’ characteristics in the regression analyses (Dose 2).
| (M1) | (M2) | (M3.1) | (M3.2) | (M3.3) | (M3.4) | (M3.5) | |
|---|---|---|---|---|---|---|---|
| Model1 | Model1+ Age_65over | Model1+ Age_65over +White | Model1+ Age_65over +Black | Model1+ Age_65over +Asian |
Model1+ Age_65over +Indian |
Model1+ Age_65over + Hispanic |
|
| R-squared | 0.760 | 0.760 | 0.761 | 0.775 | 0.760 | 0.779 | 0.760 |
| State (NM*) | |||||||
| AZ | 0.134 | 0.046 | -0.393 | 0.123 | 0.012 | -2.749 | -0.042 |
| (0.956) | (0.985) | (0.875) | (0.959) | (0.996) | (0.255) | (0.987) | |
| CA | -6.195 | -6.207 | -6.244 | -5.956 | -6.617 | -3.876 | -6.302 |
| (0.001) | (0.001) | (<0.001) | (0.001) | (<0.001) | (0.037) | (0.002) | |
| TX | -4.357 | -4.224 | -4.330 | -1.322 | -4.276 | -2.211 | -4.289 |
| (0.011) | (0.015) | (0.013) | (0.461) | (0.014) | (0.196) | (0.017) | |
| Metro Status | 1.053 | 1.186 | 1.300 | 1.304 | 1.125 | 2.412 | 1.184 |
| (0.308) | (0.267) | (0.226) | (0.208) | (0.294) | (0.022) | (0.268) | |
| Border County | 9.123 | 8.936 | 9.507 | 7.019 | 9.021 | 10.696 | 9.019 |
| (<0.001) | (<0.001) | (<0.001) | (<0.001) | (<0.001) | (<0.001) | (<0.001) | |
| Unemployment | 0.471 | 0.467 | 0.446 | 0.579 | 0.490 | 0.305 | 0.467 |
| (0.099) | (0.103) | (0.120) | (0.038) | (0.089) | (0.269) | (0.103) | |
| Democrat_pct | 0.611 | 0.611 | 0.594 | 0.649 | 0.603 | 0.561 | 0.612 |
| (<0.001) | (<0.001) | (<0.001) | (<0.001) | (<0.001) | (<0.001) | (<0.001) | |
| Farmworker | 0.042 | 0.030 | 0.036 | -0.032 | 0.029 | 0.015 | 0.035 |
| (0.687) | (0.779) | (0.740) | (0.759) | (0.786) | (0.888) | (0.755) | |
| Rural_pct | -0.004 | -0.008 | -0.011 | 0.000 | -0.006 | -0.028 | -0.009 |
| (0.831) | (0.704) | (0.601) | (0.990) | (0.766) | (0.167) | (0.683) | |
| HS graduate | 0.038 | 0.021 | 0.012 | 0.055 | 0.020 | 0.006 | 0.016 |
| (0.567) | (0.770) | (0.866) | (0.441) | (0.785) | (0.930) | (0.838) | |
| Income | 10.96e-05 | 11.07e-05 | 11.15e-05 | 8.80e-05 | 10.34e-05 | 12.15e-05 | 11.02e-05 |
| (<0.001) | (<0.001) | (<0.001) | (0.003) | (0.001) | (<0.001) | (<0.001) | |
| Age_65over | 0.051 | 0.077 | -0.004 | 0.054 | 0.168 | 0.048 | |
| (0.612) | (0.457) | (0.966) | (0.595) | (0.091) | (0.645) | ||
| Race/ethnicity | -0.052 | -0.378 | 0.091 | 0.364 | -0.005 | ||
| (0.304) | (<0.001) | (0.484) | (<0.001) | (0.873) |
*refers to the reference category. All significant estimates are expressed in bold and p-value in parentheses.
Table 5.
Associations between vaccination rate and the counties’ characteristics in the regression analyses (Booster).
Table 5.
Associations between vaccination rate and the counties’ characteristics in the regression analyses (Booster).
| (M1) | (M2) | (M3.1) | (M3.2) | (M3.3) | (M3.4) | (M3.5) | |
| Model1 | Model1+ Age_65over | Model1+ Age_65over +White | Model1+ Age_65over +Black |
Model1+ Age_65over+ Asian |
Model1 Age_65over+ Indian |
Model1+ Age_65over Hispanic |
|
| R-squared | 0.696 | 0.744 | 0.749 | 0.744 | 0.762 | 0.745 | 0.747 |
| State (NM*) | |||||||
| AZ | -4.930 | -5.760 | -6.362 | -5.761 | -5.904 | -5.939 | -6.383 |
| (0.002) | (<0.001) | (<0.001) | (<0.001) | (<0.001) | (<0.001) | (<0.001) | |
| CA | 1.444 | 1.332 | 1.282 | 1.328 | -0.390 | 1.481 | 0.657 |
| (0.240) | (0.238) | (0.253) | (0.240) | (0.732) | (0.202) | (0.577) | |
| TX | -10.910 | -9.646 | -9.791 | -9.692 | -9.864 | -9.517 | -10.106 |
| (<0.001) | (<0.001) | (<0.001) | (<0.001) | (<0.001) | (<0.001) | (<0.001) | |
| Metro Status | -1.992 | -0.732 | -0.575 | -0.734 | -0.985 | -0.653 | -0.747 |
| (0.003) | (0.254) | (0.369) | (0.254) | (0.113) | (0.320) | (0.242) | |
| Border County | -0.079 | -1.846 | -1.063 | -1.815 | -1.491 | -1.733 | -1.263 |
| (0.938) | (0.053) | (0.290) | (0.066) | (0.107) | (0.076) | (0.206) | |
| Unemployment | -0.373 | -0.410 | -0.438 | -0.411 | -0.314 | -0.420 | -0.412 |
| (0.046) | (0.017) | (0.011) | (0.017) | (0.061) | (0.015) | (0.016) | |
| Democrat_pct | 0.206 | 0.206 | 0.183 | 0.206 | 0.174 | 0.203 | 0.213 |
| (<0.001) | (<0.001) | (<0.001) | (<0.001) | (<0.001) | (<0.001) | (<0.001) | |
| Farmworker | 0.168 | 0.054 | 0.062 | 0.055 | 0.050 | 0.053 | 0.086 |
| (0.015) | (0.402) | (0.337) | (0.398) | (0.424) | (0.412) | (0.200) | |
| Rural_pct | 0.040 | 0.005 | 0.0005 | 0.005 | 0.012 | 0.003 | -0.002 |
| (0.002) | (0.705) | (0.970) | (0.714) | (0.335) | (0.787) | (0.866) | |
| HS graduate | 0.326 | 0.172 | 0.160 | 0.171 | 0.166 | 0.171 | 0.137 |
| (<0.001) | (<0.001) | (<0.001) | (<0.001) | (<0.001) | (<0.001) | (0.004) | |
| Income | 0.52e-05 | 1.57e-05 | 1.67e-05 | 1.60e-05 | -1.53e-05 | 1.63e-05 | 1.18e-05 |
| (0.792) | (0.389) | (0.356) | (0.385) | (0.412) | (0.370) | (0.517) | |
| Age_65over | 0.484 | 0.520 | 0.485 | 0.495 | 0.491 | 0.459 | |
| (<0.001) | (<0.001) | (<0.001) | (<0.001) | (<0.001) | (<0.001) | ||
| Race/ethnicity | -0.071 | 0.006 | 0.383 | 0.023 | -0.034 | ||
| (0.019) | (0.904) | (<0.001) | (0.577) | (0.060) |
*refers to reference category. All significant estimates are expressed in bold and p-value in parentheses.
Disclaimer/Publisher’s Note: The statements, opinions and data contained in all publications are solely those of the individual author(s) and contributor(s) and not of MDPI and/or the editor(s). MDPI and/or the editor(s) disclaim responsibility for any injury to people or property resulting from any ideas, methods, instructions or products referred to in the content. |
© 2025 by the authors. Licensee MDPI, Basel, Switzerland. This article is an open access article distributed under the terms and conditions of the Creative Commons Attribution (CC BY) license (http://creativecommons.org/licenses/by/4.0/).
Copyright: This open access article is published under a Creative Commons CC BY 4.0 license, which permit the free download, distribution, and reuse, provided that the author and preprint are cited in any reuse.


