Preprint
Article

This version is not peer-reviewed.

Evaluation of the Residual Effects of New Methodologies of Correction Surface and Subsurface Acidity on Soil Chemical Attributes in Agropastoral System

Submitted:

09 December 2025

Posted:

11 December 2025

You are already at the latest version

Abstract

Surface and subsurface acidity (pH < 4.4) limits nutrient availability and root exploration, whereas a pH range of 5.4–6.4 ensures the availability of most nutrients that are essential for crop productivity. To ameliorate acidity in the surface and subsurface layers and improve soil chemical fertility, different application methodologies (surface, incorporation by soil tillage, or subsurface) for calcium (Ca) compounds (limestone (LS), phosphogypsum (PG), and hydrated lime (HL)) were evaluated in an agropastoral system in an Arenic Hapludalf in Brazil during the 2017–2020 seasons. Two seasons after the last application of Ca compounds, the soil was sampled and analyzed to evaluate the long-term ability of these different application methodologies. In the 0.0–0.2 m layer, the correction of surface acidity via increased pH and base saturation (BS) and reduced total acidity was maintained, but the improvement in acidity in the 0.4–0.8 m layer previously observed after the incorporation of LS and subsurface application of HL in the 2017-2018 season was not. Moreover, the improvements in Ca2+ content and Ca2+/cation exchange capacity (CEC) after applying LS plus PG and Mg2+ content and Mg2+/CEC after applying HL plus PG were preserved in the surface layer. The positive effects of these amendments on sulfate-S (S-SO42-) content throughout the soil profile (0.0–0.8 m) were not. Finally, Ca compound application had residual positive effects on P content in the 0.1–0.8 m layer and organic matter (OM) content in the 0.2–0.8 m layer.

Keywords: 
;  ;  ;  ;  

1. Introduction

Maintaining the long-term production capacity of soil is essential for increasing crop yields to meet global food demand [1]. There is global interest in sustainable soil management systems such as no-till (NT) [2,3,4] and agropastoral systems.These systems enhance soil quality and, in turn, crop yields by improving the chemical, physical and biological attributes of soil [5] and conserving biodiversity [6]. However, in many areas of the world, increases in crop yields are limited by soil acidity (pH CaCl2 values below 4.4) [7,8].
In Brazil, most agropastoral systems are located in the Cerrado biome (the Brazilian savanna), where soil acidity is the result of leaching of basic ions promoted by high rainfall over many years. This high degree of weathering produces soils with low calcium (Ca)2+, magnesium (Mg)2+, potassium (K)+, and phosphorus (P) contents [9], low cation exchange capacity (CEC), low base saturation (BS) [10], and high levels of elements that are toxic to plants, such as exchangeable aluminum (Al3+) and manganese (Mn) [11,12,13]. The toxicity caused by high Al3+ content, P deficiency and low BS hinders root growth, reduces the absorption of water and nutrients by plants [14], and consequently limits crop yields [15,16], particularly in dry periods [17]. In addition, low Ca2+ content in deeper soil layers may restrict root exploration to the surface layer.
Applying limestone (LS), i.e., liming, efficiently increases soil pH and BS, supplies Ca2+ and Mg2+, and decreases exchangeable Al3+ and Mn [11,18]. However, the mobility of the products of LS dissolution is low and depends on the leaching of organic and/or inorganic salts throughout the soil profile; consequently, LS reactivity is restricted to the site of soil application [18,19]. This is problematic in systems without soil tillage, such as agropastoral systems of the Cerrado, where soil acidity correction is usually carried out by applying LS on the surface without incorporation into the soil [20]. [8,21,22,23,24] confirmed that surface-applied LS has low mobility, and [25] verified that liming without incorporation corrects acidity only in the 0–0.1 m layer.
Soil amendments like phosphogypsum (PG, CaSO4) can increase the efficiency of LS application [11,13,26,27,28,29]. PG is more soluble than LS (2.5 g L-1) [30] and leaches to subsurface layers [31]. As it moves down the soil profile, PG increases the supply of Ca2+ and sulfate-S (S-SO42-) and reduces Al3+ activity [17,32,33,34]. Once in the soil solution, Ca2+ adsorbs to the soil exchange complex and displaces Al3+, K+ and Mg2+ into the soil solution. These cations react with SO42- to form AlSO4+ (which is less toxic to plants than Al3+) and the neutral ion pairs K2SO40 and MgSO40, which, along with CaSO40, have high mobility in the soil profile [35]. During soil acidity correction, the carbonate of LS is consumed and is no longer available to accompany Ca2+ to deeper soil layers, whereas the sulfate of PG remains available [36]. By improving the soil profile, PG application promotes the development of the crop root system [34,37,38,39,40] to explore water and nutrients [41], reducing the adverse effects of drought [30], improving crop tolerance to water stress [42], and increasing crop yields [11], especially in the Cerrado biome.
Another input for improving soil fertility is hydrated lime (HL) [20]. HL is a fine powder produced by the hydration of virgin lime by an industrial process and in comprised of Ca(OH)2 and Mg(OH)2 [43,44]. However, there is little information on application methodologies and the long-term effects of HL application, particularly in agropastoral systems.
Methodologies that provide long-term amelioration of surface and subsurface acidity and improvements in soil chemical fertility are necessary to decrease production costs and increase the crop yields of farmers in the Cerrado. [20,45] evaluated different methodologies for applying LS, PG, and HL in a Typic Hapludalf in an agropastoral system in Brazil on soil chemical attributes, soybean [Glycine max (L.) Merr.] and maize (Zea mays L.) grain yields, and the dry matter yield of palisade grass (Urochloa brizantha syn. Brachiaria brizantha cultivar Marandu). [20] found that after three seasons, all methodologies corrected surface acidity (0.0–0.2 m) by increasing pH and BS and reducing total acidity, but only subsurface application of HL, combined with both surface application of PG in the 1st year and surface application of HL in subsequent years increased pH and BS in the subsurface layer (0.4–0.8 m). [20] also determined that applying LS or HL plus PG increased S-SO42- content throughout the soil profile (0.0–0.8 m); in the 0.0–0.2 m layer, applying LS plus PG increased Ca2+ content and Ca2+/CEC, and applying HL plus PG increased Mg2+ content and Mg2+/CEC. However, the long-term effects of these methodologies in agropastoral systems are unclear. To address this gap, this study tested the following hypotheses: (a) the improvements in surface and subsurface acidity and soil chemical fertility produced by different methodologies for applying LS, PG, and HL observed by [20,45] persist after two seasons, and (b) further changes in soil chemical attributes occur after two seasons.

2. Materials and Methods

2.1. Description of Study Area

The experiment was carried out at the Advanced Research and Development Division for Rubber Tree and Agroforestry Systems of the Agronomic Institute (IAC) of the São Paulo Agency for Agribusiness Technology (APTA), Votuporanga, São Paulo State, Brazil (20º20’S, 49º58’W and 510 m altitude), in an area with a slope < 5%. The study site is located in the Cerrado biome. Its natural vegetation has peculiar characteristics, such as small trees, thick and twisted trunks, thick bark, with large leaves.
As described previously by [45], prior to the experiment, the area had been used for grain and seed production under conventional soil tillage. In the 2014/2015 season, castor bean was grown for seed production. During the 2015/2016 growing season, maize was cultivated under no-till in the summer and sunn hemp (Crotalaria juncea) in the winter-spring season. In the 2016/2017 growing season, maize was intercropped with Congo grass (U. ruziziensis syn. B. ruziziensis) in the summer under no-till. The Congo grass was not grazed but was used as a cover crop before the next crop. Details of study area are shown in Figure S1 in the Supplemental Material.

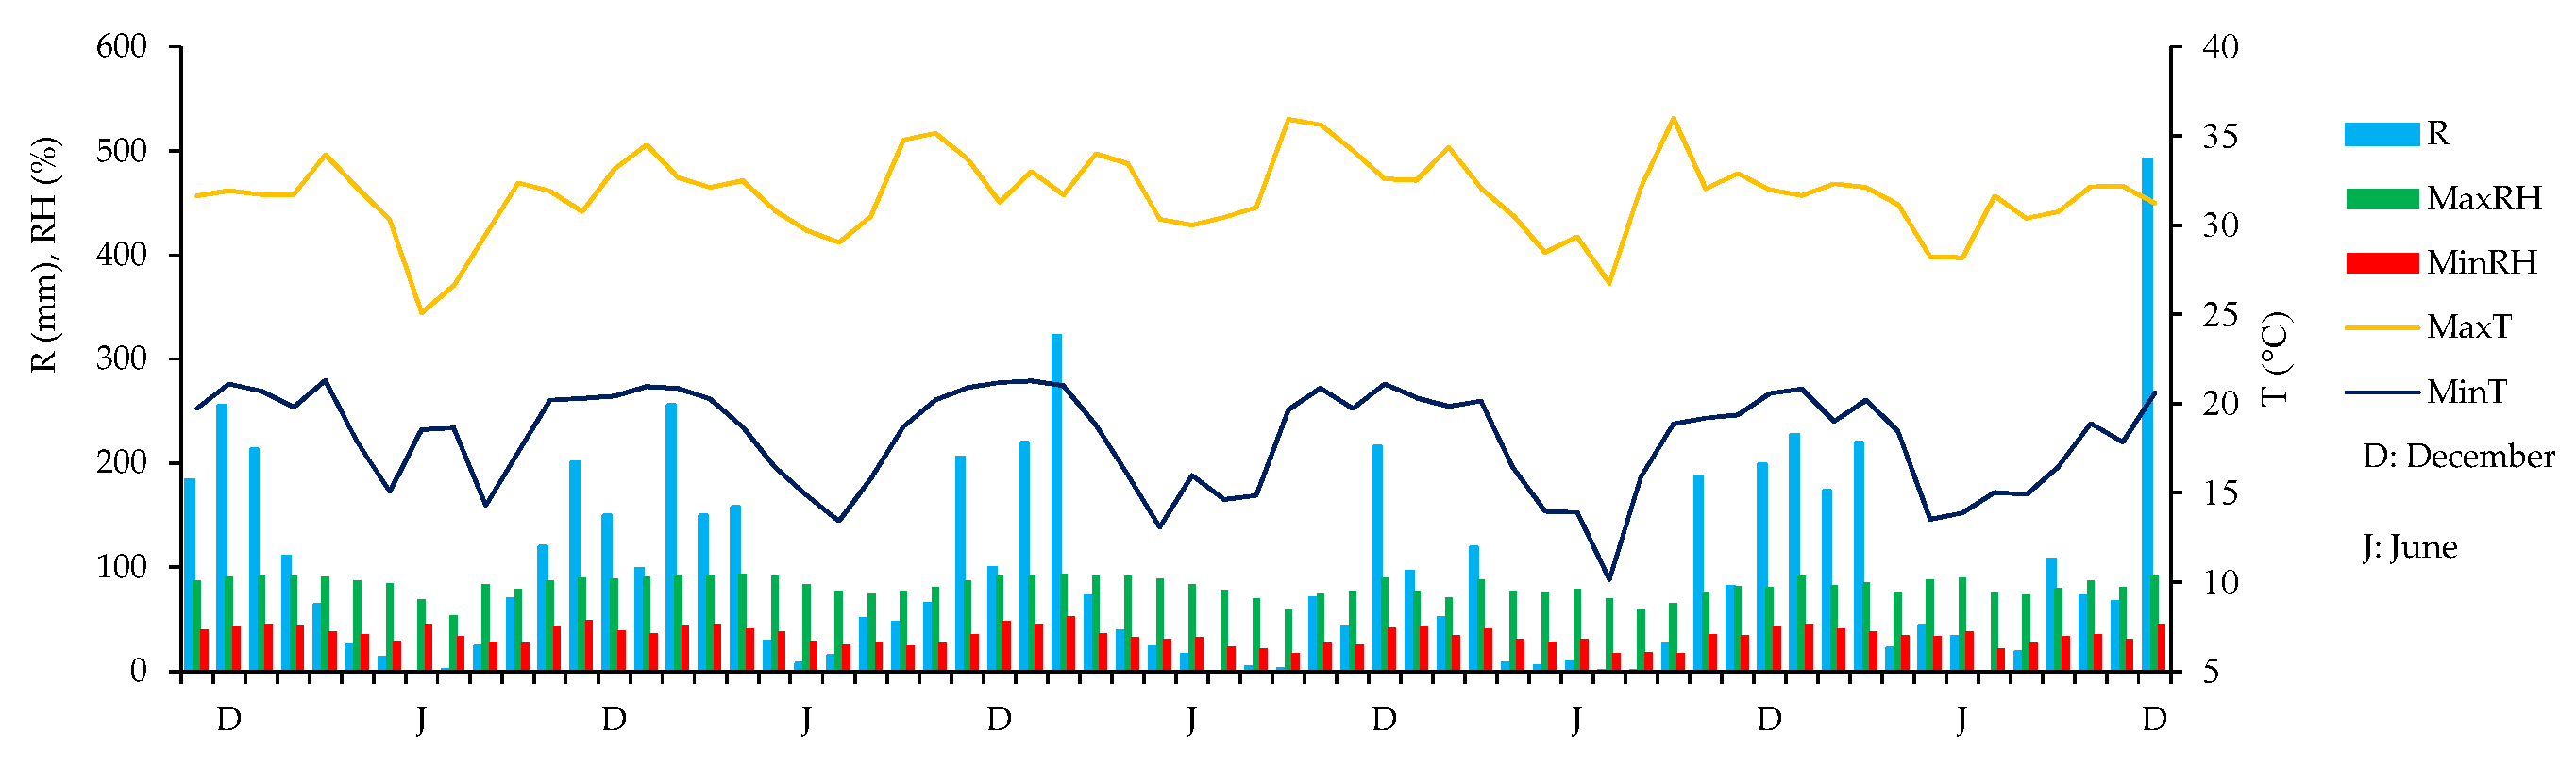
2.2. Description of Soil and Climate

The soil in the experimental area is classified as an Arenic Hapludult [46] and will be referred to in this study as an Ultisol with sandy texture. According to Köppen’s classification, the regional climate type is Aw (tropical with dry winters). The average annual maximum temperature is 31.2°C; the average annual minimum temperature is 17.4°C; and the annual mean temperature is 24°C. The annual average rainfall is 1,328.6 mm. Figure 1 presents monthly rainfall, minimum and maximum relative humidity, and minimum and maximum temperature data for Votuporanga from November 1, 2017, to December 31, 2022.

2.3. Description of Experimental Design

The experimental design was randomized complete blocks with four replications using seven treatments involving three Ca compounds (LS, PG, and HL). Each plot had a size of 0.4 ha.

2.4. Description of Treatments

Seven treatments with different combinations of Ca compounds and application management methodologies, over three growing seasons (2017–2018, 2018–2019, and 2019–2020) were evaluated (Table 1). Three Ca compounds were used: LS, which contained 42% CaO and 7% MgO; PG, which contained 17% CaO and 14% S (S-SO42-); and HL, which contained 40% CaO and 27% MgO. In T1, the control treatment, LS, PG, and LH were not applied, and soil tillage was not performed. In T2, LS and PG were surface-applied (no tillage, NT) at doses of 2,000 kg ha-1 and 2,500 kg ha-1, respectively, in the 1st year; in the 2nd and 3rd years, LS was applied to the surface to ensure that Ca+2 occupied 65% of CEC in the 0.0–0.2 m layer. In the 2nd and 3rd years, PG was not applied. In T3 and T4 conventional soil tillage system (CT) was used. In T3, in the 1st year, LS was applied at a dose of 1,000 kg ha-1 and incorporated with a heavy-duty hydraulic harrow (28” discs) and a leveling harrow (20” discs, two times). After that, LS was applied at doses of 1,350 kg ha-1 and incorporated with a moldboard plow up to 0.26 m; and PG was applied at dose of 1,500 kg ha-1 and incorporated with a leveling harrow. In the 2nd and 3rd years, LS was surface-applied to ensure that Ca+2 occupied 65% of CEC in the 0.0–0.2 m layer, and PG was surface-applied to ensure that Ca+2 occupied 50% of effective cation exchange capacity (ECEC) in the 0.2–0.4 m layer. In T4, in the 1st year, LS was applied at a dose of 1,000 kg ha-1 and incorporated with a heavy-duty hydraulic harrow (28” discs) and a leveling harrow (20” discs, two times). After that, LS was applied at doses of 1,350 kg ha-1 and incorporated with a moldboard plow up to 0.26 m. In the 2nd and 3rd years, LS was surface-applied to ensure that Ca+2 occupied 65% of CEC in the 0.0–0.2 m layer. In T5, HL and PG were surface-applied (NT) at doses of 725 kg ha-1 and 2,500 kg ha-1, respectively, in the 1st year; in the 2nd and 3rd years, HL was surface-applied to ensure that Ca+2 occupied 65% of CEC in the 0.0–0.2 m layer, and PG was surface-applied to ensure that Ca+2 occupied 50% of ECEC in the 0.2–0.4 m layer. In T6 and T7 minimum soil tillage system (MT) was used. In T6, in the 1st year, HL was applied in the 0–0.57 m layer using a 2-shank subsoiler-fertilizer at a dose of 450 kg ha-1, and PG was surface-applied at a dose of 2,500 kg ha-1. In the 2nd and 3rd years, HL was surface-applied to ensure that Ca+2 occupied 65% of CEC in the 0.0–0.2 m layer, and PG was not applied. In T7, HL was subsurface applied in the 0–0.57 m layer using a 2-shank subsoiler-fertilizer at a dose of 260 kg ha-1 in the 1st year, and PG was surface-applied at a dose of 2,500 kg ha-1. In the 2nd and 3rd years, HL was surface-applied to ensure that Ca+2 occupied 65% of CEC in the 0.0–0.2 m layer. In the 2nd and 3rd years, PG was not applied. Details of the treatments are shown in Figure S2 in the Supplemental Material.
In the 2nd and 3rd growing seasons, the dose of LS or HL was calculated based on the results of soil analysis to ensure that Ca occupied 65% of CEC in the 0.0–0.2 m layer according to the methodology of [45]: LS/HL (Mg ha−1) = Ca2+ saturation of CEC − exchangeable Ca2+ content in cmolc dm−3 over a depth of 0.0–0.2 m. The CEC at a depth of 0.0-0.2 m was calculated as the sum of the contents of exchangeable cations: CEC = Ca2+ + Mg2+ + potassium (K)+ + total acidity (hydrogen (H)+ + Al3+). The Ca2+ saturation (65%) at a depth of 0.0–0.02 m was calculated as 100 × Ca2+/CEC.
The dose of PG in the 2nd and 3rd growing seasons was calculated based on the results of soil analysis to ensure that Ca occupied 50% of ECEC in the 0.2–0.4 m layer, following the methodology of [48]: PG (Mg ha-1) = (0.5 × Ca2+ saturation in ECEC − exchangeable Ca2+ content in cmolc dm−3 at a depth of 0.2–0.4 m) × 6.4. The ECEC at a depth of 0.2-0.4 m was calculated as the sum of the contents of exchangeable cations: ECEC = Al3+ + Ca2+ + Mg2+ + K+. The Ca2+ saturation (50%) at a depth of 0.2–0.4 m was calculated as 100 × Ca2+/ECEC.

2.5. Crop Management

The details of soil and crop management in the treatments in the 2017-2018 (1st), 2018-2019 (2nd), and 2019-2020 (3rd) seasons were described previously by [45] and are presented in Tables S1, S2, and S3, respectively, in the Supplemental Material. In brief, the doses of LS, PG, and HL used in the treatments were determined based on the results of soil sampling at the end of the previous season. Seventy-one days after the maize harvest (2018/2019 season), 10 beef cattle with an average weight of 484 kg were introduced into the experimental area. To adjust the grazing height, on August 23, 2019, five more animals with an average weight of 397 kg were introduced into the area. A continuous grazing system was used, and the animals were allowed to move freely about the pasture in all plots. On October 29, 2019, the 15 beef cattle animals were removed from the area because of a drastic reduction in forage supply caused by water deficiency. On November 26, 2019, 10 different newly weaned animals with an average weight of 268 kg were introduced in a continuous grazing system. In the 2020-2021 and 2021-2022 seasons, 10 weaned beef cattle remained in the experimental area. On October 01, 2021, topdressing fertilization of palisade grass was performed using 10-10-10 fertilizer (10% N-urea, 10% P2O5- single superphosphate, and 10% K2O- potassium chloride) at 1,000 kg ha-1. We used this quantity of 10-10-10 fertilizer because palisade grass demands 13 kg of nitrogen per 1000 kg of forage dry matter yield [49] and the last fertilization of the experimental area was performed on March 1, 2019 (2nd topdressing fertilization of maize, Table S3).

2.6. Sampling and Analysis

2.6.1. Soil Sampling and Analysis

Before applying the treatments, soil was sampled from the 0.0–0.1, 0.1–0.2, 0.2–0.4, and 0.4–0.8 m layers to determine the initial soil characteristics, fertility [50] and sediment granulometric characteristics (sand, silt, and clay content). The samples were collected at ten random points of each depth increment (0.0–0.1, 0.1–0.2, 0.2–0.4, and 0.4–0.8 m layers). The ten subsamples were homogenized and pooled to form a composite sample of each depth increment. On April 10, 2018, and April 19, 2019, new soil samples were collected for chemical analysis, determination of fertility [50], and calculation of the doses of LS, PG, and HL to be reapplied according to the treatments. The samples were collected at five random points in each plot in the 0.0–0.2 and 0.2–0.4 m layers; thus, five subsamples were collected from each layer of each plot. The five subsamples were homogenized and pooled to form a composite sample of each layer of each plot. Soil was sampled with a metal probe and air-dried before analysis.
The pH (1:2.5 soil/0.01 Μ CaCl2 suspension) and total acidity pH 7.0 (H+ + Al3+) were determined by the methodology of [50]. Total acidity was determined by titrimetry and was extracted from the soil using 1 mol L-1 calcium acetate (C4H6CaO4) pH 7, a buffered solution that removes Al3+ and undissociated H from the soil. The S-SO42- content was determined by the calcium phosphate (Ca3(H2PO4)2) method [49], and the levels of P, K+, Ca2+, and Mg2+ in the soil were determined by extraction with ion-exchange resin [50]. The Ca3(PO4)2 method is based on the extraction of S-SO42- from soil samples by a solution of 0.01 mol L-1 Ca(H2PO4)2. Quantification is performed by turbidimetry, which detects barium sulfate (BaSO4) formed by the reaction of barium chloride dihydrate (BaCl2.2H2O) with S-SO42- extracted from soil samples. Extraction with ion-exchange resin allows the evaluation of so-called labile phosphorus by gradual dissolution of phosphate compounds from the solid phase of the soil and transfer of orthophosphate ions to the ion-exchange resin. Furthermore, as the extraction is carried out with a mixture of cationic and anionic exchange resins saturated with sodium bicarbonate, the exchangeable cations are also largely transferred from the soil to the resin, especially if the levels are not too high. An advantage of using sodium bicarbonate is that the bicarbonate ions buffer the medium at a pH close to neutrality, which is favorable for the dissolution of phosphates from the soil, while the sodium ions saturate the cationic resin, allowing the removal of exchangeable cations from the soil. The Ca2+ and Mg2+ were determined by atomic absorption spectrophotometry, and K+ was determined by flame photometry. These results were used to calculate the values of BS through the relationship between the content of exchangeable bases in the soil (Ca2+, Mg2+, and K+) and CEC and ECEC in cmolc dm-3 as well as the percentage ratios of K+/CEC, Ca2+/CEC, Mg2+/CEC, and Ca2+/ECEC.
To assess the long-term effects of the methodologies used to apply Ca compounds in the 2017-2020 seasons, soil samples were collected on December 12, 2022, for chemical analysis and determination of fertility. Soil was sampled with a metal probe and air-dried before analysis. The samples were collected at five random points of each depth increment (0.0–0.1, 0.1–0.2, 0.2–0.4, and 0.4–0.8 m layers) in each plot. The five subsamples from each layer were homogenized and pooled to form a composite sample of the layer. The chemical attributes of the samples were analyzed using the same methodology described previously [50].

2.6.2. Straw Sampling and Analysis

Straw was sampled in the 1st and 2nd growing seasons. Specifically, the straw within an area of 0.5 x 0.5 m was collected at 10 locations in each plot, packed in paper bags, and dried at 65–70ºC in a forced ventilation oven for 72 hours.

2.7. Statistical Analysis

Before analyzing the data to evaluate the residual effect of the treatments applied in the 2017/2018, 2018/2019, and 2019/2020 growing seasons, the normality and homoscedasticity of the data were analyzed by the Shapiro-Wilk and Bartlett tests, respectively, both at 0.05 probability. Differences in soil chemical attributes in each soil layer (0.0–0.1, 0.1–0.2, 0.2–0.4, and 0.4–0.8 m) in the 2022-2023 season were analyzed by ANOVA (F test). Averages were compared by Tukey’s test (P ≤ 0.05) in Assistat [51].

3. Results

The average amount of straw dry matter present in the area was 9,550 kg ha-1 in the 2017-2018 season and 2,424 kg ha-1 in the 2018-2019 season. The initial chemical characteristics and the sediment granulometric characteristics of the soil are shown in Table S4 in the Supplemental Material. Table 2, Table 3, Table 4 and Table 5 present the chemical attributes of the soil in the 0.0–0.1, 0.1–0.2, 0.2–0.4, and 0.4–0.8 m layers, respectively, in the 2022-2023 season. The Al3+ content was 0.0 cmolc dm-3 in all samples from the four layers and thus was excluded from statistical analysis. Figure 2, Figure 3 and Figure 4 illustrate the chemical attributes of the soil in the 0.0–0.1, 0.1–0.2, 0.2–0.4, and 0.4–0.8 m layers in the 2022-2023 season, including P (Figure 2a); S (Figure 2b); organic matter (OM) (Figure 2c); pH (Figure 3a); Ca2+ (Figure 3b); Mg2+ (Figure 3c); H+ + Al3+ (Figure 4a); BS (Figure 4b); Ca2+/CEC (Figure 4c); and Mg2+/CEC (Figure 4d).

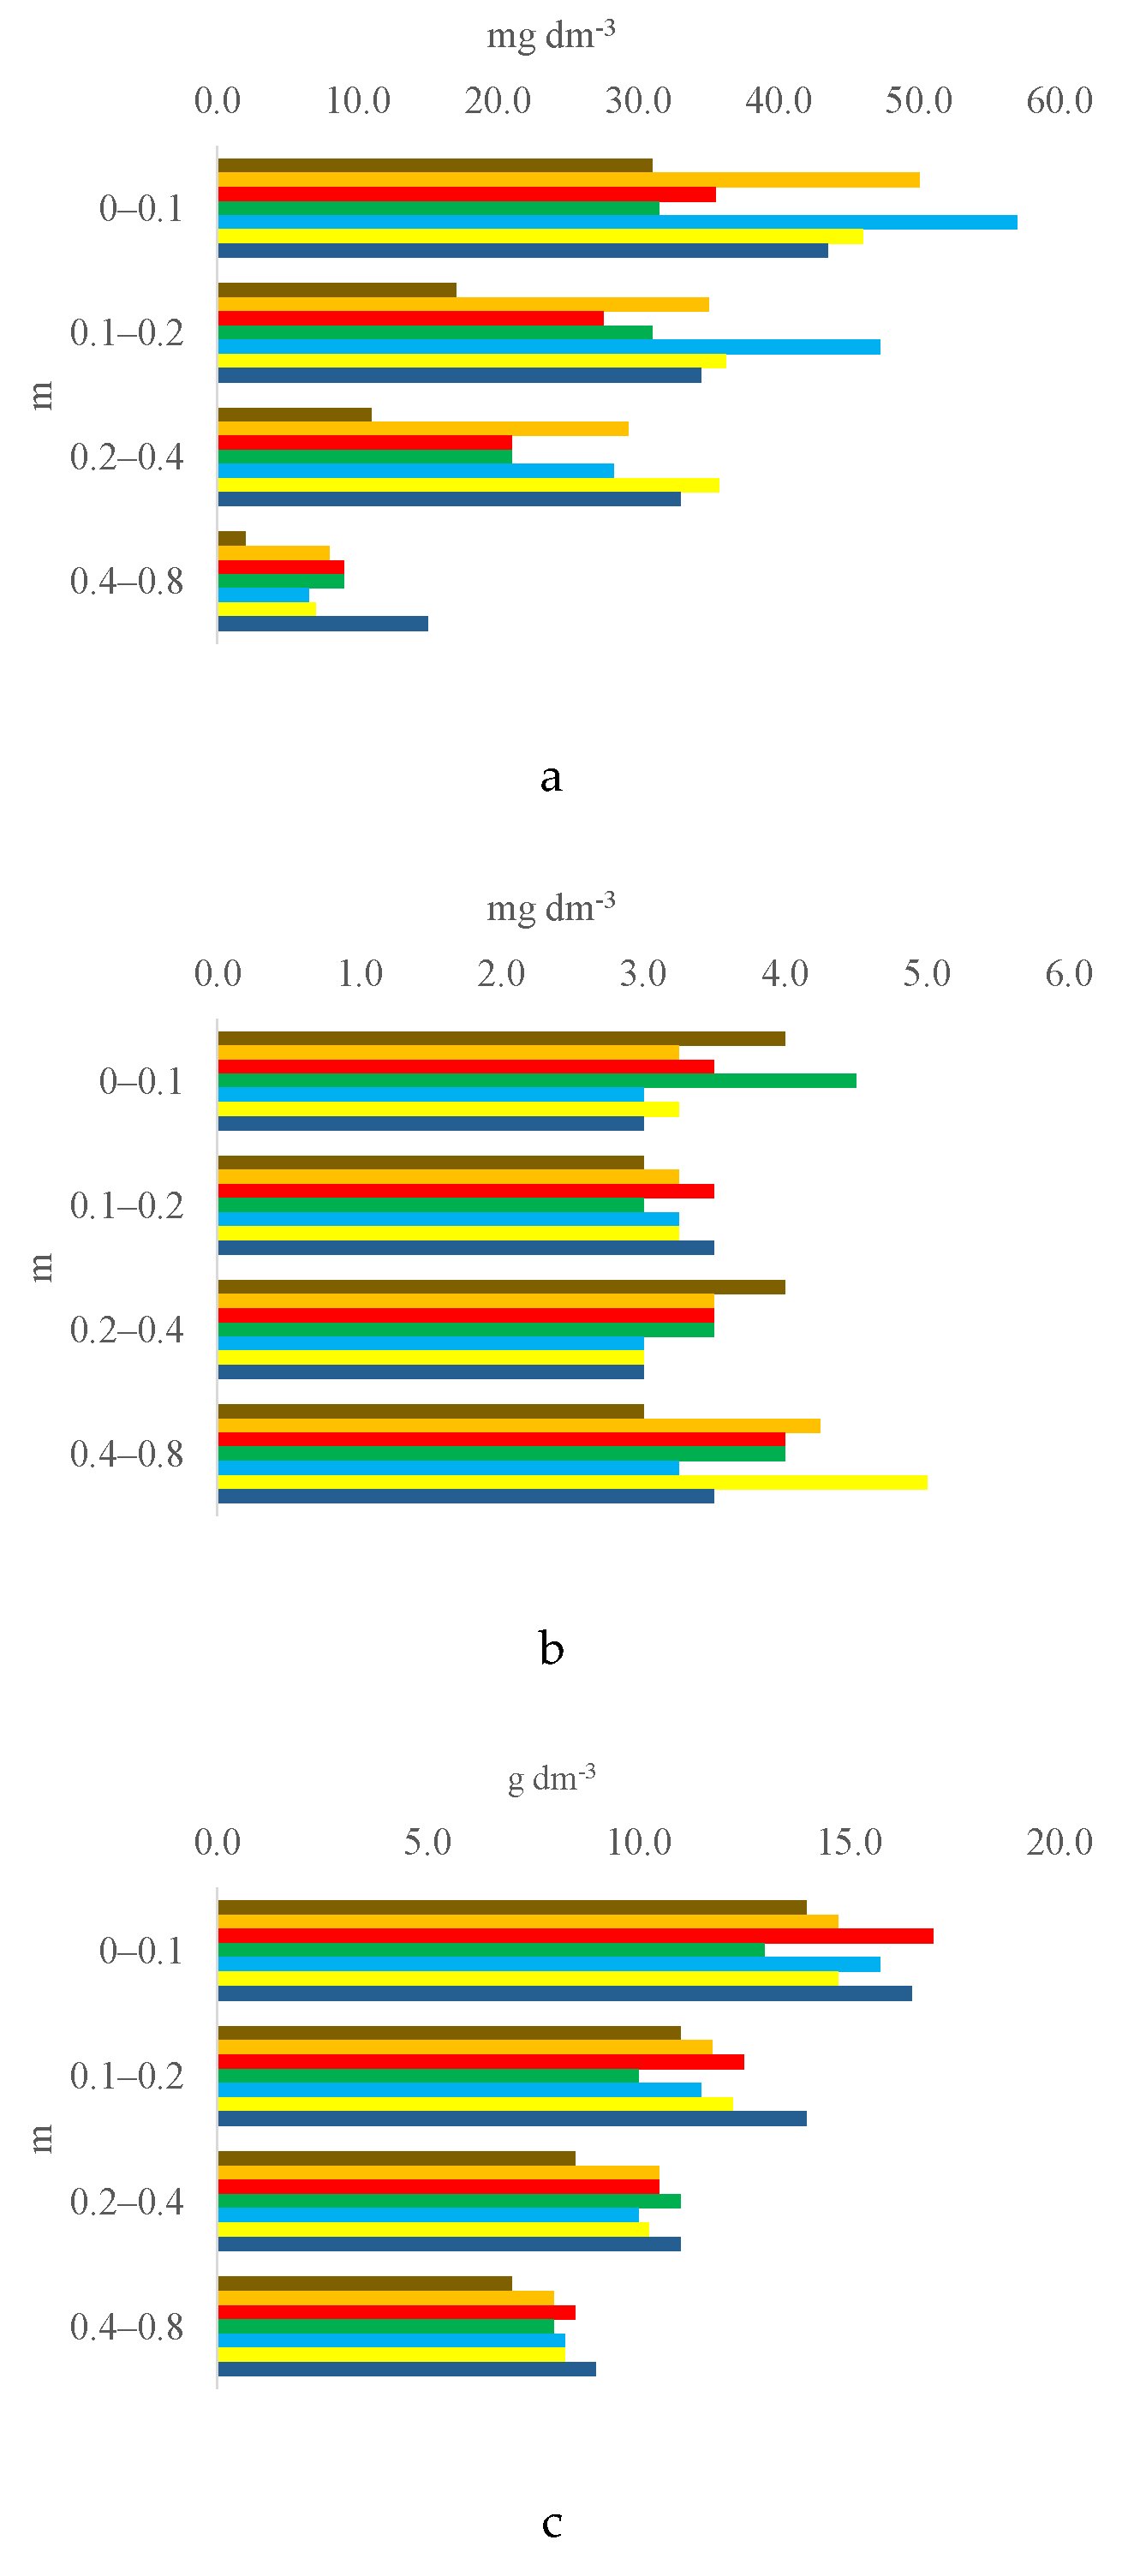
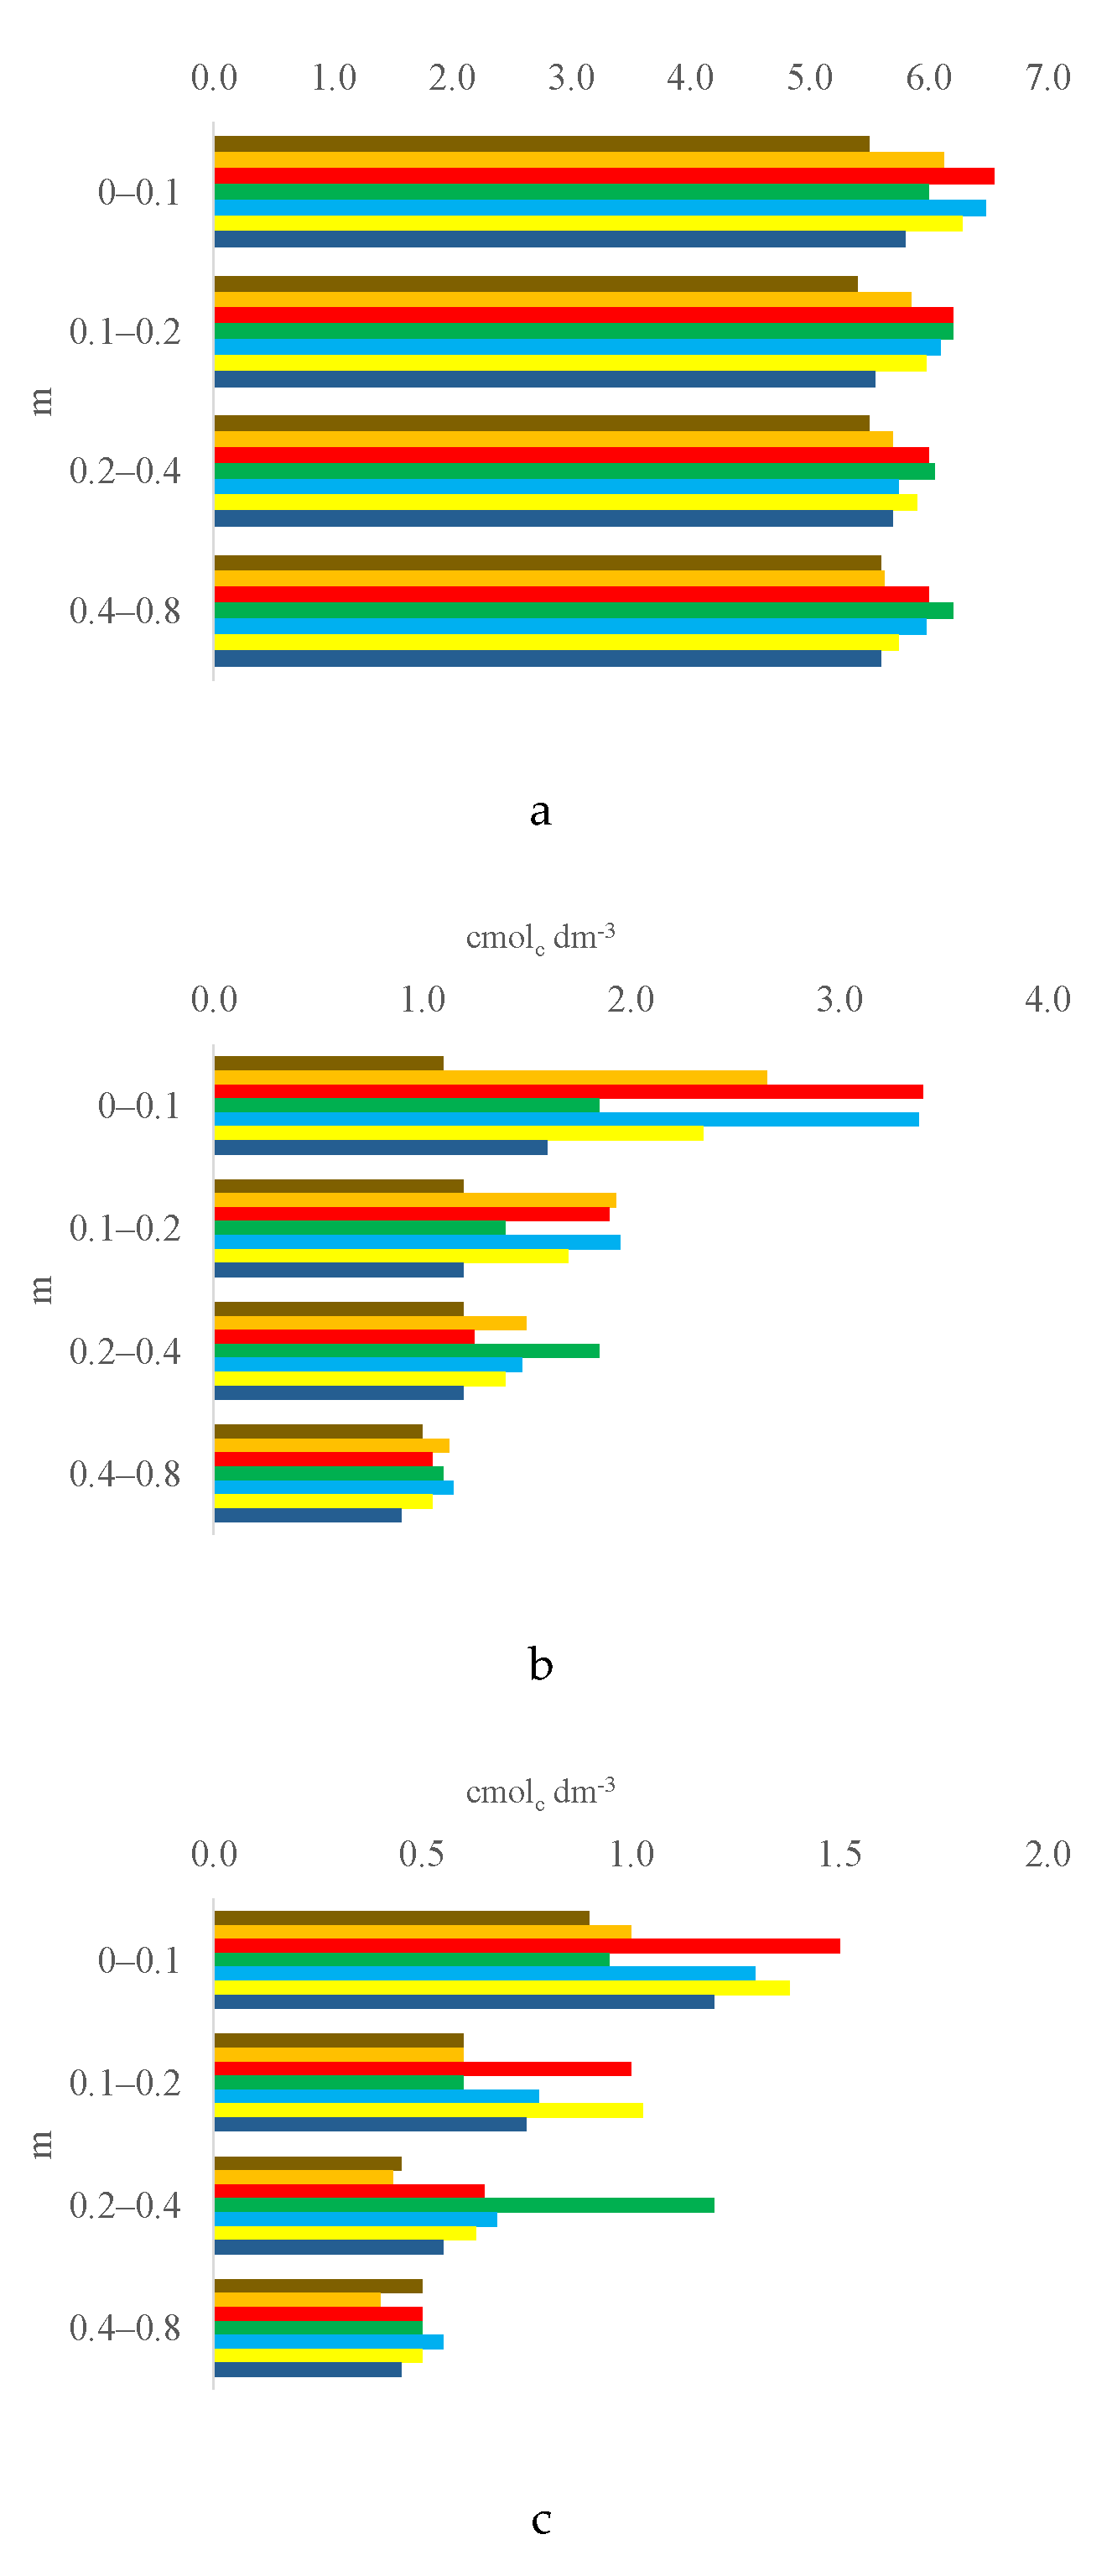
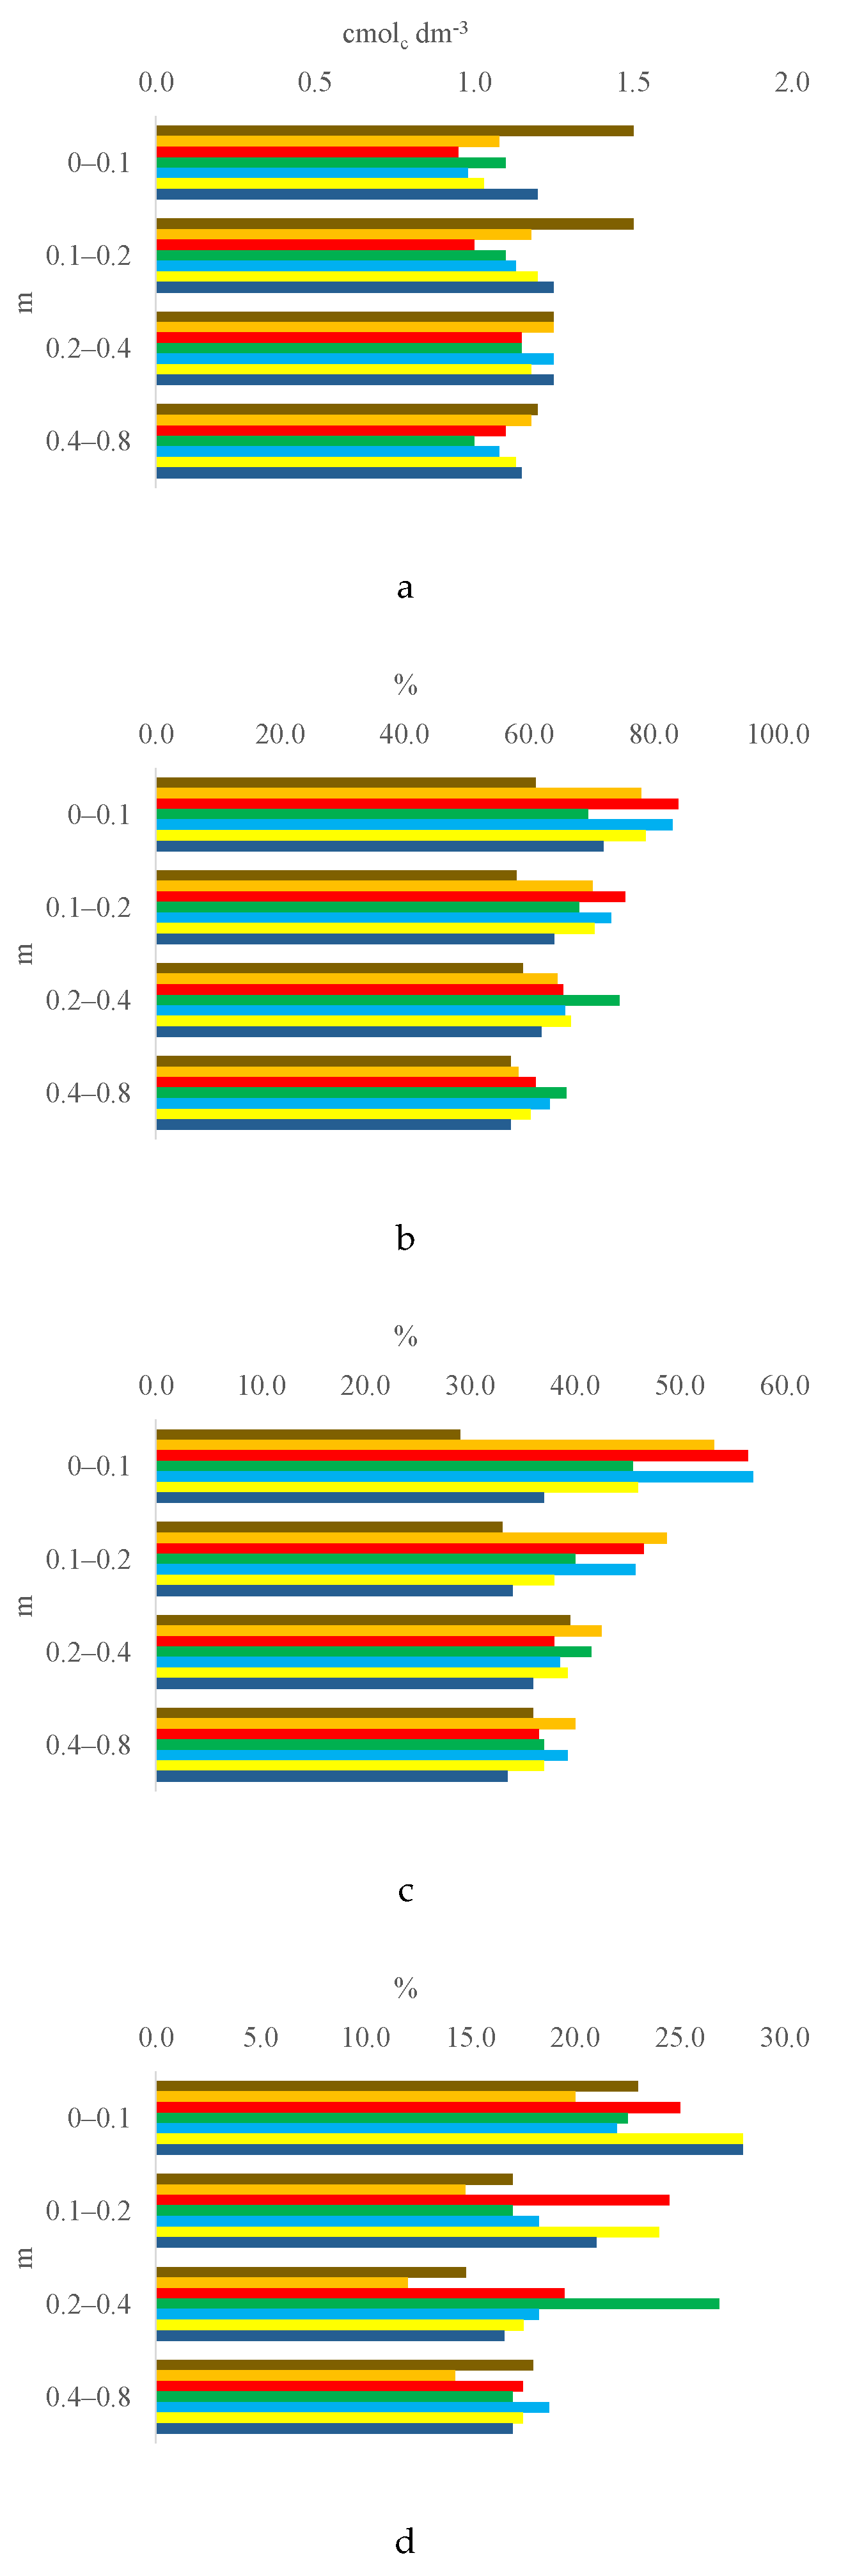
3.1. Soil Chemical Properties by Layer

Table 2 presents the characteristics of the surface (0.0–0.1 m) layer of soil. Total acidity decreased by 0.55–0.3 cmolc dm-3 in the treatments in which Ca compounds were applied (T2–T7). The differences between treatments in relation to soil S-SO42- content were in maximum of 1.5 mg dm-3. Treatment T2 increased K+/CEC by percentage-point increments of 2.65 over T3, and by 2.29 % over T4. Treatment T5 increased resin extractable P by 21.5 to 26 mg dm-3 compared with T1 (control), T3 and T4. Treatment T3 increased pH by 1.05, 0.42, 0.55, and 0.2 units over T1, T2, T4, and T7, respectively. Compared with T1, T4, and T7, T3 increased Ca2+ content by 2.3, 1.55, and 1.8 cmolc dm-3, respectively; BS by percentage-point increments of 23.0, 14.5, and 12.0, respectively; and CEC by 2.13, 1.98, and 1.68 cmolc dm-3, respectively. Compared with T1 and T4, T3 increased OM content by 3.0 and 4.0 g dm-3, respectively, and Mg2+ content by 0.6 and 0.55 cmolc dm-3, respectively. Compared with T1, T4, and T7, T5 increased Ca2+ content by 2.28, 1.53, and 1.78 0.55 cmolc dm-3, respectively; BS by percentage-point increments of 22.0, 13.5, and 11.0, respectively; CEC by 2.04, 1.89, and 1.59 cmolc dm-3, respectively; and Ca2+/CEC by percentage-point increments of 28.0, 11.5, and 20.0, respectively. Compared with T3 and T4, K+ content was 0.14 to 0.17 cmolc dm-3 higher in T5, T6, and T7. Soil Mg2+/CEC increased by percentage-point increments of 8.0 in T6 and T7 compared with T2. Treatments 2 through 7 decreased K+/CEC by percentage-point increments of 2.24 to 7.0 relative to T1 (control).
Table 3 presents the characteristics of the 0.1 to 0.2 m soil layer. In the T2 – T7 treatments, pH increased by 0.15–0.8 compared with T1. The total acidity was 0.25–0.5 cmolc dm-3 higher in T2 – T7 treatments compared with T1. The BS and Ca2+/CEC increased by percentage-point increments of 6.0–17.5 and 1.0–15.75 compared with T1, respectively. Treatment T3 increased Mg2+/CEC by percentage-point increments of 2.65 over T1. Treatment T5 increased P content by 11.0–16.25 mg dm-3 compared with T2, T4, T6, and T7; by 19.75 mg dm-3 compared with T3; and by 30.25 mg dm-3 compared with the control. Compared with T4, OM content and Mg2+ content were 2.5 g dm-3 and 0.4 cmolc dm-3 higher, respectively, in T3.
Table 4 presents the characteristics of the 0.2 to 0.4 m soil layer. The differences between treatments in relation to soil S-SO42- content were in maximum of 1.0 mg dm-3. In the T2 – T7 treatments, OM increased by 1.5–2.5 g dm-3 compared with T1. Treatment T4 increased Ca2+ content by 0.65 cmolc dm-3 and BS by percentage-point increments of 15.5 over T1. The Ca2+/ECEC was 8.49 and 10.11 percentage-point increments of in treatment T2 compared with T3 and T4 treatments. Treatment T4 increased Mg2+ content by 0.52–0.77 cmolc dm-3 and CEC by 0.75–1.43 cmolc dm-3 compared with the other treatments. In addition, T4 increased Mg2+/CEC by 8.59–14.85 percentage points compared with T1, T2, T5, T6, and T7. T6 and T7 increased P content by 12.0–14.75 mg dm-3 compared with T3 and T4. T2 increased K+ content by 0.21 cmolc dm-3 compared with the control and Ca2+/ECEC by 8.49–10.11 percentage points compared with T3 and T4. No significant differences (P > 0.05) in any soil chemical attributes were observed between the treatments with HL (T5, T6, and T7).
The characteristics of the 0.4 to 0.8 m soil layer are in Table 5. In the T2 – T7 treatments, P increased by 4.5–13.0 mg dm-3 compared with T1. Treatment T4 increased pH by 0.6 units; decreased total acidity by 0.2 cmolc dm-3; and increased BS by percentage-point increments of 9.0 over T1. Compared with the other treatments, T4 increased K+ content by 0.13–0.26 cmolc dm-3 and K+/CEC by percentage-point increments of 4.38–8.68. Treatments T3 and T4 increased K+ content by 0.08–0.21 cmolc dm-3 compared with T2.

3.2. Trends of Soil Characteristics by Layer and Treatment

Compared with T1, T2–T7 treatments decreased total acidity by 0.3–0.55 cmolc dm-3 in the surface layer (0.0–0.1 m) and by 0.25–0.5 cmolc dm-3 in the 0.1–0.2 m layer; The P content by 10.5–30.25 mg dm-3 in the 0.1–0.2 m layer, 10.0–24.75 mg dm-3 in the 0.2–0.4 m layer, and 4.5–13.0 mg dm-3 in the 0.4–0.8 m layer; and OM content by 1.5–2.5 g dm-3 in the 0.2–0.4 m layer and 1.0–2.0 g dm-3 in the 0.4–0.8 m layer. These results corroborate those of [52], who observed lasting benefits of liming for total acidity, P availability, and OM content for at least three years after application.
On average, compared with T1, T2–T7 treatments increased BS in the 0.0–0.1, 0.1–0.2 and 0.2–0.4 m layers; the pH in the 0.0–0.1 and 0.1–0.2 m layers; the K+ content in the 0.2–0.4 and 0.4–0.8 m layers; Ca2+ content and Ca2+/CEC in the 0.0–0.1 m layer; and K+/CEC in the 0.4–0.8 m layer.
In the surface layer, Ca2+/CEC was highest in T5; Mg2+/CEC was highest in T6 and T7 and lowest in T2; Mg2+ content was highest in T3; and Ca2+ content, pH, BS, and CEC were highest in T3 and T5. The Ca2+/CEC ranged by 29 (T1) to 57% (T5), however none of treatments provided 65% of Ca2+ in CEC.
In the 0.1–0.2 m layer, OM content was lowest in T4 and highest in T7; Mg2+ content was highest in T3 (as in the surface layer) and T6; BS was highest in T3 and T5 (as in the surface layer); Ca2+/CEC was highest in T2; and Mg2+/CEC was highest in T3 and lowest in T2 (as in the surface layer). The Ca2+/CEC ranged by 33 (T1) to 49% (T5), however, as in the surface layer, none of treatments provided 65% of Ca2+ in CEC.
In the 0.2–0.4 m layer, P content was highest in T6 and T7; K2+ content was highest in T2; and Ca2+ content and BS were highest in T4. Every treatments provided 50% of Ca2+ in ECEC. In the 0.4–0.8 m layer, pH, BS, and CEC were highest in T4, whereas total acidity was lowest in this treatment.

4. Discussion

This study confirms that the different methodologies for applying Ca compounds for surface and subsurface acidity correction had residual effects on soil chemical attributes at depths of 0.0 to 0.8 m in this agropastoral system. These findings are consistent with the results of prior studies in tropical no-till systems. Specifically, [52] observed that LS and PG amendment had long-term positive effects on P content in a tropical no-till intercropping system, and [53] observed residual effects of liming in a Brazilian Oxisol, including increased P content and reduced total acidity. In an annual crop system, [33] found a prolonged residual effect of PG that reduced total acidity in the subsurface layers of the soil. Similarly, [54] determined that total acidity in the 0.0–0.3 m layer was reduced two years after liming.
The PG application in the 2017-2018, 2018-2019, and 2019-2020 seasons was responsible for the increases in OM content, Ca2+ and Mg2+ contents, pH, BS, and CEC in the surface layer and in OM and Mg2+ contents in the 0.1–0.2 m layer in T3 compared with T4. Although PG does not directly affect soil pH, it increases P, Ca2+, S-SO42-, and CEC availability [52].
The increases in Mg2+ content, CEC, and Mg2+/CEC in the 0.2–0.4 m layer and K+ content and K+/CEC in the 0.4–0.8 m layer in T4 compared with the other treatments were due to the slow effect of LS. After LS application, there is a period of maximum reactivity in the soil, after which the residual effect gradually decreases [47]. The factors that influence the reaction time and residual effect of LS in the soil include the soil buffer power, degree of homogenization during LS incorporation [49], and LS particle size [47]. [56] observed that the reactivities of the particle size fractions assigned to LS by Brazilian law were only reached approximately 18 months after application. [57] observed increased Mg2+ content two years after the application of LS without PG.

4.1. Effects of the Treatments on pH and Total Acidity

Consistent with the results of this study, [54,58] observed residual effects of the surface application of LS and PG under no-till on pH, with increases in the 0.0–0.1 and 0.1–0.2 m layers. The combined application of LS and/or HL with PG provided better conditions for LS and/or HL to act on the soil solution and increase the pH, corroborating the results of [59]. Increased pH is the result of physical downward movement of fine LS particles through the continuous porosity in the soil profile formed after the decomposition of dead roots or by soil organisms; the formation of ionic pairs between NO3- or SO42- (released from fertilizer or mineralized OM) and Ca and Mg from the amendment; or the formation of water-soluble CaL0 or CaL- type complexes, which involving the incorporation of hydrophilic groups onto the ligand (L) such as sulfonated or charged substituents and then coordinating the metal ion, between plant residues on the soil surface (carboxylic and phenolic radicals) and Ca2+ or Mg2+ [54,60,61,62,63,64]. In addition, PG can indirectly increase soil pH in deeper layers as the S-SO42- from the PG displaces OH- from soil colloid surfaces into the soil solution [16]. In agropastoral systems under no tillage, low-molecular-weight organic acids, released during the decomposition of animal waste, mainly feces, or exuded by pasture residues [65], can increase the effects of surface application of LS and/or HL at greater depths by favoring the downward movement of Ca2+ and Mg2+ in the soil profile.
Although the incorporation of LS with plowing and harrowing (T3 and T4, conventional soil tillage) and the subsurface application of HL with a shank subsoiler-fertilizer (T6 and T7, minimum tillage) corrected total acidity in the 0.4–0.8 m layer in 2020 [20], residual effects of these treatments were not observed. Decreases in total acidity were observed only in the 0.0–0.1 and 0.1–0.2 m layers in T2–T7. The 10-10-10 fertilizer used in topdressing fertilization of palisade grass contained urea as the N source. Urea contains N-NH3 [25], which rapidly oxidizes to nitrate in the soil, releasing H+ [66]. This may be one reason for the lack of a decrease in total acidity (H+ + Al3+) in the 0.2–0.4 and 0.4–0.8 m layers in T2–T7. It is also possible that the decomposition of organic residues originating from soybean, maize and palisade grass acidified the soil, decreasing pH and increasing total acidity [67,68].
In T2, residual effects were not observed in the 0.4–0.8 m layer because the action of LS without incorporation is restricted to the surface layer in acidic soils (such as those in the Cerrado biome). In this treatment, PG was applied only in the first season (2017-2018 season), thus restricting the benefits of the combined application of LS with PG to the 2017-2020 seasons. [62,70,71,72,73,74] also found more pronounced positive effects of surface liming in the surface layers of the soil. The basic anions from the dissolution of LS (OH- and HCO3-) move by mass flow to the deeper layers of the soil, where they react with acidic cations (H+, Fe2+, Al3+, and Mn2+), preventing further alkalization reactions [75].

4.2. Effects of the Treatments on Base Saturation

T2–T7 had residual positive effects on BS in the 0.0–0.1, 0.1–0.2, and 0.2–0.4 m layers. The LS, PG, and HL applied in the 2017-2018, 2018-2019, and 2019-2020 seasons contained 42% CaO and 7% MgO; 17% CaO and 14% S (S-SO42-); and 40% CaO and 27% MgO, respectively. Reaction of Ca2+ in the soil solution with the soil exchange complex displaces K+ and Mg2+ into the soil solution, where these cations react with SO42- to form the neutral ionic pairs K2SO40 and MgSO40, which, along with CaSO40, have great mobility in the soil profile [35]. Ca2+, K+, and Mg2+ compete for some of the same adsorption sites in the soil [76].
Therefore, increasing Ca2+, K+, and Mg2+ contents in the soil profile also increases BS. This is very important in production systems under no tillage because increasing base saturation can reduce chemical impediments to root development and increase resistance to water deficits, which are common for maize and soybean crops [42].

4.3. Effects of the Treatments on P Content

[77] observed residual positive effects of PG application on P content and attributed these effects to the presence of P residue in PG itself. These residual effects can also be attributed to the formation of compounds between Ca and P due to the dissociation of compounds containing Ca and S in the presence of water, which releases Ca2+ and SO42- ions. Ca2+ subsequently reacts with P, reducing the solubility of P [78]. [16,79,80] also observed increases in P content in the surface layer after the application of high doses of PG.
As expected, P content in the 0.0–0.1 and 0.1–0.2 m layers increased under no-till (T5 and T2) compared with conventional soil tillage (T3 and T4) because the lack of soil turnover promotes nutrient accumulation in the surface layers [16,81]. [82,83] observed similar results and concluded that P adsorption capacity decreases as the soil concentration of P increases. In a study of soil management and residual effects of PG application on soil physical and chemical attributes in Brazil, [84] also determined that P content was higher under no-till than under conventional tillage, especially in the surface layer, and attributed this difference to the immobility of P in the soil. [85] reported greater enrichment of nutrients in the 0.0–0.05 m layer under no-till and found that this increase was greatest for P content, which was 4 –7 times higher than under conventional tillage.
The P content in surface layers is higher under no-till than under conventional tillage. Because P is not very mobile, concentrations of P are highest in the superficial soil layer. However, under no-till, the constant supply of organic material increased organic P in deeper layers, which increased the fertility of the soil after mineralization. [86,87,88,89,90] showed that a few years after the establishment of no-till, the chemical, physical and biological properties of the surface layer differ from those in an intensive tillage system that includes regular moldboard plowing with secondary tillage.

4.4. Effects of the Treatments on K+ Content and K+/CEC

The increases in K+ content and K+/CEC in the surface layer in the control were the result of K fertilization in the 2017-2018, 2018-2019, and 2019-2020 seasons. K+ was probably adsorbed by soil colloids in the surface layer, as observed by [25]. By contrast, the dry matter yield of palisade grass forage in T2 in the 2019-2020 of 4,967 kg ha-1 higher than T1 (as shown in 45), provided the increase in K+ content by 0.21 cmolc dm-3 in the 0.2–0.4 m layer. This occurred due K is the most abundant cation in plant tissues, being absorbed from the soil solution in large quantities by the roots in the form of the K+ ion [91]. In addition, K is required in large quantities by crops, equaling the amounts of N required, and being three or four times more accumulated in residues than P [92]. As shown in [45], the leaf contents of K, N, and P in the forage sample were 22.46; 14.07; and 3.18 g kg-1 in T2 and 21.01; 12.92; and 2.63 in T1. As cited by [93], forage grasses, as palisade grass, have a very extensive and constantly renewed root system, which, combined with their high dry matter production potential, are capable of altering soil OM and nutrient levels in a short period of time. [94], in an sandy Oxisol in Votuporanga, São Paulo State, Brazil, verify an average increase in K+ content by 0.23 cmolc dm-3 with Congo grass used as cover crop after two seasons. Cover crops, as palisade grass, can restore considerable amounts of nutrients to crops, since these plants absorb nutrients from the subsurface layers of the soil and subsequently release them into the surface layer through the decomposition of their residues [95].
In T2–T7, Ca compounds were applied in these three seasons, resulting in downward movement of K+ from the surface layer to the 0.2–0.4 and 0.4–0.8 m layers. Consistent with these observations, [54] observed downward movement of LS and increased BS at depths of 0.3 m for two years after LS application on the soil surface. In addition, due to the thermodynamics of ion exchange and the properties of Ca2+, PG can potentially increase leaching losses of Mg2+ and K+ to deep layers [31,96]. The CaSO4 in PG reduces Al3+ activity, decreasing subsurface acidity effects and redistributing basic cations such as Mg2+ and K+ from the surface to subsurface layers [37,39,40]. This decrease in subsurface acidity and redistribution of basic cations facilitate expansion of the root system, improving access to water and nutrients in deeper layers of the soil [78]. In sandy soil, as used in this study, these effects are very important, especially in years with dry periods.
The increase in K+/CEC in the surface layer in T2 compared to T3 and T4 may reflect greater K+ cycling due to the higher dry matter yield of palisade grass forage in T2 in the 2019-2020 season. Forage dry matter yield was 2,222 and 5,087 kg ha-1 higher in T2 than in T3 and T4, respectively (as shown in [45]). K+ cycling in T2 may also have been enhanced by the lack of soil tillage (no-till) and the high average straw dry matter of maize and Congo grass present in the surface in the 2017-2018 season (9,550 kg ha-1).

4.5. Effects of the Treatments on Ca2+ Content and Ca2+/CEC

The residual positive effects of Ca compounds on Ca2+ content and Ca2+/CEC were restricted to the surface layer, consistent with the results of a previous study of the long-term effects of PG and LS application under no-till [58]. This restriction is due to the greater ionic radius of Ca (compared with Mg and K) and its lower mobility in the soil profile [18]. There is competition between Mg2+ and Ca2+ for negative charges in the soil, with preference for Ca2+ at exchange sites [97].

4.6. Effects of the Treatments on Mg2+ Content and Mg2+/CEC

The application of Ca compounds increased Mg2+ content in the subsurface layer. A high concentration of Ca2+ in the soil favors the displacement of Mg2+ from exchange sites. The displaced Mg2+ can form an ion pair with SO42- or be leached in the form of Mg2+ ions, which is the preferred form of displacement in the profile [98]. [30] observed similar effects and concluded that PG application favors cation exchange after adjustment of the acidity of the surface layers with LS. PG affects the distribution of not only S-SO42- and Ca2+ but also other nutrients in the soil, especially when applied at high doses, promoting greater movement of Mg2+ to subsurface layers [99]. The supply of Ca2+ by PG solubilization promotes the substitution of Mg2+ from the exchange complex to the soil solution and the formation of the ionic pair MgSO40. This ionic pair is more easily leached in the soil by water infiltration, promoting the movement of Mg2+ in the soil profile [4,30,31].

4.7. Effects of the Treatments on Organic Matter Content

The increases in OM content in the subsurface layer in T2-T7 were due to the residual positive effects of Ca compounds on fertility throughout the soil profile, which included increases in P and K+ contents, BS, and K+/CEC. These improvements were reflected in the dry matter yield of palisade grass forage, which increased by 867–4967 kg ha-1 in the 2019-2020 season (as shown in [45]). Similarly, [100] reported long-term positive effects of PG on black oat biomass 44 and 55 months after the application of the last third of the PG rate. [99] also found a residual positive effect of PG on soil chemical properties and the root dry mass density of sugarcane throughout the soil profile (0.0–2.0 m). The oldest stems and stalks of palisade grass forage have high C/N ratios and high levels of lignin and polyphenols, which results in slow decomposition [101] and favors increases in OM throughout the soil profile [102]. The root system of palisade grass forage also contributed to the increase in OM content in the subsurface layers. The effects of PG in the soil solution occur through the hydrolysis of CaSO4 (calcium sulfate) to Ca2+ + SO42- + CaSO40 [77]. The Ca2+ ions react with the soil exchange complex and displace Al3+, K+ and Mg2+ to the soil solution, where they react with sulfate (SO42-) to form the AlSO4+ complex (a form of Al that is less toxic to plants) and the neutral ionic pairs K2SO40, MgSO40 and CaSO40, which have high mobility [103]. These ionic pairs move to deeper layers, improving the soil profile, crop root system development, water absorption through plant roots [38,104], and, ultimately, crop yields [105].
In a study of annual crops under no-till, [58] observed reduced Al3+ saturation and increased Ca2+ content 36 and 72 months after PG application, along with increases in maize and soybean yields. In a clayey, kaolinitic, thermic Rhodic Hapludox, [79] observed increases in maize grain yields of 7% 7–10 years after LS and PG were applied to the surface or 8% 7–10 years after LS was incorporated into the topsoil and PG was applied to the surface. These increases reflected the residual positive effects of Ca compounds in OM content and fertility throughout the soil profile. [52] also observed lasting improvements in soil chemical attributes at least three years after liming, including increases in P, Ca2+, Mg2+, and OM contents and consequently CEC and BS. Eight years after three applications of soil amendments, [29] determined that surface liming increased OM content by promoting aboveground and root biomass. [54] observed increases in Ca2+ and Mg2+ contents, pH, and BS and a decrease in total acidity in the 0.0–0.3 m layer two years after liming. The residual effects of liming observed by [53] included increases in Ca2+ and Mg2+ contents, pH, BS, and CEC and a decrease in total acidity.

4.8. Considerations

Several studies have reported limitations of surface application of LS in systems without soil tillage (no-tillage) [18,19,20]. The low mobility of the products of LS dissolution restricts the efficiency of this soil liming agent in reducing acidity in subsurface layers of the soil and results in variable loads, also known as pH-dependent loads and characteristics of highly weathered soils common in tropical regions such as Brazil, that depend on the leaching of organic and/or inorganic ion pairs deeper in the soil [19]. To contribute to methods for ameliorating surface and subsurface acidity and improving soil chemical fertility in agropastoral systems under no-till, we established this study of different application methodologies (surface, incorporation by soil tillage, or subsurface) for Ca compounds (LS, PG, and HL) during the 2017-2020 seasons. In contrast to our expectations, the improvements in soil chemical attributes throughout the soil profile (0.0–0.8 m) after the incorporation of LS and subsurface application of HL in the 2017-2018 season did not persist in subsequent seasons. The surface application of LS and HL reduces energy (fuel) costs compared with application under tillage [106]. Because the positive effects of applying LS plus PG and applying HL plus PG on soil fertility in the 0.0–0.2 m layer were maintained, T2 and T5 are good options for correcting soil acidity in agropastoral system. These two treatments also increased P content in the 0.1–0.8 m layer and OM content in the 0.2–0.8 m layer, which may promote crop root system development and plant water and nutrient absorption, thereby reducing the adverse effects of drought, improving crop tolerance to water stress, and increasing crop yields, especially in the Cerrado biome. Evaluations of the long-term effects of different methodologies for mitigating soil acidity are therefore encouraged.

5. Conclusions

The present study evaluated the residual effects of different methodologies for applying Ca compounds in an agropastoral system in an Ultisol with sandy texture two seasons after the last application. The correction of surface acidity (0.0–0.2 m) through increased pH and base saturation and reduced total acidity persisted, but the previously observed improvement of acidity in the 0.4–0.8 m layer after the incorporation of LS and subsurface application of HL in the 2017-2018 season did not. In addition, in the 0.0–0.2 m layer, the positive effects of applying LS plus PG on Ca2+ content and Ca2+/CEC and applying HL plus PG on Mg2+ content and Mg2+/CEC were maintained, but the positive effects of these amendments on S-SO4 content throughout the soil profile (0.0–0.8 m) were not. Finally, residual positive effects of Ca compound application on P content in the 0.1–0.8 m layer and OM content in the 0.2–0.8 m layer were observed. These results demonstrate that Ca compound application can promote improvements in root development, especially in deep layers, and crop development. Because increasing the soil contents of Ca and P enables greater root exploration in deeper layers, the present findings have implications for the adoption of practices that minimize water stress in plants.

Supplementary Materials

The following supporting information can be downloaded at the website of this paper posted on Preprints.org. Figure S1: Details of the experimental area; Figure S2: Details of treatments; Table S1: Treatment schedule in the 2017-2018 season; Table S2: Treatment schedule in the 2018-2019 season; Table S3: Treatment schedule in the 2019-2023 season; Table S4: Initial soil chemical characteristics by soil layer, 2017.

Author Contributions

Conceptualization, W.B., M.A. and J.H.; methodology, W.B., M.A. and J.H.; formal analysis, M.A.; investigation, W.B., L.C., D.O., J.B. and L.S.; writing—original draft preparation, W.B. and M.A.; project administration, W.B. and J.H. All authors have read and agreed to the published version of the manuscript.

Funding

This research was funded by Votorantim Cimentos−ViterAgro and Agronelli Indústria e Comércio de Insumos Agropecuários Ltda by the Fundação de Apoio à Pesquisa Agrícola - FUNDAG, grant number 6467.

Data Availability Statement

Data are contained within the article.

Acknowledgments

We are grateful to staff of Centro Avançado de Pesquisa e Desenvolvimento de Seringueira e Sistemas Agroflorestais for support for this research, and to Dawn M. Schmidt, PhD, ELS for English editing.

Conflicts of Interest

The authors declare no conflicts of interest.

Abbreviations

The following abbreviations are used in this manuscript:
BS Base saturation
HL Hydrated lime
LS Limestone
LSD Least significant difference
MaxRH Maximum relative humidity
MaxT Maximum temperature
MinRH Minimum relative humidity
MinT Minimum temperature
OM Organic matter
PG Phosphogypsum
R Rainfall

References

  1. Kopittke, P.M.; Menzies, N.W.; Wang, P.; McKenna, B.A.; Lombi, E. Soil and theintensification of agriculture for global food security. Environ. Int. 2019, 132, 105078. [Google Scholar] [CrossRef]
  2. Gibbons, J.M.; Williamson, J.C.; Williams, A.P.; Withers, P.J.; Hockley, N.; Harris, I.M.; Hughes, J.W.; Taylor, R.L.; Jones, D.L.; Healey, J.R. Sustainable nutrient management at field, farm and regional level: Soil testing, nutrient budgets and the trade-off between lime application and greenhouse gas emissions. Agric. Ecosyst. Environ. 2014, 188, 48–56. [Google Scholar] [CrossRef]
  3. Holland, J.E.; Bennett, A.E.; Newton, A.C.; White, P.J.; McKenzie, B.M.; George, T.S.; Pakeman, R.J.; Bailey, J.S.; Fornara, D.A.; Hayes, R.C. Liming impacts on soils, crops and biodiversity in the UK: a review. Sci. Total Environ. 2018, 610, 316–332. [Google Scholar] [CrossRef]
  4. Souza, M.P.; Lopes, E.C.P.; Umburanas, R.C.; Koszalka, V.; Marcolina, E.; Ávila, F.W.; Müller, M.M.L. Long-term gypsum and top-dress nitrogen rates on black oat forage yield after maize in no-till. J. Soil Sci. Plant Nutr. 2022, 22, 3448–3462. [Google Scholar] [CrossRef]
  5. Pariz, C.M.; Costa, C.; Crusciol, C.A.C.; Castilhos, A.M.; Meirelles, P.R.L.; Roça, R.O.; Pinheiro, R.S.B.; Kuwahara, F.A.; Martello, J.M.; Cavasano, F.A.; Yasuoka, J.I.; Sarto, J.R.W.; Melo, V.F.P.; Franzluebbers, A.J. Lamb production responses to grass grazing in a companion crop system with corn silage and oversowing of yellow oat in a tropical region. Agric. Syst. 2017, 151, 1–11. [Google Scholar] [CrossRef]
  6. Kim, N.; Zabaloy, M.C.; Guan, K.; Villamil, M.B. Do cover crops benefit soil microbiome? A meta-analysis of current research. Soil Biol. Biochem. 2020, 142, 107701. [Google Scholar] [CrossRef]
  7. Malavolta, E. Manual de nutrição mineral de plantas; Ceres: São Paulo, Brasil, 2006. (In Portuguese) [Google Scholar]
  8. Caires, E.F.; Garbuio, F.J.; Churka, S.; Barth, G.; Corrêa, J.C.L. Effects of soil acidity amelioration by surface liming on no-till corn, soybean, and wheat root growth and yield. Eur. J. Agron. 2008, 28, 57–64. [Google Scholar] [CrossRef]
  9. Fageria, N.K. Efeito da calagem na produção de arroz, feijão, milho e soja em solo de cerrado. Pesq. Agropec. Bras. 2001, 36, 1419–1424. (In Portuguese) [Google Scholar] [CrossRef]
  10. Allen, V.G.; Baker, M.T.; Segarra, E.; Brown, C.P. Integrated irrigated crop–livestock systems in dry climates. Agron. J. 2007, 99, 346−360. [Google Scholar] [CrossRef]
  11. Caires, E.F.; Joris, H.A.W.; Churka, S. Long-term effects of lime and gypsum additions on no-till corn and soybean yield and soil chemical properties in southern Brazil. Soil Use Manag. 2010, 27, 45–53. [Google Scholar] [CrossRef]
  12. van Raij, B. Fertilidade do solo e manejo de nutrients; International Plant Nutrition Institute: Piracicaba, Brasil, 2011. (In Portuguese) [Google Scholar]
  13. Crusciol, C.A.C.; Marques, R.R.; Carmeis Filho, A.C.A.; Soratto, R.P.; Costa, C.H.M.; Ferrari Neto, J.; Castro, G.S.A.; Pariz, C.M.; Castilhos, A.M.; Franzluebbers, A.J. Lime and gypsum combination improves crop and forage yields and estimated meat production and revenue in a variable charge tropical soil. Nutr. Cycling Agroecosyst. 2019, 115, 1–26. [Google Scholar] [CrossRef]
  14. Almeida, H.J.; Cruz, F.J.R.; Pancelli, M.A.; Flores, R.A.; Vasconcelos, R.L.; Prado, R.M. Decreased potassium fertilization in sugarcane ratoons grown under straw in different soils. Aust. J. Crop Sci. 2015, 9, 596−604. [Google Scholar]
  15. Farina, M.P.W.; Channon, P. Acid-subsoil amelioration: II. Gypsum effects on growth and subsoil chemical properties. Soil Sci. Soc. Am. J. 1988, 52, 175–180. [Google Scholar] [CrossRef]
  16. Caires, E.F.; Blum, J.; Barth, G.; Garbuio, F.J.; Kusman, M.T. Alterações químicas do solo e resposta da soja ao calcário e gesso aplicados na implantação do sistema de plantio direto. Rev. Bras. Cienc. Solo 2003, 27, 275–286. (In Portuguese) [Google Scholar] [CrossRef]
  17. Ritchey, K.D.; Silva, S.E.; Costa, V.F. Calcium deficiency in clayey B horizons of savannah oxisols. Soil Sci. 1982, 133, 378–382. [Google Scholar] [CrossRef]
  18. Caires, E.F.; Kusman, M.T.; Barth, G.; Garbuio, F.J.; Padilha, J.M. Alterações químicas do solo e resposta do milho à calagem e aplicação de gesso. Rev. Bras. Cienc. Solo 2004, 28, 125−136. (In Portuguese) [Google Scholar] [CrossRef]
  19. Caires, E.F.; Barth, G.; Garbuio, F.J. Lime application in the establishment of a no-till system for grain crop production in Southern Brazil. Soil Tillage Res. 2006, 89, 3−12. [Google Scholar] [CrossRef]
  20. Borges, W.L.B.; Hipolito, J.L.; Souza, I.M.D.; Juliano, P.H.G.; Rodrigues, L.N.F.; Andreotti, M. Methodologies for Applying Calcium Compounds in Agropastoral Systems: Changes in Soil Chemical Attributes. Agron. J. 2022, 114, 771–783. [Google Scholar] [CrossRef]
  21. Gascho, G.J.; Parker, M.B. Long-term liming effects on Coastal Plain soils and crops. Agron. J. 2001, 93, 1305–1315. [Google Scholar] [CrossRef]
  22. Conyers, M.K.; Heenan, D.P.; McGhie, W.J.; Poile, G.P. Amelioration of acidity with time by limestone under contrasting tillage. Soil Tillage Res. 2003, 72, 85–94. [Google Scholar] [CrossRef]
  23. Tang, C.; Rengel, Z.; Diatloff, E.; Gazey, C.R. Responses of wheat and barley to liming on a sandy soil with subsoil acidity. Field Crops Res. 2003, 80, 235–244. [Google Scholar] [CrossRef]
  24. Churka Blum, S.; Caires, E.F.; Alleoni, L.R.F. Lime and phosphogypsum application and sulfate retention in subtropical soils under no-till system. J. Soil Sci. Plant Nutr. 2013, 13, 279–300. [Google Scholar] [CrossRef]
  25. Carvalho, M.C.S.; Nascente, A.S. Limestone and phosphogypsum effects on soil fertility, soybean leaf nutrition and yield. Afr. J. Agric. 2014, 9, 1366–1383. [Google Scholar] [CrossRef]
  26. Soratto, R.P.; Crusciol, C.A.C. Dolomite and phosphogypsum surface application effects on annual crops nutrition and yield. Agron. J. 2008, 100, 261–270. [Google Scholar] [CrossRef]
  27. Crusciol, C.A C.; Artigiani, A.C.C.A.; Arf, O.; Carmeis Filho, A.C.A.; Soratto, R.P.; Nascente, A.S.; Alvarez, R.C.F. Surface application of lime–silicate–phosphogypsum mixtures for improving tropical soil properties and irrigated common bean yield. Soil Sci. Soc. Am. J. 2016, 80, 1–13. [Google Scholar] [CrossRef]
  28. Inagaki, T.M.; Sá, J.C.M.; Caires, E.F.; Gonçalves, D.R.P. Lime and gypsum application increase biological activity, carbon pools, and agronomic productivity in highly weathered soil. Agric. Ecosyst. Environ. 2016, 231, 156–165. [Google Scholar] [CrossRef]
  29. Carmeis Filho, A.C.; Penn, C.J.; Crusciol, C.A.; Calonego, J.C. Lime and phosphogypsum impacts on soil organic matter pools in a tropical Oxisol under long-term no-till conditions. Agric. Ecosyst. Environ. 2017, 241, 11–23. [Google Scholar] [CrossRef]
  30. Araújo, L.G.; Figueiredo, C.C.; Sousa, D.M.G.; Nunes, R.S.; Rein, T.A. Influence of gypsum application on sugarcane yield and soil chemical properties in the Brazilian Cerrado. Aust. J. Crop Sci. 2016, 10, 1557−1563. [Google Scholar] [CrossRef]
  31. Zoca, S.M.; Penn, C. An important tool with no instruction manual: A review of gypsum use in agriculture. Adv. Agron. 2017, 144, 1–44. [Google Scholar] [CrossRef]
  32. Sumner, M.E. Amelioration of subsoil acidity with minimum disturbance. In Subsoil management techniques; Jayawardane, N.S., Stewart, B.A., Eds.; Lewis Publishers: Boca Raton, United States of America, 1995; pp. 147–185. [Google Scholar]
  33. Souza, F.R.; Rosa Junior, E.J.; Fietz, C.R.; Bergamin, A.C.; Rosa, Y.B.C.J.; Zeviani, W.M. Efeito do gesso nas propriedades químicas do solo sob dois sistemas de manejo; Semina: Cien. Agrar, 2012; Volume 33, pp. 1717–786 1732, (In Portuguese). [Google Scholar] [CrossRef]
  34. Dalla Nora, D.; Amado, T.J.C. Improvement in chemical attributes of Oxisol subsoil and crop yields under no-till. Agron. J. 2013, 105, 1393–1403. [Google Scholar] [CrossRef]
  35. Pavan, M.A.; Bingham, F.T.; Pratt, P.F. Redistribution of exchangeable calcium, magnesium and aluminum following lime and gypsum applications to a Brazilian Oxisol. Soil Sci. Soc. Am. J. 1984, 48, 33–38. [Google Scholar] [CrossRef]
  36. Ritchey, K.D.; Souza, D.M.G.; Lobato, E.; Correa, O. Calcium leaching to increase rooting depth in a Brazilian savannah Oxisol. Agron. J. 1980, 72, 40–45. [Google Scholar] [CrossRef]
  37. Caires, E.F.; Zardo Filho, R.; Barth, G.; Joris, H.A.W. Optimizing nitrogen use efficiency for no-till corn production by improving root growth and capturing NO3-N in subsoil. Pedosphere 2016, 26, 474–485. [Google Scholar] [CrossRef]
  38. Rosolem, C.A.; Ritz, K.; Cantarella, H.; Galdos, M.V.; Hawkesford, M.J.; Whalley, W.R.; Mooney, S.J. Enhanced plant rooting and crop system management for improved N use efficiency. Adv. Agron. 2017, 146, 205–239. [Google Scholar] [CrossRef]
  39. Vicensi, M.; Lopes, C.; Koszalka, V.; Umburanas, R.C.; Kawakami, J.; Pott, C.A.; Müller, M.M.L. Gypsum rates and splitting under no-till: soil fertility, corn performance, accumulated yield and profits. J. Soil Sci. Plant Nutr. 2020, 20, 690–702. [Google Scholar] [CrossRef]
  40. Vicensi, M.; Lopes, C.; Koszalka, V.; Umburanas, R.C.; Vidigal, J.C.B.; Ávila, F.W.; Müller, M. M. L. Soil fertility, root and aboveground growth of black oat under gypsum and urea rates in no till. J. Soil Sci. Plant Nutr. 2020, 20, 1271–1286. [Google Scholar] [CrossRef]
  41. Sumner, M.E.; Shahandeh, H.; Bouton, J.; Hammel, J. Amelioration of an acid soil prolife through deep liming an surface application of gypsum. Soil Sci. Soc. Am. J. 1986, 50, 1254–1278. [Google Scholar] [CrossRef]
  42. Zandoná, R.R.; Beutler, A.N.; Burg, G.M.; Barreto, C.F.; Schmidt, M.R. Gesso e calcário aumentam a produtividade e amenizam o efeito do déficit hídrico em milho e soja. Pesq. Agropec. Trop. 2015, 45, 128–137. (In Portuguese) [Google Scholar] [CrossRef]
  43. Primavesi, A.C.; Primavesi, O. Características de corretivos agrícolas; Embrapa Pecuária Sudeste: São Carlos, Brasil, 2004. (Documentos, 37). (In Portuguese) [Google Scholar]
  44. Alcarde, J.C. Corretivos da acidez dos solos: características e interpretações técnicas; Associação Nacional para Difusão de Adubos: São Paulo, Brasil, 2005. (Boletim Técnico, 6). (In Portuguese) [Google Scholar]
  45. Borges, W.L.B.; Hipolito, J.L.; Tokuda, F.S.; Gasparino, A.C.; Freitas, R.S.; Andreotti, M. Methodologies for the application of calcium compounds in agropastoral systems: Effects on crop yields. Agron. J. 2021, 113, 5527–5540. [Google Scholar] [CrossRef]
  46. Soil Survey Staff. Keys to soil taxonomy, 12th ed.; USDA Natural Resources Conservation Service: Lincoln, United States of America, 2014. [Google Scholar]
  47. Centro Integrado de Informações Agrometeorológicas - CIIAGRO. Resenha: Votuporanga no período de 01/11/2017 até 31/12/2022. Available online: http://www.ciiagro.sp.gov.br/ciiagroonline/Listagens/Resenha/LResenhaLocal.asp (accessed on 18 May 2023).
  48. Caires, E.F.; Guimarães, A.M. A novel phosphogypsum application recommendation method under continuous no-till management in Brazil. Agron. J. 2018, 110, 1–9. [Google Scholar] [CrossRef]
  49. van Raij, B.; Cantarella, H.; Quaggio, J.A.; Furlani, A.M.C. (Eds.) Recomendação de adubação e calagem para o Estado de São Paulo; Instituto Agronômico: Campinas, Brasil, 1996. (In Portuguese) [Google Scholar]
  50. van Raij, B.; Andrade, J.C.; Cantarella, H.; Quaggio, J.A. (Eds.) Análise química para avaliação da fertilidade do solo; Instituto Agronômico: Campinas, Brasil, 2001. (In Portuguese) [Google Scholar]
  51. Silva, F.A.S.; Azevedo, C.A.V. The Assistat Software Version 7.7 and its use in the analysis of experimental data. Afr. J. Agric. Res. 2016, 11, 3733–3740. [Google Scholar] [CrossRef]
  52. Bossolani, J.W.; Crusciol, C.A.C.; Merloti, L.F.; Moretti, L.G.; Costa, N.R.; Tsai, S.M.; Kuramae, E.E. Long-term lime and gypsum amendment increase nitrogen fixation and decrease nitrification and denitrification gene abundances in the rhizosphere and soil in a tropical no-till intercropping system. Geoderma 2020, 375, 114476. [Google Scholar] [CrossRef]
  53. Politi, L.S. Efeito residual do calcário no solo, no estado nutricional e na produtividade da mangueira cv. Palmer. Dissertation, Universidade Estadual Paulista, Jaboticabal, Brasil, 2012. (In Portuguese). [Google Scholar]
  54. Marcelo, A.V.; Corá, J.E.; La Scala Junior, N. Influence of liming on residual soil respiration and chemical properties in a tropical no-tillage system. Rev. Bras. Cienc. Solo 2012, 36, 45–50. [Google Scholar] [CrossRef]
  55. Weirich Neto, P.H.; Caires, E.F.; Justino, A.; Dias, J. Correção da acidez do solo em função de modos de incorporação de calcário. Cienc. Rural 2000, 30, 257–261. (In Portuguese) [Google Scholar] [CrossRef]
  56. Natale, W.; Coutinho, E.L.M. Avaliação da eficiência agronômica de frações granulométricas de um calcário dolomítico. Rev. Bras. Cienc. Solo 1994, 18, 55–62. (In Portuguese) [Google Scholar]
  57. Camas-Pereyra, R.; Camas-Gómez, R.; Ramírez-Valverde, G.; Padilla-Cuevas, J.; Etchevers, J.D. Effect of gypsum and potassium on corn yield and on the exchangeable bases of an acid soil in La Frailesca, Chiapas. Agro Productividad 2022, 15, 11–20. [Google Scholar] [CrossRef]
  58. Pauletti, V.; Pierri, L.; Ranzan, T.; Barth, G.; Motta, A.C.V. Efeitos em longo prazo da aplicação de gesso e calcário no sistema de plantio direto. Rev. Bras. Cienc. Solo 2014, 38, 495–505. [Google Scholar] [CrossRef]
  59. Ferreira, A.O.; Amado, T.J.C.; Dalla Nora, D.; Keller, C.; Bortolotto, R.P. Mudança no conteúdo de carbono en calcio em latossolo melhorado por gesso e calcário no Rio Grande Do Sul. Cienc. Suelo 2013, 31, 1–13. (In Portuguese) [Google Scholar]
  60. Oliveira, E.L.; Pavan, M.A. Control of soil acidity in no-tillage system for soybean production. Soil Tillage Res. 1996, 38, 47–57. [Google Scholar] [CrossRef]
  61. Franchini, J.C.; Meda, A.R.; Cassiolato, M.E.; Miyazawa, M.; Pavan, M.A. Potencial de extratos de resíduos vegetais na mobilização do calcário no solo por métodos biológicos. Sci. Agric. 2001, 58, 357–360. (In Portuguese) [Google Scholar] [CrossRef]
  62. Petrere, C.; Anghinoni, I. Alteração de atributos químicos no perfil do solo pela calagem superficial em campo nativo. Rev. Bras. Cienc. Solo 2001, 25, 885–895. (In Portuguese) [Google Scholar] [CrossRef]
  63. Mello, J.C.A.; Villas Bôas, R.L.; Lima, E.V.; Crusciol, C.A.C.; Büll, L.T. Alterações nos atributos químicos de um Latossolo distroférrico decorrentes da granulometria e doses de calcário em sistemas de plantio direto e convencional. Rev. Bras. Cienc. Solo 2003, 27, 553–561. (In Portuguese) [Google Scholar] [CrossRef]
  64. Foloni, J.S.S.; Rosolem, C.A. Efeito da calagem e sulfato de amônio no algodão: I - Transporte de cátions e ânions no solo. Rev. Bras. Cienc. Solo 2006, 30, 425–432. (In Portuguese) [Google Scholar] [CrossRef]
  65. Flores, J.P.C.; Cassol, L.C.; Anghinoni, I.; Carvalho, P.C.F. Atributos químicos do solo em função da aplicação superficial de calcário em sistema de integração lavoura-pecuária submetido a pressões de pastejo em plantio direto. Rev. Bras. Cienc. Solo 2008, 32, 2385–2396. (In Portuguese) [Google Scholar] [CrossRef]
  66. Fageria, N.K.; Baligar, V.C.; Jones, C.A. Growth and mineral nutrition of field crops; CRC Press: Boca Raton, United States of America, 2011. [Google Scholar]
  67. Butterly, C.R.; Baldock, J.A.; Tang, C. The contribution of crop residues to changes in soil pH under field conditions. Plant Soil 2013, 366, 185–198. [Google Scholar] [CrossRef]
  68. Borges, W.L.B.; Andreotti, M.; Cruz, L.C.P.; Oliveira, D.Y.O.; Borges, J.F.; Silva, L. C. Changes in soil chemical attributes in an agrosilvopastoral system six years after thinning of eucalyptus. Plants 2024, 13, 3050. [Google Scholar] [CrossRef] [PubMed]
  69. Caires, E.F.; Chueiri, W.A.; Madruga, E.F.; Figueiredo, A. Alterações de características químicas do solo e resposta da soja ao calcário e gesso aplicados na superfície em sistema de cultivo sem preparo de solo. Rev. Bras. Cienc. Solo 1998, 22, 27–34. (In Portuguese) [Google Scholar] [CrossRef]
  70. Caires, E.F.; Fonseca, A.F.; Mendes, J.; Chueiri, W.A.; Madruga, E. F. Produção de milho, trigo e soja em função das alterações das características químicas do solo pela aplicação de calcário e gesso na superfície, em sistema plantio direto. Rev. Bras. Cienc. Solo 1999, 23, 315–327. (In Portuguese) [Google Scholar] [CrossRef]
  71. Pöttker, D.; Ben, J.R. Calagem para uma rotação de culturas no sistema plantio direto. Rev. Bras. Cienc. Solo 1998, 22, 675–684. (In Portuguese) [Google Scholar] [CrossRef]
  72. Rheinheimer, D.S.; Santos, E.J.S.; Kaminski, J.; Bortoluzzi, E.C.; Gatiboni, L. C. Alterações de atributos do solo pela calagem superficial e incorporada a partir de pastagem natural. Rev. Bras. Cienc. Solo 2000, 24, 797–805. (In Portuguese) [Google Scholar] [CrossRef]
  73. Moreira, S.G.; Kiehl, J.C.; Prochnow, L.I.; Pauletti, V. Calagem em sistema de semeadura direta e efeitos sobre a acidez do solo, disponibilidade de nutrientes e produtividade de milho e soja. Rev. Bras. Cienc. Solo 2001, 25, 71–81. (In Portuguese) [Google Scholar] [CrossRef]
  74. Ciotta, M.N.; Bayer, C.; Ernani, P.R.; Fontoura, S.M.V.; Albuquerque, J.A.; Wobeto, C. Acidificação de um Latossolo sob plantio direto. Rev. Bras. Cienc. Solo 2002, 26, 1055–1064. (In Portuguese) [Google Scholar] [CrossRef]
  75. Miyazawa, M.; Pavan, M.A.; Franchini, J.C. Evaluation of plant residues on the mobility of surface applied lime. Braz. Arch. Biol. Technol. 2002, 45, 251–256. [Google Scholar] [CrossRef]
  76. Liebhardt, W.C. The basic cation saturation ratio concept and lime and potassium recommendations an Delaware's Coastal Plain soils. Soil Sci. Soc. Am. J. 1981, 45, 544–549. [Google Scholar] [CrossRef]
  77. Salgado, A.A.B.B. Efeito residual da aplicação de gesso na eficiência da adubação fosfatada para a sucessão trigo-soja em sistema plantio direto; Dissertation, Universidade Estadual de Ponta Grossa: Ponta Grossa, Brasil, 2017. (In Portuguese) [Google Scholar]
  78. Souza, M.A.S.; Faquin, V.; Guelfi, D.R.; Oliveira, G.C.; Bastos, C.E.A. Acúmulo de macronutrientes na soja influenciado pelo cultivo prévio do capim-marandu, correção e compactação do solo. Rev. Cienc. Agron. 2012, 43, 611–622. [Google Scholar] [CrossRef]
  79. Caires, E.F.; Joris, H.A.W.; Churka, S. Long-term effects of lime and gypsum additions on no-till corn and soybean yield and soil chemical properties in southern Brazil. Soil Use Manag. 2011, 27, 45–53. [Google Scholar] [CrossRef]
  80. Caires, E.F.; Maschietto, E.H.G.; Garbuio, F.J.; Churka, S.; Joris, H.A.W. Surface application of gypsum in low acidic Oxisol under no-till cropping system. Sci. Agric. 2011, 68, 209–216. [Google Scholar] [CrossRef]
  81. Selles, F.; Kochann, R.A.; Denardin, J.E.; Zentner, R.P.; Faganello, A. Distribution of phosphorus fractions in a Brazilian Oxisol under different tillage systems. Soil Tillage Res. 1997, 44, 23–34. [Google Scholar] [CrossRef]
  82. Galetto, S.L. Eficiência da adubação fosfatada influenciada pela aplicação de gesso agrícola em sistema plantio direto. Thesis, Universidade Estadual de Ponta Grossa, Ponta Grossa, Brasil, 2016. (In Portuguese). [Google Scholar]
  83. Corrêa, J.C.; Mauad, M.; Rosolem, C.A. Fósforo no solo e desenvolvimento de soja influenciados pela adubação fosfatada e cobertura vegetal. Pesqui. Agropecu. Bras. 2004, 39, 1231–1237. (In Portuguese) [Google Scholar] [CrossRef]
  84. Costa, M.J. Manejo do solo e efeito residual da gessagem sobre atributos físicos e químicos de um Latossolo Vermelho distroférrico e no desenvolvimento da soja. Dissertation, Universidade Federal de Mato Grosso do Sul: Dourados, Brasil, 2006. (In Portuguese) [Google Scholar]
  85. Sá, J.C.M. Impacto do aumento da matéria orgânica do solo em atributos da fertilidade no sistema plantio direto. In 5º Encontro regional de plantio direto no cerrado; Campo Grande, Brasil, 10-13 July 2001. (In Portuguese)
  86. Eltz, F.L.F.; Peixoto, R.T.G.; Jaster, F. Efeitos de sistemas de preparo do solo nas propriedades físicas e químicas de um Latossolo Bruno álico. Rev. Bras. Cienc. Solo 1989, 13, 259–267. (In Portuguese) [Google Scholar] [CrossRef]
  87. Klepker, D.; Anghinoni, I. Características físicas e químicas do solo afetadas por métodos de preparo e modos de adubação. Rev. Bras. Cienc. Solo 1995, 19, 395–401. (In Portuguese) [Google Scholar]
  88. Bayer, C.; Mielniczuk, J. Características químicas do solo afetadas por métodos de preparo e sistemas de cultura. Rev. Bras. Cienc. Solo 1997, 21, 105−112. (In Portuguese) [Google Scholar]
  89. Rheinheimer, D.S.; Kaminski, J.; Lupatini, G.C.; Santos, E.J.S. Modificações em atributos químicos de solo arenoso sob sistema plantio direto. Rev. Bras. Cienc. Solo 1998, 22, 713–721. (In Portuguese) [Google Scholar] [CrossRef]
  90. Falleiro, R.M.; Souza, C.M.; Silva, C.S.W.; Sediyama, C.S.; Silva, A.A.; Fagundes, J.L. Influência dos sistemas de preparo nas propriedades químicas e físicas do solo. Rev. Bras. Cienc. Solo 2003, 27, 1097–1104. (In Portuguese) [Google Scholar] [CrossRef]
  91. Torres, J.L.R.; Pereira, M.G. Dinâmica do potássio nos resíduos vegetais de plantas de cobertura no cerrado. Rev. Bras. Cienc. Solo 2008, 32, 1609–1618. (In Portuguese) [Google Scholar] [CrossRef]
  92. Brady, N.C. Suprimento e assimilabilidade de fósforo e potássio. In Natureza e propriedade dos solos, 7th ed.; Brady, N. C., Ed.; Freitas Bastos: Rio de Janeiro, Brasil, 1989; pp. 373–413. [Google Scholar]
  93. Teixeira, I.R.; Souza, C.M.; Borém, A.; Silva, G.F. Variação dos valores de pH e dos teores de carbon orgânico, cobre, manganês, zinco e ferro em profundidade em Argissolo Vermelho-Amarelo, sob diferentes sistemas de preparo de solo. Bragantia 2003, 62, 119–126. (In Portuguese) [Google Scholar] [CrossRef]
  94. Borges, W.L.B.; Freitas, R.S.; Mateus, G.P.; Sá, M.E.; Alves, M.C. Absorção de nutrientes e alterações químicas em Latossolos cultivados com plantas de cobertura em rotação com soja e milho. Rev. Bras. Cienc. Solo 2014, 38, 252−261. (In Portuguese) [Google Scholar] [CrossRef]
  95. Duda, G.P.; Guerra, J.G.M.; Monteiro, M.T.; de-Polli, H.; Teixeira, M.G. Perennial herbaceous legumes as live soil mulches and their effects on C, N and P of the microbial biomass. Sci. Agric. 2003, 60, 139–147. [Google Scholar] [CrossRef]
  96. Syed-Omar, S.R.; Sumner, M.E. Effect of gypsum on soil potassium and magnesium status and growth of alfalfa. Commun. Soil Sci. Plant Anal. 1991, 22, 2017–2028. [Google Scholar] [CrossRef]
  97. Loyola Junior, E.; Pavan, M.A. Seletividade de troca de cátions em solos ácidos. Rev. Bras. Cienc. Solo 1989, 13, 131–138. (In Portuguese) [Google Scholar]
  98. Zambrosi, F.C.B.; Alleoni, L.R.F.; Caires, E.F. Teores de alumínio trocável e não trocável após calagem e gessagem em Latossolo sob sistema plantio direto. Bragantia 2007, 66, 487–495. (In Portuguese) [Google Scholar] [CrossRef]
  99. Araújo, L.G.; Sousa, D.M.G.; Figueiredo, C.C.; Rein, T.A.; Nunes, R.S.; Santos Júnior, J.D.G. The residual effect of gypsum on subsoil conditioning, nutrition and productivity of sugarcane crops. Aust. J. Crop Sci. 2018, 12, 1313−1321. [Google Scholar] [CrossRef]
  100. Vicensi, M.; Umburanas, R.U.; Loures, F.S.R.; Koszalka, V.; Botelho, R.V.; Ávila, F.W.; Müller, M.M.L. Residual effect of gypsum and nitrogen rates on black oat regrowth and on succeeding soybean under no-till. Int. J. Plant Prod. 2021, 15, 431–445. [Google Scholar] [CrossRef]
  101. Myers, R.J.K.; Palm, C.A.; Cuevas, E.; Gunatilleke, I.U.N.; Brossard, M. The synchronisation of nutrient mineralisation and plant nutrient demand. In The biological management of tropical soil fertility; Woomer, P. L., Swift, M. J., Eds.; Wiley-Sayce Publications: London, England, 1994; pp. 81–112. [Google Scholar]
  102. Kuzyakov, Y.; Domanski, G. Carbon input by plants into the soil. J. Soil Sci. Plant Nutr. 2000, 163, 421–431. [Google Scholar] [CrossRef]
  103. Dias, L.E. Uso de gesso como insumo agrícola; Embrapa - Centro Nacional de Pesquisa de Biologia: Cascavel, Brasil, 1992. (Comunicado Técnico 7). (In Portuguese) [Google Scholar]
  104. Carvalho, M.C.S.; van Raij, B. Calcium sulphate, phosphogypsum and calcium carbonate in the amelioration of acid subsoild for root growth. Plant Soil 1997, 192, 37–48. [Google Scholar] [CrossRef]
  105. Soratto, R.P.; Crusciol, C.A.C.; Castro Mello, F.F. Componentes da produção e produtividade de cultivares de arroz e feijão em função de calcário e gesso aplicados na superfície do solo. Bragantia 2010, 69, 965–974. (In Portuguese) [Google Scholar] [CrossRef]
  106. Borges, W.L.B.; Hipolito, J.L.; Cruz, L.C.P.; Souza, I.M.D.; Sporch, H.B.S.; Juliano, P.H.G.; Rodrigues, L.N.F. Evaluation of the influence of surface and subsurface acidity correction methodologies on soil compaction in agropastoral systems under no-till. Soil Sci. Soc. Am. J. 2024, 88, 339–353. [Google Scholar] [CrossRef]
Figure 1. Monthly rainfall (R), maximum relative humidity (MaxRH), minimum relative humidity (MinRH), maximum temperature (MaxT), and minimum temperature (MinT) data for Votuporanga, São Paulo State, Brazil, from November 2017 to December 2022. Source: [47].
Preprints 188929 g001
Figure 2. Average values of soil chemical attributes in the 0.0–0.1, 0.1–0.2, 0.2–0.4, and 0.4–0.8 m layers in the 2022-2023 season: (a) P content; (b) S-SO42- content; (c) OM content. T1 – control (brown); T2 (orange); T3 (red); T4 (green); T5 (blue); T6 (yellow); and T7 (dark blue).
Preprints 188929 g002
Figure 3. Average values of soil chemical attributes in the 0.0–0.1, 0.1–0.2, 0.2–0.4, and 0.4–0.8 m layers in the 2022-2023 season: (a) pH; (b) Ca2+ content; (c) Mg2+ content. T1 – control (brown); T2 (orange); T3 (red); T4 (green); T5 (blue); T6 (yellow); and T7 (dark blue).
Preprints 188929 g003
Figure 4. Average values of soil chemical attributes in the 0.0–0.1, 0.1–0.2, 0.2–0.4, and 0.4–0.8 m layers in the 2022-2023 season: (a) total acidity pH 7.0 (H+ + Al3+); (b) BS; (c) Ca2+/CEC; (d) Mg2+/CEC. T1 – control (brown); T2 (orange); T3 (red); T4 (green); T5 (blue); T6 (yellow); and T7 (dark blue).
Preprints 188929 g004
Table 1. Description of the treatments in each growing season.
Treatment 2017-2018 season 2018-2019 season 2019-2020 season
LS PG HL LS PG HL LS PG HL
kg ha-1  -
T1 (control)
T2 2,000 1 2,500 1 5 5
T3 1,000 2 + 1,350 1 1,500 1 5 6 5 6
T4 1,000 2 + 1,350 1 5 5
T5 2,500 1 725 4 6 5 6 5
T6 2,500 1 450 4 5 5
T7 2,500 1 260 4 5 5
1 Surface application. 2 Incorporated with a heavy-duty hydraulic harrow (28” discs) and a leveling harrow (20” discs, two times). 3 Incorporated a moldboard plow up to 0.26 m. 4 Application with a 2-shank subsoiler-fertilizer in the 0–0.57 m layer. 5 Surface application of compound to ensure that Ca occupied 65% of CEC in the 0.0–0.2 m layer. 6 Surface application of compound to ensure that Ca occupied 50% of ECEC in the 0.2–0.4 m layer.
Table 2. Characteristics of the 0.0 to 0.1 m soil layer.
Attribute Treatment5 F test LSD6 CV7
T1 T2 T3 T4 T5 T6 T7
P (resin), mg dm-3 31.00 c 8 50.00 ab 35.50 bc 31.50 c 57.00 a 46.00 abc 43.50 abc 8.6352** 15.63 15.92
S-SO42-, mg dm-3 4.00 ab 3.25 b 3.50 ab 4.50 a 3.00 b 3.25 b 3.00 b 5.1639** 1.15 14.06
Organic matter, g dm-3 14.00 bc 14.75 abc 17.00 a 13.00 c 15.75 ab 14.75 abc 16.50 ab 5.8246** 2.72 7.71
pH 1 5.50 e 6.13 bcd 6.55 a 6.00 cd 6.48 ab 6.28 abc 5.80 de 17.9692** 0.41 2.88
K+, cmolc dm-3 0.35 a 0.24 bc 0.13 cd 0.10 d 0.24 ab 0.24 b 0.30 ab 13.8536** 0.11 20.94
Ca2+, cmolc dm-3 1.10 c 2.65 ab 3.40 a 1.85 bc 3.38 a 2.35 ab 1.60 bc 10.8351** 1.24 22.85
Mg2+, cmolc dm-3 0.90 b 1.00 ab 1.50 a 0.95 b 1.30 ab 1.38 ab 1.20 ab 4.4962** 0.51 18.50
Total acidity 2 1.50 a 1.08 bc 0.95 c 1.10 bc 0.98 c 1.03 c 1.20 b 33.0000** 0.15 5.86
Base saturation, % 3 61.00 c 78.00 ab 84.00 a 69.50 bc 83.00 a 78.75 ab 72.00 b 13.0757** 10.59 6.03
CEC pH 7.0, cmolc dm-3 4 3.85 b 4.96 ab 5.98 a 4.00 b 5.89 a 4.99 ab 4.30 b 6.2932** 1.60 14.09
K+/CEC, % 9.09 a 4.74 c 2.09 d 2.45 d 4.15 c 4.82 c 6.85 b 45.9236** 1.68 14.77
Ca2+/CEC, % 29.00 d 53.25 ab 56.50 ab 45.50 bc 57.00 a 46.00 abc 37.00 cd 18.9931** 11.18 10.34
Mg2+/CEC, % 23.00 ab 20.00 b 25.00 ab 22.50 ab 22.00 ab 28.00 a 28.00 a 4.5491** 6.70 11.92
1 pH (1:2.5 soil/0.01 Μ CaCl2 suspension). 2 total acidity pH 7.0 (H+ + Al3+), cmolc dm-3. 3 base saturation = 100(Ca2+ + Mg2+ + K+/CEC pH 7.0). 4 cation exchange capacity (CEC) pH 7.0 = Ca2+ + Mg2+ + K+ + total acidity (H+ + Al3+). 5 See Table 1 for details of the treatments. 6 LSD: least significant difference. 7 CV: coefficient of variation. 8 Within rows, means followed by the same letter are not significantly different according to LSD (0.05). **Significant at the 0.01 probability level.
Table 3. Characteristics of the 0.1 to 0.2 m soil layer.
Attribute Treatment5 F test LSD6 CV7
T1 T2 T3 T4 T5 T6 T7
P (resin), mg dm-3 17.00 d 8 35.00 b 27.50 c 31.00 bc 47.25 a 36.25 b 34.50 b 66.7845** 5.26 6.91
S-SO42-, mg dm-3 3.00 3.25 3.50 3.00 3.25 3.25 3.50 1.3125 0.83 10.96
Organic matter, g dm-3 11.00 bc 11.75 abc 12.50 ab 10.00 c 11.50 bc 12.25 abc 14.00 a 6.2964** 2.34 8.45
pH 1 5.40 c 5.85 ab 6.20 a 6.20 a 6.10 a 5.98 a 5.55 bc 14.2299** 0.39 2.84
K+, cmolc dm-3 0.29 0.28 0.20 0.37 0.38 0.34 0.30 1.7563 0.22 30.14
Ca2+, cmolc dm-3 1.20 1.93 1.90 1.40 1.95 1.70 1.20 3.4500* 0.85 22.63
Mg2+, cmolc dm-3 0.60 b 0.60 b 1.00 a 0.60 b 0.78 ab 1.03 a 0.75 ab 5.6134** 0.36 20.41
Total acidity 2 1.50 a 1.18 b 1.00 c 1.10 bc 1.13 bc 1.20 b 1.25 b 20.6033** 0.16 5.81
Base saturation, % 3 58.00 c 70.25 ab 75.50 a 68.00 ab 73.25 a 70.50 ab 64.00 bc 103486** 8.58 5.36
CEC pH 7.0, cmolc dm-3 4 3.59 3.98 4.10 3.47 4.23 4.27 3.50 2.7690* 0.97 10.77
K+/CEC, % 8.08 6.89 4.88 10.66 9.06 8.21 8.58 2.4738 5.36 28.52
Ca2+/CEC, % 33.00 b 48.75 a 46.50 ab 40.00 ab 45.75 ab 38.00 ab 34.00 b 4.6271** 13.61 14.26
Mg2+/CEC, % 17.00 bc 14.75 c 24.50 a 17.00 bc 18.25 abc 24.00 ab 21.00 abc 5.4504** 7.49 16.45
1 pH (1:2.5 soil/0.01 Μ CaCl2 suspension). 2 total acidity pH 7.0 (H+ + Al3+), cmolc dm-3. 3 base saturation = 100(Ca2+ + Mg2+ + K+/CEC pH 7.0). 4 cation exchange capacity (CEC) pH 7.0 = Ca2+ + Mg2+ + K+ + total acidity (H+ + Al3+). 5 See Table 1 for details of the treatments. 6 LSD: least significant difference. 7 CV: coefficient of variation. 8 Within rows, means followed by the same letter are not significantly different according to LSD (0.05). **Significant at the 0.01 probability level. *Significant at the 0.05 probability level.
Table 4. Characteristics of the 0.2 to 0.4 m soil layer.
Attribute Treatment5 F test LSD6 CV7
T1 T2 T3 T4 T5 T6 T7
P (resin), mg dm-3 11.00 c 8 29.25 ab 21.00 b 21.00 b 28.25 ab 35.75 a 33.00 a 16.6239** 9.74 16.28
S-SO42-, mg dm-3 4.00 a 3.50 ab 3.50 ab 3.50 ab 3.00 b 3.00 b 3.00 b 3.7895* 0.91 11.57
Organic matter, g dm-3 8.50 b 10.50 a 10.50 a 11.00 a 10.00 a 10.25 a 11.00 a 9.0741** 1.32 5.53
pH 1 5.50 5.70 6.00 6.05 5.75 5.90 5.70 2.6771* 0.552 4.08
K+, cmolc dm-3 0.14 b 0.35 a 0.28 ab 0.27 ab 0.32 ab 0.32 ab 0.31 ab 2.8399* 0.19 28.60
Ca2+, cmolc dm-3 1.20 b 1.50 ab 1.25 ab 1.85 a 1.48 ab 1.40 ab 1.20 b 2.8965* 0.63 19.23
Mg2+, cmolc dm-3 0.45 b 0.43 b 0.65 b 1.20 a 0.68 b 0.63 b 0.55 b 15.8692** 0.30 19.94
Total acidity 2 1.25 1.25 1.15 1.15 1.25 1.18 1.25 0.5646 0.31 10.93
Base saturation, % 3 59.00 b 64.50 ab 65.50 ab 74.50 a 65.75 ab 66.75 ab 62.00 b 4.2858** 10.82 7.08
CEC pH 7.0, cmolc dm-3 4 3.04 b 3.52 b 3.33 b 4.47 a 3.72 b 3.52 b 3.31 b 8.9719** 0.71 8.51
K+/CEC, % 4.52 9.79 8.41 5.94 8.70 9.31 9.33 2.4484 5.93 31.76
Ca2+/CEC, % 39.50 42.50 38.00 41.50 38.50 39.25 36.00 0.9628 10.34 11.27
Mg2+/CEC, % 14.79 b 12.01 b 19.49 ab 26.86 a 18.27 b 17.53 b 16.60 b 7.6373** 7.84 18.72
Ca2+/ECEC, %e 67.20 a 65.93 ab 57.44 c 55.82 c 58.41 bc 59.53 abc 58.31 bc 6.5697** 8.00 5.68
1 pH (1:2.5 soil/0.01 Μ CaCl2 suspension). 2 total acidity pH 7.0 (H+ + Al3+), cmolc dm-3. 3 base saturation = 100(Ca2+ + Mg2+ + K+/CEC pH 7.0). 4 cation exchange capacity (CEC) pH 7.0 = Ca2+ + Mg2+ + K+ + total acidity (H+ + Al3+). 5 See Table 1 for details of the treatments. 6 LSD: least significant difference. 7 CV: coefficient of variation. 8 Within rows, means followed by the same letter are not significantly different according to LSD (0.05). **Significant at the 0.01 probability level. *Significant at the 0.05 probability level.
Table 5. Characteristics of the 0.4 to 0.8 m soil layer.
Attribute Treatment5 F test LSD6 CV7
T1 T2 T3 T4 T5 T6 T7
P (resin), mg dm-3 2.00 c 8 8.00 b 9.00 b 9.00 b 6.50 b 7.00 b 15.00 a 31.3140** 3.24 17.17
S-SO42-, mg dm-3 3.00 4.25 4.00 4.00 3.25 5.00 3.50 2.0959 2.18 24.17
Organic matter, g dm-3 7.00 c 8.00 b 8.50 ab 8.00 b 8.25 ab 8.25 ab 9.00 a 13.8889** 0.76 4.02
pH 1 5.60 b 5.63 b 6.00 ab 6.20 a 5.98 ab 5.75 ab 5.60 b 4.6100** 0.52 3.81
K+, cmolc dm-3 0.08 d 0.13 cd 0.21 b 0.34 a 0.15 bcd 0.16 bcd 0.16 bc 23.5443** 0.08 19.47
Ca2+, cmolc dm-3 1.00 1.13 1.05 1.10 1.15 1.05 0.90 2.3861 0.26 10.41
Mg2+, cmolc dm-3 0.50 0.40 0.50 0.50 0.55 0.50 0.45 1.1287 0.21 18.43
Total acidity 2 1.20 a 1.18 a 1.10 ab 1.00 b 1.08 ab 1.13 ab 1.15 ab 4.3846** 0.15 5.75
Base saturation, % 3 57.00 b 58.25 b 61.00 ab 66.00 a 63.25 ab 60.25 ab 57.00 b 5.9591** 6.42 4.55
CEC pH 7.0, cmolc dm-3 4 2.78 ab 2.83 ab 2.86 ab 2.94 a 2.93 ab 2.83 ab 2.66 b 2.7145* 0.27 4.05
K+/CEC, % 2.88 c 4.43 bc 7.18 b 11.56 a 5.26 bc 5.54 bc 6.06 b 19.4631** 2.91 20.30
Ca2+/CEC, % 36.00 40.00 36.50 37.00 39.25 37.00 33.50 2.4325 6.42 7.42
Mg2+/CEC, % 18.00 14.25 17.50 17.00 18.75 17.50 17.00 0.9315 6.84 17.08
1 pH (1:2.5 soil/0.01 Μ CaCl2 suspension). 2 total acidity pH 7.0 (H+ + Al3+), cmolc dm-3. 3 base saturation = 100(Ca2+ + Mg2+ + K+/CEC pH 7.0). 4 cation exchange capacity (CEC) pH 7.0 = Ca2+ + Mg2+ + K+ + total acidity (H+ + Al3+). 5 See Table 1 for details of the treatments. 6 LSD: least significant difference. 7 CV: coefficient of variation. 8 Within rows, means followed by the same letter are not significantly different according to LSD (0.05). **Significant at the 0.01 probability level. *Significant at the 0.05 probability level.
Disclaimer/Publisher’s Note: The statements, opinions and data contained in all publications are solely those of the individual author(s) and contributor(s) and not of MDPI and/or the editor(s). MDPI and/or the editor(s) disclaim responsibility for any injury to people or property resulting from any ideas, methods, instructions or products referred to in the content.
Copyright: This open access article is published under a Creative Commons CC BY 4.0 license, which permit the free download, distribution, and reuse, provided that the author and preprint are cited in any reuse.
Prerpints.org logo

Preprints.org is a free preprint server supported by MDPI in Basel, Switzerland.

Subscribe

Disclaimer

Terms of Use

Privacy Policy

Privacy Settings

© 2025 MDPI (Basel, Switzerland) unless otherwise stated