
Submitted:
09 December 2025
Posted:
09 December 2025
You are already at the latest version
Abstract
Ultrasound applications are currently a very intense field of research, always in expansion, constantly finding new uses for them in all scientific fields. The basic process investigated in this research is that of obtaining wires by wire-drawing technology, which consists of successively passing a semi-finished wire through a sequence of dies until the desired final diameter is obtained. This plastic deformation process usually takes place at room temperature. The phenomena that can still be studied in this process and improved is that of reducing the friction between two parts that are in relative motion named also “ultrasonic lubrication”. Based on this phenomenon, technology for obtaining metal wires by wire drawing can be improved by increasing the wiredrawing speed. The article presents the design and calculation of the ultrasonic transducer used to activate the drawing die, the FEM to determine the optimal vibration frequencies and vibration modes used in activation of the die. To demonstrate the effect of reducing the coefficient of friction during wire drawing, a test stand was used in which the pulling force is achieved by a pneumatic system and the die is one of those used in a wire production factory. By ultrasonic activation of the die, an increase in the working speed was obtained. The percentage increase in the drawing speed is different, depending on the initial traction speed.
Keywords:
ultrasonic
; vibrations
; speed
; increase
; FEM
; wire
; drawing
1. Introduction
1.1. Ultrasonic Applications
Piezoelectricity represents a property of certain dielectric materials to change their geometric shape in the presence of an electric field or, on the contrary, to produce an electric charge when they are mechanically deformed by applying a concentrated force on them. There are a wide variety of materials that exhibit this phenomenon to some degree, including natural quartz crystals, semicrystalline polymer, polycrystalline piezoceramic, bone, and even wood. Piezoelectricity is produced due to the spontaneous separation of electric charge in certain crystalline structures under appropriate conditions. This phenomenon, called spontaneous polarization, is caused by a displacement of the electron clouds relative to their individual atomic centers, that is, a displacement of the positive ions relative to the negative ions in their crystal cells. Such a situation produces an electric dipole [1,2,3].
Piezoceramic materials are currently used in a series of very important industrial and scientific fields that include elements of high intelligence and innovation. Thus, we can find such structures, and the notion of structure is well used here because these materials include several elements, in areas such: industrial automation; high precision engineering and mechanics; aviation and space activities; automobile industry; industrial automation; advanced medicine; telecommunications; consumer goods industry. In all these industries, electrical energy is usually transformed into mechanical energy by using various types of electrical transducers [4,5,6,7]. Very interesting applications can be found, for example, in the use of ultrasound in the phenomenon of ultrasonic cavitation [8,9,10,11,12] used in medical cleaning installations, for example, or air filtration systems. Another example of the very successful use of ultrasound is that in the construction of ultrasonic motors [13,14,15]. These systems transform electrical energy into "traveling wave" vibratory waves to obtain high-precision translational or rotational movements that cannot be influenced by electric or magnetic fields, for example. In addition to all these applications of ultrasound, the reduction of the coefficient of friction between two surfaces that are in relative motion relative to each other is also distinguished. The evaluation of friction reduction and frictionless stress in ultrasonic vibration forming process was studied also by Jul L. [16]. The phenomenon has been studied also from the point of view of ultrasonic motors by H. Storck, end all [17]. Thomas Sednaoui &all [18] studied using an experimental stand the variation of the friction coefficient depending on the vibration amplitude and found a substantial reduction from the value of 1.6 to the value of 0.4 µm if the vibration amplitude increases from 0.5 µm to 3.5 µm. at a frequency f = 25 KHz. The experiments were carried out in the case of palpating with the finger a plate that oscillates in the ultrasonic field. Pham, T.M.; Twiefel, J studied in [19] the reduction of the friction coefficient at the contact between an elastomer and a metal. In their research [20], Diana Angelica Torres also proposed to measure the reduction of the coefficient of friction when palpating with a finger a vibrating surface in the ultrasonic range by means of longitudinal waves as a function of speed. Dong S & all also studied the reduction of the coefficient of friction as a result of the action of ultrasonic waves and named this as a kind of “ultrasonic lubrication” [21]. They built a test stand in which the normal applied force is approximately 2 N. The relative speeds of movement between the parts in contact were around 20 and 40 m/sec. The ultrasound frequency was f = 22 KHz and their amplitude was 2.5 um. Furthermore, Sheng Dong, Marcelo J. Dapino made an experimental stand that uses the active part of an ultrasonic welding system [22]. The forces in the normal direction applied varied between 40 and 240 N. Depending on the value of the applied normal force, they found a reduction of the tangential force acting on the displaced model by approximately 50%. V.C Kumar presents in his researche [23] the influence of ultrasonic oscillations in the perpendicular or parallel direction on the sliding direction of three aluminum, copper or steel alloy specimens that make contact with the vibrating system made of steel. It performs vibrations with a frequency of 20KhZ and an amplitude of 10 um, and the pressure between the moving elements is up to 0.7 MPa. In his experiments he obtained a substantial reduction of the frictional force by up to 80%. For the processing processes of the deep drawing type, experiments were carried out by Takashi Jimma [24] in which ultrasonic oscillations were applied, in which an important reduction of the friction between the deforming material and the processing tool was found at the same time with a reduction of resistance to deformation. In his research, C.L. Yang [25] studied the friction reduction during the friction welding process when the ultrasonic field is applied. At the same time, he also studied the heat generation process, the temperature variation as well as the material flow process during this operation. Studying machining by chipping, Littman found in his researche [26] the same phenomenon of friction reduction and found a theoretical explanation of this phenomenon. These results were then demonstrated experimentally, where it was demonstrated that by adding a very small amount of energy, this substantial reduction of friction based on Coulomb's law can be obtained. Also with reference to metal machining, Wei Bai studies this process in great detail in the presence of the ultrasonic field in his paper [27]. The experiments were carried out using ultrasonic vibrations at a frequency of 20 KHz, with amplitudes in the range of 4.7...9.3 micrometers. Moving somewhat towards the medical field, T. Sednaoui studies the friction variation between the surface of the finger and that of an ultrasonically activated plate [28]. It determines the variation of the relative coefficient of friction depending on the amplitude of the ultrasonic vibrations or the coefficient of friction depending on the magnitude of the applied normal force. Staying in the same area of research, namely reducing the coefficient of friction between the human finger and an ultrasonically activated surface, E. Vezzoli [29]. It was found that this friction reduction is the result of the intermittent contact between the two elements and depends on the vibration amplitude and frequencies, the intrinsic friction coefficient and the relative speed between them.
1.2. Wire Drawing
Wire drawing represents a processes for obtaining semi-finished products through plastic deformation, in which the metal material under the action of a drawing force is forced to pass through a calibrated hole of a tool, which is smaller than the initial section of the material. If the traction force is provided by a drum or roller, on which the deformed material is wrapped, the process is called drawing; if the traction force is exerted by a machine body with rectilinear movement, and the deformed products (bars or pipes) are obtained straight, the process is called pulling. To obtain the wires, drawing machines are used (Figure 1 a), which are made up of several dies (Figure 1 b,c) that ensure a gradual reduction of the diameter of the semi-finished product until the final, desired one.
2. Design of the Ultrasonic Transducer to Activate the Drawing Die
2.1. Analytical Dimensional Design of the Ultrasonic Transducer
The analytical calculation to realize the dimensional design of the main elements of the piezoceramic transducer represents a very important stage in the realization of the entire ultrasonic assembly. To calculate and size the ultrasonic system, according to [30,31] in the first stage, the initial data necessary to solve the equations describing the vibrational behavior of piezoceramic materials are entered, namely [32]:
| - material permittivity - [F/m] | (1) |
| - resonance frequency - f0 = 35000 Hz | (2) |
| - resonance pulsation - | (3) |
| - particle displacement - ξ= 0.5 · 10-7 m | (4) |
| - input electrical power - Pin = 1500 W | () |
| - acoustic intensity [33,34] - = 4.8W/m2 | () |
where – acoustic impedance; f0 – resonance frequency; - particle displacement
Zc = 80 kRayl
| - the acousto-mechanical efficiency [35,36] - = 0.8 | (7) |
| - the electromechanical coupling factor - [37,38] – ζ = 0.75 | (8) |
| - the electroacoustic efficiency [35,36] - ηea = 0.95 | (9) |
| - piezoceramic material density [39] - [Kg/m3] | (10) |
| - piezoceramic material Young modulus [39] - [N/m2] | () |
| - piezoceramic material Poisson coefficient [40] – ν = 0.25 | (12) |
| - the relative permittivity [41] at 1 Hz - | (13) |
| - loss angle - δp = 0.73 deg ; tg (δp) = 0.0127 | (14) |
| - piezoelectric constant [m/V] | (15) |
| - steel Young modulus - [N/m2] | (16) |
| - steel density - [Kg/m3] | (17) |
| - steel Poisson coefficient ν = 0.3 | (18) |
| - aluminium density - [Kg/m3] | (19) |
| - aluminium Poisson coefficient - ν = 0.33 | (20) |
Using the input data presented previously, the dimensions of the transducer composed of a passive element (the reflector) and an active element, made of steel and aluminum, were calculated. It was calculated as follows:
- -
- ultrasound propagation speed [42] through piezoceramic elements - vp, with formula 21.
Using the same formula, the speed of ultrasound propagation through the aluminum amplifier area SAl = 6148 m/s and through the steel area SSt = 5952 m/s resulted.
The wavelength λp of ultrasound through the same elements [42]. For the piezoceramic material this is:
For aluminum and steel cylinders respectively, the wavelengths are λAl= 297 mm and for the steel one λSt = 307 mm.
The axial dimensions of the main components made of piezoceramic material, aluminum and steel of the ultrasonic transducer according to the longitudinal direction of propagation of ultrasonic vibrations in /4 are, according to relation, for the piezoceramic elements:
As can be seen from Figure 2, the block of piezoceramic elements is 20 mm long. For the aluminum portion of the transducer amplifier the resulting length is lAl = 74.25 mm and for the steel portion lSt = 76 mm. To determine the radius of the piezoceramic active element, the radiation area of the active element must be calculated. This must be correlated with the input power, Pin = 3000 W and with the required acoustic intensity and is calculated:
- -
- the radius of the resulting piezoceramic active element (for the circular section), is rp:
- -
- -
where:
where , is the electromagnetic transformation coefficient
Where the effective electroacoustic efficiency of the transducer is
- -
where Cm = 1.36 nF is the real electrical capacitance of the active element
- -
where Cp = 1.16 nF is the electrical capacitance of the active element
Calculation elements for the ultrasonic energy concentrator are:
- -
- length of ultrasonic energy concentrator
- -
Considering the constructive possibilities regarding the choice of piezoceramic elements, the radius of the available piezoceramic element is rp = 17.5 mm. This radius was used for the construction of the piezoceramic transducer instead of radius = 15.7 mm resulted from theoretical calculation. One of the most important elements of the ultrasonic transducer system is represented by the ultrasound concentrator. It has the role of concentrating the energy of the ultrasonic vibrations and sending it to the area of interest. As can be seen in figure 1, a concentrator consisting of three cylindrical zones was designed with a total length of 104 mm as resulted from calculations and experience of the authors in this domanin. Figure 2 presents the overall scheme of the ultrasonic system used to activate the molds used for wire drawing. Here they were noted as follows: 1 – the ultrasonic reflector; 2 – the four piezoceramic discs; 3 – the ultrasonic amplifier (the aluminum part); 4 – the ultrasonic amplifier (steel part); 5 – nodal flange; 6 – the ultrasonic concentrator.
2.2. Analysis of the Optimal Vibration Modes of the Ultrasonic System Used to Activate the Wire Drawing Dies
To determine the optimal working frequencies of the ultrasonic system and to greatly reduce the time required for the experiment regarding the determination of the frequency at which the vibration amplitude is maximum, the finite element method can be used. This method, implemented through the ANSYS software, within the performance of a modal analysis, determines the free, natural vibration frequencies of the ultrasonic system. The analysis was carried out using two types of discretization elements, namely SOLID98 for the discretization of piezoelectric elements and Solid187 for the discretization of elements made of aluminum and steel. The material properties used to characterize the piezoceramic material are: ET,1,SOLID98,1; MP,DENS,1,7500; MP,PERX,1,804.6; MP,PERZ,1,659.7, TB,PIEZ,1; TBDATA,16,10.5; TBDATA,14,10.5; TBDATA,3,-4.1; TBDATA,6,-4.1; TBDATA,9,14.1, TB,ANEL,1; TBDATA,16,3.0E10; TBDATA,19,2.6E10; TBDATA,21,2.6E10.
For aluminum and steel, properties such as Young's modulus, Poisson's ratio and density are already well known.
The analytical mathematical calculation presented above was made considering the vibration frequency of 35 KHz. From these calculations the length of the concentrator resulted, finally the entire assembly of the acoustic system used to activate the die used for drawing, being presented in Figure 1. Next, starting from this drawing, the 3D model was made in the Ansys software presented in Figure 3 a while Figure 3 b presents the application of the potential difference on the surfaces of the piezoceramic plates. To determine the free vibration frequencies, a modal analysis was performed that calculated two vibration modes close to the vibration frequency of 35000Hz, namely, the first of them at the frequency f = 33990 Hz and the second at the frequency f = 36000 Hz. This small difference can be explained by the fact that in the construction of the ultrasonic transducer system, the calculations resulted in a diameter of the piezoceramic elements d = 15.7 mm and due to the constructive possibilities the real diameter is 17.5 mm. On the other hand, small errors can also arise from the configuration of the transducer fixing system in the nodal flange area or, finally, errors due to the differences between the theoretical properties of the piezoceramic material and its real properties.
2.3. Displacement Calculation of the Ultrasonic System Using FEM at f = 33990 Hz
Using the finite element method, the ultrasonic transducer displacements for the two vibration frequencies determined by modal analysis are presented below. Since the energy concentrator peak is the zone that comes in contact with the drawing die, attention will be focused on it. Thus, Figure 4 presents for these two vibration frequencies how they vibrate by presenting the USUM displacements. Figure 4 a present the transducer deformation at frequency f = 33990 Hz for which it can be observed how the design of the entire system led to obtaining oscillations only in the free part of the ultrasonic concentrator where their value is around the USUM = 6 µm value. In the rest of the ultrasonic transducer the amplitude of the oscillations is very small, close to zero. What is noteworthy is the fact that the free end of concentrator oscillates only along the OZ axis which can be useful in achieving the “ultrasonic lubrication” phenomenon necessary to reduce the friction forces during wire drawing. Figure 4 b presents the transducer deformation corresponding to frequency f = 36000 Hz. And this time, only the free end of the ultrasonic concentrator oscillates, but these are bending oscillations around the OX axis. Considering the way in which the drawing takes place, this vibration mode is also considered useful. In the same way, it can be observed that throughout the volume of the transducer the calculated displacements are almost zero, which is very useful considering the fact that in the nodal flange area it is necessary that the amplitude of the oscillations be zero or extremely small. From the point of view of the amplitude of the oscillations, for the frequency f= 36000 Hz, these are approximately USUM = 26 µm which can constitute a much better efficiency of the ultrasonic system.
2.4. Mechanical Stress Calculation of the Ultrasonic Transducer Using FEM at f = 33990 Hz
For the two vibration frequencies that can be used in practical experiments to reduce the friction coefficient in drawing, it is very important to analyze the state of mechanical stresses that occur during the operation of the ultrasonic system, since this system must operate for a long time on drawing machines. The interest zone for observation is the piezoceramic elements and the nodal flange. This is important because for a long time of use, the piezoceramic elements can be destroyed and, also for a long time, high stresses can damage the fixation of the system in the nodal flange area.
2.4.1. Calculation on the OX, OY and OZ Mechanical Stress
For the frequency f = 33990 Hz, Figure 5 presents the calculation of the mechanical stresses related to the three orthogonal axes.
2.4.2. Calculation of the Shear Mechanical Stress on the Orthogonal Planes
For the calculation of shear stresses in the three orthogonal planes, the corresponding images are presented in Figure 6.
2.4.3. Calculation of the S1, S2, S3 Mechanical Stress
For the study of S1, S2 and S3 type stresses, the images in Figure 7 are presented.
S1 type stresses predominantly present the state of tensile stresses, S2 type stresses present tensile and compressive stresses in a balanced manner, and S3 type stresses predominantly present compressive stresses. To analyze the stress values in the two areas of interest, Table 3 is presented. As can be seen in this case, the stress values are minimal, the value ranges in which they are contained also include the value of zero, and do not reach values that can lead to the destruction of the piezoceramic elements.
3. Experiments on Reducing Friction Force During Drawing in an Ultrasonic Field
3.1. General Information About the Use of Pneumatic Stands
A pneumatic experimental stand was used to conduct experiments on reducing the friction coefficient by ultrasonic activation of the wire drawing die. In this way, the wire was drawn through the inside of the die. In this sense it is known that Pneumatic actuators remain a compact, safe and cost-effective solution for many automation and research tasks. The experimental stand described here is designed to collect high-resolution data from pneumatic cylinders, evaluate performance (speed, flow, pressure), study wear effects, and enable predictive maintenance using edge computing, time-series databases and dashboarding tools.
3.1.2. Pneumatic Stand Description
To achieve the pulling force necessary for wire drawing, the pneumatic experimental stand consists of four major layers (Figure 8):
- Pneumatic supply & actuators - compressor, FRL (filter-regulator-lubricator), valves and multiple cylinders (various diameters and strokes).
- Sensor layer - digital position sensors (magnetic/Hall), analog airflow and pressure sensors, plus optional vibration sensors.
- Control layer - RSTi-EP PACSystem (real-time logic, valve actuation) connected to a BUS coupler and I/O modules.
- Edge & data layer - Rxi2-LP edge controller hosting Node-RED flows, InfluxDB for time-series storage and Grafana for visualization. Data transport between nodes uses direct I/O, PROFINET and optional MQTT gateways.
The stand consists of the following components:
Mechanical
- -
- -pneumatic cylinder -1
- -
- -air filter and lubricant - 3
- -
- pneumatic 5/2 distributor - 5
- -
- -valve system and IOT interface module - 10
Sensors
- -
- magnetic proximity sensors at the end of each cylinder. Their purpose is to transmit the relative position of the piston rod in the cylinder -2
- -
- analog air flow monitor - 4
- -
- a two-channel vibration sensor is used. The entire device contains a box with the brain and its power supply through 6 AA batteries. Two wires with one sensor attached at the end of each come out of it - 9
- -
- I/O modules, 2 analogic, 1 digital - 12
Microcontrollers
- -
- Wi-Fi Micro Gateway for MQTT Wireless receiver and transmitter box - 6
- -
- PACedge - 7
- -
- Edge Controller - 8
Pneumatic subsystem components
Main components: compressor (AtlasCopco G2FF), air preparation unit (FRL), multiple solenoid distributors (Aventics and Airtac), valves (5/2, 5/3, 3/2 types) and one cylinder with nominal specifications: cylinder 2 — Aventics Ø32, stroke 500 mm (this is the smallest diameter cylinder used). The cylinder with a diameter of 32 mm was used to carry out the experiments.
3.2. Experiments on the Realization of the Wire Drawing Process in Ultrasonic Field
The experiments on obtaining metal wires through the ultrasonic wire drawing process were carried out using the stand presented in Figure 9. Cylinder 1, driven and controlled by pneumatic system 2, pulls piston 3 to which semi-finished wire 4.
The wire passes through the die 5 placed in support 6. A hole is drilled in this support through which the edge of concentrator 7 passes, which concentrates the mechanical energy produced by the ultrasonic transducer 8 (Figure 10a). Piezoceramic transducer 8 converts the electrical energy received from the ultrasound generator 9 (Figure 10b) into mechanical energy. To achieve the best possible contact between the tip of the concentrator and the die, a conical bore hole was drilled in it.
In the working regime, ultrasound generator was self-tuned to the frequency f = 33940 Hz as can be observed from Figure 10 b. From Figure 4 (a) which presents the modal analysis of the free vibration modes, mathematically calculated frequency is ft = 33990 Hz. As can be seen, between the two frequencies, the working fw = 33990 Hz and the one calculated by the finite element method, the difference is very small, namely approximately 0.14%. The experiments carried out on the effect of the ultrasonic field on the wire drawing process were carried out in four steps. In the first stage, wire drawing was carried out without the lubricating cooling liquid that is currently used industrially. The average wire drawing speed used in this case is v1 = 43.3 mm/s. Starting from this speed, when applying the lubricating cooling liquid, an average working speed vw1 = 51.81 mm/s was obtained. When the ultrasonic system was activated, an increase in the working speed was found according to the values in Table 4. The average speed in this case is thus vwU1 = 51.81 mm/sec. Thus, compared to operation without an ultrasonic field, an increase in the working speed by 5.7% is found. A second set of tests was carried out using an average traction speed, without an ultrasonic field, vw2 = 95.5 mm/s. When applying the ultrasonic field, an increase in the drawing speed was found to the values presented in Table 7, about vwU2 = 105.01 mm/sec. In this case, the average increase in the drawing speed is 9%. The fourth set of tests was performed at a wire drawing speed of v = 1005 mm/min only in the presence of the lubricating coolant. Under these working conditions, when the ultrasonic vibration field was applied, the drawing speed increased on average to v = 1005 mm/min. In this case, an increase in working speed of approximately 17% was recorded.
4. Discussion
The presented research aimed to highlight the effect of the ultrasonic vibration field on the process of obtaining wires by wire drawing. This effect is already known as "ultrasonic lubrication" and consists in reducing the coefficient of friction between two surfaces in the presence of this type of vibration. The novelty of the research is the highlighting of this process during wire drawing under conditions very similar to industrial ones. Information in this field is very limited in the specialized literature. Compared to similar studies in which the phenomenon of "ultrasonic lubrication" was highlighted and in which a much more significant effect was generally found, the present research highlighted increases in working speeds but in smaller proportions. What was found is an increase in the influence of the ultrasonic field as the drawing speed increased. Unfortunately, however, the experiments were carried out up to a working speed of approximately 1 m/sec. In industrial production, the working speeds for wire drawing are approximately 12....13 m/sec. Considering experimental data, black points, it was possible to draw the graph (Figure 11) of the increase in the working speed and make an estimate of the percentage increase in the processing speed up to approximately industrial working speed, namely 12 m/sec, red point.
For these working speeds, the experiments will have to be continued using a larger pneumatic cylinder. presented in figure 11.
Considering this, research will continue to demonstrate the effectiveness of the ultrasonic field wire drawing technology at the working speeds used in industry.
5. Conclusions
The presented article aimed to carry out the entire process of mathematical calculation, design and experimentation of the functioning of an ultrasonic system that aims to increase working speeds in the wire drawing process based on the process of reducing friction forces, known in the specialized literature as "ultrasonic lubrication". For this, an attempt was made to define working conditions as close as possible to those in industrial production. For this purpose, the following were carried out:
- -
- an analytical calculation model of the main characteristics of the ultrasonic system;
- -
- based on this, the geometric design of the ultrasonic system was carried out, which includes the stepped shape of the ultrasonic energy concentrator;
- -
- the geometry thus defined constituted the model for carrying out a modal analysis based on FEM, through which the vibration modes were determined at the working frequencies found by the mathematical method; following this analysis, it was found that one of the two vibration frequencies, namely f = 33900 Hz, is very close to the vibration frequency of the piezoceramic elements used in the analytical calculation, f = 35000 Hz. The mathematical model aimed to determine the amplitude of vibrations and the state of stress as long-term operation of the ultrasonic system is necessary.
- -
- experiments on drawing under the action of the ultrasonic field at the vibration frequency f = 33940Hz, also very close to that determined by FEM, namely f = 33900 Hz.
- -
- increase in the drawing speed, when applying the ultrasonic field, in different percentages depending on the different working speeds used.
Acknowledgments
The experiments were performed in the laboratories of the National University of Science and Technology Politehnica Bucharest. Program for Research of the National Association of Technical Universities - GNAC ARUT 2023". The authors have reviewed and edited the output and take full responsibility for the content of this publication.”
References
- Heywang, W.; Lubitz, K., Wersing, W., Piezoelectricity: evolution and future of a technology. Vol. 114. Springer Science & Business Media, 2008.
- Eitel, R. E.; Shrout, T. R.; Randall, C. A. Nonlinear contributions to the dielectric permittivity and converse piezoelectric coefficient in piezoelectric ceramics. Journal of Applied Physics, 2006, 99. [CrossRef]
- Rupitsch, S. J.; Ilg, J. Complete characterization of piezoceramic materials by means of two block-shaped test samples. IEEE Transactions on Ultrasonics, Ferroelectrics, and Frequency Control, 2015, vol. 62, pp. 1403-1413. [CrossRef]
- Gallego-Juarez, J. A. Piezoelectric ceramics and ultrasonic transducers. J. Phys E: Sci. Instrum. 1989, Volume 22. [CrossRef]
- Chandra Sekhar, B.; Dhanalakshmi, B.; Srinivasa, R.; S., Ramesh, K.; Prasad, V.; Subba Rao, P.S.V.; Parvatheeswara Rao, B. Multifunctional Ferroelectric Materials. Piezoelectricity and its applications, 2021.
- Aabid, A.; Raheman, M.A.; Ibrahim, Y.E.; Anjum, A.; Hrairi, M.; Parveez, B.; Parveen, N.; Mohammed Zayan, J. A. Systematic Review of Piezoelectric Materials and Energy Harvesters for Industrial Applications. Sensors, 2021, 21. [CrossRef]
- Aabid, A.; Parveez, B.; Raheman, A.; Ibrahim, Y.E.; Anjum, A.; Hrairi, M.; Parveen, N.; Zayan, J.M. A review of piezoelectric materials based structural control and health monitoring techniques for engineering structures: Challenges and opportunities. Actuators, 2021, 10. [CrossRef]
- Weavers, C.; K.; Hoffmann, M., R. Chemical Bubble Dynamics and Quantitative Sonochemistry. J. Phys. Chem. A 1998, 102, 6927-6934. [CrossRef]
- Suslick, K. The Chemical Effects of Ultrasound. Scientific American, 1989, 260, 80-87.
- Trevena, D. H. Ultrasonic waves in liquids. Contemporary physics, 2006, 10, 601-614. [CrossRef]
- Muthupandian, A. The characterization of acoustic cavitation bubbles – An overview. Ultrasonics Sonochemistry, 2011, 18, 864-872. [CrossRef]
- https://www.hielscher.com/ultrasonic-cavitation-in-liquids-2.htm (22 03 2025).
- Pingqing, F.; Keshuai, Z. Mechanical analysis of the contact interface of standingwave linear piezoelectric driver. Journal: AIP Advances, 2020, Volume 10, 015054. [CrossRef]
- Hanlu, L.; Weihao, R.; Lin, Y.; Chengcheng, M.; Siyu, T.; Ruijia, Y. Tunable-focus liquid lens actuated by a novel piezoelectric motor. J. Mechanical Engineering Science, 2021, Volume 235, 4337. [CrossRef]
- Jiangbo, H.; Yu, C.; Binlei, C.; Xiaoshi, L.; Tianyu, Y.; Zongda, H.; Longqi, R.; Wu, Z., J. Mechanical Systems and Signal Processing, 2023, 189, 110083.
- Jun, L.; Jao, L.; Tao, L.; Lihua, Z.; Xingrong, C.; Guoqun, Z.; Yanjin, G. Evaluation of friction reduction and frictionless stress in ultrasonic vibration forming process. J. Materials Processing Technology, 2021, 288. [CrossRef]
- Storck, H.; Littmann, W.; Wallaschek, J.; Mracek, M. The effect of friction reduction in presence of ultrasonic vibrations and its relevance to travelling wave ultrasonic motors. Ultrasonics, 2002, 40, 379-383. [CrossRef]
- Sednaoui, T.; Vezzoli, E.; Dzidek, B.; Lemaire-Semail, B.; Chappaz, C.; Adams, M. Friction Reduction Through Ultrasonic Vibration Part 2: Experimental Evaluation of Intermittent Contact and Squeeze Film Levitation. IEEE Transactions on Haptics. 2017, 10.,109. [CrossRef]
- Pham, T.M.; Twiefel, J. Ultrasonic friction reduction in elastomer - Metal contacts and application to pneumatic actuators. Physics Procedia, 2015, 70 , 55-58. [CrossRef]
- Torres, D.; A,; Vezzoli, E.; Lemaire-Semail, B.; Adams, M.; Giraud-Audine, C.; Giraud, F.; Amberg, M. Mechanisms of friction reduction in longitudinal ultrasonic surface haptic devices with non-collinear vibrations and finger displacement. https://lilloa.univ-lille.fr/bitstream/handle/20.500.12210/61756/LFrictionReduction_Vf.pdf.
- Dong, S.; Dapino; M. Experiments on Ultrasonic Lubrication Using a Piezoelectrically-assisted Tribometer and Optical Profilometer. J. Vis Exp. 2015. 103. [CrossRef]
- Sheng, D.; Marcelo, J. D. Elastic–plastic cube model for ultrasonic friction reduction via Poisson's effect. Ultrasonics, 2014, 54, 343-350. [CrossRef]
- Kumar, V.C.; Hutchings, I.M. Reduction of the sliding friction of metals by the application of longitudinal or transverse ultrasonic vibration. Tribology International, 2004, 37, 833-840. [CrossRef]
- Takashi, J.; Yukio, K.; Nobuyoshi, I.; Osamu, M.; Eiji, M.; Katsuhiko, I.; Hajime, H. An application of ultrasonic vibration to the deep drawing process. J. Materials, Processing Technology, 1998, 80–81, 406-412. [CrossRef]
- Yang, C.L.; Wu, C.S.; Shi, L. Analysis of friction reduction effect due to ultrasonic vibration exerted in friction stir welding, J. Manufacturing Processes. 2018, 35, 118-126. [CrossRef]
- Littmann, W.; Heiner, S.; Wallaschek, J. Reduction of friction using piezoelectrically excited ultrasonic vibrations, Smart Structures and Materials, Damping and Isolation, 2001, 4331. [CrossRef]
- Bai, W.; Roy, A.; Lingxi, G.; Jianfeng, X.; Silberschmidt, V. Analytical prediction of shear angle and frictional behaviour in vibration-assisted cutting. J. of Manufacturing Processes, 2021, 62, 37-46. [CrossRef]
- Sednaoui, T.; Vezzoli, E.; Dzidek, B.; Lemaire-Semail, P.; Chappaz, C.; Adams, M. Experimental evaluation of friction reduction in ultrasonic devices, IEEE World Haptics Conference (WHC), Evanston, IL, USA, 37-42, 2015. [CrossRef]
- Vezzoli, E. Friction Reduction through Ultrasonic Vibration Part 1: Modelling Intermittent Contact. IEEE Transactions on Haptics, 2017, 10, 196-207. [CrossRef]
- Amza, Gh. Sisteme ultraacustice, Publising House. Tehnica, Bucuresti, 1991.
- Amza, Gh. Actuatori electromecanici neconvenţionali, Publising House, Bucureşti, 2002.
- Heywang, W.; Lubitz, K.; Wersing, W. Piezoelectricity: evolution and future of a technology, Springer Science & Business Media, 2008.
- https://www.ndt.net/ndtaz/files/ut_formula/ut_formula.php.
- Law, H.H.; Rossiter, P.L.; Simon, G.P.; Koss, L.L. Characterization of mechanical vibration damping by piezoelectric materials, J. of Sound and Vibration, 1996, 197, 489-513. [CrossRef]
- Lin, S.; Zhang, F. Measurement of ultrasonic power and electro-acoustic efficiency of high power transducers. Ultrasonics, 2000, Jan;37(8):549-54. PMID: 11243458. [CrossRef]
- Banno, H.; Masamura, Y. N.; Naruse, Acoustic load dependency of electroacoustic efficiency in the electrostrictive ultrasonic transducer and acoustical matching, Ultrasonics, Volume 17, Issue 2, 1979, Pages 63-66, ISSN 0041-624X. [CrossRef]
- Lustig, S.; Elata, D. Ambiguous definitions of the piezoelectric coupling factor, Journal of Intelligent Material Systems and Structures. 2020, 31(14):1689-1696. [CrossRef]
- Geng, Y. Y.; Liu, L.; Leng, H., Li, H.; Wang, X.; Priya,Y. Jeba, S. Near-ideal electromechanical coupling in textured piezoelectric ceramics, Nature Communications. 13. [CrossRef]
- Gowdhaman, P. Annamalai, V.; Thakur, O.P. Piezo, ferro and dielectric properties of ceramic-polymer composites of 0-3 connectivity, Ferroelectrics, 2016, 120-129. [CrossRef]
- Jianjun, W.; Weijie, L.; Chengming, L., Peijun, W. Effective determination of Young’s modulus and Poisson’s ratio of metal using piezoelectric ring and electromechanical impedance technique: A proof-of-concept study, Sensors and Actuators A: Physical, 2021, 319. [CrossRef]
- https://www.americanpiezo.com (11 05 2025).
- https://www.nde-ed.org/NDETechniques/Ultrasonics/CalibrationMeth/standreferences.xhtml (11 05 2025).
Figure 1.
The process of obtaining wires by drawing; (a) wire drawing machine; (b) positioning a die on the wire drawing machine; (c) wire drawing die.
Figure 1.
The process of obtaining wires by drawing; (a) wire drawing machine; (b) positioning a die on the wire drawing machine; (c) wire drawing die.
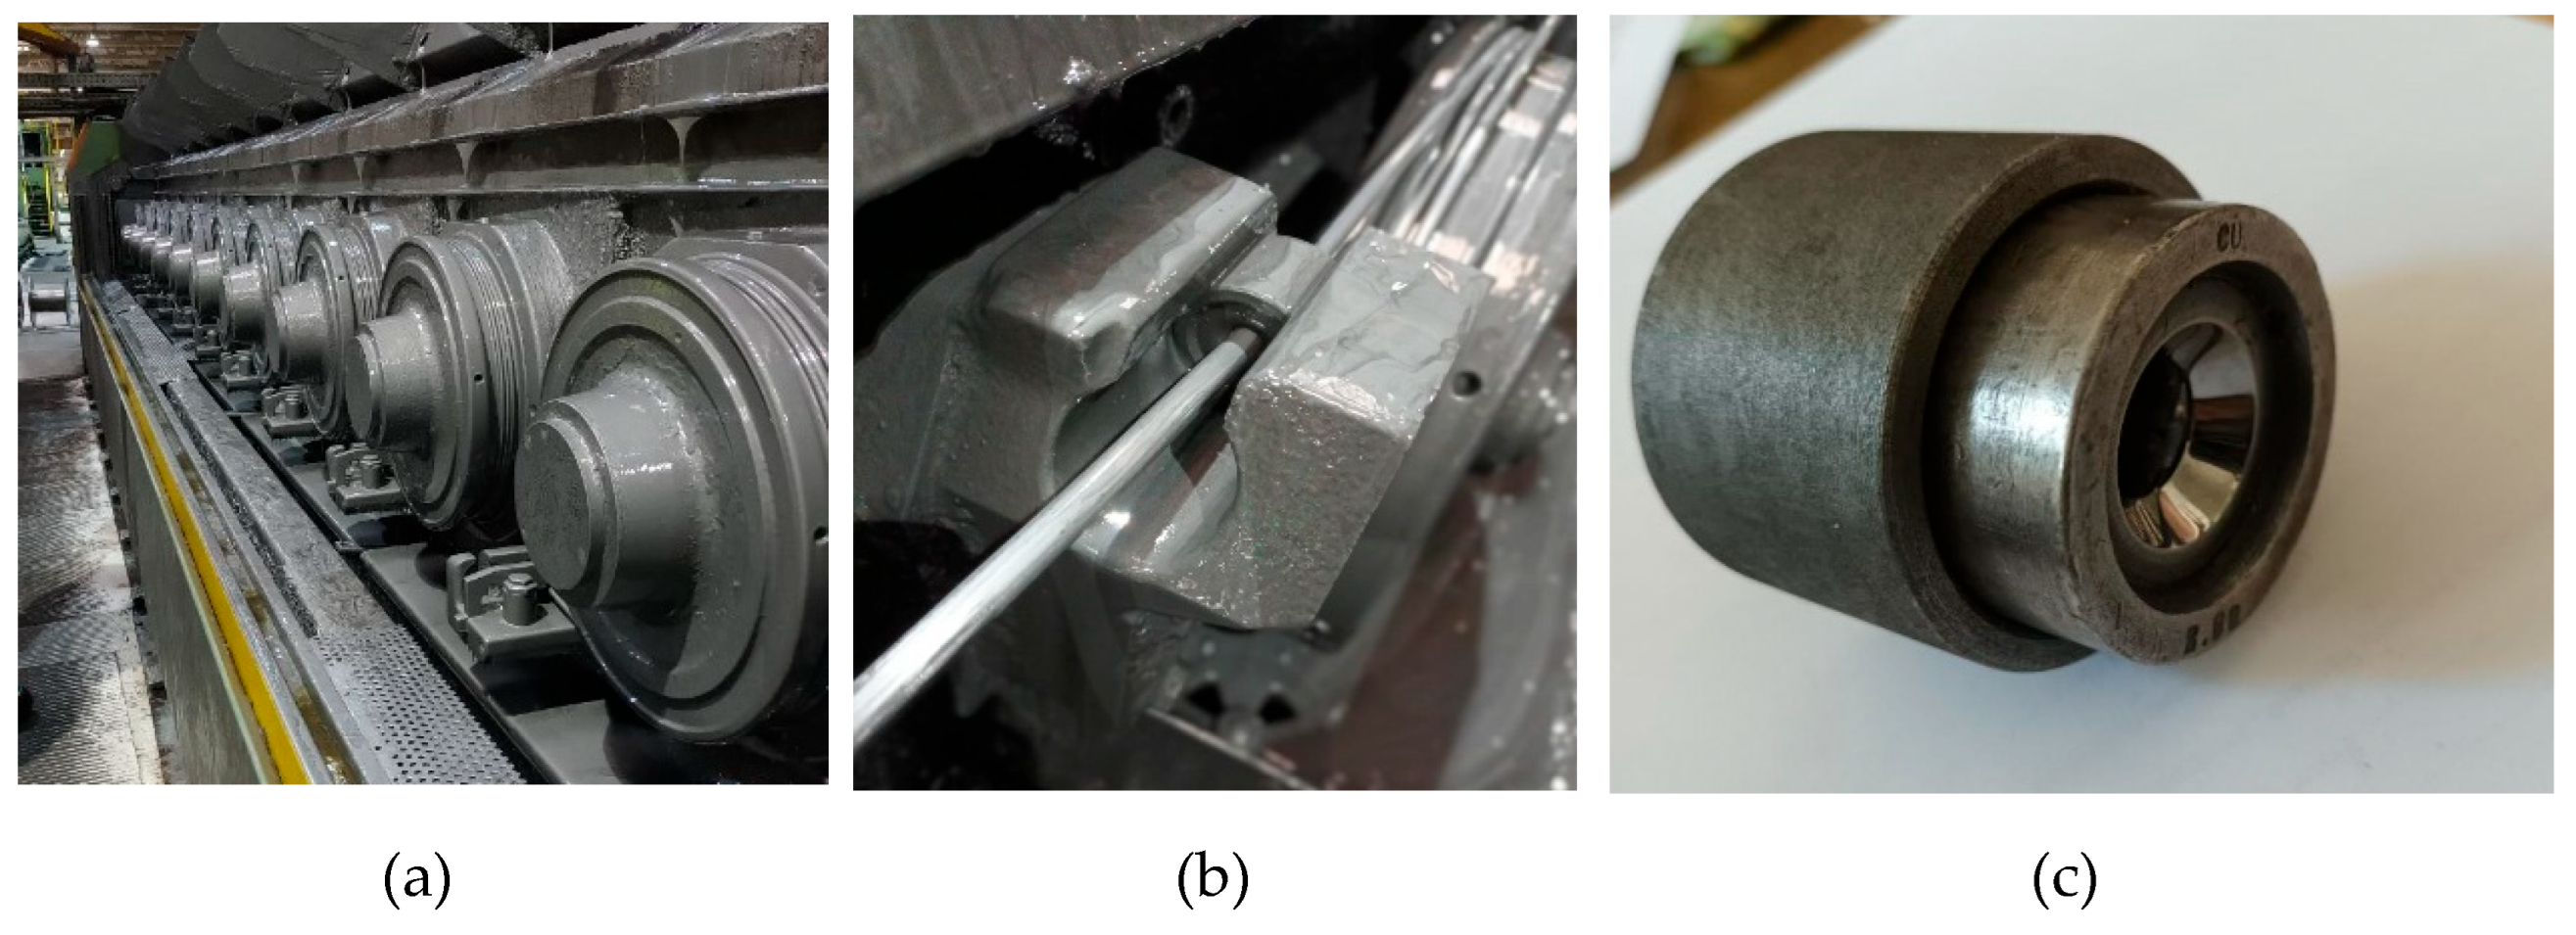
Figure 2.
Ultrasonic transducer design.
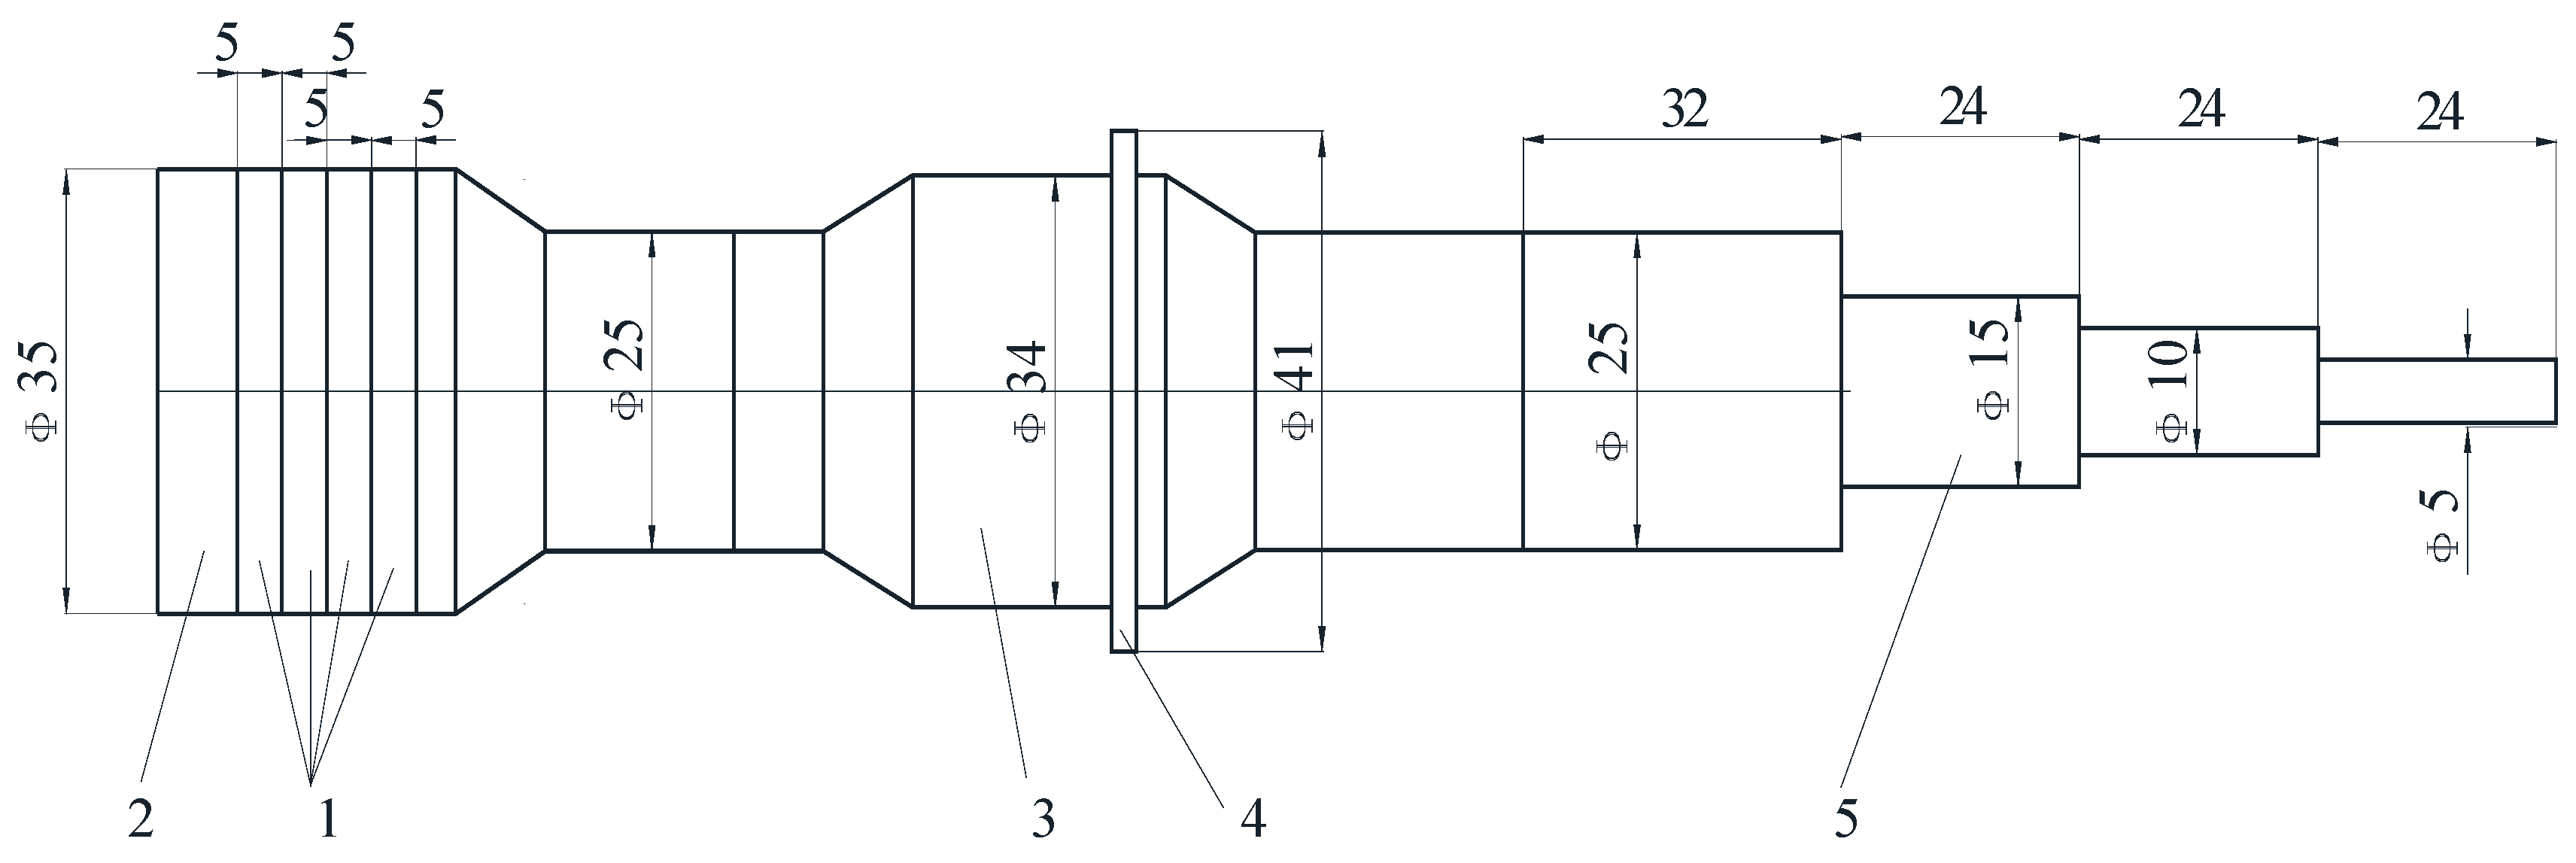
Figure 3.
Ultrasonic system modeling; (a) geometrical model of the ultrasonic system used in modeling; (a) geometrical model of the ultrasonic system used in ultrasonic activation of the die; (b) view of application of the electric potential difference.
Figure 3.
Ultrasonic system modeling; (a) geometrical model of the ultrasonic system used in modeling; (a) geometrical model of the ultrasonic system used in ultrasonic activation of the die; (b) view of application of the electric potential difference.
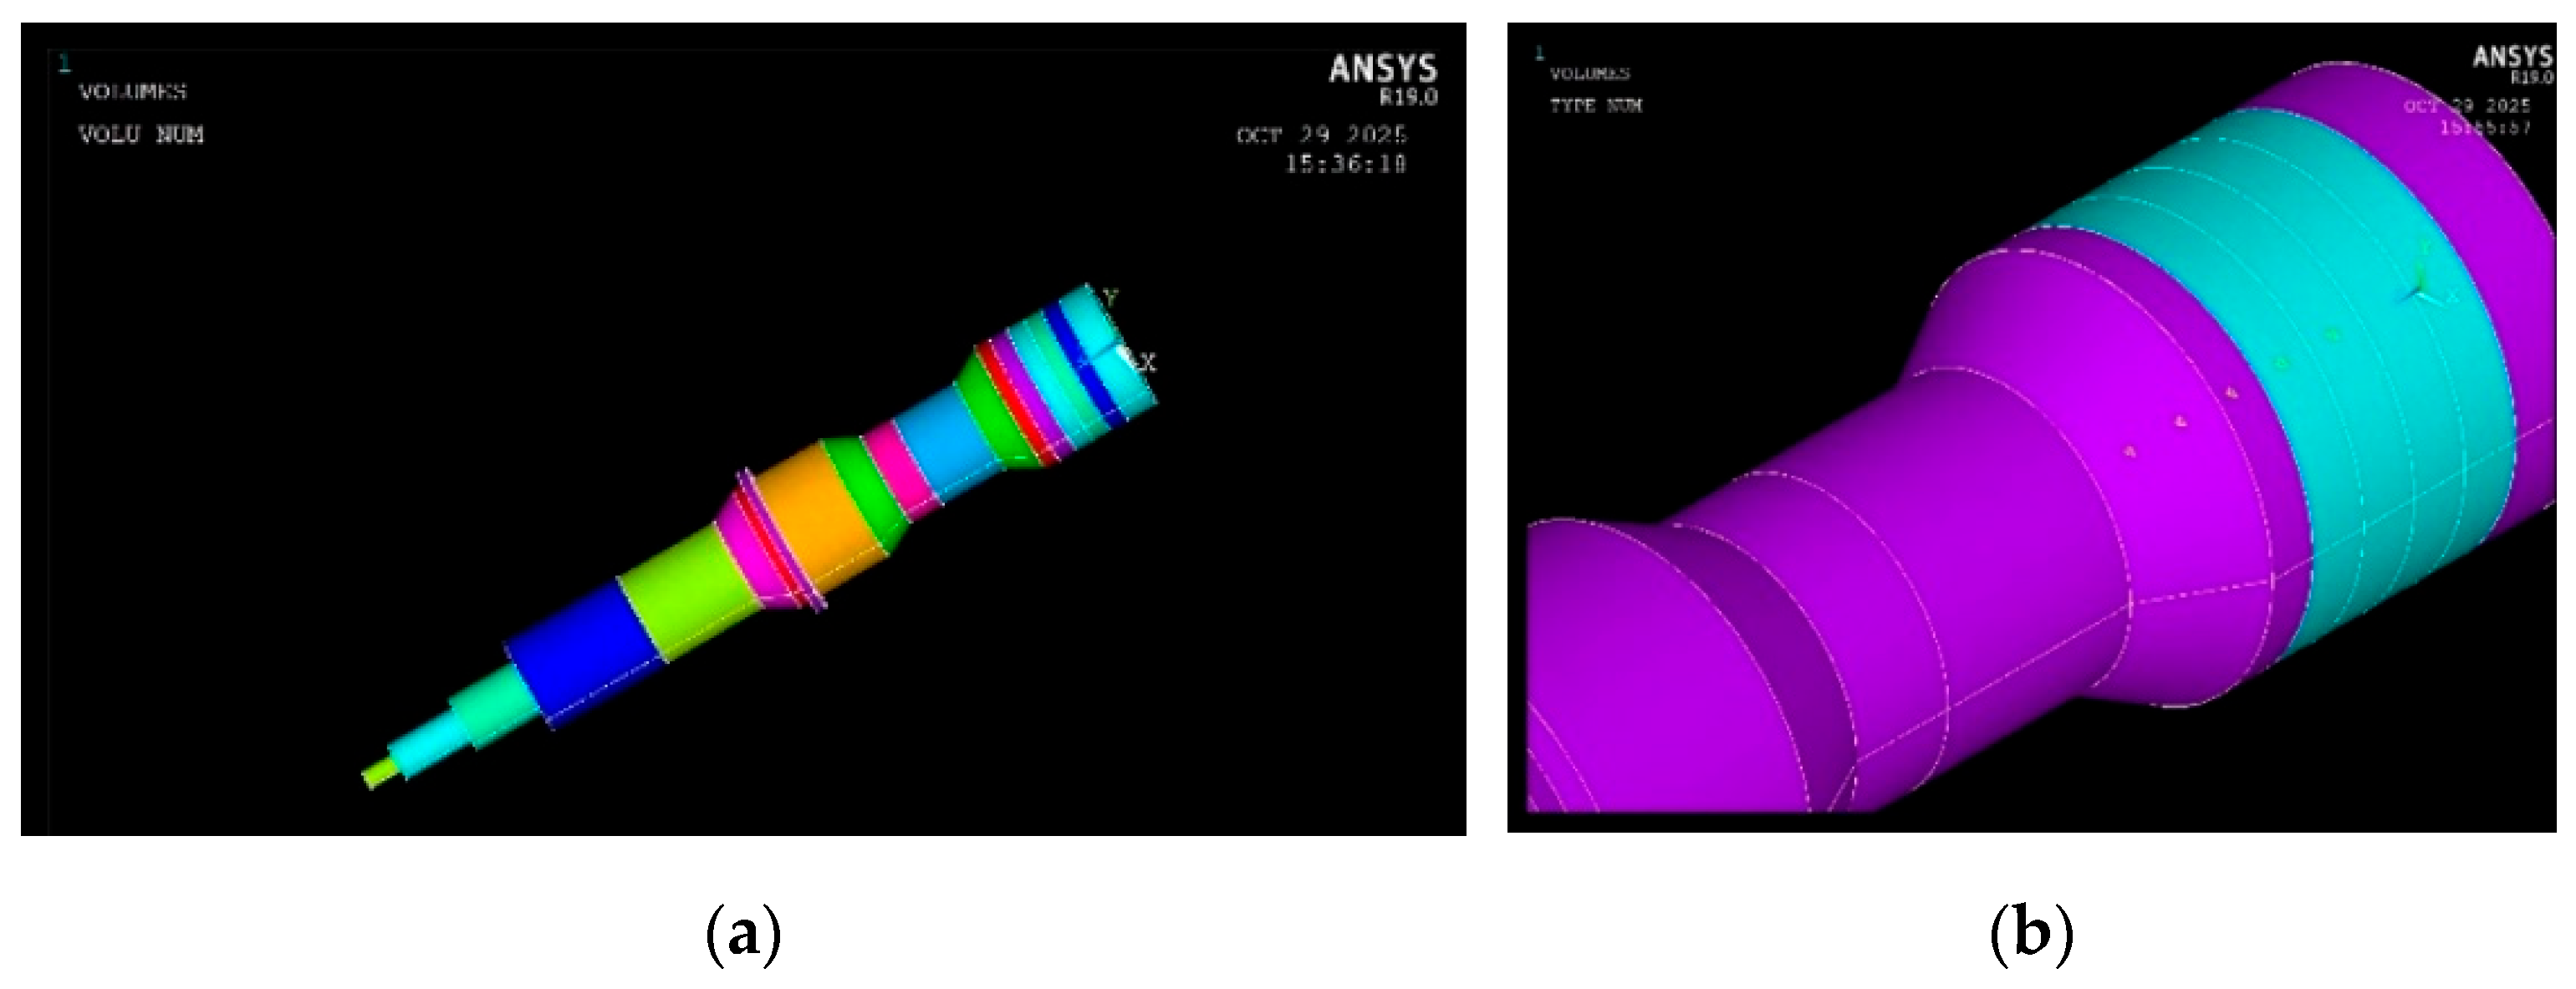
Figure 4.
Modal analyse of the ultrasonic system: (a) vibration mode at f = 33990 Hz; (b) vibration mode at f = 36000 Hz.
Figure 4.
Modal analyse of the ultrasonic system: (a) vibration mode at f = 33990 Hz; (b) vibration mode at f = 36000 Hz.
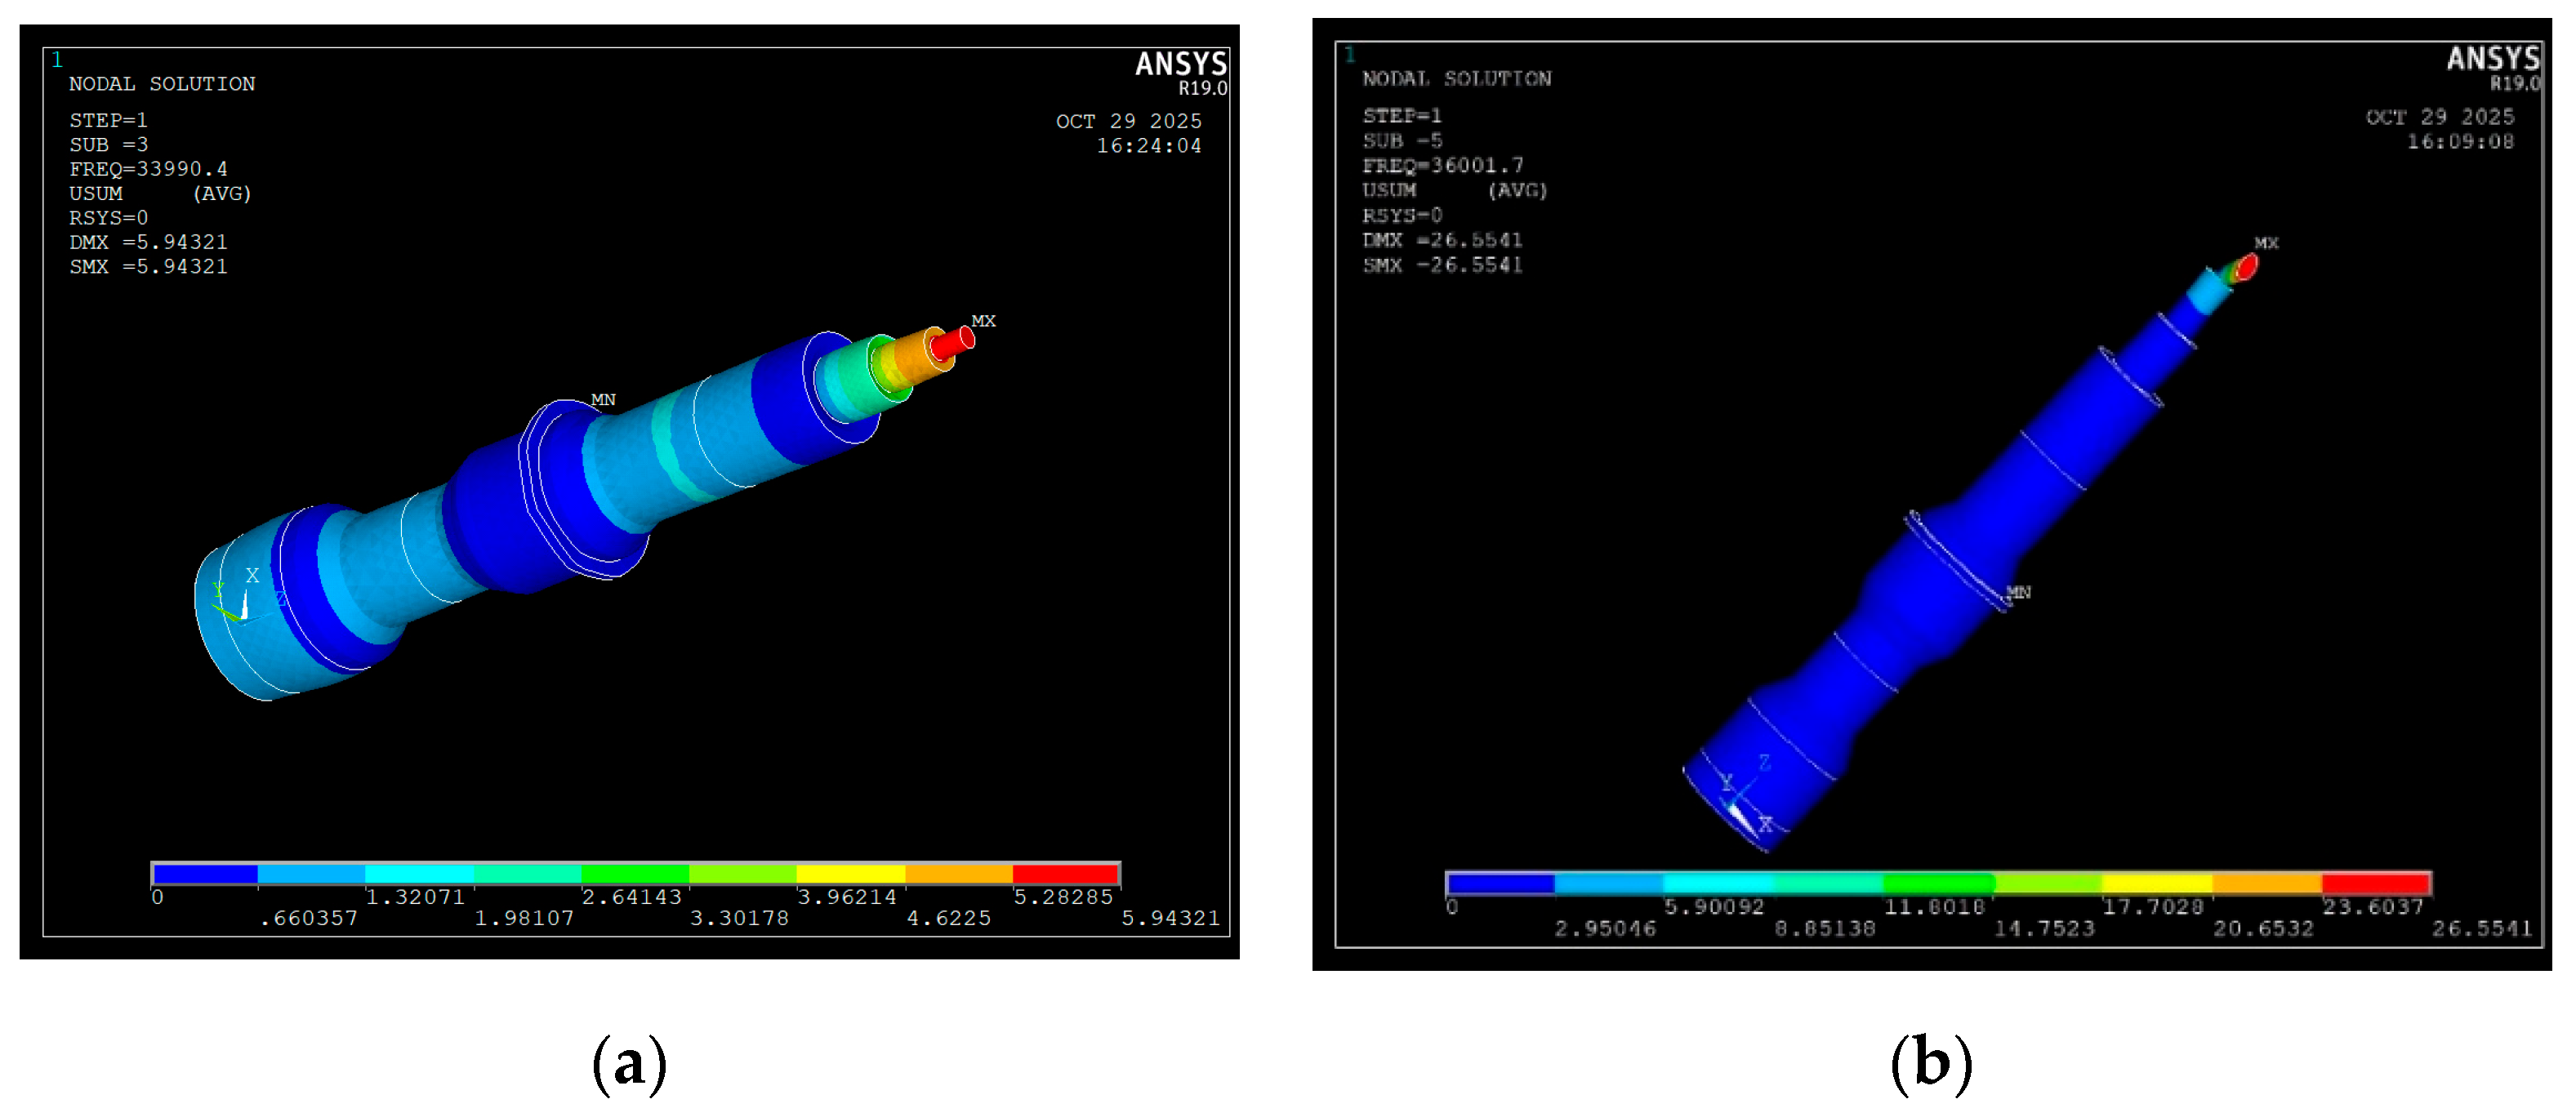
Figure 5.
Mechanical stress calculation at frequency f = 33990 Hz. (a) OX axis; (b) OY axis; (c) OZ axis.
Figure 5.
Mechanical stress calculation at frequency f = 33990 Hz. (a) OX axis; (b) OY axis; (c) OZ axis.

Figure 6.
Mechanical stress calculation at frequency f = 33990 Hz. (a) OX axis; (b) OY axis; (c) OZ axis.
Figure 6.
Mechanical stress calculation at frequency f = 33990 Hz. (a) OX axis; (b) OY axis; (c) OZ axis.
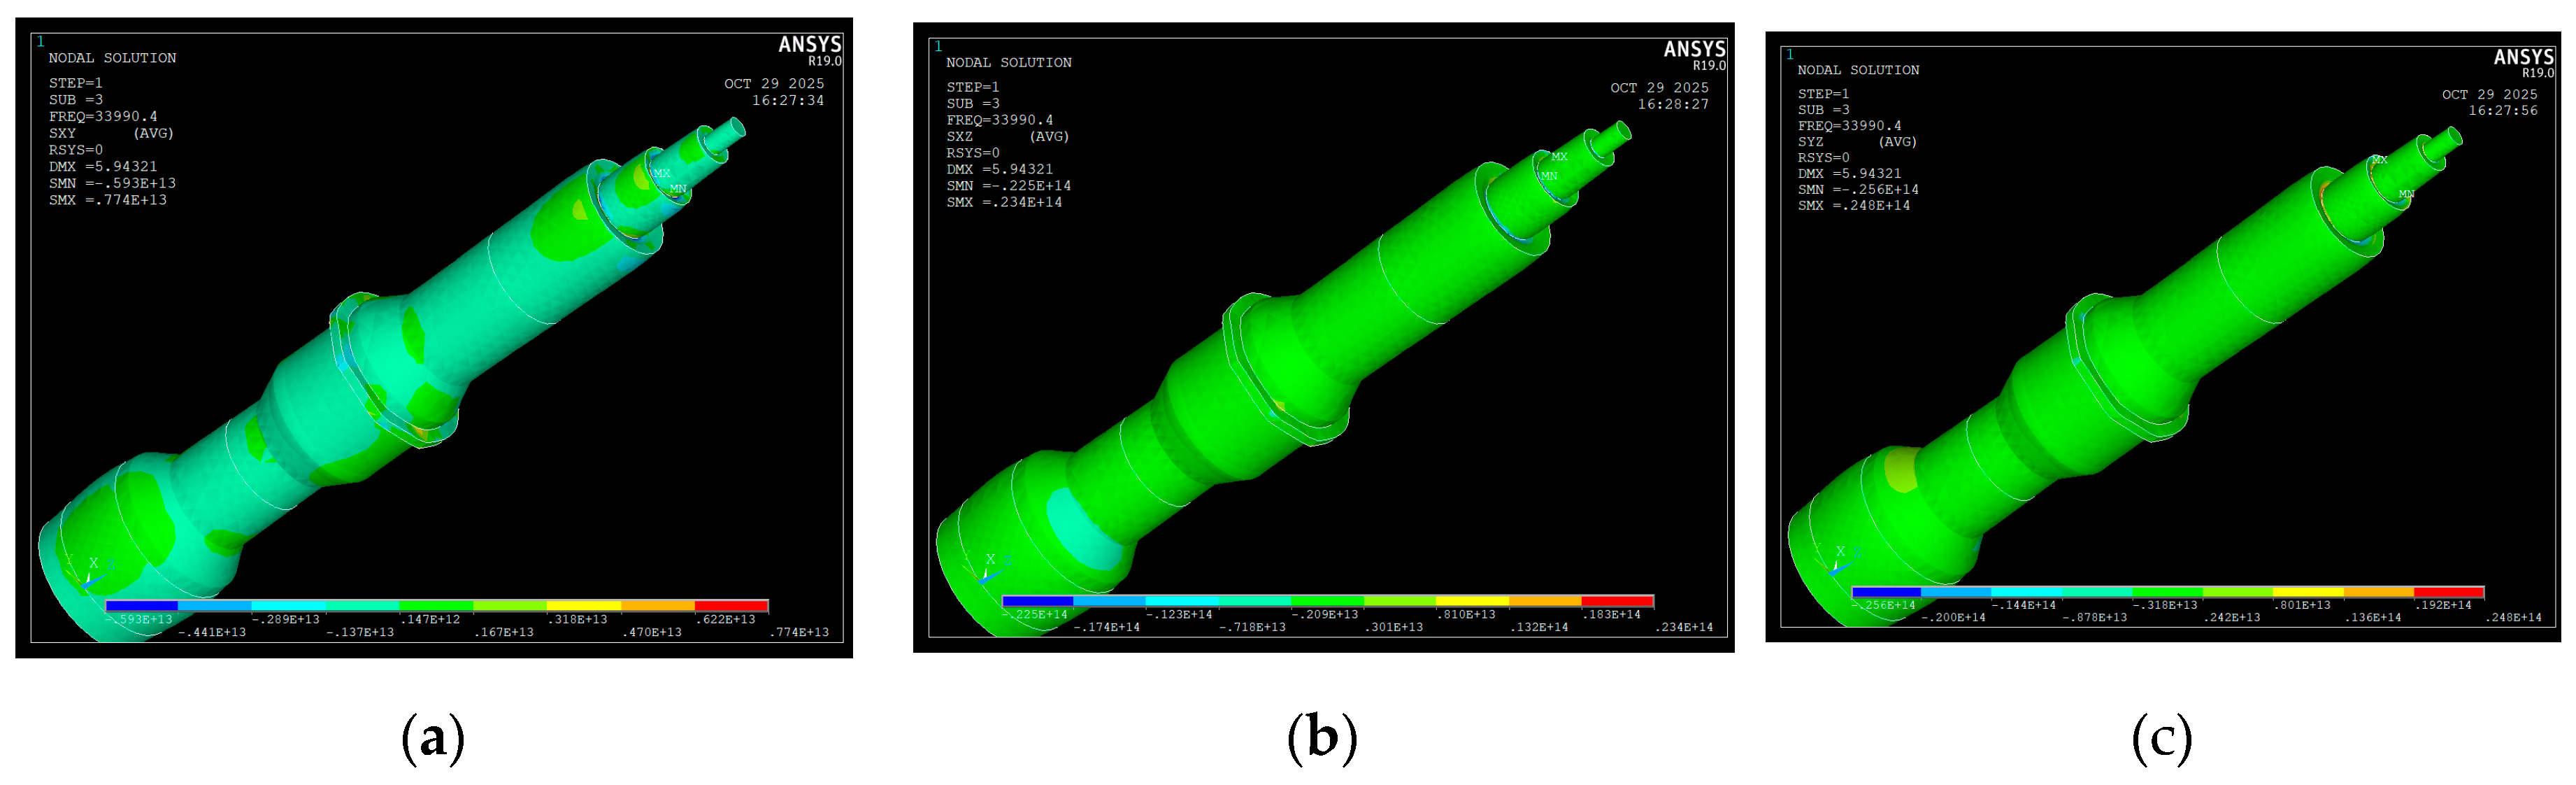
Figure 7.
Mechanical stress calculation at frequency f = 33990 Hz. (a) S1 stress; (b) S2 stress; (c) S3 stress.
Figure 7.
Mechanical stress calculation at frequency f = 33990 Hz. (a) S1 stress; (b) S2 stress; (c) S3 stress.
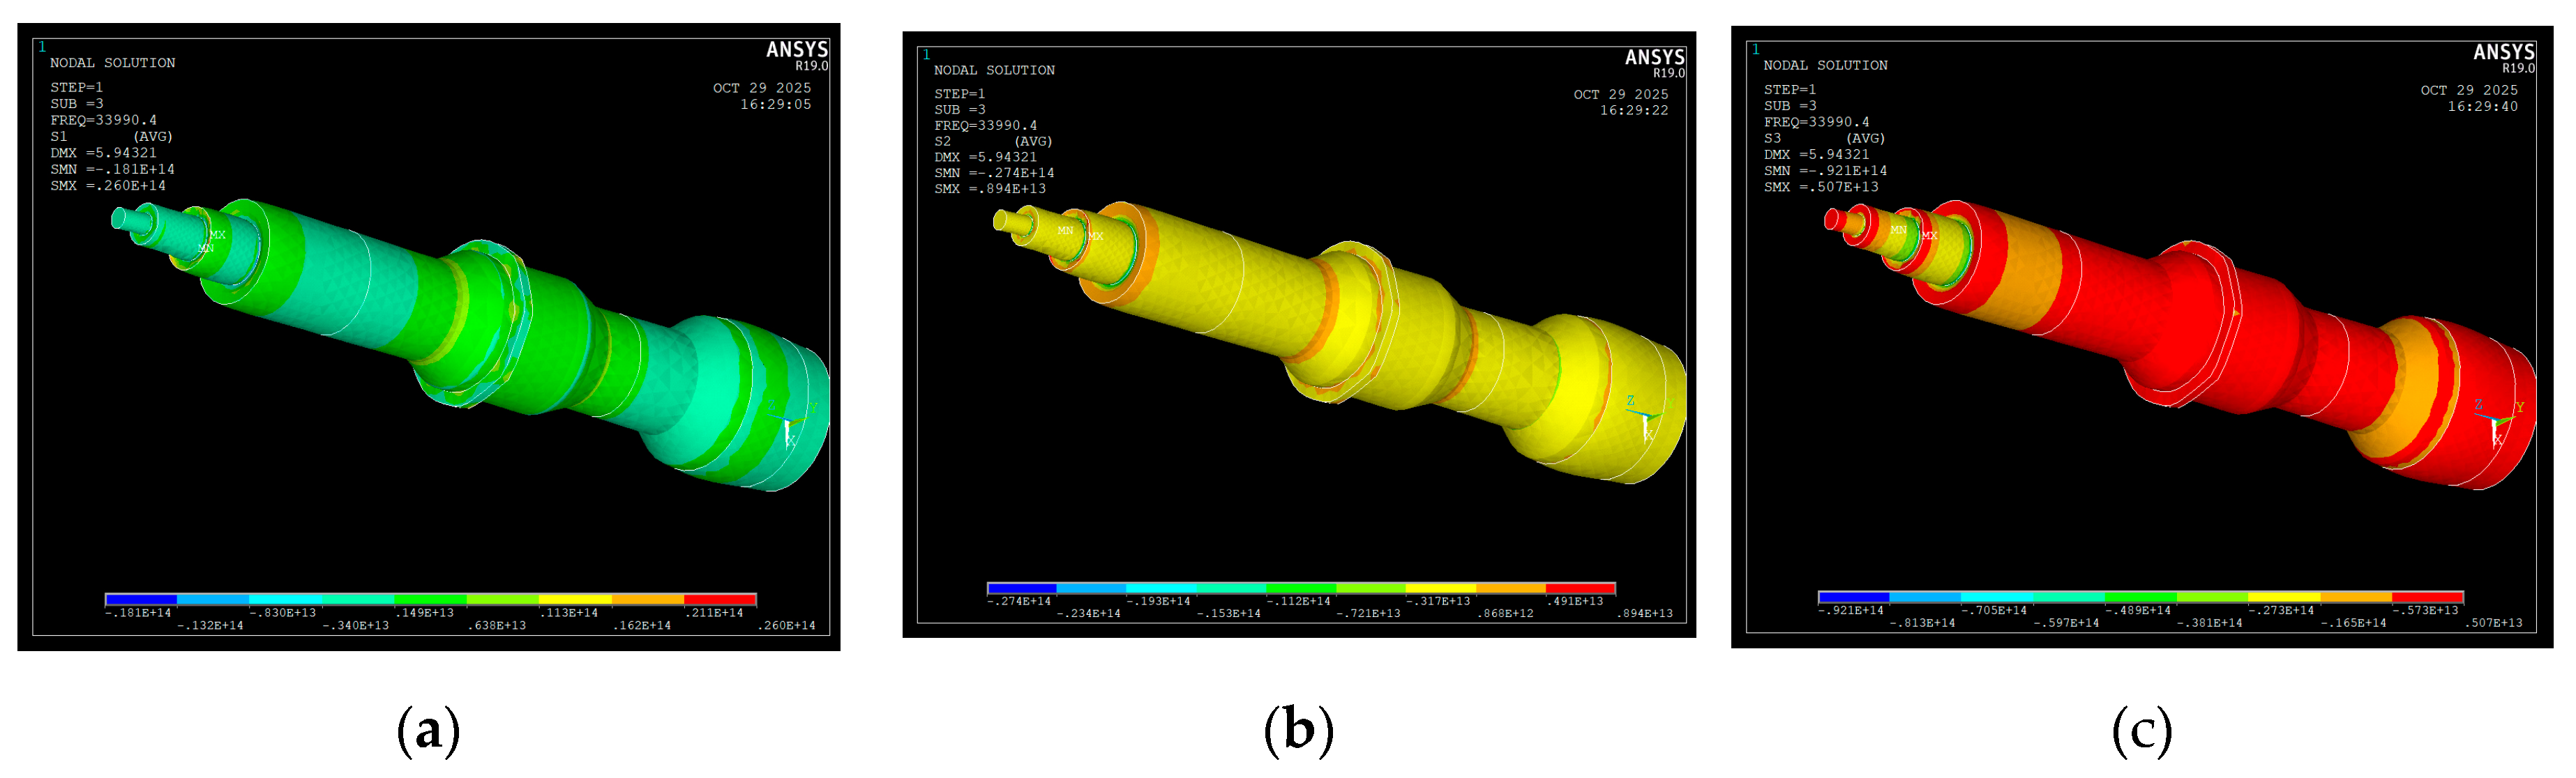
Figure 8.
Schematic presentation active elements of the pneumatic system.
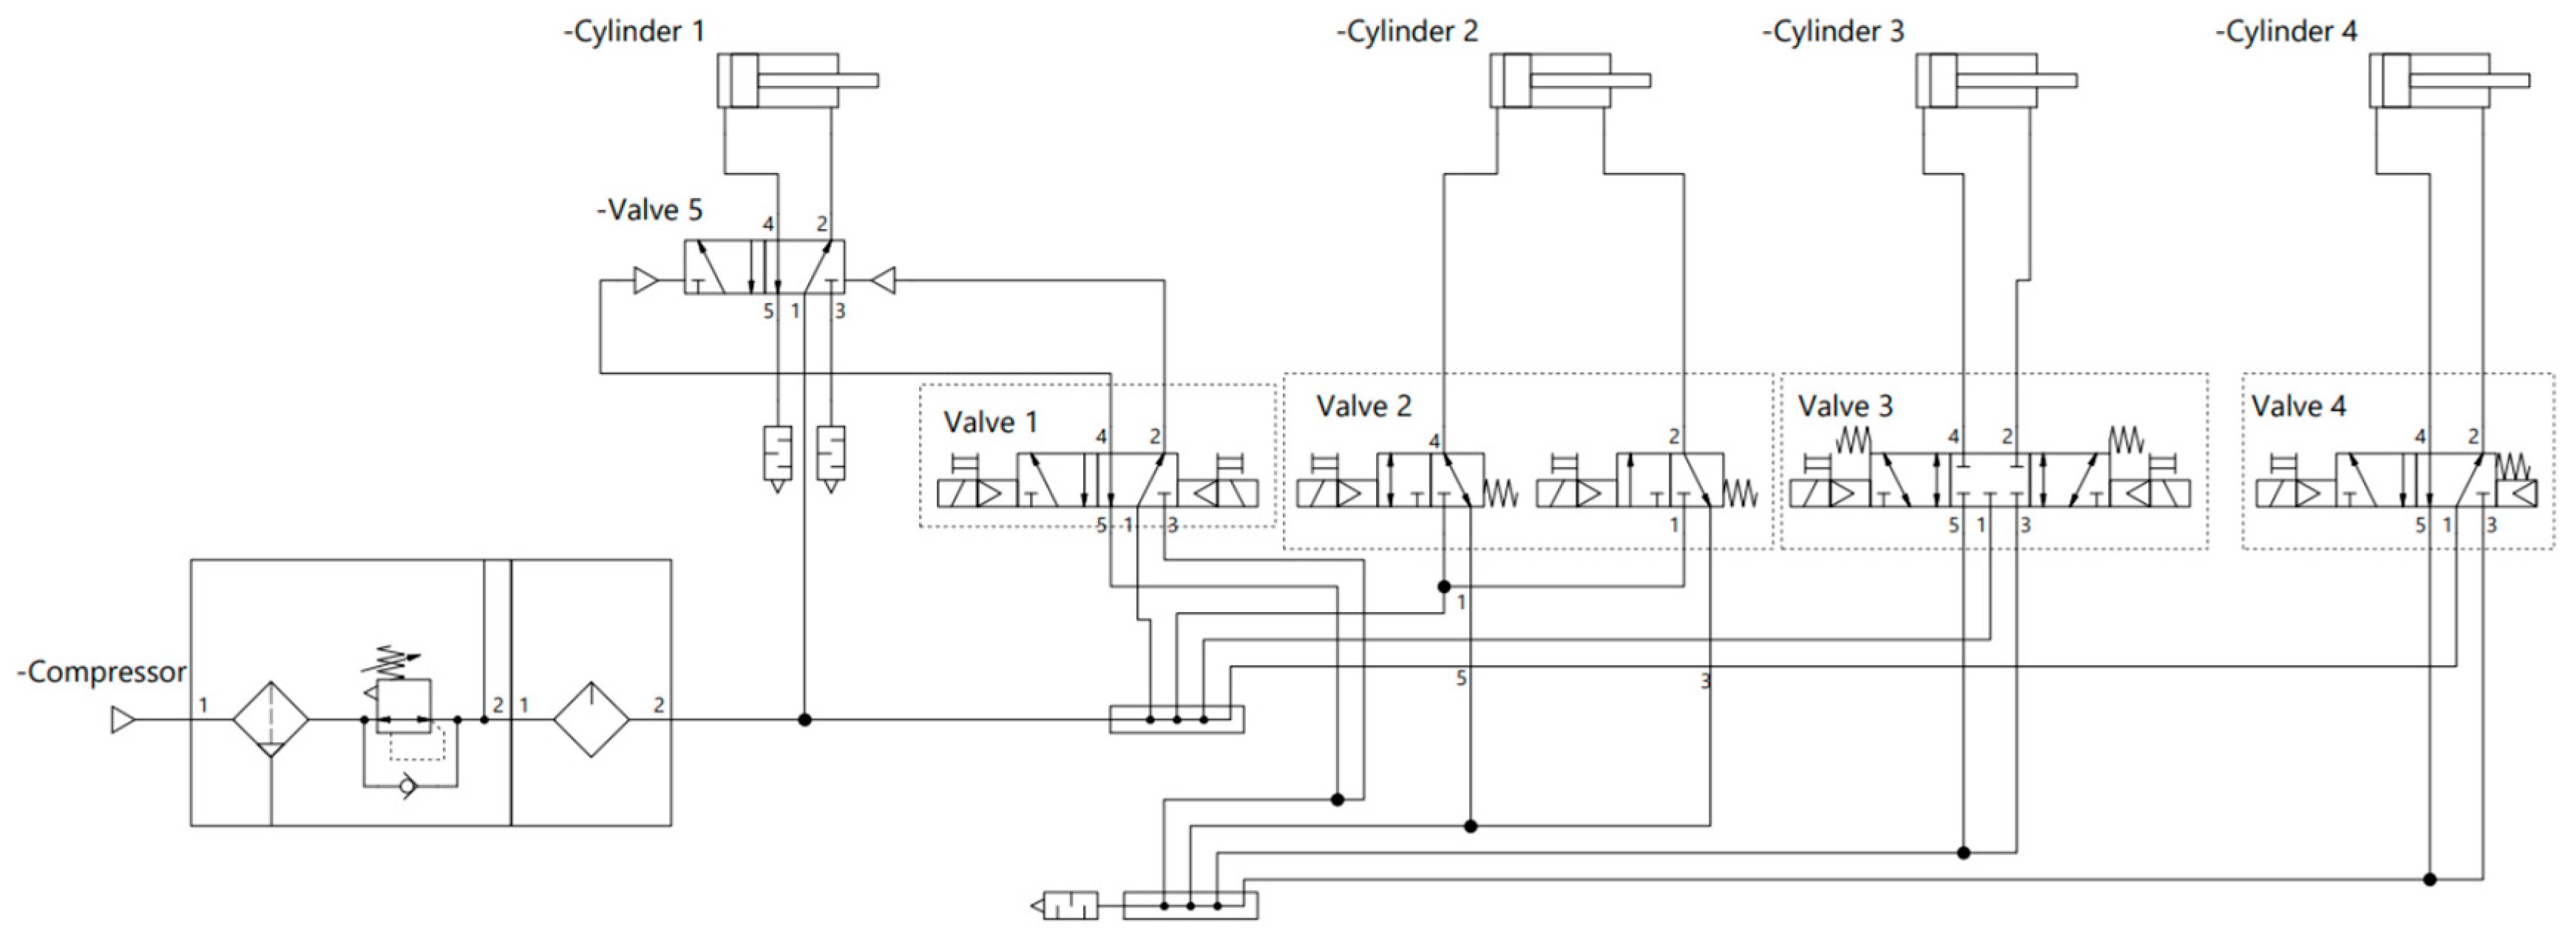
Figure 9.
Experimental stand for carrying out the wire drawing process in ultrasonic field.
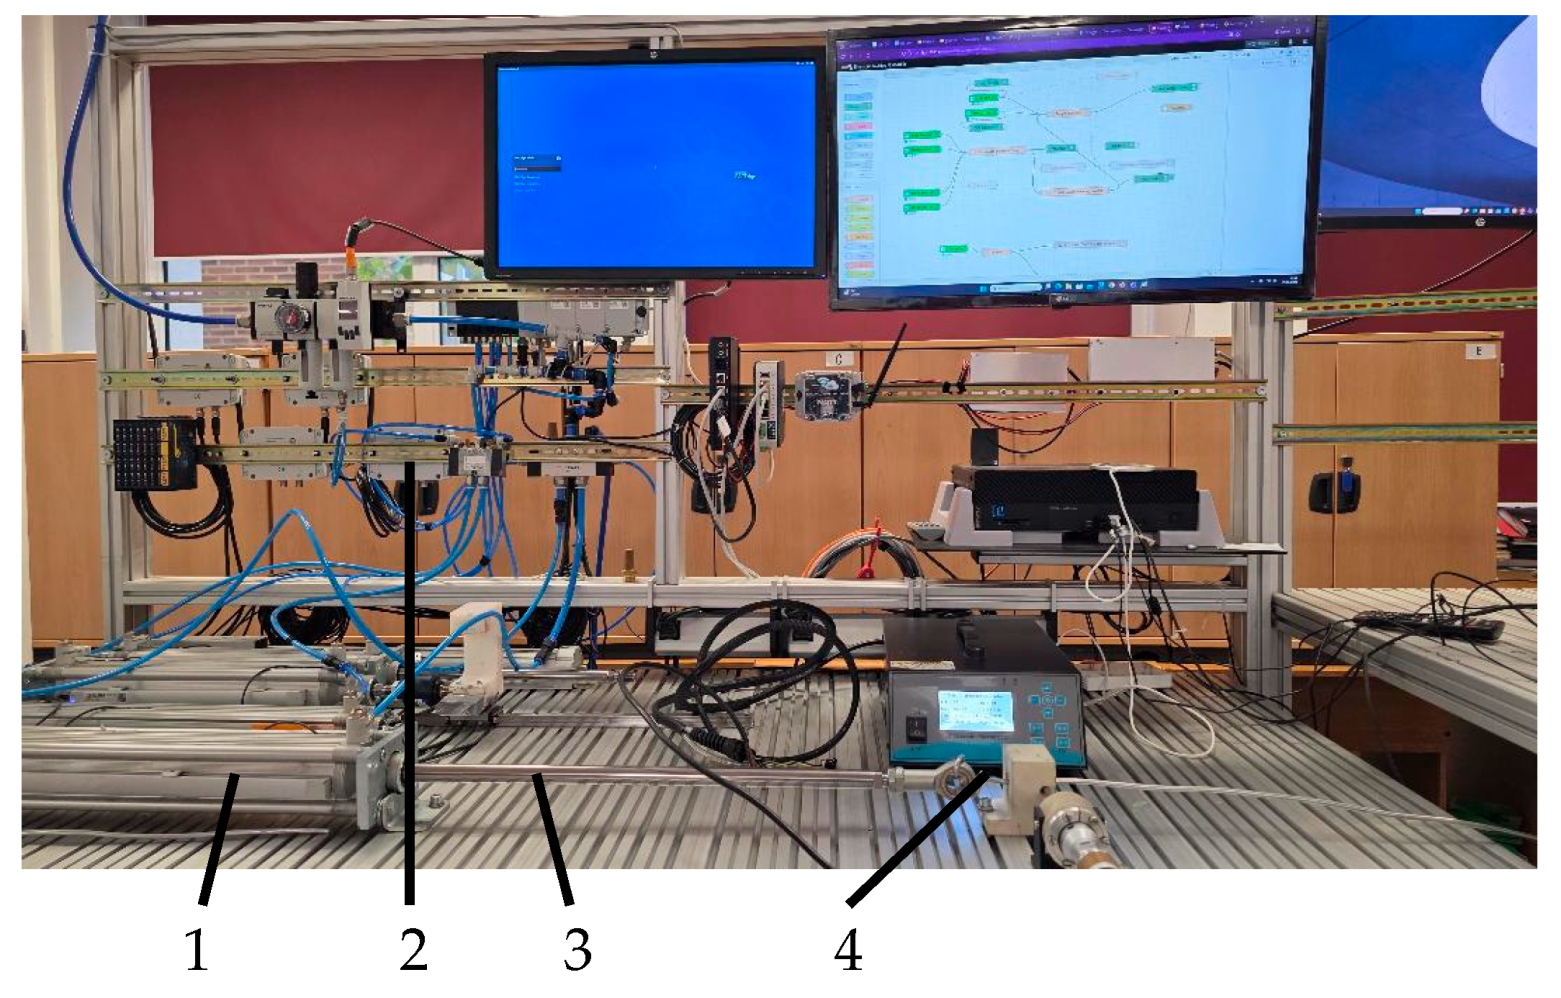
Figure 10.
Elements of the experimental stand used in ultrasonic assisted wire drawing process; (a) 5 - die for wire drawing process, 6 – 3D printed support of the die, 7 – ultrasonic concentrator, 8 – ultrasonic transducer; (b) 9 – ultrasonic generator.
Figure 10.
Elements of the experimental stand used in ultrasonic assisted wire drawing process; (a) 5 - die for wire drawing process, 6 – 3D printed support of the die, 7 – ultrasonic concentrator, 8 – ultrasonic transducer; (b) 9 – ultrasonic generator.

Figure 11.
Graph of the percentage increase in drawing speed based on experimental data and the prediction of their evolution up to the industry working values 12...13 m/sec.
Figure 11.
Graph of the percentage increase in drawing speed based on experimental data and the prediction of their evolution up to the industry working values 12...13 m/sec.
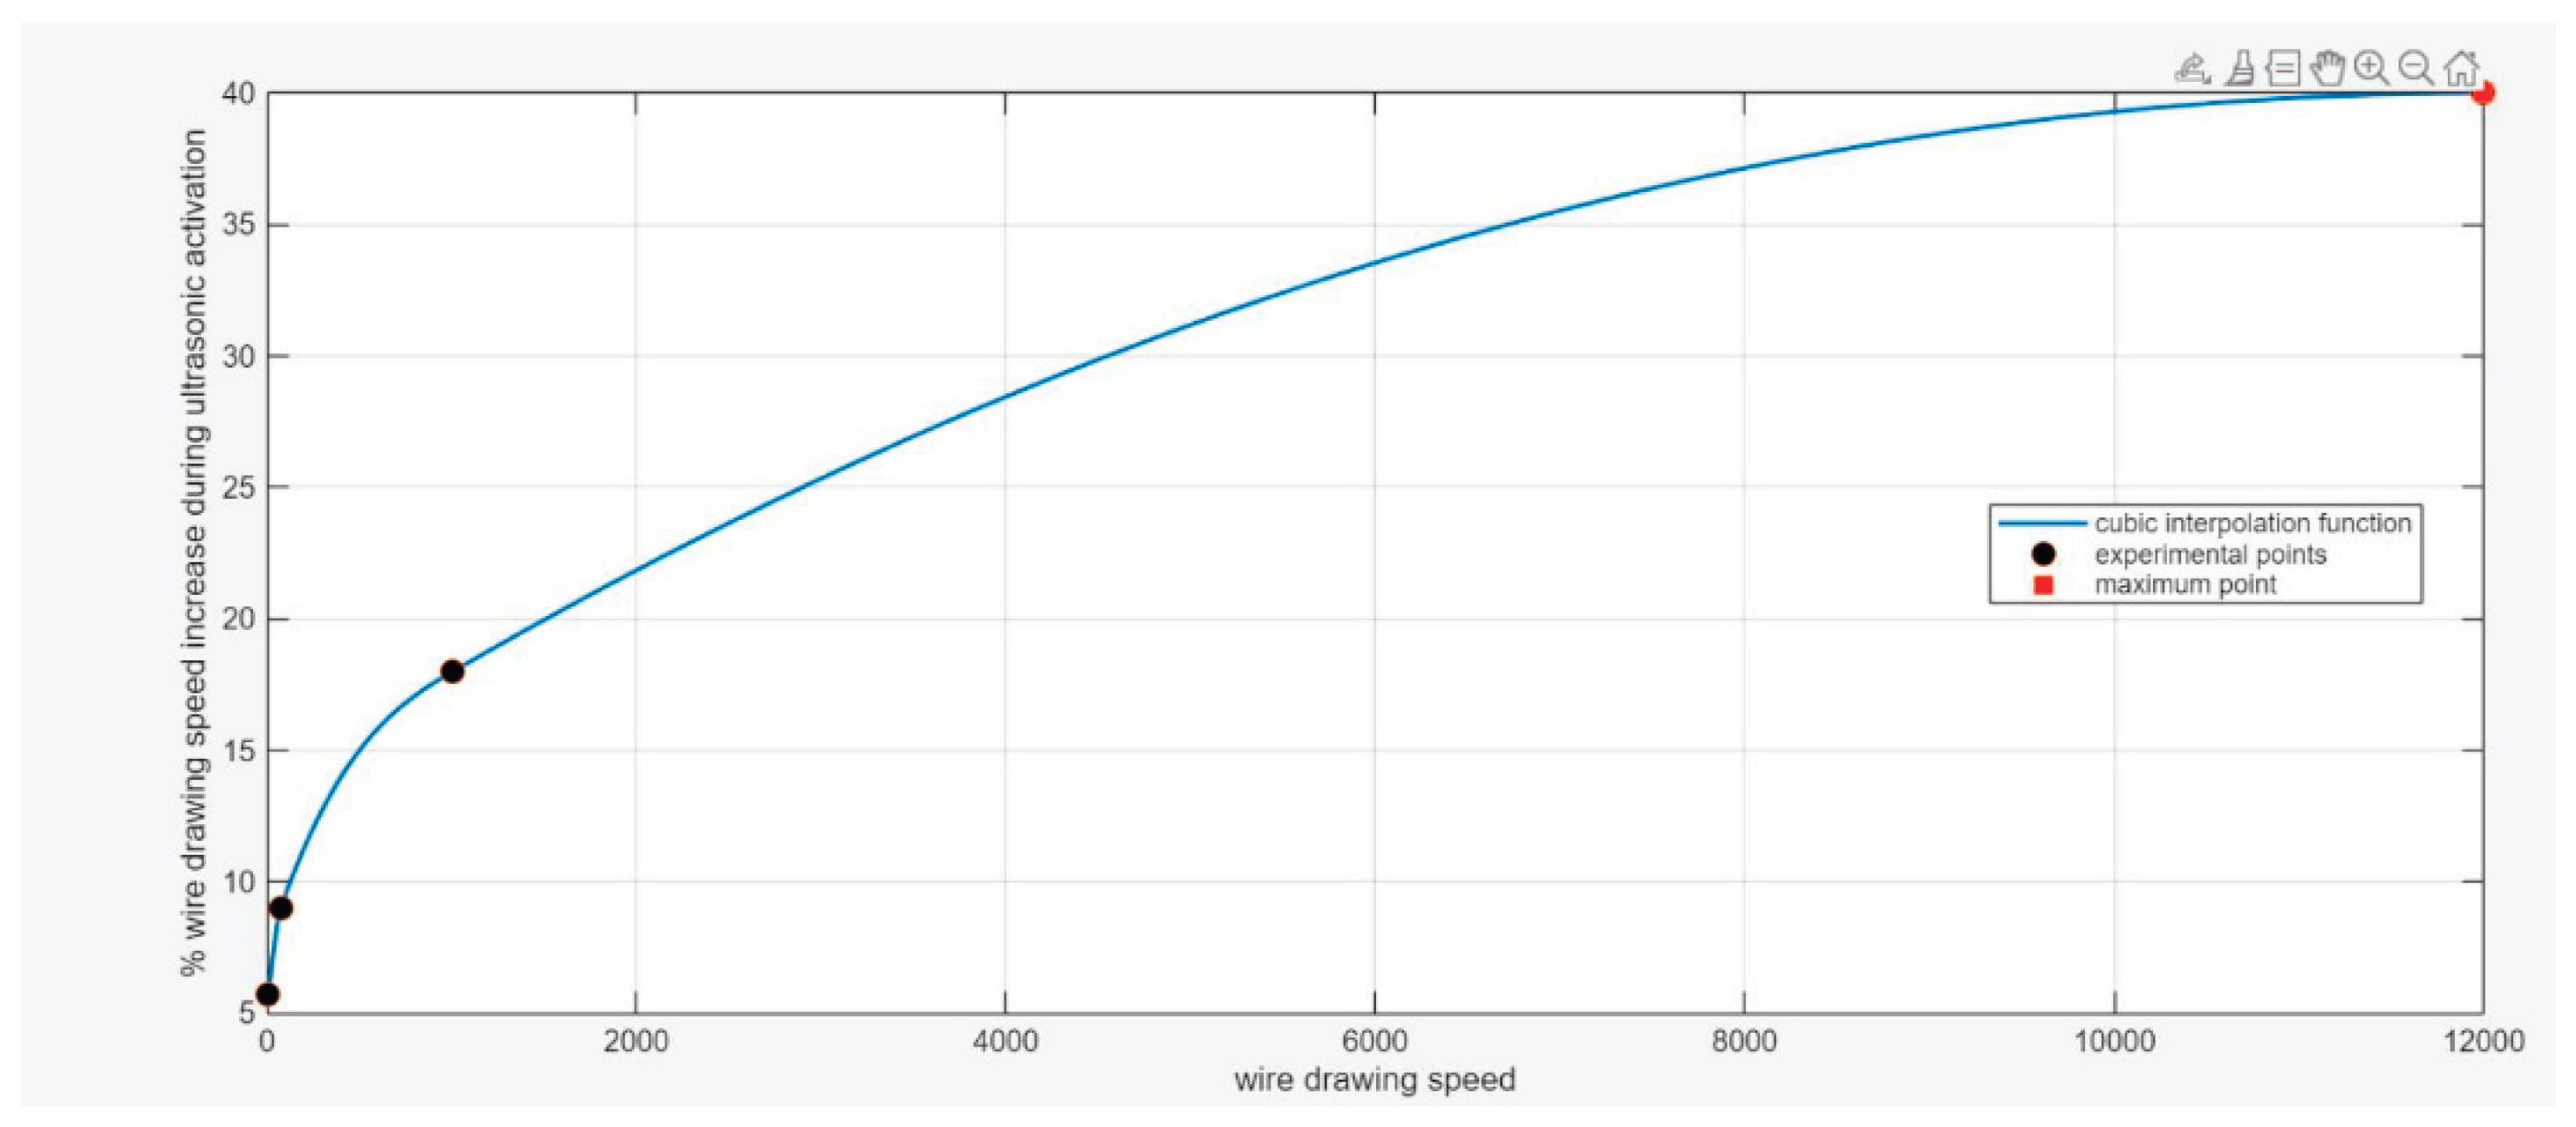

Table 1.
Stress values on the Ox, Oy and Oz axis for the frequency f = 33390 Hz.
| Sx [N/m2] |
SY [N/m2] |
Sz [N/m2] |
|
|---|---|---|---|
| Nodal flange | -0.38 E13 – 0.93 E12 | -0.38 E13 – 0.1 E13 | -0.63 E13 – 0.43 E13 |
| Piezoceramic elementes | -0.38 E13 – 0.93 E12 | -0.38 E13 – 0.1 E13 | -0.63 E13 – 0.43 E13 |
Table 2.
Shear stress values on the XY, XZ and YZ planes for the frequency f = 33390 Hz.
| Sxy [N/m2] |
Sxz [N/m2] |
Syz [N/m2] |
|
|---|---|---|---|
| Nodal flange | -0.13 E13 – 0.16 E13 | -0.2 E13 – 0.3 E13 | -0.31 E13 – 0.24 E13 |
| Piezoceramic elementes | -0.13 E13 – 0.14 E12 | -0.2 E13 – 0.3 E13 | -0.31 E13 – 0.24 E13 |
Table 3.
S1, S2 and S3 stress values for the frequency f = 33990 Hz.
| S1 [N/m2] |
S2 [N/m2] |
S3 [N/m2] |
|
|---|---|---|---|
| Nodal flange | -0.14 E13 – 0.63 E13 | -0.31E13 – 0.86 E13 | -0.57 E13 – 0.5 E13 |
| Piezoceramic elementes | -0.14 E13 – 0.63 E13 | -0.31E13 – 0.86 E13 | -0.57 E13 – 0.5 E13 |
Table 4.
Presentation of experimental results regarding the increase in drawing speed when applying the ultrasonic field to the aluminum wire drawing die.
Table 4.
Presentation of experimental results regarding the increase in drawing speed when applying the ultrasonic field to the aluminum wire drawing die.
| Test No. | Drawing speed without cooling liquid lubrication [mm/s] |
Drawing speed with cooling liquid lubrication [mm/s] |
Drawing speed with cooling liquid lubrication with application of ultrasonic field (ultrasonic lubrication) [mm/s] |
|---|---|---|---|
| 1. | 43.3 | 51.81 51.81 51.81 |
54.38 |
| 2. | 54.67 | ||
| 3. | 55.26 | ||
| 4. | 95.5 95.5 95.5 |
104.31 | |
| 5. | 105.9 | ||
| 6. | 104.82 | ||
| 7. | 1005 | 1214 | |
| 8. | 1005 | 1214.9 | |
| 9. | 1005 | 1215.2 |
Disclaimer/Publisher’s Note: The statements, opinions and data contained in all publications are solely those of the individual author(s) and contributor(s) and not of MDPI and/or the editor(s). MDPI and/or the editor(s) disclaim responsibility for any injury to people or property resulting from any ideas, methods, instructions or products referred to in the content. |
© 2025 by the authors. Licensee MDPI, Basel, Switzerland. This article is an open access article distributed under the terms and conditions of the Creative Commons Attribution (CC BY) license (http://creativecommons.org/licenses/by/4.0/).
Copyright: This open access article is published under a Creative Commons CC BY 4.0 license, which permit the free download, distribution, and reuse, provided that the author and preprint are cited in any reuse.


