
Submitted:
09 December 2025
Posted:
09 December 2025
You are already at the latest version
Abstract
Rain erosion testing of wind turbine blade coatings is still based almost entirely on kinetic test parameters while ignoring the temperature–salinity domains that control field damage. This short communication quantifies how far current rain erosion test conditions diverge from offshore environmental temperature–salinity envelopes. Using seas surface climatology for four offshore regions (North Sea, US Atlantic shelf, Taiwan Strait–South China Sea, Bass Strait) and temperature and water composition parameters from 11 water-based erosion studies, we show the environmental sea surface temperature (SST) spans 5 – 17 °C in the North Sea and 8 – 24 °C in the US Atlantic, rising to 20 – 32 °C in the Asia–Pacific and Bass Strait, with sea surface salinity (SSS) typically 31 – 35.5 PSU. In contrast, all reported droplet erosion tests were run between 18 and 29 °C; three of 11 used only freshwater (~ 0 PSU) and the remainder a single seawater-like level (3.0 – 3.5% NaCl, ≈30 – 35 PSU). No study combined marine salinity with cold (<10 °C) or tropical (≥28 – 30 °C) temperatures, despite evidence of markedly higher damage in saline media and up to an order of magnitude increase in polyurethane rates near the glass transition region.
Keywords:
leading edge erosion
; rain erosion testing
; wind turbine blades
; sea surface temperature
; sea surface salinity
; offshore wind
1. Introduction
The operational reliability of offshore wind turbines depends strongly on the durability of blade surfaces exposed to high wind speeds, frequent precipitation and saline marine conditions. Leading edge erosion (LEE), driven by repeated high velocity hydrometeor impacts, can reduce annual energy production by up to 5% and necessitate costly repairs [1]. Offshore assets face heightened erosion risks due to elevated wind speeds, greater rainfall frequency and persistent salt exposure [2].
Qualification of leading-edge protection (LEP) systems relies principally on controlled high velocity impact tests such as whirling arm rigs and jet impingement systems. These procedures regulate impact velocity and droplet size (typically 2.2 – 3.5 mm) [3] in accordance with DNV-RP-0171 guidance [4], but across the reviewed erosion studies [5,6,7,8], they typically conducted using deionised or municipal freshwater at ambient laboratory temperatures. Although ageing mechanisms such as ultraviolet exposure, humidity, salinity and thermal cycling are recognised as important modifiers of coating performance [2], they are rarely incorporated directly into the erosion phase of testing. As a result, LEP systems are often evaluated under a narrow set of benign conditions that do not represent marine operational environments.
Field-based studies further demonstrate that erosion severity varies significantly across regions. Spatial differences in precipitation intensify, wind speed and impact frequency produce strong geographic variability in erosion loads across North America [9], western Ireland [10] and the Netherlands [11]. These findings show that a complete assessment of LEE must consider both kinetic forcing and the environmental conditions that modify material susceptibility.
This communication rystalliza experimentally used temperature and water-composition parameters from erosion-relevant studies and compares them with global temperature and salinity distributions. The aim is to identify mismatches between laboratory testing conditions and real operational environments and to highlight regions where environmental representation is currently lacking.
2. Materials and Method
Environmental envelopes were derived through a comparative synthesis of peer-reviewed meteorological and oceanographic studies. SST and SSS values were extracted from regional climatologies, hydrographic analyses and typhoon microphysics research.
Reported seasonal and spatial conditions were then rystalli into three representative market typologies:
- The North Sea, a mature offshore wind region characterised by temperature to sub-polar climatic influence.
- The U.S. Atlantic, an emerging market exhibiting strong thermal stratification and seasonal variability.
- The Asia–Pacific Region, a rapidly expanding market shaped by tropical and subtropical cyclone activity.
Published erosion-relevant experiments were systematically reviewed to compile the current experimental envelope for LEP systems. Test parameters extracted from literature included imposed temperatures, saline or aqueous compositions, droplet conditions and combined aging-impact procedures used in whirling-arm and related erosion studies. These data were used to rystallizat the temperature and salinity ranges represented in existing laboratory practice and to identify the extent to which prior work integrates environmental co-stressors. Where experimental studies reported salinity as % NaCl, values were converted to approximate Practical Salinity Unit (PSU) using the reengineering approximation 1% NaCl ≈ 10 PSU to enable comparison with environmental salinity ranges [12].
3. Results
3.1. Environmental Envelope
3.1.1. The North Sea: The “Cold-Brittle” Trap
The North Sea exhibits strong seasonal thermal gradients that influence coating performance. Winter SSTs typically reach 5 – 9 °C, while summer SSTs rise to 12 – 17 °C according to regional climatology [13]. During easterly atmospheric flow, polar-continental air masses can reduce air temperatures to -5 °C to -10 °C [14] while the sea remains unfrozen. Under these conditions, supercooled precipitation or freezing rain can impinge blades operating within the polymer’s glass-transition regime, thereby heightening material susceptibility to erosion [15].
Marked spatial variability is evident across the basin. The northeastern North Sea experiences colder winters, higher wind speeds and heavier rainfall than the southwestern sector. The Netherlands Organisation for Applied Scientific Research (TNO) analyses report that erosion rates in the northeastern region are approximately 20% higher, and that nearly 30% of annual damage occurs within twelve hours during frontal passages with wind speeds above 10 m/s and rainfall exceeding 7.5 mm/hr [16]. Large hydrometeors of 2 – 3 mm generated under convective or frontal intensification further amplify impact loading [17].
Salinity in the central North Sea remains stable at approximately 34 – 35 PSU but decrease substantially in the German Bight and along the Dutch coast due to freshwater flux from the Rhine and Elbe rivers [18], as illustrated in Figure 1. In this setting, the dominant saline-related degradation mechanism is salt-crystal wedging, driven by frequent wetting-drying cycles under strong winds and intermittent rainfall, which promotes microcracking and surface damage in LEP systems [19].
3.1.1. The US Atlantic: Stratification and the “Cold Pool”
The emerging US offshore wind market along the US Atlantic margin operates within a thermodynamically complex system influenced by the Cold Pool and strong thermal stratification [21]. The Mid-Atlantic Bight contains a distinct hydrographic feature in which a remnant body of cold winter water below 10 °C becomes isolated beneath the seasonal thermocline during spring and summer, forming the Cold Pool [21]. This structure creates pronounced vertical temperature gradients summer SSTs can reach 24 °C near Nantucket and Martha’s Vineyard [22], whereas bottom waters remain near 8 – 10 °C as shown in Figure 2 [23]. The strong stratification alters atmospheric stability, as it decouples surface winds from the overlying air mass and produces extreme vertical wind shear identifies as Low-Level Jets [24], which can increase tip-level impact velocities beyond what surface wind measurements indicate, thereby intensifying rain-impact loading [25].
Observed SST anomalies further modify this environment. Tidal mixing over Nantucket Shoals produces a cold surface anomaly, whereas Nantucket Sound displays warmer conditions [26]. Adjacent lease areas therefore operate under differing thermal baselines, affecting wind-resource availability and stability regimes [27]. The region also forms a mixing interface between fresh, cold Scotian Shelf water and warm, saline Gulf Stream waters. Salinity typically ranges from 32 PSU, although Gulf Stream warm-core rings can introduce higher salinity (approximately 36 PSU) and higher temperature water onto the shelf [28], as evidenced in Figure 3. Elevated SSTs from Gulf Stream intrusions can intensify tropical and extratropical cyclones moving northward [29], producing high liquid water content precipitation and large drop-size distributions that exceed temperate design assumptions [30].
3.1.2. Asia-Pacific: The “Warm Saline” Accelerator
The Taiwan Strait, Australian Bass Strait and South China Sea represent the most aggressive erosion environments globally, rystallizati by thermal, chemical, and kinetic extremes.
4.1.3.2. Taiwan Strait: The Typhoon Corridor
The Taiwan Strait exhibits some of the most severe erosion conditions globally due to the combined influence of thermal, chemical and kinetic extremes. SSTs remain within a tropical range, with winter mean SSTs of 18 – 20 °C and summer SSTs exceeding 29 °C as reported in regional climatologies [31,32], as shown in Table 1. These conditions ensure that PU coatings remain above their glass-transition temperature (Tg between -5 °C and +5 °C in the system rystallizati in [14]), thereby maintaining a soft state that promotes hydrolytic ingress [33,34]. Salinity patterns are governed by monsoon-driven circulation, with the Kuroshio Branch Water producing spring maxima of approximately 34.60 PSU and the South China Sea Water producing summer minima of about 34.01 PSU [31].
Kinetic forcing is dominated by monsoon winds and seasonal typhoons, which produce strong vertical mixing and high rainfall [31]. Typhoon events can generate convective rain rates of about 84 mm/hr and drop diameters up to 5.25 mm [35], leading to impact energies significantly higher than Europe design conditions [36]. The shallow bathymetry of the strait facilities sediment resuspension, creating abrasive loads that initiate surface damage [37], which subsequently interacts with liquid impact and saline exposure to accelerate material degradation [38].
4.1.3.2. Australia (Bass Strait): The Saline Cascade
The Bass Strait, which includes the Star of the South project, presents a distinctive high-salinity risk environment. During summer and autumn, strong evaporation progressively increases the salinity of the shallow waters. In winter, rapid atmospheric cooling raises the density of this hypersaline water, which can exceed 35.5 PSU, causing it to sink and flow downslope as a seasonal gravity-driven cascade [39]. As a result, turbines in this region operate within a highly saline boundary layer that intensifies chemical degradation process. The elevated salinity increases the likelihood of osmotic pressure build up within the coating system, which can deform and debond the surface through osmotic blistering [40]. Furthermore, salt rystallization within blisters or surface defects can compound this degradation mechanism and accelerate coating failure [19].
Figure 4 shows the average winter SST, which is approximately 12 – 14 °C, while the average summer SST is approximately 18 – 20 °C [41]. The broader region is also experiencing significant warming, with SSTs having increased by approximately 1.08 °C since 1900 [42]. This long-term thermal trend enhances atmospheric moisture content and contributes to increasingly intense rainfall events [42]. Consequently, the local erosion regime is shifting from a predominantly temperate profile toward conditions more characteristic of subtropical environments, where convective rainfall with high kinetic energy and larger drop-size distributions plays a key role in accelerating blade erosion [30].
3.1.3.3. The South China Sea: A Tropical Warm Basin
The South China Sea (SCS) forms a meteorological continuum with the Taiwan Strait. The norther SCS is influenced by the Northeast Monsoon, and the basin functions as both a development region and pathway for Pacific typhoons [43]. High SSTs support typhoon formation and intensification [43], and the associated precipitation microphysics, including drop-size distributions, are critical for modelling high frequency kinetic impacts relevant to LEE [44].
Seasonal temperature and salinity patterns in the SCS water masses have been characterised in detail in [45]. The “Coastal Diluted Water” exhibits the largest seasonal SST range, with winter temperatures near 19.5 °C and summer values between 27 °C and 32.1 °C. Latitudinal gradients are evident in the “South China Sea Surface Water,” where SSTs range from 21.5 °C to 29 °C in winter and 22 °C to 30.5 °C in summer, reflecting strong solar-driven vertical mixing in the warm season. Salinity differentiates the water masses further: the “Coastal Diluted water” remains below 31 PSU due to riverine inputs, while “Kuroshio Surface Water” and “Kuroshio Subsurface Water” maintain higher salinity values of 34.45 – 34.9 PSU as they enter the basin from the Pacific. Transitional behaviour occurs in the “Nearshore Mixed Water,” which exhibits salinity between 31.7 and 32.3 PSU. The spatial boundaries of these surface and subsurface water masses are presented in Figure 5 and Figure 6.
3.2. Experimental Envelope
In the compiled dataset of erosion-relevant studies presented in Table 2, impact tests were predominantly conducted using deionised, tap or otherwise freshwater at ambient laboratory temperatures, typically between 18 and 29 °C [5,6,7,8]. Only a subset of experiments incorporated seawater-representative salinity by using 3 – 3.5% NaCl solutions, and these were still generally performed at near- ambient temperatures [15,47,48,49,50,51]. Very few studies reported test temperatures near the polymer glass-transition region or within the higher SST ranges characteristic of tropical basins, and no study combined such temperature control with realistic marine salinity. Taken together, the compiled experimental envelope covers only a narrow subset of the temperature–salinity conditions encountered by offshore wind turbines.
3.3. Quantitative Mismatch
The environmental envelope indicate that offshore wind regions operate across temperature ranges that are not represented in existing erosion tests. North Sea SSTs typically span about 5 – 17 °C with frequent cold-air outbreaks below 0 °C. In comparison, the US Atlantic shelf exhibits strong stratification with summer surface waters near 24 °C overlying an 8 10 °C cold pool [13,14]. The Taiwan Strait-South China Sea system frequently reach 20 – 32 °C in summer [31,45], while SSTs in the Bass Strait commonly reach around 18 – 20 °C [41]. By contrast, all water-droplet erosion tests in the compiled experimental envelope were conducted at near-ambient laboratory temperatures, approximately 18 – 19 °C [6,7,49,51], and none sampled cold North Sea winter conditions (<10 °C) or the highest tropical SSTs (>30 °C) [13,45].
A comparable restriction occurs in salinity. Operational SSSs in the North Sea, US Atlantic Shelf, Taiwan Strait, Bass Strait and South China Sea generally lie between about 32 and 36 PSU, with documented coastal freshening (<31 PSU) and local hypersaline anomalies (>35.5 PSU) in several basins [31,39,45]. Most erosion-relevant experiments instead use freshwater media with salinity ≈0 PSU [6,7,8], and seawater-like salinity appears only as discrete 3 – 3.5% NaCl conditions near 30 – 35 PSU [5,15,46,47,48,49]. In T – S space, the experimental envelope therefore collapses to two narrow clusters: freshwater at 18 – 20 °C and single-level saline tests at similar temperatures, while cold saline, warm saline and low-salinity coastal operating conditions remain effectively untested.
4. Discussion
The combined environmental and experimental envelopes show that current rain erosion testing samples only a narrow subset of the temperature–salinity conditions identified of operating offshore wind farms. The erosion studies collated in the table further demonstrate that both temperature and water composition govern not only the rate but also the operative damage mechanisms. Comparisons between freshwater and seawater-representative solutions (3 – 3.5%) NaCl on glass fibre reinforced polymer composites report higher mass loss, greater moisture uptake, deeper cracking and more severe surface damage in saline media, with additional phenomena such as mass gain through brine absorption and salt recrystallisation in cracks and pits [46,48,49,50,51]. Impingement-flow and immersion studies in 3.5% NaCl further show rapid loss of barrier properties, increased water uptake, roughness growth and fibre–matrix debonding relative to pure water, supported by chemical evidence of accelerated bond breakdown in saline environments [15,52]. Temperature-controlled work on polyurethane coatings for LEP shows that moving away from moderate laboratory temperatures into cold conditions associated with the vicinity of the glass transition produces much higher erosion rates, more severe pitting and changes in hardness and H/Er ratio that indicate reduce elastic recovery and a different dominate damage mechanism [14]. Nanoindentation-based rankings of polymers confirm that better rain-erosion resistance is associated with lower stiffness and faster elastic recovery rather than simply highest hardness [7]. Collectively, these mechanistic results show that Tg-range temperatures, warm softened states and saline fluids are precisely the regimes where coatings are most vulnerable, yet many water-droplet erosion tests still characterise materials only under near-ambient freshwater conditions.
Existing geospatial LEE studies are concentrated in the North Sea and selected US regions, where experimental erosion data gave been combined with rainfall rate, raindrop size and impact energy to produce site-specific kinetic risk maps [9,10,11]. No comparable basin-scale LEE maps have yet been published for Asia or Australian waters. Across all basins, current mapping frameworks do not incorporate spatially resolved SST and SSS, even though several laboratory studies conducted in the UK, Ireland, China and the US already include controlled variations in temperature and water composition [5,8,15,49]. In this sense, Asia and Australia represent clear gaps in the global erosion mapping effort: they lie in some of the most aggressive temperature–salinity configurations yet remain unmapped in terms both kinetic LEE risk and integrated kinetic–thermal–chemical exposure.
In the erosion studies reviewed here, tests were predominantly conducted using deionised or tap water at a single ambient temperature, thereby omitting the ionic strengths and thermal conditions that drive hydrolysis, osmotic blistering and salt crystallisation in service [19,40]. High temperature corrosion or salt-spray standards, while useful for barrier assessment, probe different failure modes and do not include droplet impact [53]. Ageing and impact are typically decoupled [4], rather than applied in realistic sequences that combine UV, humidity, salinity and thermal cycling with subsequent rain erosion [2]. Under these constraints, test results generated under temperate freshwater conditions cannot be assumed to bound performance in colder saline or warmer saline offshore environments.
These findings suggest that rain erosion testing should move from a purely kinetic specification toward environment-aware envelopes. Test matrices should explicitly include points near the Tg region and at a warm, saline conditions representative of tropical basins, and they should use offshore-relevant salinity bands rather than defaulting to freshwater. Combined ageing–erosion sequences need to be specified, rather than treating corrosion and rain erosion as independent checks. At the mapping level, integrating SST, SSS and changing rainfall statistics into multi-region atlases would allow location-specific coating selection and lifetime assessment instead of extrapolating a single temperate test envelope to a global fleet.
5. Conclusion
This short communication compared experimentally used temperature–salinity conditions in rain-erosion-relevant studies with basin-scale seas surface temperature and salinity climatologies for major offshore wind regions. The analysis showed that existing water droplet erosion tests are concentrated at near-ambient freshwater conditions and sample only a limited fraction of the operational temperature–salinity envelope, leaving cold–saline and warm–saline regimes essentially untested. As a result, high risk environments such as cold North Sea winters and war, saline Asia–Pacific basins are not explicitly represented in current validation practice. Addressing this gap will be essential for developing coating-test protocols and mapping approaches that are robust for a genuinely global offshore wind fleet.
Abbreviations
DNV-RP-0171: testing of rotor blade erosion protection systems; LEE: leading edge erosion; LEP: leading edge protection; NaCl: sodium chloride; PSU: Practical Salinity Unit; SCS: South China Sea; SSS: sea surface salinity; SST: sea surface temperature; Tg: glass-transition temperature; TNO: Netherlands Organisation or Applied Scientific Research; UV: ultraviolet
References
- Herring, R.; Dyer, K.; Martin, F.; Ward, C. The increasing importance of leading edge erosion and a review of existing protection solutions. Renew. Sustain. Energy Rev. 2019, 115. [CrossRef]
- Keegan, M.H.; Nash, D.H.; Stack, M.M. On erosion issues associated with the leading edge of wind turbine blades. J. Phys. D: Appl. Phys. 2013, 46. [CrossRef]
- Yusof, N.A.W.A.; Algaddaime, T.F.; Stack, M.M. Advancements and Challenges in Coatings for Wind Turbine Blade Raindrop Erosion: A Comprehensive Review of Mechanisms, Materials and Testing. Sustainability 2025, 17, 9611. [CrossRef]
- DNV-RP-0171. Testing of rotor blade erosion protection systems. 2018.
- Rasool, G.; Middleton, A.C.; Stack, M.M. Mapping Raindrop Erosion of GFRP Composite Wind Turbine Blade Materials: Perspectives on Degradation Effects in Offshore and Acid Rain Environmental Conditions. J. Tribol. 2020, 142, 1–15. [CrossRef]
- Groucott, S.; Pugh, K.; Zekos, I.; Stack, M.M. A Study of Raindrop Impacts on a Wind Turbine Material: Velocity and Impact Angle Effects on Erosion MAPS at Various Exposure Times. Lubricants 2021, 9, 60. [CrossRef]
- O'CArroll, A.; Hardiman, M.; Tobin, E.; Young, T. Correlation of the rain erosion performance of polymers to mechanical and surface properties measured using nanoindentation. Wear 2018, 412-413, 38–48. [CrossRef]
- Zheng, Z.; Sun, H.; Xue, W.; Duan, D.; Chen, G.; Zhou, X.; Sun, J. Preparation of protective coatings for the leading edge of wind turbine blades and investigation of their water droplet erosion behavior. Wear 2024, 558-559. [CrossRef]
- Pryor, S.C.; Coburn, J.J.; Barthelmie, R.J. Spatiotemporal Variability in Wind Turbine Blade Leading Edge Erosion. Energies 2025, 18, 425. [CrossRef]
- Nash, J.W.K.; Zekos, I.; Stack, M.M. Mapping of Meteorological Observations over the Island of Ireland to Enhance the Understanding and Prediction of Rain Erosion in Wind Turbine Blades. Energies 2021, 14, 4555. [CrossRef]
- Shankar Verma A, Jiang Z, Ren Z, et al. A probabilistic long-term framework for site-specific erosion analysis of wind turbine blades: a case study of 31 Dutch sites. Wind Energy 2021; 24: 1315–1336.
- Webb P. 5.3 Salinity Patterns. In: Introduction to Oceanography. Roger Williams University – Pressbooks. https://rwu.pressbooks.pub/webboceanography/chapter/5-3-salinity-patterns/ (accessed 8 December 2025).
- Federal Maritime and Hydrographic Agency (BSH). State of the North Sea. https://www.bsh.de/EN/TOPICS/Monitoring_systems/State_of_the_North_Sea/state_of_the_north_sea_node.html (accessed 24 November 2025).
- Godfrey, M.; Siederer, O.; Zekonyte, J.; Barbaros, I.; Wood, R. The effect of temperature on the erosion of polyurethane coatings for wind turbine leading edge protection. Wear 2021, 476. [CrossRef]
- Sista H. Experimental studies on the detrimental effects of adverse weather on offshore wind turbines. PhD Thesis, Iowa State University, USA, 2025.
- TNO. TNO research leads to better damage prediction for offshore wind turbine blades. https://www.tno.nl/en/newsroom/2025/03/damage-prediction-wind-turbine-blades/ (2025, accessed 14 August 2025).
- IEA Wind Task 46. Atmospheric drivers of wind turbine blade leading edge erosion: Hydrometeors IEA Wind Task 46 Erosion of wind turbine blades. Epub ahead of print 5 November 2021. [CrossRef]
- Zijl F, Leummens L, Alexandrova N, et al. Impact of offshore wind farms on the North Sea ecosystem. Report, 13 December 2024.
- Feng, Z.; Song, G.-L.; Wang, Z.M.; Xu, Y.; Zheng, D.; Wu, P.; Chen, X. Salt crystallization-assisted degradation of epoxy resin surface in simulated marine environments. Prog. Org. Coatings 2020, 149. [CrossRef]
- NOOS. Multi model ensemble of forecast products. https://noos.eurogoos.eu/increasing-noos-awareness/community-tasks/multi-model-ensemble-of-forecast-products/ (accessed 25 November 2025).
- Miles T, Murphy S, Kohut J, et al. Could federal wind farms influence continental shelf oceanography and alter associated ecological processes? A literature review. Report, New Jersey. https://scemfis.org/wp-content/uploads/2021/01/ColdPoolReview.pdf (1 December 2020, accessed 26 November 2025).
- National Centers for Environmental Information (NCEI). NCEI Coastal Water Temperature Guide. https://www.ncei.noaa.gov/access/coastal-water-temperature-guide/all_table.html (accessed 26 November 2025).
- Horwitz, R.; Miles, T.N.; Munroe, D.; Kohut, J. Overlap between the Mid-Atlantic Bight Cold Pool and offshore wind lease areas. ICES J. Mar. Sci. 2023, 82. [CrossRef]
- Colle, B.A.; Novak, D.R. The New York Bight Jet: Climatology and Dynamical Evolution. Mon. Weather. Rev. 2010, 138, 2385–2404. [CrossRef]
- Letson, F.; Barthelmie, R.J.; Pryor, S.C. Radar-derived precipitation climatology for wind turbine blade leading edge erosion. Wind. Energy Sci. 2020, 5, 331–347. [CrossRef]
- Yu, L.; Yang, K.T. A Warm and A Cold Spot in Cape Cod Waters Amid the Recent New England Shelf Warming. Front. Mar. Sci. 2022, 9. [CrossRef]
- Redfern, S.; Optis, M.; Xia, G.; Draxl, C. Offshore wind energy forecasting sensitivity to sea surface temperature input in the Mid-Atlantic. Wind. Energy Sci. 2023, 8, 1–23. [CrossRef]
- Townsend, D.W.; Pettigrew, N.R.; Thomas, M.A.; Moore, S. Warming waters of the Gulf of Maine: The role of Shelf, Slope and Gulf Stream Water masses. Prog. Oceanogr. 2023, 215. [CrossRef]
- Jones, E.; Parfitt, R.; Wing, A.A.; Hart, R. Gulf Stream Sea Surface Temperature Anomalies Associated With the Extratropical Transition of North Atlantic Tropical Cyclones. Geophys. Res. Lett. 2023, 50. [CrossRef]
- Tilg, A.-M.; Hagen, M.; Vejen, F.; Hasager, C.B. Variation of leading-edge-erosion relevant precipitation parameters with location and weather type. Meteorol. Z. 2021, 30, 251–269. [CrossRef]
- Tseng, H.-C.; You, W.-L.; Huang, W.; Chung, C.-C.; Tsai, A.-Y.; Chen, T.-Y.; Lan, K.-W.; Gong, G.-C. Seasonal Variations of Marine Environment and Primary Production in the Taiwan Strait. Front. Mar. Sci. 2020, 7. [CrossRef]
- Hao, Q.-Z.; Hsu, P.-C. Spatiotemporal variability of sea surface temperature, sea surface height, and water quality along the northwestern coast of Taiwan. Active and Passive Remote Sensing of Oceans, Seas, and Lakes. China; pp. 101–110.
- Mamalis, D.; Floreani, C.; Brádaigh, C.M.Ó. Influence of hygrothermal ageing on the mechanical properties of unidirectional carbon fibre reinforced powder epoxy composites. Compos. Part B: Eng. 2021, 225. [CrossRef]
- Chen, D.; Meng, M.; Sun, X.; Guan, M.; Yang, B.; Xiao, S. Effects of Hygrothermal Aging on the Flexural Properties of Cross-Ply and Angle-Ply CFRP Composite Laminates. Fibers Polym. 2023, 25, 257–274. [CrossRef]
- Chen BJ, Wang Y, Ming J. Microphysical characteristics of the raindrop size distribution in typhoon Morakot (2009). J Trop Meteorol 2012; 18: 162–171.
- Mishnaevsky, L.; Hasager, C.B.; Bak, C.; Tilg, A.-M.; Bech, J.I.; Rad, S.D.; Fæster, S. Leading edge erosion of wind turbine blades: Understanding, prevention and protection. Renew. Energy 2021, 169, 953–969. [CrossRef]
- da Silva, R.G.; Silveira, P.L.G.d.S.; da Cunha, R.D.; de Souza, L.G.V.M.; Alves, S.M. Erosion behavior of turbine blades due to sand and salt particles. J. Compos. Mater. 2025, 59, 3305–3319. [CrossRef]
- Rao, P.; Mulky, L. Erosion-Corrosion of Materials in Industrial Equipment: A Review. ChemElectroChem 2023, 10. [CrossRef]
- Sandery, P.A.; Kämpf, J. Transport timescales for identifying seasonal variation in Bass Strait, south-eastern Australia. Estuarine, Coast. Shelf Sci. 2007, 74, 684–696. [CrossRef]
- Effendy, S.; Zhou, T.; Eichman, H.; Petr, M.; Bazant, M.Z. Blistering failure of elastic coatings with applications to corrosion resistance. Soft Matter 2021, 17, 9480–9498. [CrossRef]
- Australian Bureau of Meteorology (BOM). Sea Surface Temperature (SST) maps. https://www.bom.gov.au/climate/ocean/sst/#/sst/australia/monthly/20250201 (accessed 2 December 2025).
- CSIRO. Sea surface temperatures, ocean heat content, sea levels, ocean acidification and sea-ice: State of the Climate 2024. https://www.csiro.au/en/research/environmental-impacts/climate-change/state-of-the-climate/oceans (2024, accessed 27 November 2025).
- DTN. Sea Conditions Guide South China Sea and Southeast Asia. https://www.dtn.com/wp-content/uploads/2020/03/wp_offshore_south-china-sea_1019.pdf (2019, accessed 28 November 2025).
- Huang, X.; Wu, Z.; Xie, Y.; Zhang, Y.; Zhang, L.; Zheng, H.; Xiao, W. Precipitation Microphysics of Locally-Originated Typhoons in the South China Sea Based on GPM Satellite Observations. Remote. Sens. 2023, 15, 2657. [CrossRef]
- Jin, S.; Nie, X.; Wang, G.; Teng, F.; Xu, T. Analysis of the Distribution and Seasonal Variability of the South China Sea Water Masses Based on the K-means Cluster Method. J. Mar. Sci. Eng. 2023, 11, 485. [CrossRef]
- Rasool G, Larios MP, Stack MM. Impact angle and exposure time effects on raindrop erosion of fibre reinforced polymer composites: application to offshore wind turbine conditions. https://mc.manuscriptcentral.com/tandf/tribtrans, (accessed 21 September 2025).
- Pugh, K.; Rasool, G.; Stack, M.M. Raindrop Erosion of Composite Materials: Some Views on the Effect of Bending Stress on Erosion Mechanisms. J. Bio- Tribo-Corrosion 2019, 5, 45. [CrossRef]
- Pugh, K.; Rasool, G.; Stack, M.M. Some Thoughts on Mapping Tribological Issues of Wind Turbine Blades Due to Effects of Onshore and Offshore Raindrop Erosion. J. Bio- Tribo-Corrosion 2018, 4, 50. [CrossRef]
- Pugh, K.; Stack, M.M. Rain Erosion Maps for Wind Turbines Based on Geographical Locations: A Case Study in Ireland and Britain. J. Bio- Tribo-Corrosion 2021, 7, 1–7. [CrossRef]
- Singh, A.; Singh, G.; Kumar, S.; Sehgal, S.S. Tribo-Erosion Performance of GFRP Composite Panels in Both Offshore and Onshore Environmental Conditions. J. Offshore Mech. Arct. Eng. 2022, 144, 1–19. [CrossRef]
- Rani, M.; Zafar, S. Investigations on surface damage due to water jet erosion of glass fiber-reinforced polymer composites. Springer Proc Mater 2025; 72: 243–254.
- Vedadi, A.; Wang, X.; Parvej, M.S.; Yuan, Q.; Azarmi, F.; Battocchi, D.; Lin, Z.; Wang, Y. Degradation of epoxy coatings exposed to impingement flow. J. Coatings Technol. Res. 2021, 18, 1153–1164. [CrossRef]
- ISO 9227:2022. Corrosion tests in artificial atmospheres — Salt spray tests.
Figure 1.
Mean sea surface salinity distribution across the North Sea. Image reproduced from the NOOS Multi-model Ensemble of Forecast Products [20] with permission.
Figure 1.
Mean sea surface salinity distribution across the North Sea. Image reproduced from the NOOS Multi-model Ensemble of Forecast Products [20] with permission.
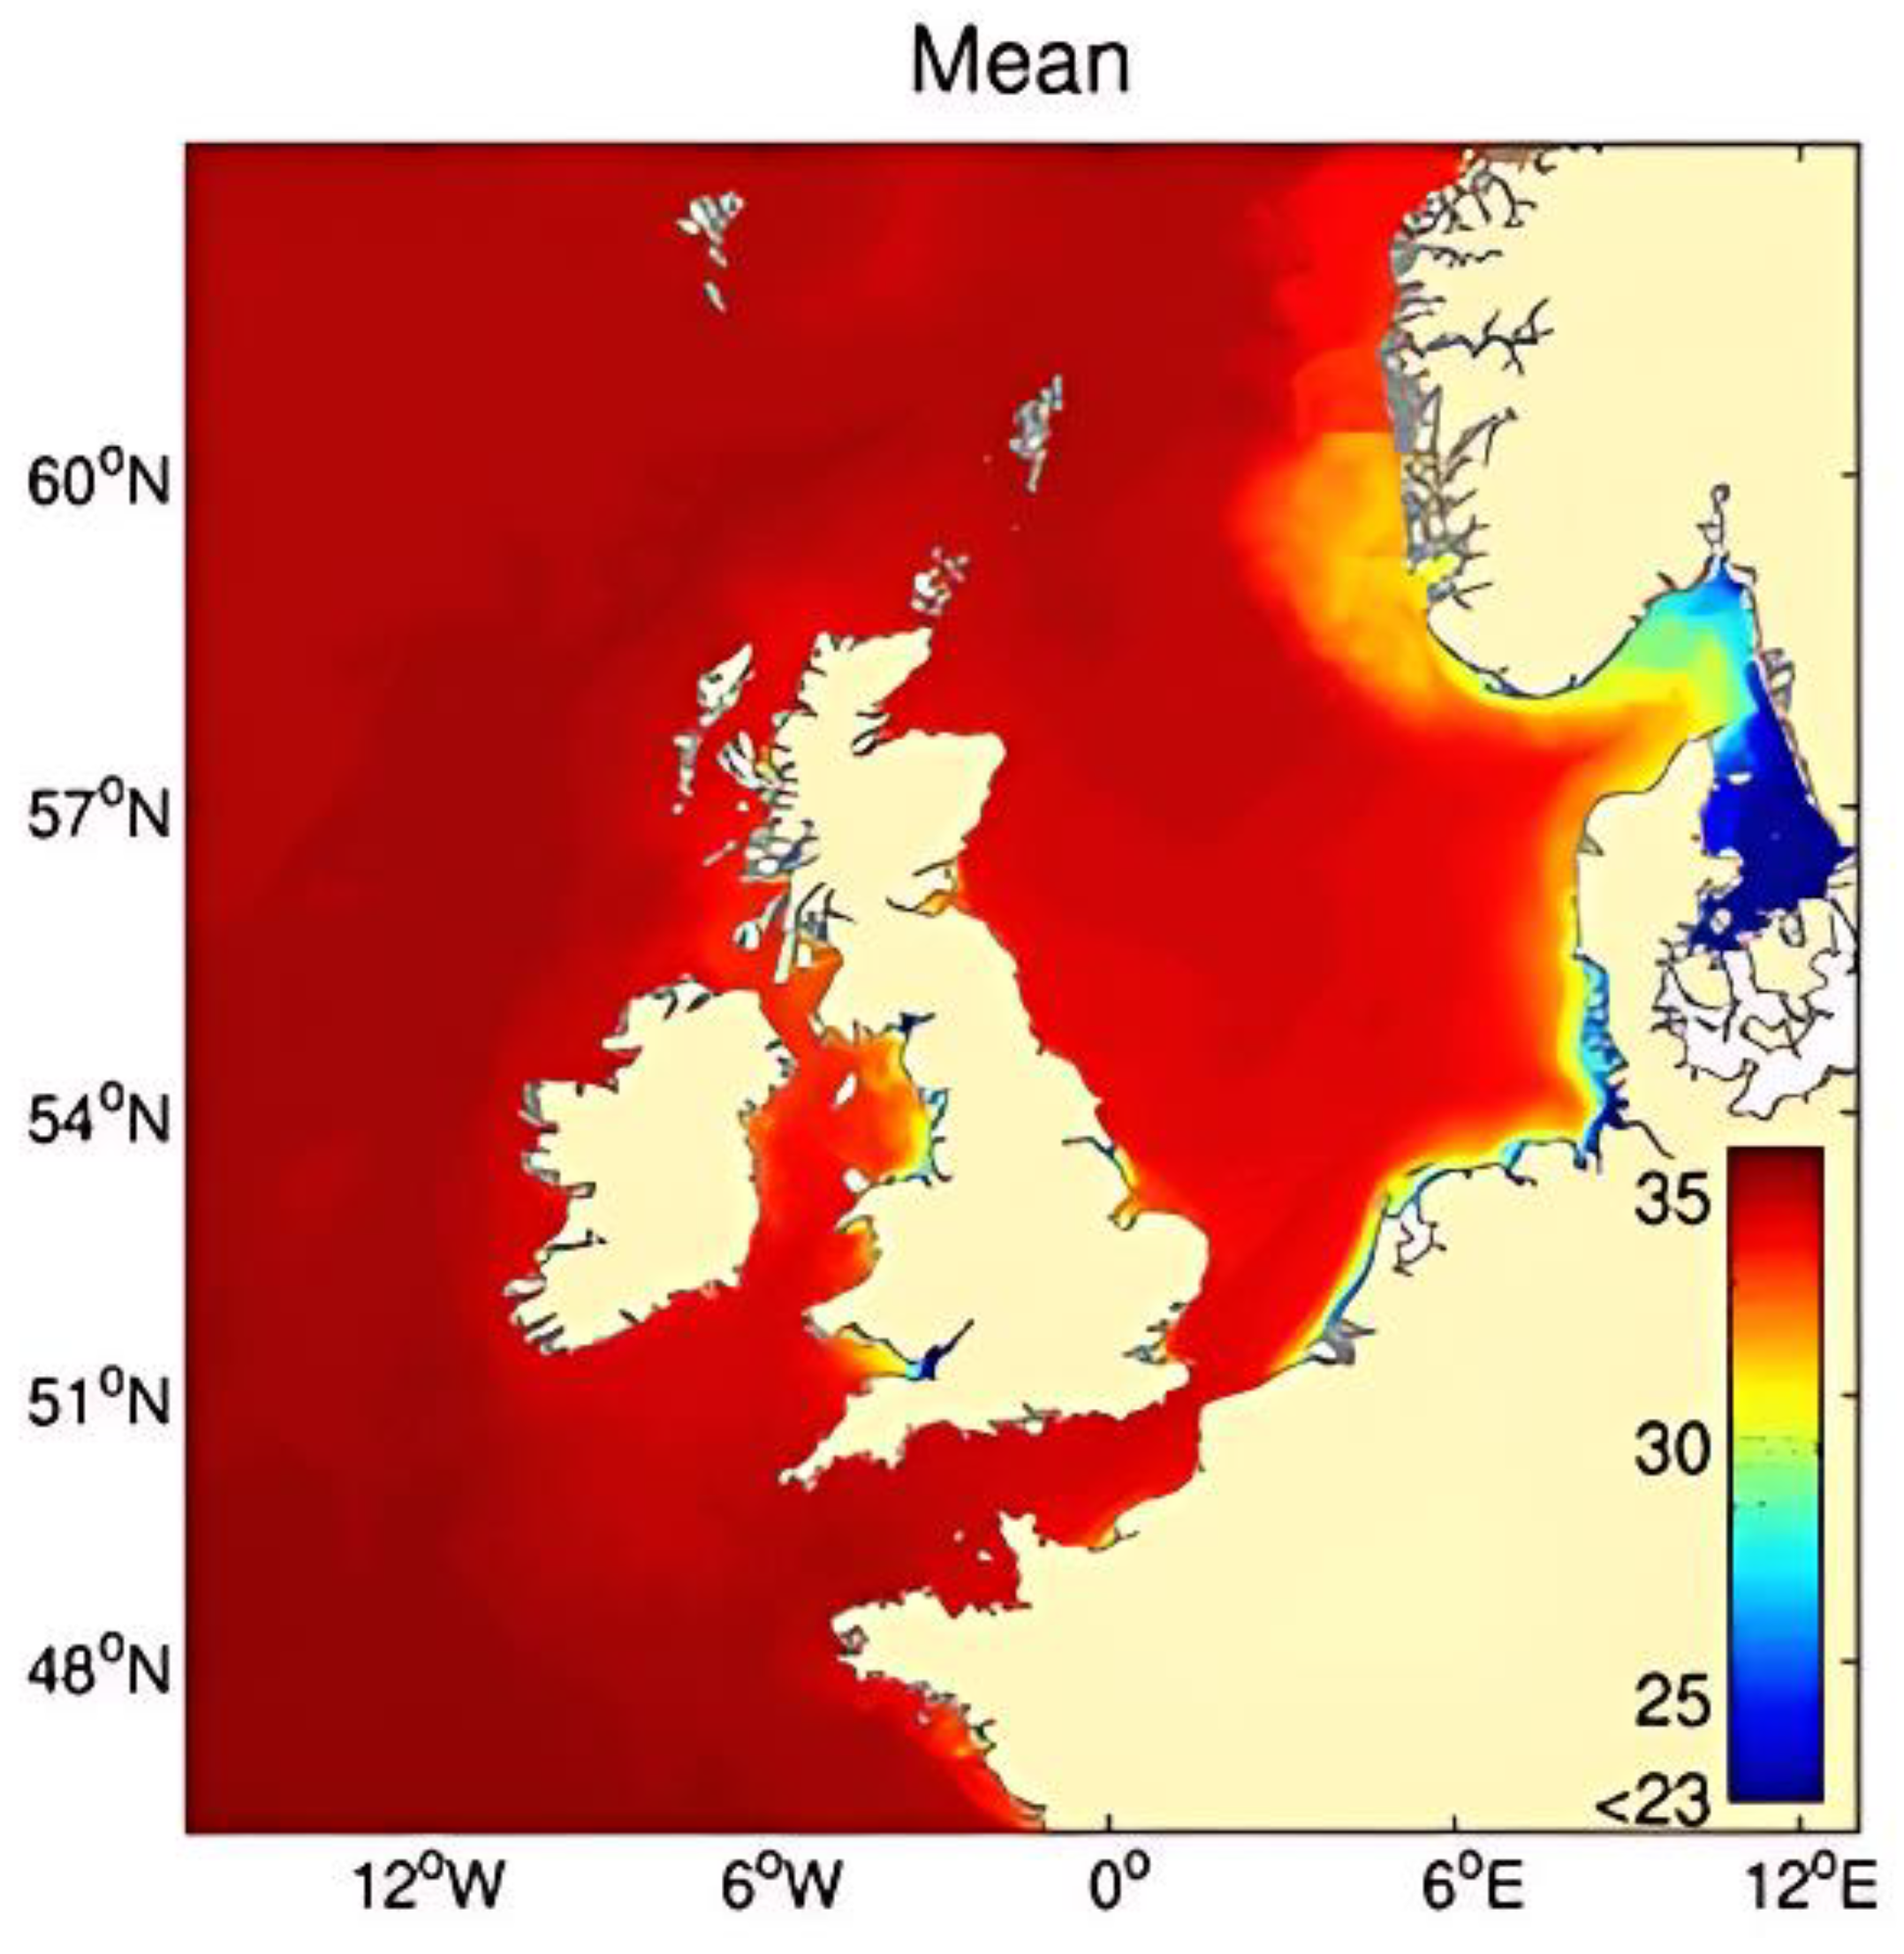
Figure 2.
Monthly averaged Cold Pool bottom temperatures (<10 °C) based on Doppio simulations (2007 – 2021). Reprinted from [23] with permission.
Figure 2.
Monthly averaged Cold Pool bottom temperatures (<10 °C) based on Doppio simulations (2007 – 2021). Reprinted from [23] with permission.
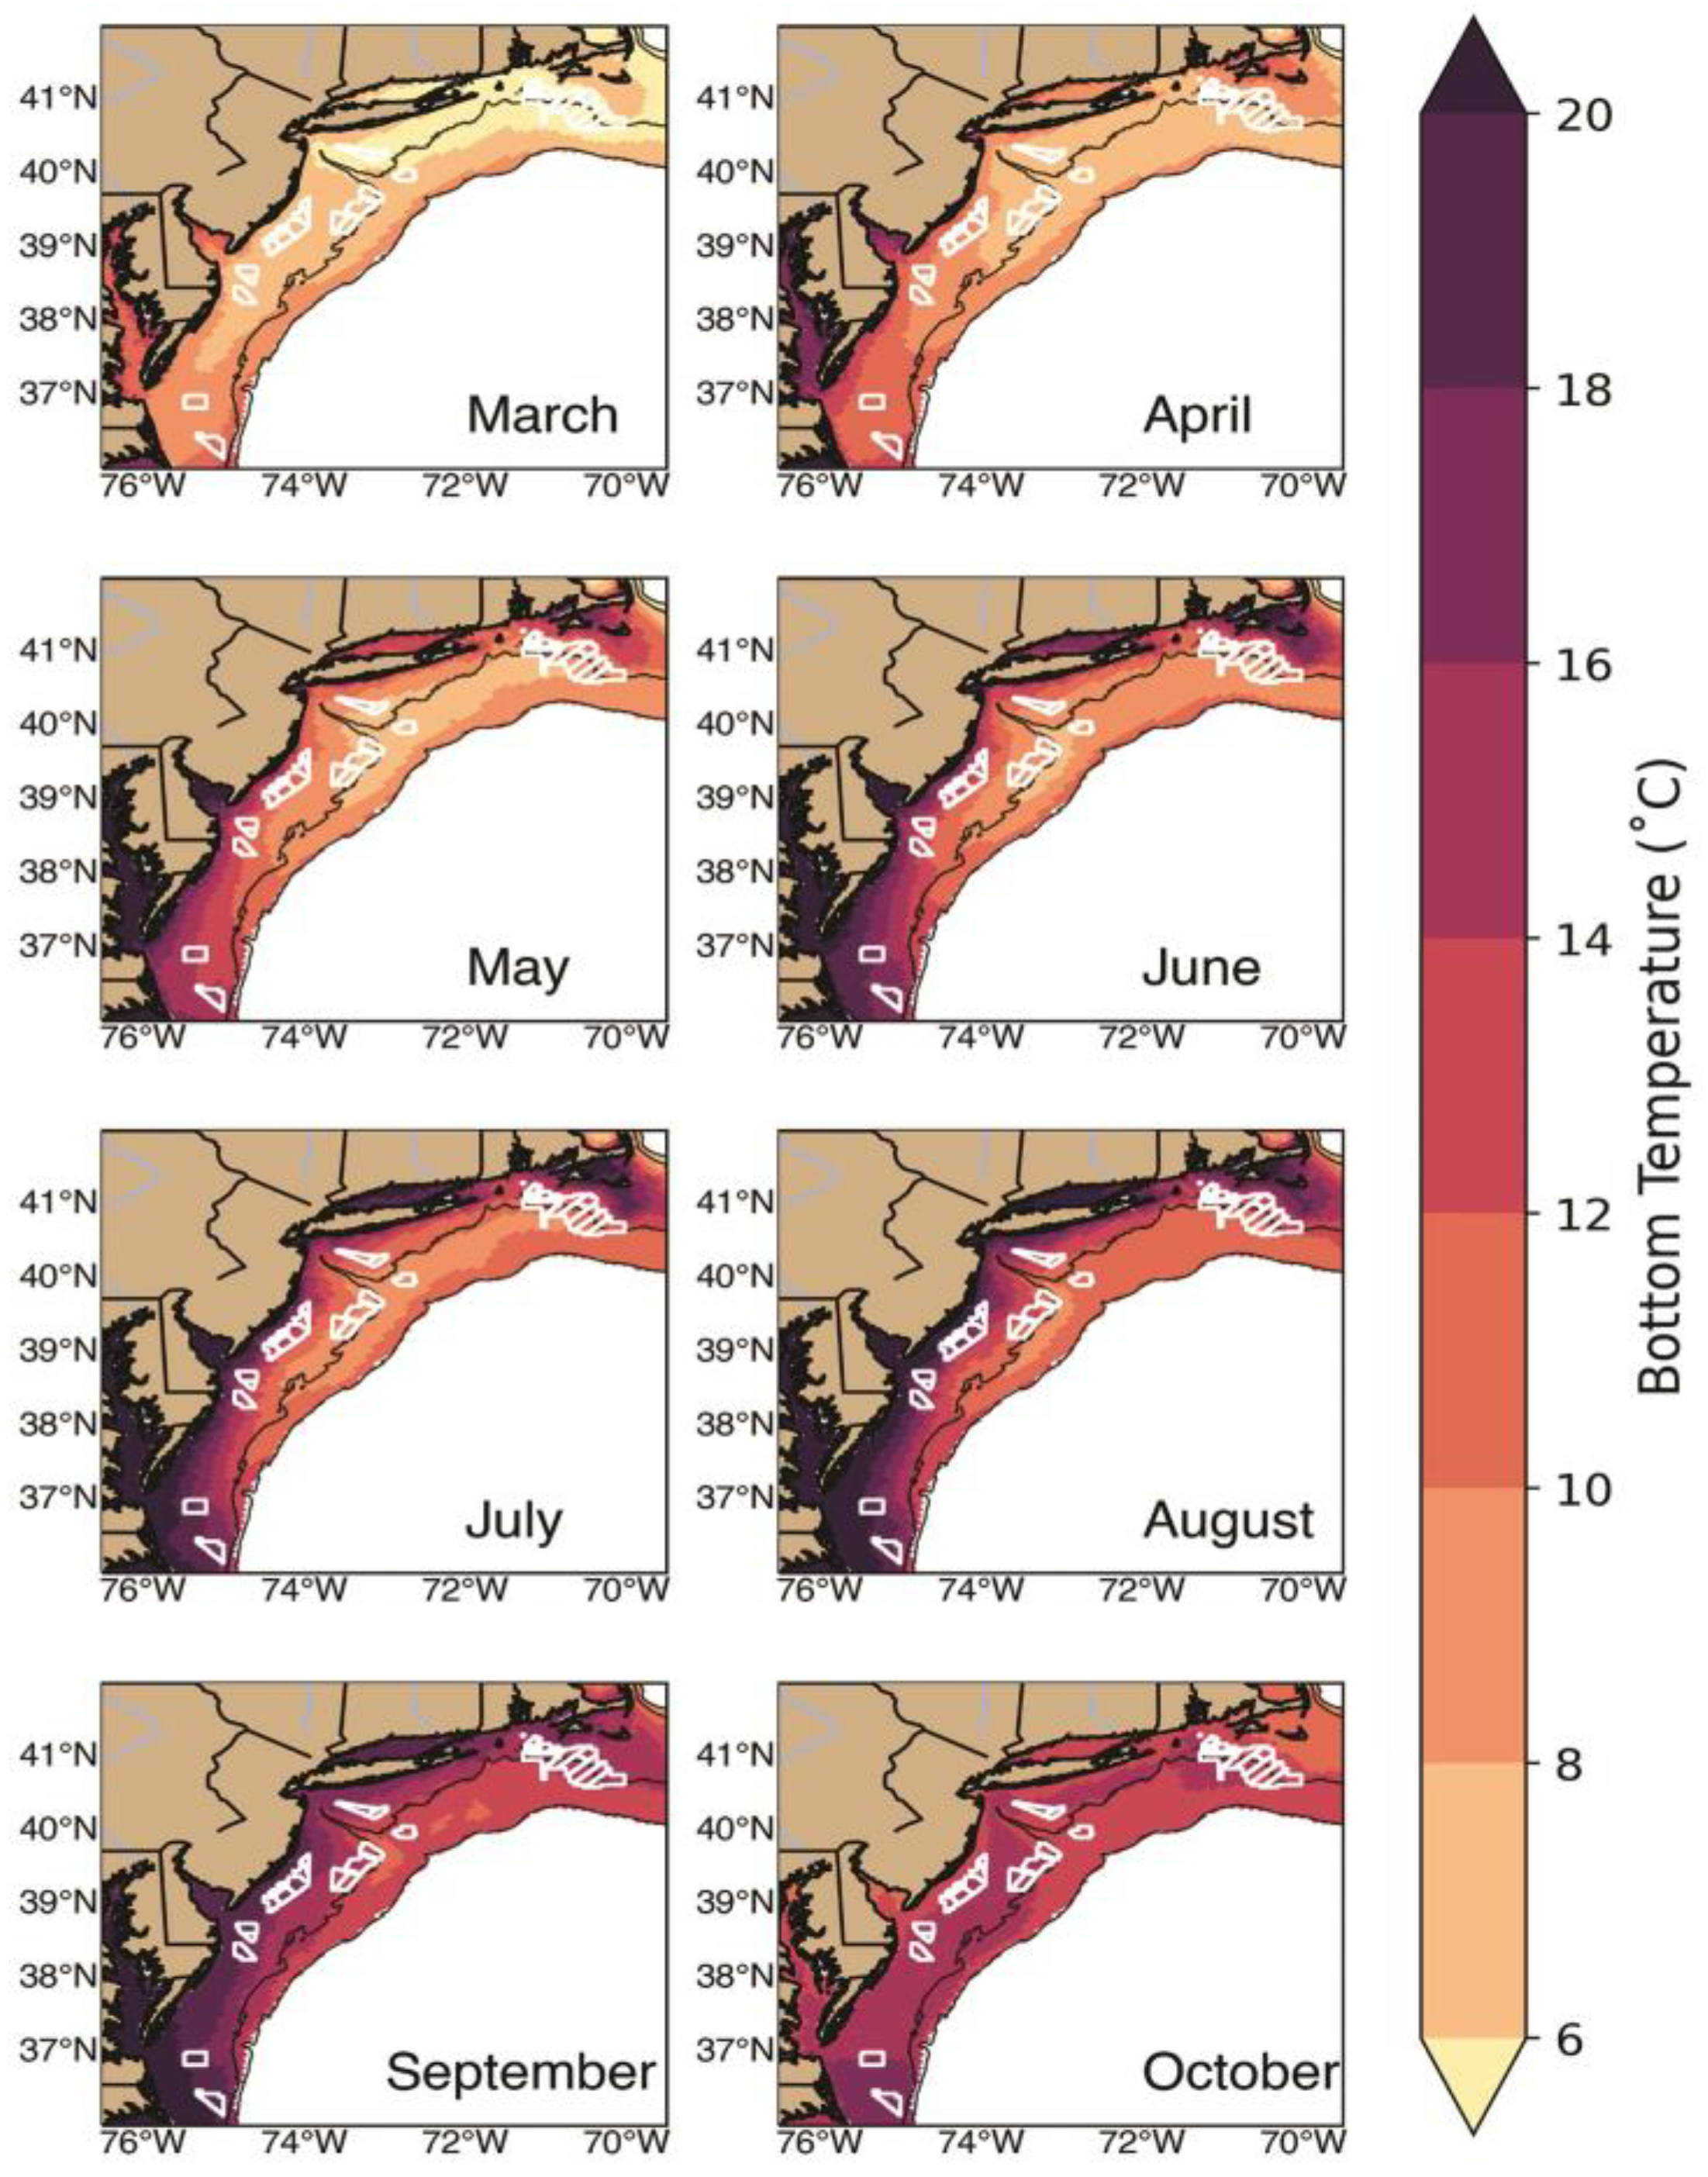
Figure 3.
The temperature–salinity diagram visually demonstrates the mixing, showing data points stretching from the cold/fresh Scotian Shelf Water end (~32 PSU) toward the warm/salty Gulf Stream Water end (36 PSU). Reprinted from [28] with permission.
Figure 3.
The temperature–salinity diagram visually demonstrates the mixing, showing data points stretching from the cold/fresh Scotian Shelf Water end (~32 PSU) toward the warm/salty Gulf Stream Water end (36 PSU). Reprinted from [28] with permission.
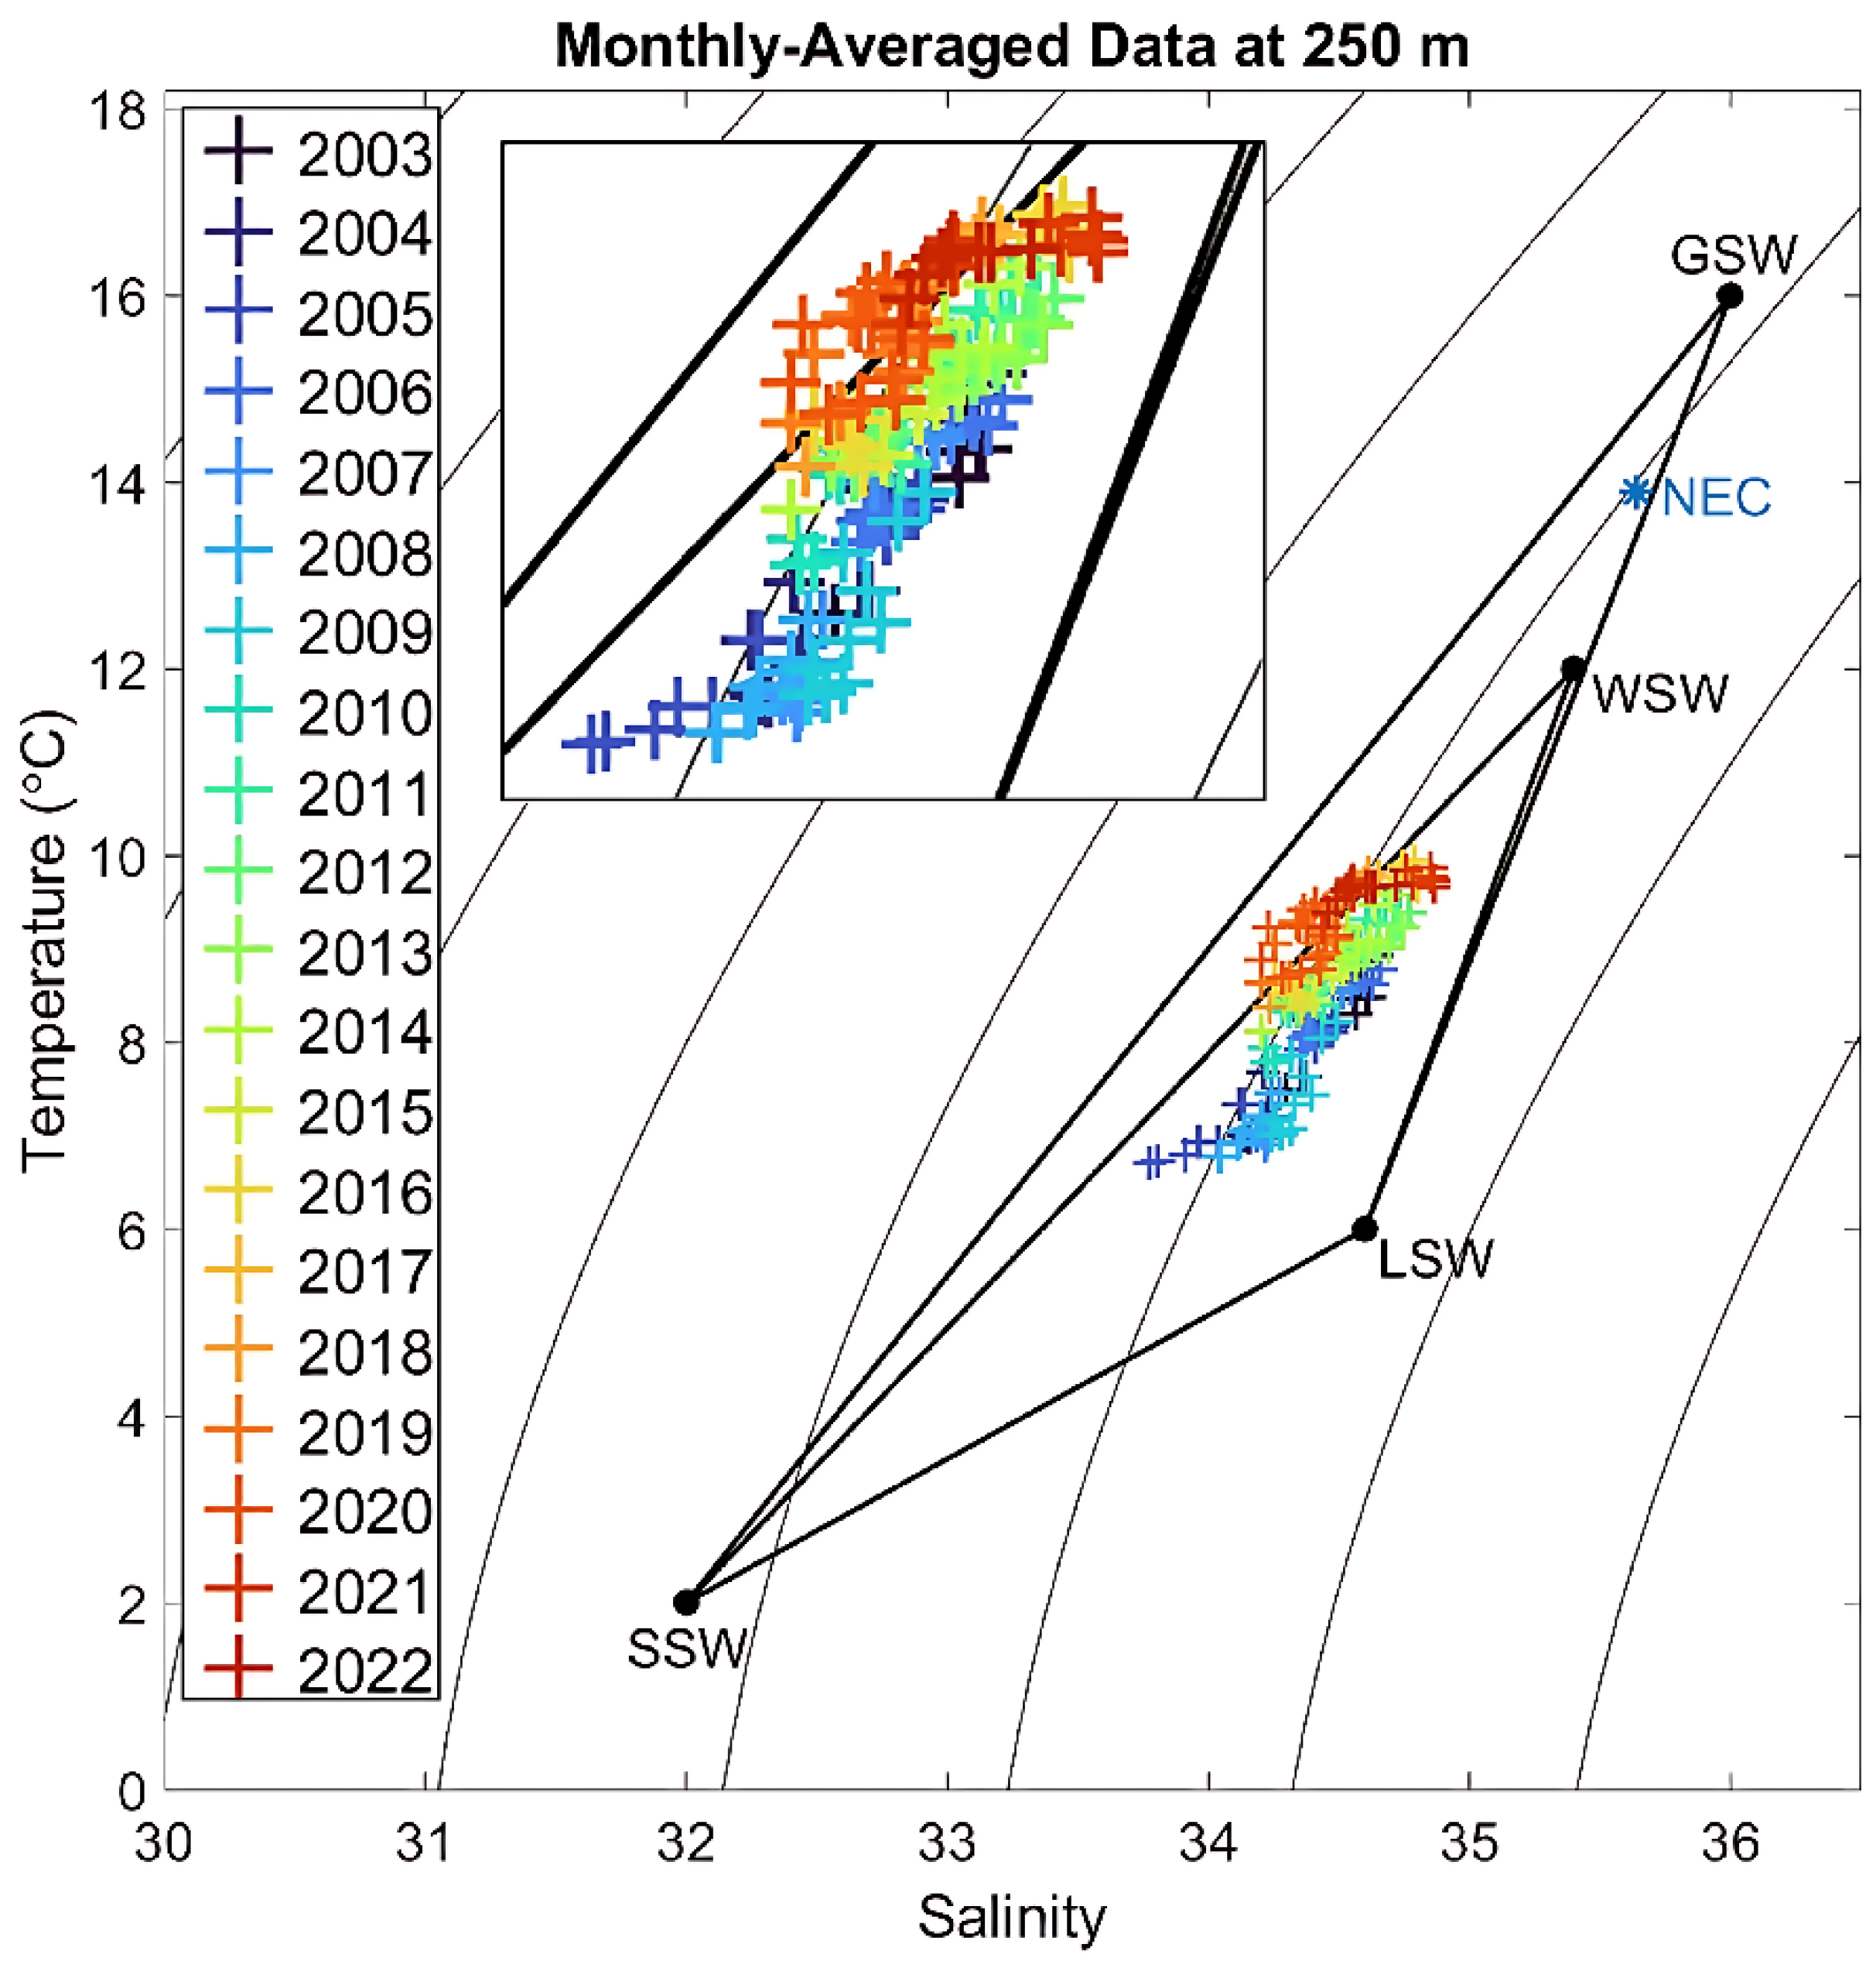
Figure 4.
(a) Average SST for winter 2025 (b) Average SST for summer 2025. Reprinted with permission from [41].
Figure 4.
(a) Average SST for winter 2025 (b) Average SST for summer 2025. Reprinted with permission from [41].
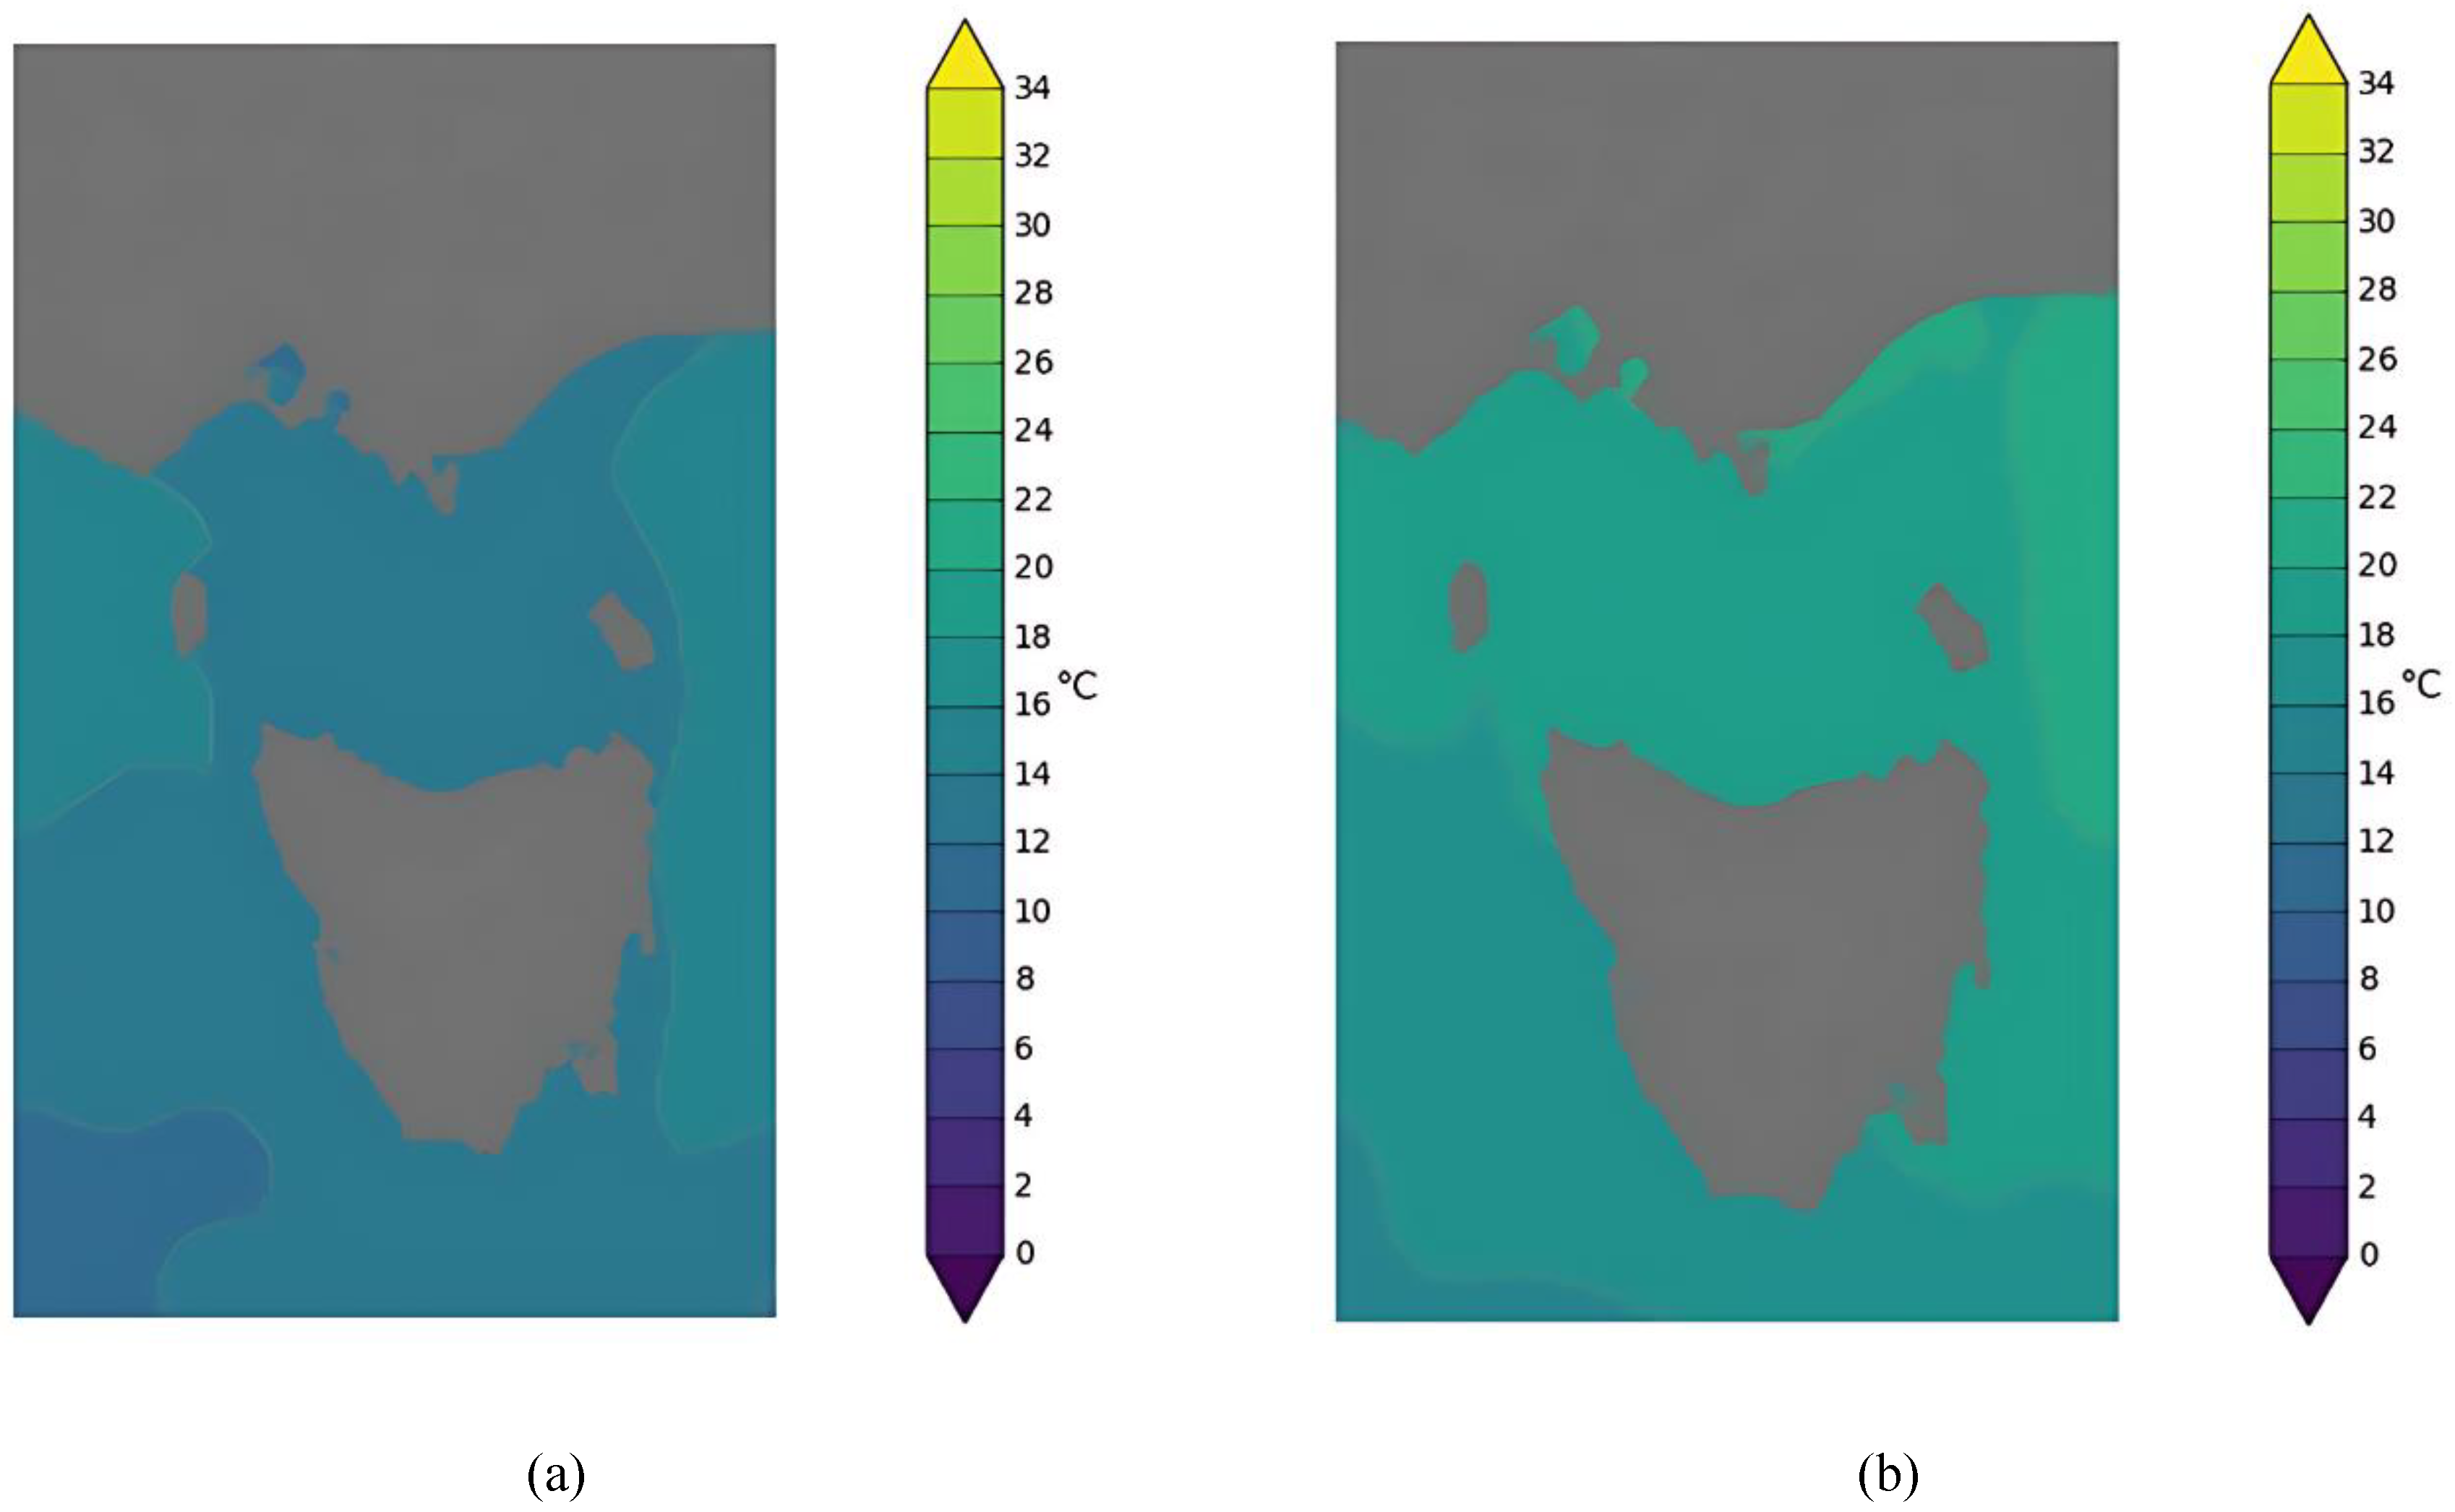
Figure 5.
Seasonal surface water mass distribution in the South China Sea. Panels show (a) winter, (b) spring, (c) summer, and (d) autumn. Red points denote Coastal Diluted Water, green points denote Nearshore Mixed Water, blue points denote South China Sea Surface Water and the Southern SCS Shelf Water (present only in summer), and black points denote Kuroshio Surface Water. Reprinted with permission from [45].

Figure 6.
Seasonal subsurface water mass distribution in the South China Sea. Panels show (a) winter, (b) spring, (c) summer, and (d) autumn. Blue points denote South China Sea Subsurface Water and black points denote Kuroshio Subsurface Water. Reprinted with permission from [45].
Figure 6.
Seasonal subsurface water mass distribution in the South China Sea. Panels show (a) winter, (b) spring, (c) summer, and (d) autumn. Blue points denote South China Sea Subsurface Water and black points denote Kuroshio Subsurface Water. Reprinted with permission from [45].
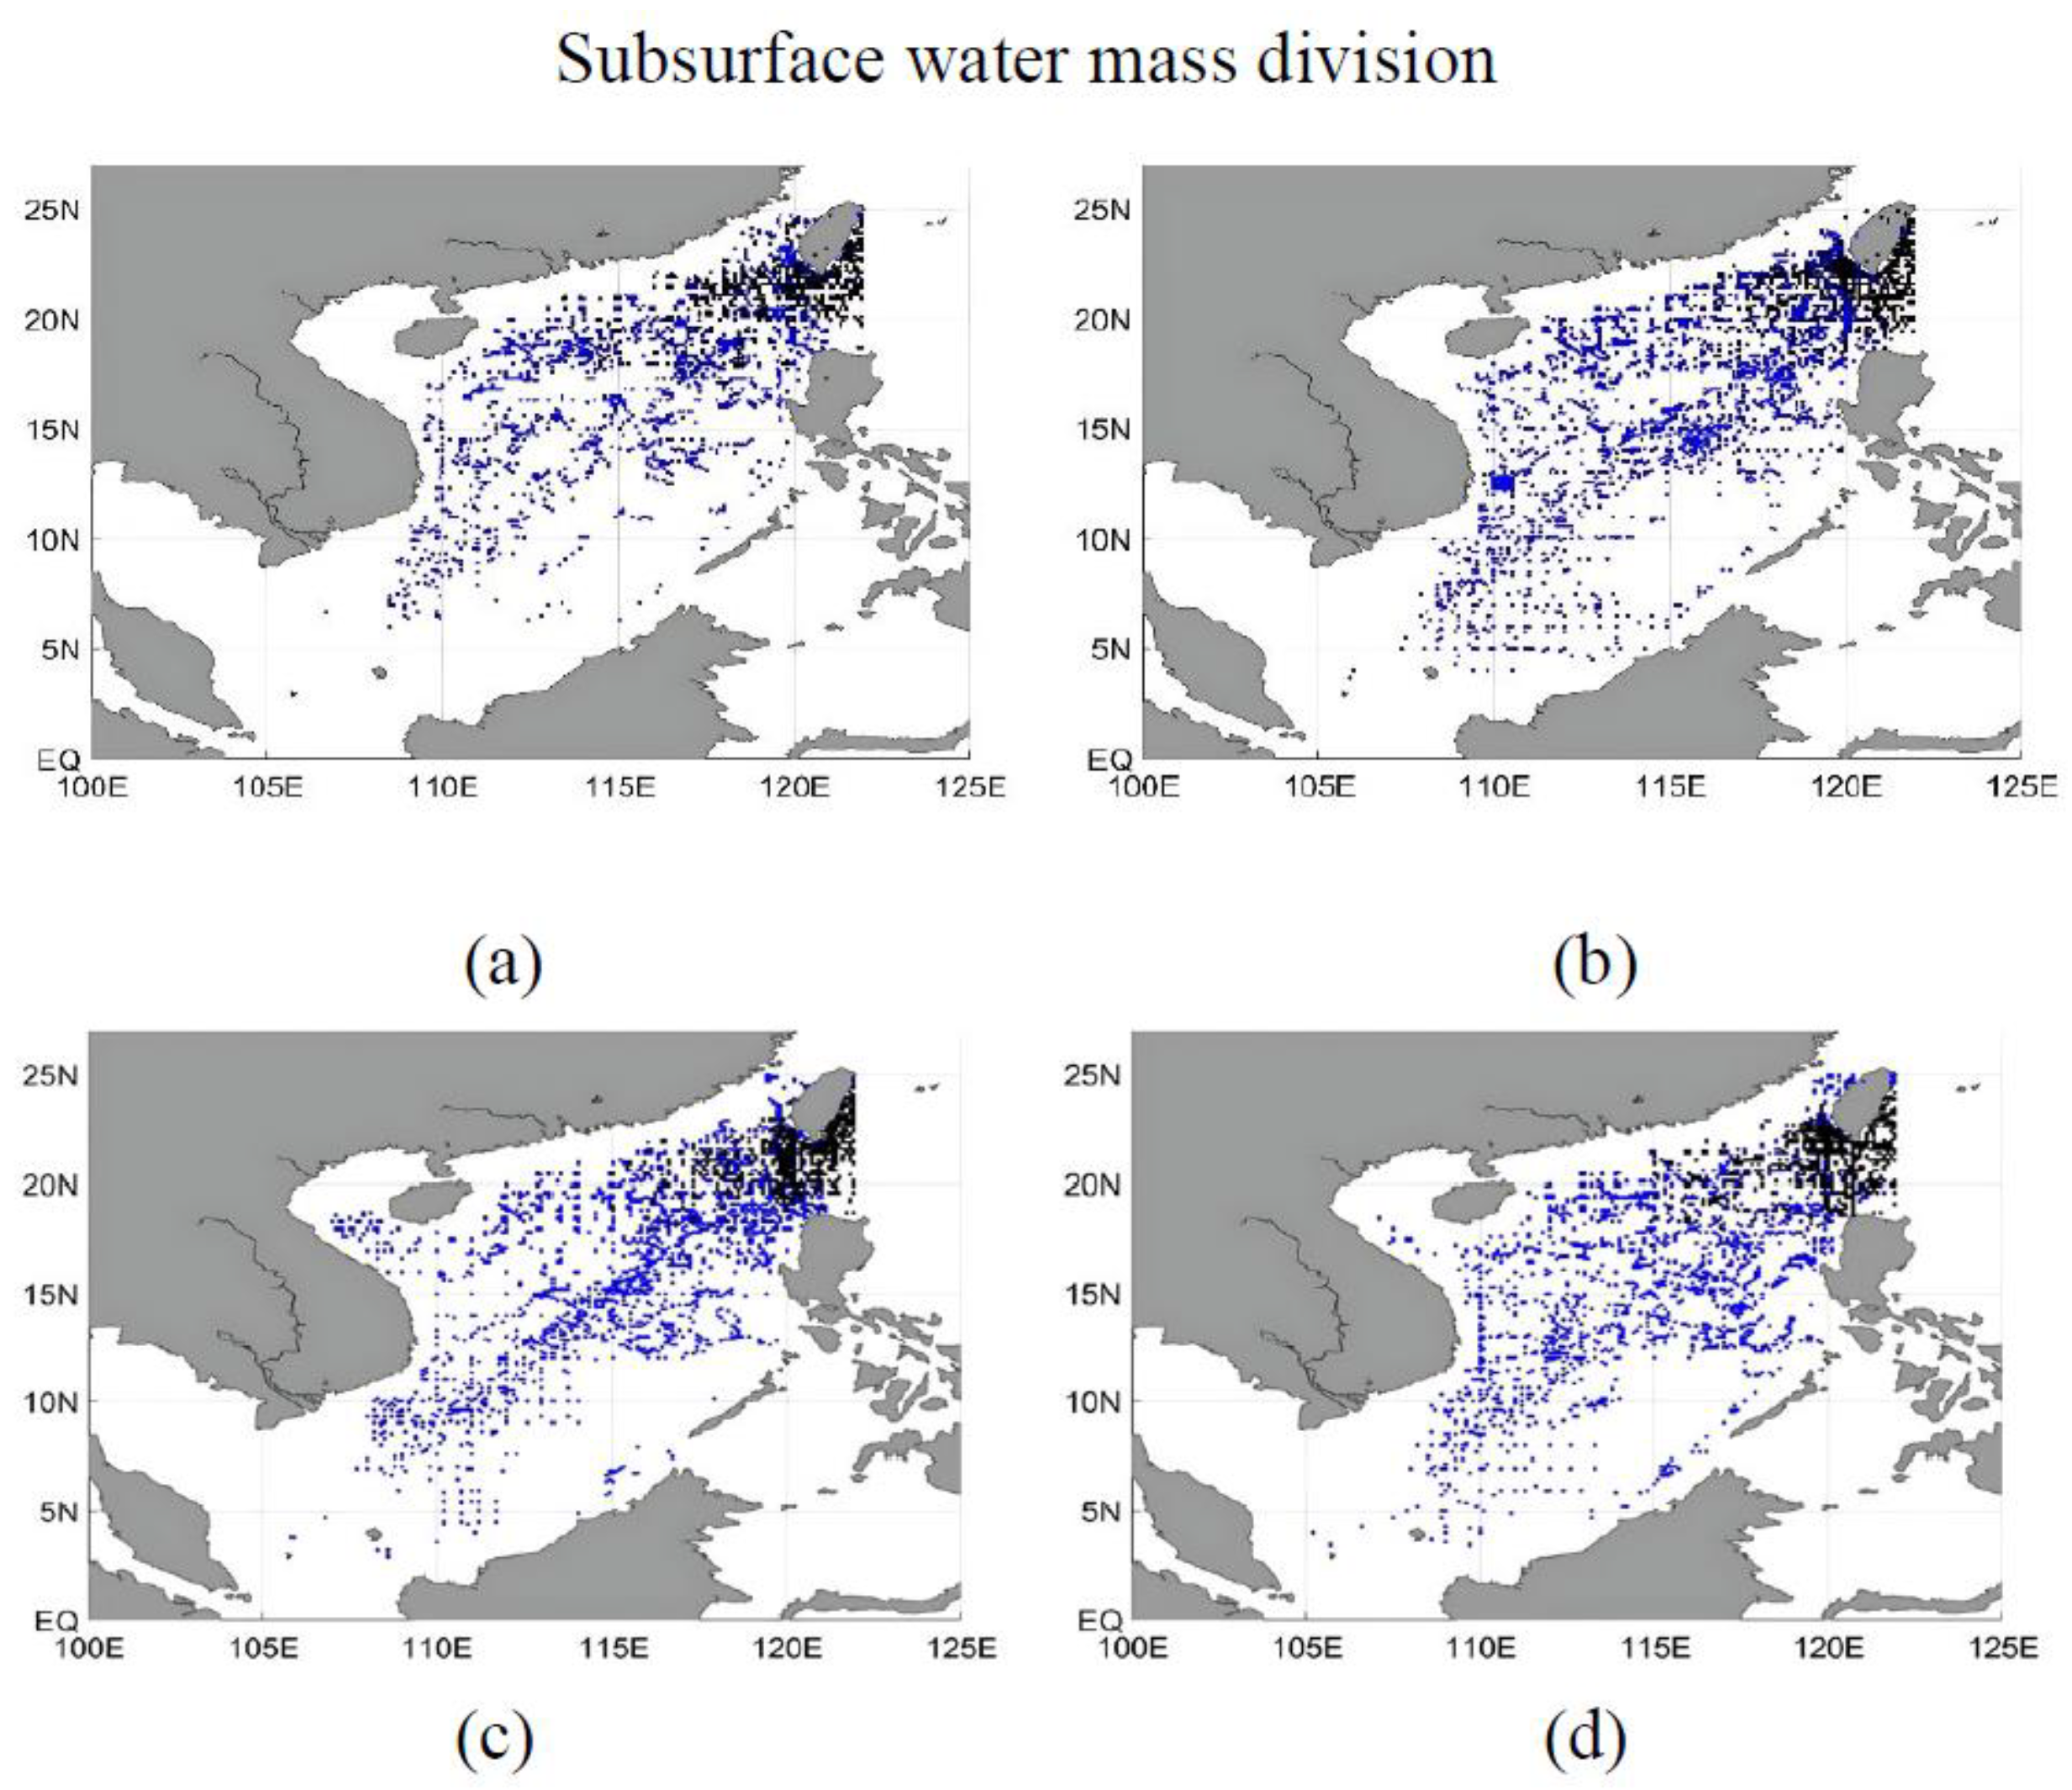

Table 1.
seasonal properties of water masses (average temperature and salinity) [31].
Table 1.
seasonal properties of water masses (average temperature and salinity) [31].
| Season | Sampling date | Water Mass | Temperature (°C) | Salinity (PSU) |
| Winter | January 3, 2017 | Mixed China Coastal | 19.91 ± 0.70 | 33.13 ± 0.52 |
| Kuroshio Branch | 22.51 ± 0.92 | 34.19 ± 0.26 | ||
| Average | 20.73 ± 1.44 | 33.47 ± 0.67 | ||
| Spring | April 2, 2017 | Kuroshio Branch | 23.49 ± 0.36 | 34.60 ± 0.01 |
| Summer | July 27, 2017 | South China Sea | 27.95 ± 1.29 | 34.01 ± 0.26 |
| Autumn | October 2, 2017 | South China Sea | 27.60 ± 1.54 | 33.97 ± 0.23 |
Table 2.
Experimental conditions in leading-edge erosion-relevant studies.
| Study | Country | Test type | Temperature (°C) | Fluid medium (Original as reported) | Approx. salinity (PSU) | Environmental realism notes |
| [5] | UK | Whirling arm rig | Not reported | Deionised water; artificial acid rain pH 4 (tap water + acids); saltwater with 3.5% NaCl | ≈0 – 35 | Includes a realistic seawater salinity (≈35 PSU), but temperature is unspecified and freshwater/ acid tests do not reflect marine chemistry. |
| [46] | UK | Whirling arm rig | Not reported | 3.5 % NaCl solution | ≈35 | Salinity is representative of seawater; lack of reported temperature prevents assessment of thermal realism. |
| [47] | UK | Whirling arm rig | 25 | Freshwater; 3.5% salt solution | ≈0 and ≈35 | Tests contrast freshwater and seawater-like salinity at a single ambient temperature that does not capture cold-climate or tropical conditions. |
| [48] | UK | Whirling arm rig | Room temperature (≈20 – 25) | Pure water; 3.5 % salt water | ≈0 and ≈35 | Onshore/Offshore contrast in fluid chemistry is included, but tests are restricted to ambient laboratory temperature |
| [6] | UK | Whirling arm rig | 20 ± 1 | Tap water (replacement for rainwater) | ≈0 | Canonical freshwater test at temperate laboratory conditions; no salinity and no representation or cold or tropical SST regimes. |
| [7] | UK | Whirling arm rig | 18 ± 1 | Water (not specified) | ≈0 | Near-ambient temperature freshwater-like test; salinity and detailed chemistry are not reported, limiting environmental realism. |
| [49] | Uk & Ireland | Whirling arm rig | 29 ± 1 | Neutral water; 3.5% saline water | ≈0 and ≈35 | Links experimental data to geospatial rainfall, with realistic seawater salinity but at a single warm laboratory temperature above typical North Sea winter SST. |
| [50] | India | Whirling arm rig | Not reported | Freshwater; 3% NaCl solution | ≈0 and ≈30 | Offshore tests use near-seawater salinity, but temperature is not reported, and thus thermal realism cannot be evaluated. |
| [8] | China | Water droplet erosion device | 20 ± 3 | Tap water | ≈0 | Water droplet erosion evaluated at ambient freshwater conditions; no marine salinity and no temperature variation relative to Tg or tropical SSTs. |
| [15] | USA | Open-circuit wind tunnel | Not reported | Freshwater; saltwater with 3.5% NaCl | ≈0 and ≈35 | Airflow + droplet configuration reflects offshore operation more closely, with realistic seawater salinity, but the absence of reported temperature limits comparison with environmental SST. |
| [51] | India | Water jet erosion test | 20 | Fresh water; saline water with 3% NaCl | ≈0 and ≈30 | Continuous jet impact using near-seawater salinity at ambient temperatures; captures chemical contribution of salinity but not cold-climate or high SST conditions. |
Disclaimer/Publisher’s Note: The statements, opinions and data contained in all publications are solely those of the individual author(s) and contributor(s) and not of MDPI and/or the editor(s). MDPI and/or the editor(s) disclaim responsibility for any injury to people or property resulting from any ideas, methods, instructions or products referred to in the content. |
© 2025 by the authors. Licensee MDPI, Basel, Switzerland. This article is an open access article distributed under the terms and conditions of the Creative Commons Attribution (CC BY) license (http://creativecommons.org/licenses/by/4.0/).
Copyright: This open access article is published under a Creative Commons CC BY 4.0 license, which permit the free download, distribution, and reuse, provided that the author and preprint are cited in any reuse.


