
Submitted:
08 December 2025
Posted:
10 December 2025
You are already at the latest version
Abstract
This study examines how the injection rate affects fracture complexity during hydraulic fracturing using water as the fracturing fluid. Experiments were conducted on concrete, impermeable sandstone, and brittle bituminous coal across a wide range of injection rates. The results showed that both low (< 1.0mL/min) and high (≥5.0mL/min) injection rates produced simple, planar fractures with limited branching. In contrast, an intermediate rate of 2.2mL/min consistently generated the most complex fracture networks. Fracture complexity was evaluated using 3D-scanned surface roughness quantified by the Joint Roughness Coefficient (JRC), which reached its highest values at the optimum injection rate. Although water is sometimes considered less effective than unconventional fluids, the findings demonstrate that it performs well in moderately permeable rocks with sufficient tensile strength. However, water was less effective in brittle coal and highly impermeable sandstone, where more compressible, low-viscosity fluids such as supercritical CO2 or nitrogen may be advantageous. Overall, three fracture behavior regimes were identified: a low-rate regime producing simple fractures, a mid-rate optimal regime producing complex networks, and a high-rate regime where fracture complexity decreased. Thin fractures dominated because controlled injection conditions focused on observing fracture behavior rather than merely inducing fracture, as reflected by the relatively high post-fracture injection pressure.
Keywords:
hydraulic fracturing
; injection rate
; fracture propagation
; fluid viscosity
; fracture complexity
1. Introduction
Hydraulic fracturing performance is critically dependent on the complexity and connectivity of the induced fracture network, which directly influences reservoir productivity in applications ranging from hydrocarbon recovery to geothermal energy, CO₂ sequestration, and hydrogen storage (Yu et al. 2023; Mwakipunda et al. 2023). While injection rate and fluid viscosity are among the most controllable operational parameters, their coupled influence on fracture initiation, propagation, and branching remains insufficiently understood, especially in heterogeneous or naturally fractured rock formations. The lack of a systematic, formation-specific understanding of how these parameters interact hinders the ability to optimize fracture network complexity, surface area, and conductivity. Current knowledge is further limited by the nonlinear interplay between these parameters and geo-mechanical conditions, leading to unpredictable outcomes in both laboratory and field-scale operations. This creates a pressing need for integrated experimental, theoretical, and numerical studies to establish optimal operational windows that maximize fracture complexity while avoiding undesirable outcomes such as premature fracture crossing, excessive height growth, or reduced connectivity.
Hydraulic fracturing has emerged as a transformative engineering technique for enhancing the productivity of low-permeability geological formations. By injecting pressurized fluid into subsurface rock, this method induces the initiation and propagation of fractures, creating artificial pathways that significantly improve fluid flow. Although traditionally associated with hydrocarbon recovery, hydraulic fracturing also plays a pivotal role in unconventional energy applications, including enhanced geothermal systems, carbon dioxide sequestration, and hydrogen storage. The effectiveness of hydraulic fracturing depends not merely on the initiation of fractures but also on the complexity and interconnectivity of the resulting fracture networks. It is within this context that operational parameters, especially injection rate and fluid viscosity, assume critical importance in dictating the geometry and efficacy of induced fractures(Guanhua et al. 2019; Ji et al. 2021; Wu et al. 2016; Kong, Ranjith, and Li 2021).
Fracture complexity is a multifaceted outcome that encompasses the number, orientation, branching behavior, and interaction of fractures within a given rock volume. Complex fracture networks are essential because they increase the contact area between the fluid and the rock matrix, improving hydrocarbon extraction and thermal exchange in geothermal applications. Achieving such complexity is contingent upon a delicate balance between various geological, mechanical, and operational factors. Among these, the rate at which fluid is injected and the physical properties of the fluid itself, most notably viscosity, are two of the most controllable and influential parameters. Understanding how these two factors interact to govern the evolution of fracture networks is crucial for optimizing hydraulic fracturing processes across a wide range of geological settings(Zhang et al. 2022).
The injection rate, defined as the volume of fluid introduced into the formation per unit time, determines the rate of energy delivery into the subsurface(Zhou and Burbey 2014; Zhang, Zhang, and Huang 2021). A higher injection rate can lead to rapid pressurization, triggering dynamic fracture propagation and potentially promoting fracture branching or bifurcation. Conversely, a low injection rate may result in delayed or incomplete fracture initiation, with fluid infiltration dominating over fracture propagation. However, a simplistic interpretation of injection rate effects can be misleading. For instance, excessively high rates may cause premature fracture crossing through existing natural fractures or bedding planes, reducing fracture complexity and increasing the risk of vertical growth beyond the target zone. Thus, there exists an optimal window of injection rate that must be identified and tailored to the geo-mechanical characteristics of the target formation.
Equally important is the viscosity of the fracturing fluid, which governs its ability to transmit pressure and infiltrate pore spaces or microfractures within the rock. Low-viscosity fluids, such as supercritical carbon dioxide or nitrogen gas, are more mobile and can easily penetrate the rock matrix, potentially initiating multiple microfractures. High-viscosity fluids, on the other hand, tend to localize pressure near the borehole, generating fewer but wider fractures(Bear 2013). The trade-off between these behaviors influences the pressure distribution, crack tip velocity, and the morphology of the fracture system(Chen et al. 2023). Additionally, viscosity affects fluid leak-off into the formation, the time to reach breakdown pressure, and the rate of acoustic emission events, all of which are indicators of the fracture process at different stages(Scoffin 2013).
The coupling between injection rate and fluid viscosity introduces a non-linear dynamic that can either enhance or suppress fracture complexity depending on the conditions(West et al. 2021). When considered together, these two variables define a hydraulic energy input per unit area and time, which in turn dictates the dominant failure mechanism, whether it is tensile failure, shear slippage along existing fractures, or a combination of both. For instance, a high injection rate coupled with a low-viscosity fluid may generate rapid tensile failure but may not sustain the pressure required for multi-directional branching. In contrast, a moderate injection rate with a high-viscosity fluid may induce stable but limited propagation. Thus, the interplay between injection rate and fluid viscosity becomes a central theme in the design of efficient and targeted fracturing treatments(Yaws 2014).
Fracture propagation in rock is governed by principles from fracture mechanics, especially the concepts of stress intensity factors (Irwin 1957) and energy release rates(Griffith 1921; Roylance 2001).
According to mode I fracture theory, propagation occurs when the stress intensity at the crack tip exceeds the material’s fracture toughness. The rate of pressurization, controlled by injection rate and viscosity, determines how quickly this threshold is reached. Furthermore, energy-based models suggest that crack propagation is energetically favorable when the strain energy release rate exceeds the energy required to create new surfaces. Since both injection rate and viscosity influence the accumulation and dissipation of strain energy, their effect on fracture initiation and growth is both direct and profound. In heterogeneous or naturally fractured rock masses, the situation becomes more complex. Natural fractures(Zeng and Wei 2017; Xi et al. 2022; Kolawole and Ispas 2020; Dehghan 2020), bedding planes, and faults interact with hydraulic fractures in unpredictable ways(Zheng, Liu, and Zhang 2019; Ma, Wang, and Zheng 2023). The nature of this interaction, whether the hydraulic fracture crosses, offsets, or is deflected by a natural fracture, depends on several factors, including the angle of approach, the mechanical contrast across the interface, and the fluid injection characteristics. The injection rate and fluid viscosity can modulate this interaction by altering the local stress field and pressure gradients at the point of intersection. For example, a high injection rate may allow a hydraulic fracture to cross a natural fracture due to inertia, while a lower rate might promote deflection and thereby enhance complexity. These nuanced behaviors highlight the need for integrated experimental and theoretical approaches to understand fracture-fluid interactions.
Several studies have attempted to empirically relate injection parameters to fracture behavior(Ishida et al. 2004; Zheng et al. 2025; Brady and Brown 2006). Laboratory experiments using synthetic rock analogs, real rock specimens, and advanced monitoring systems such as acoustic emission sensors and high-speed cameras have provided valuable insights into the time-evolution of fracture networks. These investigations suggest that optimal injection strategies must be adapted to the specific fluid-rock system under consideration(Heinze, Galvan, and Miller 2015). Modern numerical simulations using discrete element methods and coupled hydro-mechanical models have reinforced the view that the injection rate-viscosity interaction is neither trivial nor universally predictable, but is instead formation-dependent and highly sensitive to in-situ conditions(Zoback and Kohli 2019; Hubbert and Willis 1957).
In practical applications, field-scale hydraulic fracturing operations face additional constraints, such as equipment limitations, economic considerations, and environmental regulations. The optimization of injection protocols must therefore balance operational feasibility with geo-mechanical effectiveness. One promising approach is the use of parameters, such as the product of injection rate and viscosity (Qμ) (Kresse et al. 2013), as a proxy for fluid energy input. By maintaining a constant Qμ (Eshiet and Sheng 2017) across different fluid types, operators may achieve comparable fracturing performance even when substituting one fluid for another. This strategy could be particularly beneficial in unconventional or environmentally sensitive reservoirs where fluid selection is constrained by availability, cost, or environmental impact.
Given the centrality of fracture network complexity to production performance and reservoir sustainability, there is a pressing need to develop a systematic understanding of how injection rate and fluid viscosity interact to shape fracture geometries. The goal is not only to maximize fracture surface area but also to enhance fracture connectivity and conductivity, thereby improving the long-term efficiency of resource extraction. This calls for a comprehensive research approach involving controlled laboratory tests, theoretical modeling, and where possible, pilot-scale field trials.
This paper aims to address the above-mentioned problem by investigating the coupled influence of injection rate and fluid viscosity on fracture branching behavior in representative rock materials, with the underlying premise that low-viscosity fluids may necessitate substantially higher injection rates whereas higher-viscosity fluids can achieve similar effects at comparatively lower rates. Using experimental setups that mimic in-situ stress conditions, we will explore how varying these parameters influences fracture initiation, propagation paths, and resulting network complexity. The preliminary results are expected to contribute to the development of more refined hydraulic fracturing strategies that are adaptable, efficient, and better aligned with the geo-mechanical realities of diverse geological formations.
2. Methodology and Sample Preparation
2.1. Sample Preparation
2.1.1. Concrete Preparation
42.5MPa (42.5N/mm2) cement type, sand and water were mixed in the ratio of 1:1:0.4(Singh, Munjal, and Thammishetti 2015; Li 2021) by weight, respectively (e.g. weight of cement was 7.5kg same as sand and water had a weight of 3kg). To have a common grain size for sand, sieving was done using a size 30 mesh or sieve equivalent to 0.6mm, as shown in Figure 1. Additionally, weighed cement, sand and water were put in a bucket and stirred thoroughly to get a uniform mixture. The mixture was then poured into cubic molds measuring 100x100x100mm to cast the concrete. The mixture was also poured into cylindrical molds measuring 100mm and 50mm by length and diameter, respectively, according to the recommended International Standard for Rock Mechanics (ISRM) for testing Uniaxial Compressive Strength (UCS)(Bieniawski and Bernede 1979). This was to later check the quality of the concrete. The concrete mix was then left to cure for the recommended period of 28 days in a place away from sunlight for maximum strength(Pawar and Kate 2020). See Figure 1 below:
To keep the concrete hydrated during the curing period, water was constantly added to it during the first twelve days to attain maximum strength (Tan and Gjorv 1996). The uniaxial compressive strength test results for concrete are presented in Figure 2 and Table 1. For accurate results, the test was conducted under a loading rate of 0.100 mm/min(Xiu et al. 2021).
The calculated average UCS value was 28MPa which falls within the range of standard concrete after 28 days curing time and classifying it as M25 (Ali Abbas et al. 2024; Rafi et al. 2014).
2.1.2. Sandstone and Coal Preparation
In this study, in addition to concrete samples, bituminous coal and sandstone (Figure 3) were selected as representative rock materials due to their contrasting mechanical and permeability characteristics, which are relevant for simulating heterogeneous subsurface conditions. Each sample was precisely shaped into a cubic form with dimensions of 100 × 100 × 100 mm using a high-precision wire cutting machine. This method ensured minimal surface damage and maintained the integrity of the internal structure, which is critical for accurately capturing fracture initiation and propagation behavior under controlled laboratory conditions. The use of standardized dimensions and uniform preparation techniques facilitated repeatability and comparability across different experimental runs.
2.1.3. Sample Design
The samples were prepared according to the specified dimensions to facilitate the installation of the fluid injection system, ensuring a 5mm fluid injection column was maintained, as illustrated in Figure 4(a). A central borehole was drilled to a depth of 52.5mm using a 6mm diameter drill bit, after which compressed air was employed to remove residual drill cuttings. A steel injection pipe was then inserted into the borehole to a depth of 47.5mm, secured with sealing tape wrapped around its lower end, thereby leaving a 5mm space between the bottom of the hole and the pipe tip to serve as the fluid injection column. To prevent leakage during fluid injection, resin adhesive was applied to fill the annular gap between the borehole wall and the injection pipe. This procedure was replicated for all remaining samples. The adhesive was allowed to cure for a minimum of 48hours in accordance with the manufacturer’s guidelines, prior to the commencement of the hydraulic fracturing tests. Figure 4(b)(c)(d) present the completed sample preparation with the injection pipes inserted.
2.2. Experimental Set-Up
The main hydraulic fracturing equipment was the HADZ–IV true tri-axial seepage hydraulic fracturing machine. It’s fitted with a control unit for setting the confining stresses that mimic field conditions, i.e., vertical or overburden stress σv, minimum principal stress σh and maximum principal stress σH through the hydraulic-operated platens. In addition, we had a HAG – 70P fluid injection pump; Central computer for data display, capture and setting; An Acoustic Emission detector (AE) used for accurate monitoring of seismic events in the rock sample as the test was being conducted. Figure 5 below shows the main equipment and Figure 6 as its corresponding schematic diagram.
The fracturing fluid used in the experiment was water and the assumed depth for the fracture test was set at 1000m. Different injection rates at a constant rate were applied from as low as 0.2ml/min to 20ml/min while observing the results. With the density of sandstone taken as 2500kg/m3, the vertical stress was worked out to be 25MPa and assumed a normal faulting condition to set values for minimum and maximum principal stresses. Since standard concrete can have a density (2200 – 2500kg/m3 )(Neville 1995) similar to that of sandstone, the same values for in-situ stresses were used for concrete samples. However, bituminous coal with a much lower density taken as 1200kg/m3(Speight 2012) for this test at the same depth, its overburden stress was calculated as 12MPa and equally assumed a normal faulting condition to set the minimum and maximum principal stresses. Table 2 below summarizes the laboratory set conditions for all the tests. In the table, C1 implies test number 1 on a concrete sample up to test number 14, Ss13 as test number 13 on a sandstone sample, and coal14 and coal15 as test numbers on coal samples.
3. Results and Discussion
In this section, the results of the hydraulic fracturing tests using concrete, sandstone and coal samples with different injection rates are presented. Specifically, the fracture behaviors in the different rocks, the injection rate conditions for fractures to penetrate the different rocks and the fracture surfaces are discussed.
3.1. Hydraulic Fracture (HF) Behavior at Different Injection Rates
In general, the hydraulic fractures propagated perpendicular to the minimum principal stress (σh), consistent with the theoretical prediction of Mode I fracture opening under high fluid pressure. Samples such as C1, C2, C3, C4, C5, C6, and C7 (Figure 7, Figure 8 and Figure 9) exhibited well-defined, planar fracture surfaces with minimal deviation or branching, indicating a stable fracture growth mechanism. These results suggest that within a certain injection rate range, the fracture propagation is controlled predominantly by the stress field and rock matrix properties, with limited influence from pre-existing heterogeneities. C1, conducted at a rate of 2.0ml/min showed planar fracture surfaces while C4 conducted at the same rate, showed some fracture surface irregularities. Tests with high injection rates like C2 and C5, showed a planar fracture surface just like those with low rates in the case of C3.
As injection rates increased (up to 20 ml/min), fracture propagation remained efficient and planar, consistent with sufficient pressure buildup overcoming tensile strength and cohesive forces along the weakest plane perpendicular to σh. Conversely, tests conducted at low injection rates (e.g., <0.2 ml/min) failed to initiate fractures, indicating that below a critical pressure threshold, the induced fluid pressure is insufficient to exceed the breakdown pressure of the rock matrix or overcome the confining stress. In samples like C6 and C8 (Figure 9 and Figure 12), the resulting fracture surfaces remained relatively smooth and uniform, suggesting minimal energy dissipation during infiltration, limiting multiple fracture initiation points and the consequential branching.
In contrast, more complex fracture behaviors were observed in samples that allowed a longer fluid infiltration time accompanied by acoustic emission (AE) signal detection, for example, in C11. Similarly, C12 exhibited multiple thin fractures originating from the base and lateral sections of the sample, indicating that the stress distribution and fracture energy were redistributed upon encountering pre-existing features, as shown in Figure 11. These irregular patterns suggest the initiation of secondary fractures or branching. This emphasizes the importance of internal structural mapping, where CT scanning can provide crucial insights into internal fracture intersections and hidden discontinuities that influence fracture geometry. In Coal14, as shown in Figure 13, HF propagation was significantly inhibited or deviated due to interaction with pre-existing discontinuities. The inability of the fracture to cross a natural fracture in Coal14, likely due to a wide-aperture natural fracture acting as a barrier, resulted in fracture termination or deviation. Figure 13 also shows a planar fracture surface from a test conducted on sandstone; fracture complexity could not be attained due to the poor infiltration process in a highly impermeable rock type.
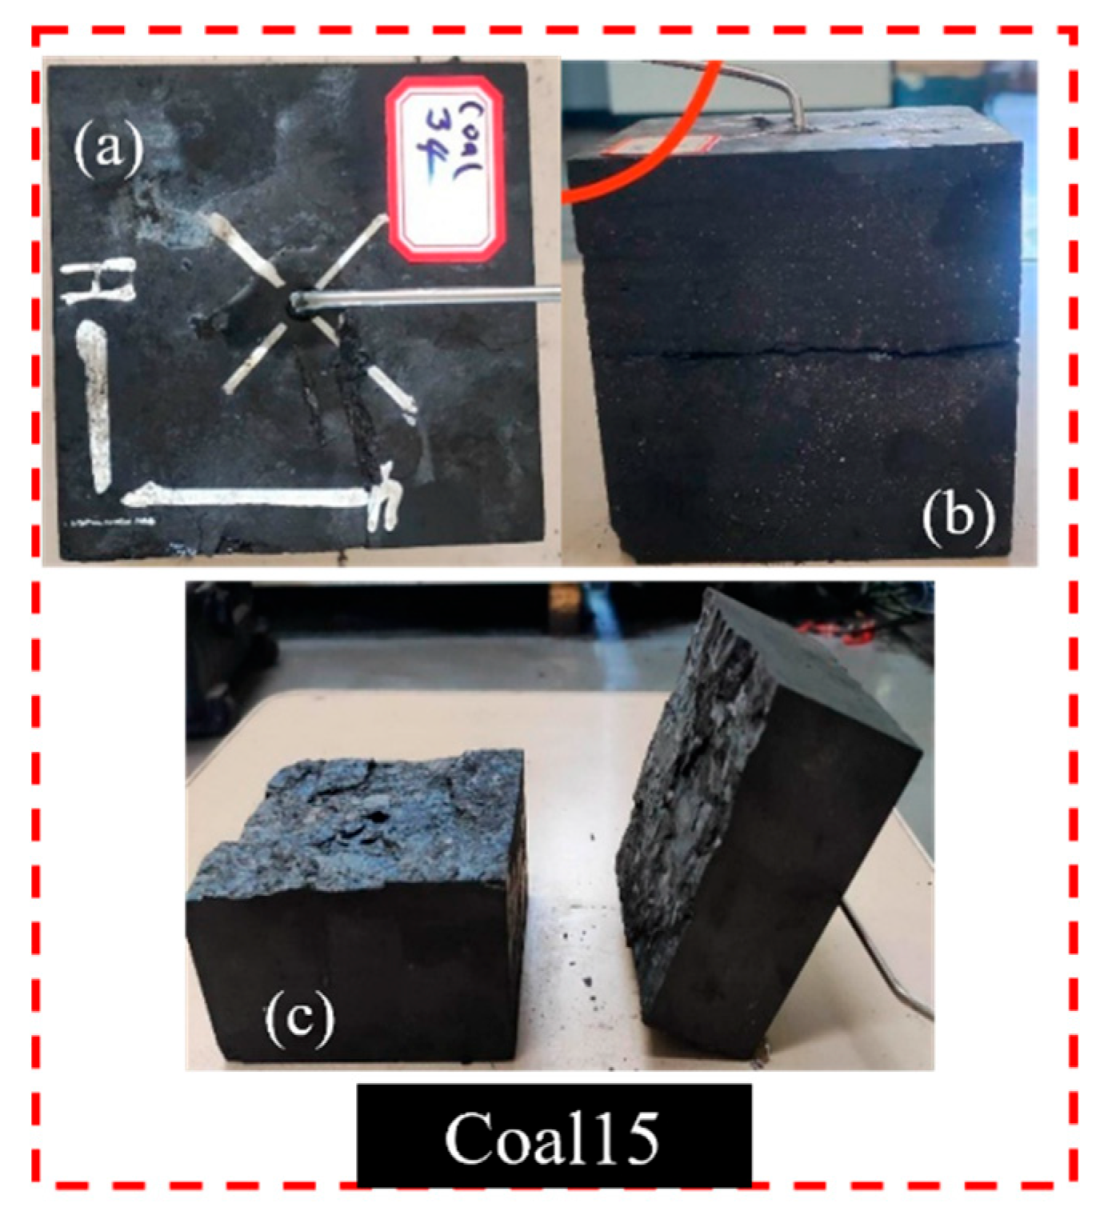
One of the most significant findings emerged from sample Coal15 (Figure 14), where an injection rate of 1.0 ml/min failed to generate a conventional hydraulic fracture. Instead, fluid pressure exploited an existing natural fracture aligned with the injection column, resulting in failure along that plane rather than initiating a new HF. This demonstrates that the presence of natural fractures intersecting the injection column can drastically alter the fracturing process by providing a preferential flow path, thereby relieving pressure and preventing new fracture initiation. Figure 10 represents a transition through which results were gradually improving as the injection rate increased from very low to medium rate, with fracture surfaces showing minor irregularities. Test sample C9, conducted with a rate of 5.0ml/min, gave a reversal of results to planar fracture surface. In order to emphasize on the poor results as the injection rate increased, C8 was conducted at 20ml/min, giving a similar flat fracture surface. Both of these results are shown in Figure 12.
Figure 10.
Tested sample C10 (a) HF direction (b) HF development (c) fracture surface.
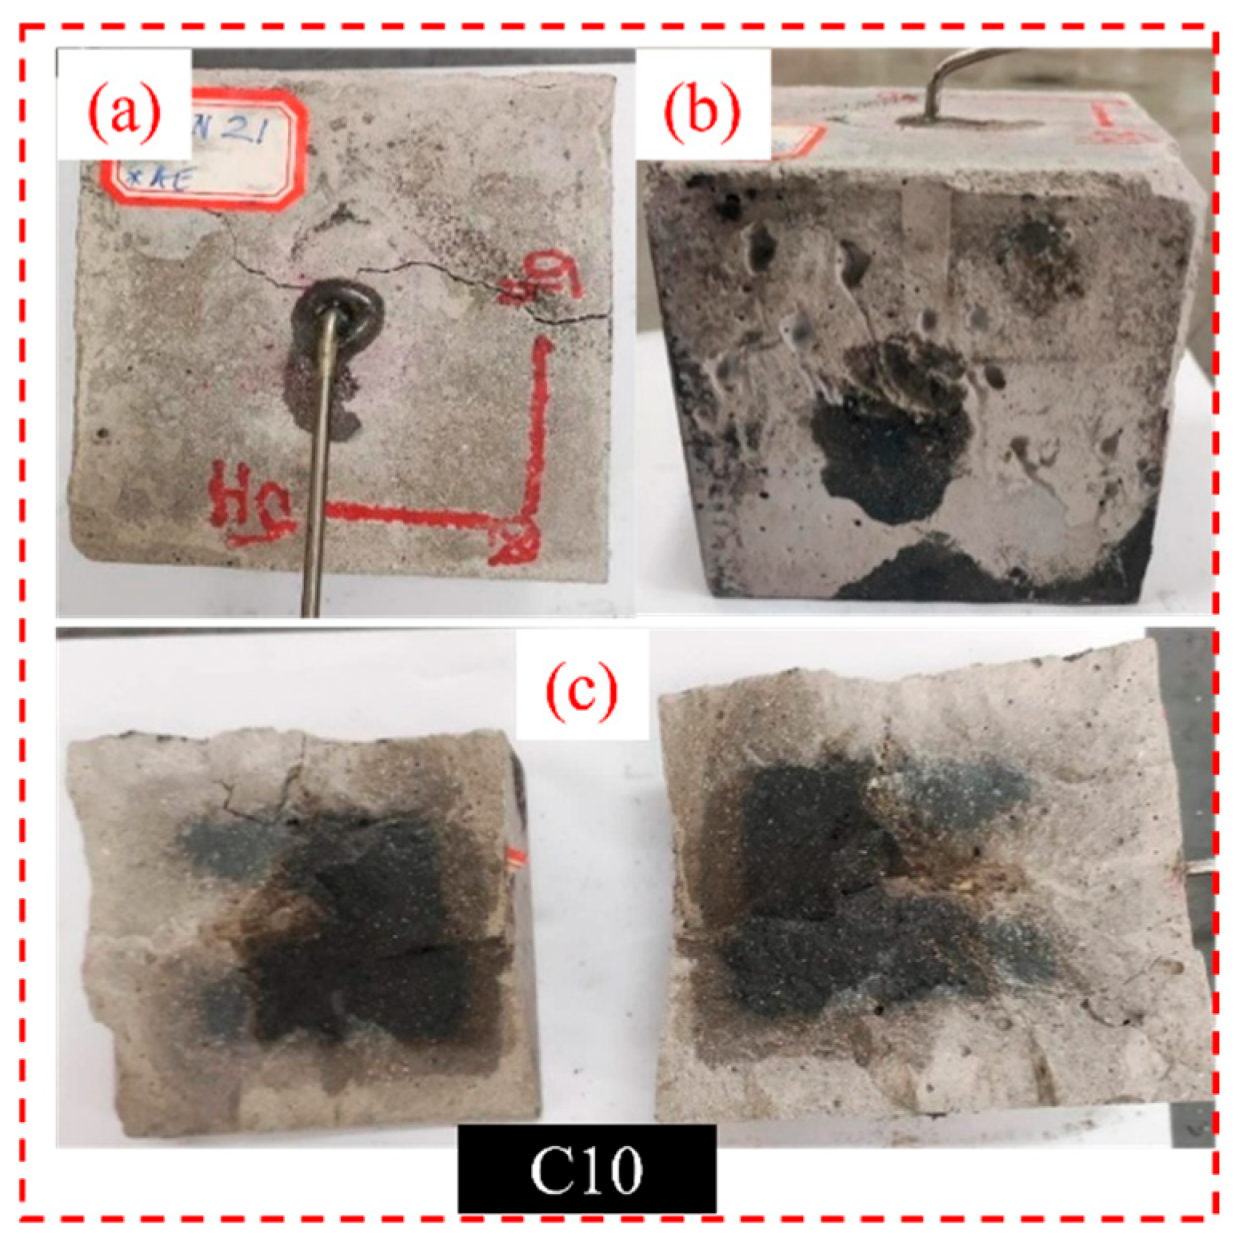
Figure 11.
Tested samples C11 (a) HF direction (b) HF development (c) fracture surface; C12 (a) HF direction (b) multiple HF development (c) fracture development (d) fracture surface.
Figure 11.
Tested samples C11 (a) HF direction (b) HF development (c) fracture surface; C12 (a) HF direction (b) multiple HF development (c) fracture development (d) fracture surface.
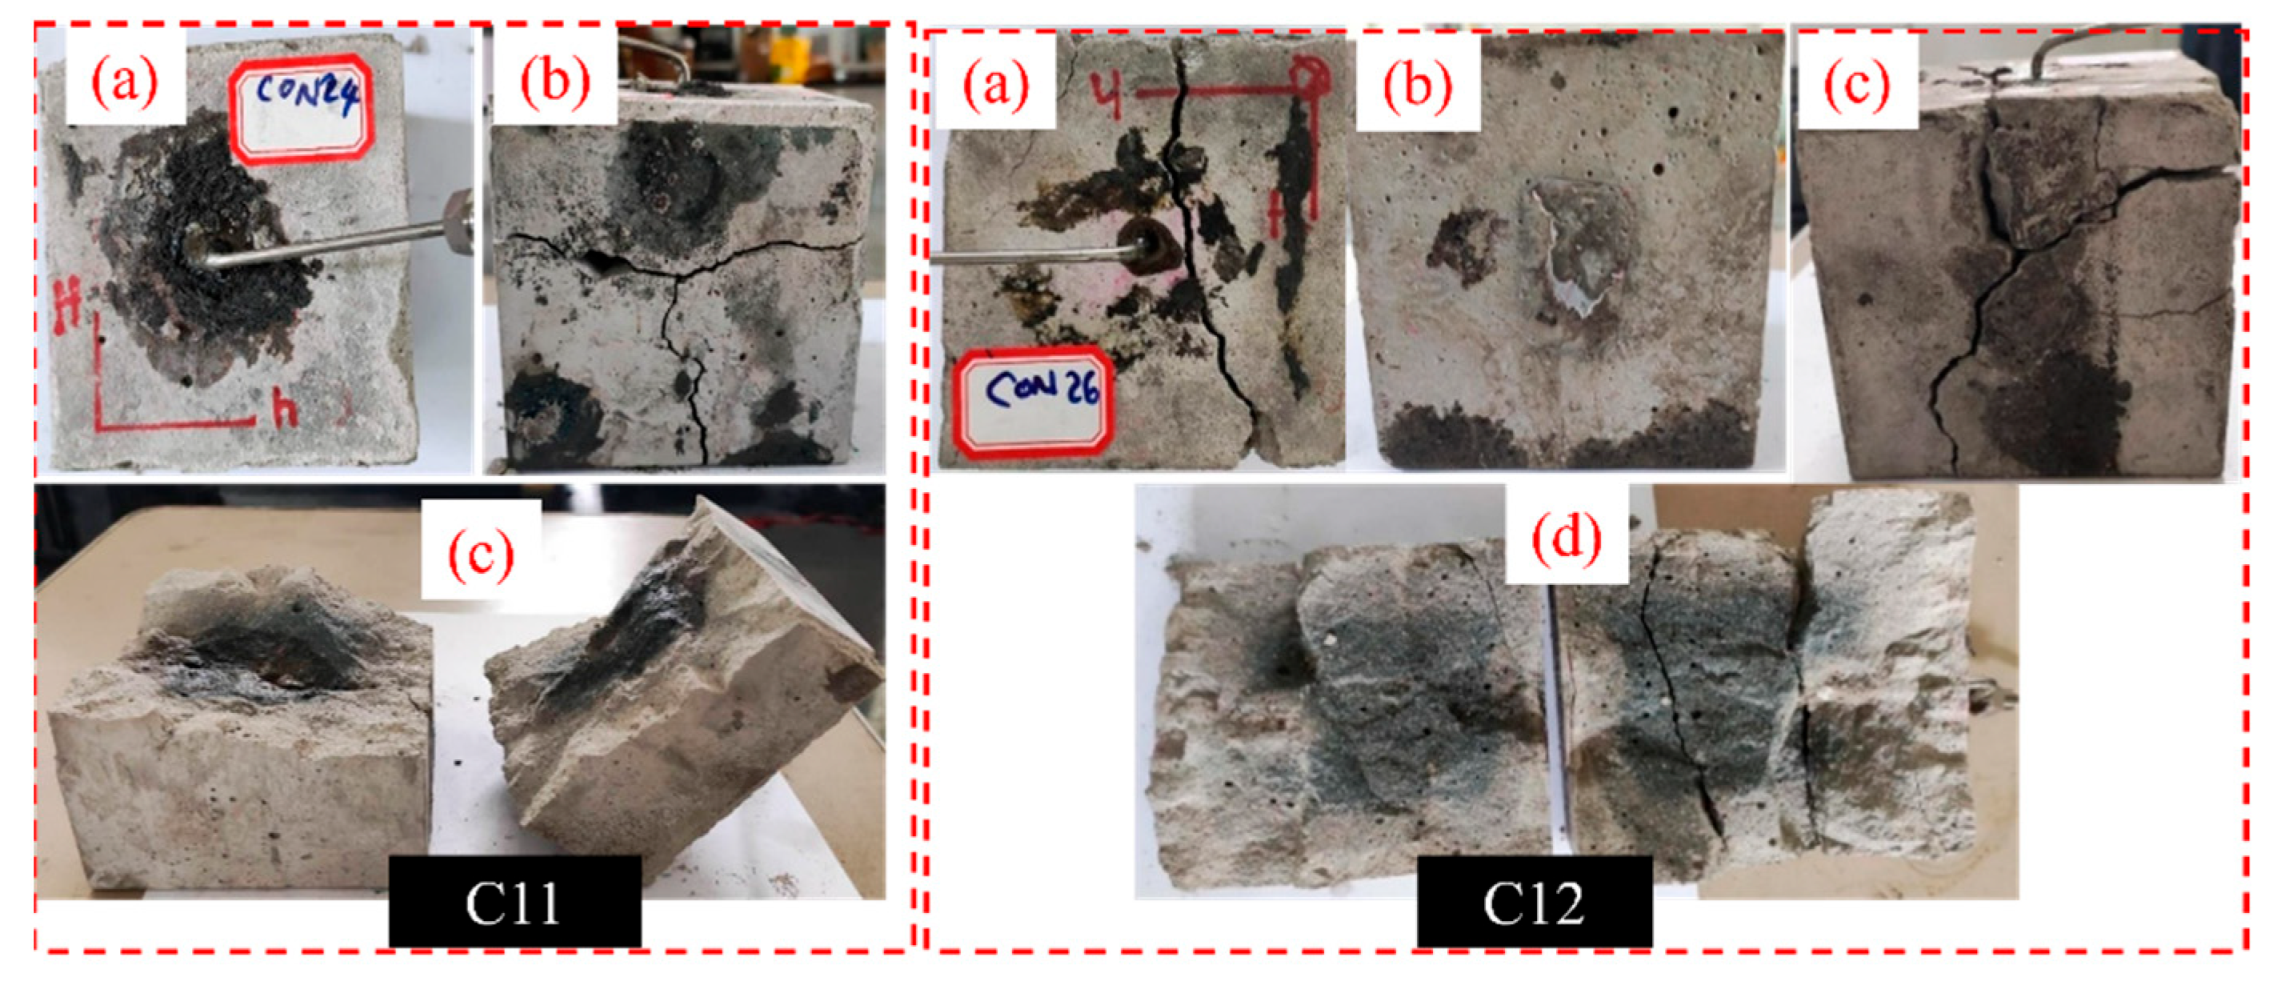
Figure 12.
Tested samples C9 (a) HF direction (b) HF development (c) fracture surface; C8 (a) HF direction (b) HF development (c) fracture surface.
Figure 12.
Tested samples C9 (a) HF direction (b) HF development (c) fracture surface; C8 (a) HF direction (b) HF development (c) fracture surface.
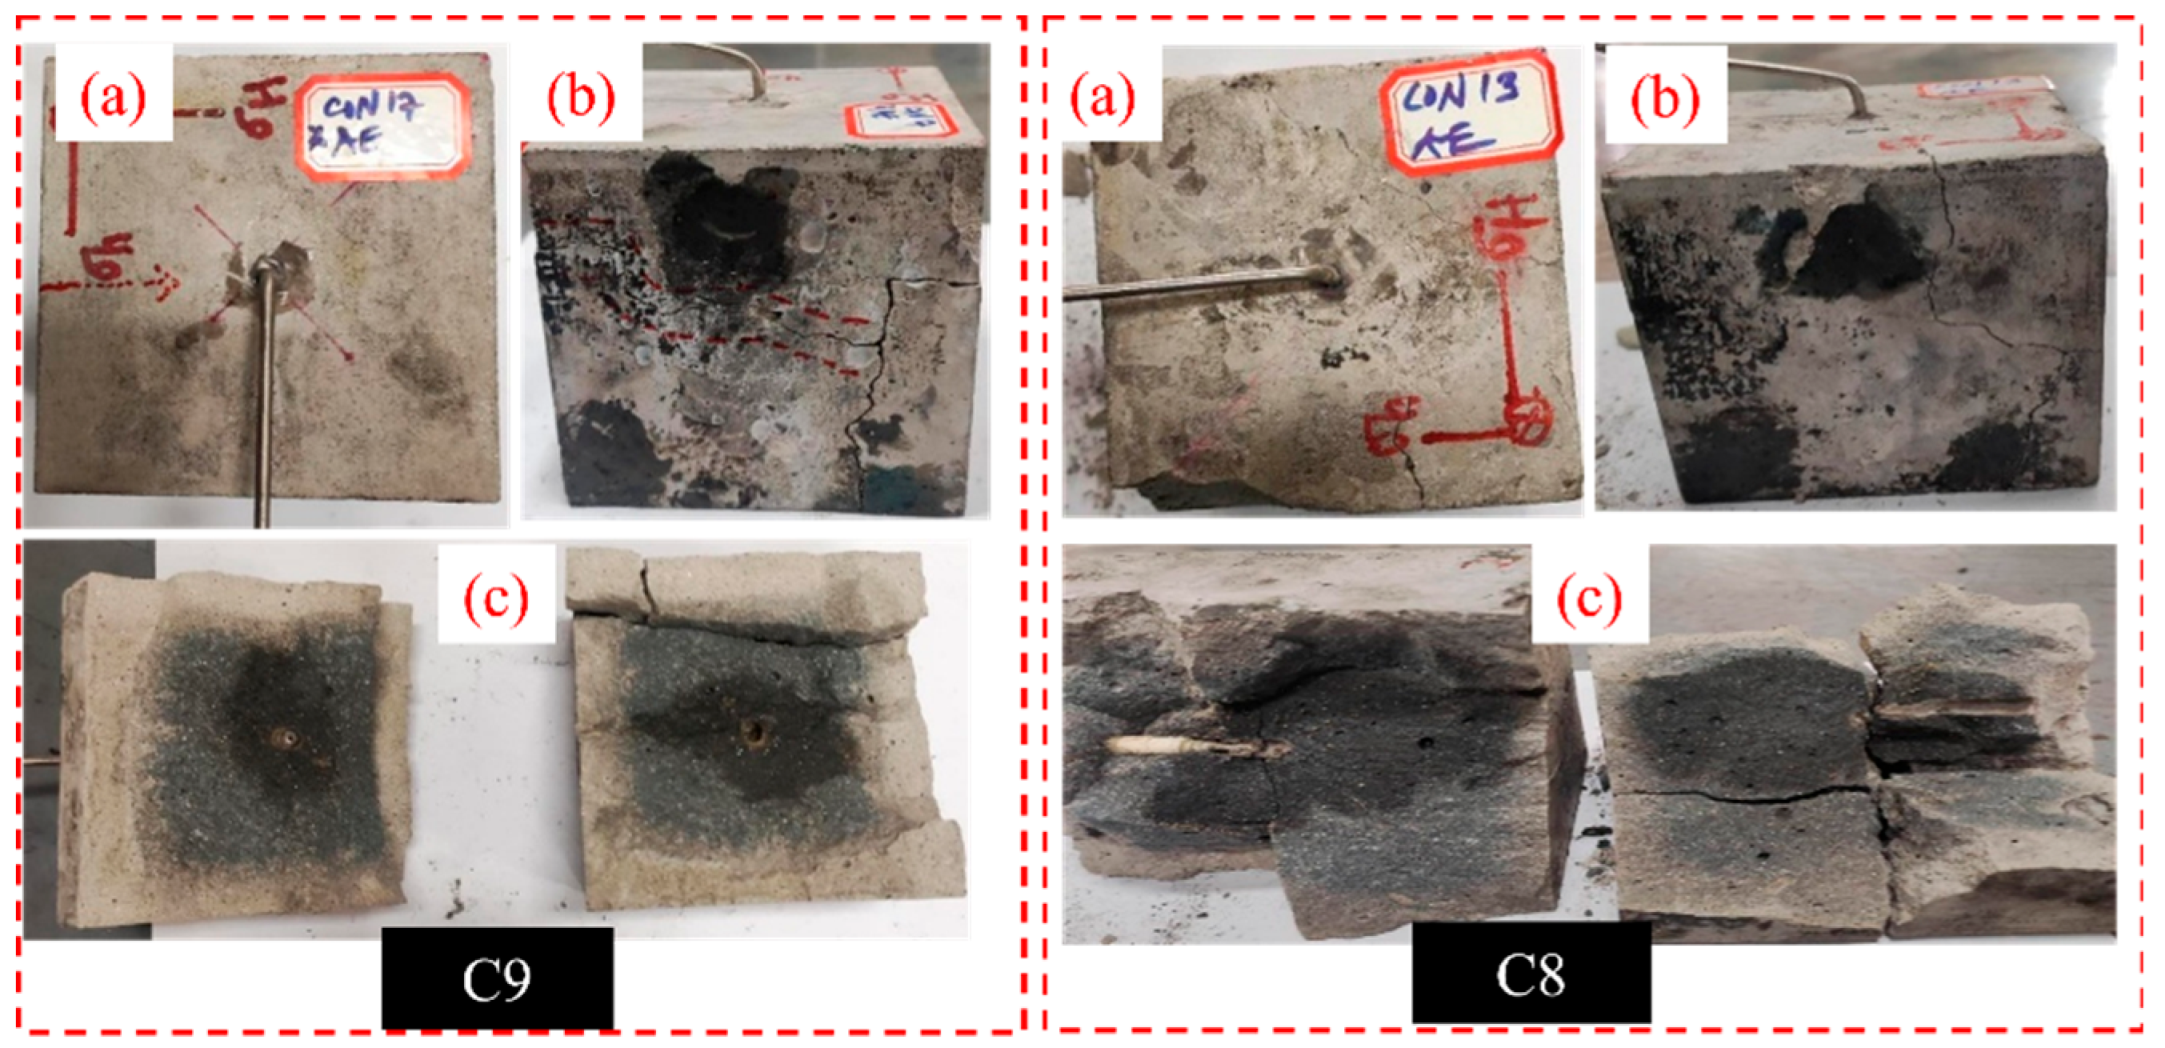
Figure 13.
Tested samples SST13 (a) HF direction (b) HF development (c) fracture surface; Coal14 (a) HF direction (b) HF development (c) fracture surface.
Figure 13.
Tested samples SST13 (a) HF direction (b) HF development (c) fracture surface; Coal14 (a) HF direction (b) HF development (c) fracture surface.
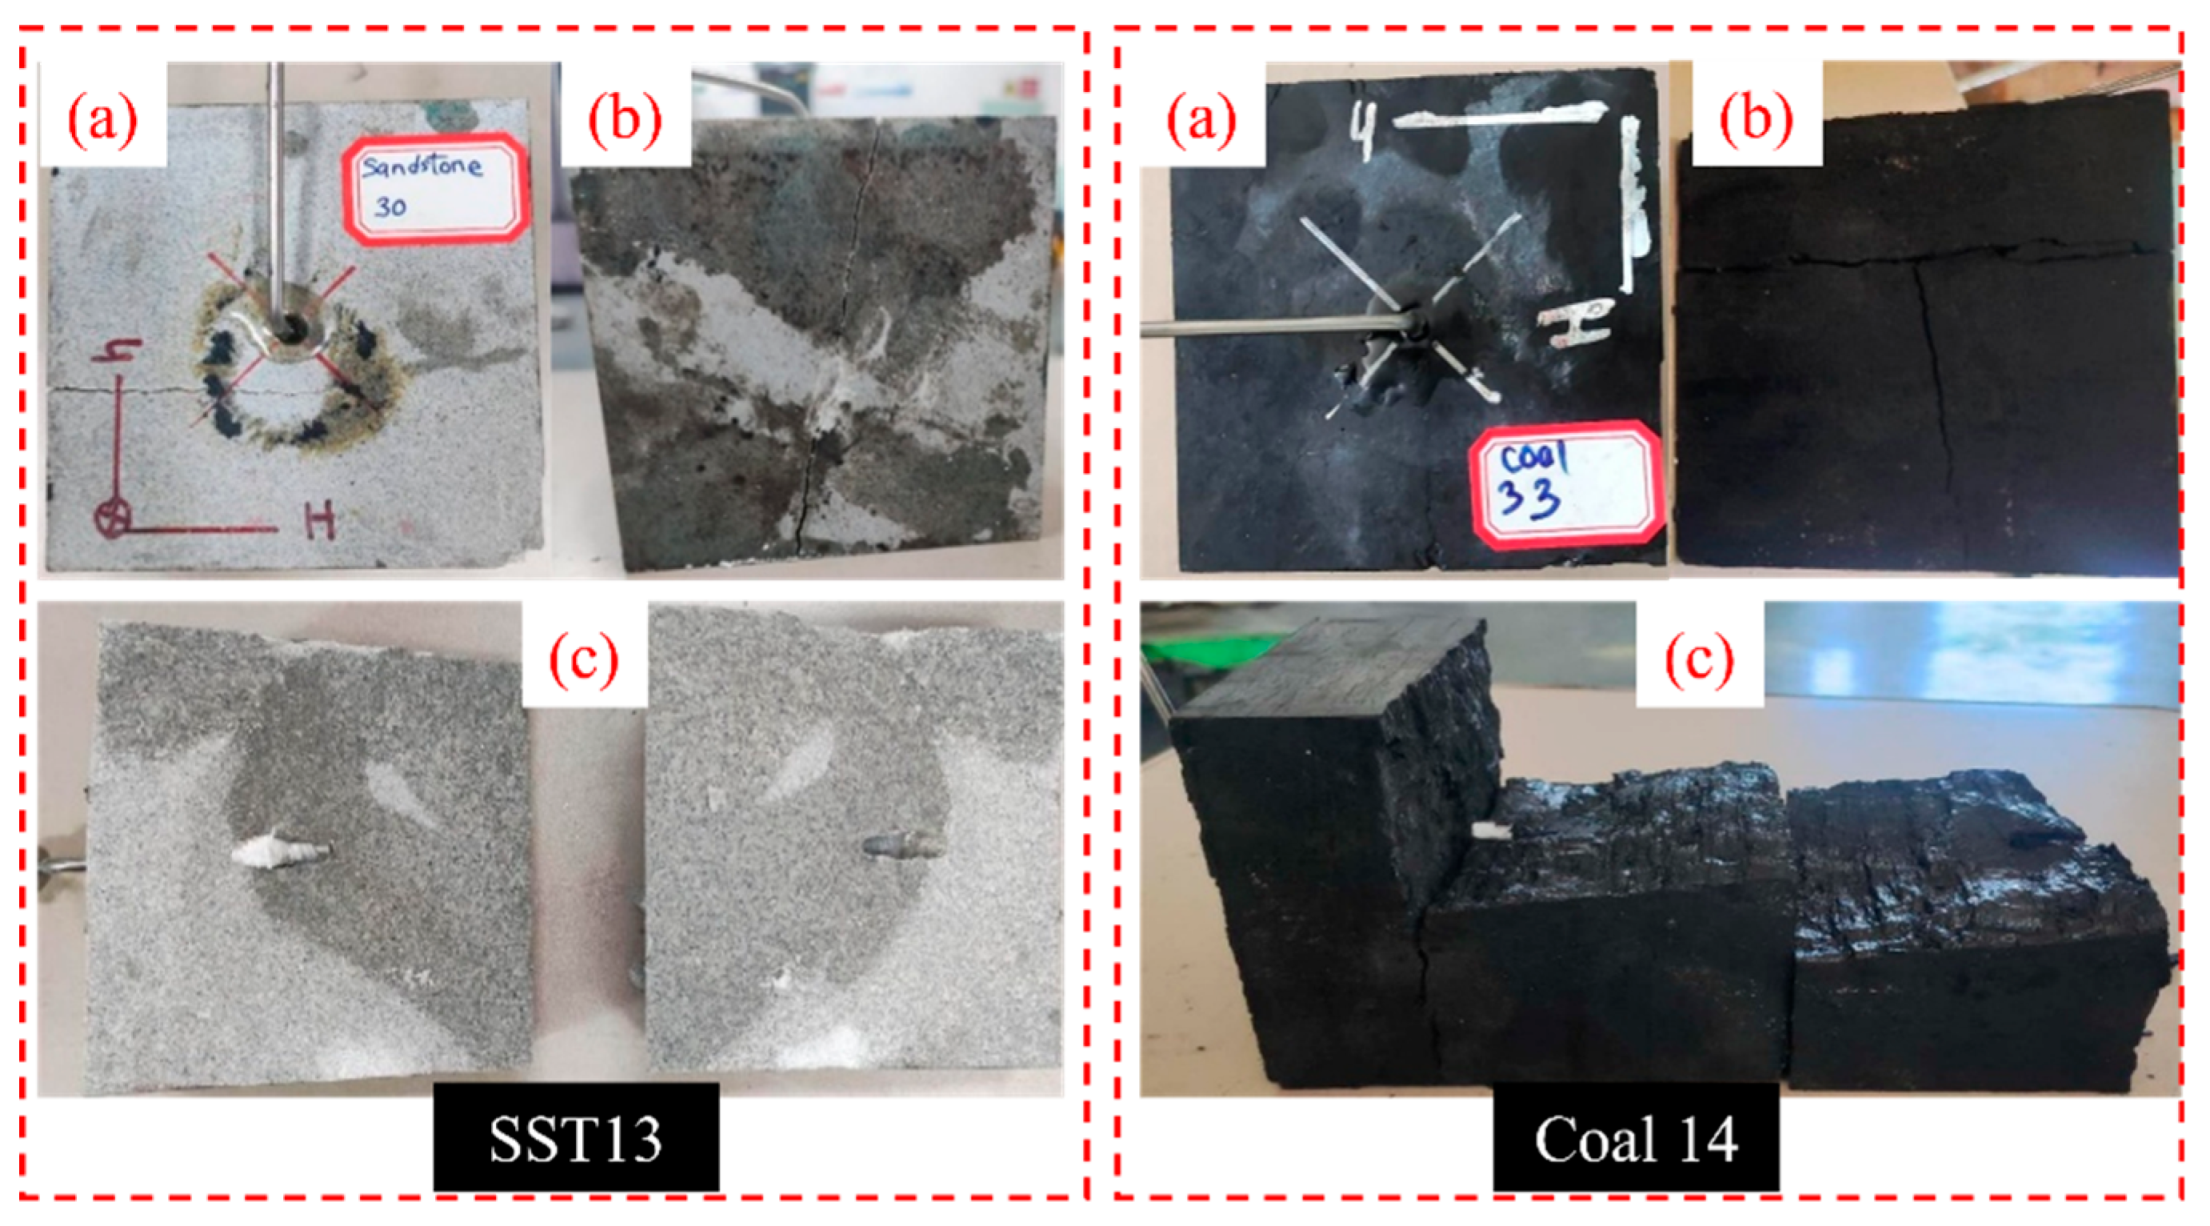
Figure 14.
Tested sample Coal15 No HF development.
3.2. Injection Pressure Evolution
Figure 15 illustrates the injection pressure-time evolution for samples C1, C2, and C3, highlighting the effects of varying injection rates on fracture initiation and pressure response. In test C1, conducted at an injection rate of 2.0 ml/min, fracture initiation occurred at a breakdown pressure of 30.44 MPa after 149 seconds and 4.96 ml of water injection. The breakdown event was followed by a brief pressure plateau lasting approximately 8 seconds before the pressure declined slightly to 30.16 MPa and subsequently to 27.16 MPa, indicating the onset of fluid infiltration into the created fracture. A notable pressure recovery phase occurred after 15 seconds, stabilizing at an average of 27.7 MPa. This recovery is indicative of progressive fracture opening and sealing behavior, possibly influenced by minor fluid leakage or partial fracture closure. The absence of additional breakdown events suggests that the initial fracture pathway remained dominant throughout the test, with high residual pressure supporting the presence of thin but hydraulically conductive fractures.
In contrast, test C2 was conducted at a significantly higher injection rate of 8.0 ml/min and exhibited a more abrupt pressure response. Breakdown occurred at 29.82 MPa after injecting 7.68 ml of fluid over just 41 seconds. Following the peak, pressure dropped sharply to 26.67 MPa within 5 seconds, then stabilized at an average of 26.1 MPa. The rapid pressure decay and subsequent stabilization imply the formation of a single dominant fracture with reduced resistance to fluid flow, allowing for efficient pressure dissipation. Notably, the absence of further pressure peaks suggests a stable fracture path with minimal branching. Interestingly, test C3, conducted at the lowest injection rate of 0.2 ml/min, still induced fracture initiation at a breakdown pressure of 29.68 MPa after 1612 seconds and 4.33 ml of injection. Although the peak pressure was sustained for only 3 seconds before falling to 25.21 MPa over 76 seconds, the pressure eventually recovered to 27.68 MPa. This test demonstrates that even at low injection rates, pressure can accumulate sufficiently over time to exceed the tensile strength of the rock and induce fracturing. The long duration to breakdown reflects a slow but steady pressurization process, consistent with low-rate diffusion-controlled stress buildup. However, it must be noted that the resulting fracture network from this test was a simple one.
Figure 16 shows the pressure evolution and acoustic emission (AE) activity during test C4, conducted at 2.0 ml/min. Breakdown occurred at a relatively lower pressure of 18.51 MPa after injecting 3.38 ml of fluid over 107 seconds. Unlike the previous tests, multiple breakdown events were observed, each followed by a pressure recovery phase, with the final breakdown peak reaching 21.05 MPa. This complex pressure behavior suggests the initiation of multiple fracture tips or reactivation of pre-existing microfractures. The pressure dropped to 18.14 MPa within 7 seconds before stabilizing at a post-peak average of 19.79 MPa. Importantly, AE monitoring—recording energy, count, and hit data—was implemented during this test, offering critical insight into micro-fracturing behavior preceding macroscopic failure. Elevated AE activity prior to and during breakdown events indicates active rock damage accumulation and distributed microcrack formation. The synchronization of AE energy surges with pressure spikes strongly supports the hypothesis that micro-fracturing plays a key role in creating multiple fracture initiation sites. This phenomenon, when coupled with an optimized injection rate, promotes the formation of complex fracture networks essential for enhancing permeability in hydraulic stimulation applications. C5, conducted at a high injection rate of 8.0 ml/min, where 2.95 ml of fluid was injected over a brief period of 31 seconds. Breakdown occurred at 15.89 MPa, with the peak pressure lasting only 1 second before rapidly dropping to 11.84 MPa within 3 seconds, and stabilizing at an average pressure of 12.38 MPa. The extremely short pressurization window limited the rock’s ability to undergo progressive micro-damage, reflected in the minimal AE activity recorded during the test. This suggests that at high injection rates, the induced pressure surpasses the tensile strength abruptly, initiating a single dominant fracture while bypassing the necessary stress redistribution phase required for multi-fracture nucleation. Thus, while fracture initiation is successful, the potential for forming a complex fracture network is significantly reduced under such rapid pressurization.
In Figure 17, test C7, conducted at the same rate of 8.0 ml/min, reinforces the above observations. A total of 2.55 ml was injected over 27 seconds, resulting in a breakdown pressure of 24.01 MPa. Post-breakdown, pressure declined to 21.32 MPa over 7 seconds, then stabilized at 21.69 MPa. As with C5, acoustic emission signals were negligible, indicating insufficient micro-fracturing. Conversely, test C6, performed at a much lower rate of 0.6 ml/min, involved the injection of 2.72 ml over 301 seconds, leading to a breakdown at 21.80 MPa. Despite this extended pressurization time, the post-breakdown pressure dropped to 17.00 MPa and stabilized at 17.80 MPa. Yet, AE monitoring again recorded only limited activity, suggesting that at very low injection rates, pressure increases too gradually to generate widespread stress concentration and fails to initiate sufficient micro-fractures. Together, these tests highlight that both very high and very low injection rates are sub-optimal for complex fracture development, as they either bypass or under-stimulate micro-crack propagation mechanisms.
Figure 18 explores the transitional regime through a series of tests conducted at intermediate injection rates (1.0–1.9 ml/min). These tests showed a gradual increase in injection time prior to breakdown and a corresponding enhancement in AE signals, particularly in terms of counts and hits. Among them, test C10, at 1.8 ml/min, serves as a representative case. Breakdown occurred at 17.4 MPa after 94 seconds of injection (2.67 ml of fluid). The peak pressure lasted for 1 second, declined to 15.12 MPa within 14 seconds, and stabilized at 15.95 MPa. Throughout the injection, AE monitoring recorded consistent hit and count activity, indicating sustained micro-fracturing. However, energy levels remained low, suggesting that while distributed damage occurred, the intensity of individual fracture events was limited. These observations place C10 within a transitional fracturing regime, where fracture complexity begins to emerge but remains sub-optimal in terms of connectivity and aperture.
To further investigate the effectiveness of injection rates near the upper intermediate range, Figure 19 presents tests C11 and C12, both conducted at 2.2 ml/min, a slight increase from the previously tested 2.0 ml/min. In test C11, 11.48 ml of fluid was injected over 319 seconds, resulting in a breakdown pressure of 7.61 MPa. The peak was sustained for 9 seconds, followed by a drop to 7.35 MPa, and a gradual rise to an average of 8.22 MPa. Although the post-breakdown pressure increase was too gradual to trigger another failure, AE activity was high and sustained, with strong signals in hits, counts, and notably in energy levels. These elevated AE responses suggest extensive micro-damage and multiple fracture initiation points, a prerequisite for the development of complex and branched fracture networks. The absence of further breakdown despite the pressure rise implies that thin or partially open fractures created sufficient flow paths to dissipate pressure, thus preventing additional macro-fracture formation.
Also detailed in Figure 19, test C12 showed similar behavior to C11. Conducted under the same rate of 2.2 ml/min, C12 reached a breakdown pressure of 17.44 MPa after a total injection of 16.86 ml over 460 seconds. The peak pressure lasted briefly for 1 second, dropped to 16.00 MPa within 29 seconds, and then stabilized at an average of 16.86 MPa. The AE response was notably active throughout the test, with high energy levels indicating significant micro-fracture development. Despite the short duration of peak pressure, the fracture complexity inferred from AE activity aligns well with the study’s objectives. C12 therefore corroborates the findings of C11, confirming that 2.2 ml/min represents an optimal injection rate for inducing complex fracture networks. This rate allows for sufficient pressurization time to stimulate micro-fractures while avoiding the abruptness of high-rate injections and the under-stimulation seen at low rates. The combination of AE signal intensity, pressure recovery behavior, and fracture response highlights the critical role of injection rate in governing fracture complexity in anisotropic geomaterials.
Figure 20 presents the injection pressure response for test C9, conducted at an intermediate injection rate of 5.0 ml/min—a rate chosen to bridge the gap between the optimal rate (2.2 ml/min) and previously observed high-rate behavior (8.0 ml/min). In this test, hydraulic fracture initiation (breakdown) occurred at 14.86 MPa, following the injection of 2.92 ml of fluid over 41 seconds. The peak pressure was sustained for merely 1 second, after which a rapid pressure drop to 11.11 MPa occurred within 6 seconds. Subsequently, the pressure stabilized at an average of 12.65 MPa. Acoustic emission (AE) data recorded minimal activity during the infiltration phase, suggesting limited microcrack nucleation and poor fracture complexity. This insufficient AE response indicates that the formation of branching or networked fractures was not favored at this rate. The results place 5.0 ml/min firmly within the high injection rate regime, which appears to surpass the optimal threshold for promoting energy-efficient, complex fracture propagation.
To further validate the negative impact of excessively high injection rates on fracture complexity, Test C8 was performed at a very high rate of 20 ml/min, also shown in Figure 20. Breakdown occurred rapidly at 23.54 MPa, with only 2.86 ml of fluid injected over 15 seconds. The system experienced an immediate pressure drop to 20.51 MPa within 2 seconds, followed by stabilization at an average of 18.19 MPa. AE monitoring during this test revealed extremely limited acoustic signals, signifying negligible fracture branching or microcrack coalescence. The abrupt and brief fluid-rock interaction period provided insufficient time for stress redistribution or the activation of multiple failure planes. This further substantiates that extremely high injection rates lead to localized, unstable fracturing that lacks spatial complexity, compromising the effectiveness of hydraulic fracturing in stimulating a productive reservoir.
Figure 21 highlights comparative tests conducted on sandstone (SST13) and bituminous coal (Coal14) to explore the material-dependent fracture behavior under similar injection conditions (2.2 ml/min). In test Ss13, breakdown occurred at a notably high pressure of 30.01 MPa after the injection of 5.41 ml of fluid over 153 seconds. The pressure sharply declined to 22.05 MPa in 9 seconds, rebounded briefly to an average of 20.74 MPa, and eventually approached near-zero pressure. During fluid injection, AE sensors recorded only ‘hits’ with no energy or count data, indicating a lack of distributed microcracking. These observations suggest that the tested sandstone was low-porosity and mechanically strong, consistent with its high Young’s modulus. The sharp pressure decay after peak suggests the sudden creation of a single, dominant planar fracture, rather than the formation of a branched network.
In contrast, test Coal14, also illustrated in Figure 21, exhibited distinctly different behavior. Fracture initiation occurred at a low breakdown pressure of 8.79 MPa after 2.08 ml of fluid was injected over 64 seconds. Post-peak, the pressure dropped swiftly to 5.40 MPa within 9 seconds, then rose slightly to an average of 7.36 MPa, with no further breakdown events. The short infiltration time and low breakdown pressure are characteristic of coal's low tensile strength and low elastic modulus, which reduces its ability to resist deformation and sustain pressure. Unlike sandstone, AE monitoring during Coal14 revealed erratic but high-energy signals, indicative of brittle fracture processes and distributed microcracking common in cleated, anisotropic coal. These results emphasize the critical importance of lithological properties in determining the hydraulic fracture initiation and propagation mechanisms, underlining the need to customize injection strategies to match the mechanical behavior and internal fabric of the rock type.
3.3. Fracture Surface Morphology
In order to quantify the results analysis on fracture surfaces, a 3D scanner, OKIO-H-2000, TENYOUN, was used to measure and characterize the surface morphologies. The Surfer 21 software was then employed to refine the surfaces and calculate the Joint Roughness Coefficient (JRC) number (Tse and Cruden 1979). Therefore, scanned 3D surfaces from C3, C10, C12, and SST13 tested samples are shown in Figure 22, Figure 23, Figure 24 and Figure 25 with their respective JRC numbers.
where Xi is the coordinate of the surface profile parallel to the axial direction, Zi is the height of the fracture surface profile, and N is the total number of data points of each profile. The fracture surface was divided into six groups and the calculated JRC for each surface is the average of this group.
The Joint Roughness Coefficient (JRC) is a quantitative measure of the surface irregularity of a fracture, which is directly linked to the complexity of the fracture network. Higher JRC values typically indicate more tortuous, uneven fracture surfaces, which suggest a higher degree of fracture branching and surface interaction during hydraulic fracturing. In this study, sample C12 recorded the highest average JRC value of 23.89, indicating that it experienced the most complex fracture development among the selected specimens. This aligns with the earlier findings that 2.2 ml/min injection rate—used for C12—produced consistently optimal results, with favorable propagation behavior and sufficient injection duration before breakdown. The high JRC supports the conclusion that moderate injection rates under suitable geological conditions promote complex fracture geometries.
Sample C5, with an average JRC of 17.69, also demonstrated a relatively complex fracture surface, though not to the extent observed in C12. C10 was subjected to an intermediate injection rate within the transitional zone (1.0–1.9 ml/min), which was hypothesized to be near-optimal. The JRC value confirms that while C10 did not achieve the same level of complexity as C12, it still benefited from injection parameters that allowed for sustained pressure buildup and gradual fracture propagation. The moderate roughness seen in C10 suggests that at this rate, the fluid was able to infiltrate natural weaknesses and microfractures in the rock mass, enabling more irregular fracture formation.
On the other end of the spectrum, sample C3, which was tested at a very low injection rate of 0.2 ml/min, had a significantly lower average JRC value of 14.97. This relatively smooth fracture surface indicates that the low injection rate failed to build sufficient pressure for the initiation of multiple fracture tips or significant propagation. The flat and uniform surface morphology associated with this sample supports the earlier conclusion that injection rates below a certain threshold do not provide the energy necessary for complex fracture formation. As such, C3 exemplifies the ineffective fracture behavior that arises when the pressure buildup is too gradual to initiate branching or irregular propagation paths.
Sample SST13, a sandstone specimen, recorded an average JRC of 16.36, which is higher than C3 but still much lower than C12. Despite its longer injection duration (153 seconds), SST13 failed to produce a complex fracture network, primarily due to its low permeability and non-porous matrix. This inhibited fluid infiltration and limited the number of potential initiation points. The moderate JRC value reflects this outcome—while the fracture was not entirely smooth, the complexity was constrained by the rock’s intrinsic properties. The pressure buildup led to a single dominant fracture rather than a branched network, confirming that rock lithology and permeability significantly influence the effectiveness of hydraulic fracturing, even when injection conditions are held constant.
3.4. Discussion
Table 3 below shows results from all the samples, highlighting the notable differences from various injection rates that were applied.
The results of this experimental study confirm that both extremely low and excessively high injection rates are ineffective in promoting the development of complex fracture networks during hydraulic fracturing. Tests conducted at very low rates, specifically below 0.2 ml/min, failed to generate adequate injection pressure to induce tensile failure. For instance, Test C3, conducted at 0.2 ml/min, resulted in flat and planar fracture surfaces, indicating minimal fracture branching or bifurcation. Similarly, an increase to 0.6 ml/min still exhibited suboptimal fracturing behavior, suggesting insufficient pressure buildup to overcome the rock’s tensile strength. Although Test C4 at 2.0 ml/min showed some promise in fracture complexity, the inconsistent result from Test C1, which was also conducted at the same rate, demonstrated the non-repeatability of performance at this level, thereby ruling it out as an optimal rate. These inconsistencies prompted further investigation within the intermediate injection rate range of 1.0–1.9 ml/min, where a progressive improvement in fracture complexity was observed. Notably, Test C10, conducted at 1.8 ml/min, displayed moderately favorable results and was thus selected to represent the transitional zone between ineffective and optimal injection conditions (see Figure 18).
To identify a more consistent injection rate capable of yielding complex fractures, the injection rate was increased to 2.2 ml/min, which was tested in three separate trials. Among these, Tests C11 and C12 both consistently demonstrated enhanced fracture complexity and energy release patterns, supported by Acoustic Emission (AE) data and pressure-time curves. In particular, Figure 19(a) (C11) illustrates a stable and prolonged propagation pressure phase, characterized by a horizontal inflection on the pressure curve—indicative of sustained crack growth and resistance to sudden breakdown. This behavior is typically associated with stable fracture propagation and network development, as opposed to abrupt failure. The consistency of these results confirmed that 2.2 ml/min falls within the optimal injection range. The enhanced fracture geometry at this rate is attributed to the favorable balance between pressure build-up and rock resistance, enabling more uniform energy dissipation and complex fracture nucleation.
To assess the upper boundary of the optimal injection rate range, a test was performed at 5.0 ml/min (Test C9). While the breakdown pressure was successfully reached, the subsequent AE signals and fracture morphology (shown in Figure 12) pointed to limited microcracking activity and low fracture complexity. The short duration between fluid injection and failure suggested that the system lacked sufficient time for distributed microcrack growth, resulting instead in the formation of a dominant, planar fracture. To further verify the adverse effects of high-rate injection, an extreme case was tested at 20 ml/min (Test C8). This trial exhibited an instantaneous pressure drop and minimal AE activity, indicating brittle, uncontrolled fracture propagation with no evidence of branching. The fracture surfaces were similarly flat and indicative of a single propagation front, confirming that excessively high injection rates lead to rapid energy release and suppress the development of intricate fracture systems (refer to Figure 12).
Based on the collected data and fracture characterization across the full injection rate spectrum, the study identified three distinct operational regimes: (i) a low-rate regime (≤0.6 ml/min), which produced stable but planar and simplistic fractures due to insufficient pressure and energy, (ii) an optimal-rate regime (centered around 2.2 ml/min), which promoted gradual pressurization, enhanced AE activity, and complex fracture branching, and (iii) a high-rate regime (≥5.0 ml/min), where rapid pressure surges caused early failure with limited fracture network development. These findings are conceptually illustrated in Figure 26, which delineates the relationship between injection rate and fracture complexity. The figure further emphasizes that successful hydraulic fracturing in low-permeability rock masses is highly sensitive to the control of injection parameters. The identification of these regimes offers critical insight for optimizing fracturing strategies in field operations, particularly when targeting anisotropic and heterogeneous rock formations.
The histograms in Figure 27, Figure 28 and Figure 29 highlight the various corresponding results parameters for respective injection rates in the three material types, with injection rate labelled as Q, and injected fluid volume before initial breakdown as Inj. Vol., period of fluid injection before initial breakdown pressure as t, initial breakdown pressure as Pb, period of peak pressure as Pp, pressure recovery time as Pr and average pressure after recovery (without further breakdown) as Pav. The graphs show that an optimum injection rate will have an extended period of fluid injection accompanied by a consistent AE energy before initial breakdown occurs, which indicates that multiple fracture initiation points are being formed.
Conclusion
This study systematically investigated the influence of fluid injection rate on fracture complexity during hydraulic fracturing in different rock samples, using bituminous coal, sandstone, and concrete specimens with standardized dimensions. Both qualitative observations and quantitative data, including pressure curves, fracture morphology, and acoustic emission responses, were integrated to establish optimal injection conditions for maximizing fracture network development. Considering these, the following conclusions can be drawn:
- The experimental results clearly delineated three injection rate regimes. In the low-rate region (≤ 0.6 ml/min), the fluid injection was insufficient to generate the pressure needed to overcome the tensile strength of the rock matrix, resulting in planar fractures with minimal branching. Tests C3 and C4 exemplified this behavior, with flat fracture surfaces and poor propagation, indicating stable but ineffective fracturing. In contrast, the high-rate region (≥ 5.0 ml/min) led to sudden pressure surges, characterized by instantaneous failure, reduced AE activity, and a lack of fracture complexity. The fractures here were also planar, suggesting that rapid energy release inhibited distributed microcrack growth.
- In the intermediate or optimal injection rate range, particularly at 2.2 ml/min, fractures exhibited significantly higher complexity. All samples in this group show consistent AE patterns and complex fracture networks, except sandstone and coal.
- Based on the fracture surface analysis and pressure evolution data, below 0.2 ml/min, fracture initiation was not achieved; 0.2 ml/min is thus defined as the minimum effective injection rate. 1.0–1.9 ml/min represents a transitional zone with increasing fracture complexity, while at a rate of 2.0, optimal results were observed but lacked repeatable optimization. 5.0 ml/min and 20 ml/min produced simple, planar fractures, demonstrating that high injection rates result in rapid pressure drops and uncontrolled failure.
- Fracture complexity was found to correlate strongly with the shape of the pressure-time curve, particularly the presence of horizontal inflection points and longer stable propagation phases. Water as a fracturing fluid does not permit effective optimization of the injection rate in non-porous, highly impermeable, or low-tensile-strength brittle rock types (due to a shorter elastic region, which will not support a prolonged fluid infiltration time critical for forming multiple fracture initiation points). Nevertheless, it may be applicable in moderately permeable rock formations where fluid infiltration can facilitate fracture complexity.
Generally, the study confirms that fracture complexity is highly sensitive to injection rate, and that optimizing this parameter is essential to achieving desirable fracturing outcomes in anisotropic rocks. The identification of distinct operational regimes, simple fractures at low and high rates, and complex fractures in the optimal range provides valuable guidance for the design of hydraulic fracturing protocols in both laboratory and field-scale applications. This work offers a foundational reference for future research and practical implementation in unconventional reservoir stimulation. Future work should incorporate larger sample sizes, CT-based internal fracture mapping, and refined stress conditions to enhance fracture propagation and network complexity.
CRediT authorship contribution statement
Tresphord Chishimba: Writing – original draft, Methodology, Conceptualization. Weiguo Liang: Supervision, Conceptualization, Ngambua Ngambua Rene: Writing – review & editing, Software, Project administration, Data curation; Irfan Ahmad Butt: Writing – review & editing.
Data availability
Data will be made available on request.
Acknowledgments
This work was supported by the National Natural Science Foundation of China (No. 51874206, No. 52274222), Key Projects of National Joint Fund for Regional Innovation and Development (U22A20167) and the Science and Technology Major Project in Shanxi Province (20201102002), which is gratefully acknowledged.
Declaration of competing interest
The authors declare that they have no known competing financial interests or personal relationships that could have appeared to influence the work reported in this paper.
References
- Ali Abbas, Hasan, Mortada Abbas Hashem, Muhammad Adam Hussein, and Miqdad Ahmed Nawaf. 2024. 'Impact of recycled polypropylene fibers on the density and strength of unreinforced concrete', Journal of Applied Engineering Design & Simulation (JAEDS), 4: 46–55. [CrossRef]
- Bear, Jacob. 2013. Dynamics of fluids in porous media (Courier Corporation).
- Bieniawski, ZT, and MJ Bernede. 1979. 'International Society for Rock Mechanics Suggested methods for determining the uniaxial compressive strength and deformability of rock materials: Part 1. Suggested method for determination of the uniaxial compressive strength of rock materials', Int. J. Rock Mech. Min. Sci, 16: 137. [CrossRef]
- Brady, Barry HG, and Edwin T Brown. 2006. Rock mechanics: for underground mining (Springer science & business media).
- Chen, Houze, Guangqing Zhang, Lutong Cao, and Lu Zhang. 2023. "Study on the Influence of Injection Rate on Hydraulic Fractures Crossing Natural Fractures." In ARMA US Rock Mechanics/Geomechanics Symposium, ARMA–2023–0168. ARMA.
- Dehghan, Ali Naghi. 2020. 'An experimental investigation into the influence of pre-existing natural fracture on the behavior and length of propagating hydraulic fracture', Engineering Fracture Mechanics, 240: 107330. [CrossRef]
- Eshiet, Kenneth Imo-Imo, and Yong Sheng. 2017. 'An overview of principles and designs of hydraulic fracturing experiments and an inquiry into the influence of rock permeability and strength on failure mode', Advances in Natural Gas Emerging Technologies. https://doi.10.5772/intechopen.69732.
- Griffith, Alan Arnold. 1921. 'VI. The phenomena of rupture and flow in solids', Philosophical transactions of the royal society of london. Series A, containing papers of a mathematical or physical character, 221: 163–98. [CrossRef]
- Guanhua, Ni, Dong Kai, Li Shang, and Sun Qian. 2019. 'Gas desorption characteristics effected by the pulsating hydraulic fracturing in coal', Fuel, 236: 190–200. [CrossRef]
- Heinze, Thomas, Boris Galvan, and Stephen Andrew Miller. 2015. 'Modeling porous rock fracturing induced by fluid injection', International Journal of Rock Mechanics and Mining Sciences, 77: 133–41. [CrossRef]
- Hubbert, M King, and David G Willis. 1957. 'Mechanics of hydraulic fracturing', Transactions of the AIME, 210: 153–68.
- Irwin, George R. 1957. 'Analysis of stresses and strains near the end of a crack traversing a plate'. [CrossRef]
- Ishida, Tsuyoshi, Qu Chen, Yoshiaki Mizuta, and Jean-Claude Roegiers. 2004. 'Influence of fluid viscosity on the hydraulic fracturing mechanism', J. Energy Resour. Technol., 126: 190–200. [CrossRef]
- Ji, Yinlin, Li Zhuang, Wei Wu, Hannes Hofmann, Arno Zang, and Günter Zimmermann. 2021. 'Cyclic water injection potentially mitigates seismic risks by promoting slow and stable slip of a natural fracture in granite', Rock Mechanics and Rock Engineering: 1–17. [CrossRef]
- Kolawole, Oladoyin, and Ion Ispas. 2020. 'Interaction between hydraulic fractures and natural fractures: current status and prospective directions', Journal of Petroleum Exploration and Production Technology, 10: 1613–34. [CrossRef]
- Kong, Lie, Pathegama Gamage Ranjith, and Bing Qiuyi Li. 2021. 'Fluid-driven micro-cracking behaviour of crystalline rock using a coupled hydro-grain-based discrete element method', International Journal of Rock Mechanics and Mining Sciences, 144: 104766. [CrossRef]
- Kresse, Olga, Xiaowei Weng, Dimitry Chuprakov, Romain Prioul, and Charles Cohen. 2013. "Effect of flow rate and viscosity on complex fracture development in UFM model." In ISRM International Conference for Effective and Sustainable Hydraulic Fracturing, ISRM–ICHF–2013–027. ISRM.
- Li, Wei. 2021. "Analysis of the influence of water-cement ratio on concrete strength." In E3S Web of Conferences, 01016. EDP Sciences.
- Ma, Yulin, Ding Wang, and Yongxiang Zheng. 2023. 'Influence of the bedding plane on the propagation of multiple hydraulic fractures', Frontiers in Earth Science, 10: 1077652. [CrossRef]
- Mwakipunda, Grant Charles, Yuting Wang, Melckzedeck Michael Mgimba, Mbega Ramadhani Ngata, Jeremiah Alhassan, Christopher N Mkono, and Long Yu. 2023. 'Recent advances in carbon dioxide sequestration in deep unmineable coal seams using CO2-ECBM technology: experimental studies, simulation, and field applications', Energy & Fuels, 37: 17161–86. [CrossRef]
- Neville, Adam M. 1995. Properties of concrete (Longman London).
- Pawar, Yogesh, and Shrikant Kate. 2020. 'Curing of concrete: A review', Int. Res. J. Eng. Technol, 7: 1820–24. [CrossRef]
- Rafi, SK Mohammad, B Ambalal, B Krishna Rao, and Mohd Abdul Baseer. 2014. 'Analytical study on special concretes with M20 & M25 grades for construction', International Journal of Current Engineering and Technology, 2: 338–43. [CrossRef]
- Roylance, David. 2001. 'Introduction to fracture mechanics'.
- Scoffin, Katriona. 2013. 'Viscometers: The Science of Measuring Fluid Flow', AMERICAN LABORATORY, 45: 29–31.
- Singh, Shamsher Bahadur, Pankaj Munjal, and Nikesh Thammishetti. 2015. 'Role of water/cement ratio on strength development of cement mortar', Journal of Building Engineering, 4: 94–100. [CrossRef]
- Speight, James G. 2012. The chemistry and technology of coal (CRC press).
- Tan, Kefeng, and Odd E Gjorv. 1996. 'Performance of concrete under different curing conditions', Cement and Concrete Research, 26: 355–61. [CrossRef]
- Tse, R, and DM Cruden. 1979. "Estimating joint roughness coefficients." In International journal of rock mechanics and mining sciences & geomechanics abstracts, 303–07. Elsevier. [CrossRef]
- West, Amanda, Jia Wei, Alfonso Cruz, Farhina Haque, Chanyeop Park, Zhiyang Jin, and Lukas Graber. 2021. "Viscosity measurement of gaseous and supercritical fluids as a dielectric medium." In 2021 IEEE Conference on Electrical Insulation and Dielectric Phenomena (CEIDP), 635–38. IEEE.
- Wu, Kangqian, Gokulram Paranjothi, Jana B Milford, and Frank Kreith. 2016. 'Transition to sustainability with natural gas from fracking', Sustainable Energy Technologies and Assessments, 14: 26–34. [CrossRef]
- Xi, Xun, Zoe K Shipton, Jackie E Kendrick, Andrew Fraser-Harris, Julien Mouli-Castillo, Katriona Edlmann, Christopher I McDermott, and Shangtong Yang. 2022. 'Mixed-mode fracture modelling of the near-wellbore interaction between hydraulic fracture and natural fracture', Rock Mechanics and Rock Engineering, 55: 5433–52. [CrossRef]
- Xiu, Zhanguo, Shuhong Wang, Yingchun Ji, Feili Wang, Fengyu Ren, and Van-Tuan Nguyen. 2021. 'Loading rate effect on the uniaxial compressive strength (UCS) behavior of cemented paste backfill (CPB)', Construction and building materials, 271: 121526. [CrossRef]
- Yaws, Carl L. 2014. Transport properties of chemicals and hydrocarbons (William Andrew).
- Yu, Hao, WenLong Xu, Bo Li, HanWei Huang, Marembo Micheal, Quan Wang, MengCheng Huang, SiWei Meng, He Liu, and HengAn Wu. 2023. 'Hydraulic fracturing and enhanced recovery in shale reservoirs: theoretical analysis to engineering applications', Energy & Fuels, 37: 9956–97. [CrossRef]
- Zeng, Xiaguang, and Yujie Wei. 2017. 'Crack deflection in brittle media with heterogeneous interfaces and its application in shale fracking', Journal of the Mechanics and Physics of Solids, 101: 235–49. [CrossRef]
- Zhang, Bo, Xinyi Cui, Linjun Wang, and Xiaodi Fu. 2022. 'Rock fracture response exposed to hydraulic fracturing: Insight into the effect of injection rate on aperture pattern', Advances in Materials Science and Engineering, 2022: 9431143. [CrossRef]
- Zhang, Xin, Yuqi Zhang, and Bingxiang Huang. 2021. 'Investigation of the Fracturing Effect Induced by the Disturbing Stress of Hydrofracturing Using the Bonded-Particle Model', Geofluids, 2021: 9988748. [CrossRef]
- Zheng, Yongxiang, Jianjun Liu, and Bohu Zhang. 2019. 'An investigation into the effects of weak interfaces on fracture height containment in hydraulic fracturing', Energies, 12: 3245. [CrossRef]
- Zheng, Yongxiang, Haiyang Wei, Ao Zhang, and Qinghe Niu. 2025. 'Exploring the influence of fluid viscosity on the hydraulic fracture propagation in composite coal seams', Engineering Fracture Mechanics: 111203. [CrossRef]
- Zhou, Xuejun, and Thomas J Burbey. 2014. 'Fluid effect on hydraulic fracture propagation behavior: a comparison between water and supercritical CO 2-like fluid', Geofluids, 14: 174–88. [CrossRef]
- Zoback, Mark D, and Arjun H Kohli. 2019. Unconventional reservoir geomechanics (Cambridge University Press).
Figure 1.
Concrete preparation (a) size 30 mesh (b) sieved sand (c) electronic weighing scale.
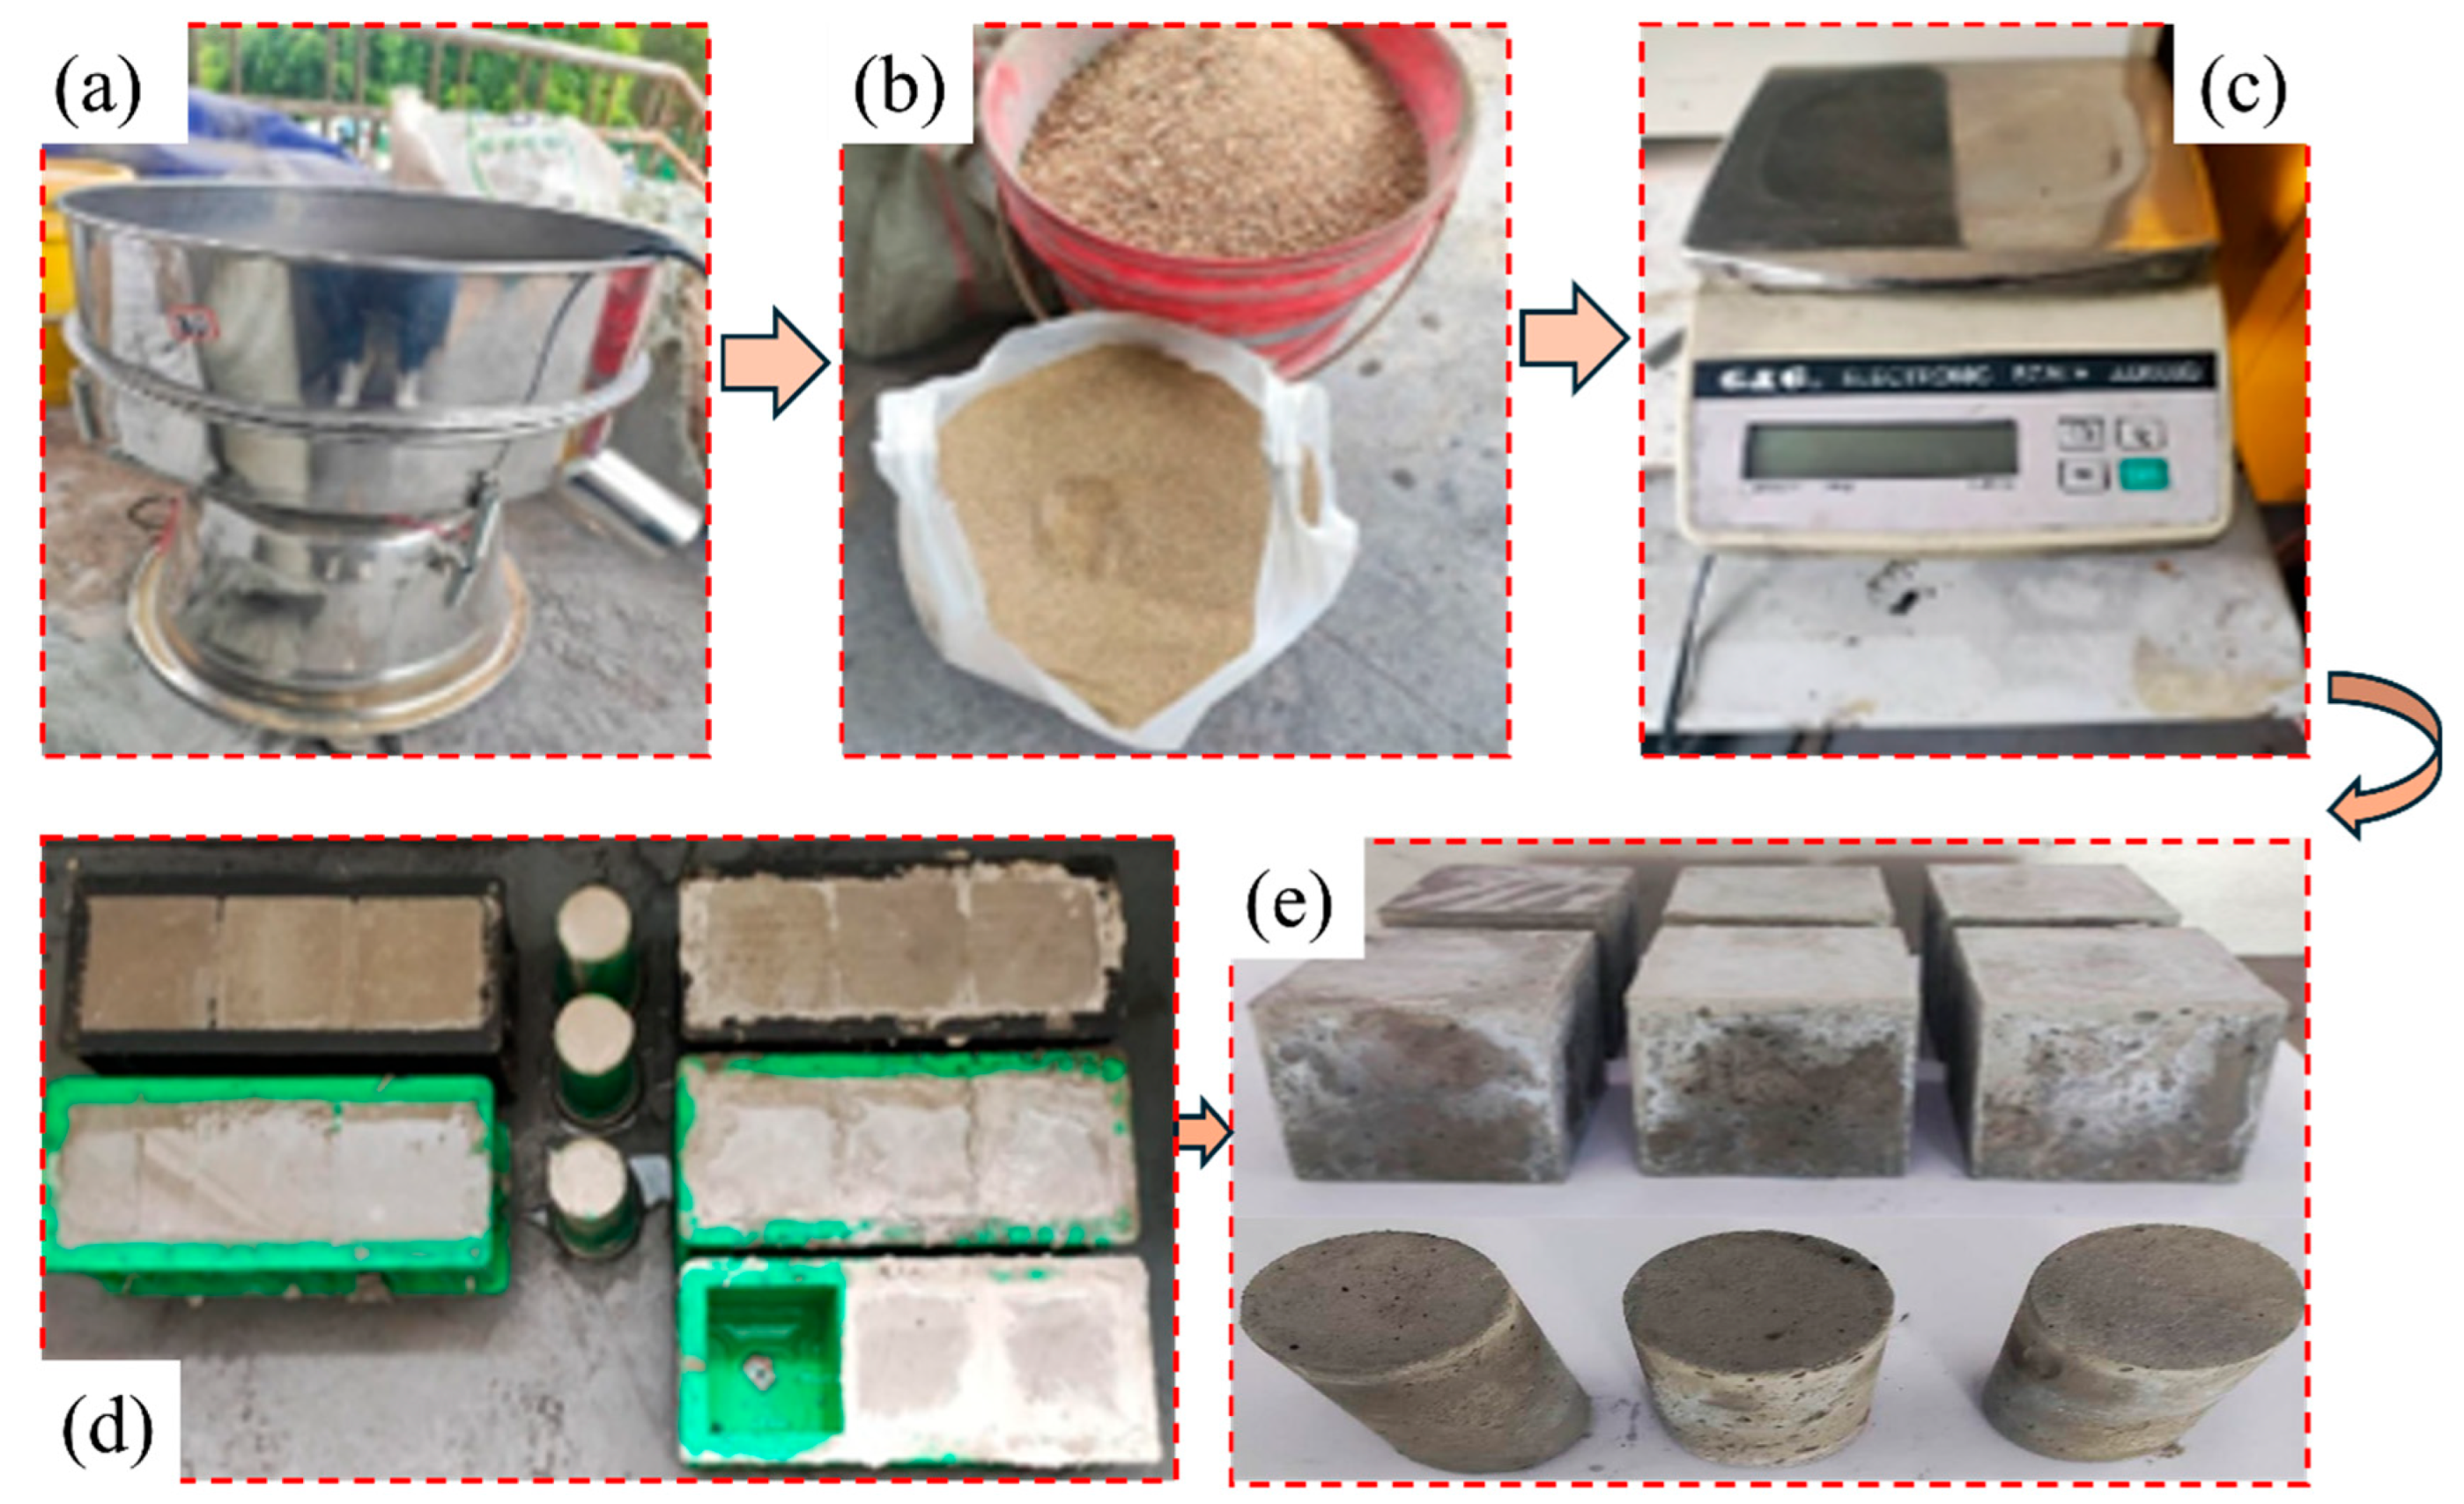
Figure 2.
Concrete UCS test results from two samples.
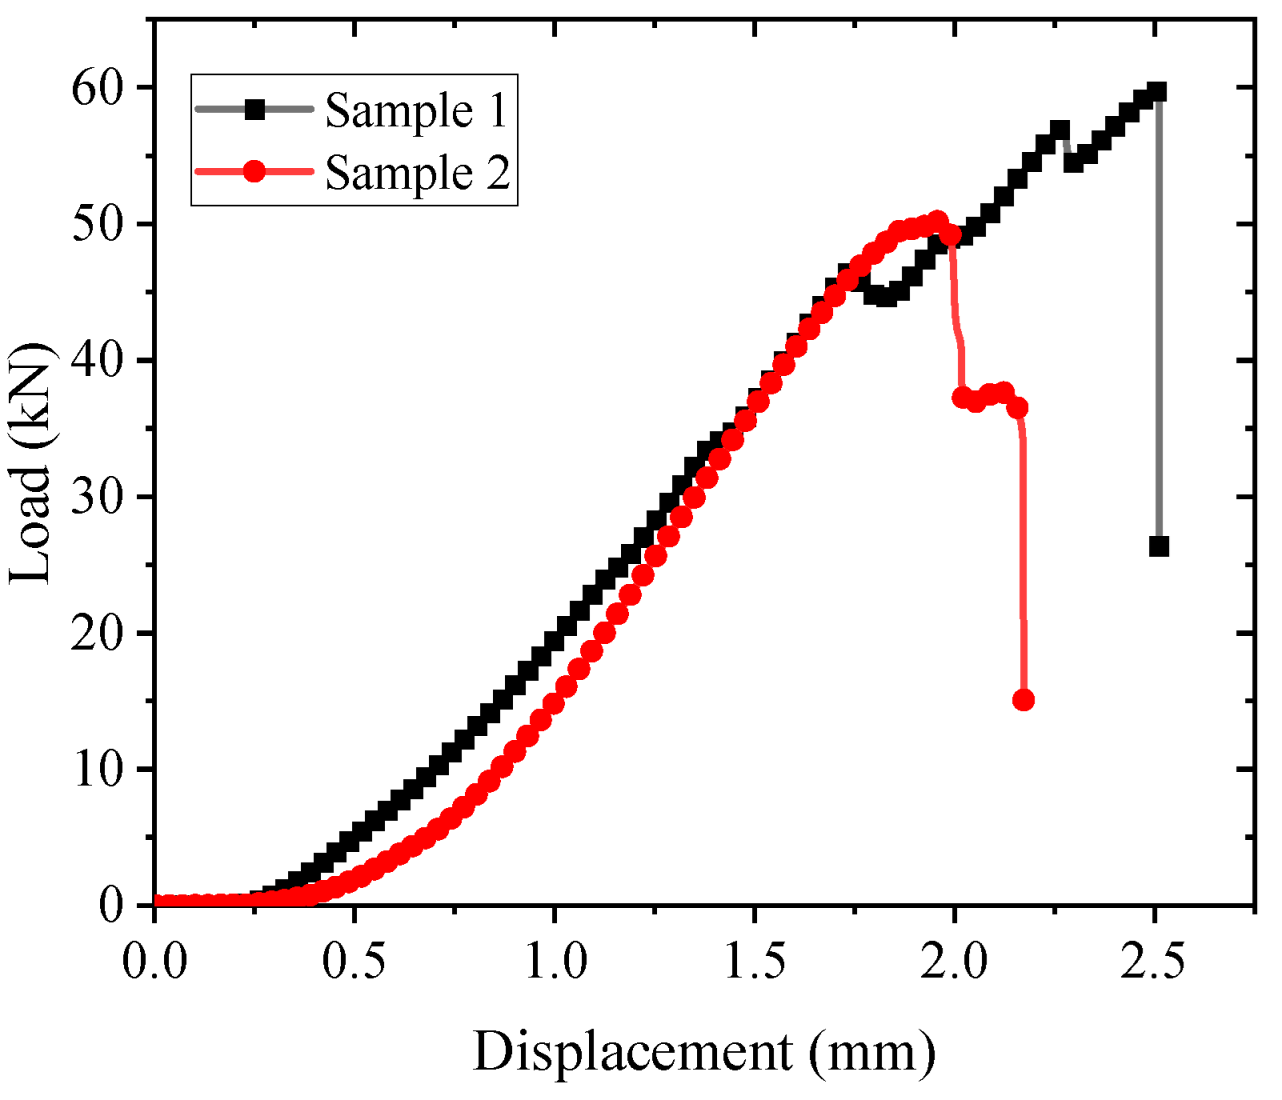
Figure 3.
Natural rock samples (a) 100mm3 coal samples and (b) 100mm3 sandstone samples.
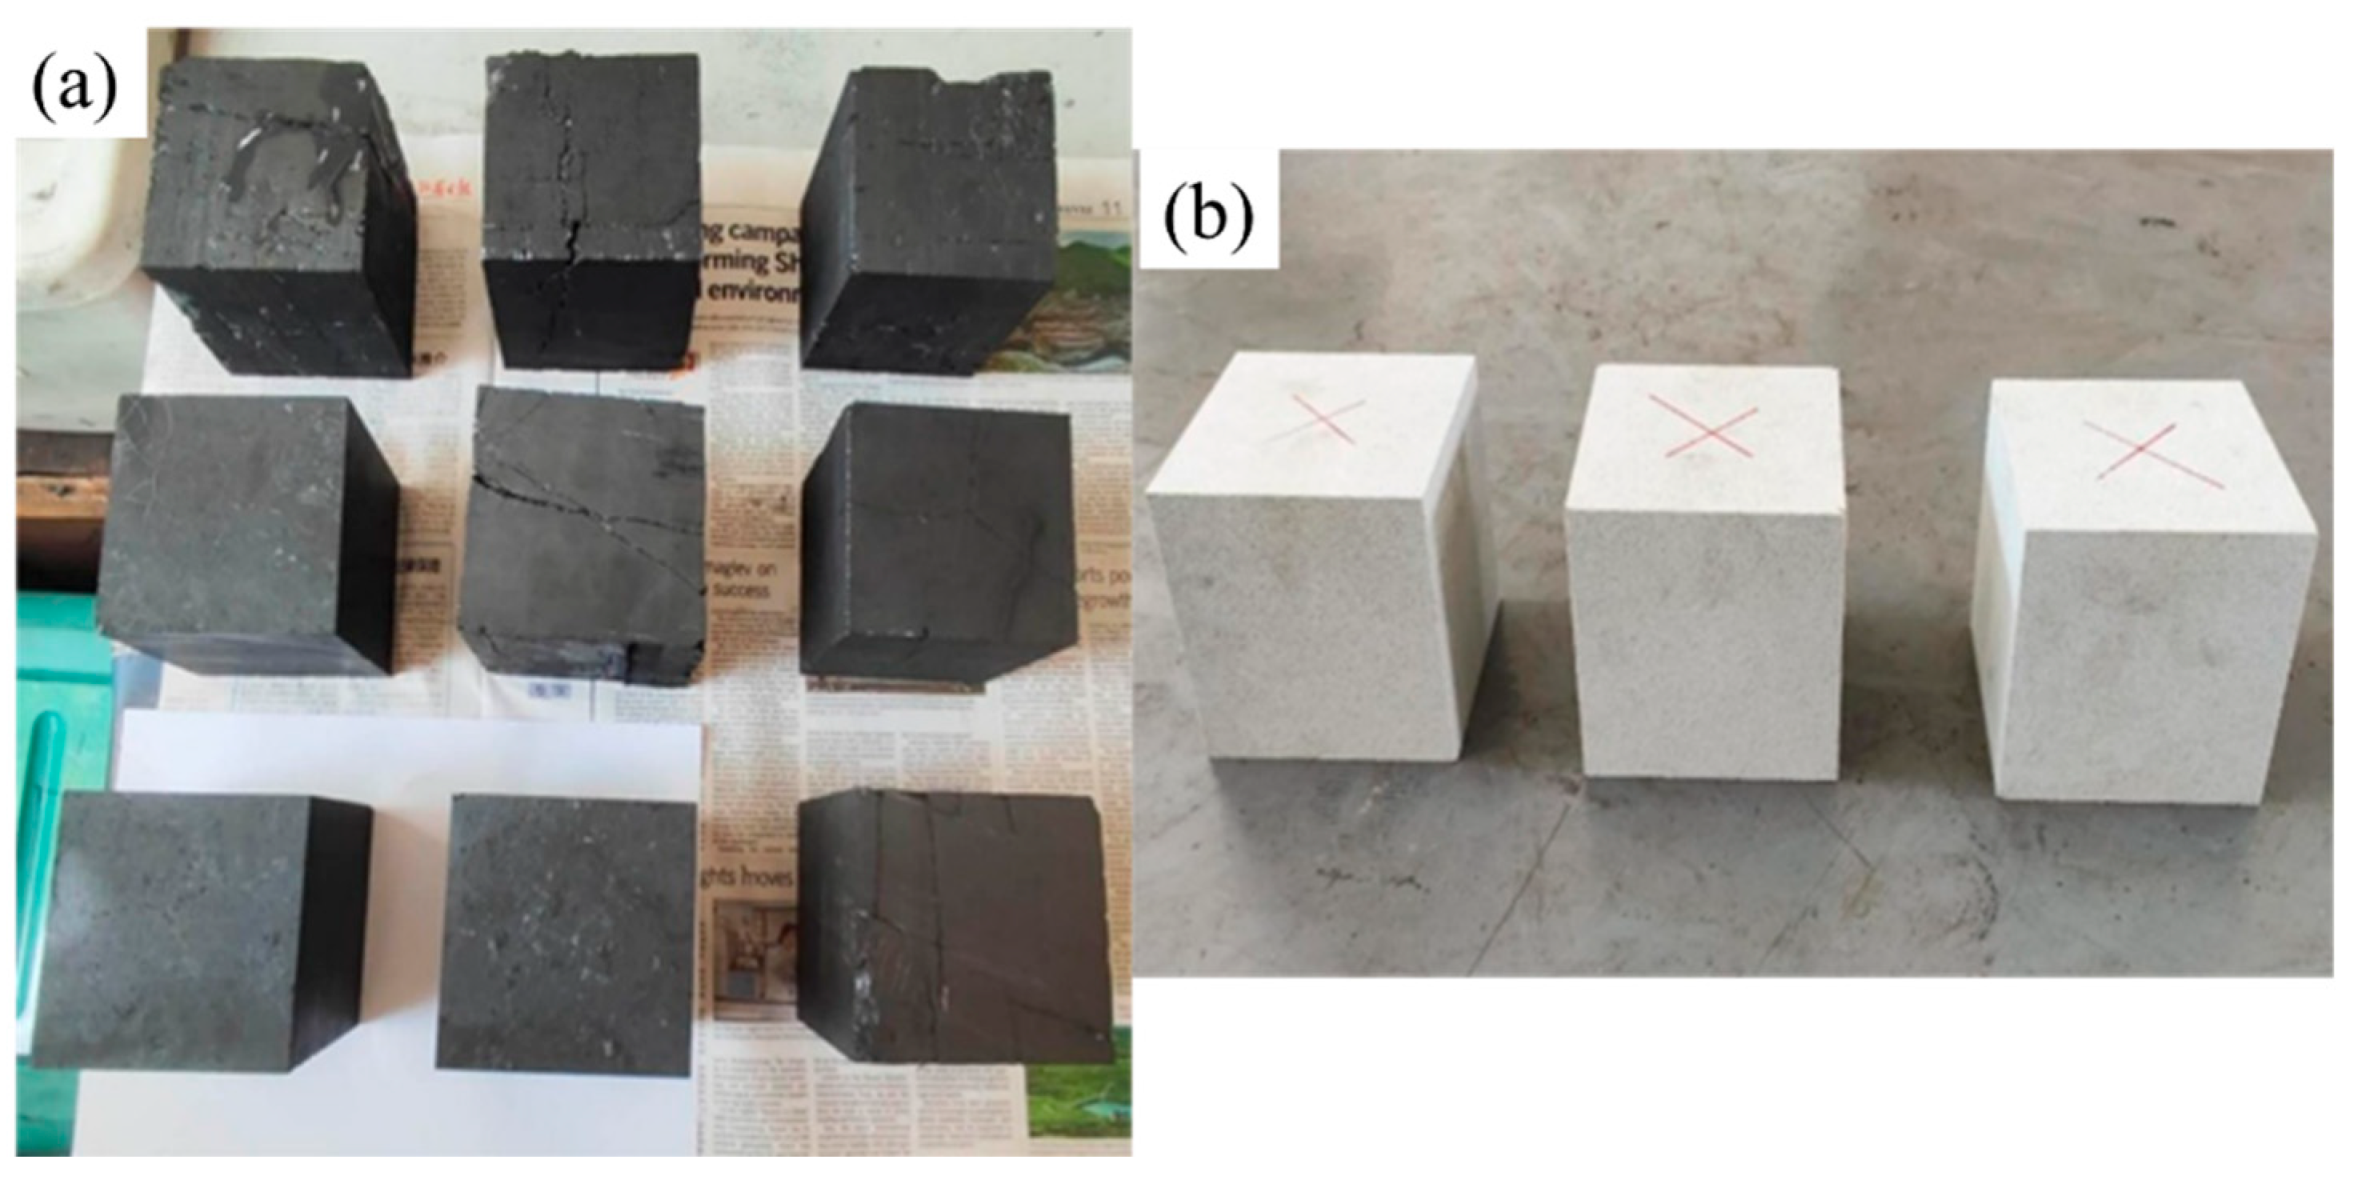
Figure 4.
prepared samples (a)sample design, (b) concrete, (c) sandstone, (d) coal.
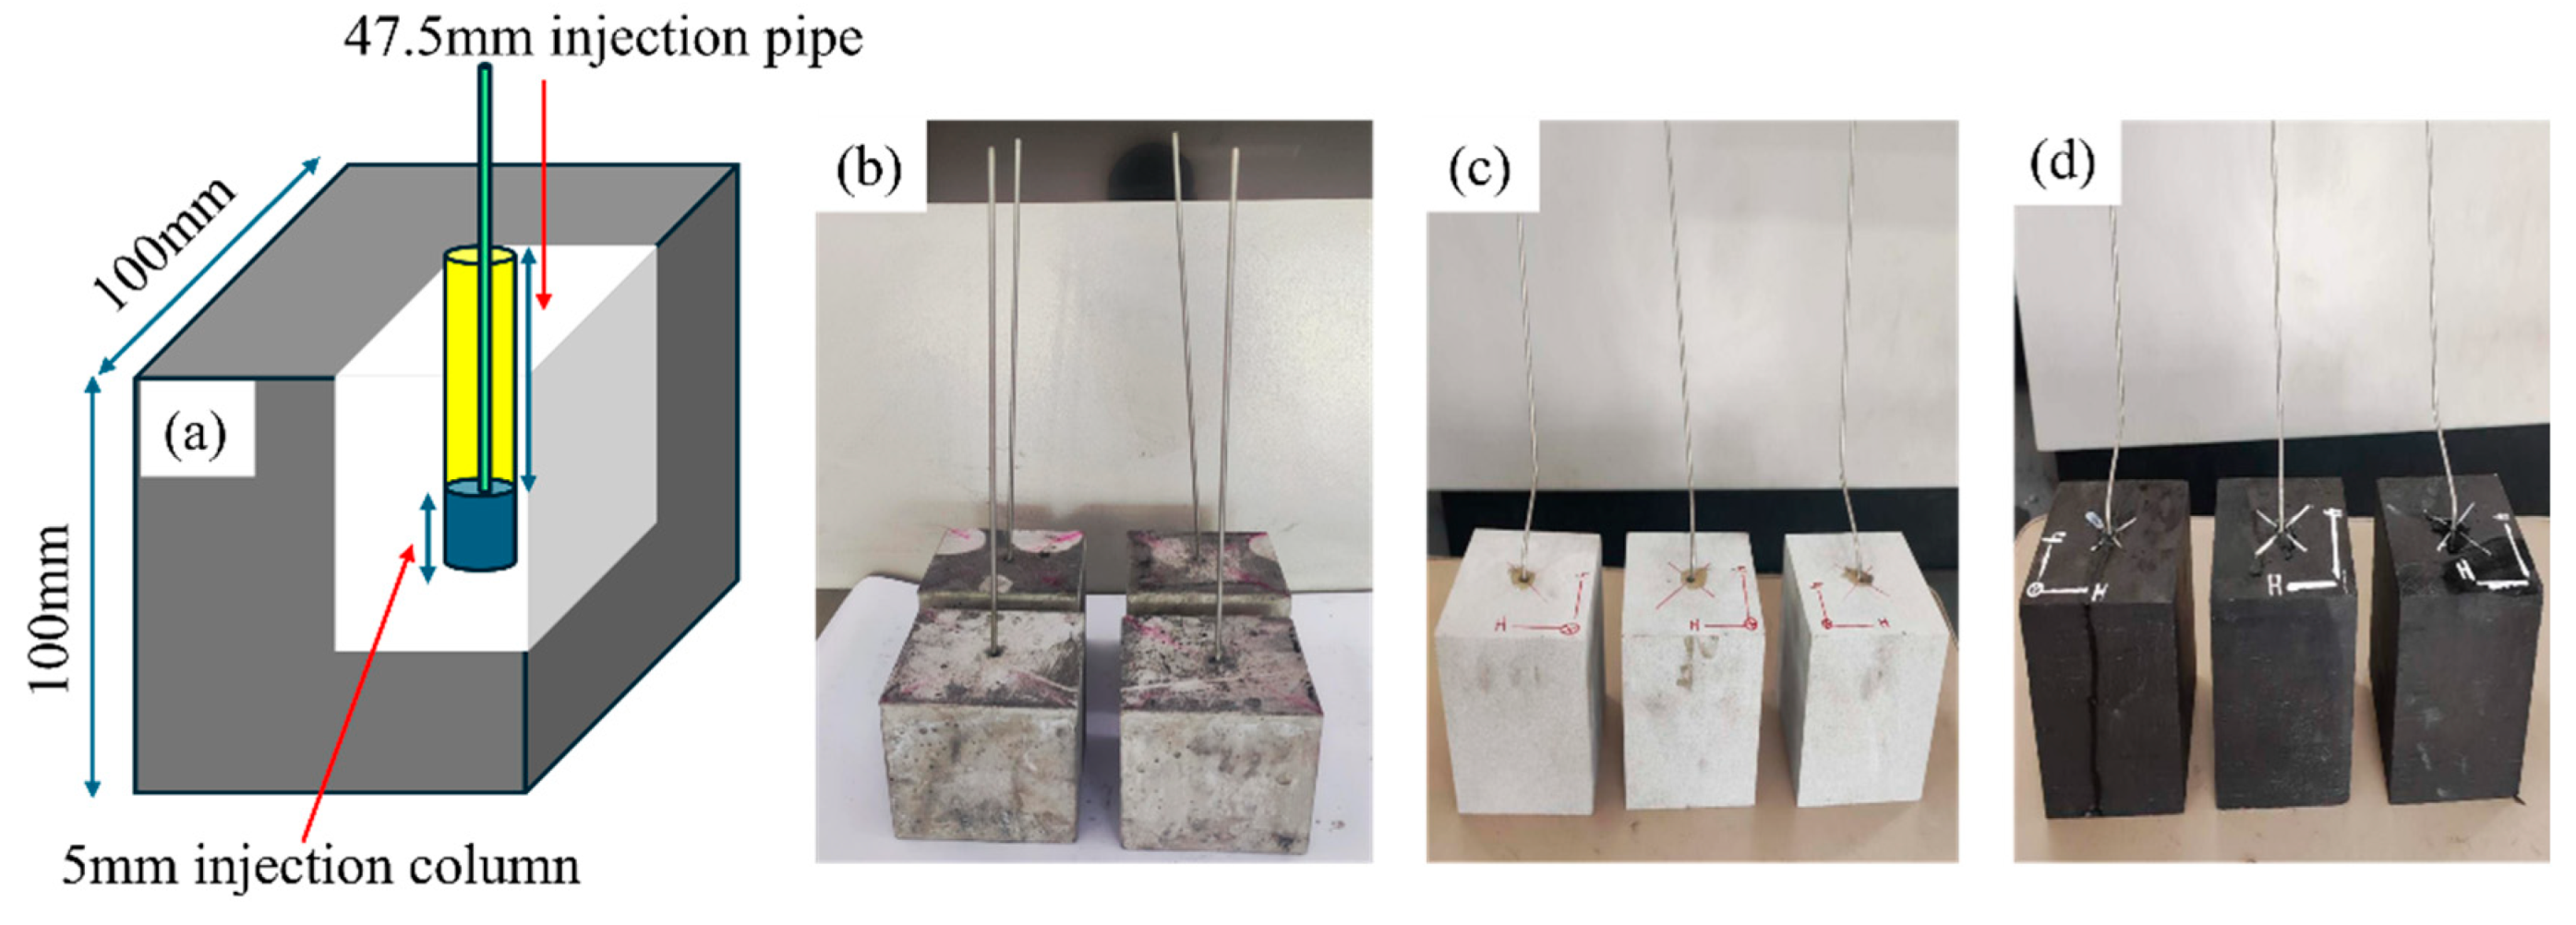
Figure 5.
Main equipment of the hydraulic fracturing test.
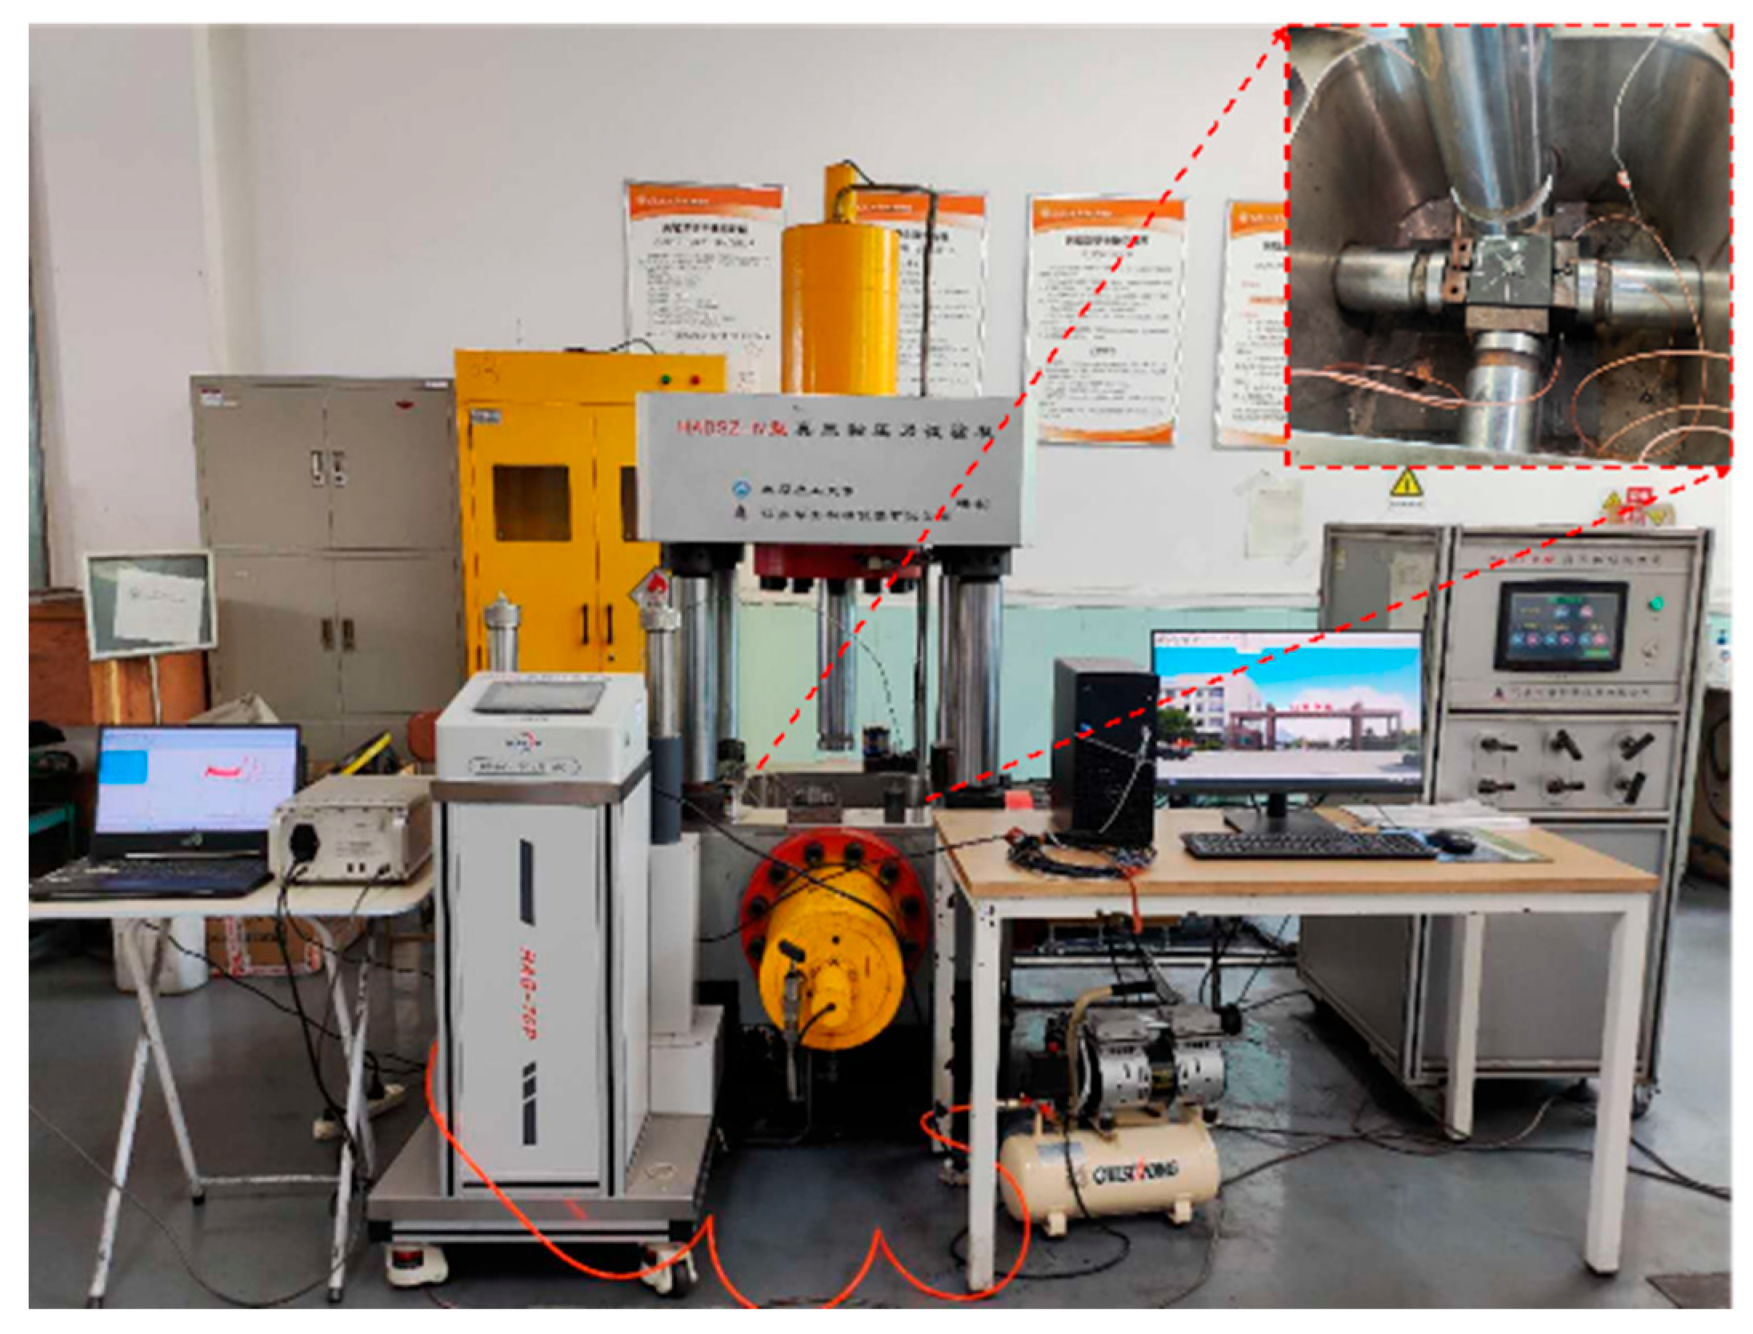
Figure 6.
Schematic diagram of the hydraulic fracturing test.
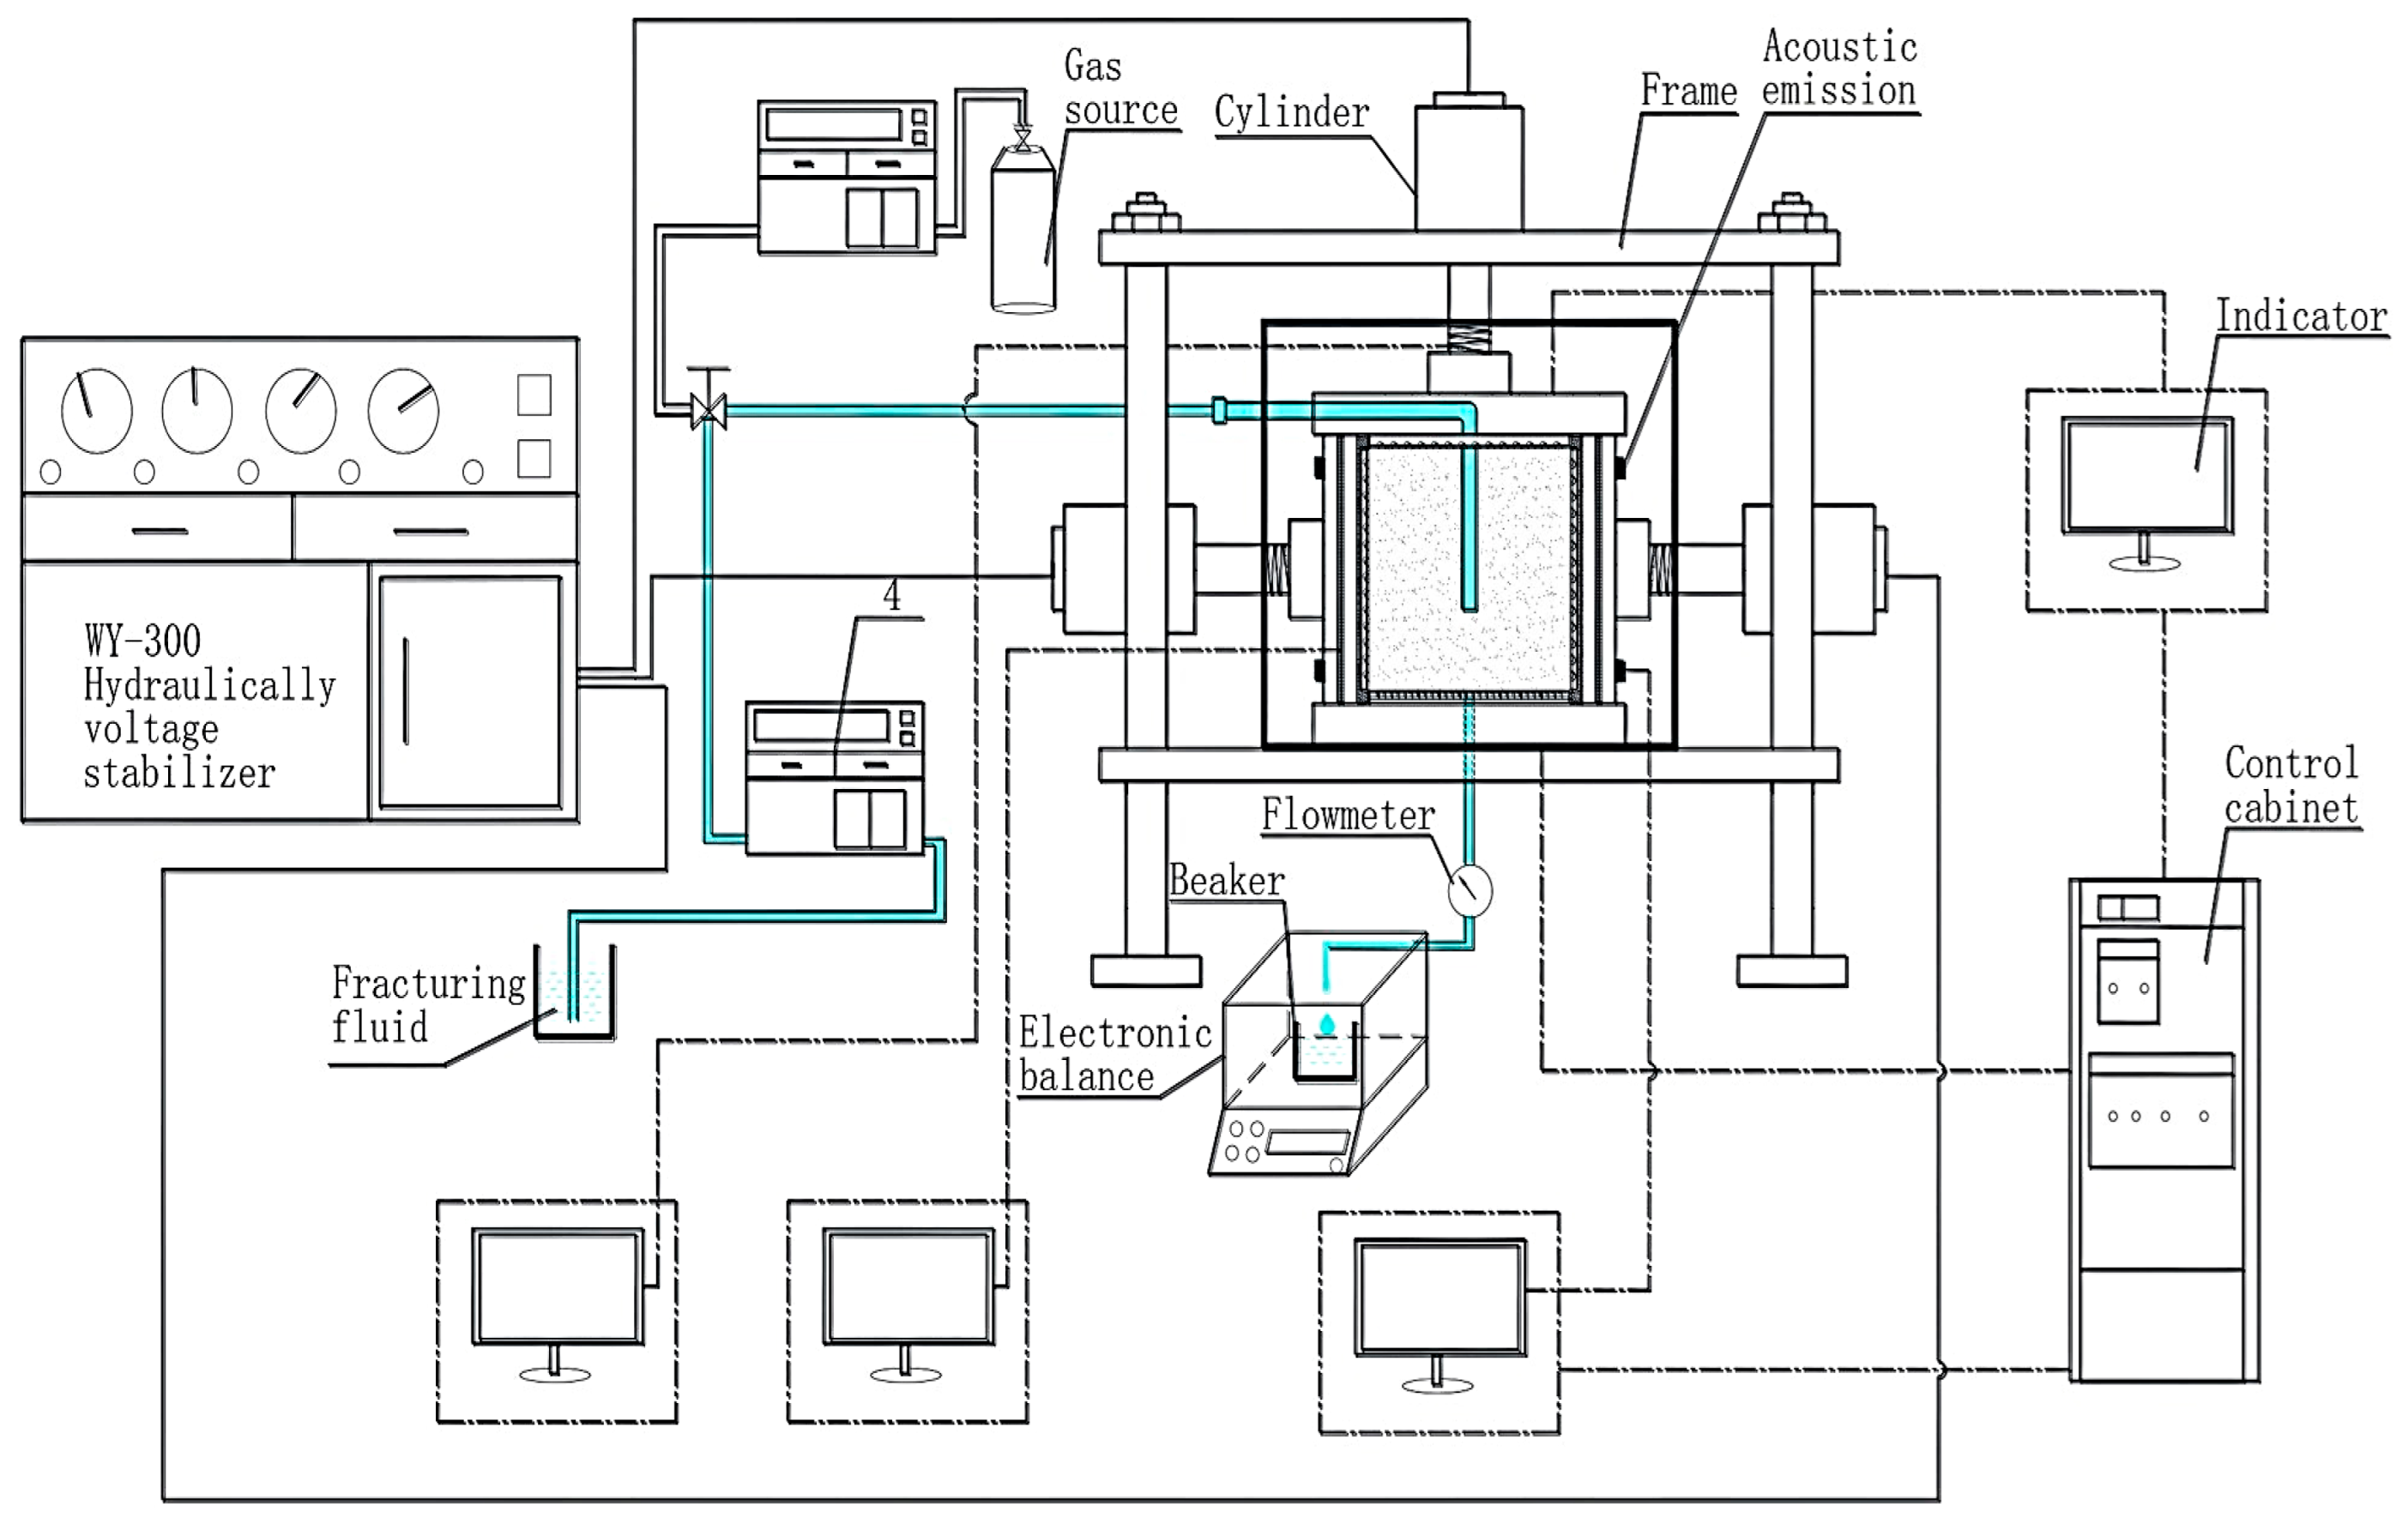
Figure 7.
Tested samples C1 (a) HF direction (b) HF development (c) fracture surface; C2 (a) HF direction (b) HF development (c) HF surface; C3 (a) HF direction (b) HF development (c) HF surface.
Figure 7.
Tested samples C1 (a) HF direction (b) HF development (c) fracture surface; C2 (a) HF direction (b) HF development (c) HF surface; C3 (a) HF direction (b) HF development (c) HF surface.
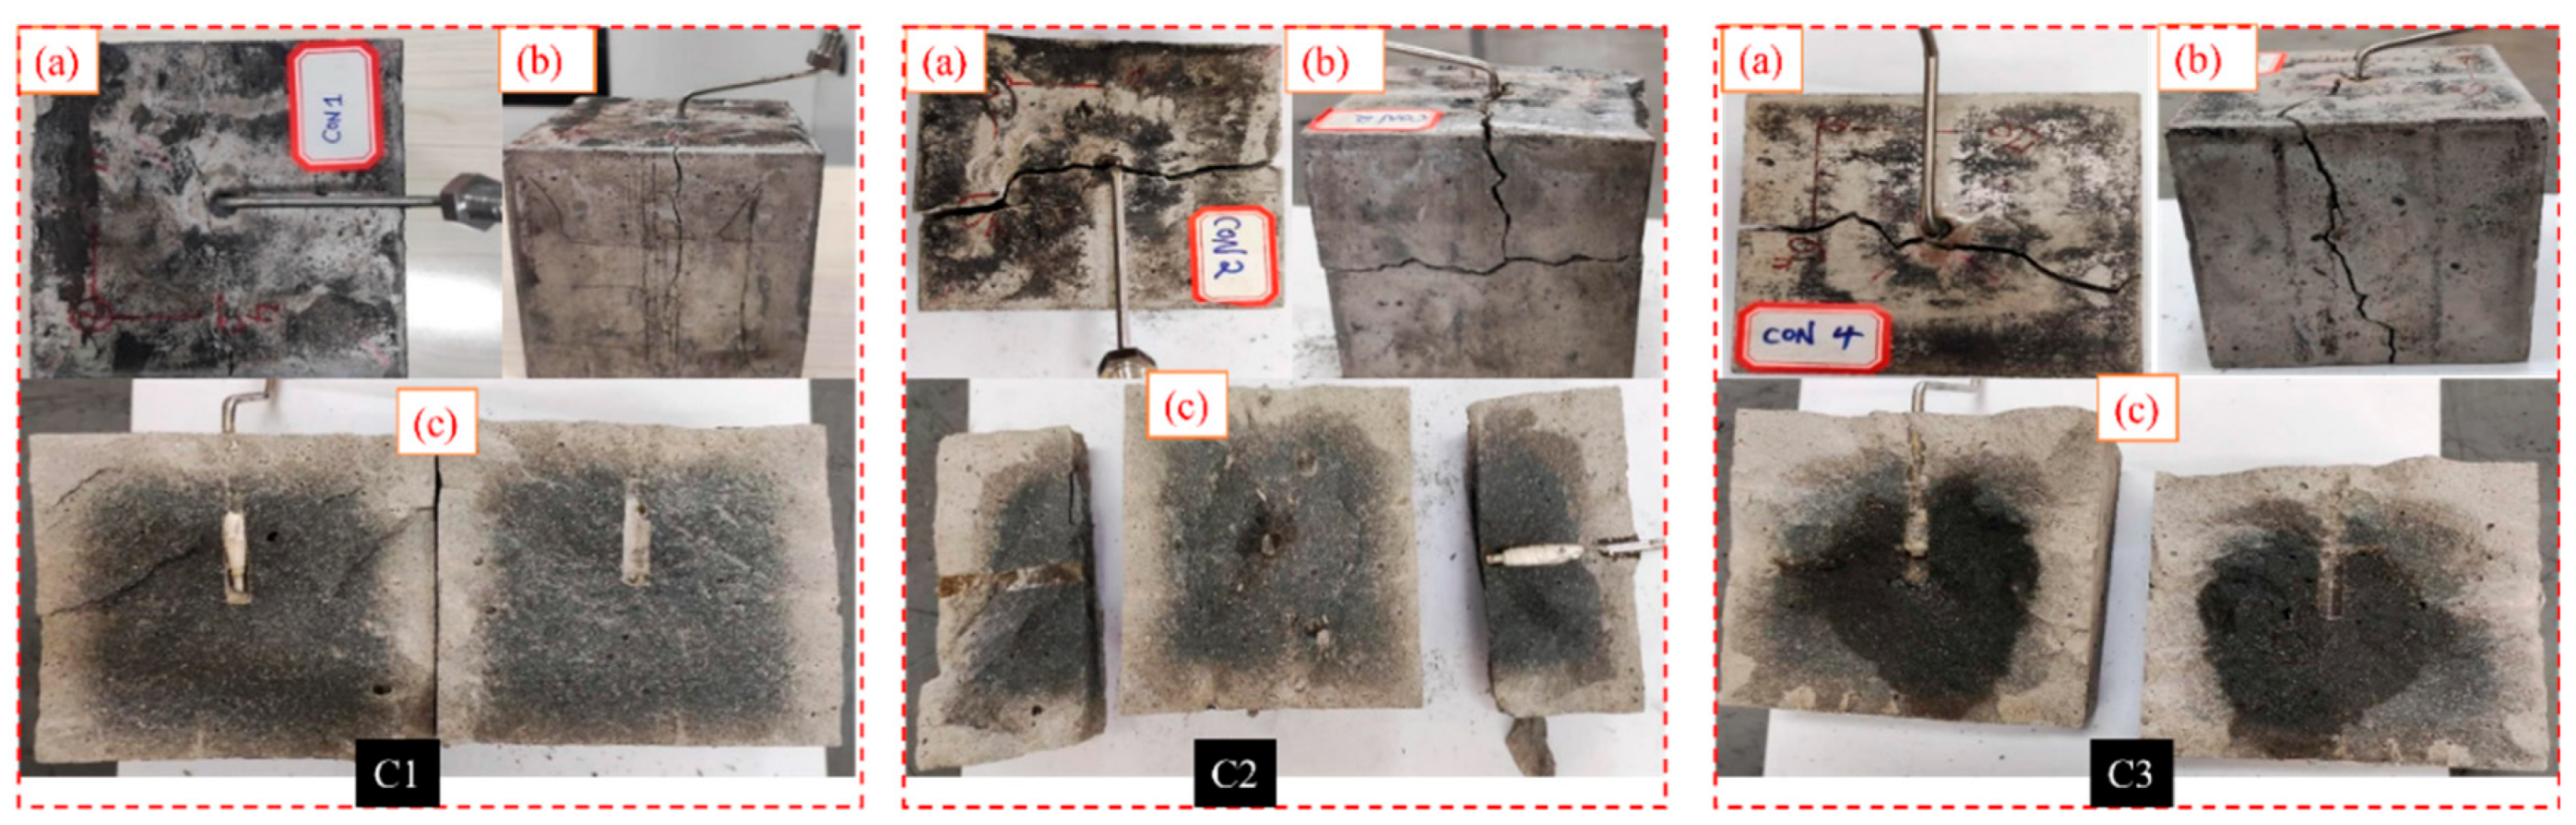
Figure 8.
Tested samples C4 (a) HF direction (b) HF development (c) fracture surface; C5 (a) HF direction (b) HF development (c) fracture surface.
Figure 8.
Tested samples C4 (a) HF direction (b) HF development (c) fracture surface; C5 (a) HF direction (b) HF development (c) fracture surface.
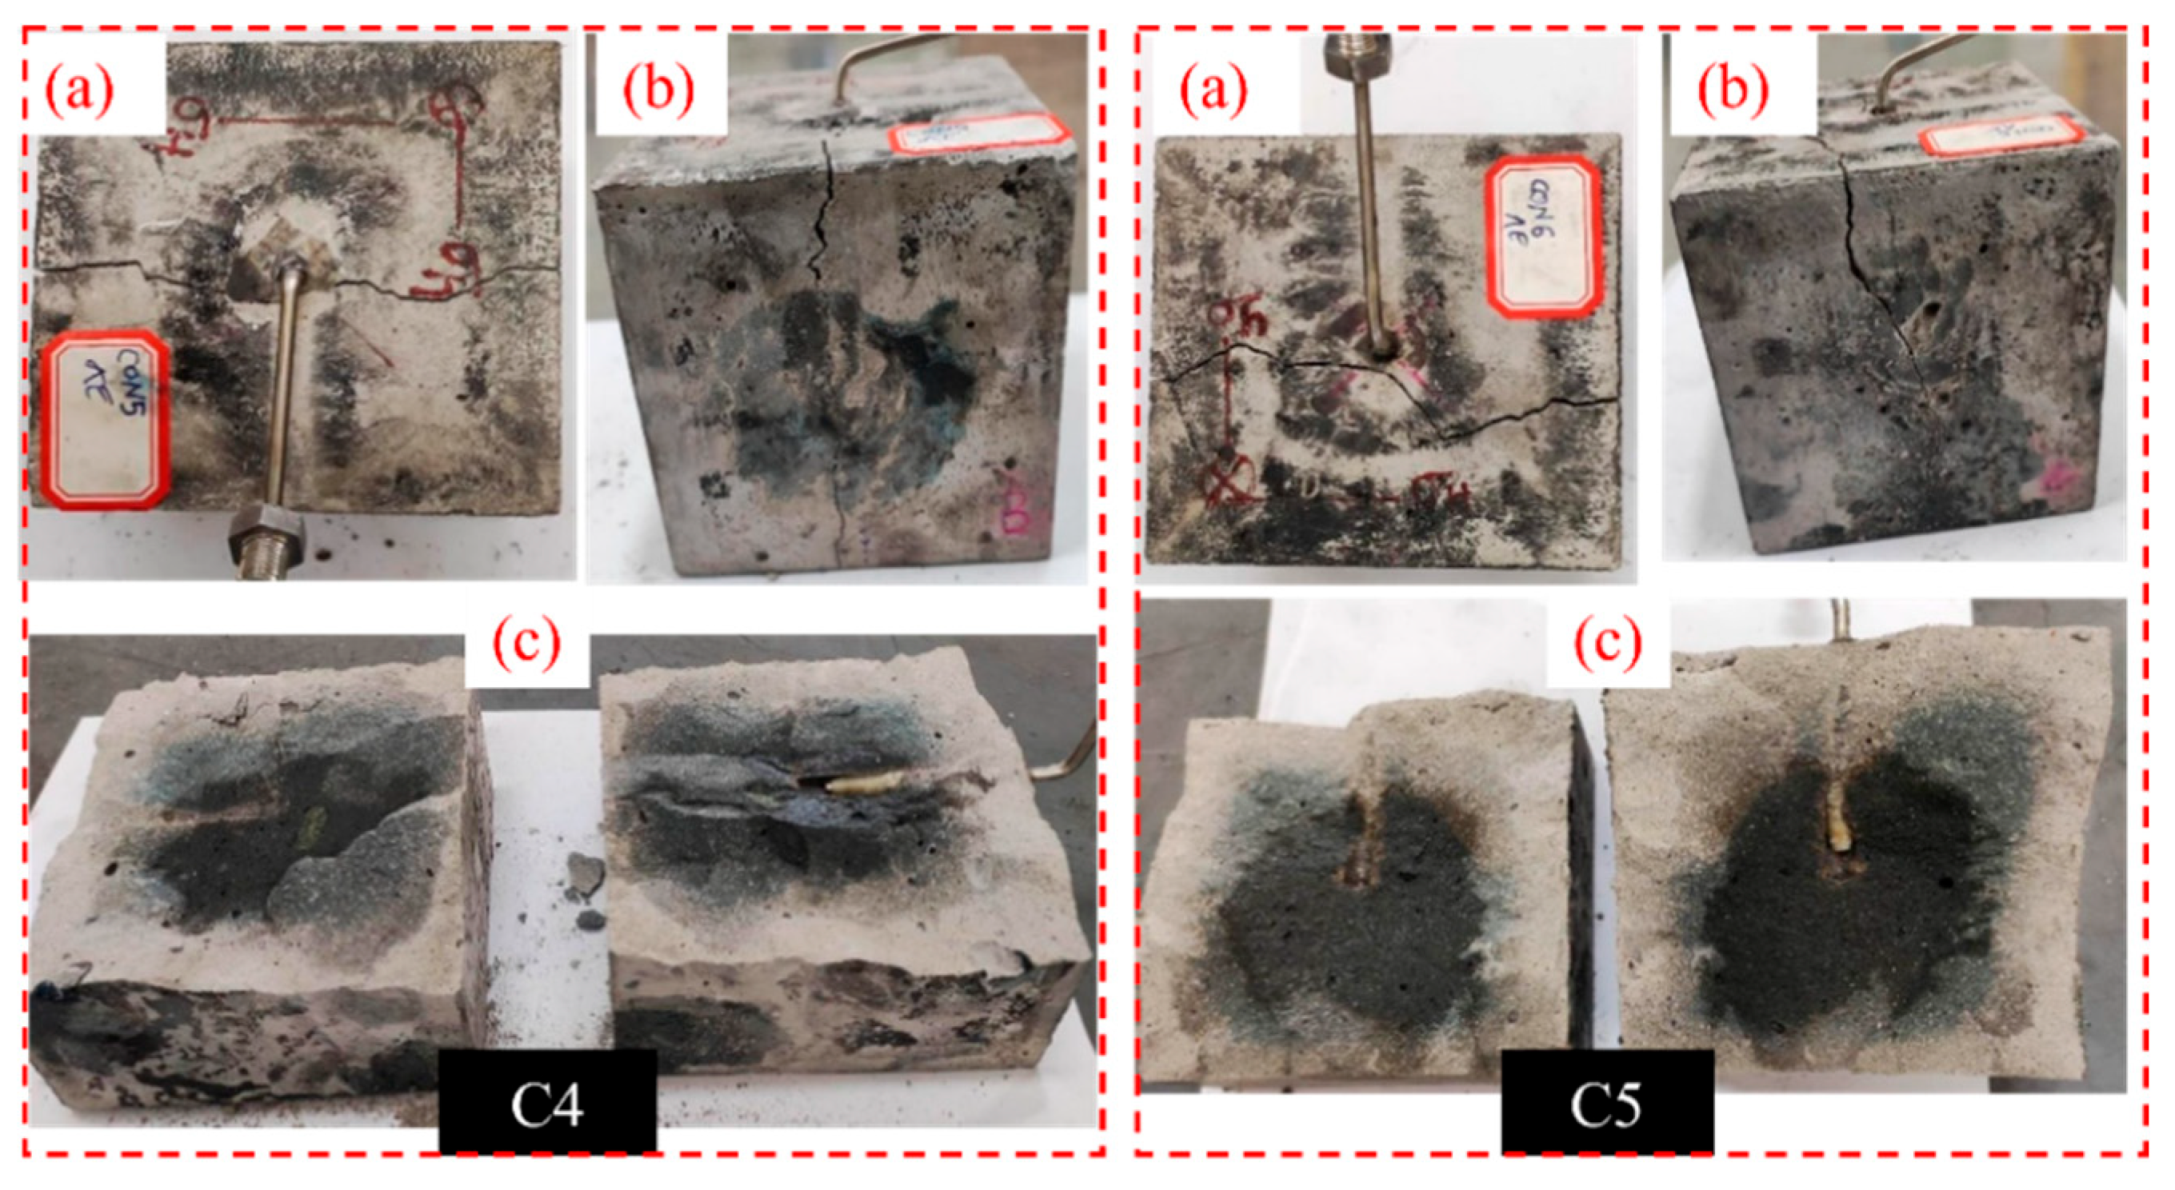
Figure 9.
Tested samples C7 (a) HF direction (b) HF development (c) fracture surface; C6 (a) HF direction (b) HF development (c) fracture surface.
Figure 9.
Tested samples C7 (a) HF direction (b) HF development (c) fracture surface; C6 (a) HF direction (b) HF development (c) fracture surface.
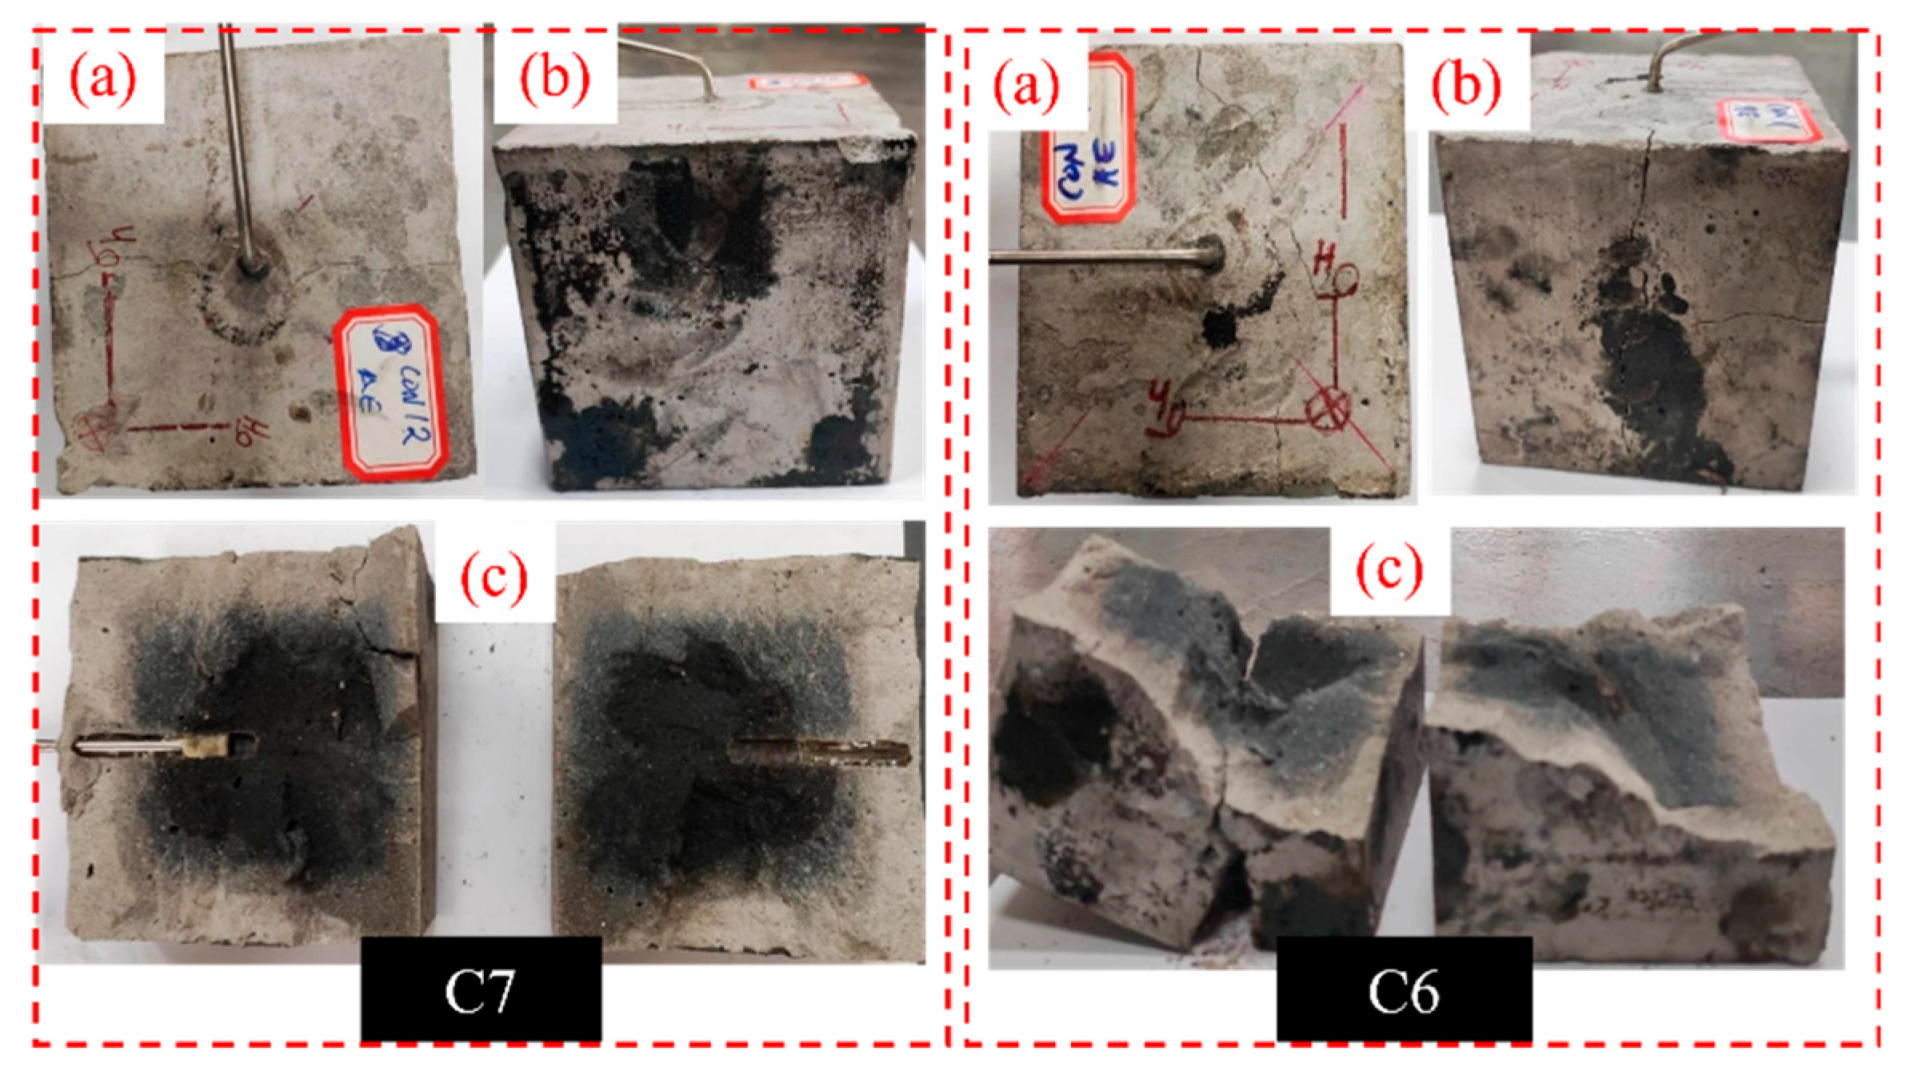
Figure 15.
Pressure-time graph (a) C1, (b) C2 and (c) C3.
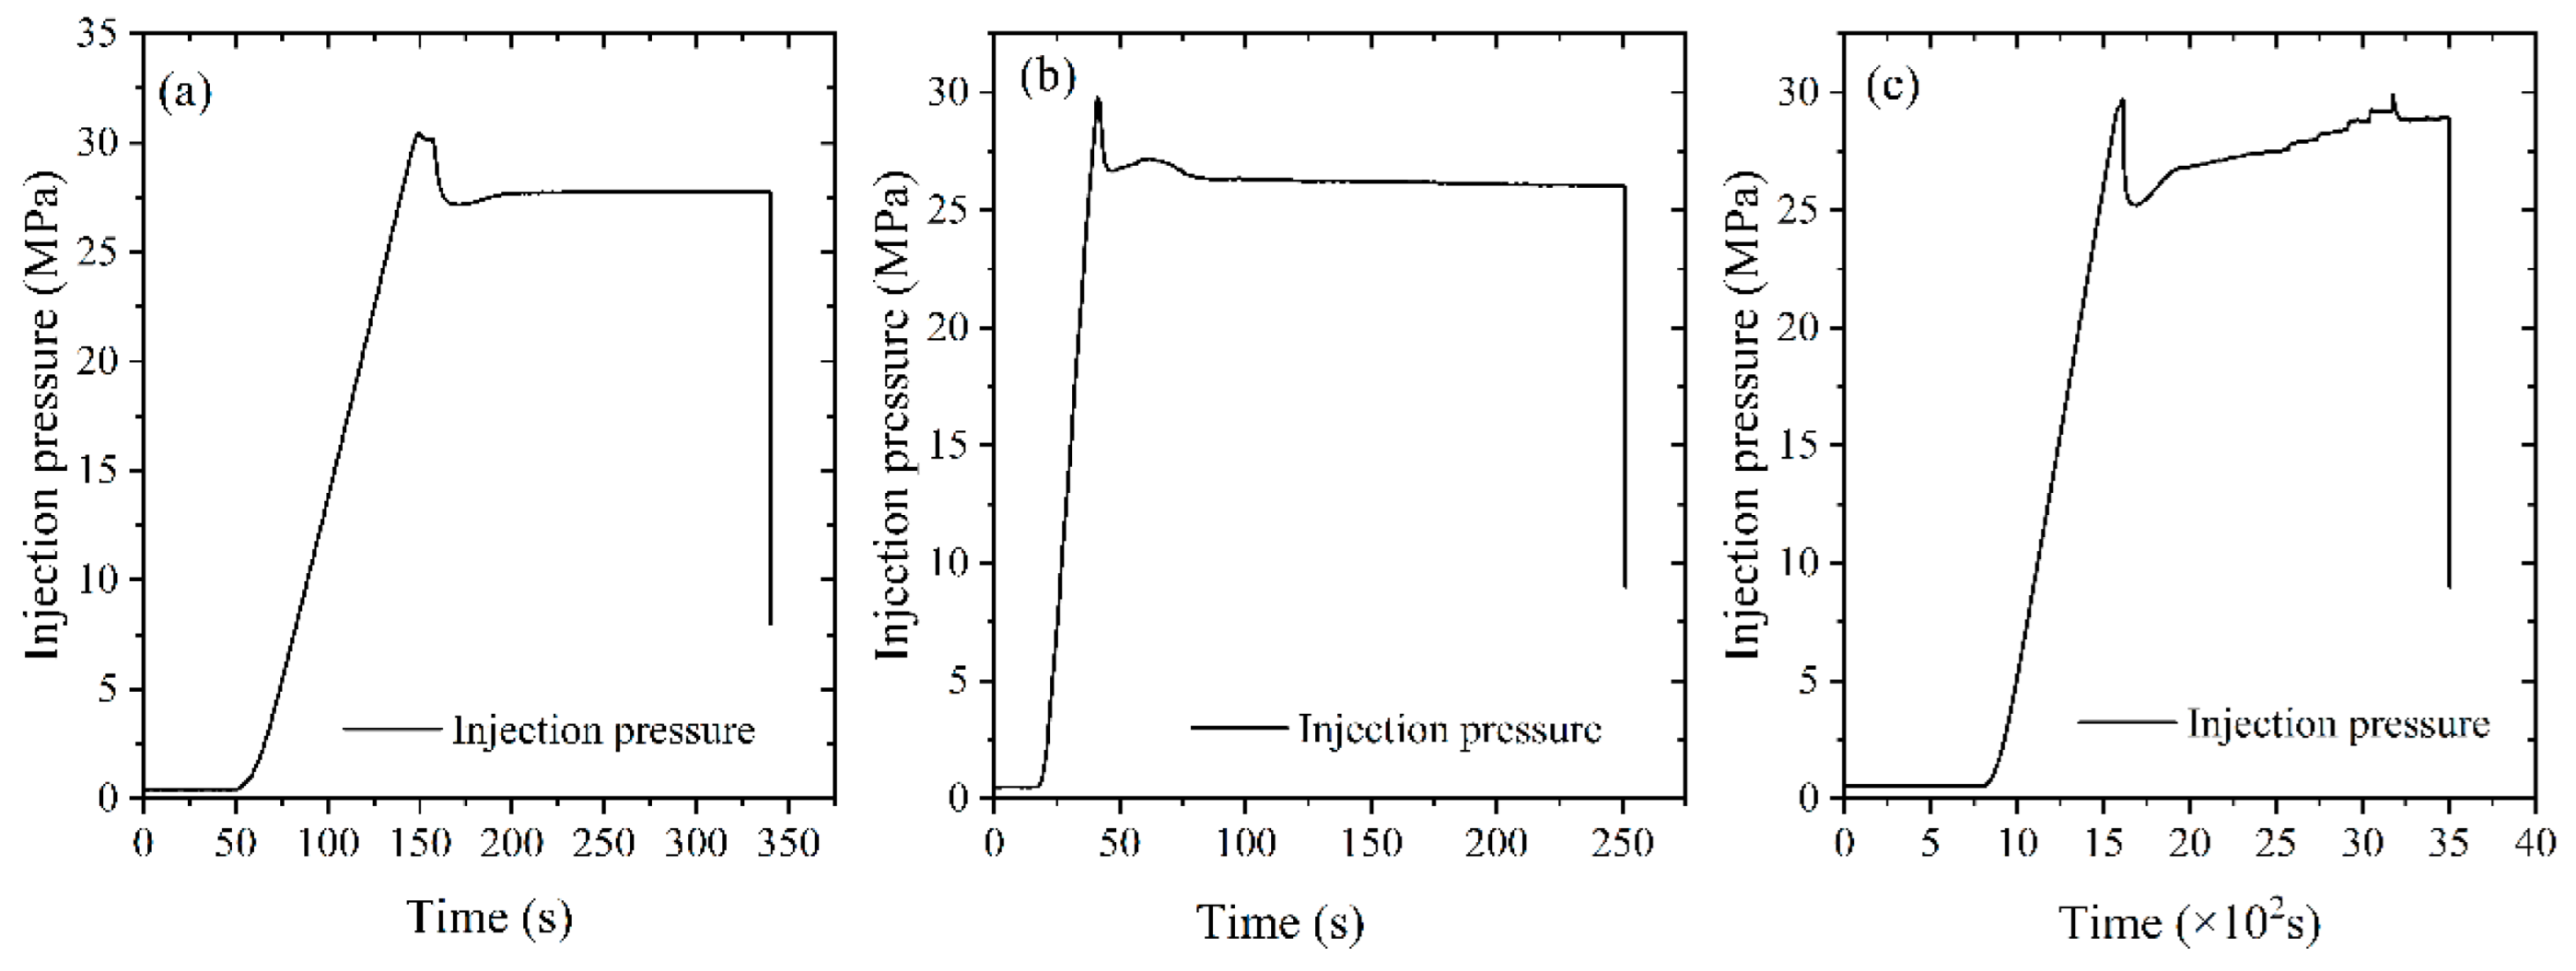
Figure 16.
Pressure-time graph (a) C4 (b) C5.
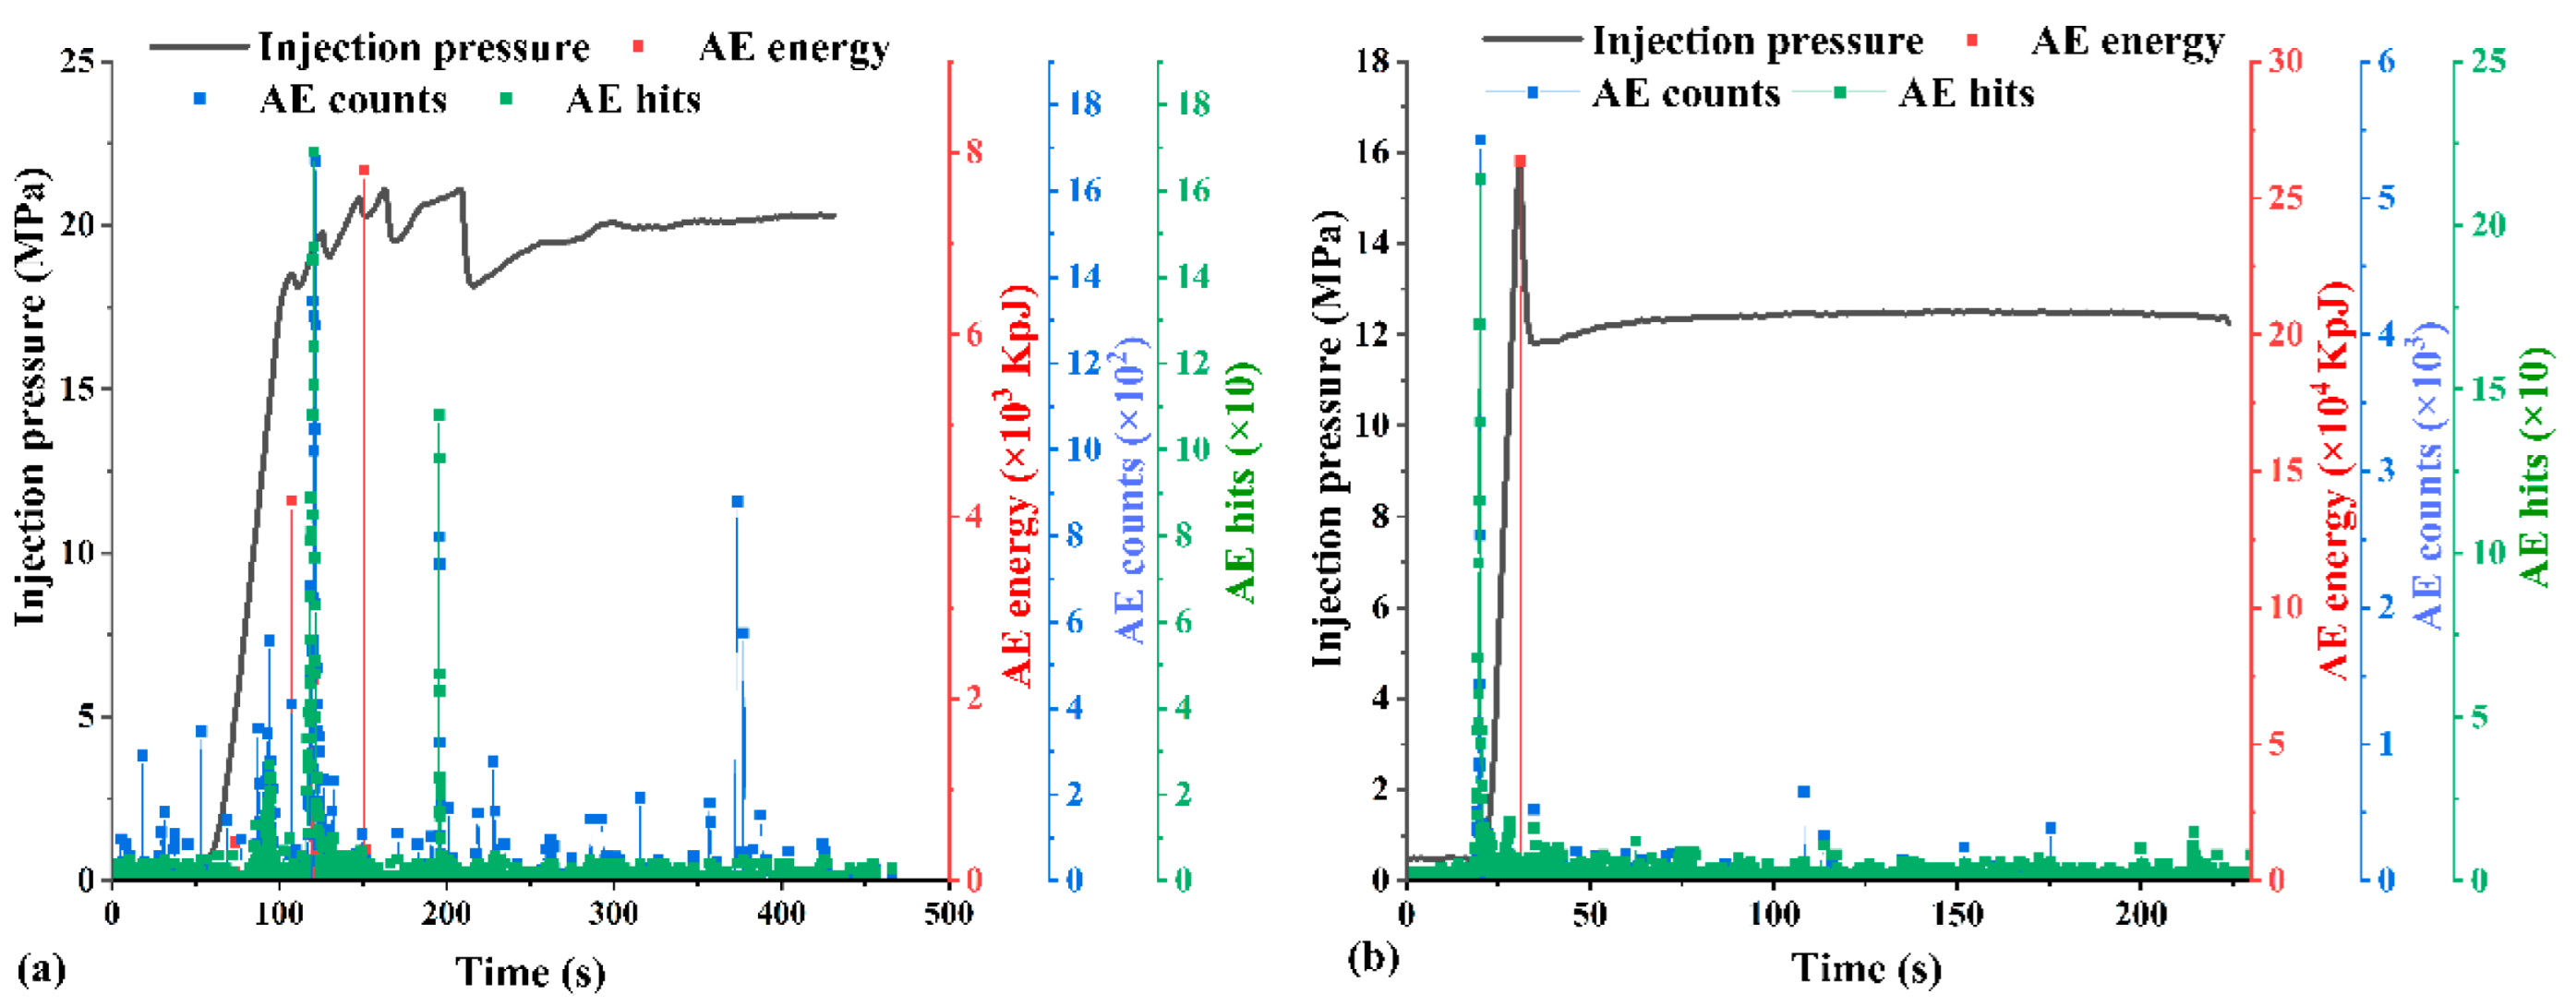
Figure 17.
Pressure-time graph (a) C7 and (b) C6.
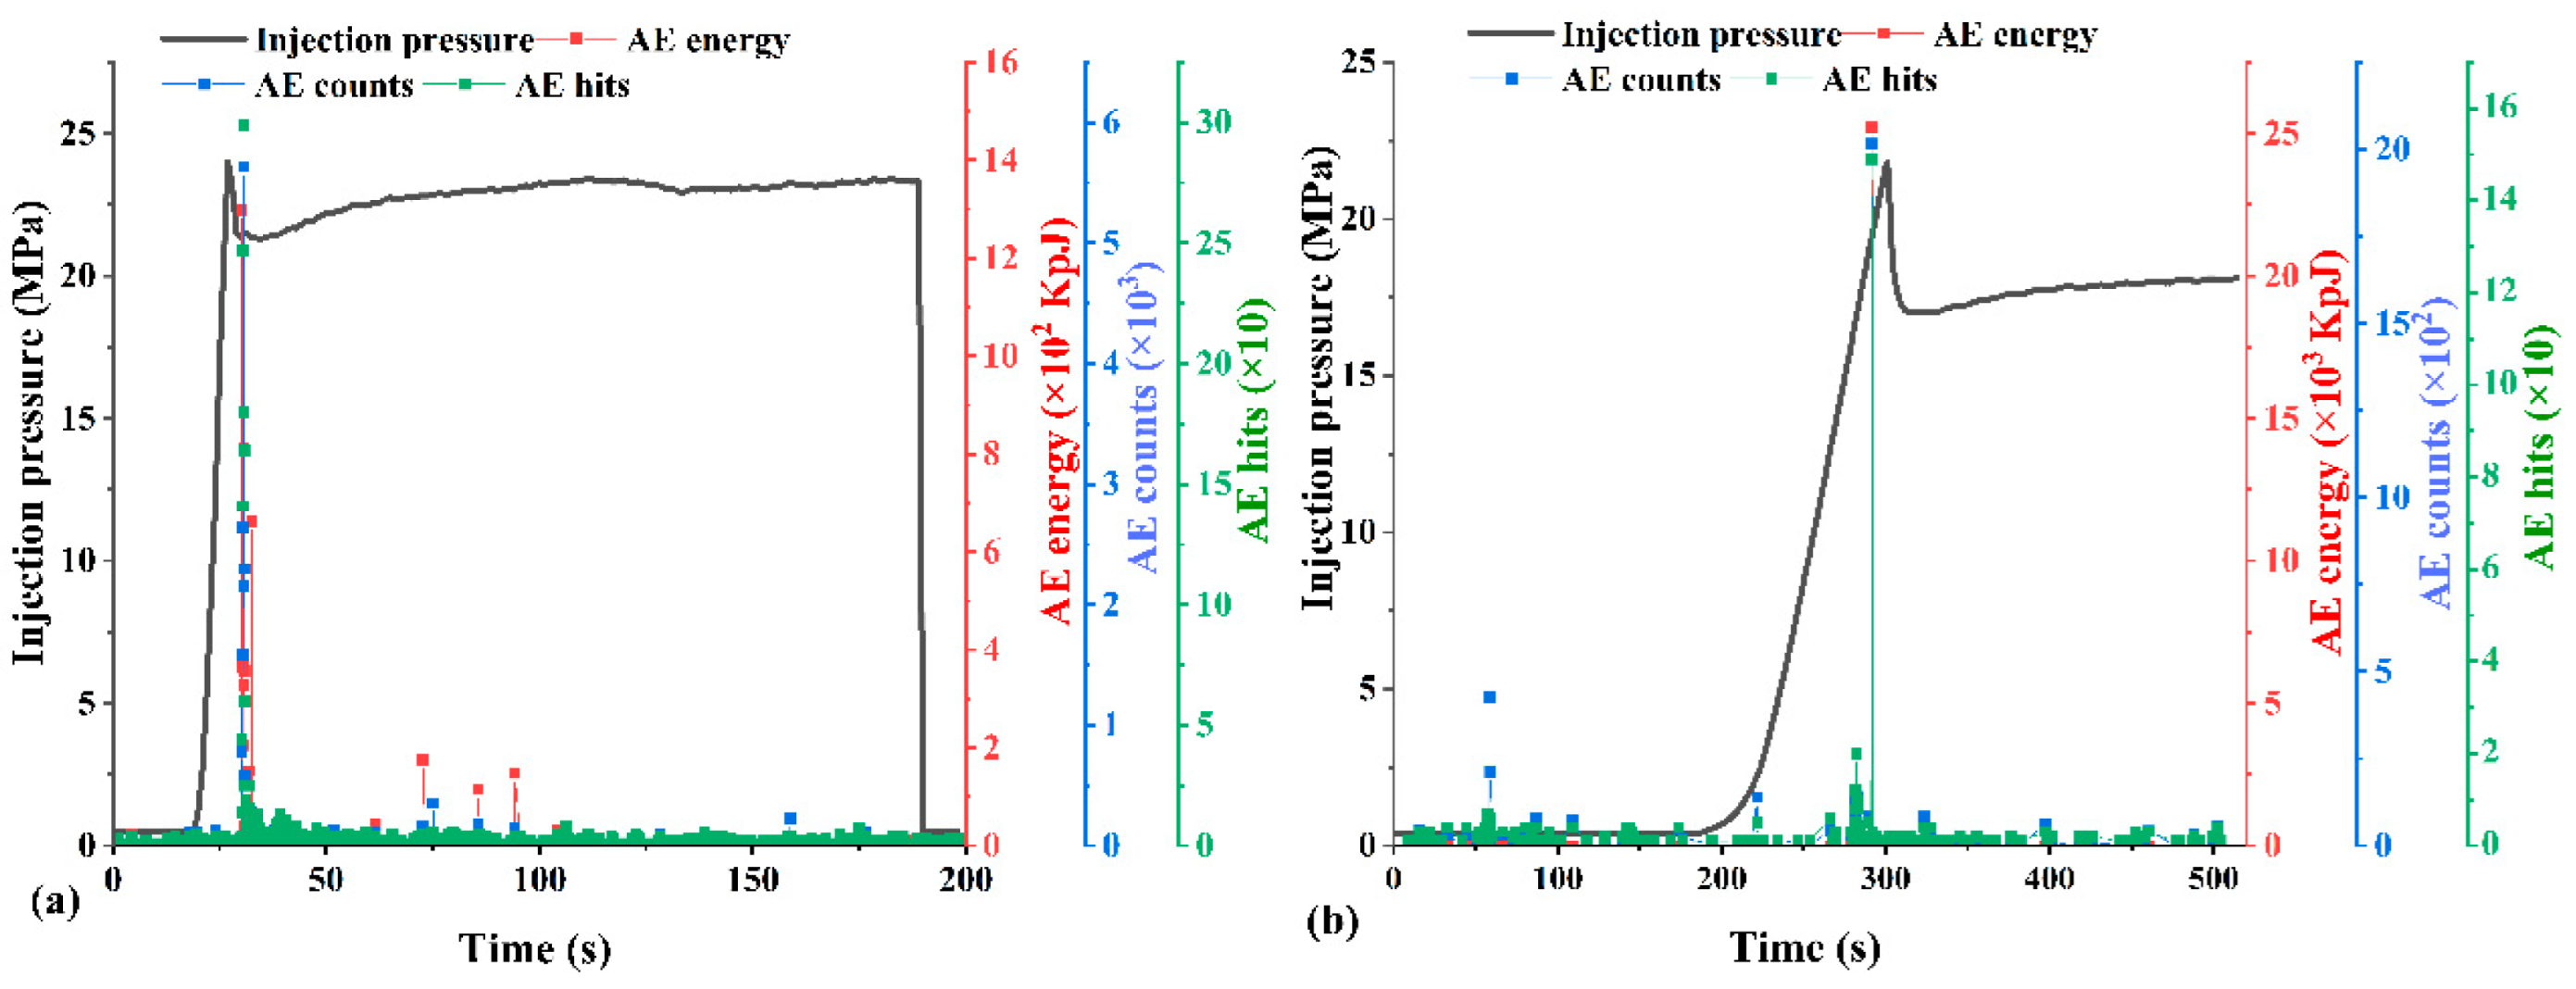
Figure 18.
Pressure-time graph C10.
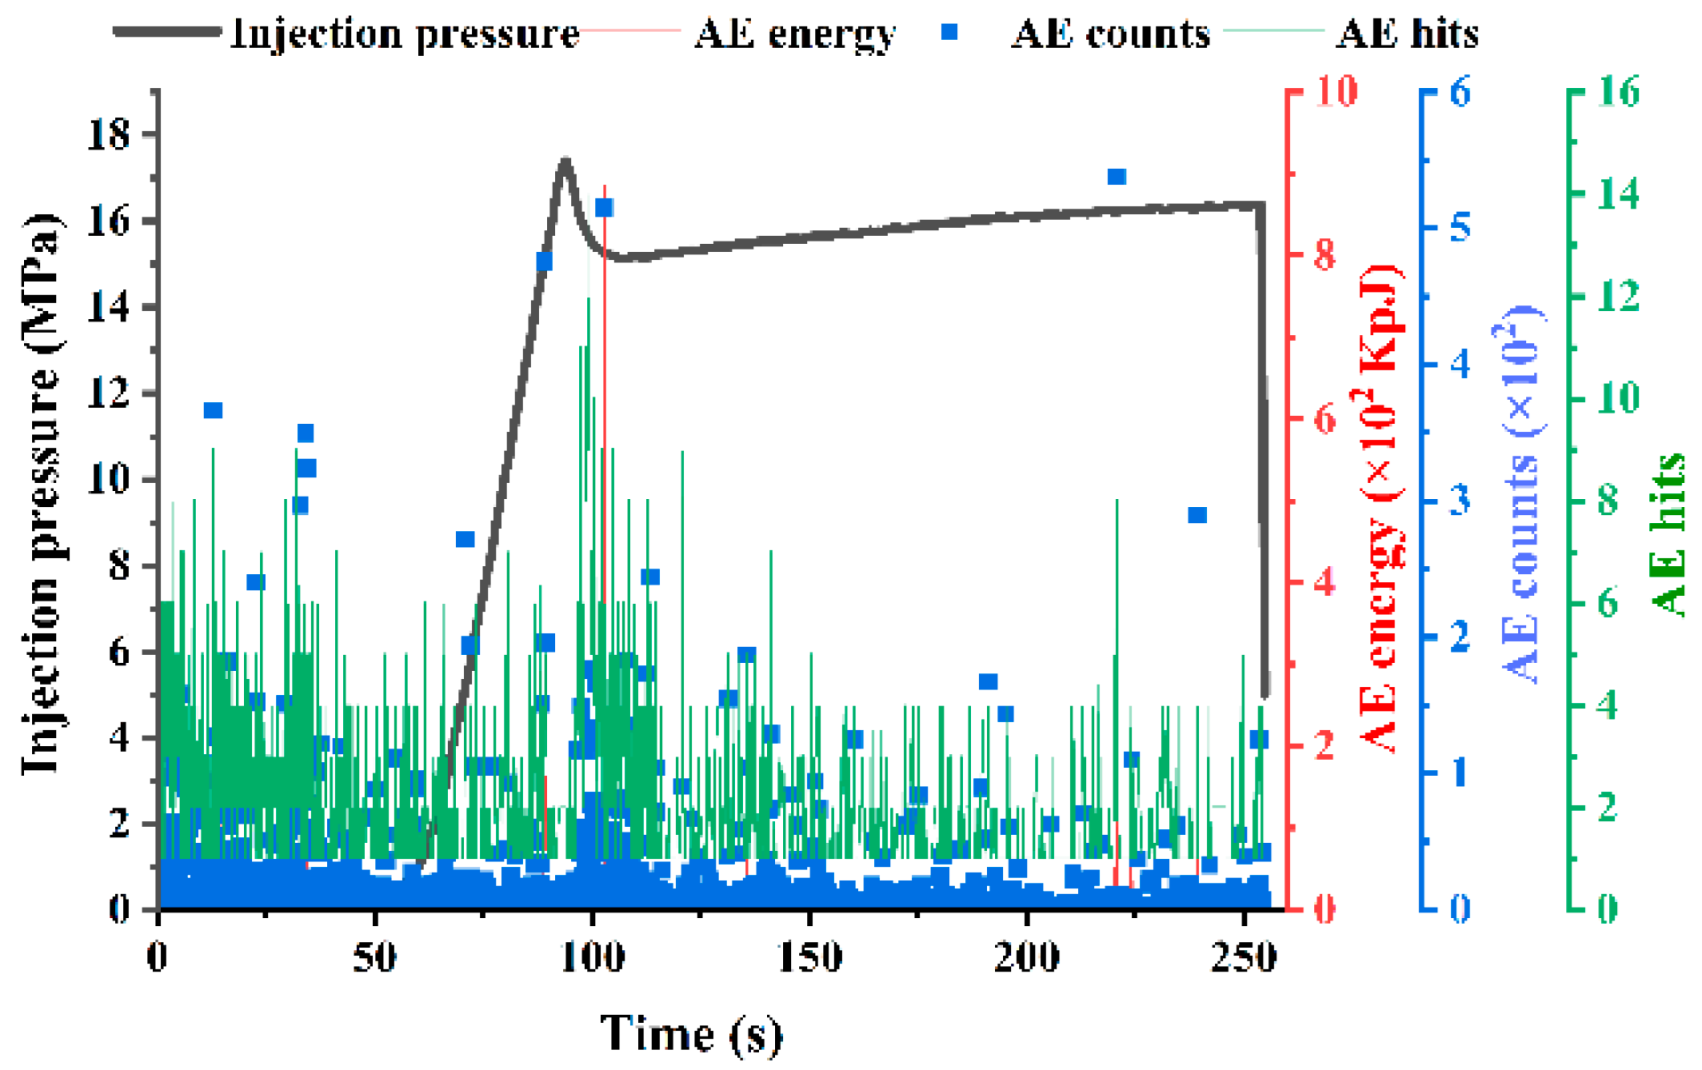
Figure 19.
Pressure-time graph (a) C11 and (b) C12.
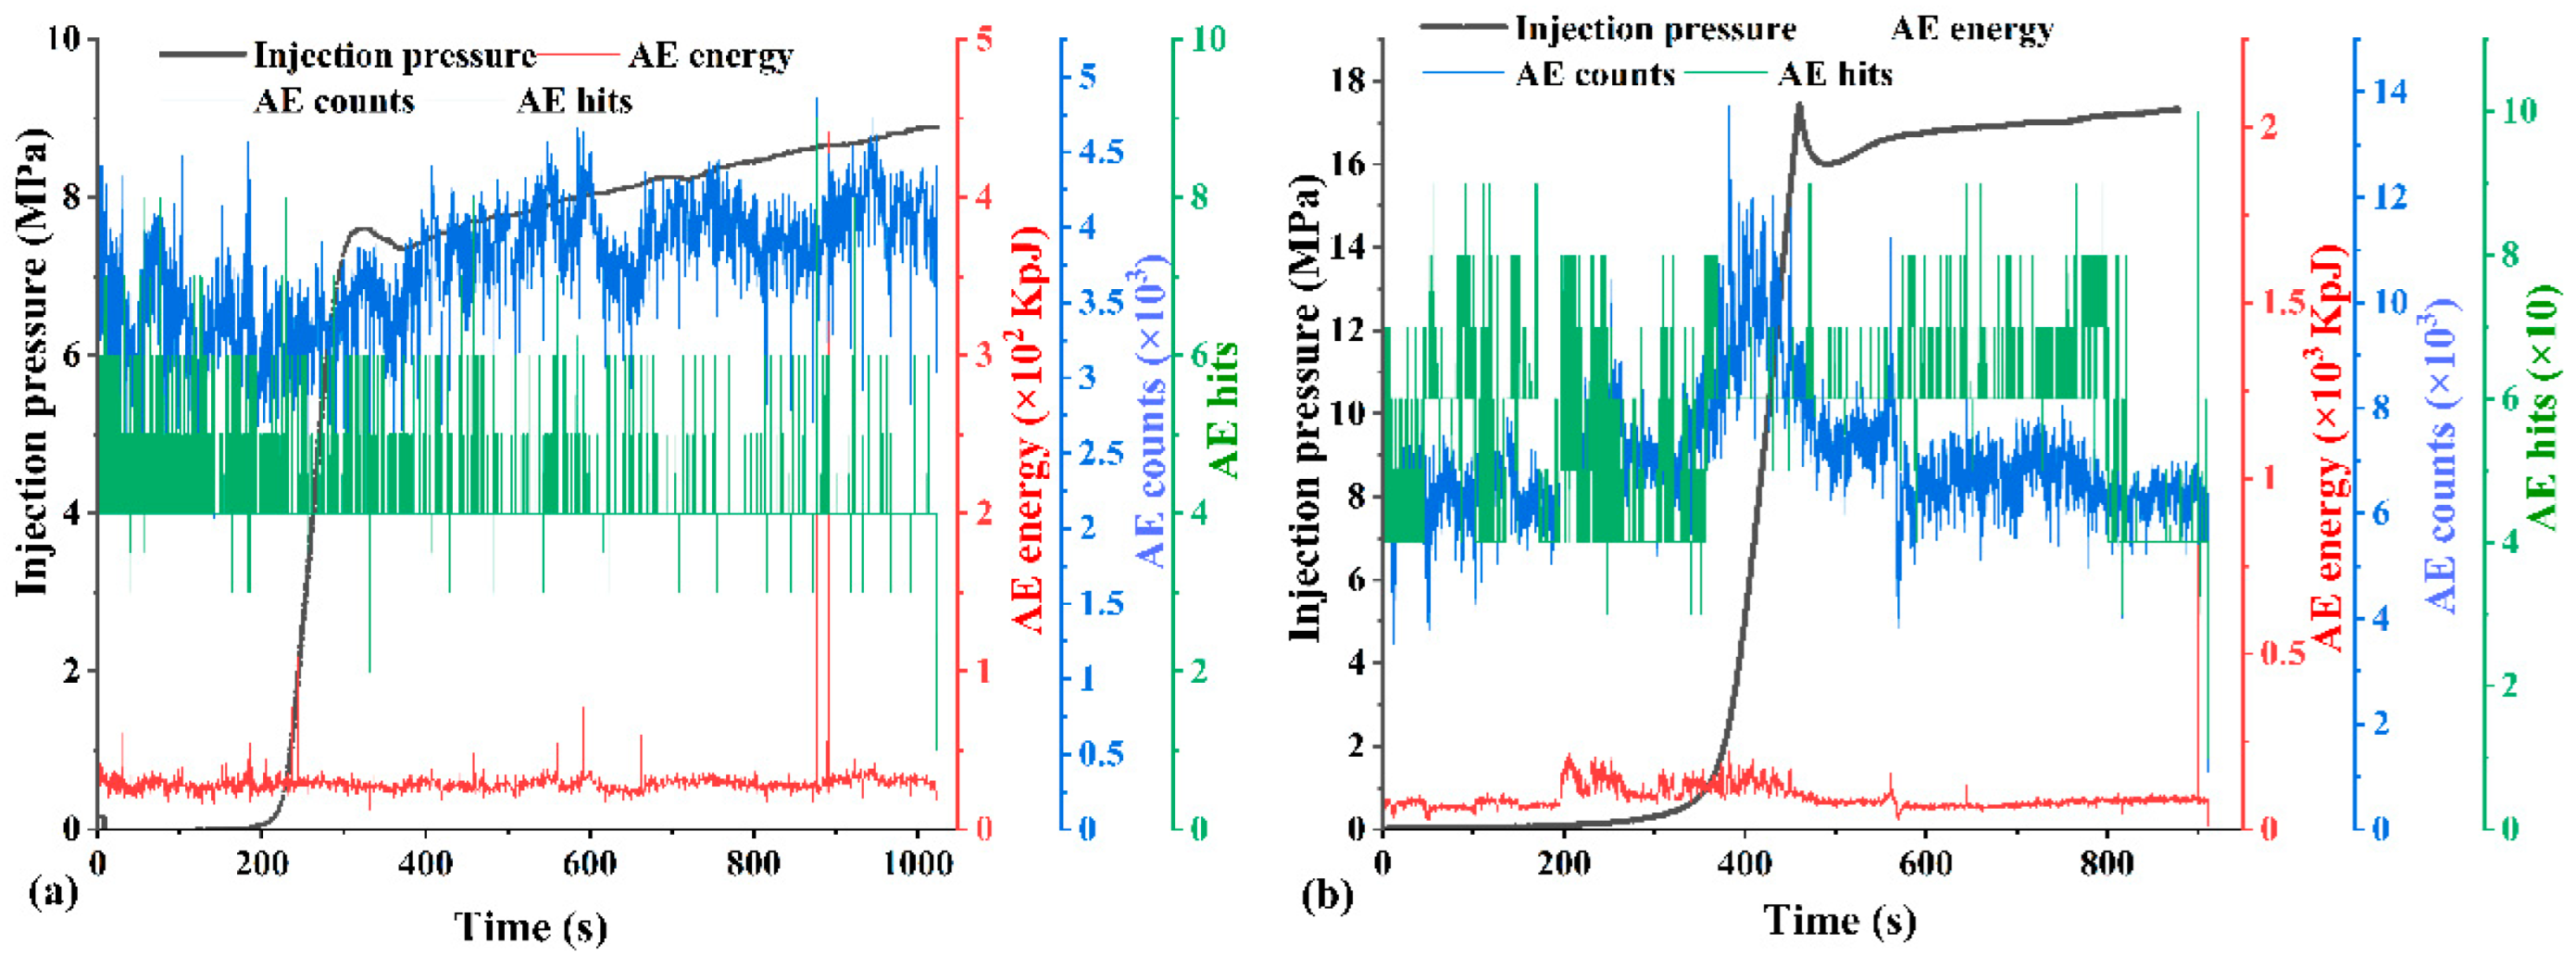
Figure 20.
Pressure-time graph (a) C9 and (b) C8.
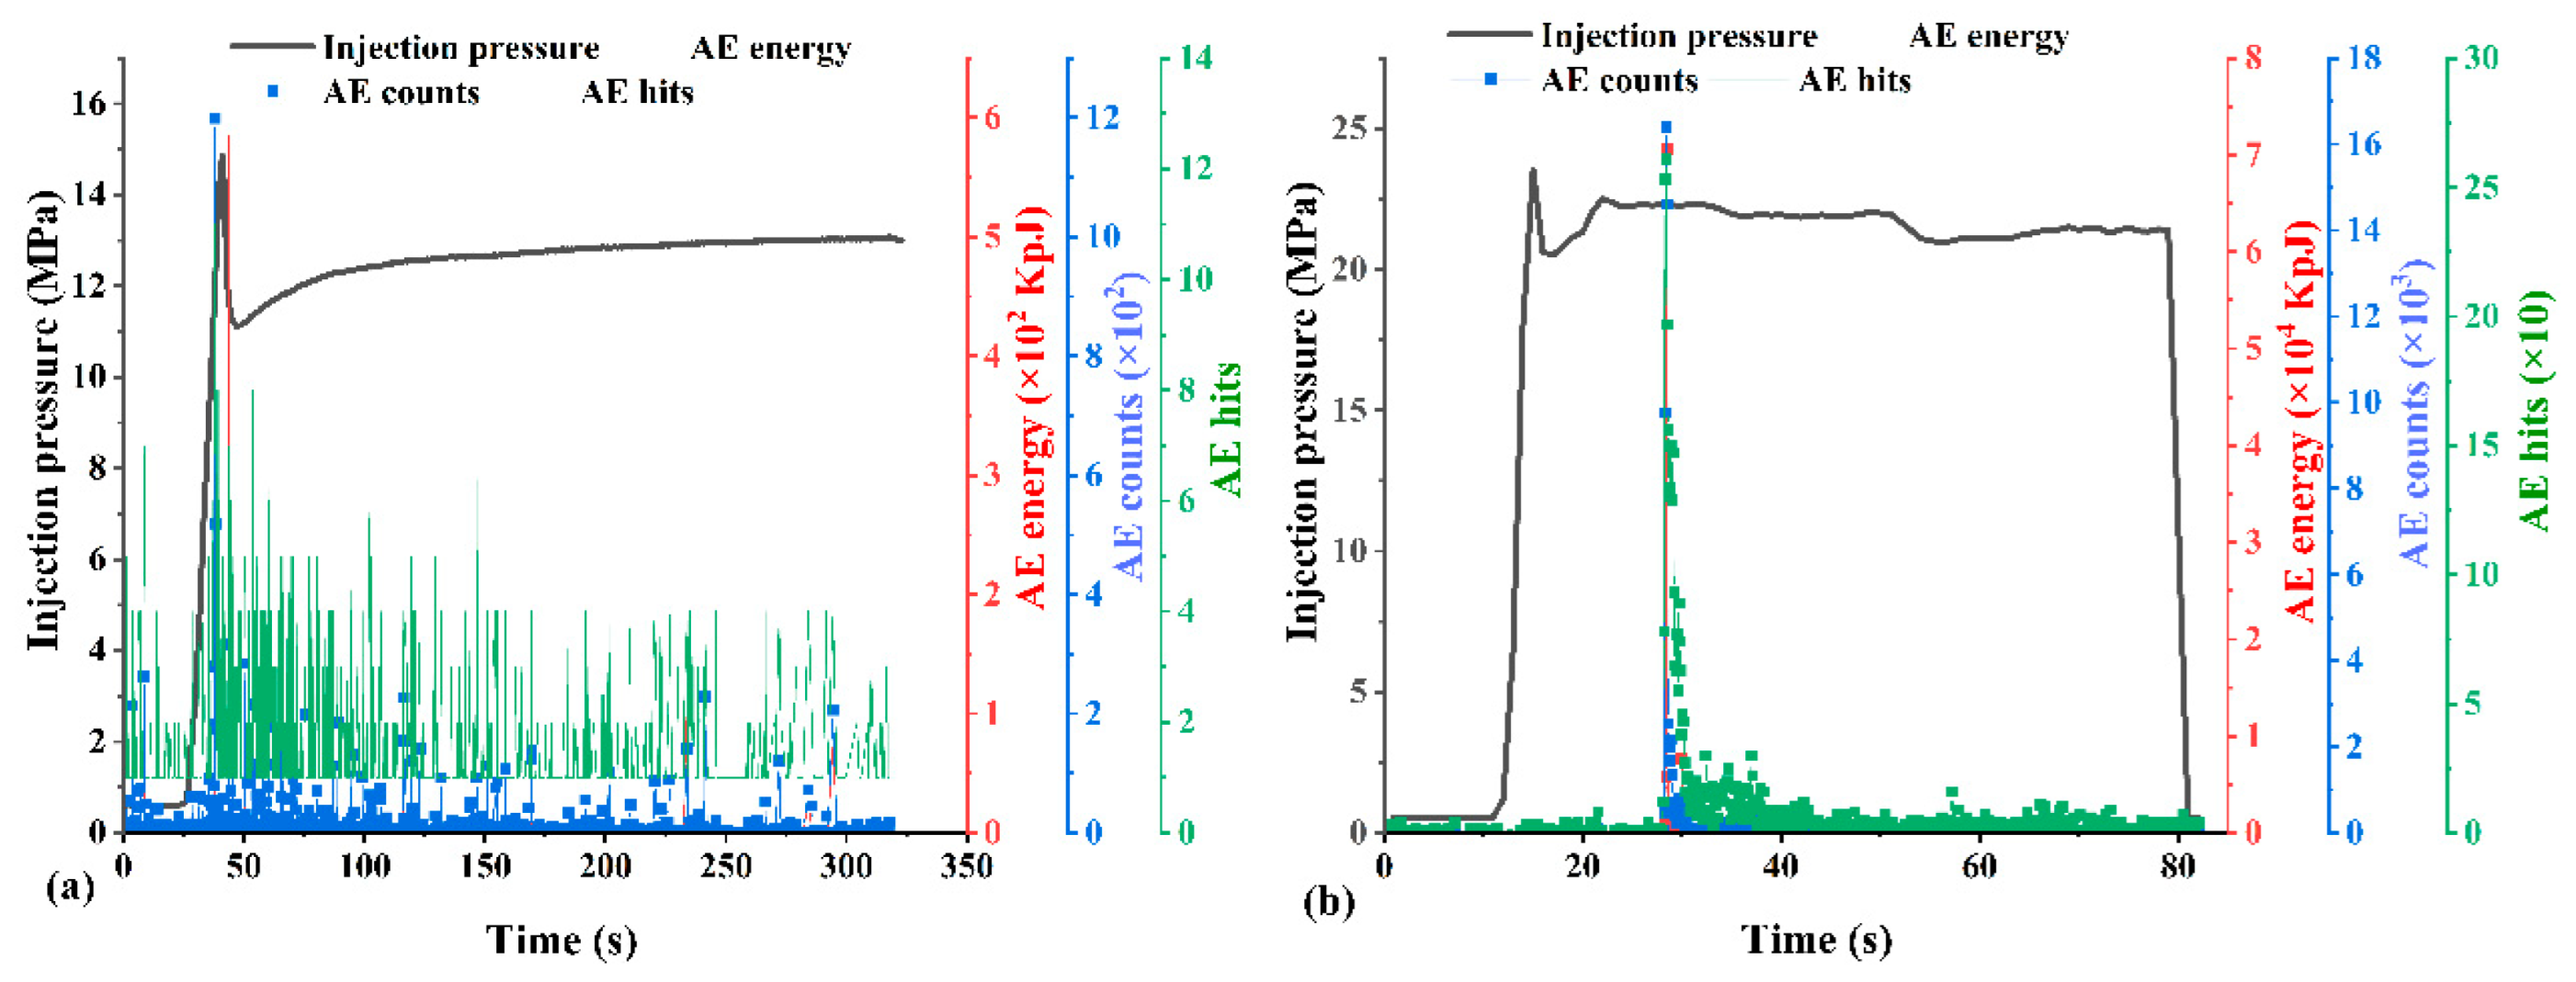
Figure 21.
Pressure-time graph (a) SST13 and (b) Coal14.
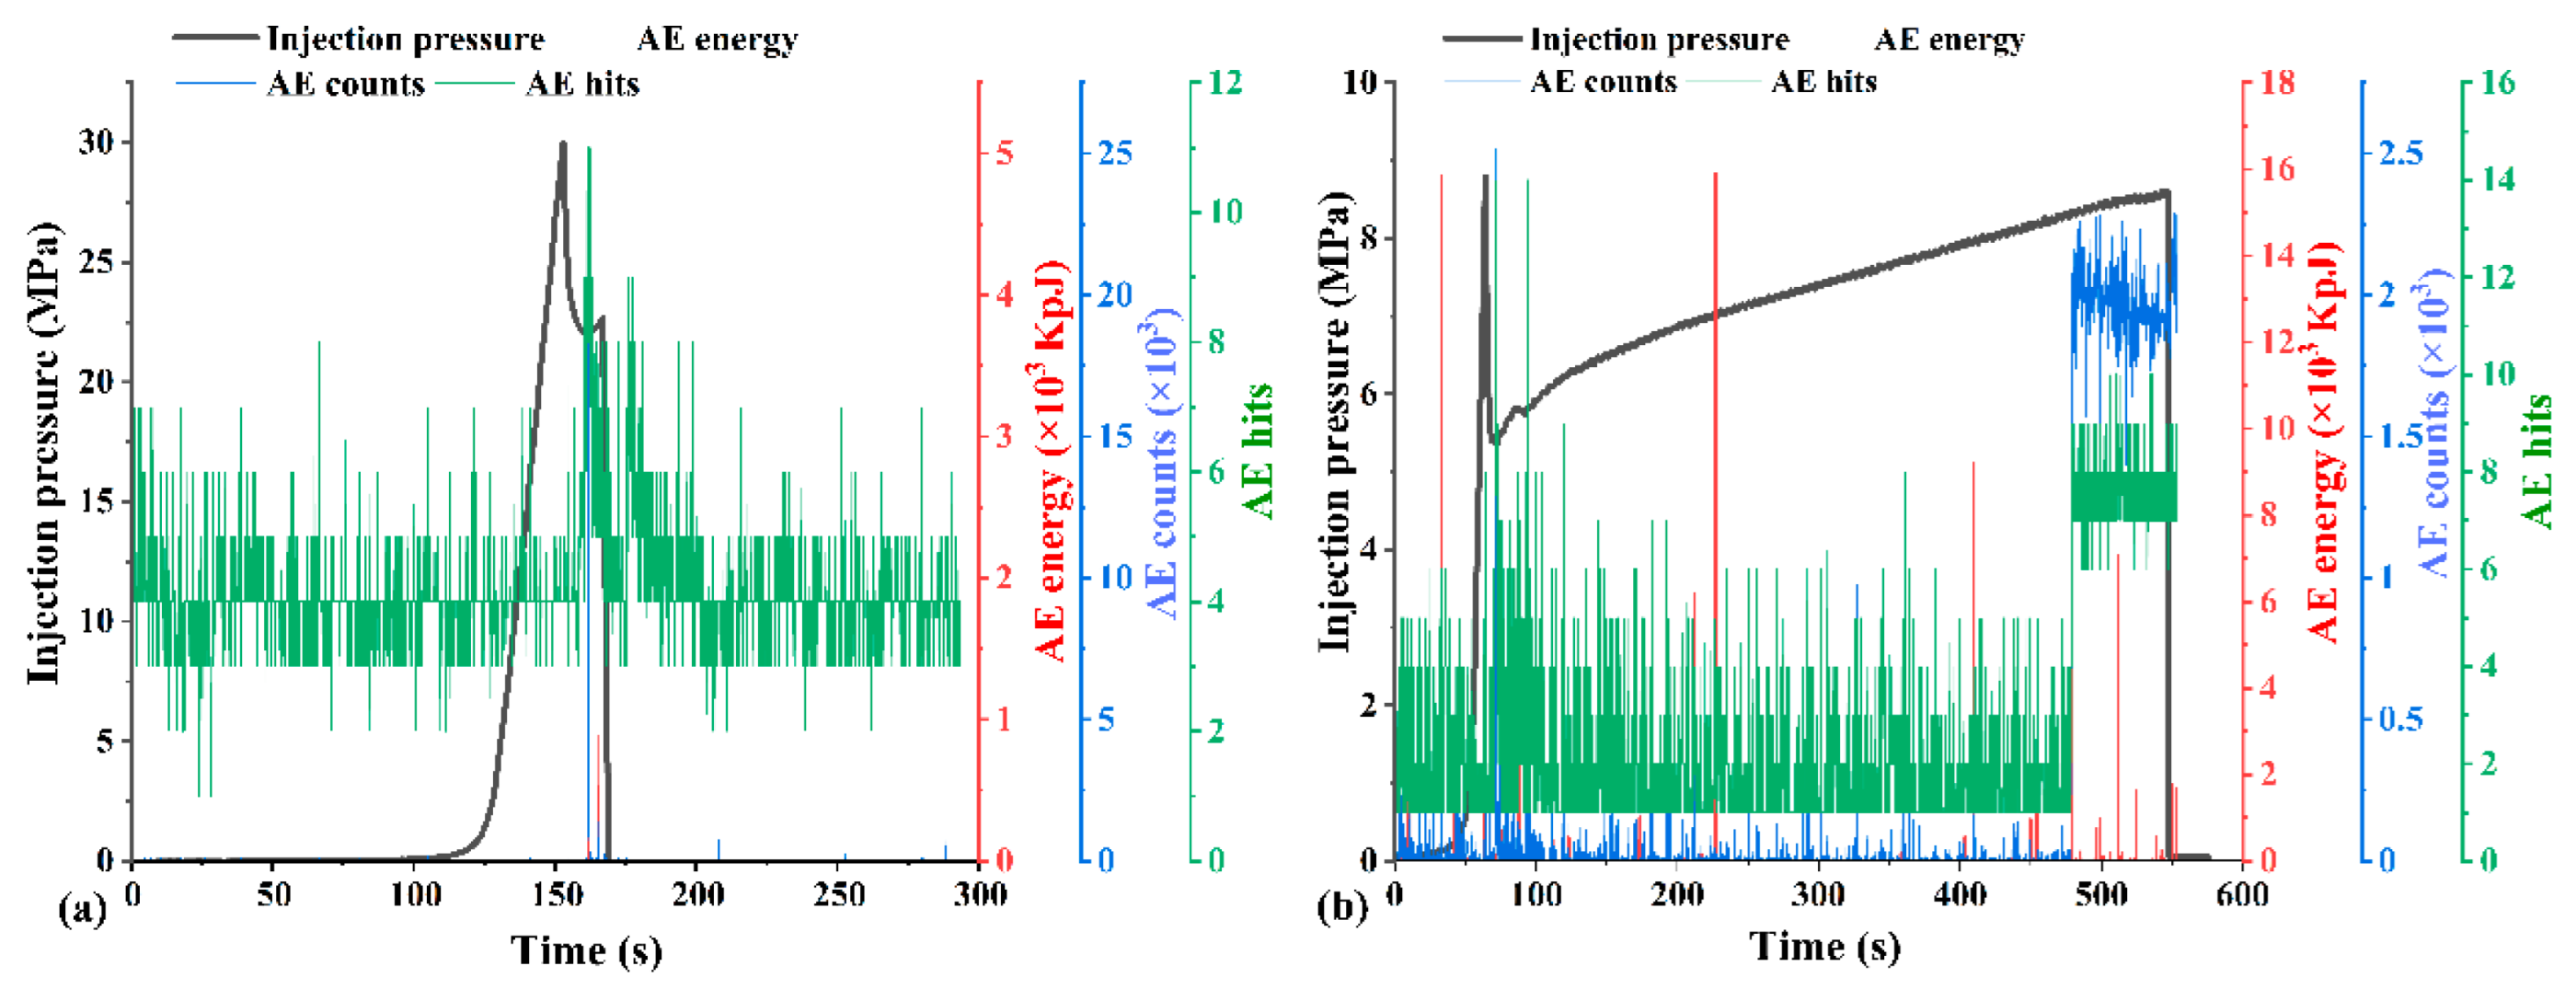
Figure 22.
Scanned fracture surface: C3 - Average JCR 14.97.
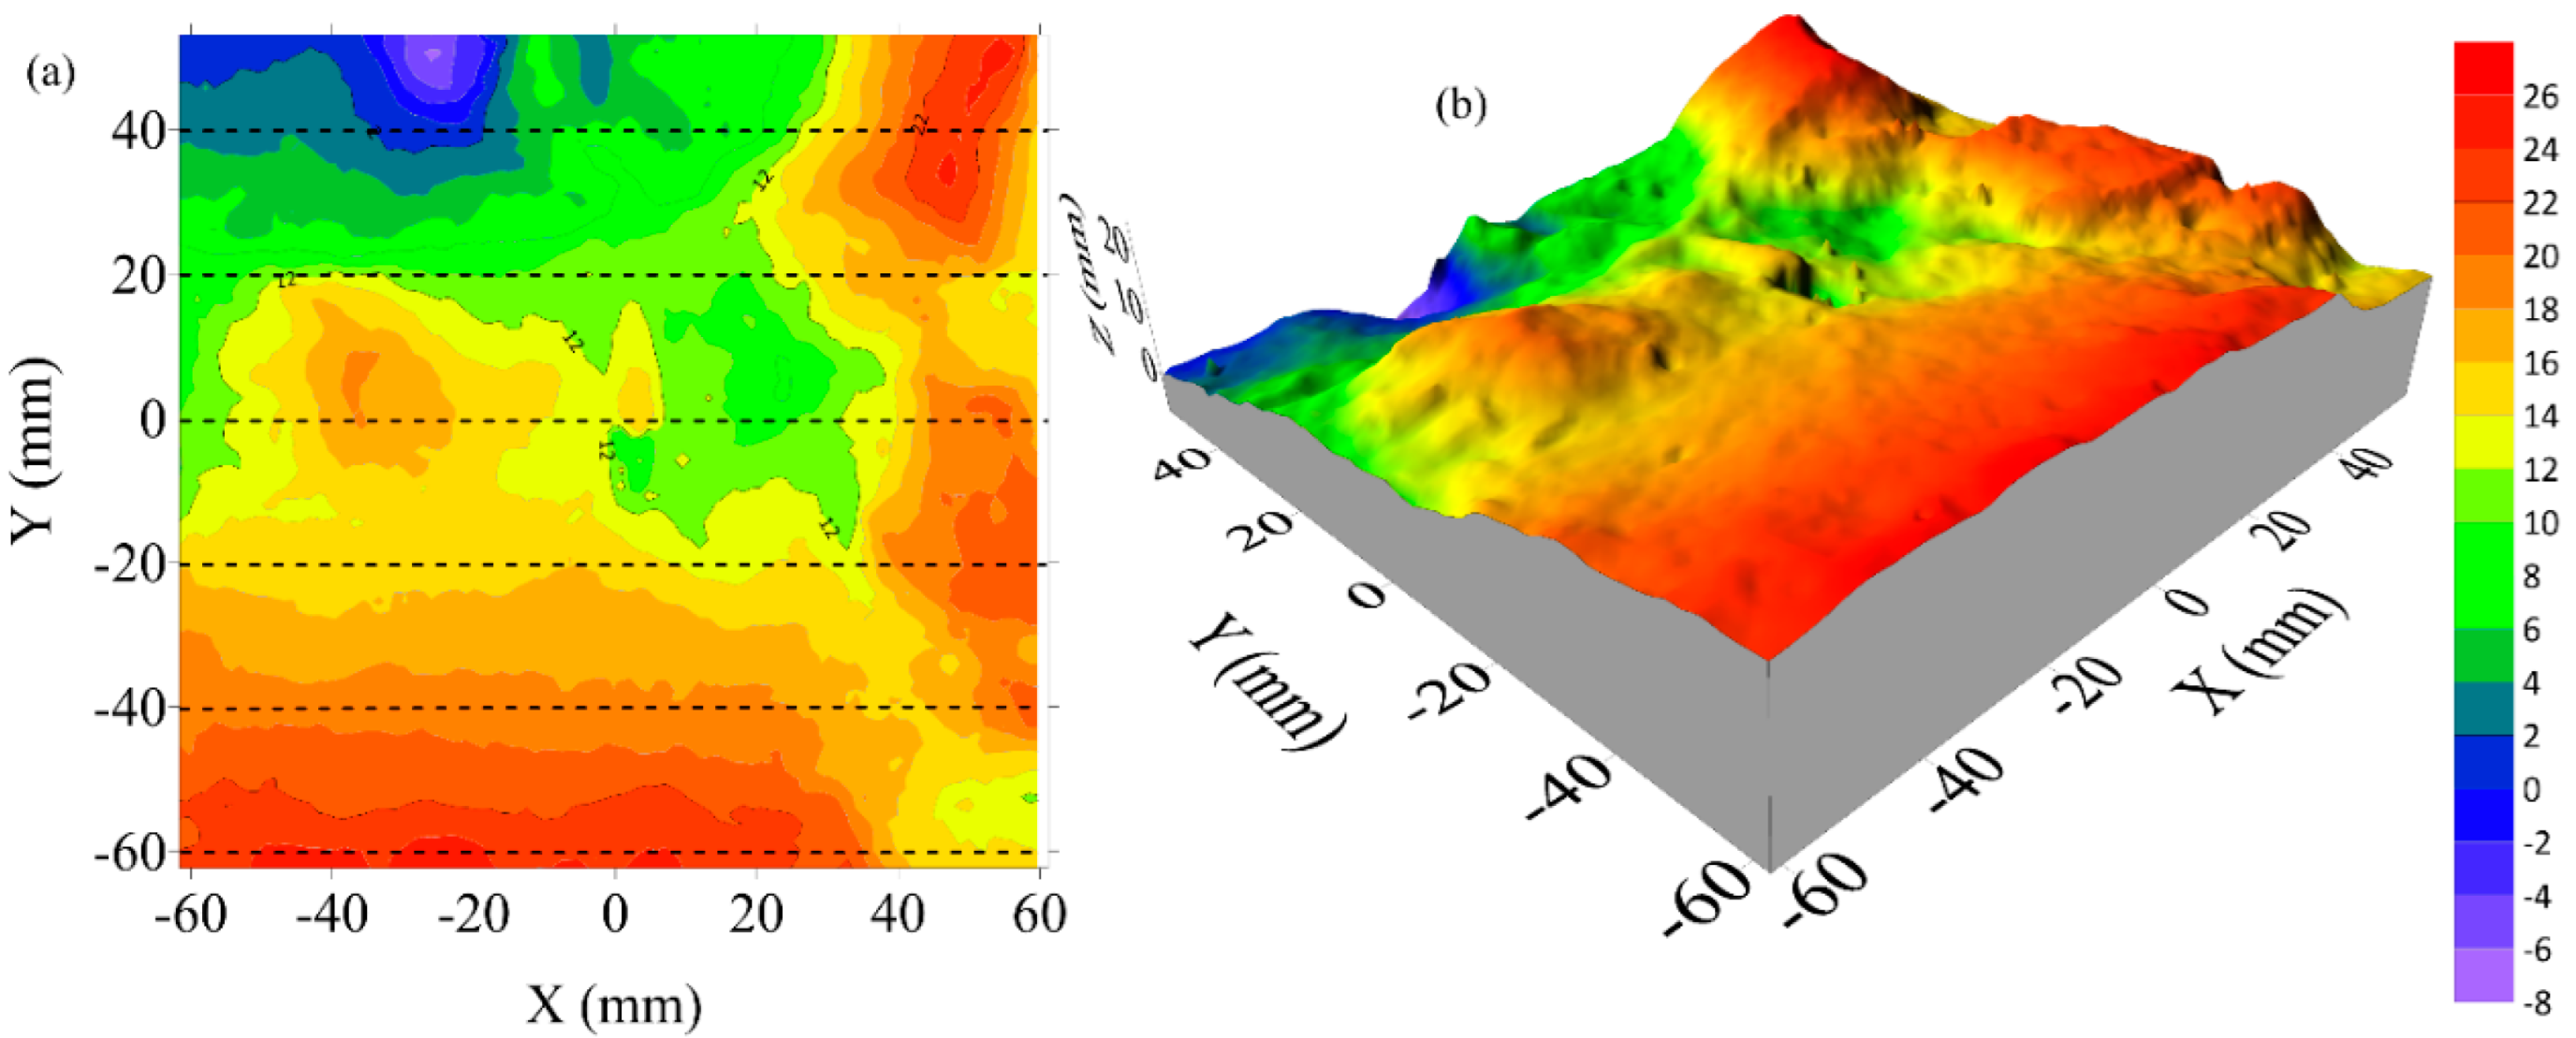
Figure 23.
Scanned fracture surface: C10 - Average JCR 17.69.
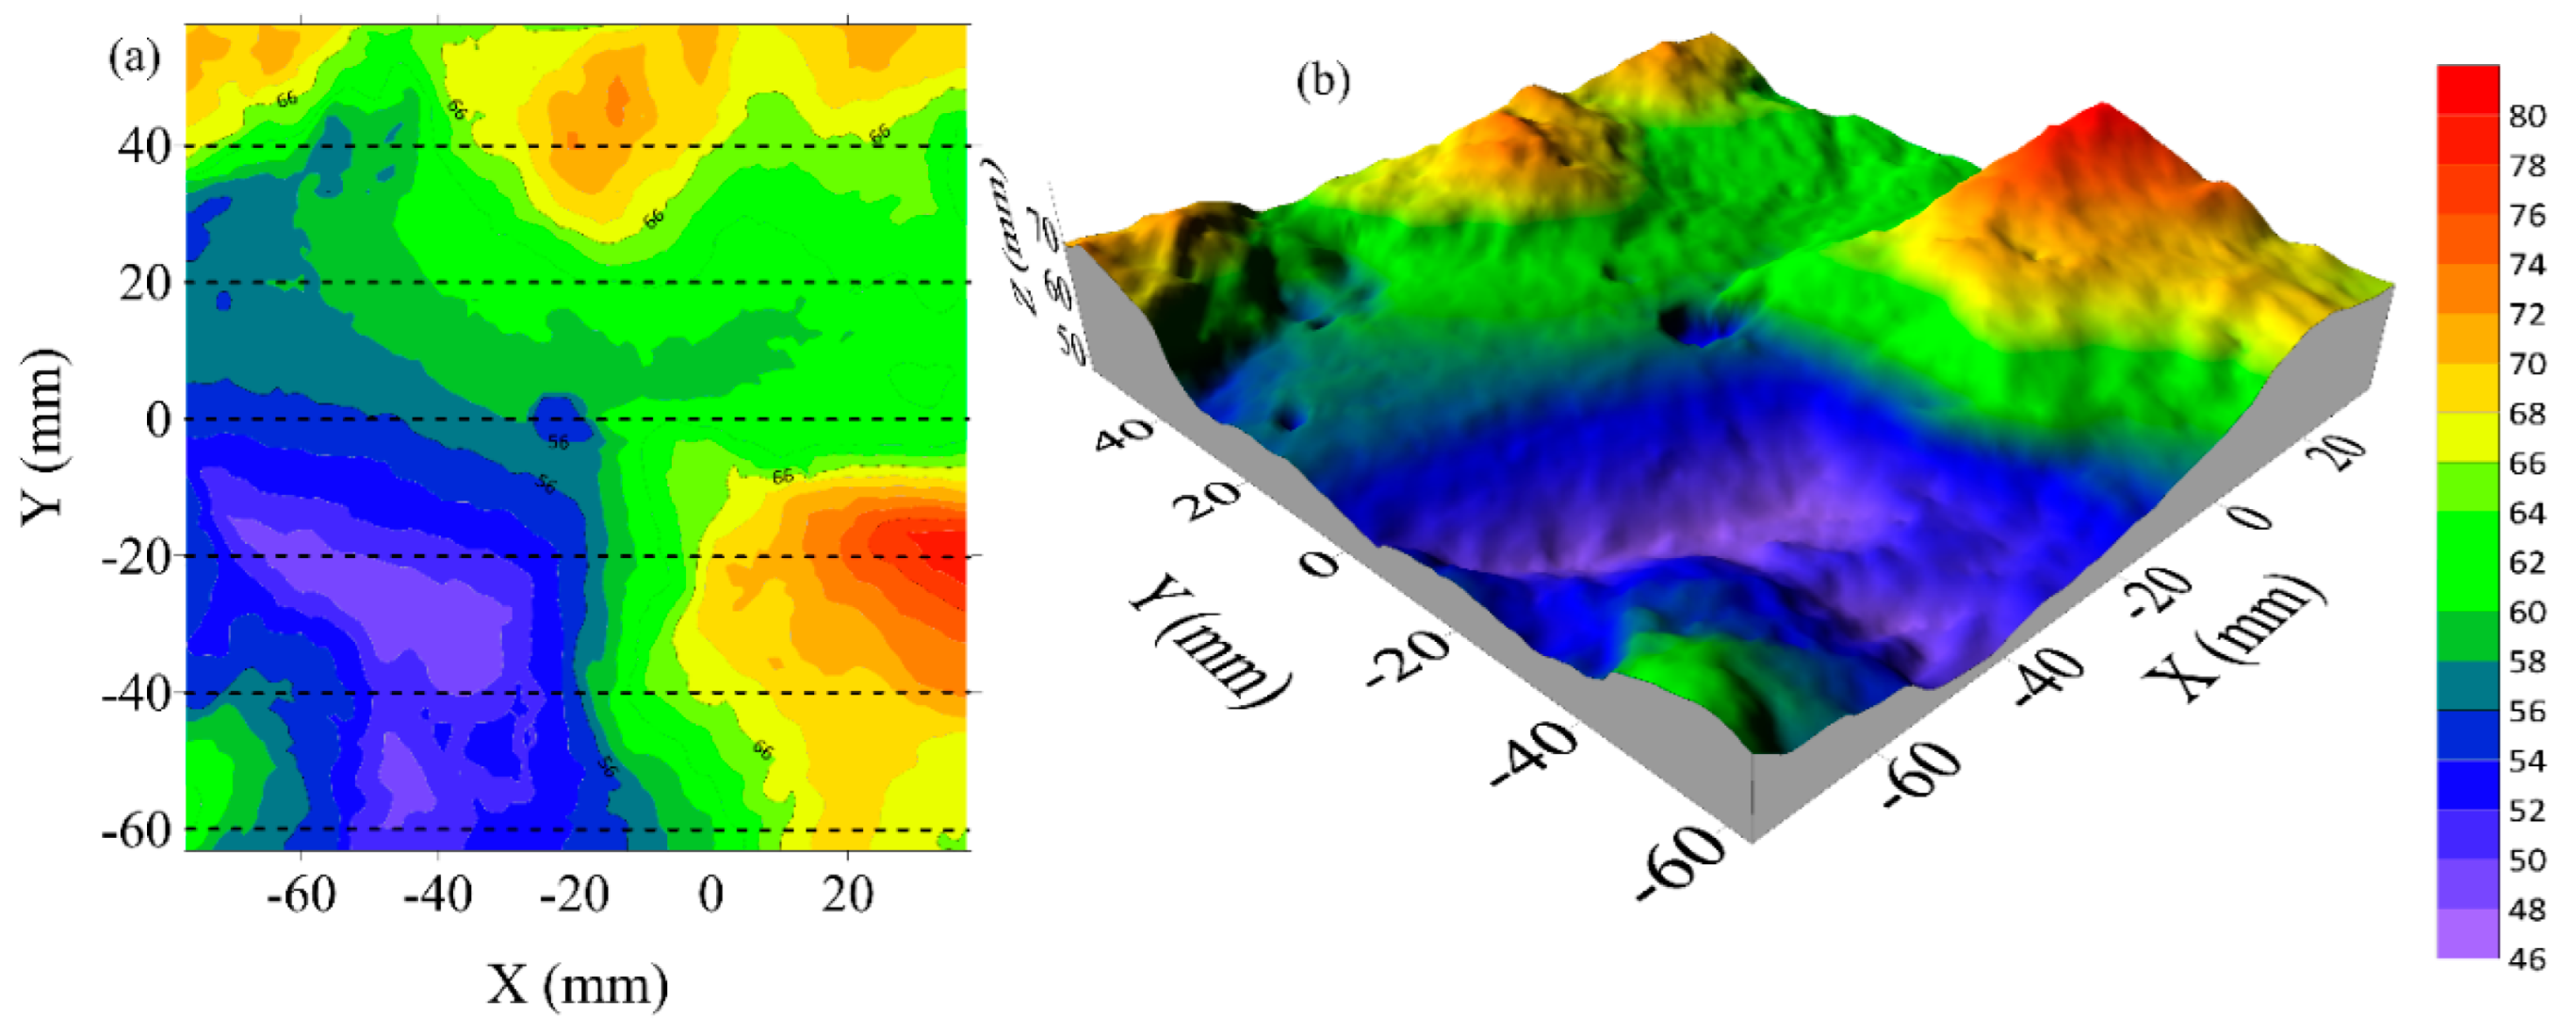
Figure 24.
Scanned fracture surface: C12 – Average JRC 23.89.
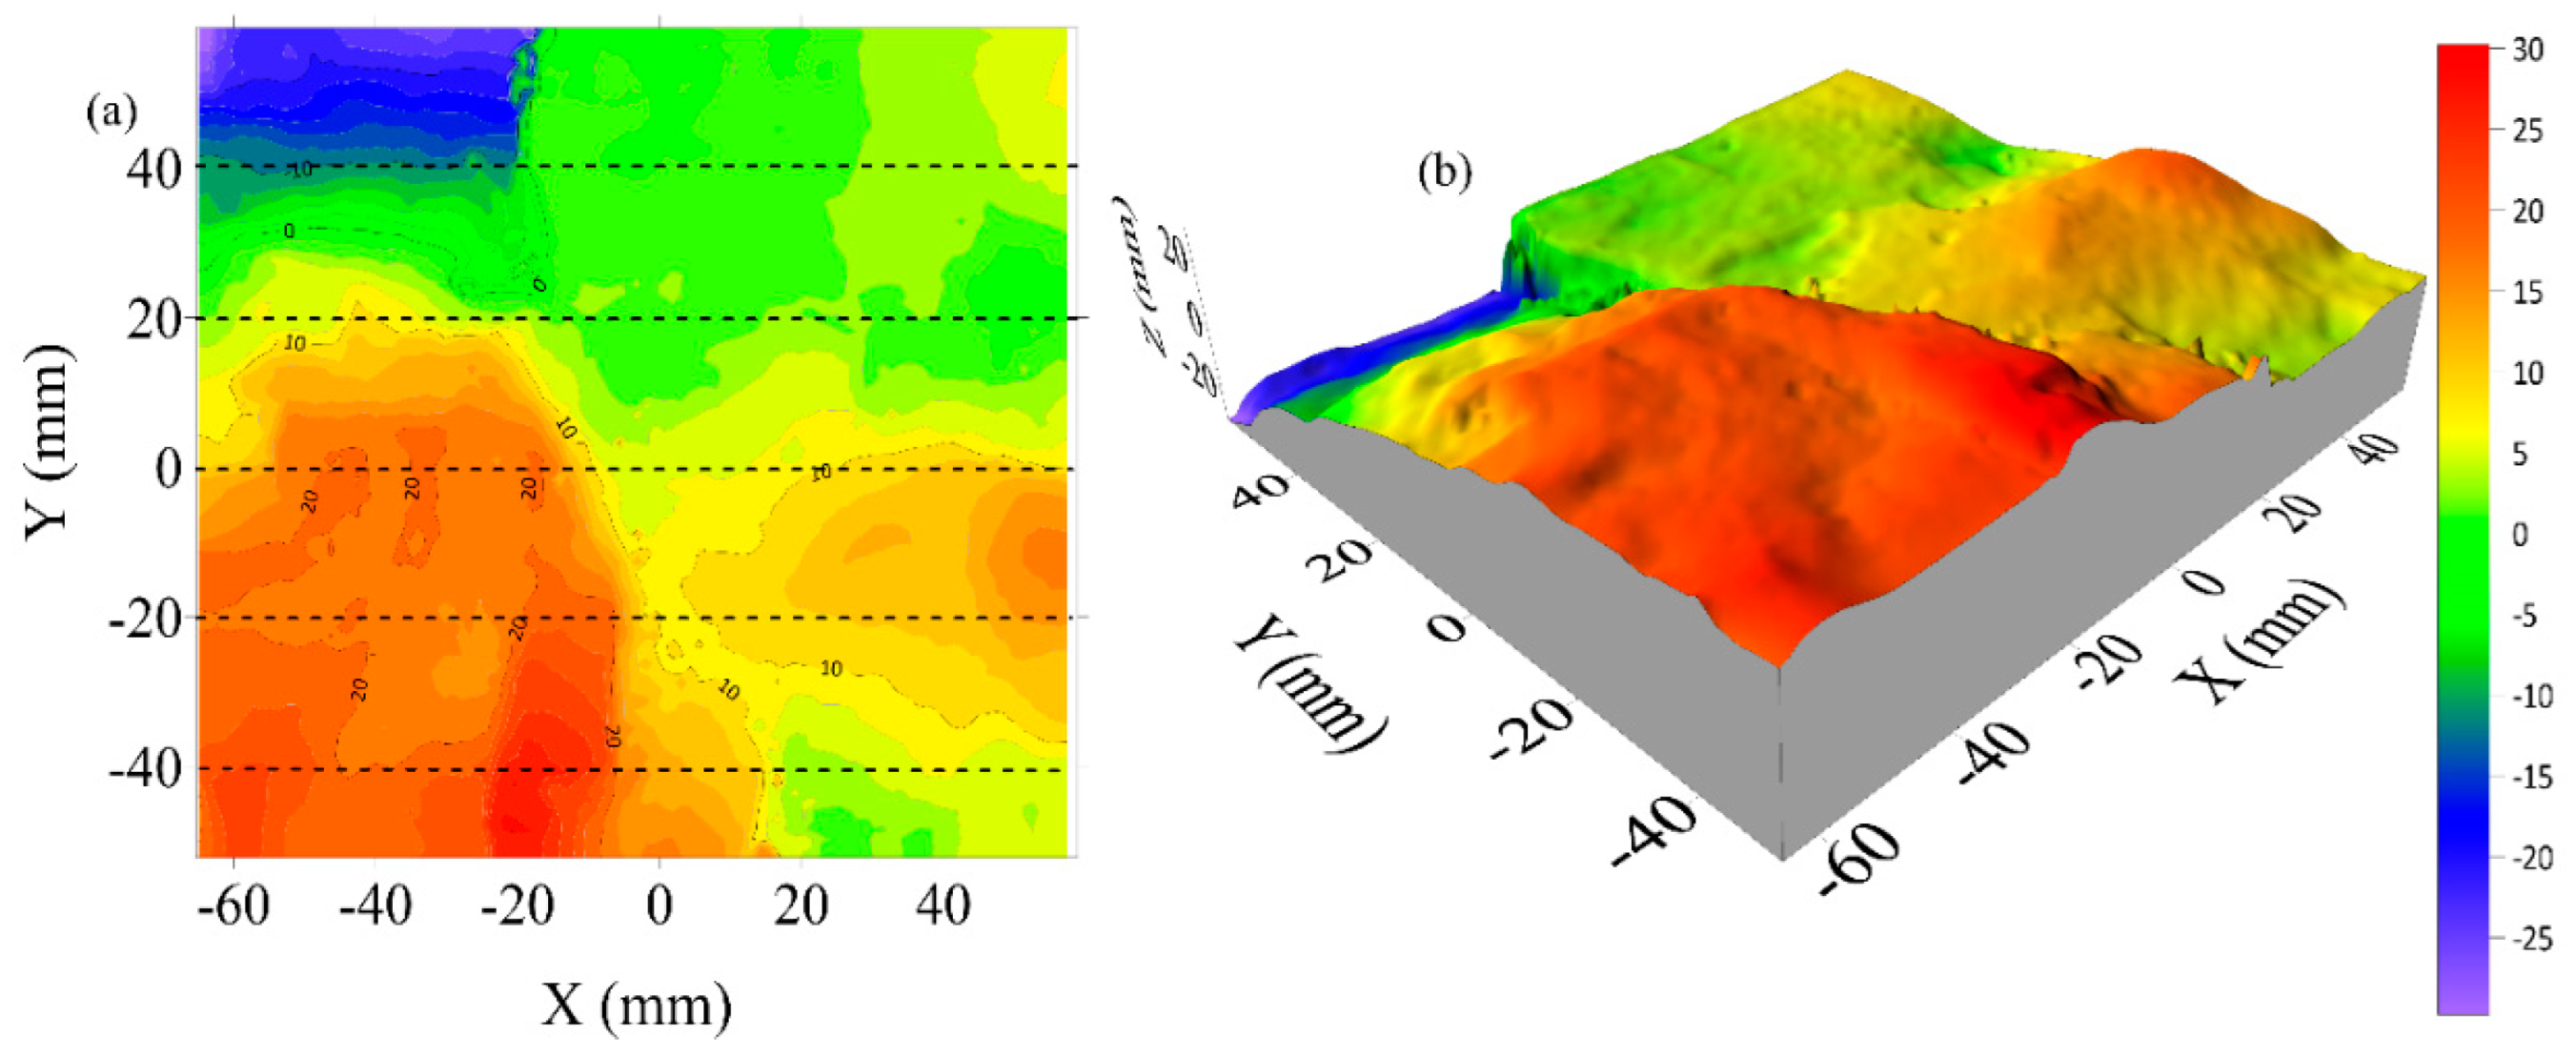
Figure 25.
Scanned fracture surface: SST13 – Average JCR 16.36.
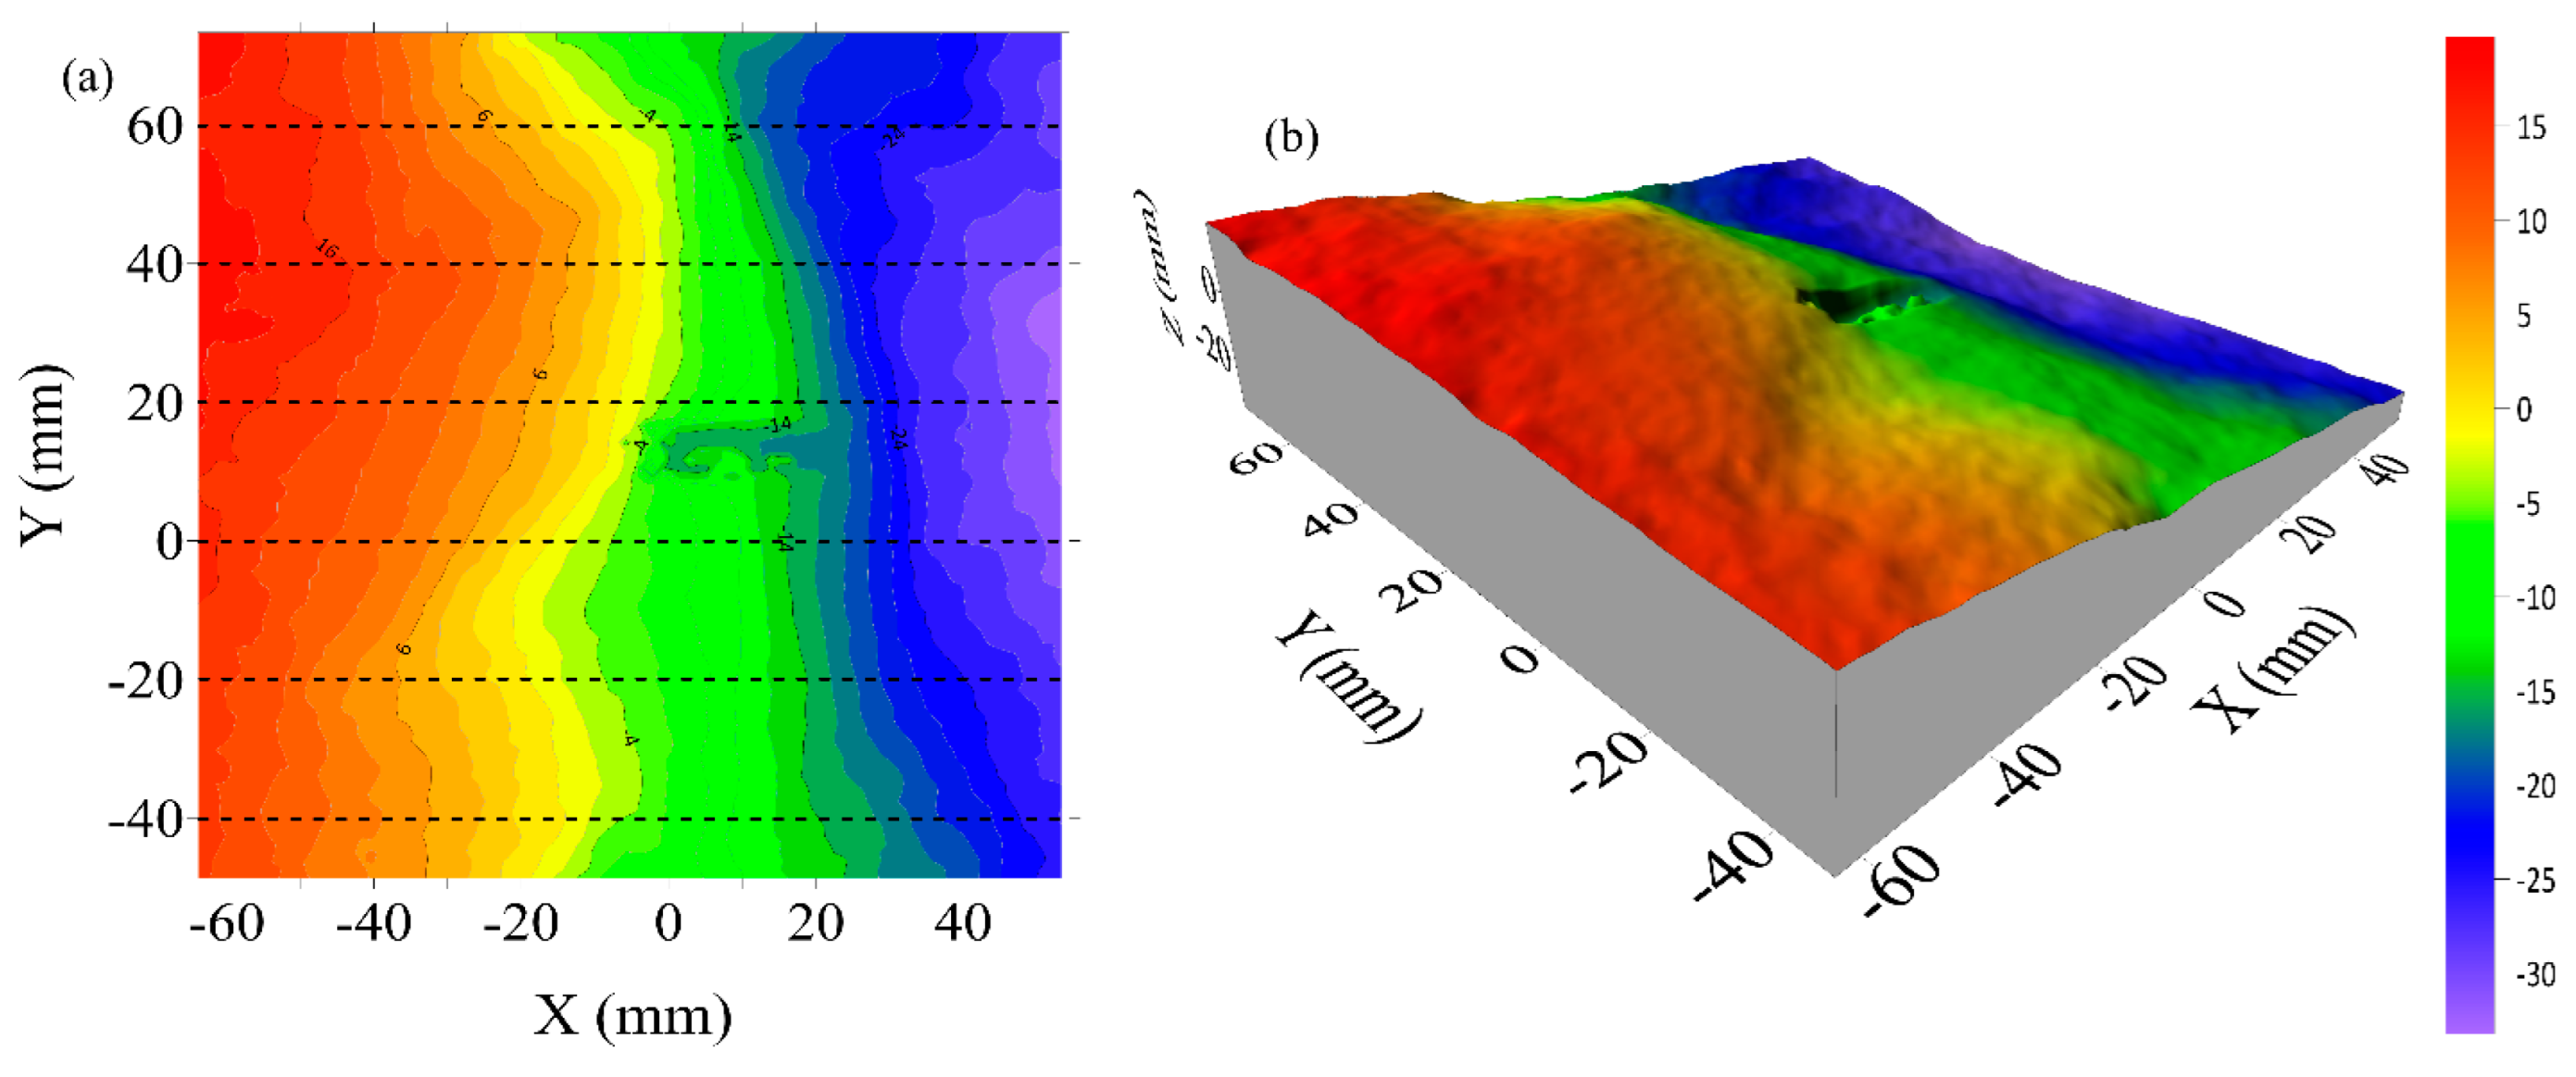
Figure 26.
Spectrum of injection rates (ml/min) falling under poor and optimal regions.
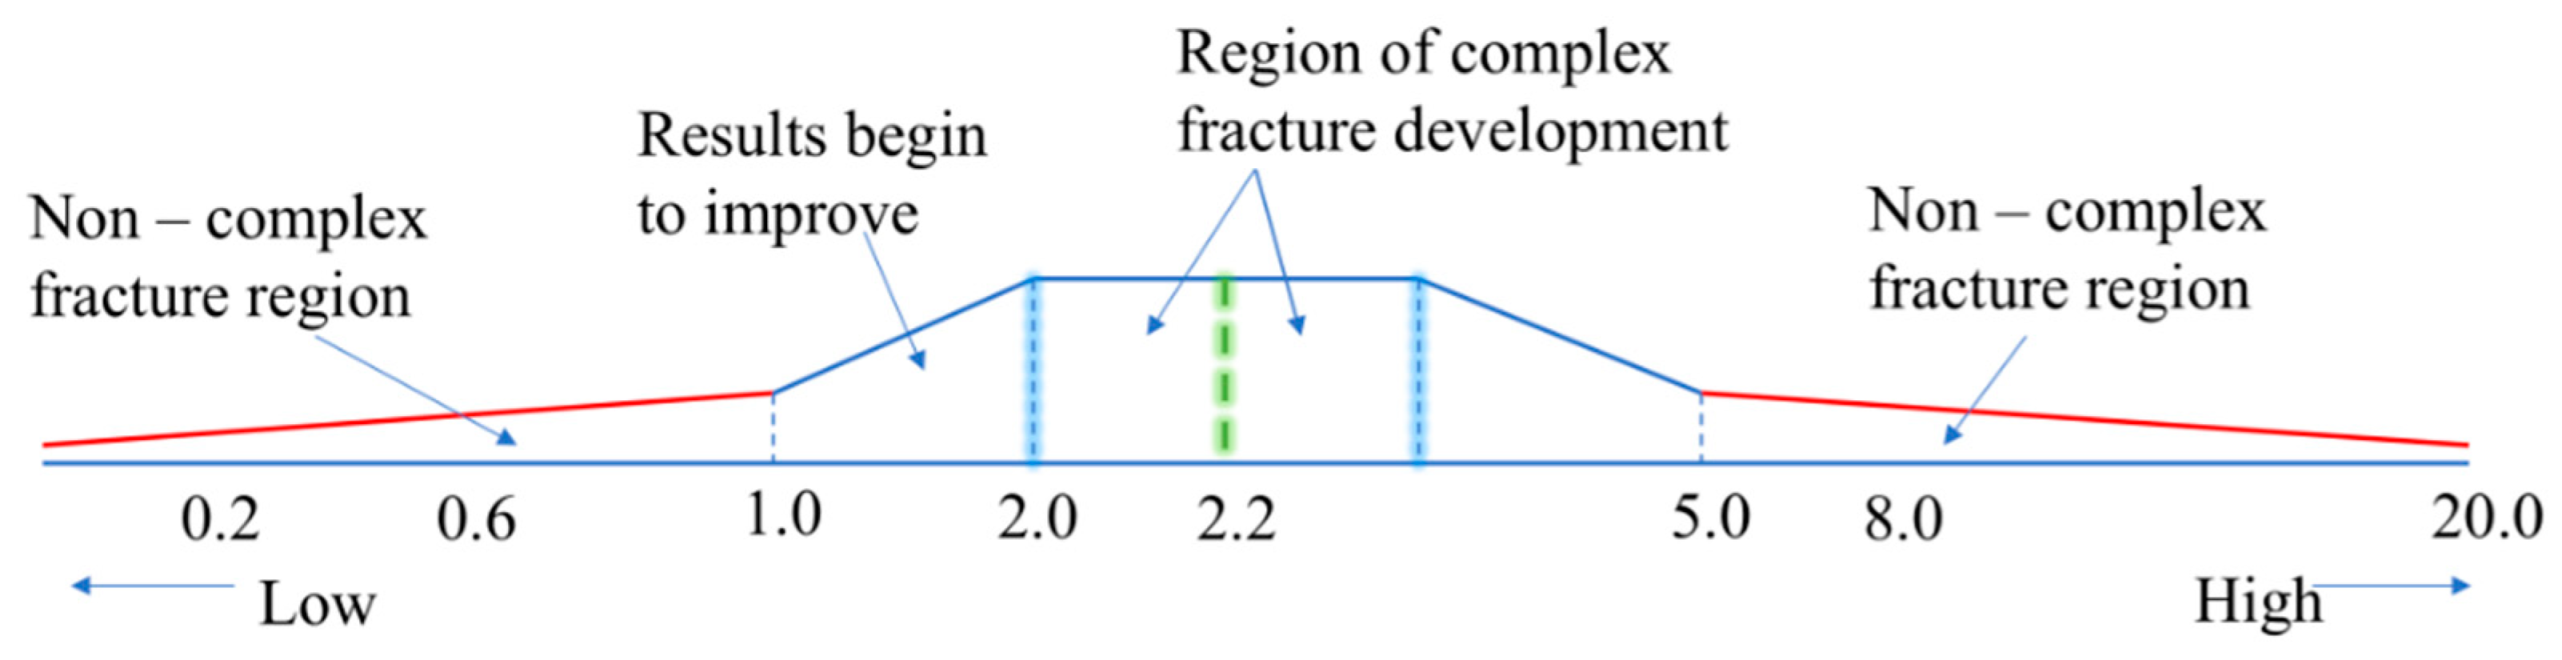
Figure 27.
Fluid infiltration time – injection rate (a) C5 (b) C6.
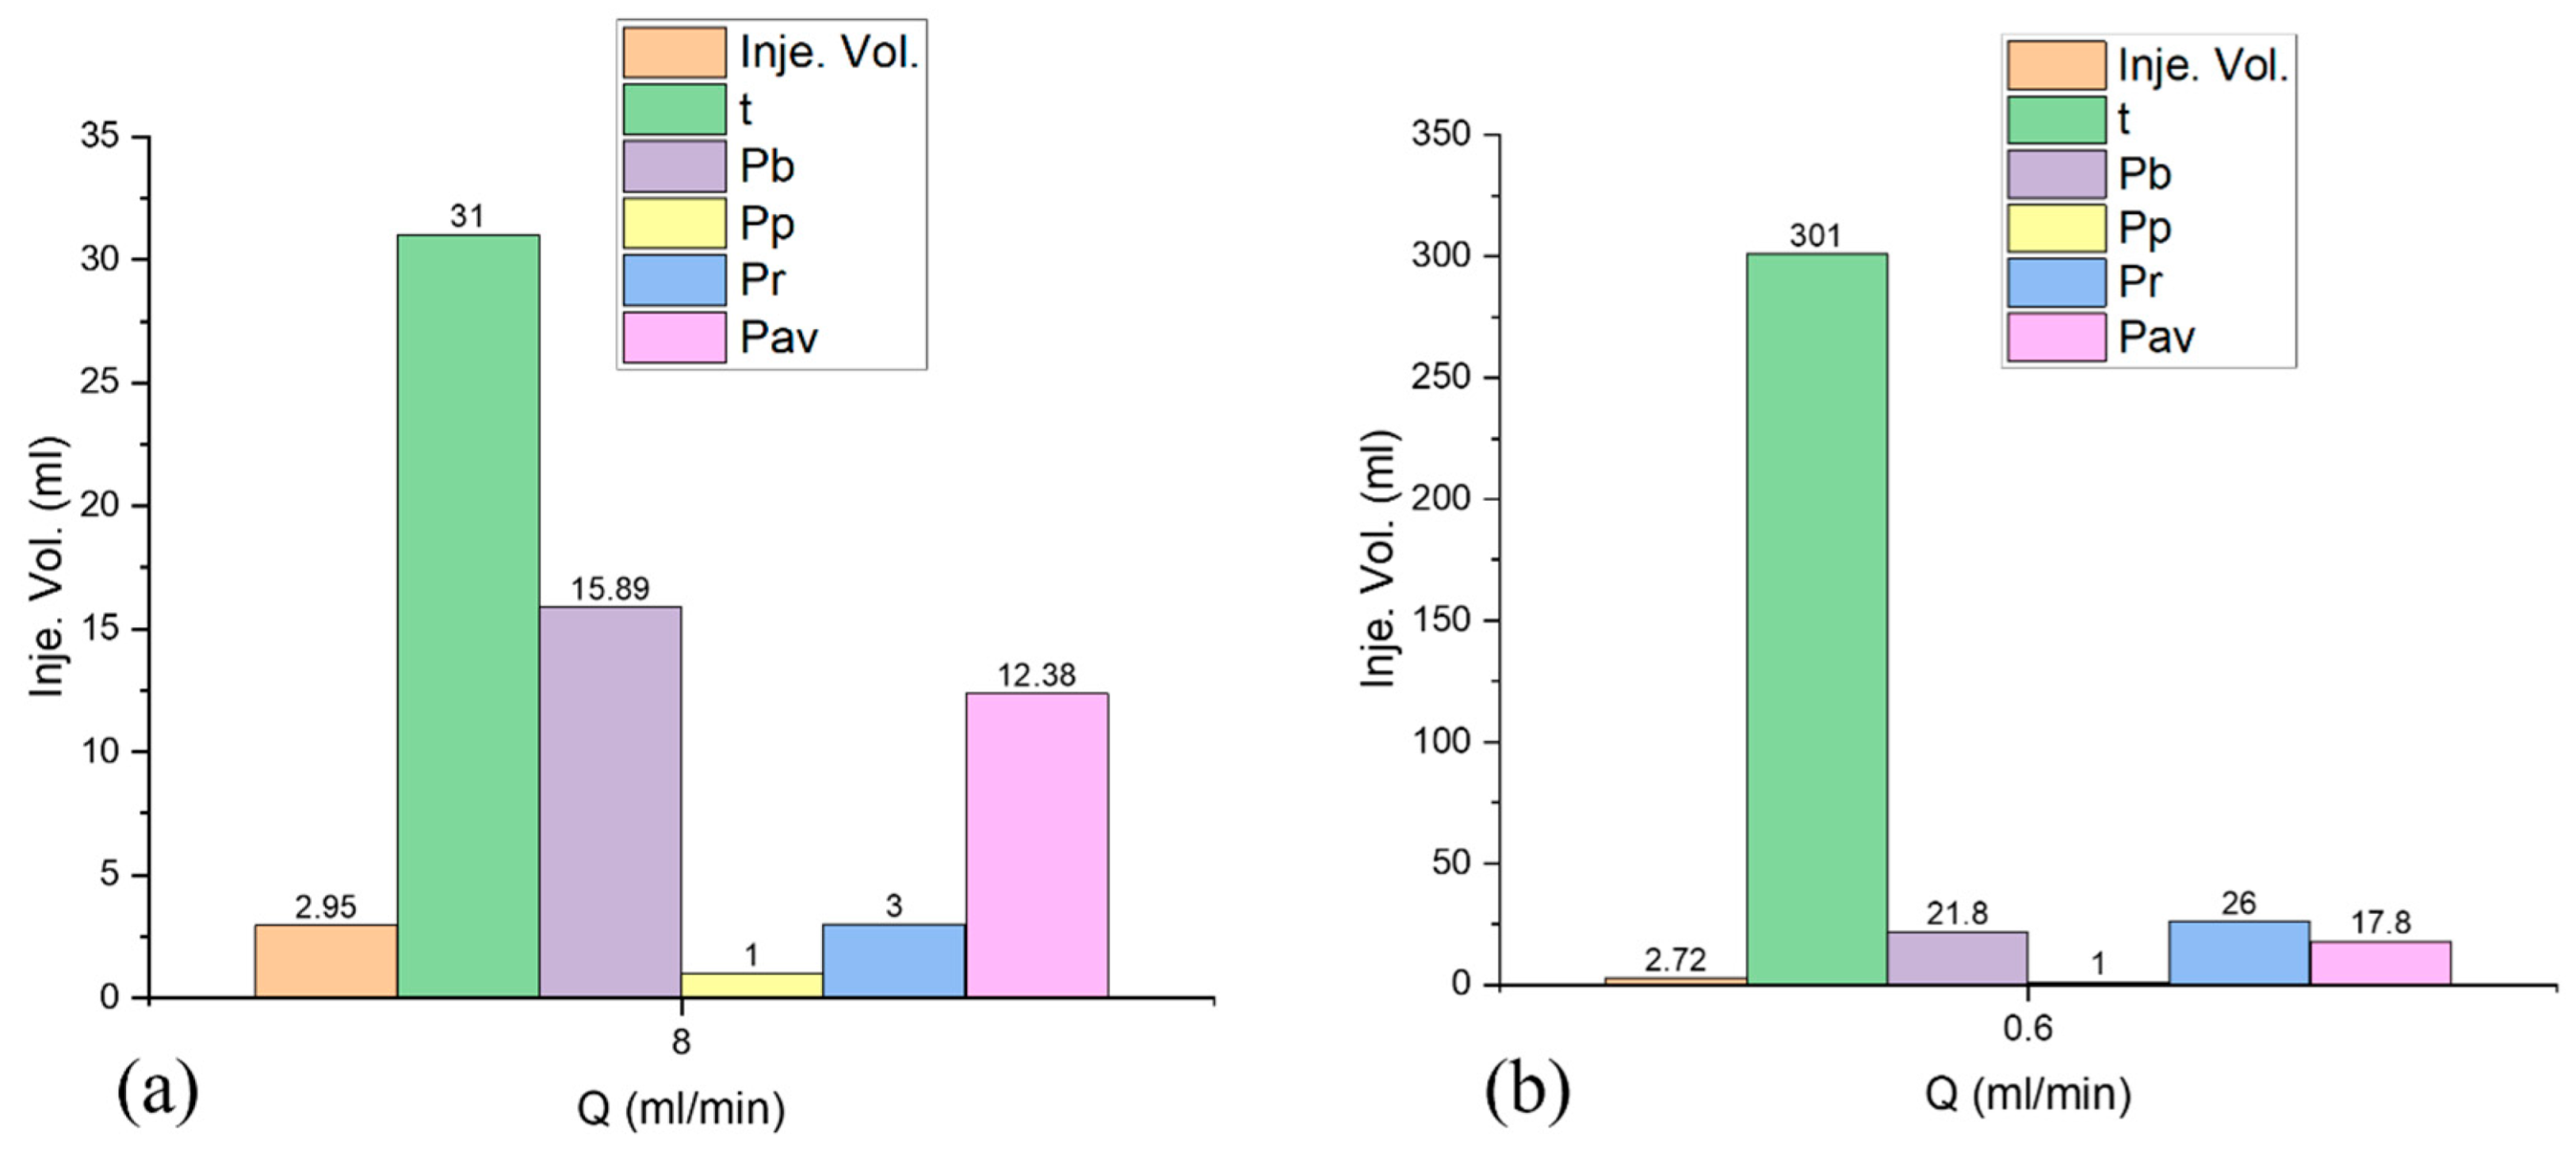
Figure 28.
Fluid infiltration time – injection rate (a) C10 (b) C12.
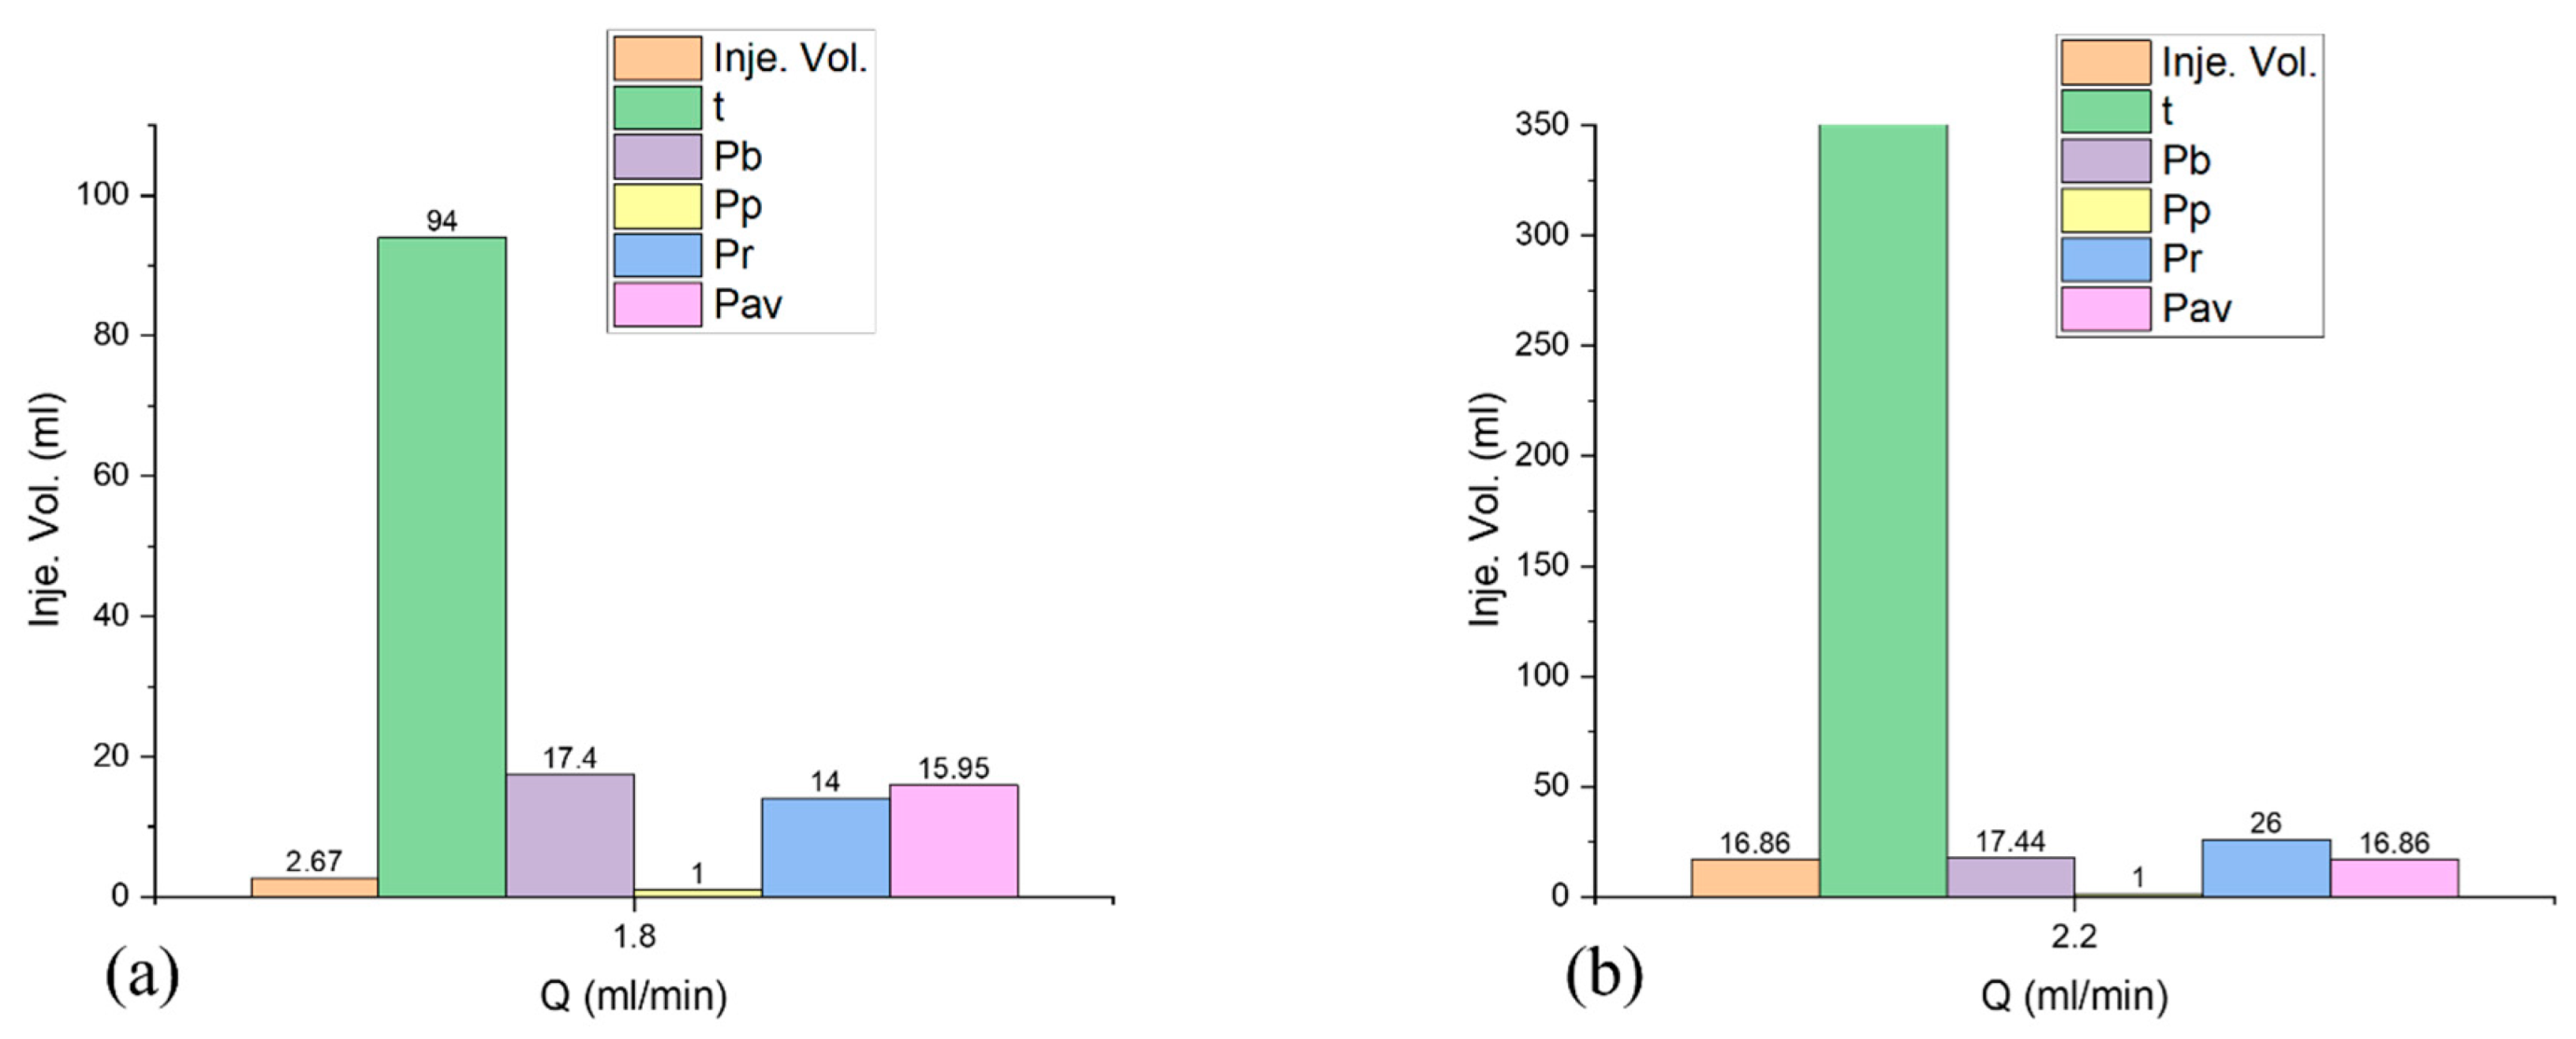
Figure 29.
Fluid infiltration time – injection rate (a) SST13 (b) Coal14.
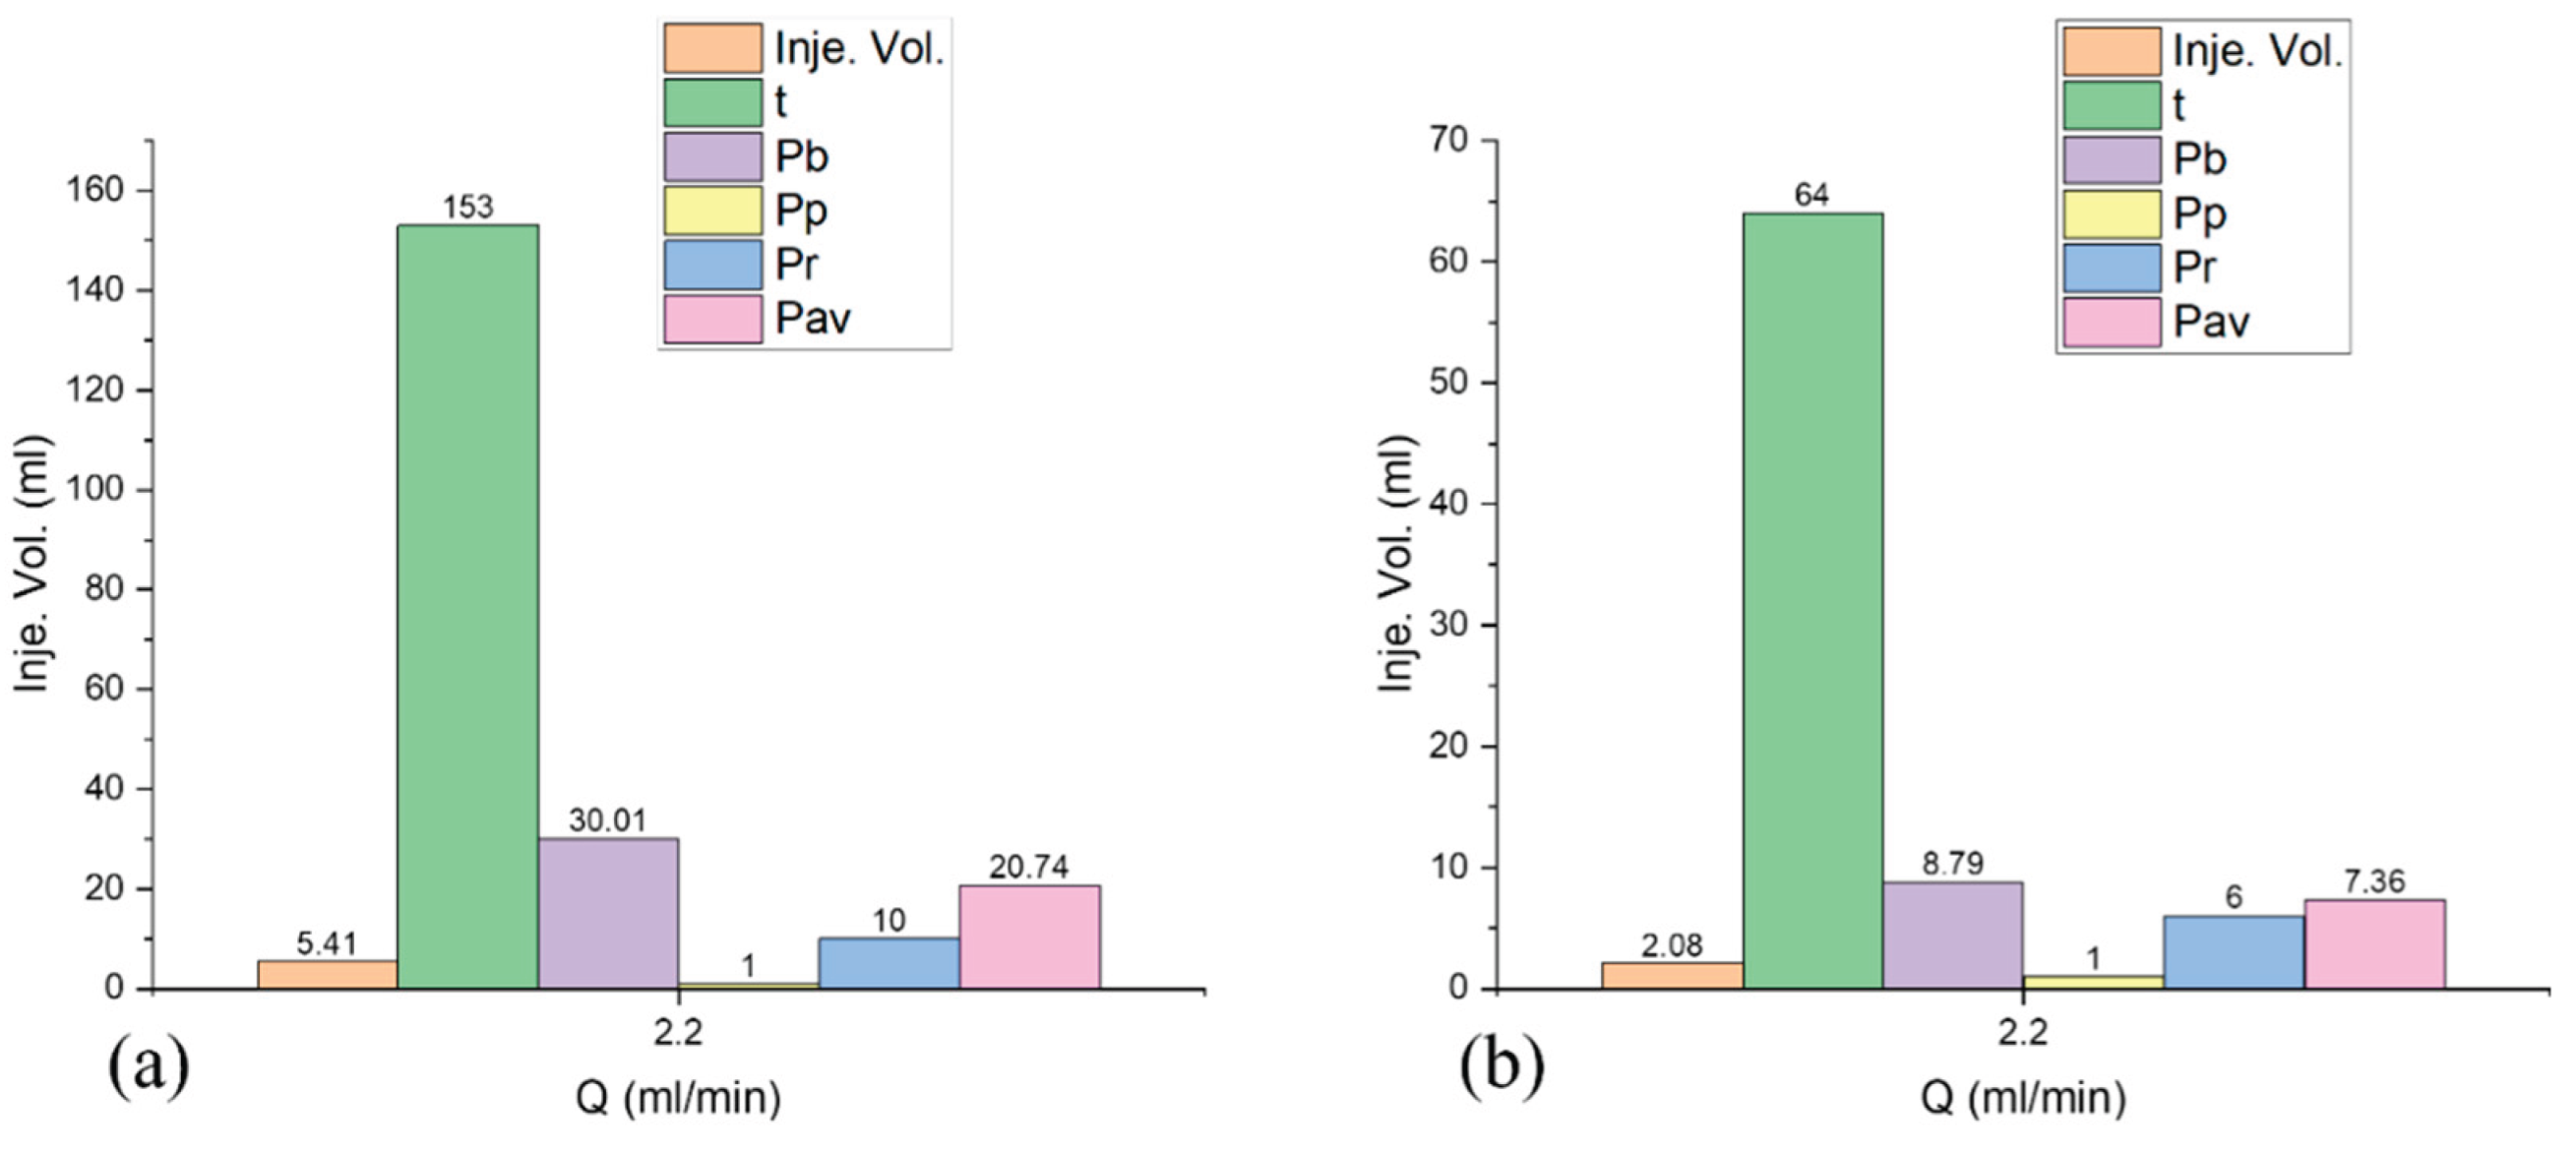

Table 1.
UCS results.
| Sample | A | B | Average | Standard |
| UCS value (MPa) | 30.43 | 25.56 | 28 | 20 - 50 |
Table 2.
Experimental conditions.
| Test No. | Q (ml/min) | In-situ stresses (MPa) | |||
|---|---|---|---|---|---|
| σv | σH | σh | |||
| C1 C2 C3 C4 C5 C6 C7 C8 C9 C10 C11 C12 SST13 Coal14 Coal15 |
2.0 8.0 0.2 2.0 8.0 0.6 8.0 20.0 5.0 1.8 2.2 2.2 2.2 2.2 1.0 |
25 25 25 25 25 25 25 25 25 25 25 25 25 12 12 |
20 20 20 20 20 20 20 20 20 20 20 20 20 8 8 |
15 15 15 15 15 15 15 15 15 15 15 15 15 5 5 |
|
Table 3.
Test results: - refer to Table 2 for experiment set conditions.
Table 3.
Test results: - refer to Table 2 for experiment set conditions.
| Test No. |
Injected V. before initial Pb (ml) | Injection time before initial Pb (s) | Initial Pb (MPa) | Period of peak pressure (s) | Pressure recovery time (s) | Average pressure after recovery (MPa) |
|---|---|---|---|---|---|---|
| C1 C2 C3 C4 C5 C6 C7 C8 C9 C10 C11 C12 SST13 Coal14 Coal15 |
4.96 | 149 | 30.44 | 8 | 15 | 27.70 |
| 7.68 | 41 | 29.82 | 1 | 5 | 26.29 | |
| 4.33 | 1612 | 29.68 | 3 | 76 | 27.78 | |
| 3.38 | 107 | 18.51 | 101 | Multiple | 19.79 | |
| 2.95 | 31 | 15.89 | 1 | 3 | 12.38 | |
| 2.72 | 301 | 21.8 | 1 | 26 | 17.80 | |
| 2.55 | 27 | 24.01 | 1 | 7 | 21.69 | |
| 2.86 | 15 | 23.54 | 1 | 2 | 18.19 | |
| 2.92 | 41 | 14.86 | 1 | 6 | 12.65 | |
| 2.67 | 94 | 17.4 | 1 | 14 | 15.95 | |
| 11.48 | 319 | 7.61 | 9 | 48 | 8.22 | |
| 16.86 | 460 | 17.44 | 1 | 29 | 16.86 | |
| 5.41 | 153 | 30.01 | 1 | 9 | 20.74 | |
| 2.08 | 64 | 8.79 | 1 | 6 | 7.36 | |
| 3.45 | 210 | - | - | - | - |
Disclaimer/Publisher’s Note: The statements, opinions and data contained in all publications are solely those of the individual author(s) and contributor(s) and not of MDPI and/or the editor(s). MDPI and/or the editor(s) disclaim responsibility for any injury to people or property resulting from any ideas, methods, instructions or products referred to in the content. |
© 2025 by the authors. Licensee MDPI, Basel, Switzerland. This article is an open access article distributed under the terms and conditions of the Creative Commons Attribution (CC BY) license (http://creativecommons.org/licenses/by/4.0/).
Copyright: This open access article is published under a Creative Commons CC BY 4.0 license, which permit the free download, distribution, and reuse, provided that the author and preprint are cited in any reuse.


