
Submitted:
08 December 2025
Posted:
10 December 2025
You are already at the latest version
Abstract
Recurrent depressive disorder (RDD) and bipolar disorder (BD) are the most common affective disorders worldwide. However, the pathogenesis of these disorders remains far from understood. Macromolecular proton fraction (MPF) mapping is a sensitive and specific quantitative MRI method for the assessment of brain tissue myelination, but its clinical value for affective disorders remains unknown. This cross-sectional study employed fast MPF mapping on a 1.5T MRI scanner using single-point synthetic reference method to investigate myelin abnormalities in white matter of RDD and BD patients. ANOVA revealed a significant main effect of the group (RDD vs. BD vs. 2 age-matched control groups; F (3.76) =7.42, p<0.001, η²=0.227). MPF values were significantly reduced in RDD versus BD patients (p<0.001). BD showed elevated MPF compared to controls (p=0.01). MPF levels showed significant weak-to-moderate correlations with clinical scales of affective disorders. These findings demonstrate divergent cerebral myelination patterns—hypomyelination in RDDversus an increased myelin content in BD. In conclusion, MPF mapping demonstrated a promise as a marker of myelin content changes in affective disorder.
Keywords:
macromolecular proton fraction
; recurrent depressive disorder
; bipolar disorder
; neuroimaging markers
; myelin
1. Introduction
Affective disorders, such as recurrent depressive disorder (RDD) and bipolar disorder (BD), are highly prevalent and functionally debilitating conditions associated with substantial suicide risk and significant societal burden [1]. Despite their high prevalence, a comprehensive pathophysiological understanding of these disorders remains elusive, and validated diagnostic biomarkers are still lacking. Neuroinflammation is commonly viewed as a potential pathological substrate of neurotransmitter dysregulation in affective disorders, particularly in major depressive disorder (MDD) and BD [2,3]. Myelin is a known target of inflammatory response in the central nervous system (CNS) [4]. Postmortem pathological studies reported a decrease in the myelin content [5], reduced expression of myelin-related genes [6], and oligodendroglia apoptosis [7] in white matter (WM) of MDD and BD patients. Recent magnetic resonance imaging (MRI) studies have identified structural brain alterations in patients with depression, including microstructural WM differences suggestive of reduced myelin density [8,9]. Diffusion tensor imaging (DTI) in BD patients have revealed widespread increases in radial diffusivity (RD), which may indicate altered myelination in this disorder [10].
Several other neuroimaging methods including traditional magnetization transfer (MT) imaging [11,12,13,14], inhomogeneous MT imaging [15,16,17], and R1 mapping [18] demonstrated a reduction in quantitative MRI parameters consistent with demyelination in MDD and BD. However, DTI metrics provide only indirect proxies of myelin content [19,20], underscoring the need for more specific and -sensitive MRI techniques for the myelin assessment. The lack of specificity to myelin is also a key limitation of traditional MT imaging and R1 mapping [21,22]. A newer approach, inhomogeneous MT imaging [15,16,17], improves specificity to myelin but lacks the capability of absolute quantitation enabling comparison between different imaging platforms and magnetic field strengths. This technique also has limited availability due to need for a specialized acquisition sequence, which is currently not implemented on most clinical MRI systems.
The fast macromolecular proton fraction (MPF) mapping method [23,24] provides a clinical-ready quantitative myelin imaging approach with a short acquisition time, high reproducibility, and easy implementation based on routine MRI equipment without modification of original manufacturers’ pulse sequences [24]. MPF represents a key biophysical parameter characterizing the magnetization transfer effect within a two-pool model, quantifying the relative abundance of protons with restricted molecular motion that engage in magnetic cross-relaxation with free water protons. Substantial evidence from animal histologic studies has established MPF as a highly specific myelin biomarker strongly correlated with myelin content in neural tissues [24]. Fast MPF mapping demonstrated sensitivity to myelin content changes in the clinical studies of multiple sclerosis [21,25], mild traumatic brain injury [26], Parkinson disease [27], post-COVID depression [28], and schizophrenia [29]. The last study [29] identified global microscopic myelin deficiency in both white and gray matter in schizophrenia patients, which was significantly associated with the disease duration and negative symptoms. Collectively, the above studies demonstrate high sensitivity of the method for detection of statistically significant intergroup differences within a relatively narrow value range and provide the rationale for applications of the MPF mapping methodology to study myelin abnormalities in affective disorders. The aim of this study was to evaluate potential changes in WM myelination in patients with BD and RDD using fast MFP mapping and to examine relationships between myelination and clinical manifestation of these affective disorders.
2. Materials and Methods
2.1. Subjects
A total of 80 participants were examined in this cross-sectional study. The formation of study groups and clinical confirmation of diagnoses of patients with affective disorders was performed by certified physicians of the Affective States Department of Mental Health Research Institute of Tomsk National Research Medical Center during the period from September 2023 to September 2025. The study included 44 patients, of whom 21 had RDD and 23 had BD. The diagnosis was established according to the ICD-10 classification.
The criteria for inclusion in the group of patients were the presence of an established diagnosis, age from 18 to 65 years, the absence of acute somatic pathology, the absence of contraindications of MRI, and the capability to sign the in-formed consent form. The control group consisted of mentally and somatically healthy individuals without any acute or chronic illnesses and having no contraindications of MRI. The healthy individuals were divided into two subgroups, corresponding to the age ranges of the patient groups. This allowed for a more accurate comparison between the groups of patients and controls with similar age distributions and reduced the influence of age on possible differences in MPF, which is known from the literature [30,31]. The characteristics of the study groups by gender and age are presented in Table 1.
This study was conducted according to the guidelines of the Declaration of Helsinki and approved by the Ethical Committee of Mental Health Research Institute at Tomsk National Research Medical Center of the Russian Academy of Sciences No. 163 from 12 May 2023 (No. 163/3.2023).
The distribution of clinical presentations in BD patients was as follows: current episode of mixed nature –18 participants; current episode of mild or moderate depression – 4 participants; current episode of severe depression without psychotic symptoms –1 participant. Thus, the BD group mainly consisted of patients with a current episode of a mixed nature. In the RDD group, patients were distributed as follows: remission –1 patient; current episode of moderate severity –19 patients; current episode of severe depression without psychotic symptoms –1 patient. Thus, in the RDD, patients with a moderate current episode of depression predominated. The clinical study was conducted using a set of standardized scales and questionnaires before the start of therapy upon admission to the hospital. To assess the severity of current depression, our study used the 24-item version of the SIGH-SAD scale, which includes 17 items from the Hamilton Depression Rating Scale (Structured Interview Guide for the Hamilton Depression Rating Scale, Seasonal Affective Disorders) [32]. A score for typical depressive symptoms, a score for atypical depressive symptoms, and a total score were calculated. Severity was assessed using the Clinical Global Impression Scale (CGI) subscale, CGI-S (Clinical Global Impression – Severity). The Bipolar Spectrum Diagnostic Scale (BSDS) was used to screen patients with bipolar disorder. According to the BSDS, all our patients had a high to moderate probability of bipolar dis-order. All psychometric assessments were conducted upon admission to the clinic, before treatment was prescribed.
2.2. MRI Data Acquisition
All participants underwent non-contrast MRI of the brain using a 1.5T scanner (Ingenia Evolution, Philips, Netherlands). The imaging protocol included both standard clinical sequences and a specialized fast MPF mapping protocol. The MPF mapping protocol was implemented based on a standard manufacturer's 3D spoiled gradient-echo pulse sequence according to the single-point synthetic reference method [33]. This technique reconstructs MPF maps from three source images with different contrast weightings—magnetization transfer (MT), T1, and proton density (PD)—through voxel-wise iterative fit of the pulsed MT model. All MPF mapping sequences were acquired in the axial plane with in-plane resolution = 1.25x1.51 mm, slice thickness = 3 mm (3D field-of-view = 240x240x240 mm, matrix =192x159x80), TE = 4.6 ms, and receiver bandwidth = 179 Hz/pixel. The specific acquisition parameters for each sequence were as follows:
- -
- MT-weighted: TR = 32 ms, flip angle = 12°, acquisition time = 4 min 11 s
- -
- T1-weighted: TR = 20 ms, flip angle = 25°, acquisition time = 2 min 37 s
- -
- PD-weighted: TR = 20 ms, flip angle = 4°, acquisition time = 2 min 37 s
For MT-weighted imaging, a standard manufacturer's off-resonance Gaussian saturation pulse was applied with the following parameters: frequency offset = 1.1 kHz, effective flip angle = 520°, and pulse duration = 15 ms.
The standard clinical imaging sequences included 3D T1-weighted fast spin-echo (slice thickness = 1.1 mm, TR = 600 ms, TE = 27.7 ms, sagittal orientation); 2D T2-weighted fast spin-echo (slice thickness = 5 mm, TR = 5331 ms, TE = 110 ms, axial orientation); and 3D T2-weighted FLAIR (slice thickness = 1.1 mm, TR = 4800 ms, TE = 314.5 ms, sagittal orientation).
2.3. Image Processing and MPF Map Reconstruction
Routine clinical images were reviewed by a board-certified radiologist for the presence of focal, diffuse, or structural abnormalities. MPF maps were reconstructed using custom C++ language software (available at https://www.macromolecularmri.org/) based on the single-point synthetic reference algorithm [23,33]. The two-pool model parameter constraints were set according to the earlier implementations for 1.5 T [29,34]: cross-relaxation rate constant R =19 s−1; T2 of bound macromolecular protons, T2B = 10 μs; and the product of the relaxation rate R1 and T2 of free water protons, R1T2F = 0.055. No correction of B0 and B1 field inhomogeneities was performed, because the effect of these corrections at 1.5T is negligibly small [35]. An example MPF map obtained using the above acquisition and processing protocol is presented in Fig. 1a. The resulting 3D MPF maps were post-processed using FSL software (FMRIB Software Library v. 6.0; Oxford Centre for Functional Magnetic Resonance Imaging of the Brain, University of Oxford, Oxford, England; available at www.fmrib.ox.ac.uk/fsl/). The post-processing steps included skull stripping using the brain-extraction tool (BET) [36] and tissue segmentation using the fast automated segmentation tool (FAST) [37] under the single-channel three-class approach with the Markov random field parameter 0.1 and four iterations for bias field removal. The resulting WM probability maps (exemplified in Fig. 1b) were binarized at the probability threshold of 0.9 to obtain conservative WM masks for MPF quantitation.
2.4. Statistical Analysis
All statistical analyses were conducted using Statistica 10 (StatSoft, USA). Normality of residuals in parametric analyses (analysis of variance (ANOVA) or regression) was assessed using the Shapiro-Wilk test. The absence of significant deviations from normal distribution justified the use of parametric methods where appropriate. Clinical ordinal scores were compared between BD and RDD patient groups using the Mann-Whitney U test. Group comparisons of MPF values between patients with BD, RDD, and their respective control groups were performed using one-way analysis of variance (ANOVA) with the participant group as an independent factor. Post-hoc pairwise comparisons were conducted using Tukey's HSD test. Relationships between MPF and clinical variables (age and disease duration) were assessed using Pearson's correlation coefficient (r). Nonparametric Spearman correlations coefficient (ρ) was used to analyze associations between MPF and ordinal scores on clinical scales. In all analyses, statistical significance was set at p < 0.05.
3. Results
3.1. Psychometric Evaluation
The severity of depressive symptoms is assessed quantitatively using the SIGH-SAD scale, which is calculated using the sum of scores for 17 typical and 7 atypical symptom items. These scores are categorized as mild (scores from 8 to 16), moderate (scores from 17 to 23), and severe (scores equal to or greater than 24).
In the BD group, moderate (33%) and mild (33%) depressive symptoms were predominant. 19% of patients scored less than 8 points and thus did not exhibit depressive symptoms. The proportion of individuals with severe depressive symptoms was 15%.
In the RDD group, half of the patients (50%) demonstrated moderate depressive symptoms, while the proportion of patients with severe depression was 45%, and only 5% exhibited mild depressive symptoms.
According to the atypical symptom scale, the severity of symptoms in both groups did not show significant differences (Table 2). However, a characteristic feature of our RDD group was that 35% of patients showed relatively high scores on atypical symptoms.
The severity of the patients' condition was assessed using the "Severity" subscale of the Clinical Global Impression (CGI), which allows us to assess the severity of the disease before the start of therapy. The median scores on this scale in the study groups are presented in Table 2 and indicate that the condition of patients in both groups is characterized predominantly as "Moderate Disorder" and does not demonstrate reliable differences (p = 0.05).
The distribution of BD patients by S-CGI score was as follows: 5% - mild disorder; 43% - moderate disorder; 47% - severe disorder; 5% - very severe disorder. For patients with RDD, the following distribution was observed: 10% - mild disorder; 70% - moderate disorder; 5% - severe disorder; 10% - very severe disorder.
A quantitative assessment of the presence of BD symptoms was conducted using the BSDS scale. It was shown that upon admission to the hospital, BD patients demonstrated the highest probability of having this disorder (90%) (10% had a moderate probability of BD) and significantly differed in this indicator from patients with RDD (p = 0.000) (Table 2). In the RDD group, 15% of patients had a high probability of BD, 10% had a moderate probability, and the vast majority (75%) showed a low probability of BD.
Group comparisons (Table 2) demonstrated that before the start of therapy, the severity of depressive symptoms determined by the total score on the SIGH-SAD scalewas significantly higher in patients with RDD (p = 0.003). Furthermore, a significant difference was observed between the groups in the severity of typical depressive symptoms (p = 0.002), while the severity of atypical symptoms did not differ significantly between the compared groups (p = 0.053). Thus, Table 2 clearly demonstrates the accuracy of the clinically established diagnoses of patients in the study groups.
3.2. MRI and MPF Analysis
An example of the maps used in the work is shown in Figure 1.
Clinical MRI results in all participants were radiologically unremarkable. The one-way ANOVA results for WM MPF values are presented in Table 3, and visual representation of group-wise MPF distributions is provided in Figure 2. ANOVA revealed a statistically significant main effect of group membership on WM MPF. (The effect size was large (η² = 0.227), indicating that approximately 23% of the variance in MPF was explained by the group differences. The observed statistical power was 0.98, demonstrating a 98% probability that the analysis correctly identified existing intergroup differences and confirming adequate sample size for this study design.
The complete ANOVA results are presented in Table 3, with visual representation of group-wise MPF distributions provided in Figure 2
Post-hoc analysis using Tukey's HSD test identified statistically significant pairwise differences between the RDD and BD groups, and between the BD patient group and their corresponding healthy controls (p < 0.05). Conversely, no statistically significant differences were found between the two control groups (for RDD and BD), despite initial significant age differences during participant recruitment. Detailed results of the post-hoc comparisons are summarized in Table 4
The Pearson correlation analysis demonstrated no significant correlation between white matter MPF and age (r = -0.15, p > 0.05) as well as no correlation was observed between white matter MPF and illness duration (r = -0.20, p > 0.05).
In addition, a correlation analysis of the MPF values with the numerical indicators of the clinical scales was performed in the entire sample of examined patients without separation into groups. In our study, the SIGH-SAD and CGI clinical scales were used to assess the severity of depressive symptoms and illness severity, and the BSDS was used to confirm the presence of bipolar spectrum disorders. These measures are qualitative traits, quantified through ranking. Under these conditions, the Spearman correlation coefficient becomes more appropriate, since, unlike the Pearson correlation coefficient, the Spearman correlation coefficient allows for the analysis of relationships between values represented by rank values or scores
Significant negative correlations were identified between WM MPF and the SIGH-SAD scale for both atypical (ρ = -0.379; p = 0.009) and general symptoms (ρ = -0.287; p = 0.045)(Figure 3a,b). MPF also positively correlated with BSDS scale (ρ = 0.346; p = 0.017) (Fig. 3c).
4. Discussion
This study presents the first application of the fast MPF mapping method for the quantitative assessment of myelination in patients with RDD and BD. A significant reduction in WM myelination in RDD patients is consistent with previous findings in depressive disorders including MDD [5,8,9,11,12,16,17,18] and post-COVID depression [28]. It is important to note that only the last study [28] relied on MPF as a myelin marker and reported a global decrease in MPF across all WM [28]. Investigations based on other methods are in line with these findings. Particularly, DTI similarly showed widespread fractional anisotropy (FA) reductions in WM of depression patients with childhood trauma anamnesis, confirming global alterations in WM connectivity [38]. A comparable FA study in MDD patients identified microstructural impairments in three of seven WM tracts: reduced FA in the genu of the corpus callosumshowing negative correlation with depression severity; and reduced FA with axial diffusivity (AD) alterations in both superior and inferior longitudinal fasciculi [39]. Furthermore, comparative analysis between patients experiencing current depressive episodes and those in remission revealed more extensive WM abnormalities during acute phases, involving the left insula, left middle occipital gyrus, right thalamus, left pallidum, and left precuneus. During remission, only the left insula maintained significant FA reduction, suggesting global WM impairment specifically during active depressive states [40]. Notably, a comprehensive meta-analysis of DTI data from 5,171 subjects demonstrated significant reductions in global WM integrity as measured by FA [41]. Also in agreement with our observations, the findings consistent with myelin loss in depression were reported in earlier magnetization transfer [11,12,13,14,15,16,17] and R1 mapping studies [18].
Correlation analysis in our current study revealed no significant linear association between myelination measures and disease duration, which is known from the literature [30,31], also contrasting with an earlier prospective case-control cohort study utilizing DWI that identified a significant diagnosis time interaction, indicating accelerated decline in superior longitudinal fasciculus (SLF) integrity among MDD patients compared to healthy controls. [42]. This discrepancy underscores the necessity for expanded sample sizes in future studies to enhance analytical precision. Our comparative analysis of cerebral WM MPF values revealed substantial differences between BD and RDD groups despite clinical similarities in disease onset that often contribute to BD underdiagnosis. These findings align well with earlier DTI investigations of microstructural WM differences between unipolar depression (n = 562) and depressed patients later converting to BD (n = 83) [43].
Our unexpected finding is an elevated cerebral WM MPF in BD patients compared to both matched controls and RDD patients. This appears to contradict an earlier neuroimaging studies reporting a decrease in MRI parameters associated with myelin in both patient groups [8,9,10,11,12,13,14,15,16,17,18,19,20,21,22,23,24,25,26,27,29,44,45]. The existing literature presents conflicting evidence, reflecting the pathophysiological complexity of BD and its inherent clinical heterogeneity. Supporting our observations, a resting-state fMRI study of BD patients during depressive episodes revealed enhanced functional connectivity between the superficial temporofrontal network and both cerebellar and pre/post-central networks, potentially indicating functional tract consolidation in these regions. Conversely, a whole-brain voxel-based multicomponent diffusion MRI study employing multiple diffusion metrics identified lower FA in BD patients, but did not find differences in MPF [46]. As such, neuroimaging findings in BD remain inconsistent across studies. A multicenter investigation of neurodevelopmental BD subtypes based on cortical folding patterns reported elevated local sulcal indices (l-SIs) in the right prefrontal dorsolateral region in early-onset BD, but reduced l-SI in the left superior parietal cortex in psychotic BD, though no significant differences emerged between healthy controls and the entire patient cohort [47]. Another possible explanation of an increased MPF in BD may be related to a relatively young age of our BD group and a difference in the brain maturation rates between control subjects and BD patients. This hypothesis is supported by a recent DTI study [48], which reported an earlier peak of brain maturation in BD (27-29 years) as compared to healthy controls (32-36 years). If a similar trend is valid for MPF, it may explain greater MPF values in BD relative to age-matched controls given the fact that the mean age of our groups is 24-25 years. Of note, this study [48] also did not identify differences between BP and controls in any of the DTI metrics. Consequently, given a limited amount of MPF data in BD patients, contradictory DTI and functional MRI findings, and heterogeneous literature reports, we assert that pathogenetic mechanisms underlying myelination abnormalities remain inadequately characterized in BD compared to RDD. This area warrants more extensive investigation with careful consideration of confounding factors including medication effects and disease subtypes, which have been previously established as significant sources of variability [49].
5. Conclusions
This study establishes distinct white matter myelination patterns in affective disorders, demonstrating a reduced myelin content in RDD but paradoxically elevated myelination in BD. These differential myelination profiles may suggest unique neurobiological mechanisms underlying these conditions. The findings of this study position MPF as a promising biomarker capable of detecting subtle changes in myelination and underscore the necessity for multimodal approaches in future neuroimaging studies of mood disorders.
Author Contributions
Conceptualization, V.Y. and L.S.; methodology, V.Y.; software, V.Y.; validation, S.G., V.Y. and L.S.; formal analysis, S.G and A.S..; working with patients, E.EX.; resources, O.B.; data curation, E.E.; writing—original draft preparation, S.G.; writing—review and editing, L.S and V.Y..; visualization, O.B.; supervision, L.S.; project administration, L.S.; funding acquisition, L.S. All authors have read and agreed to the published version of the manuscript
Funding
This work was supported by the Russian Science Foundation (RSF), grant number 23-75-00023, “Search for new molecular mechanisms of affective disorders for the development of diagnostic and prognostic methods using proteomic approaches and neuroimaging.” Software for MPF map reconstruction was distributed under the support of the National Institutes of Health High-Impact Neuroscience Research Resource grant R24NS104098.
Institutional Review Board Statement
This study was conducted according to the guidelines of the Declaration of Helsinki and approved by the Ethical Committee of Mental Health Research Institute at Tomsk National Research Medical Center of the Russian Academy of Sciences No. 163 from 12 May 2023 (No. 163/3.2023).
Informed Consent Statement
Informed consent was obtained from all subjects involved in the study.” OR “Patient consent was waived due to REASON (please provide a detailed justification
Data Availability Statement
The data presented in this study are available on request from the corresponding author.
Acknowledgments
The authors express their sincere gratitude to the physicians and medical staff of the Affective States Department of the Mental Health Research Institute of the Tomsk National Research Medical Center of the Russian Academy of Sciences for their professionalism, attentiveness, and comprehensive support throughout the study. The high qualifications and dedication of the department's staff significantly contributed to the successful completion of this study.
Conflicts of Interest
The authors declare no conflicts of interest.
Abbreviations
The following abbreviations are used in this manuscript:
| AD | Axial diffusivity |
| ANOVA | One-way analysis of variance |
| BD | Bipolar disorder |
| BSDS | Bipolar Spectrum Diagnostic Scale |
| CGI | Clinical Global Impression Scale |
| CGI-S | Clinical Global Impression – Severity |
| CNS | The central nervous system |
| DTI | Diffusion tensor imaging |
| FA | Fractional anisotropy |
| GenuCC | Genu of the corpus callosum |
| ICD-10 | International Statistical Classification of Diseases |
| l-SIs | Local sulcal indices |
| MDD | Major depressive disorder |
| MPF | Macromolecular proton fraction |
| MRI | Magnetic resonance imaging |
| MT | Magnetization transfer |
| PD | Proton density |
| R1 | Longitudinal relaxation rate |
| RD | Radial diffusivity |
| RDD | Recurrent depressive disorder |
| SIGH-SAD | Structured Interview Guide for the Hamilton Depression Rating Scale, Seasonal Affective Disorder Version |
| SLF | Superior longitudinal fasciculus |
| T1 | Longitudinal relaxation time |
| T2 | Transverse relaxation time |
| TE | Echo time |
| TR | Time of Repetition |
| Tukey's HSD test | Tukey's HSD Honest Significant Difference test |
| WM | Cerebral white matter |
References
- Malhi, G.S.; et al. Default mode dysfunction underpins suicidal activity in mood disorders. Psychol. Med. 2020, 50, 1214–1223. [Google Scholar] [CrossRef] [PubMed]
- McNamara, R.K.; Lotrich, F.E. Elevated immune-inflammatory signaling in mood disorders: a new therapeutic target? Expert Rev. Neurother. 2012, 12, 1143–1161. [Google Scholar] [CrossRef] [PubMed]
- Lima, D.D.; Cyrino, L.A.R.; Ferreira, G.K.; Magro, D.D.D.; Calegari, C.R.; Cabral, H.; Cavichioli, N.; Ramos, S.A.; Ullmann, O.M.; Mayer, Y.; et al. Neuroinflammation and neuroprogression produced by oxidative stress in euthymic bipolar patients with different onset disease times. Sci. Rep. 2022, 12, 16742. [Google Scholar] [CrossRef] [PubMed]
- Murayama, R.; Cai, Y.; Nakamura, H.; Hashimoto, K. Demyelination in psychiatric and neurological disorders: Mechanisms, clinical impact, and novel therapeutic strategies. Neurosci. Biobehav. Rev. 2025, 174, 106209. [Google Scholar] [CrossRef]
- Regenold, W.T.; Phatak, P.; Marano, C.M.; Gearhart, L.; Viens, C.H.; Hisley, K.C. Myelin staining of deep white matter in the dorsolateral prefrontal cortex in schizophrenia, bipolar disorder, and unipolar major depression. Psychiatry Res. 2007, 151, 179–188. [Google Scholar] [CrossRef]
- Tkachev, D.; Mimmack, M.L.; Ryan, M.M.; et al. Oligodendrocyte dysfunction in schizophrenia and bipolar disorder. Lancet 2003, 362, 798–805. [Google Scholar] [CrossRef]
- Uranova, N.; Orlovskaya, D.; Vikhreva, O.; Zimina, I.; Kolomeets, N.; Vostrikov, V.; Rachmanova, V. Electron microscopy of oligodendroglia in severe mental illness. Brain Res. Bull. 2001, 55, 597–610. [Google Scholar] [CrossRef]
- Wu, G.; Mei, B.; Hou, X.; Wang, F.; Zang, C.; Zhang, X.; Zhang, Z. White matter microstructure changes in adults with major depressive disorder: evidence from diffusion magnetic resonance imaging. BJPsych Open 2023, 9, e101. [Google Scholar] [CrossRef]
- Liao, Y.; Huang, X.; Wu, Q.; Yang, C.; Kuang, W.; Du, M.; Lui, S.; Yue, Q.; Chan, R.C.; Kemp, G.J.; Gong, Q. Is depression a disconnection syndrome? Meta-analysis of diffusion tensor imaging studies in patients with MDD. J. Psychiatry Neurosci. 2013, 38, 49–56. [Google Scholar] [CrossRef]
- Linke, J.O.; Adleman, N.E.; Sarlls, J.; Ross, A.; Perlstein, S.; Frank, H.R.; Towbin, K.E.; Pine, D.S.; Leibenluft, E.; Brotman, M.A. White Matter Microstructure in Pediatric Bipolar Disorder and Disruptive Mood Dysregulation Disorder. J. Am. Acad. Child Adolesc. Psychiatry 2020, 59, 1135–1145. [Google Scholar] [CrossRef]
- Wyckoff, N.; et al. Magnetization transfer imaging and magnetic resonance spectroscopy of normal-appearing white matter in late-life major depression. J. Magn. Reson. Imaging 2003, 18, 537–543. [Google Scholar] [CrossRef]
- Kumar, A.; et al. Biophysical changes in normal-appearing white matter and subcortical nuclei in late-life major depression detected using magnetization transfer. Psychiatry Res. 2004, 130, 131–140. [Google Scholar] [CrossRef] [PubMed]
- Gunning-Dixon, F.M.; et al. Macromolecular White Matter Abnormalities in Geriatric Depression: A Magnetization Transfer Imaging Study. Am. J. Geriatr. Psychiatry 2012, 16, 255–262. [Google Scholar] [CrossRef]
- Zhang, T.-J.; et al. Magnetization transfer imaging reveals the brain deficit in patients with treatment-refractory depression. J. Affect. Disord. 2009, 117, 157–161. [Google Scholar] [CrossRef] [PubMed]
- Zhou, Z.; Xu, Z.; Lai, W.; Chen, X.; Zeng, L.; Qian, L.; Liu, X.; Jiang, W.; Zhang, Y.; Hou, G. Reduced myelin content in bipolar disorder: A study of inhomogeneous magnetization transfer. J. Affect. Disord. 2024, 356, 363–370. [Google Scholar] [CrossRef]
- Hou, G.; Lai, W.; Jiang, W.; Liu, X.; Qian, L.; Zhang, Y.; Zhou, Z. Myelin deficits in patients with recurrent major depressive disorder: An inhomogeneous magnetization transfer study. Neurosci. Lett. 2021, 750, 135768. [Google Scholar] [CrossRef]
- Chen, G.; Fu, S.; Chen, P.; Zhong, S.; Chen, F.; Qian, L.; Luo, Z.; Pan, Y.; Tang, G.; Jia, Y.; et al. Reduced myelin density in unmedicated major depressive disorder: An inhomogeneous magnetization transfer MRI study. J. Affect. Disord. 2022, 300, 114–120. [Google Scholar] [CrossRef]
- Sacchet, M.D.; Gotlib, I.H. Myelination of the brain in Major Depressive Disorder: An in vivo quantitative magnetic resonance imaging study. Sci. Rep. 2017, 7, 2200. [Google Scholar] [CrossRef]
- Winklewski, P.J.; Sabisz, A.; Naumczyk, P.; Jodzio, K.; Szurowska, E.; Szarmach, A. Understanding the Physiopathology Behind Axial and Radial Diffusivity Changes—What Do We Know? Front. Neurol. 2018, 9, 92. [Google Scholar] [CrossRef]
- Underhill, H.R.; Yuan, C.; Yarnykh, V.L. Direct quantitative comparison between cross-relaxation imaging and diffusion tensor imaging of the human brain at 3.0 T. Neuroimage 2009, 47, 1568–1578. [Google Scholar] [CrossRef]
- Yarnykh, V.L.; Bowen, J.D.; Samsonov, A.; Repovic, P.; Mayadev, A.; Qian, P.; Gangadharan, B.; Keogh, B.P.; Maravilla, K.R.; Henson, L.K. Fast whole-brain three-dimensional macromolecular proton fraction mapping in multiple sclerosis. Radiology 2015, 274, 210–220. [Google Scholar] [CrossRef] [PubMed]
- Underhill, H.R.; Rostomily, R.C.; Mikheev, A.M.; Yuan, C.; Yarnykh, V.L. Fast bound pool fraction imaging of the in vivo rat brain: Association with myelin content and validation in the C6 glioma model. Neuroimage 2011, 54, 2052–2065. [Google Scholar] [CrossRef]
- Yarnykh, V.L. Fast macromolecular proton fraction mapping from a single off-resonance magnetization transfer measurement. Magn. Reson. Med. 2012, 68, 166–178. [Google Scholar] [CrossRef] [PubMed]
- Kisel, A.A.; Naumova, A.V.; Yarnykh, V.L. Macromolecular Proton Fraction as a Myelin Biomarker: Principles, Validation, and Applications. Front. Neurosci. 2022, 16, 819912. [Google Scholar] [CrossRef] [PubMed]
- Yarnykh, V.L.; Krutenkova, E.P.; Aitmagambetova, G.; Repovic, P.; Mayadev, A.; Qian, P.; Jung Henson, L.K.; Gangadharan, B.; Bowen, J.D. Iron-Insensitive Quantitative Assessment of Subcortical Gray Matter Demyelination in Multiple Sclerosis Using the Macromolecular Proton Fraction. AJNR Am. J. Neuroradiol. 2018, 39, 618–625. [Google Scholar] [CrossRef]
- Petrie, E.C.; Cross, D.J.; Yarnykh, V.L.; Richards, T.; Martin, N.M.; Pagulayan, K.; Hoff, D.; Hart, K.; Mayer, C.; Tarabochia, M.; et al. Neuroimaging, Behavioral, and Psychological Sequelae of Repetitive Combined Blast/Impact Mild Traumatic Brain Injury in Iraq and Afghanistan War Veterans. J. Neurotrauma 2014, 31, 425–436. [Google Scholar] [CrossRef]
- Fujiwara, Y.; Sakae, N.; Kumazoe, H.; Miyamoto, K.; Hirakawa, Y.; Kan, H.; Yamashita, K.; Kitajima, M. Diagnostic Po-tential of Macromolecular Proton Fraction Mapping Combined with Quantitative Susceptibility Mapping as a Subcortical Biomarker for Parkinson's Disease. Magn. Reson. Med. Sci. 2025. [Google Scholar] [CrossRef]
- Khodanovich, M.; Svetlik, M.; Kamaeva, D.; Usova, A.; Kudabaeva, M.; Anan'ina, T.; et al. Demyelination in Patients with POST-COVID Depression. J. Clin. Med. 2024, 13, 4692. [Google Scholar] [CrossRef]
- Smirnova, L.P.; Yarnykh, V.L.; Parshukova, D.A.; Kornetova, E.G.; Semke, A.V.; Usova, A.V.; Pishchelko, A.O.; Khodanovich, M.Y.; Ivanova, S.A. Global hypomyelination of the brain white and gray matter in schizophrenia: quanti-tative imaging using macromolecular proton fraction. Transl. Psychiatry 2021, 11, 365. [Google Scholar] [CrossRef]
- Khodanovich, M.; Svetlik, M.; Naumova, A.; Kamaeva, D.; Usova, A.; Kudabaeva, M.; Anan'ina, T.; Wasserlauf, I.; Pashkevich, V.; Moshkina, M.; et al. Age-Related Decline in Brain Myelination: Quantitative Macromolecular Proton Fraction Mapping, T2-FLAIR Hyperintensity Volume, and Anti-Myelin Antibodies Seven Years Apart. Biomedicines 2023, 12, 61. [Google Scholar] [CrossRef]
- Khodanovich, M.Y.; Svetlik, M.V.; Naumova, A.V.; Usova, A.V.; Pashkevich, V.Y.; Moshkina, M.V.; Shadrina, M.M.; Kamaeva, D.A.; Obukhovskaya, V.B.; Kataeva, N.G.; et al. Global and Regional Sex-Related Differences, Asymmetry, and Peak Age of Brain Myelination in Healthy Adults. J. Clin. Med. 2024, *13*, 7065.Williams, J. B. A structured interview guide for the Hamilton Depression Rating Scale. Arch. Gen. Psychiatry, 1988, 45, 742–747.
- Williams, J. B. A structured interview guide for the Hamilton Depression Rating Scale. Arch. Gen. Psychiatry 1988, 45, 742–747. [Google Scholar] [CrossRef] [PubMed]
- Yarnykh, V.L. Time-efficient, high-resolution, whole brain three-dimensional macromolecular proton fraction mapping. Magn. Reson. Med. 2016, 75, 2100–2106. [Google Scholar] [CrossRef] [PubMed]
- Yarnykh, V.L.; Prihod’ko, I.Y.; Savelov, A.A.; Korostyshevskaya, A.M. Quantitative assessment of normal fetal brain myelination using fast macromolecular proton fraction mapping. Am. J. Neuroradiol. 2018, *39*, 1341–1348. [Google Scholar] [CrossRef] [PubMed]
- Yarnykh, V.L.; Kisel, A.A.; Khodanovich, M.Y. Scan-Rescan Repeatability and Impact of B(0) and B(1) Field Nonuniformity Corrections in Single-Point Whole-Brain Macromolecular Proton Fraction Mapping. J. Magn. Reson. Imaging 2020, 51, 1789–1798. [Google Scholar] [CrossRef]
- Smith, S. M. Fast robust automated brain extraction. Hum. Brain Mapp. 2002, 17, 143–155. [Google Scholar] [CrossRef]
- Zhang, Y.; Brady, M.; Smith, S. Segmentation of brain MR images through a hidden Markov random field model and the expectation-maximization algorithm. IEEE Trans. Med. Imaging 2001, 20, 45–57. [Google Scholar] [CrossRef]
- Kang, W.; Kang, Y.; Kim, A.; Kim, H.; Han, K.M.; Ham, B.J. Gray and white matter abnormalities in major depressive disorder patients and its associations with childhood adversity. J. Affect. Disord. 2023, 330, 16–23. [Google Scholar] [CrossRef]
- Benson, K.L.; Winkelman, J.W.; Gönenç, A. Disrupted white matter integrity in primary insomnia and major depressive disorder: relationships to sleep quality and depression severity. J. Sleep Res. 2023, 32, e13913. [Google Scholar] [CrossRef]
- Dong, Q.; Liu, J.; Zeng, L.; Fan, Y.; Lu, X.; Sun, J.; et al. State-Independent Microstructural White Matter Abnormalities in Major Depressive Disorder. Front. Psychiatry 2020, 11, 431. [Google Scholar] [CrossRef]
- Shen, X.; Reus, L.M.; Cox, S.R.; Adams, M.J.; Liewald, D.C.; Bastin, M.E.; et al. Subcortical volume and white matter in-tegrity abnormalities in major depressive disorder: findings from UK Biobank imaging data. Sci. Rep. 2017, 7, 5547. [Google Scholar] [CrossRef] [PubMed]
- Flinkenflügel, K.; Meinert, S.; Hirtsiefer, C.; Grotegerd, D.; Gruber, M.; Goltermann, J.; et al. Associations between white matter microstructure and cognitive decline in major depressive disorder versus controls in Germany: a prospective case-control cohort study. Lancet Psychiatry 2024, 11, 899–909. [Google Scholar] [CrossRef] [PubMed]
- Sun, H.; Yan, R.; Hua, L.; Xia, Y.; Huang, Y.; Wang, X.; Yao, Z.; Lu, Q. Based on white matter microstructure to early identify bipolar disorder from patients with depressive episode. J. Affect. Disord. 2024, 350, 428–434. [Google Scholar] [CrossRef] [PubMed]
- Cui, Y.; Dong, J.; Yang, Y.; Yu, H.; Li, W.; Liu, Y.; et al. White matter microstructural differences across major depressive disorder, bipolar disorder and schizophrenia: A tract-based spatial statistics study. J. Affect. Disord. 2020, 260, 281–286. [Google Scholar] [CrossRef]
- Canales-Rodríguez, E.J.; Verdolini, N.; Alonso-Lana, S.; Torres, M.L.; Panicalli, F.; Argila-Plaza, I.; et al. Widespread in-tra-axonal signal fraction abnormalities in bipolar disorder from multicompartment diffusion MRI: Sensitivity to diagnosis, association with clinical features and pharmacologic treatment. Hum. Brain Mapp. 2023, 44, 4605–4622. [Google Scholar] [CrossRef]
- Sui, Y.V.; Bertisch, H.; Goff, D.C.; Samsonov, A.; Lazar, M. Quantitative magnetization transfer and g-ratio imaging of white matter myelin in early psychotic spectrum disorders. Mol. Psychiatry 2025, 30, 2739–2747. [Google Scholar] [CrossRef]
- Sarrazin, S.; Cachia, A.; Hozer, F.; McDonald, C.; Emsell, L.; Cannon, D.M.; et al. Neurodevelopmental subtypes of bipolar disorder are related to cortical folding patterns: An international multicenter study. Bipolar Disord. 2018, 20, 721–732. [Google Scholar] [CrossRef]
- Tønnesen, S.; Kaufmann, T.; Doan, N.T.; Alnæs, D.; Córdova-Palomera, A.; Meer, D.V.; Rokicki, J.; Moberget, T.; Gurholt, T.P.; Haukvik, U.K.; et al. White matter aberrations and age-related trajectories in patients with schizophrenia and bipolar disorder revealed by diffusion tensor imaging. Sci. Rep. 2018, 8, 14129. [Google Scholar] [CrossRef]
- Haukvik, U.K.; Gurholt, T.P.; Nerland, S.; Elvsåshagen, T.; Akudjedu, T.N.; Alda, M.; et al. In vivo hippocampal subfield volumes in bipolar disorder-A mega-analysis from The Enhancing Neuro Imaging Genetics through Meta-Analysis Bipolar Disorder Working Group. Hum. Brain Mapp. 2022, 43, 385–398. [Google Scholar] [CrossRef]
Figure 1.
Example 3D MPF (a) and WM probability (b) maps obtained from a BD patient. Axial cross-sections of a 3D volume are presented with the step of 6 mm (every second cross-section).
Figure 1.
Example 3D MPF (a) and WM probability (b) maps obtained from a BD patient. Axial cross-sections of a 3D volume are presented with the step of 6 mm (every second cross-section).
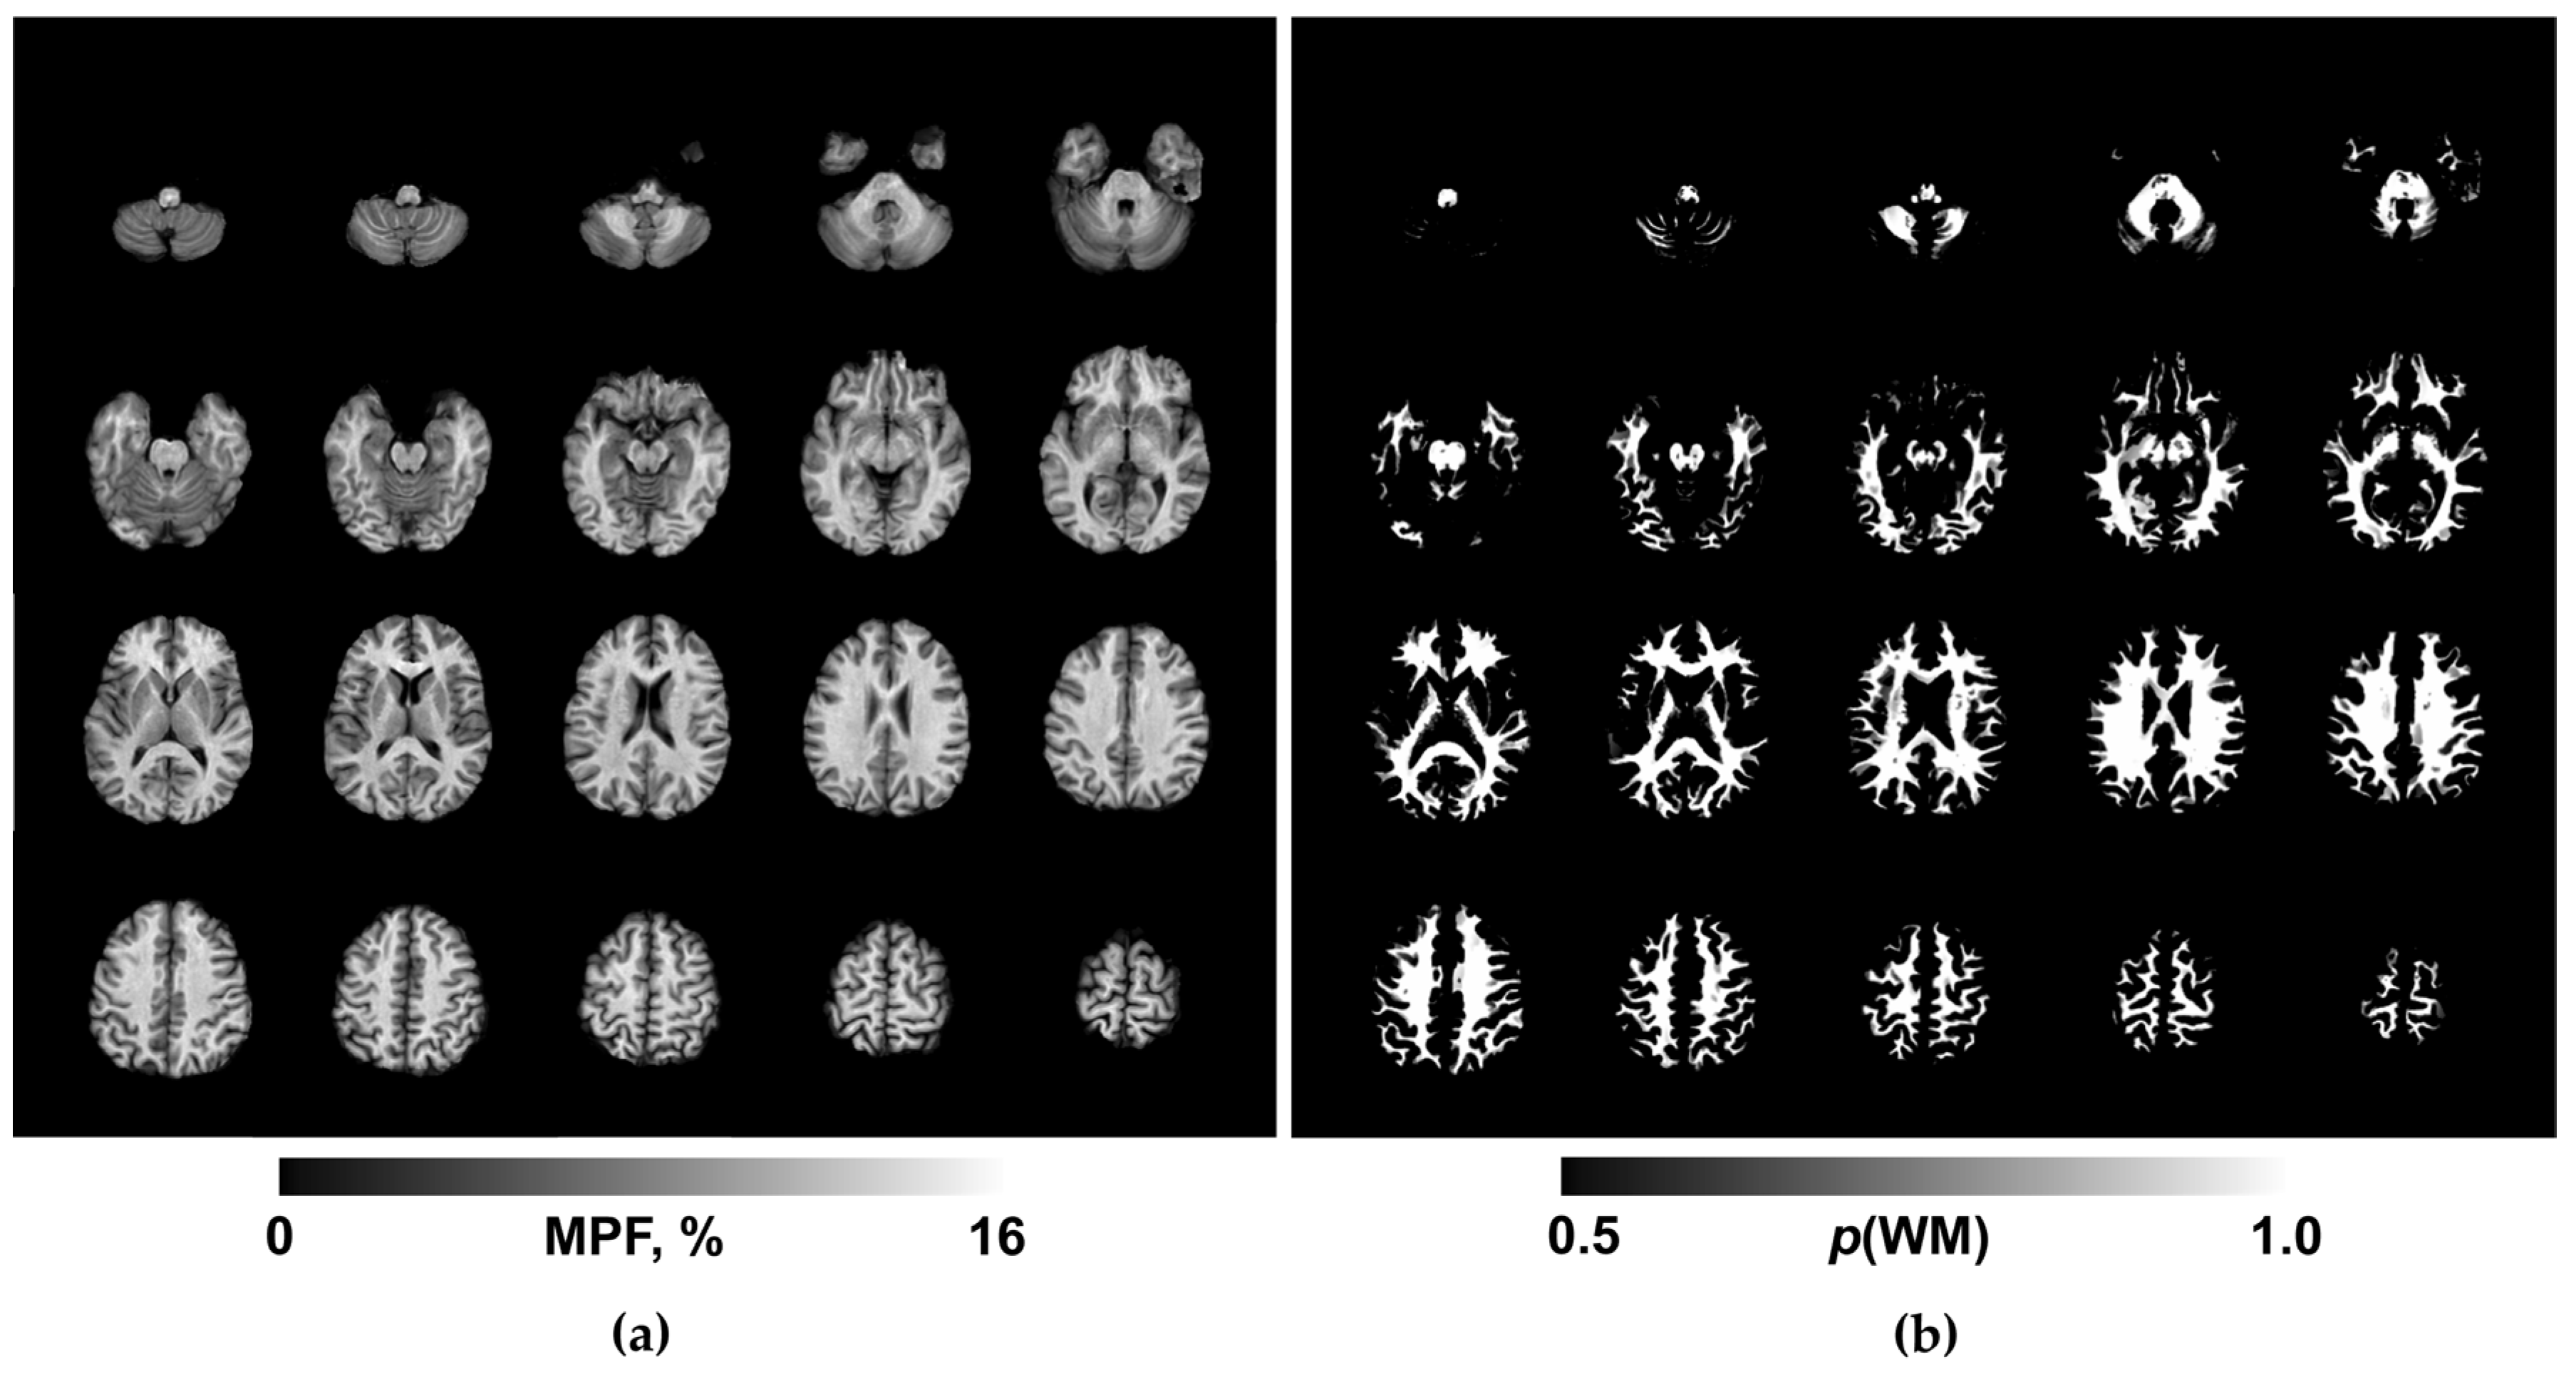
Figure 2.
Box-n-whiskers diagram representing MPF value distributions in patients` groups (RDD- 1, BD – 2, and control group for RDD - Group 3 and BD - 4).
Figure 2.
Box-n-whiskers diagram representing MPF value distributions in patients` groups (RDD- 1, BD – 2, and control group for RDD - Group 3 and BD - 4).
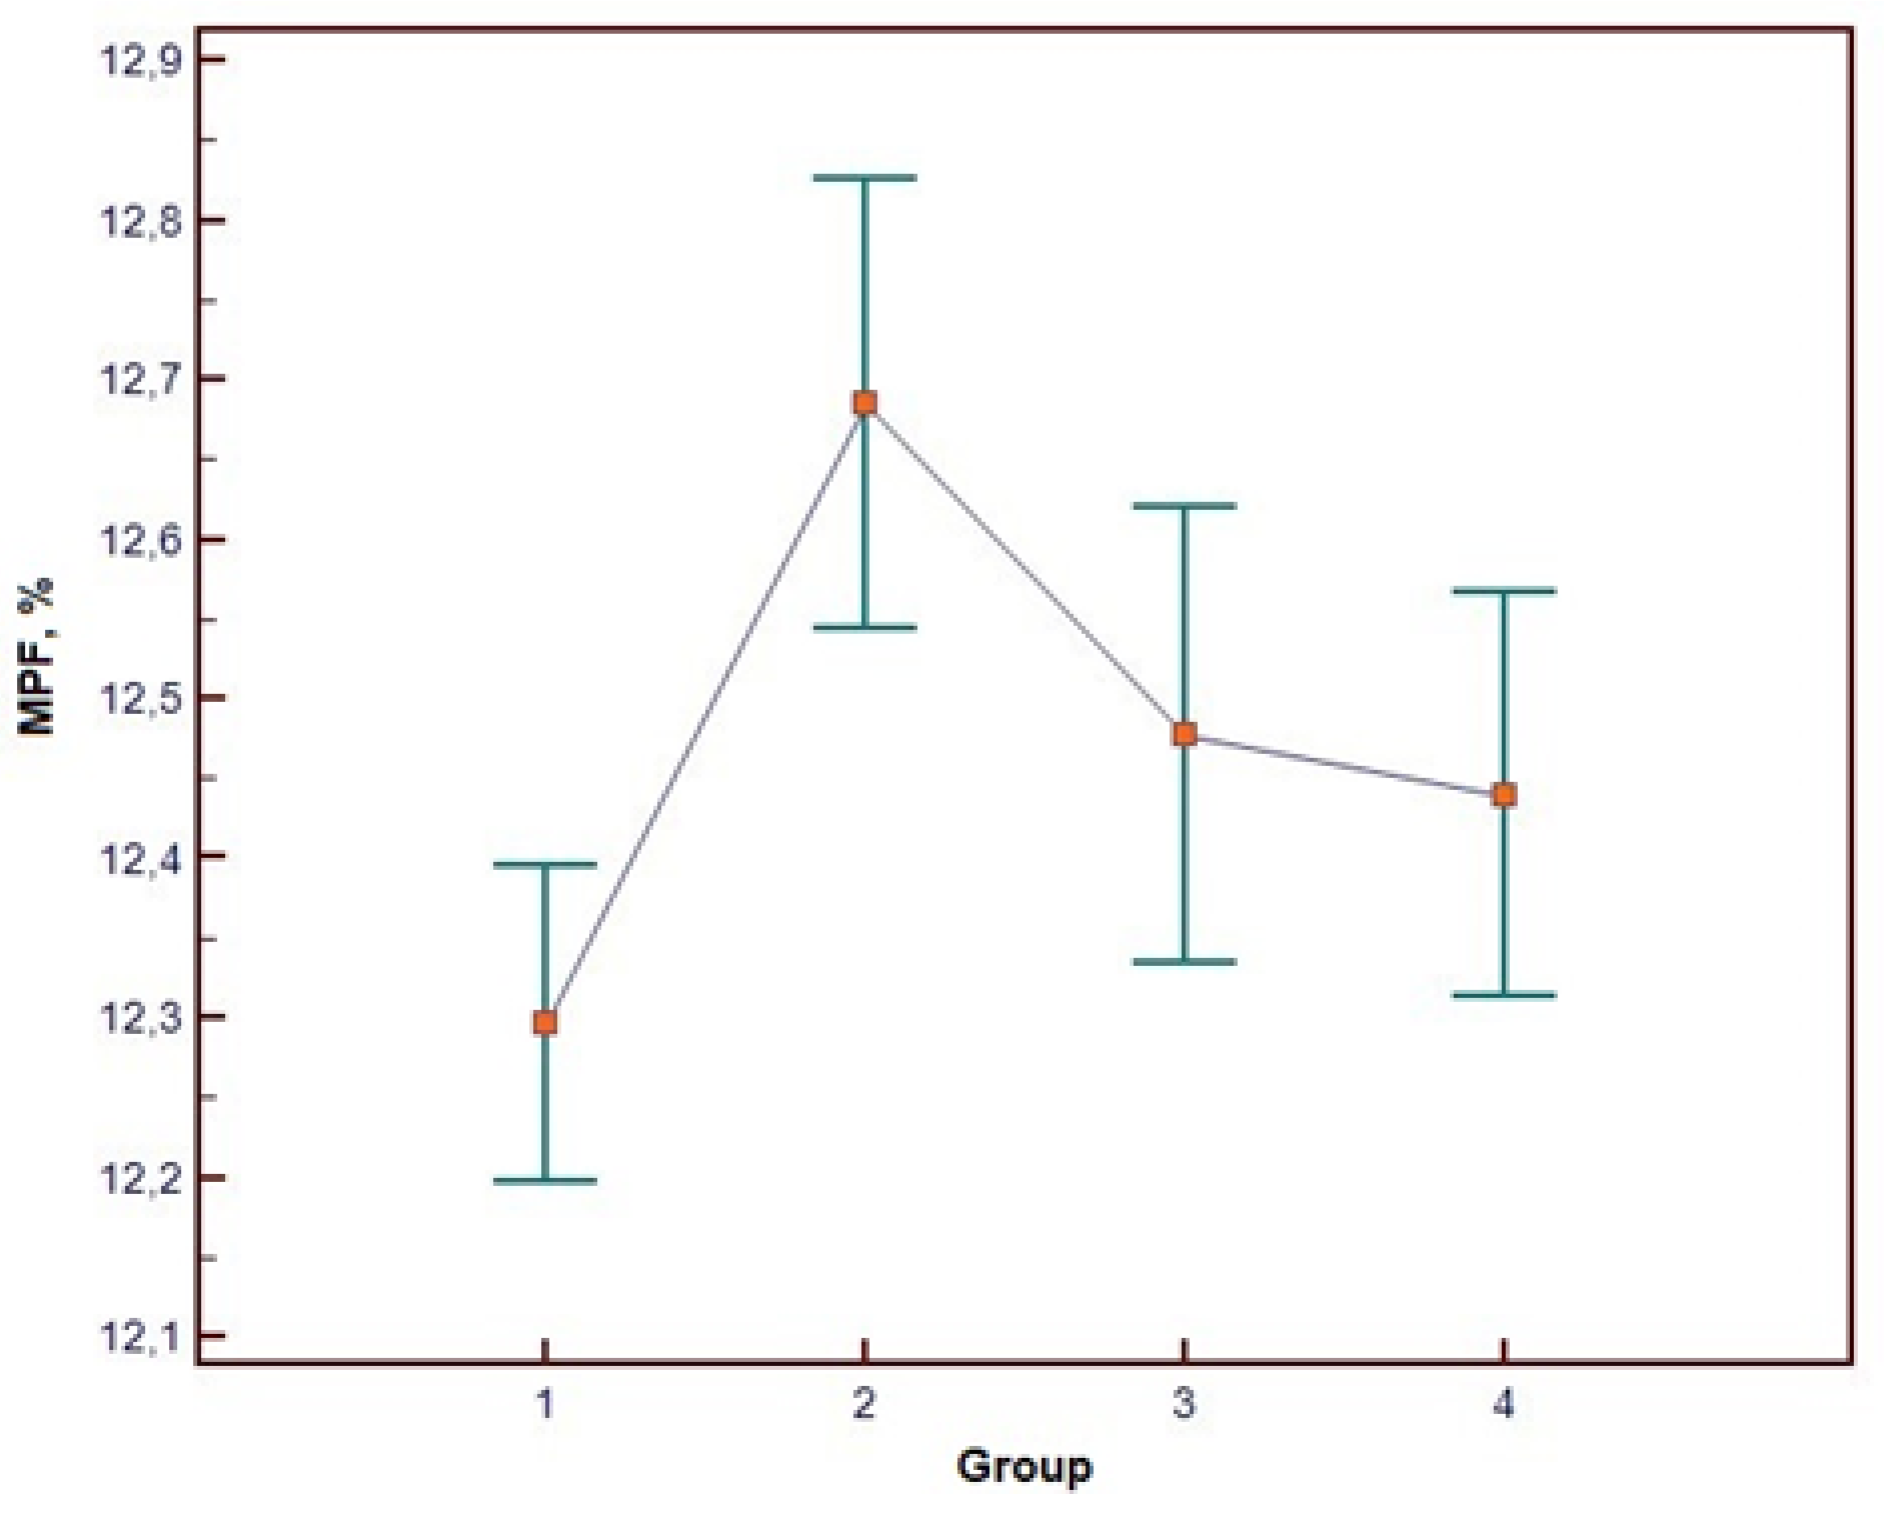
Figure 3.
Correlations between MPF and the score on the scale: A -- SIGH-SAD; B -- SAD for atypical symptoms; C -- BSDS.
Figure 3.
Correlations between MPF and the score on the scale: A -- SIGH-SAD; B -- SAD for atypical symptoms; C -- BSDS.


Table 1.
Characteristics of the study groups by gender and age.
| Group | Male |
Age Me [Q25;Q75] |
|||
| men | women | ||||
| % | Abs. | % | Abs. | ||
|
Recurrent depressive disorder (n=21) |
19. | 4 | 81 | 17 | 38 [25,26,27,28,29,30,31,32,33,34,35,36,37,38,39,40,41,42,43,44,45,46,47,48] |
| Bipolar disorder (n=23) | 26 | 6 | 74 | 17 | 24 [20,21,22,23,24,25,26,27,28,29,30,31] |
|
Healthy control subjects for RDD (n=19) |
21 | 4 | 79 | 15 | 38 [32,33,34,35,36,37,38,39,40,41,42,43,44,45] |
|
Healthy control subjects for BD (n=17) |
29 | 5 | 71 | 12 | 25 [23,24,25,26,27,28,29,30,31,32] |
Table 2.
Differences in scores on clinical scales in groups of patients with bipolar disorder and recurrent depressive disorder.
Table 2.
Differences in scores on clinical scales in groups of patients with bipolar disorder and recurrent depressive disorder.
| Scale | Points, Me [Q25;Q75] | р (Mann-Whitney U test) | |
| BD | RDD | ||
| SIGH-SAD for typical depressive symptoms | 15.0 [12.5; 19.0] | 20.0 [19.0; 24.0] | 0.002 |
| SIGH-SAD for atypical depressive symotoms | 4.0 [3.0; 5.0] | 6.0 [4.0; 13.0] | 0.053 |
| Total score SIGH-SAD | 18.0 [14.0; 24.0] | 26.0 [24.0; 35.0] | 0.003 |
| S-CGI | 5.0 [4.0; 5.0] | 4.0 [4.0; 4.0] | 0.050 |
| BSDS | 17.5 [16.0; 19.0] | 7.0 [5.0; 10.0] | 0.000 |
Table 3.
ANOVA analysis results with participant group as the independent factor (RDD - Group 1, BD - Group 2 and their respective healthy control groups for RDD - Group 3 and BD - Group 4).
Table 3.
ANOVA analysis results with participant group as the independent factor (RDD - Group 1, BD - Group 2 and their respective healthy control groups for RDD - Group 3 and BD - Group 4).
| Source of variation | Sum of squares (SS) | Degrees of freedom (DF) | Mean Square (MS) | F-statistic | p-value | η² | Observed power (alpha=0,05) |
| Group | 1.709 | 3 | 0.57 | 7.419 | <0.001 | 0.227 | 0.981 |
| Within-group (Error) | 5.835 | 76 | 0.077 | ||||
| Total | 7.544 | 79 | |||||
| Intercept | 12292.585 | 1 | 12292.585 | 160098.00 | <0.001 | 0.9995 | 1.000 |
Table 4.
Group sample sizes and results of pairwise comparisons using Tukey's HSD post-hoc test.
| Group number | Group | N | Mean MPF ±SD, % | Statistically Significant Differences (р<0,05) |
| 1 | RDD | 21 | 12.30 ±0.22 | BD (2) |
| 2 | BD | 23 | 12.69±0.33 | RDD (1), control group for BD (4) |
| 3 | Control for RDD | 19 | 12.48±0.3 | Not found |
| 4 | Control for BD | 17 | 12.44±0.25 | BD (2) |
Disclaimer/Publisher’s Note: The statements, opinions and data contained in all publications are solely those of the individual author(s) and contributor(s) and not of MDPI and/or the editor(s). MDPI and/or the editor(s) disclaim responsibility for any injury to people or property resulting from any ideas, methods, instructions or products referred to in the content. |
© 2025 by the authors. Licensee MDPI, Basel, Switzerland. This article is an open access article distributed under the terms and conditions of the Creative Commons Attribution (CC BY) license (http://creativecommons.org/licenses/by/4.0/).
Copyright: This open access article is published under a Creative Commons CC BY 4.0 license, which permit the free download, distribution, and reuse, provided that the author and preprint are cited in any reuse.


