Submitted:
08 December 2025
Posted:
08 December 2025
You are already at the latest version
Abstract
Promoting the clean energy transition is crucial for environmental sustainability and public health. Utilizing data from the China Health and Nutrition Survey (CHNS) spanning 2006 to 2015, this study employs a Difference-in-Differences (DID) model, treating China's West-East Gas Pipeline Project (WEGT) as a quasi-natural experiment to evaluate the causal impact of natural gas infrastructure expansion on resident health. The empirical results indicate that the WEGT significantly improved public health, with more pronounced effects observed among urban residents and the elderly. Mechanism analysis reveals that the infrastructure improves health primarily by optimizing household energy structures and reducing industrial pollution emissions. Furthermore, the "Coal-to-Gas" policy synergistically enhances these health benefits. Welfare analysis demonstrates that the project reduced medical expenditures and increased local employment. These findings provide empirical evidence for deepening supply-side structural reforms in energy and support the realization of the United Nations Sustainable Development Goals (SDGs) related to good health (SDG 3) and affordable clean energy (SDG 7).
Keywords:
clean energy transition
; public health
; natural gas infrastructure
; sustainable development goals
1. Introduction
Health is a fundamental prerequisite for human development and a primary goal of socioeconomic progress. Governments worldwide prioritize public health, and the United Nations lists health as a core component of the Human Development Index and the Sustainable Development Goals (SDGs). In China, the government has strategically prioritized public health through initiatives such as the "Healthy China 2030" plan. By 2022, China's average life expectancy had risen to 77.93 years, marking significant progress in national health outcomes. This improvement depends not only on the continuous perfection of medical security [1] but also on the sustained improvement of environmental quality. Consequently, the development of clean energy has emerged as a critical pathway to reduce pollution and improve ecological conditions, helping to establish a long-term mechanism for low-carbon energy transition and fostering endogenous drivers for green growth.
Energy serves as the foundation and engine of economic development and is a crucial aspect of ecological civilization construction. Given China's resource endowment characterized by coal dominance, there is an urgent need to promote clean energy development, which has triggered extensive academic debate regarding the paths and effects of energy transition [2]. On the one hand, regarding implementation paths, existing literature on energy transition primarily focuses on environmental governance [3], energy efficiency [4], financial development [5], and energy technology [6]. However, discussions specifically addressing mega-energy infrastructure projects like the West-East Gas Pipeline Project (WEGT) remain relatively scarce. On the other hand, regarding transition effects, existing studies mainly focus on the macro-level, examining impacts on the economy and environment [7]. Few studies have explored the positive externalities generated at the micro-individual level. This gap exists partly due to endogeneity issues, such as omitted variable bias or individual preferences, which complicate the causal inference between energy transition and individual status. The WEGT, representing an exogenous shock, provides an ideal opportunity to utilize a quasi-natural experiment framework to rigorously identify the positive health externalities of clean energy development.
To address the structural imbalance between clean energy distribution and demand in China, the State Council approved the launch of the West-East Gas Pipeline Project (WEGT) in February 2000, with full-scale construction commencing in July 2002. According to statistics from the National Energy Administration, by the end of 2022, the WEGT had cumulatively transmitted over 800 billion cubic meters of natural gas. This effectively replaced 1.07 billion tons of standard coal and reduced emissions of carbon dioxide and dust by 1.171 billion tons and 581 million tons, respectively. Consequently, the share of natural gas in China's primary energy consumption rose from 2.4% in 2003 to 8.4% by the end of 2021. This infrastructure has not only provided energy security for high-quality development but also injected clean momentum into achieving China's "carbon peaking and carbon neutrality" goals and advancing ecological civilization initiatives. Evidently, the WEGT has generated immense environmental benefits; however, the associated health externalities remain to be rigorously examined.
The development of clean energy impacts resident health through multiple dimensions. On the one hand, it drives the transition of household energy structures (Direct Impact). When households rely on firewood and coal as primary fuels, the inefficient combustion produces substantial indoor air pollutants. The WEGT facilitates the substitution of polluting fuels with clean energy in households, thereby optimizing the energy structure, reducing indoor pollution, and directly improving resident health. On the other hand, it promotes industrial pollution reduction (Indirect Impact). Extensive literature has established that air pollution significantly impairs public health [8]. Industrial production is a major source of such pollution. Following the operation of the WEGT, the reduction in pollutants from industrial energy consumption has led to sustained improvements in regional air quality, thereby indirectly enhancing public health levels.
In this study, focusing on the WEGT Line 2, we employ data from the China Health and Nutrition Survey (CHNS) and a Difference-in-Differences (DID) model to empirically test the impact of the project on resident health. The results indicate that as a landmark project of the Western Development Strategy, the WEGT significantly reduced the probability of illness among residents in regions along the pipeline. This conclusion remains robust after excluding interference from concurrent energy and environmental policies, conducting placebo tests, and performing a series of sensitivity analyses. Mechanism analysis reveals that the increased supply of natural gas promotes the transformation of household energy structures. Simultaneously, enterprises utilize natural gas as a substitute fuel, which helps reduce pollution emissions. The improvement in city-level environmental quality further validates this micro-level impact channel. Further analysis indicates heterogeneity in these effects, with more pronounced health benefits observed in urban areas with larger-scale natural gas usage and among the elderly population, who are more sensitive to air pollution. Additionally, environmental regulations such as the "Coal-to-Gas" policy synergistically enhance the health benefits of the WEGT. Welfare analysis demonstrates that the project has reduced individual medical expenses and regional healthcare expenditures while promoting local employment.
This study contributes to the existing literature in three main aspects:
First, it enriches the evaluation of the implementation effects of the WEGT. Previous studies have mostly approached this topic from macro-level or enterprise-level perspectives [9], paying relatively less attention to the impact on micro-individuals. This paper focuses directly on resident health from a micro-individual perspective. Furthermore, it explores the welfare effects in terms of reduced medical costs and increased employment levels following health improvements, providing empirical evidence for the role of the WEGT in promoting the "Healthy China" strategy.
Second, it expands the research on determinants of resident health. While existing literature has examined the impact of environmental issues on health and the environmental effects of the WEGT [10], as well as its effect on urban carrying capacity [11], few studies have focused on the downstream effects of environmental quality improvements. By placing the analysis of resident health against the backdrop of China's rapid clean energy development and using the WEGT as an entry point, this study systematically explores the significant impact of clean energy development on enhancing public health levels.
Third, it supplements the logical mechanisms through which clean energy development improves resident health. This paper first explores how the WEGT improves resident health by inducing behavioral changes in micro-energy consumers—specifically through optimizing household energy structures and reducing corporate pollution emissions. It then provides supplementary verification through macro-level improvements in urban environmental performance. These findings offer theoretical support for government initiatives to promote resident health through clean energy development and validate the significant historical significance and practical value of the WEGT in synergistically advancing the energy revolution and the "Healthy China" strategy.
2. Context and Literature Review
2.1. Institutional Background: The West-East Gas Pipeline Project
Since China’s reform and opening-up, China has experienced surging energy demand. However, the nation's resource endowment, historically characterized by coal dominance, has led to an irrational energy supply structure. As of the end of 2022, coal still accounted for 56.2% of total energy consumption [12]. Excessive coal consumption has resulted in deteriorating air quality and a series of environmental and health challenges. Consequently, promoting the structural optimization of energy supply and accelerating the development of clean energy have become critical pathways to resolve the conflict between economic growth and environmental sustainability.
In this context, China has actively explored various alternatives to coal, including hydropower, wind, and nuclear energy. Among these, natural gas—as a high-quality, efficient, and relatively clean fossil fuel—has emerged as a vital substitute. However, a significant spatial mismatch exists in China's energy landscape: natural gas reserves are predominantly located in the western regions, while energy consumption is concentrated in the economically developed eastern coastal areas. To address this imbalance and ensure energy security, the State Council approved the launch of the West-East Gas Pipeline Project (WEGT) in 2000.
The WEGT is a massive infrastructure network consisting of four phases. While Line 1 commenced operations in 2004, this study specifically focuses on the Second West-East Gas Pipeline (Line 2), which represents the first strategic channel introducing overseas natural gas (primarily from Central Asia) into China. Construction of Line 2 began in February 2008, and it became fully operational in December 2012. The pipeline spans 9,102 kilometers, starting from Horgos in Xinjiang, extending south to Guangzhou and Hong Kong, and east to Shanghai. It traverses 14 provinces and municipalities, including Xinjiang, Gansu, Ningxia, Shaanxi, Henan, Hubei, Jiangxi, Hunan, Guangdong, Guangxi, Zhejiang, Anhui, Jiangsu, and Shanghai. Line 2 is characterized by its extensive coverage and large beneficiary population, making it an ideal quasi-natural experimental setting for analyzing regional health disparities.
The expansion of the WEGT has significantly increased the share of natural gas in China's primary energy mix. National natural gas consumption rose from 147.1 billion cubic meters in 2012 (4.8% of total energy consumption) to 364.6 billion cubic meters in 2022 (8.4% of total consumption). By connecting the energy-rich West with the demand-heavy East, the WEGT not only optimizes the regional energy structure but also facilitates the "green" low-carbon transition of the economy [13]. The substantial environmental benefits of this substitution—specifically the reduction in sulfur dioxide and particulate matter emissions—provide the theoretical basis for the health effects examined in this paper.
2.2. Literature Review
2.2.1. Energy Transition: Drivers and Effects
Energy transition refers to the structural transformation of the energy supply side [14]. Since the late 1970s, China has relied on low-cost and abundant coal resources, forming an extensive economic growth model characterized by high inputs, high output, and high pollution. With the shift toward sustainable economic development, China is transitioning from high-speed growth to high-quality growth, necessitating corresponding adjustments and optimization of the energy supply structure. Existing literature on energy transition focuses primarily on transition pathways and their effects. Regarding pathways, studies have extensively discussed driving mechanisms, including policy interventions [15], financial development and income growth [16], energy price changes and subsidies [17], and public environmental awareness [18]. However, few studies have examined energy transitions driven by mega-infrastructure projects like the WEGT. Regarding effects, current research largely emphasizes economic growth [19], environmental quality improvement [20], and welfare effects [21], often overlooking the positive externalities related to public health. Based on this, this paper focuses on the WEGT—a mega-trans-regional energy allocation project—to examine the health externalities and impact pathways of clean energy development, providing empirical evidence for the social benefits of major infrastructure.
2.2.2. Determinants of Public Health
China has made significant achievements in health construction, continuously improving public health levels and narrowing regional disparities [22]. While existing studies often explore health determinants from a public policy perspective, recent attention has shifted to institutional changes, social security, and individual behaviors. First, regarding public policy, numerous studies employing Difference-in-Differences (DID) methods have found positive health effects from policies such as the "Two Control Zones" environmental regulation [23], the "Air Pollution Prevention and Control Action Plan" [24], and agricultural tax reform [25]. Second, regarding institutional change, research indicates that trade liberalization (e.g., WTO accession) may increase working hours and illness probability [26], while changes in medical insurance reimbursement schemes affect patient costs [27]. Third, regarding social security, literature suggests that improvements in community elderly care [28], pension insurance systems [29], and the structure of health expenditure [30] can enhance resident health, whereas air pollution accelerates the depreciation of health capital [31]. Finally, individual behaviors, such as alcohol consumption [32] and self-employment choices [33], also significantly impact health outcomes. Despite the richness of research on health determinants, the perspective of infrastructure construction remains to be expanded, a gap this paper aims to fill using the WEGT as an entry point.
2.2.3. The Impact of Energy Consumption on Health
Economic development is intrinsically linked to energy consumption, yet the air pollution generated by excessive fossil fuel use adversely affects resident health. A growing body of literature has examined the health impacts of fossil fuel consumption, generally concluding that non-clean fossil energy damages physical health. For instance, increased coal use in power plants has been found to lower student health levels, whereas substitution with clean energy (like natural gas) improves academic performance [34]. However, some literature notes that natural gas flaring during oil extraction can negatively impact health. Studies closely related to this paper include findings from Colombia, where reduced rainfall led to hydroelectric shortages and increased thermal power reliance, causing air pollution that raised respiratory and cardiovascular morbidity [35]. Similarly, the expansion of natural gas infrastructure in Turkey was found to reduce infant mortality [36]. In India, proximity to coal-fired power plants was associated with respiratory damage [37], while promoting clean cooking fuels improved women's health [38].
While substantial research exists, much of it focuses on developed contexts or specific developing economies. China, however, faces more severe challenges regarding industrial pollution and urbanization, with higher degrees of environmental pollution and governance complexity. Whether the existing conclusions are applicable to China's reality requires further exploration. In particular, as the world's largest energy consumer and most populous nation, the development of clean energy in China holds significant importance for global pollution reduction and the improvement of public health standards.
3. Materials and Methods
3.1. Data Source and Processing
This study utilizes individual-level data from the China Health and Nutrition Survey (CHNS), a longitudinal survey project conducted collaboratively by the Chinese Center for Disease Control and Prevention (CCDC) and the University of North Carolina at Chapel Hill (UNC). The survey covers 15 provinces and municipalities, collecting data across individual, household, and community dimensions [39]. Unlike other micro-surveys, the CHNS provides a unique advantage for this study: it includes not only detailed demographic characteristics (e.g., age, gender, income) but also comprehensive health records, including self-reported illness in the past four weeks and specific chronic conditions. The reliability and objectivity of its health metrics have led to its widespread application in health economics research [40].
For the empirical analysis, we selected four waves of survey data: 2006, 2009, 2011, and 2015. The rationale for this selection is twofold: first, to establish a clean baseline period (2006 and 2009) prior to the full-scale operation of the WEGT Line 2, minimizing interference from antecedent energy policies; and second, to utilize the latest available public data (2015) to capture the post-treatment effects.
We merged the CHNS data with the geographical route information of the WEGT Line 2. Individuals residing in cities traversed by the pipeline's main or branch lines were identified as the treatment group, while those in non-traversed cities served as the control group. Additionally, city-level characteristic variables were matched to the dataset using the China City Statistical Yearbook and the China Economic and Social Big Data Platform. The final integrated dataset comprises a balanced panel containing information on project-node and non-node cities across the four selected waves.
3.2. Identification Strategy
To evaluate the causal impact of the WEGT Line 2 on public health, following the approach of Imelda et al. (2020) [41], we treat the operation of the WEGT Line 2 as a quasi-natural experiment. Since the pipeline's route planning is primarily determined by national energy strategy and geological conditions rather than local resident health levels, the project serves as an exogenous shock. Therefore, we employ a Difference-in-Differences (DID) model for identification, specified as follows:
In Equation (1), the subscripts ,denote the individual, city, and year, respectively. The dependent variable, , represents health status, assigned a value of 1 if the individual was sick or injured in the past four weeks, and 0 otherwise.
The core explanatory variable is the interaction term .Here, is a dummy variable indicating whether a city is a node on the Line 2 route (1 for treated cities, 0 for control cities), and indicates the time period, taking a value of 1 for years after the project's operation and 0 otherwise. represents a set of control variables covering individual, household, and regional characteristics. and denote city fixed effects and year fixed effects, respectively, to absorb time-invariant regional heterogeneity and time-varying common shocks. is the random error term. Standard errors are clustered at the city level to account for potential serial correlation and heteroscedasticity within regions.The coefficient of interest is , which is expected to be negative, implying that the project reduces the illness rate of residents in regions along the pipeline.
3.3. Data Source and Processing
3.3.1. Dependent Variable
Extensive literature has established that air pollution leads to respiratory and cardiovascular diseases [42]. Consequently, objective morbidity indicators for these specific conditions are often used as dependent variables to assess pollution-induced health issues [43]. While respiratory and cardiovascular diseases are direct indicators of air pollution exposure and are widely used in international health studies [44], the CHNS dataset contains a high rate of missing values for these specific disease categories. To address this, following the approach of recent domestic studies on pollution and health [45], we adopt "whether the respondent was sick or injured in the past four weeks" as the primary proxy for resident health in our baseline regression. This self-reported health measure is a widely accepted comprehensive indicator in health economics. Additionally, we utilize specific respiratory and cardiovascular disease indicators in the robustness checks to validate our findings.
3.3.2. Key Explanatory Variable
The core independent variable is the interaction term representing whether a city is a node city along the Line 2 after the project's operation. We identified the node cities by cross-referencing the Map of Natural Gas Pipelines in China (2013), published by the Editorial Board of the Yearbook of China's Gas Industry, with official announcements from municipal governments. Based on this, we constructed the interaction term , indicating the treatment status and timing.
3.3.3. Control Variables
Drawing on existing literature [46], we control for a comprehensive set of covariates at the individual, household, and city levels to mitigate omitted variable bias:
· Individual-level controls: Age, Gender, Years of schooling (Education), Marital status, Occupation type (Agricultural sector), Medical insurance status, and Household registration status (Hukou).
· Household-level controls: Household size and Household income per capita.
· City-level controls: Total population and Number of hospital beds (a proxy for medical resource availability).
3.3.4. Descriptive Statistics Analysis
Table 1 presents the descriptive statistics for the main variables.
Table 1 presents the descriptive statistics for the main variables. On average, the illness rate in the control group is slightly lower than that in the treatment group. While demographic characteristics such as age, gender, education, marital status, and household size are comparable between the two groups, notable disparities exist in other dimensions. Specifically, the treatment group exhibits lower levels of medical insurance coverage, urbanization (Hukou), household income, city population, and medical resources (hospital beds) compared to the control group. These baseline disparities suggest potential selection bias, underscoring the necessity of employing the Difference-in-Differences (DID) model with fixed effects to account for time-invariant unobserved heterogeneity and ensure robust causal inference.
4. Empirical Results
4.1. Baseline Estimation Results
Baseline Estimation Results Based on the quasi-natural experiment provided by the full-scale operation of the WEGT Line 2 in 2012, we employ a panel fixed effects model to examine the potential public health benefits of the project. The regression results are reported in Table 2. Column (1) presents the estimates without control variables and fixed effects. Columns (2) and (3) introduce control variables and fixed effects separately, while Column (4) incorporates the full set of controls and two-way fixed effects. Across all specifications, the coefficients of the core explanatory variable,,are consistently negative and statistically significant at the 5% level or better. This indicates that, compared to non-node cities, the incidence of illness among residents in node cities significantly decreased following the operation of the WEGT Line 2. These results confirm that the increased supply of natural gas brought by the project significantly improved public health in regions along the pipeline. This finding aligns with the evidence provided by Cesur et al. [47] regarding the health benefits of natural gas infrastructure expansion.
4.2. Robustness Checks
4.2.1. Parallel Trend Test
The validity of the Difference-in-Differences (DID) method relies on the parallel trend assumption, which requires that, in the absence of the intervention, the treatment and control groups would have followed the same trajectory. To verify this, we employed the event study method [48] to examine the dynamic effects of the WEGP II project. The model is specified as follows:
In Equation (2), serves as a dummy variable for the year . Based on the survey waves utilized in this study, takes the values of 2006, 2009, and 2011 to represent the pre-implementation period (denoted as , and ), and 2015 to represent the post-implementation period (denoted as ). The year 2011 ( is selected as the reference base year. The control variables remain consistent with the baseline regression. The parameter captures the difference in health levels between the treatment and control groups relative to the base year.
The results of the parallel trend test are presented in Figure 1. The coefficients for the pre-implementation periods are not statistically significant, indicating no systematic differences in health trends between the treatment and control groups prior to the project. However, a significant divergence is observed after the project's operation, thereby confirming that the study sample satisfies the parallel trend assumption.
4.2.2. Placebo Test
To rule out the possibility that the baseline results are driven by unobservable omitted variables, we conducted a placebo test by randomizing the treatment assignment. Specifically, we randomly selected a set of cities from the sample to form a pseudo-treatment group, while the remaining cities constituted a pseudo-control group. We then re-estimated the baseline model using these generated groups.
This process was repeated 1,000 times to obtain a distribution of estimated coefficients and their corresponding p-values. As illustrated in Figure 2, the mean of the randomized coefficients is concentrated around zero and follows a normal distribution. This distribution significantly deviates from the actual estimated coefficient (represented by the vertical dashed line). Furthermore, the majority of the p-values are greater than 0.1. These findings suggest that the baseline results are not driven by random chance or unobserved factors, further validating the robustness of our conclusions.
4.2.3. Addressing Sample Selection Bias
he routing of the WEGP II project considers factors such as geographical location, resource endowment, and economic development, which means certain cities have a higher probability of becoming project nodes. This non-random placement may introduce sample selection bias. Although our baseline model controls for city-level fixed effects, potential bias may persist. To further mitigate this issue and enhance the exogeneity of the shock, we adopted the following three strategies:
- Excluding Provincial Capitals;
Provincial capitals typically possess larger scales and higher levels of economic development, increasing their likelihood of being selected as WEGP II nodes. Furthermore, these cities generally offer superior medical conditions, which naturally contribute to better public health outcomes. To eliminate this potential bias, we excluded provincial capitals from the sample. The regression results, presented in Appendix A Column (1) of Table A1, show that the coefficient of WEGT_Post remains significantly negative, indicating that the health benefits of the WEGP II project hold even after removing these special administrative units.
- Excluding the Yangtze River Delta (YRD) Urban Agglomeration;
The Yangtze River Delta is one of China's most economically developed regions, with an industrial structure and energy demand pattern distinct from other regions. This uniqueness might mask or amplify the actual impact of the WEGP project. Additionally, the YRD's rapid economic growth and mature energy infrastructure allow for economies of scale and lower natural gas supply costs, potentially skewing the assessment of health effects. Therefore, we excluded cities in the YRD to remove these confounding factors. The results in Column (1) of Table A1 demonstrate that excluding the YRD sample does not qualitatively change the estimation results.
- Limiting the Sample to Pipeline-Adjacent Provinces;
While the natural gas from the WEGP project primarily supplies nodal cities along the main line, it may also be transported to other cities within the same province via provincial pipelines. If non-nodal cities within the same province also benefit from the gas supply, the baseline regression might overestimate the specific health effects of the WEGP II project (by contaminating the control group). To address this, drawing on the method by [49], we restricted the sample to provinces traversed by the WEGP II line, excluding non-adjacent provinces. In this subsample, nodal cities along the line served as the treatment group, while other cities within the same provinces served as the control group. The results, reported in Column (3) of Table A1, show that the coefficient of WEGT_Post remains significantly negative. This indicates that the baseline conclusion remains robust even after controlling for potential intra-provincial spillovers and unobserved provincial heterogeneity.
4.2.4. Excluding Interference from Concurrent Energy Projects
Other major energy infrastructure projects implemented during the sample period could potentially confound the estimated health effects of the WEGP II project. To mitigate this interference and isolate the net effect of the WEGP II, we sequentially excluded samples affected by other representative natural gas pipelines that became operational around the same time. These primarily include the Shaanxi-Beijing Gas Pipeline III and the Qinhuangdao-Shenyang Gas Pipeline.
- Excluding the Shaanxi-Beijing Gas Pipeline III;
The Shaanxi-Beijing Gas Pipeline III commenced construction in May 2009 and began operation in January 2011, running from Yulin City in Shaanxi Province to Liangxiang District in Beijing. Given that its operation time closely coincides with the WEGP II project, it presents a potential confounding risk. Following the approach of [50], we excluded cities traversed by the Shaanxi-Beijing Gas Pipeline III from the total sample. The regression results, reported in Column (1) of Table A2, show that the estimated coefficient remains consistent with the baseline regression after removing the potential influence of this concurrent project.
- Excluding the Qinhuangdao-Shenyang Gas Pipeline;
The Qinhuangdao-Shenyang Pipeline started construction in May 2009 and was put into operation in February 2011. It starts in Qinhuangdao City, Hebei Province, and ends in Shenyang City, Liaoning Province, including branches to Huludao, Panjin, and Shenyang. Similarly, we excluded the sample of cities covered by the main line and branches of this pipeline to eliminate its interference with the evaluation of the WEGP II's health effects. The results in Column (2) of Table A2 indicate that the coefficient of WEGT_Post remains significantly negative. This suggests that our baseline conclusion remains robust even after accounting for the impact of the Qinhuangdao-Shenyang natural gas project.
4.2.5. Excluding Interference from Concurrent Environmental Policies
Environmental regulations serve as effective instruments for pollution abatement and public health improvement. During the "11th Five-Year Plan" and "12th Five-Year Plan" periods, China implemented various environmental regulatory policies. The distinct environmental protection measures adopted in pilot regions for these policies could lead to pollution reduction, which might confound the observed health effects in our study. To address this, we selected three representative environmental policies implemented during the sample period—the "Low-carbon City" pilot, the "Carbon Emission Trading Scheme (CETS)" pilot, and the "Air Pollution Prevention and Control Action Plan"—to rule out their potential interference.
- Controlling for the "Low-carbon City" Pilot Policy;
China's Low-carbon City pilot policy was progressively rolled out to reduce greenhouse gas emissions, improve energy efficiency, and promote sustainable urban planning. Since 2010, 81 cities have been designated as pilot zones, which has significantly improved urban air quality [51]. Following the method of [52], we added an interaction term between the "Low-carbon City" dummy and year dummy variables to the baseline model to control for the policy's potential impact. The results, shown in Column (3) of Table A2, indicate that the core explanatory variable remains significantly negative, confirming the robustness of our baseline conclusion.
- Controlling for the "Carbon Emission Trading Scheme (CETS)" Pilot Policy;
To fulfill its commitment to reducing carbon intensity made at the Copenhagen Climate Change Conference, China began exploring market-based mechanisms to reduce greenhouse gas emissions, with the carbon market being a crucial component. In 2011, the National Development and Reform Commission approved pilot work for carbon emission trading in seven provinces and cities: Beijing, Shanghai, Tianjin, Chongqing, Hubei, Guangdong, and Shenzhen. The market launched progressively starting in 2013. The CETS has generated significant environmental dividends [53] and may also affect resident health. Therefore, we included an interaction term between the CETS pilot dummy and year dummy variables in the regression. The results reported in Column (4) of Table A2 show that the findings remain robust.
- Controlling for the "Air Pollution Prevention and Control Action Plan" ;
To address increasingly severe air pollution and reduce the concentration of particulate matter, the State Council issued the Air Pollution Prevention and Control Action Plan in September 2013. By January 2018, the goals of the "Action Plan" were fully achieved, effectively reducing air pollutant concentrations and improving public health [54]. To exclude the influence of this policy, we added an interaction term between the dummy variable for key regions targeted by the "Action Plan" and a time dummy (pre- and post-2013) to the baseline model. Column (5) of Table A2 reports the estimated results, revealing that the baseline conclusion holds even after controlling for the "Action Plan."
Finally, to rigorously exclude the interference of all three environmental policies simultaneously, we included the interaction terms for all three policies in the regression model. The results are reported in Column (6) of Table A2. The coefficient of the core explanatory variable remains significantly negative, demonstrating that our main conclusion remains robust even after accounting for the combined influence of these concurrent environmental regulations.
4.2.6. Additional Robustness Checks
To further verify the reliability of our findings, we conducted a series of additional sensitivity analyses, including excluding confounding project impacts, controlling for other energy infrastructure, using alternative dependent variables, and employing high-dimensional fixed effects. The results of these tests are summarized in Table A3-A4.
- Excluding the Impact of WEGP I ;
The First West-East Gas Pipeline (WEGP I) was completed and put into operation in 2004. Although our sample period begins in 2006 to minimize its immediate impact, there is a geographical overlap between the two phases. To eliminate the potential interference of the first phase, following the method of [55], we excluded cities traversed by WEGP I and re-estimated the model. The results remain robust after removing these samples.
- Analysis of Overlapping Areas ;
To investigate whether the health effects in areas covered by both WEGP I and WEGP II differ from the baseline, we conducted a subsample analysis. We defined cities traversed by both pipelines as the treatment group and cities not covered by either pipeline as the control group, excluding those covered only by WEGP I or only by WEGP II. The estimated coefficient remains significantly negative and is similar in magnitude to the baseline result, indicating that the existence of WEGP I does not bias the main conclusions regarding WEGP II.
- Controlling for Other Clean Energy and Infrastructure ;
The consumption of other clean energies might substitute for natural gas, and local energy infrastructure could affect natural gas penetration rates. To account for this, we obtained data on the total supply of liquefied petroleum gas (LPG) and natural gas storage capacity from the China City Statistical Yearbook and China Urban Construction Statistical Yearbook. These variables were added as controls in the baseline model. The results indicate that the conclusion remains robust after controlling for these alternative energy sources and infrastructure factors.
- Alternative Dependent Variables ;
While the WEGP II project reduces various pollutants, air pollution-related diseases are the most direct health consequences. In the baseline analysis, we used a general "sick in the past four weeks" indicator due to its high response rate. Here, we replace the dependent variable with specific incidences of respiratory diseases and cardiovascular diseases, which are more sensitive to air quality. Despite the reduced sample size due to data availability, the results show that the WEGP II project significantly reduces the prevalence of both diseases, corroborating the reliability of our baseline findings.
- Mitigating Omitted Variable Bias ;
Although the baseline model controls for multidimensional characteristics, public health may still be influenced by unobserved seasonal factors or time trends. To mitigate bias from time-correlated omitted variables, drawing on [56], we added city-specific linear time trends and province-by-year fixed effects to the model. These controls account for distinct economic growth paths across cities and province-specific shocks over time. The coefficient of the core explanatory variable remains significantly negative, suggesting that omitted variable bias does not drive our main results.
- Alternative Fixed Effects;
To more effectively control for unobserved time-invariant heterogeneity at the micro-level, we replaced the city fixed effects in the baseline model with household fixed effects and individual fixed effects. This specification controls for factors such as genetics, long-term family habits, and other persistent individual characteristics. The results demonstrate that, even with these stringent fixed effects, the coefficient of the policy variable remains significantly negative, further confirming the robustness of the estimates.
5. Mechanism Analysis and Heterogeneity Discussion
5.1. Mechanism Analysis
The preceding analysis established that the WEGP II project significantly improved the health levels of residents in nodal cities. Extensive literature indicates that air pollution is a critical determinant of health outcomes [57]. Air pollution comprises two main categories: indoor pollution, primarily stemming from household fuel combustion, and outdoor pollution, largely originating from industrial emissions. These two sources can interact and collectively contribute to overall atmospheric pollution. Given that the WEGP II project increases the supply of natural gas, potentially substituting for coal and other polluting fuels, it is expected to reduce pollution emissions on the consumption side and lower the incidence of related diseases. Therefore, we examine this pollution-reduction mechanism from both micro and macro perspectives, specifically at the household, firm, and city levels.
5.1.1. Household Energy Choice
Indoor air pollution is a leading risk factor for public health in many developing countries [58]. Household energy consumption constitutes a significant portion of China's energy demand [59], and an irrational energy structure directly affects resident health. This is primarily because the combustion of solid fuels, such as coal and biomass, releases substantial amounts of indoor pollutants that are easily inhaled [60]. Therefore, promoting a transition toward clean household energy is an effective pathway to improve family health.
To verify this channel, we matched the full sample with household energy usage data. Following the classification standards of [61] and the World Health Organization's guidelines on indoor air quality [62], we categorized household fuels as follows: "Traditional Energy" (charcoal, firewood, and crop residue/straw), "Polluting Energy" (unprocessed solid fuels like coal, and kerosene), and "Clean Energy" (Natural Gas). We constructed binary variables for the usage of these energy types and estimated the effects using the baseline model.
The regression results are reported in Table 3. Compared to households in non-nodal cities, the WEGP II project significantly reduces the probability of using traditional and polluting energy in nodal cities, while significantly increasing the probability of using natural gas (statistically significant at least at the 5% level). This result indicates that the WEGP II project has effectively promoted the upgrading of the household energy structure. Since substituting dirty fuels with clean fuels reduces the incidence of illness among family members [63], our findings confirm that the project improves public health by facilitating a clean energy transition at the household level.
5.1.2. Firm Pollution Reduction
Industrial energy consumption is a primary source of pollution emissions. Promoting the transition toward cleaner energy structures in the industrial sector is a crucial pathway to reconciling production growth with environmental protection. The WEGP II project provides an abundant supply of clean energy to firms in nodal cities, facilitating the clean transformation of their energy consumption structure [64] and reducing pollution emissions, thereby improving local public health.
To explore this pollution-reduction mechanism at the firm level, we matched the Annual Survey of Industrial Firms (ASIF) with the Environmental Statistics Database (ESD) to examine the impact of the WEGP II project on corporate emissions. Following the approach of [65], we selected five pollution indicators: sulfur dioxide (SO2), chemical oxygen demand (COD), smoke and dust, industrial wastewater (H2O), and nitrogen oxides (NOX) to capture the impact on various pollutant types.
The estimation results in Table 4 show that the WEGP II project significantly reduces the emissions of SO2, COD, smoke and dust, wastewater, and NOX. The coefficients of WEGT_Post are statistically significant . This implies that firms in regions traversed by the WEGP II project are better able to utilize clean energy, thereby reducing pollution emissions and improving public health.
5.1.3. City Environmental Performance
With the advancement of the "Healthy China" strategy and the construction of healthy cities, the importance of urban environmental performance for public health continues to rise. Among environmental performance indicators, urban air pollutant emissions are the direct cause of many public diseases, and these emissions depend on the environmental behaviors of micro-entities such as firms and households. The WEGP II project increases the share of natural gas in the energy supply of nodal cities, promoting an upgrade in the urban energy consumption structure.
While the previous sections verified the pollution reduction effects at the household and firm levels, investigating the mechanism at the city level helps validate these micro-channels from a macro perspective. Drawing on [66], we selected sulfur dioxide SO2, smoke and dust, and PM2.5 as the primary proxies for urban air pollutants. Additionally, we used urban natural gas (NG) consumption as a proxy for the energy structure transition.
The regression results in Columns (1)–(3) of Table 5 indicate that the WEGP II project significantly reduces urban emissions of SO2, smoke and dust, and PM2.5. Furthermore, the result in Column (4) confirms that the increased natural gas supply brought by the project effectively promotes a cleaner transformation of the urban energy consumption structure. This suggests that the WEGP II project improves resident health by optimizing the energy mix and reducing pollution emissions at the city level.
5.2. Heterogeneity Analysis
Given the variations in natural gas accessibility across regions and the differing physiological sensitivities to air pollution among demographic groups, the health benefits of the WEGP II project may not be uniform. Therefore, we examine the heterogeneity of these effects based on urban-rural attributes and age groups.
5.2.1. Urban-Rural Heterogeneity
The primary objective of the WEGP project is to alleviate the imbalance between regional economic development and energy supply. Cities are characterized by high population density and economic agglomeration. Their rapid development and substantial energy demand allow for economies of scale in natural gas supply. In contrast, rural areas are scattered, making the construction of supporting pipeline infrastructure difficult and costly, leading to a historically low share of natural gas consumption.
To investigate this disparity, we divided the full sample into urban and rural subsamples. The regression results, presented in Table A5, show that the coefficients of the interaction term WEGT_Post are significantly negative for both subsamples, indicating that the WEGP II project improves health outcomes in both urban and rural areas. However, the health benefits are more pronounced in urban areas compared to rural ones. We further conducted a coefficient difference test, which confirmed that this gap is statistically significant. The results suggest that while cities benefit most directly, the improvement in regional air quality driven by clean energy development in cities also generates positive spillover effects for adjacent rural residents.
5.2.2. Age Heterogeneity
Different age groups exhibit distinct sensitivities to environmental pollution. Theoretically, older adults often have weaker immune systems and pre-existing conditions, making them more susceptible to the adverse effects of air pollution [67]. To identify the differential impacts of the WEGP II project across age demographics, we examined the heterogeneity from the perspective of age structure.
Drawing on [68], we categorized the sample into three subgroups: children (1–15 years), adults (16–59 years), and the elderly (60 years and above). The regression results in Table A6 reveal that the WEGP II project generates health benefits across all three groups, regardless of whether control variables are included. However, the magnitude of the health improvement is largest for the elderly group. This finding aligns with the literature suggesting that pollution damage increases with age [69] and corroborates our mechanism that the project improves health primarily by reducing air pollution.
This finding has significant policy implications. As China faces the challenge of rapid population aging, maintaining and improving the health of the elderly is critical. Our results suggest that promoting clean energy development is an effective pathway to achieving "Healthy Aging" and mitigating the health risks associated with demographic shifts.
6. Further Analysis
6.1. Synergistic Effect of the "Coal-to-Gas" Policy
Achieving a green and low-carbon transformation of the energy structure requires simultaneous efforts on both the "energy supply" and "energy consumption" sides. While the WEGP II project ensures a sufficient supply of clean energy for nodal cities, its pollution reduction effect ultimately depends on the actual utilization of natural gas. The "Coal-to-Gas" (CTG) switching policy, through administrative promotion and subsidies, incentivizes the substitution of coal with natural gas, thereby promoting local clean energy development and reducing pollution emissions 70].
In practice, local governments have not issued a uniform national policy document for the CTG initiative, and implementation varies by region. To examine the synergistic effect of the policy on the health benefits of the WEGP project, drawing on the method of [70], we constructed a dummy variable, . This variable takes the value of 1 if a region experienced a decrease in coal consumption and an increase in natural gas consumption concurrently, and 0 otherwise. We then established the following Triple Difference (DDD) model:
In Equation (3), aside from the inclusion of the policy variable, all other variables remain consistent with the baseline regression. The core explanatory variable is the triple interaction term .
he regression results are reported in Table 6. Column (1) presents the results without control variables and fixed effects, while Columns (2) and (3) sequentially add controls and fixed effects. Column (4) includes the full set of controls and fixed effects. The estimates show that the absolute value of the coefficient for is larger than that of the baseline coefficient, and it remains statistically significant. This indicates that the CTG policy exerts a synergistic effect (or "amplifying effect"), suggesting that combining energy infrastructure construction with demand-side policy incentives can further accelerate the clean energy transition and enhance the health benefits of the WEGP project.
6.2. Welfare Analysis
Illness imposes not only physical suffering but also a series of economic burdens, such as medical expenses and productivity losses. Therefore, focusing solely on the health effects of the WEGP II project might underestimate its broader economic benefits. To provide a more comprehensive assessment, we analyzed the welfare effects of the project from two perspectives: medical costs (direct impact) and employment opportunities (indirect impact).
First, regarding the direct economic burden of disease, we used individual medical expenses and city-level medical expenditures as dependent variables. The regression results are reported in Columns (1) and (2) of Table 7. The findings indicate that the WEGP II project significantly reduces both personal and regional medical costs. Specifically, compared to non-nodal cities, residents in nodal cities saved an average of approximately 540 RMB in medical expenses, and the average city-level medical expenditure decreased by approximately 2.57 billion RMB.
Second, regarding the indirect economic impact manifested through labor market outcomes, we used individual employment status as the dependent variable. The results in Column (3) of Table 7 show that the WEGP II project significantly increases the probability of individual employment, with a coefficient of 0.069 (significant at the 1% level). This suggests that improved health enables a more active labor supply.
It is important to note that the above analysis represents a conservative estimate (or a lower bound) of the welfare effects generated by the WEGP project. This is because many hidden costs associated with disease—such as psychological distress (pain and suffering), efficiency losses due to presenteeism, and long-term sequelae—are difficult to observe and quantify. Therefore, the comprehensive social benefits brought by the WEGP II project are likely far greater than these estimates suggest.
7. Discussion
This study empirically investigates the health effects of clean energy infrastructure development by leveraging the "quasi-natural experiment" of the WEGP II project. Consistent with previous macro-level studies , we confirm that energy transition significantly reduces pollution emissions. However, unlike studies that focus solely on environmental metrics, our micro-level evidence from the CHNS data reveals that these environmental improvements translate directly into substantial public health benefits.
Our mechanism analysis highlights that the health benefits are driven by a dual channel: the optimization of household energy structures and the reduction of industrial pollution. This finding complements the work of by providing a complete chain of evidence from "infrastructure" to "emissions" and finally to "health." Furthermore, the heterogeneity analysis indicates that the elderly population benefits the most, providing a new perspective for addressing the health challenges of an aging society.
Limitations and Future Research Despite the robust findings, this study has limitations. First, due to data availability in the CHNS database, our sample period ends in 2015. While the immediate effects of the WEGP II project are captured, the long-term health accumulation effects in recent years require further verification as new data becomes available. Second, while we controlled for major concurrent policies, unobserved confounding factors may still exist. Future research could utilize more granular health data and encompass more recent energy infrastructure projects to validate and extend these findings.
8. Conclusions and Policy Implications
8.1. Conclusions
Clean energy development and public health improvement are not only key goals of the UN 2030 Agenda for Sustainable Development but also intrinsic requirements for China's energy revolution. Based on the integration of WEGP II nodal city data and CHNS micro-survey data, this paper draws the following conclusions:
Significant Health Improvement: The operation of the WEGP II project significantly reduces the probability of illness among residents in nodal cities compared to non-nodal areas.
Dual Mechanisms: The project improves health by promoting the transition to clean household fuels (reducing indoor pollution) and providing clean energy for firms (reducing industrial emissions).
Heterogeneous Benefits: The health dividends are more pronounced in urban areas and among the elderly population, who are more sensitive to air quality.
Policy Synergy and Welfare: The "Coal-to-Gas" policy amplifies the health benefits of the infrastructure. Furthermore, the project generates significant social welfare by reducing individual medical expenses by approximately 540 RMB and city-level medical expenditures by 2.57 billion RMB, while also boosting local employment.
8.2. Policy Implications
Based on the above findings, we propose the following policy recommendations:
Enhancing the Clean Energy Supply Network To maximize health benefits, the government must prioritize the construction of energy infrastructure.Expand Infrastructure: Accelerate the construction of the national natural gas pipeline network to broaden the coverage of gas supply.Diversify Sources: Increase the development of domestic unconventional gas (shale gas, coalbed methane) and strategically import high-quality natural gas to ensure supply security.Multi-Energy Complementarity: Build a comprehensive energy system that integrates natural gas with solar, wind, hydrogen, and nuclear power to enhance the consumption and storage capacity of clean energy.
Promoting Clean Energy Consumption on the Demand Side Simultaneous reforms on the "consumption side" are essential to complement the "supply side."For Firms: Use market-based instruments to incentivize firms to switch to clean energy. Rigorously control new energy-intensive projects and phase out outdated production capacity to improve terminal energy efficiency.For Households: Strengthen public education to raise awareness of the health risks of solid fuels. Provide targeted subsidies for natural gas connection and usage to lower the transition cost for households, thereby accelerating the substitution of traditional polluting fuels.
Strengthening Policy Coordination and Social Welfare Policy design should focus on maximizing the comprehensive social value of energy projects.Synergistic Governance: Strengthen the coordination between energy infrastructure policies and environmental regulations (e.g., "Coal-to-Gas"). A supportive policy system is needed to ensure that infrastructure is effectively utilized.Focus on Vulnerable Groups: Given that the elderly benefit most from the energy transition, policymakers should promote clean energy reforms in elderly care institutions and communities. This serves as a proactive strategy to cope with population aging.Regional Equity: Leverage the spillover effects of urban infrastructure to support clean energy development in rural areas. Tailor energy solutions (e.g., photovoltaics, biomass) to local conditions in rural regions to bridge the urban-rural health gap.
Author Contributions
Conceptualization, H.L. and B.Z.; methodology, H.L.; software, H.L.; validation, H.L. and B.Z.; formal analysis, H.L.; investigation, H.L.; resources, B.Z.; data curation, H.L.; writing—original draft preparation, H.L.; writing—review and editing, H.L. and B.Z.; visualization, H.L.; supervision, B.Z.; project administration, H.L.; funding acquisition, B.Z. All authors have read and agreed to the published version of the manuscript.
Funding
This research received no external funding.
Institutional Review Board Statement
Not applicable.
Informed Consent Statement
Not applicable.
Data Availability Statement
Publicly available datasets were analyzed in this study. The China Health and Nutrition Survey (CHNS) data can be found here: https://www.cpc.unc.edu/projects/china.Other macro-level data are available from the China City Statistical Yearbook and relevant government publications..
Conflicts of Interest
The authors declare no conflicts of interest.
Appendix A
Appendix A.1

Table A1.
Sample Selection Bias Test Results.
| (1) | (2) | (3) | |
| Variable | Excluding Provincial Capitals | Excluding YRD Region | Using Pipeline-Adjacent Provinces Sample |
| WEGT_Post | -0.0735*** | -0.0595*** | -0.0785*** |
| (-0.0171) | (-0.0202) | (-0.0278) | |
| Constant | -0.3957* | -0.0135 | 0.5204 |
| (-0.2258) | (-0.1728) | (-0.3798) | |
| Individual Controls | Yes | Yes | Yes |
| Household Controls | Yes | Yes | Yes |
| Regional Controls | Yes | Yes | Yes |
| Year Fixed Effects | Yes | Yes | Yes |
| City Fixed Effects | Yes | Yes | Yes |
| Observations | 35,404 | 33,708 | 16,944 |
| Adj. R2 | 0.0317 | 0.0311 | 0.0336 |
* Note:Same as Table 2.
Table A2.
Excluding Interference from Concurrent Energy Projects and Environmental Policies.
| (1) | (2) | (3) | (4) | (5) | (6) | |
| Variable | Shaanxi-Beijing Line 3 | Qin-Shen Line | Low-carbon City | Carbon Trading Market | Action Plan (Atmosphere Ten) | Simultaneous Exclusion |
| WEGT_Post | -0.0997*** | -0.0803*** | -0.0706*** | -0.0652*** | -0.0606** | -0.0773*** |
| (-0.0244) | (-0.0255) | (-0.0216) | (-0.014) | (-0.0241) | (-0.0155) | |
| Constant | -0.1674 | 0.0752 | -0.0177 | -0.1531* | -0.0292 | -0.1553* |
| (-0.1259) | (-0.1852) | (-0.1249) | (-0.0902) | (-0.124) | (-0.0872) | |
| Individual Controls | Yes | Yes | Yes | Yes | Yes | Yes |
| Household Controls | Yes | Yes | Yes | Yes | Yes | Yes |
| Regional Controls | Yes | Yes | Yes | Yes | Yes | Yes |
| Year Fixed Effects | Yes | Yes | Yes | Yes | Yes | Yes |
| City Fixed Effects | Yes | Yes | Yes | Yes | Yes | Yes |
| Observations | 38,193 | 36,623 | 40,265 | 40,265 | 40,265 | 40,265 |
| Adj. R2 | 0.0341 | 0.0359 | 0.0339 | 0.0353 | 0.034 | 0.0355 |
* Note:Same as Table 2.
Table A3.
Results After Excluding Interference from Engineering Projects, Other Energy & Energy Facility Construction.
Table A3.
Results After Excluding Interference from Engineering Projects, Other Energy & Energy Facility Construction.
| (1) | (2) | (3) | (4) | (5) | |
| Variable | Excluding WEGP Line I | Project Overlapping Areas | Excluding LPG | Excluding Energy Infrastructure | Simultaneous Exclusion |
| WEGT_Post | -0.0890*** | -0.0884** | -0.0928*** | -0.0817** | -0.1003*** |
| (-0.0277) | (-0.0345) | (-0.019) | (-0.0303) | (-0.0219) | |
| Constant | -0.0266 | 0.3143 | -0.0557 | -0.2602 | -0.1115 |
| (-0.1857) | (-0.5045) | (-0.1191) | (-0.2614) | (-0.3642) | |
| Individual Controls | Yes | Yes | Yes | Yes | Yes |
| Household Controls | Yes | Yes | Yes | Yes | Yes |
| Regional Controls | Yes | Yes | Yes | Yes | Yes |
| Year Fixed Effects | Yes | Yes | Yes | Yes | Yes |
| City Fixed Effects | Yes | Yes | Yes | Yes | Yes |
| Observations | 40,265 | 33,920 | 37,473 | 25,286 | 24,049 |
| Adj. R2 | 0.0336 | 0.035 | 0.0368 | 0.0475 | 0.0495 |
* Note:Same as Table 2.
Table A4.
Results for Alternative Dependent Variables, Excluding Omitted Variables, and Changing Fixed Effects.
Table A4.
Results for Alternative Dependent Variables, Excluding Omitted Variables, and Changing Fixed Effects.
| Variable | Respiratory Diseases | Cardiovascular Diseases | City × Time | Province × Time | Household FE | Individual FE |
| WEGT_Post | -0.0113*** | -0.0322*** | -0.0697*** | -0.0906*** | -0.0883*** | -0.0868* |
| (-0.0028) | (-0.0081) | (-0.0205) | (-0.0217) | (-0.0272) | (-0.0319) | |
| Constant | 0.0247 | -0.1787* | -0.0513 | 0.06517 | 0.03376 | 0.0137 |
| (-0.0158) | (-0.0921) | (-0.1299) | (-0.1306) | (-0.0539) | (-0.0422) | |
| Individual Controls | Yes | Yes | Yes | Yes | Yes | Yes |
| Household Controls | Yes | Yes | Yes | Yes | Yes | Yes |
| Regional Controls | Yes | Yes | Yes | Yes | Yes | Yes |
| Year Fixed Effects | Yes | Yes | Yes | Yes | Yes | Yes |
| City Fixed Effects | Yes | Yes | Yes | Yes | No | No |
| Household Fixed Effects | No | No | No | No | Yes | No |
| Individual Fixed Effects | No | No | No | No | No | Yes |
| Observations | 31,000 | 40,184 | 40,265 | 40,265 | 39,530 | 30,792 |
| Adj. R2 | 0.0122 | 0.1306 | 0.0342 | 0.034 | 0.0527 | 0.0294 |
* Note:Same as Table 2.
Table A5.
Urban-Rural Attributes.
| Variable | Rural | Urban | ||
| (1) | (2) | (3) | (4) | |
| WEGT_Post | -0.0716*** | -0.0657*** | -0.0861*** | -0.0989*** |
| (-0.0194) | (-0.0189) | (-0.0279) | (-0.0342) | |
| Constant | 0.1581*** | -0.1652 | 0.1795*** | 0.1573 |
| (-0.0016) | (-0.1653) | (-0.0032) | (-0.2257) | |
| Individual Controls | No | Yes | No | Yes |
| Household Controls | No | Yes | No | Yes |
| Regional Controls | No | Yes | No | Yes |
| Year Fixed Effects | Yes | Yes | Yes | Yes |
| City Fixed Effects | Yes | Yes | Yes | Yes |
| Observations | 32,577 | 24,887 | 18,869 | 15,378 |
| Adj. R2 | 0.0135 | 0.0312 | 0.0144 | 0.0402 |
* Note:Same as Table 2.
Table A6.
Age Differences.
| Children (1-15 years) | Adults (16-59 years) | Elderly (60+ years) | ||||
| Variable | (1) | (2) | (3) | (4) | (5) | (6) |
| WEGT_Post | -0.0964*** | -0.0824* | -0.0533*** | -0.0646*** | -0.1383*** | -0.1351*** |
| (-0.0321) | (-0.046) | (-0.0185) | (-0.0223) | (-0.0402) | (-0.0498) | |
| Constant | 0.1086*** | 0.6587** | 0.1326*** | -0.0298 | 0.2714*** | 0.1857 |
| (-0.0032) | (-0.2917) | (-0.0015) | (-0.1878) | (-0.0046) | (-0.2112) | |
| Individual Controls | No | Yes | No | Yes | No | Yes |
| Household Controls | No | Yes | No | Yes | No | Yes |
| Regional Controls | No | Yes | No | Yes | No | Yes |
| Year Fixed Effects | Yes | Yes | Yes | Yes | Yes | Yes |
| City Fixed Effects | Yes | Yes | Yes | Yes | Yes | Yes |
| Observations | 4,757 | 3,505 | 33,269 | 29,238 | 13,419 | 11,027 |
| Adj. R2 | 0.0103 | 0.0194 | 0.012 | 0.0181 | 0.026 | 0.0386 |
* Note:Same as Table 2.
References
- Chen, R.; Zhou, S. Energy conservation target policy and regional coordinated development: Evidence from Chinese enterprises. World Econ. 2022, 45, 205–232. [Google Scholar]
- Fan, D.; Ye, Y.; Wang, W. Air pollution control and public health: Evidence from the "Atmosphere Ten Articles" policy. Stat. Res. 2021, 38, 60–74. [Google Scholar]
- Fan, Y.; Yi, B. The laws, driving mechanisms and Chinese path of energy transition. Manag. World 2021, 37, 95–105. [Google Scholar]
- Han, J. Path exploration of "soft landing" of energy structure adjustment: Developing clean utilization of coal, solving energy dilemma, and practicing energy revolution. Manag. World 2016, 32, 3–7. [Google Scholar]
- Jia, K.; Xia, Y.; Zhao, G. Home and community-based elderly care services and the mental health of the elderly. World Econ. 2023, 46, 163–185. [Google Scholar]
- Li, H.; Tong, M.; Zhang, G.; Zhao, J. Research on the effect of cross-regional energy scheduling on promoting enterprise emission reduction. J. Quant. Tech. Econ. 2023, 40, 156–178. [Google Scholar]
- Li, Q.; Zhao, R.; Zhang, T. Does the pension insurance system alleviate the adverse impact of widowhood on the health of the elderly? World Econ. 2021, 44, 180–206. [Google Scholar]
- Li, W.; Zhang, K. The impact of air pollution on enterprise productivity: Evidence from Chinese industrial enterprises. Manag. World 2019, 35, 95–112+119. [Google Scholar]
- Li, Z.; Chen, J.; Lian, Y.; Li, M. Economic policy uncertainty and corporate short-term debt for long-term use. Manag. World 2022, 38, 77–89+143+90–101. [Google Scholar]
- Liang, C.; Lin, C.; Wang, S. Rural living environment, resident health and medical burden: Research based on "Toilet Revolution". World Econ. 2023, 46, 197–224. [Google Scholar]
- Lin, B.; Li, J. Transformation of China's energy structure under environmental governance constraints: Analysis based on coal and carbon dioxide peaks. Soc. Sci. China 2015, 9, 84–107+205. [Google Scholar]
- Liu, H.; Shi, Y.; Guo, L.; Qiao, L. China's energy revolution in the new era: Course, achievements and prospects. Manag. World 2022, 38, 6–24. [Google Scholar]
- Luo, Z.; Li, H. The impact of the implementation of the "Atmosphere Ten Articles" policy on air quality. China Ind. Econ. 2018, 9, 136–154. [Google Scholar]
- Ma, L.; Huang, C. Financial drive and renewable energy development: Dynamic evolutionary analysis based on cross-country data. China Ind. Econ. 2022, 4, 118–136. [Google Scholar]
- Shao, C. How does import competition affect corporate environmental performance: Evidence from the quasi-natural experiment of China's accession to the WTO. China Econ. Q. 2021, 21, 1615–1638. [Google Scholar]
- Shen, X.; Chen, Y.; Lin, B. The impact of technological progress and industrial structure distortion on China's energy intensity. Econ. Res. J. 2021, 56, 157–173. [Google Scholar]
- Available online: https://www.gov.cn/xinwen/2022-07/06/content_5699422.htm.
- Available online: https://www.cpc.unc.edu/projects/china.
- Song, H.; Sun, Y.; Chen, D. Assessment of government air pollution control effects: Empirical research from China's "low-carbon city" construction. Manag. World 2019, 35, 95–108+195. [Google Scholar]
- Ta, Y.; Fu, H.; Li, L. The impact of changes in patient cost sharing on medical expenses and health outcomes: Empirical analysis based on inpatient medical record home page data. China Econ. Q. 2020, 19, 1441–1466. [Google Scholar]
- Tang, Y.; Liang, R. Can energy substitution policy improve air quality: Also on the impact of energy pricing mechanism. China Popul. Resour. Environ. 2018, 28, 80–92. [Google Scholar]
- Tian, K.; Xing, W.; Shi, G. Health effects of tax reform: Evidence based on suicide behavior of middle-aged and elderly people. China Econ. Q. 2022, 22, 2063–2084. [Google Scholar]
- Wang, S.; Jiang, J. Regional unbalanced evolution of China's Human Development Index (HDI) and its structural decomposition. J. Quant. Tech. Econ. 2020, 37, 85–106. [Google Scholar]
- Wang, S.; Yang, C. Health expenditure structure, personal health investment and resident welfare. Econ. Res. J. 2023, 58, 190–208. [Google Scholar]
- Wang, Y.; Luo, N. Air pollution, health depreciation and medical costs: Research based on the triple perspectives of physiology, psychology and social adaptability. Econ. Res. J. 2020, 55, 80–97. [Google Scholar]
- Wu, S.; Zheng, X. Income growth and household energy consumption ladder: Re-examination based on survey data of rural household energy consumption in China. China Econ. Q. 2022, 22, 45–66. [Google Scholar]
- Xie, Q.; Feng, J. Health effects and welfare effects of environmental regulation. China Econ. Q. 2023, 23, 894–912. [Google Scholar] [CrossRef]
- Xie, Z.; Jing, Z.; Yang, M. Water resource constraint alleviation and regional economic growth: Empirical evidence from the "South-to-North Water Diversion" project. J. Quant. Tech. Econ. 2023, 40, 93–115. [Google Scholar]
- Xing, W.; Tian, K.; Shi, G. Alcohol consumption, disease risk and health costs. World Econ. 2021, 44, 178–202. [Google Scholar]
- Xu, B.; Chen, Y.; Shen, X. Clean energy development, carbon dioxide emissions and regional economic growth. Econ. Res. J. 2019, 54, 188–202. [Google Scholar]
- Xu, W.; Sun, L. Market-incentive environmental regulation and energy consumption structure transformation: Empirical evidence from China's carbon emission trading pilot. J. Quant. Tech. Econ. 2023, 40, 133–155. [Google Scholar]
- Zhang, M. How does trade liberalization affect resident health? Evidence from China's accession to the WTO. China Econ. Q. 2021, 21, 819–842. [Google Scholar]
- Zhang, X.; Huang, X.; Zhang, D.; Geng, Y.; Tian, L.; Fan, Y.; Chen, W. Research on energy economic transition path and policy under the carbon neutrality goal. Manag. World 2022, 38, 35–66. [Google Scholar]
- Zhao, J.; Zhou, D. The impact of self-employment on the health of migrant workers. World Econ. 2021, 44, 184–204. [Google Scholar]
- Abrell, J.; Rausch, S.; Streitberger, C. The economics of renewable energy support. J. Public Econ. 2019, 176, 94–117. [Google Scholar] [CrossRef]
- Adhvaryu, A.; Molina, T.; Nyshadham, A.; Tamayo, J.; Torres, N. The health costs of dirty energy: Evidence from the capacity market in Colombia. J. Dev. Econ. 2023, 164, 103116. [Google Scholar] [CrossRef]
- Afridi, F.; Debnath, S.; Somanathan, E. A breath of fresh air: Raising awareness for clean fuel adoption. J. Dev. Econ. 2021, 151, 102674. [Google Scholar] [CrossRef]
- Allcott, H.; Kessler, J.B. The welfare effects of nudges: A case study of energy use social comparisons. Am. Econ. J. Appl. Econ. 2019, 11, 236–276. [Google Scholar] [CrossRef]
- Barreca, A.I.; Neidell, M.; Sanders, N.J. Long-run pollution exposure and mortality: Evidence from the acid rain program. J. Public Econ. 2021, 200, 104440. [Google Scholar] [CrossRef]
- Blundell, W.; Kokoza, A. Natural gas flaring, respiratory health, and distributional effects. J. Public Econ. 2022, 208, 104601. [Google Scholar] [CrossRef]
- Cesur, R.; Tekin, E.; Ulker, A. Air pollution and infant mortality: Evidence from the expansion of natural gas infrastructure. Econ. J. 2017, 127, 330–362. [Google Scholar] [CrossRef]
- Cheung, C.W.; He, G.; Pan, Y. Mitigating the air pollution effect? The remarkable decline in the pollution-mortality relationship in Hong Kong. J. Environ. Econ. Manag. 2020, 101, 102316. [Google Scholar] [CrossRef]
- Cullen, J. Measuring the environmental benefits of wind-generated electricity. Am. Econ. J. Econ. Policy 2013, 5, 107–133. [Google Scholar] [CrossRef]
- Currie, J.; Neidell, M. Air pollution and infant health: What can we learn from California's recent experience? Q. J. Econ. 2005, 120, 1003–1030. [Google Scholar]
- Deryugina, T.; Heutel, G.; Miller, N.H.; Molitor, D.; Reif, J. The mortality and medical costs of air pollution: Evidence from changes in wind direction. Am. Econ. Rev. 2019, 109, 4178–4219. [Google Scholar] [CrossRef]
- Duan, M.; Li, L.; Liu, X.; Pei, J.; Song, H. Turning awareness into behavior: Meta-analysis of household residential life energy transition behavior from the dual perspective of internal driving forces and external inducing forces. Energy 2023, 279, 128072. [Google Scholar] [CrossRef]
- Duque, V.; Gilraine, M. Coal use, air pollution, and student performance. J. Public Econ. 2022, 213, 104712. [Google Scholar] [CrossRef]
- Fan, H.; Lin, F.; Lin, S. The hidden cost of trade liberalization: Input tariff shocks and worker health in China. J. Int. Econ. 2020, 126, 103349. [Google Scholar] [CrossRef]
- Fell, H.; Kaffine, D.T.; Novan, K. Emissions, transmission, and the environmental value of renewable energy. Am. Econ. J. Econ. Policy 2021, 13, 241–272. [Google Scholar] [CrossRef]
- Gao, Y.; Zheng, J. Clearing the air through pipes? An evaluation of the air pollution reduction effect of China's natural gas pipeline projects. Energy Policy 2022, 160, 112649. [Google Scholar] [CrossRef]
- Gupta, A.; Spears, D. Health externalities of India's expansion of coal plants: Evidence from a national panel of 40,000 households. J. Environ. Econ. Manag. 2017, 86, 262–276. [Google Scholar] [CrossRef] [PubMed]
- Hanna, R.; Oliva, P. Moving up the energy ladder: The effect of an increase in economic well-being on the fuel consumption choices of the poor in India. Am. Econ. Rev. 2015, 105, 242–246. [Google Scholar] [CrossRef]
- He, G.; Liu, T.; Zhou, M. Straw burning, PM2.5, and death: Evidence from China. J. Dev. Econ. 2020, 145, 102468. [Google Scholar] [CrossRef]
- Helm, C.; Mier, M. Steering the energy transition in a world of intermittent electricity supply: Optimal subsidies and taxes for renewables and storage. J. Environ. Econ. Manag. 2021, 109, 102497. [Google Scholar] [CrossRef]
- Huang, J.; Xing, J.; Zou, E.Y. (Re)Scheduling pollution exposure: The case of surgery schedules. J. Public Econ. 2023, 219, 104825. [Google Scholar] [CrossRef]
- Imelda. Cooking that kills: Cleaner energy access, indoor air pollution, and health. J. Dev. Econ. 2020, 147, 102548. [Google Scholar] [CrossRef]
- Ito, K.; Ida, T.; Tanaka, M. Moral suasion and economic incentives: Field experimental evidence from energy demand. Am. Econ. J. Econ. Policy 2018, 10, 240–267. [Google Scholar] [CrossRef]
- Kuang, Y.; Lin, B. Unwatched pollution reduction: The effect of natural gas utilization on air quality. Energy 2023, 273, 127247. [Google Scholar] [CrossRef]
- Li, P.; Lu, Y.; Wang, J. Does flattening government improve economic performance? Evidence from China. J. Dev. Econ. 2016, 123, 18–37. [Google Scholar] [CrossRef]
- Novan, K. Valuing the wind: Renewable energy policies and air pollution avoided. Am. Econ. J. Econ. Policy 2015, 7, 291–326. [Google Scholar] [CrossRef]
- Pan, S. Health, air pollution, and location choice. J. Environ. Econ. Manag. 2023, 119, 102794. [Google Scholar] [CrossRef]
- Tang, Y.; Liang, R.B. Does energy substitution improve air quality: Analysis from energy pricing mechanism. China Popul. Resour. Environ. 2018, 28, 80–92. (In Chinese) [Note: This seems to be the English translation of ref 19, but listed as English in your image. I kept the English title from the image]. [Google Scholar]
- Verma, A.P.; Imelda. Clean energy access: Gender disparity, health and labour supply. Econ. J. 2023, 133, 845–871. [Google Scholar] [CrossRef]
- Xu, S.; Klaiber, H.A. The impact of new natural gas pipelines on emissions and fuel consumption in China. Resour. Energy Econ. 2019, 55, 49–62. [Google Scholar] [CrossRef]
- Zheng, L. Research on the impact of mega-projects on carrying capacity of cities taking the first-line project of the west-east gas pipeline as an example. J. Manag. Sci. Eng. 2020, 5, 195–211. [Google Scholar] [CrossRef]
- Zhang, D.; Wang, J.; Zheng, X. Environmental Benefits of the West-East Natural Gas Transmission Project: Cross-Regional Energy Optimization and Transformation for Sustainable Development. Energies 2024, 17, 3820. [Google Scholar]
- Yang, Z.; Liu, Y. Can household clean energy transition reduce medical expenditures? Evidence from China. Front. Public Health 2024, 12, 1385416. [Google Scholar]
- Zhu, J.; Fan, Y.; Deng, X.; Xue, L. The Impact of “Coal to Gas” Policy on Air Quality: Evidence from Beijing, China. Energies 2020, 13, 3876. [Google Scholar] [CrossRef]
- Zhang, Y.; Li, F.; Li, Z. Impacts of the West-East Gas Pipeline Project on energy conservation and emission reduction: Empirical evidence from Hubei province in Central China. Environ. Sci. Pollut. Res. 2022, 29, 32156–32171. [Google Scholar]
- Li, P.; Lu, Y.; Wang, J. How does natural gas consumption affect human health? Empirical evidence from China. Environ. Sci. Pollut. Res. 2022, 29, 5678–5690. [Google Scholar]
Figure 1.
Parallel Trend Test.
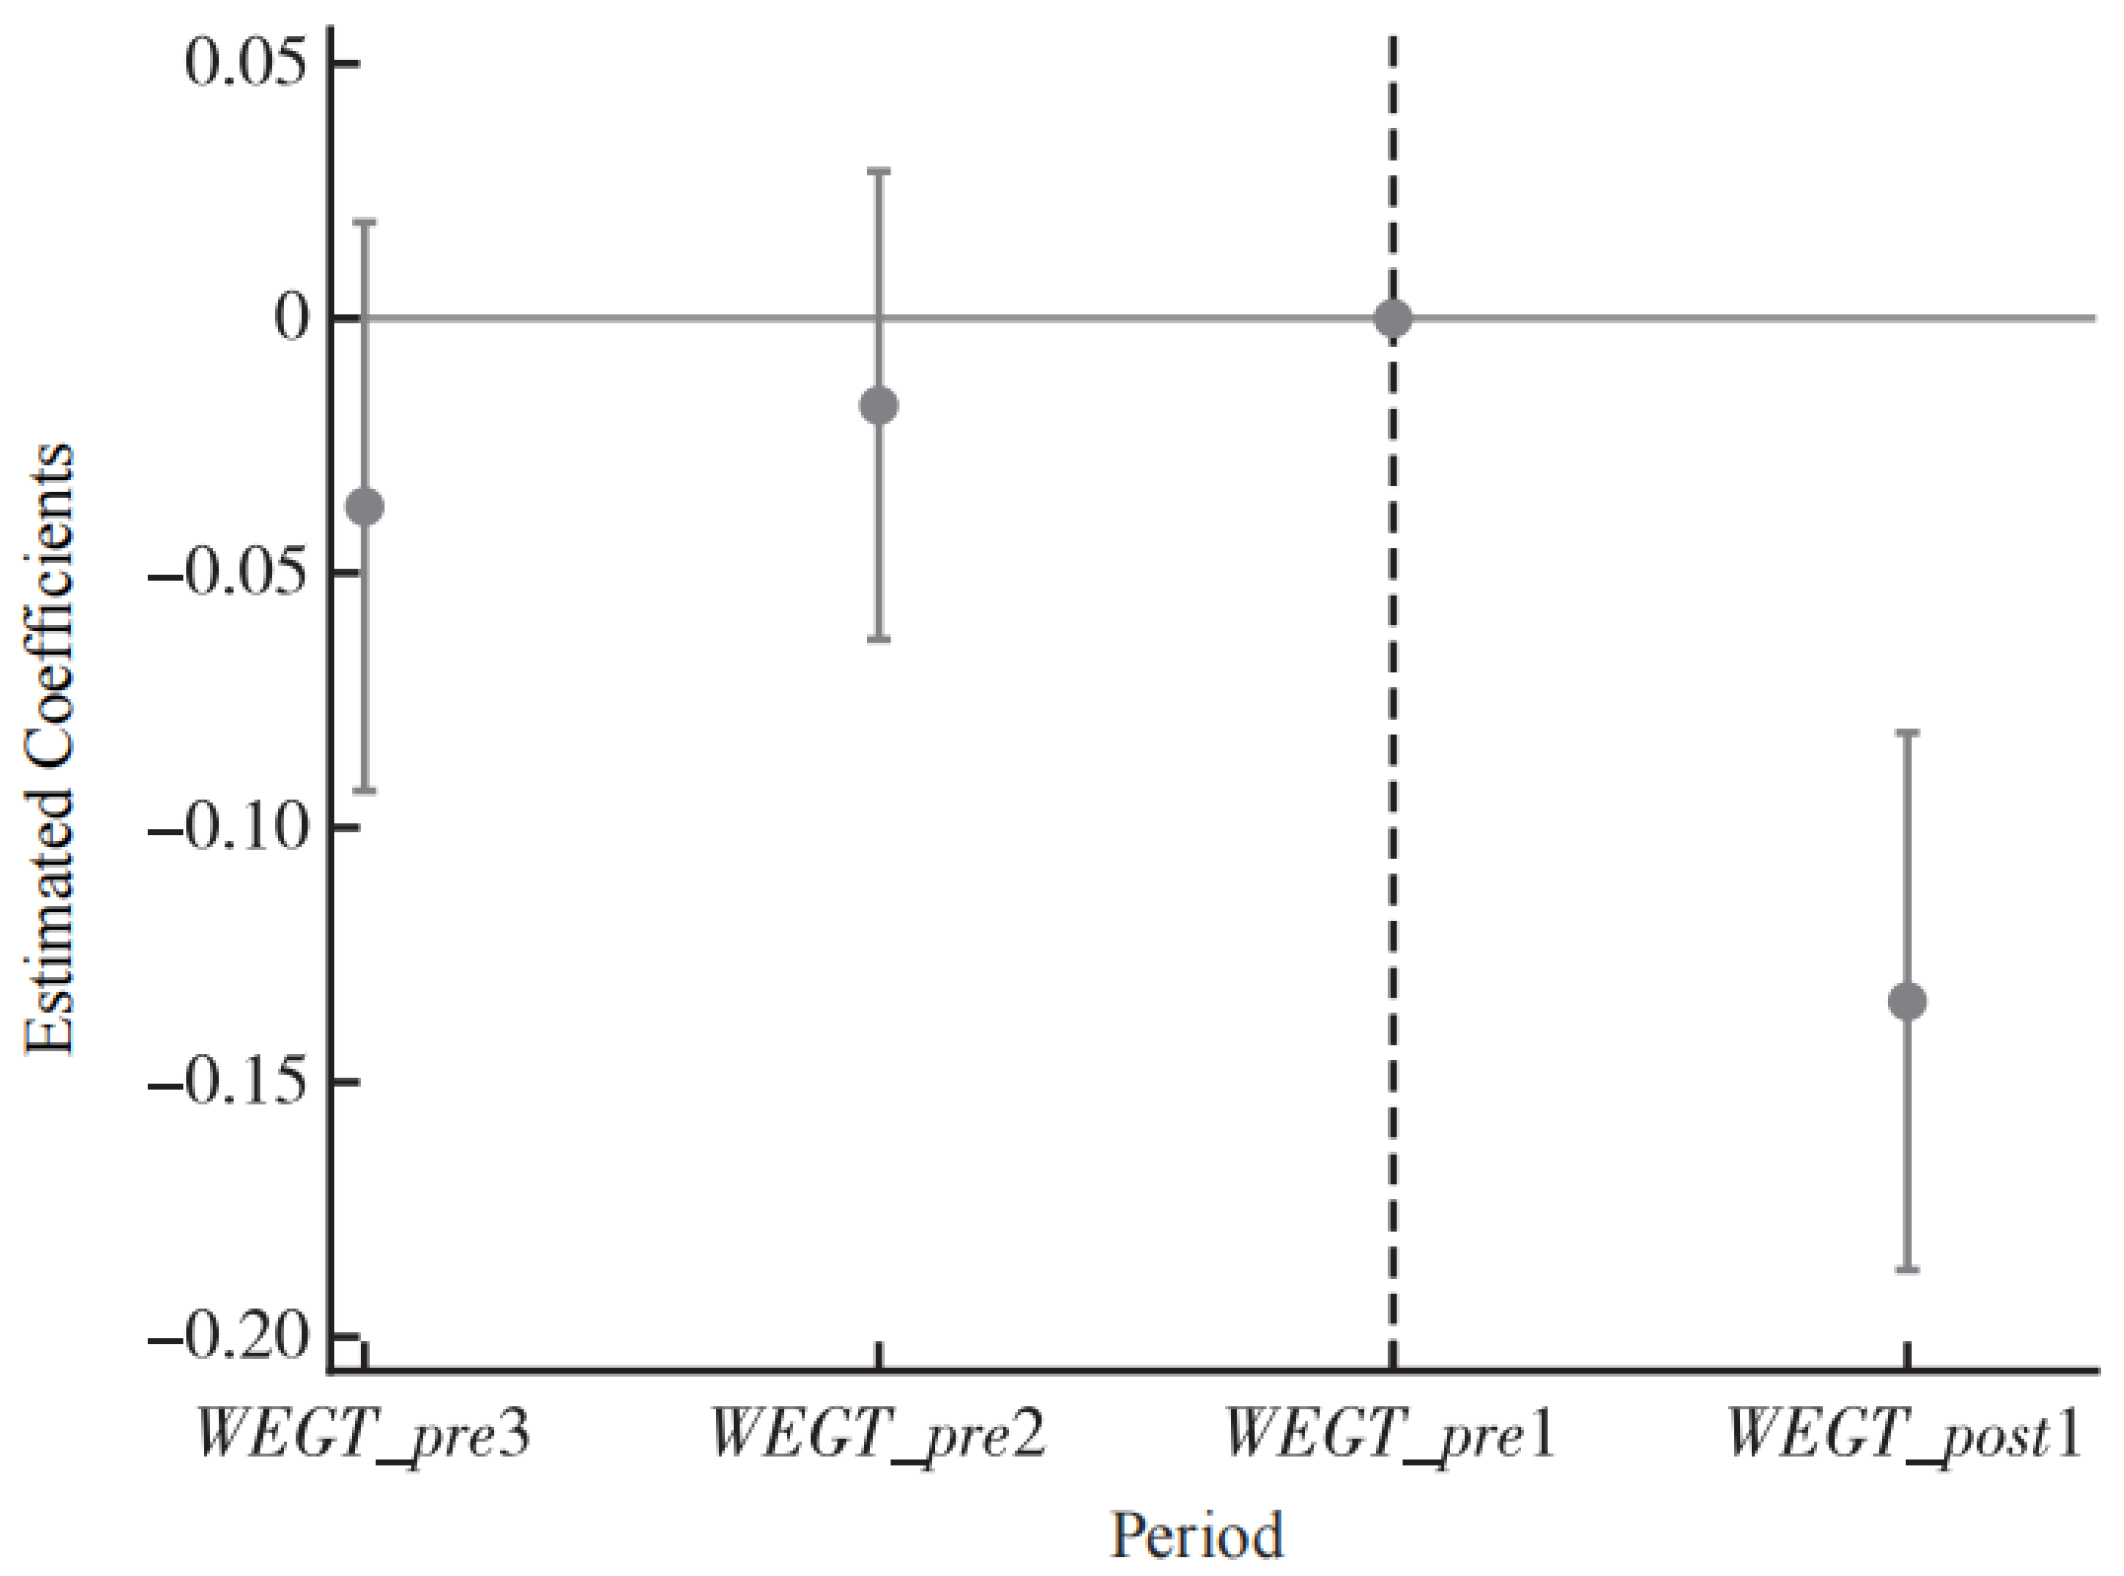
Figure 2.
Placebo Test Results..
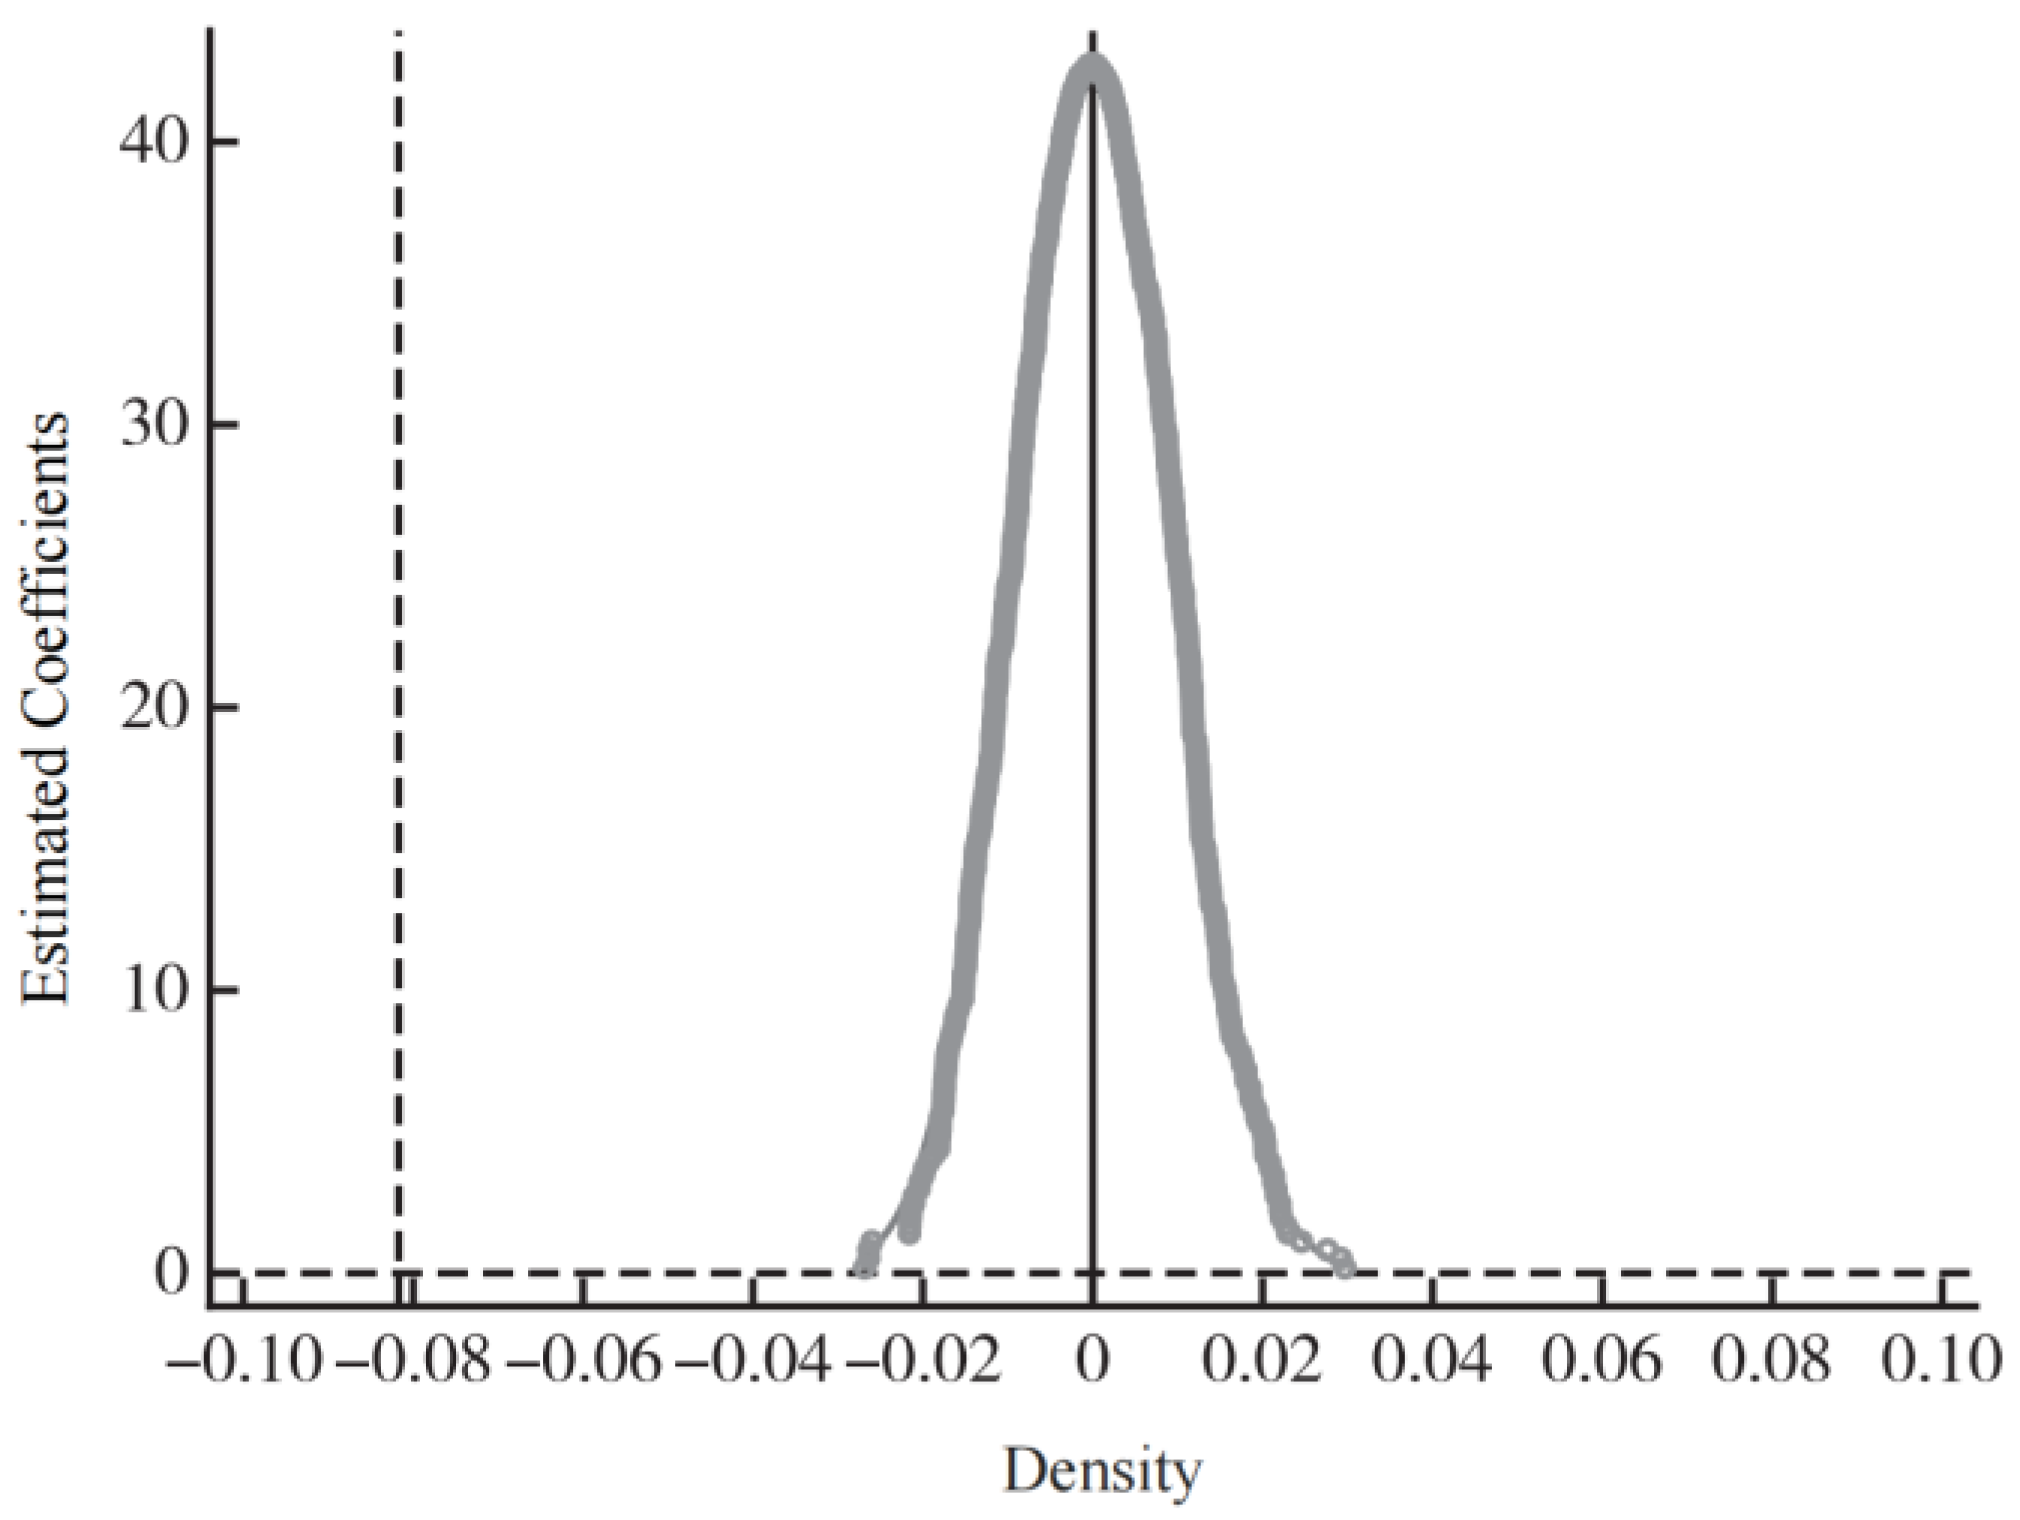
Table 1.
Descriptive Statistics of Variables.
| Variable | Definition | N | Mean | Std. Dev. | N | Mean | Std. Dev. |
| WEGT Nodes (Treatment) | Non-WEGT Nodes (Control) | ||||||
| Illness Rate | 1 if sick/injured in past 4 weeks, 0 otherwise | 10909 | 0.182 | 0.53 | 40537 | 0.153 | 0.48 |
| Age | Actual age of respondent | 10931 | 44.61 | 20 | 40593 | 46.48 | 18.99 |
| Gender | 1 for Male, 0 for Female | 10932 | 0.483 | 0.5 | 40593 | 0.478 | 0.5 |
| Education | Years of schooling | 10332 | 7.901 | 4.776 | 38133 | 8.306 | 5.019 |
| Marital Status | 1 if Married, 0 otherwise | 9540 | 0.886 | 0.317 | 36191 | 0.924 | 0.265 |
| Agriculture | 1 if agricultural job, 0 other jobs | 9652 | 0.196 | 0.397 | 36504 | 0.204 | 0.403 |
| Medical Ins. | 1 if insured, 0 otherwise | 10931 | 0.799 | 0.401 | 40593 | 0.856 | 0.352 |
| Hukou | 1 for Urban, 0 for Rural | 10932 | 0.314 | 0.464 | 40593 | 0.381 | 0.486 |
| Income | Household income per capita (log) | 10365 | 1.887 | 1.431 | 38245 | 2.042 | 1.559 |
| Family Size | Number of family members | 10775 | 4.29 | 1.816 | 39966 | 3.591 | 1.533 |
| Population | City population (log/10k) | 10074 | 1.143 | 0.673 | 38282 | 1.629 | 1.686 |
| Hospital Beds | Number of beds (log/10k) | 10717 | 1.395 | 1.081 | 38760 | 3.581 | 4.125 |
Table 2.
Baseline Regression Results.
| Variables | -1 | -2 | -3 | -4 |
| WEGT_Post | -0.033 ** | -0.063 ** | -0.078 *** | -0.082 *** |
| (-0.013) | (-0.024) | (-0.019) | (-0.026) | |
| Constant | 0.162 *** | 0.016 | 0.166 *** | 0.032 |
| (-0.011) | (-0.027) | (-0.002) | (-0.181) | |
| Individual Controls | No | Yes | No | Yes |
| Household Controls | No | Yes | No | Yes |
| City Controls | No | Yes | No | Yes |
| Year FE | No | No | Yes | Yes |
| City FE | No | No | Yes | Yes |
| Observations | 51,446 | 40,265 | 51,446 | 40,265 |
| Adjusted R2 | 0 | 0.023 | 0.013 | 0.034 |
* Note: *, **, and *** indicate significance at the 10%, 5%, and 1% levels, respectively. Robust standard errors clustered at the city level are reported in parentheses.ables may have a footer.
Table 3.
THousehold Energy Choices.
| Variable | (1) Traditional Energy |
(2) Polluting Energy |
(3) Natural Gas |
| WEGT_Post | -0.028** | -0.046*** | 0.062*** |
| (-0.013) | (-0.012) | (-0.011) | |
| Constant | 0.363*** | 0.783*** | 0.183*** |
| (-0.035) | (-0.027) | (-0.019) | |
| Individual Controls | Yes | Yes | Yes |
| Household Controls | Yes | Yes | Yes |
| Regional Controls | Yes | Yes | Yes |
| Household FE | Yes | Yes | Yes |
| Year FE | Yes | Yes | Yes |
| Observations | 14,154 | 14,154 | 14,154 |
| Adj. R-squared | 0.499 | 0.562 | 0.639 |
* Note: Standard errors clustered at the city level are in parentheses. ***, **, and * indicate significance at the 1%, 5%, and 10% levels, respectively. "Traditional Energy" includes charcoal, firewood, and crop residue; "Polluting Energy" includes coal and kerosene.
Table 4.
Firm Pollution Reduction.
| Variable | (1) SO2 |
(2) COD |
(3) Smoke |
(4) H2O |
(5) NOx |
| WEGT_Post | -0.252** | -0.337*** | -0.197* | -0.740** | -0.185** |
| (-0.121) | (-0.061) | (-0.119) | (-0.292) | (-0.088) | |
| Constant | 92.829*** | 6.191*** | -6.621*** | 97.291*** | -15.970*** |
| (-6.519) | (-0.893) | (-0.321) | (-14.547) | (-0.71) | |
| Individual Controls | Yes | Yes | Yes | Yes | Yes |
| Household Controls | Yes | Yes | Yes | Yes | Yes |
| Regional Controls | Yes | Yes | Yes | Yes | Yes |
| Firm FE | Yes | Yes | Yes | Yes | Yes |
| Year FE | Yes | Yes | Yes | Yes | Yes |
| Industry FE | Yes | Yes | Yes | Yes | Yes |
| Observations | 269,655 | 247,937 | 270,263 | 307,449 | 255,676 |
| Adj. R-squared | 0.246 | 0.085 | 0.069 | 0.051 | 0.278 |
* Note: Standard errors clustered at the city level are in parentheses. ***, **, and * indicate significance at the 1%, 5%, and 10% levels, respectively. The control variables are consistent with Table 2.
Table 5.
City Environmental Performance.
| Variable | (1) SO2 |
(2) Smoke |
(3) PM2.5 |
(4) NG |
| WEGT_Post | -3.723*** | -2.500*** | -2.152*** | 4.390*** |
| (-0.915) | (-0.694) | (-0.675) | (-1.223) | |
| Constant | 7.163* | 5.779 | 46.762*** | -16.375*** |
| (-3.778) | (-3.854) | (-1.893) | (-4.174) | |
| Individual Controls | Yes | Yes | Yes | Yes |
| Household Controls | Yes | Yes | Yes | Yes |
| Regional Controls | Yes | Yes | Yes | Yes |
| Year FE | Yes | Yes | Yes | Yes |
| City FE | Yes | Yes | Yes | Yes |
| Observations | 3,611 | 3,613 | 3,816 | 3,107 |
| Adj. R-squared | 0.612 | 0.066 | 0.945 | 0.84 |
* Note: Standard errors clustered at the city level are in parentheses. ***, **, and * indicate significance at the 1%, 5%, and 10% levels, respectively. The control variables are consistent with Table 2.
Table 6.
Synergistic Effect of the "Coal-to-Gas" Policy.
| Variable | (1) | (2) | (3) | (4) |
| WEGT_Post_CTG | -0.098*** | -0.115*** | -0.111*** | -0.136*** |
| 0 | -0.004 | -0.006 | -0.014 | |
| Constant | 0.145*** | -0.001 | 0.162*** | 0.02 |
| -0.011 | -0.028 | -0.001 | -0.17 | |
| Individual Controls | No | Yes | No | Yes |
| Household Controls | No | Yes | No | Yes |
| Regional Controls | No | Yes | No | Yes |
| Year FE | Yes | No | Yes | Yes |
| City FE | Yes | No | Yes | Yes |
| Observations | 51,446 | 40,265 | 51,446 | 40,265 |
| Adj. R-squared | 0.003 | 0.026 | 0.013 | 0.034 |
* Note: Standard errors clustered at the city level are in parentheses. ***, **, and * indicate significance at the 1%, 5%, and 10% levels, respectively.
Table 7.
Synergistic Effect of the "Coal-to-Gas" Policy.
| Variable | (1) Individual Medical Expenses |
(2) City Medical Expenditure |
(3) Employment Probability |
| WEGT_Post | -5.401** | -0.257** | 0.069*** |
| (-2.408) | (-0.13) | (-0.017) | |
| Constant | -1.11 | -3.457*** | 0.812***** |
| (-3.171) | (-1.576) | (-0.118) | |
| Individual Controls | Yes | Yes | Yes |
| Household Controls | Yes | Yes | Yes |
| Regional Controls | Yes | Yes | Yes |
| Year FE | Yes | Yes | Yes |
| City FE | Yes | Yes | Yes |
| Observations | 41,294 | 2,400 | 37,759 |
| Adj. R-squared | 0.001 | 0.959 | 0.434 |
* Note: Standard errors clustered at the city level are in parentheses. ***, **, and * indicate significance at the 1%, 5%, and 10% levels, respectively.
Disclaimer/Publisher’s Note: The statements, opinions and data contained in all publications are solely those of the individual author(s) and contributor(s) and not of MDPI and/or the editor(s). MDPI and/or the editor(s) disclaim responsibility for any injury to people or property resulting from any ideas, methods, instructions or products referred to in the content. |
© 2025 by the authors. Licensee MDPI, Basel, Switzerland. This article is an open access article distributed under the terms and conditions of the Creative Commons Attribution (CC BY) license (http://creativecommons.org/licenses/by/4.0/).
Copyright: This open access article is published under a Creative Commons CC BY 4.0 license, which permit the free download, distribution, and reuse, provided that the author and preprint are cited in any reuse.


