Preprint
Article

This version is not peer-reviewed.

Synthesis, Structural and Electrochemical Characterization of Carbon Fiber/MnO2 Composites for Hydrogen Storage

Submitted:

07 December 2025

Posted:

09 December 2025

You are already at the latest version

Abstract

Hydrogen, as an alternative energy carrier, presents significant prospects for the transition to more environmentally friendly energy solutions. However, its efficient and safe storage remains a challenge, as materials with high adsorbent capacity and long-term storage capability are required. This study focuses on the synthesis and characterization of a composite material consisting of carbon fiber and manganese dioxide (MnO2/CFs), for the purpose of storing hydrogen. Carbon fiber was chosen as the basis for the composition of the composite material due to its large active surface area and its excellent mechanical, thermal, and electrochemical properties. The deposition of MnO2 on the surface of carbon fibers took place through two different synthetic pathways: electrochemical deposition and chemical synthesis under different conditions. The electrochemical method allowed the development of oxide in more quantity, with optimized structural and chemical properties, while the chemical method had a more basic application but required more time to showcase same or less capacity performance. The elemental analysis of the electrochemically produced composites showcased an average of 40.60 wt% Mn presence, which is an indicator of the quantity of MnO2 on the surface responsible for hydrogen storage, while the chemically produced showcased an average of 4.21 wt% Mn presence. Manganese oxide’s high specific capacity and reversible redox reaction participation make it suitable for hydrogen storage applications. The obtained results of the hydrogenated samples through physicochemical characterization indicated the formation of the MnOOH intermediate. These findings may be remarked that carbon fiber/MnO2 composites are promising candidates for hydrogen storage technologies. Finally, the fabricated carbon fiber/MnO2 composites were applied successfully as working electrodes for analysis of [Fe(CN)6]3-/4- redox system in aqueous KCl solutions.

Keywords: 
;  ;  ;  ;  ;  

1. Introduction

In recent years, concerns about the environmental impact of modern lifestyles have grown significantly, prompting a growing number of people to turn to renewable energy sources to meet their needs. A gradual shift away from fossil fuels is essential, with a focus on replacing them with renewable sources that have a lower environmental footprint. At the 2024 Climate Change Conference held in Azerbaijan, the establishment of the Climate Change Action Fund (CFAF) was announced. This fund, amounting to $1 billion annually, is supported by contributions from countries with heavy fossil fuel industries. The money is then redistributed to developing nations to invest in renewable energy systems. The primary aim of the conference was to promote progress toward the goals set in the Paris Agreement (2016) regarding the reduction of greenhouse gas emissions [1].
Hydrogen is emerging as a promising energy carrier, offering an alternative path toward decarbonization. It can be produced through various methods—conventional (using fossil fuels), renewable sources, or nuclear energy. While there’s a clear trend toward renewable methods (such as wind, solar, hydroelectric, biomass, geothermal, and ocean thermal energy), the cost of hydrogen-related technologies remains a challenge for society [2]. Hydrogen has several advantages: it has a high energy content, is highly reactive, non-toxic, environmentally friendly, and can transport energy over long distances [3]. These properties are encouraging governments and industries to invest in hydrogen as a viable alternative energy solution. However, efficient and safe storage of hydrogen is crucial for its widespread use. Hydrogen can be stored in either liquid or gaseous form, either on the surface of solids (adsorption) or within them (absorption) [4].The material-based hydrogen storage methods involve interactions between the hydrogen atom and the substrate. When absorption is attributed to weak van der Waals forces, the process is referred to as physisorption. It typically occurs between hydrogen atoms and carbon-based structures, metal-organic frameworks, zeolites, or microporous polymers [5]. On the other hand, chemisorption involves the formation of ionic or covalent bonds with the surface atoms of solid materials such as metals, metal alloys, transition metal oxides and sulfides [6,7].
The focus of this research is the use of carbon fibers as a hydrogen storage medium, specifically investigating how their storage capacity is affected by the deposition of manganese dioxide on their surface. It is reported that manganese oxide decoration of carbon structures increases their hydrogen absorption capabilities, acting as a catalyst due to its high surface area [8,9]. It has been reported that the presence of metal oxides in hydrogen storage materials, such as carbon nanostructures, enhances the absorption capabilities via hydrogen spillover phenomenon [8]. Hydrogen spillover is a surface phenomenon that refers to the migration of hydrogen atoms generated by H2 splitting on a metal nanoparticle to another site of a catalyst with a hydrogen acceptor site. MnO2 can act as a hydrogen spillover catalyst. The proposed oxide is a low-cost, highly abundant material with eco-friendly properties that can be deposited onto carbon fibers utilizing basic deposition methods [10,11].
The deposition of manganese dioxide onto carbon fibers can be achieved using various synthesis techniques, including electrodeposition, template-assisted methods, in situ redox deposition, precipitation and hydrothermal synthesis [12,13,14,15]. In this study, two synthesis methods—in situ redox deposition and electrochemical synthesis—were employed and compared in terms of the concentration and morphology of the manganese dioxide deposited on the carbon fibers. Both methods require the activation of carbon fibers, which can be achieved by exposure to high concentration acidic solutions such as HCl, HNO3, or H2SO4. This treatment disrupts the graphene-like structure and introduces reactive functional groups (–COOH, –OH, C=O) into the carbon lattice [16]. After activation, the in situ redox deposition method is based on the reaction between KMnO4 and the CFs activated surface. More specifically, it involves the reduction of manganese from its +7-oxidation state in MnO4 to lower oxidation states, often forming MnO2, which can be deposited onto the surface of the fiber. The following reaction takes place on the surface of CFs [17,18]:
4MnO4- + 3C + 4H+ → 4MnO2 + 3CO2 + 2 H2O
The anodic electrochemical deposition utilizes Mn(CH3COO)2 as a precursor compound, which requires lower potential for its decomposition and results in a higher deposition rate. A less acidic environment obtained by the utilization of Na2SO4 as a medium leads to a hydrolysis pathway: initially, Mn2+ ions diffuse to the electrode surface. The following reaction involves the oxidation to Mn3+ which, in a less acidic environment, is unstable, and forms the intermediate MnOOH upon contact with water, which under specific conditions can be further converted to MnO2. Under these conditions, the following sequence typically represents the electrochemical oxidation of Mn2+ ions:
Mn2+ → Mn3+ + e
Hydrolysis pathway: Mn3+ + 2H2O → MnOOH + 3H+
MnOOH → MnO2 + H+ + e
This study employs both chemical and electrochemical synthesis methods for the fabrication of composite materials consisting of carbon fibers and manganese dioxide, with the aim of identifying the most effective deposition route and the optimal conditions for producing MnO2-coated carbon fiber structures. Furthermore, the research assesses the hydrogen storage potential of the synthesized materials through comprehensive characterization of their morphology and composition using Scanning Electron Microscopy (SEM), Energy Dispersive X-ray Spectroscopy (EDS), X-ray Photoelectron Spectroscopy (XPS), Raman spectroscopy, and Thermogravimetric Analysis (TGA)[19].

2. Materials and Methods

2.1. Materials and Tools

Carbon fibers (CFs, diameter ≈ 7.25 μm, purchased by Chembiotin), Hydrogen Chloride (HCl, 37 wt%, Chem-lab, Mr = 36.46 g/mol), Potassium manganate (VII) (KMnO4, 99 wt%, ChemSolute), Nitric Acid (HNO3, 65 wt%, Merck), Manganese (II) Acetate (Mn(CH3COO)2, Purity: 99.3 wt%, Mr = 245.09, BLD Pharmatech), Sodium Sulfate Decahydrate (Na2SO4 ⋅10H2O, Mr = 322.19 g/mol, Merck,) high-purity hydrogen (99.9%) gas was used without further purification.
Potassium hexacyanoferrate (III), (>99.0 wt%), potassium hexacyanoferrate (II) trihydrate, (>98.5 wt%), and potassium chloride (>99.0 wt%) were purchased from Sigma-Aldrich used without further purification. For the electrochemistry measurements, a stock solution of the binary mixture K3Fe(CN)6/K4Fe(CN)6 with a concentration of 1.0×10⁻² mol∙L-1 was prepared by dissolving the appropriate amounts of salts in KCl aqueous solution (1.0 mol∙L-1). The stock solution of K3Fe(CN)6/K4Fe(CN)6 was prepared immediately prior to the electrochemical experiments by using doubly distilled water. The solutions of [Fe(CN)6]3-/4- in a concentration range of 7.0×10⁻⁵-1.0×10⁻³ mol∙L-1, were prepared directly in the electrochemical cell with the progressive addition of the appropriate volume of stock solution in KCl solution (1.0 mol∙L-1).
All electrochemistry measurements were performed on electrochemical working station Zahner (IM6/6EX, Germany). The obtained results were analyzed by means of Thales software (version 4.15). A three-electrode system configuration consisting of CF-based working electrode, platinum auxiliary electrode, and Ag/AgCl (saturated KCl) reference electrode was used for the electrochemistry measurements. The electrochemical impedance spectra (EIS) were recorded in the frequency range from 0.1 Hz to 100 kHz at the half-wave potential of [Fe(CN)6]3-/4- (+0.275 V vs. Ag/AgCl). The recorded impedance spectra were analyzed by means of equivalent electrical circuit (Rs+(Cdl/(Rct+Zw))). The elements of the circuit can be explained as follows: Rs is the solution resistance, Cdl the modified layer/solution interface capacitance, Rct the electron-transfer resistance due to electron transfer at modified layer/solution interface, and Zw the Warburg diffusion impedance due to the diffusion of the redox couple [Fe(CN)6]3-/4- in solution. All experiments were carried out at room temperature. In all measurements, the solutions were deoxygenated by purging with high-purity nitrogen.
Surface morphology and elemental analysis were carried out using a JEOL JSM6390LV scanning electron microscope (JEOL Ltd., Tokyo, Japan) at an accelerating voltage of 20 kV, equipped with an Oxford INCA PentaFETx3 EDS detector (Oxford Instruments, Oxfordshire, UK), and a field emission scanning electron microscope (FE-SEM, Jeol JSM-7000F, JEOL Ltd., Tokyo, Japan) operat-ing at 15 keV. The XPS spectra were carried out on KRATOS AXIS Ultra DLD (Delay Line Detector). The Raman spectra of samples were recorded using a confocal microscope Raman spectrometer system equipped with a 532 nm laser (inVia Reflex, Renishaw, UK), fitting of the peaks was performed with WireTM 3.4 software. Thermal analysis was performed with a Mettler Toledo e 851 TG instrument (Mettler Toledo, US). The deposition of high-purity hydrogen was conducted using a gas chromatograph GC -14 A Shimadzu (ID: Shimadzu-G0-0235). A galvanostat, was employed to supply the desired current in the closed-circuit configuration of the electrochemical deposition system. The ultrasonic cleaning unit employed in the experimental setup was an Elma Transsonic T460/H (Elma D-78224 / T 460 H), a precision ultrasonic bath designed for laboratory applications. The magnetic stirrer with integrated heating functionality used was the ARGOlab M2-A, an analog-controlled magnetic hotplate stirrer.

2.2. Synthesis of MnO2/Carbon Fiber Composites

Two distinct synthetic pathways were used in this study to produce the MnO2/CFs composites: an in situ redox deposition and an electrochemical deposition. In the in situ redox deposition method, 50 mL of 37 wt% HCl were transferred into a 100 mL glass beaker. Pre-fabricated carbon fibers were then immersed in the acid solution and stirred using a mechanical stirrer at 200 rpm for 1 h at a temperature of approximately 10 °C. Following acid treatment, the surface-oxidized carbon fibers were thoroughly rinsed with deionized water to remove residual acid. Subsequently, the treated carbon fibers were transferred to another 100-mL beaker containing 50 mL of an aqueous 0.1 M KMnO4 solution. To prepare the KMnO4 solution, 1.5804 g of KMnO4 (measured using a four-decimal precision balance) were dissolved in deionized water and diluted to 100 mL in a volumetric flask, followed by stirring to ensure complete dissolution. The carbon fibers were then immersed in the KMnO4 solution and subjected to sonication for 30 min. After sonication, the samples were rinsed with deionized water (Figure 1). This deposition process was repeated for varying contact durations between the carbon fibers and the KMnO4 solution: 2, 6, and 24 h, respectively (Table 1). Finally, all samples were dried in a convection oven at 90 °C for 8 h. The growth of MnO2 is based on the redox reaction between MnO4 and carbon:
4MnO4 + 3C + 4H+ → 4MnO2 + 3CO2 + 2H2O
In addition to the in situ redox deposition method described earlier, an electrochemical route was also developed for the synthesis of the compound. The basic principle of the electrodeposition process involves the use of an electric current of 20.0 mA∙cm−2 to transfer metal ions from an electrolyte bath containing 0.1 M Mn(CH3COO)2 and 0.1 M Na2SO4 onto the carbon fibers. The average area of one carbon fiber is 0.0182 cm2, and the sample bundle, on average, consists of 50 CFs, which calculates the overall area to 0.91 cm2. The carbon fibers act as the working electrode, while a pure platinum sheet was used as a counter electrode [20].
For the preparation of the electrolyte bath solution, 6.1273 g of Mn(CH3COO)2 and 8.0547 g of Na2SO4·10 H2O, were precisely weighed using an analytical balance with four-decimal precision. Each salt was dissolved separately in a small volume of deionized water in two separate 50 mL beakers. The resulting solutions were transferred into a 250 mL volumetric flask, including the rinse water from each beaker to ensure complete transfer. The flask was filled with deionized water up to the calibration mark (250 mL total volume). The solution was then thoroughly stirred to ensure homogeneity.
Approximately, 100 mL of the prepared electrolyte was transferred to a 200 mL beaker, which was placed on a heating plate. One end of the carbon fiber electrode was immersed in the electrolyte solution, while the other end was connected to the anode terminal of a galvanostat via a conductive wire. Similarly, the platinum electrode was immersed in the solution and connected to the cathode terminal (Figure 2). A constant current density of 20.0 mA∙cm−2 was applied to the closed circuit for a regulated time and temperature. Then, the fibers were rinsed thoroughly 5 times with deionized water. The manganese dioxide-coated carbon fibers (MnO2/CFs) were subsequently transferred to a crucible and dried in an oven at 80 °C for 24 h [21].
This procedure was repeated while applying different heat temperatures and reaction durations to test which conditions provide CFs with maximum MnO2 concentration (Table 2).

2.3. Absorption of Hydrogen Gas into the Constructed MnO2/CFs

The exposure of the synthesized carbon fiber–manganese dioxide (CFs-MnO2) composites to hydrogen gas was conducted utilizing a gas chromatograph, Shimadzu GC-14A. For the purpose of this experiment, the chromatographic column was replaced with an empty stainless-steel column (length 5 cm × internal diameter ¼’’), in order to accommodate the sample fibers. High-purity hydrogen (99.999%, Aerialco, Greece), supplied via a dedicated gas cylinder, was the carrier gas utilized for samples hydrogenation. A measured quantity of CFs was tightly packed within the metallic tube to ensure controlled exposure to the hydrogen environment. The tube was then securely integrated into the chromatographic oven, ensuring a hermetically sealed connection to prevent any gas leakage. Operational parameters, including the exposure temperature and duration, were manually programmed on the device. Following parameter input, the system was activated to initiate the exposure process. The hydrogen gas flow was 30 mL/min at a set temperature of 240 °C for a duration of 6 hours. Upon completion of the defined exposure period and subsequent cooling of the system to ambient temperature, the treated samples were collected for further analysis. The characterization process aimed to quantify the extent of hydrogen absorption by the samples.
This procedure was applied to the following samples:
Sample #1: MnO2-CFs synthesized via in situ redox deposition method for 30 min.
Sample #2: MnO2-CFs synthesized via electrochemical method for 20 min at 28 °C.

2.4. Characterization of MnO2/CFs Composites

A range of analytical techniques was employed to characterize the synthesized fibers, with the aim of determining the final product’s composition, evaluating the physicochemical properties of the fibers, and assessing their effectiveness in hydrogen storage applications. Techniques such as X-ray photoelectron spectroscopy (XPS), scanning electron microscopy (SEM), energy-dispersive X-ray spectroscopy (EDS), Fourier-transform infrared spectroscopy (FTIR) and Raman spectroscopy were utilized. The spectra of the dry powders were taken by a Perkin Elmer FT-IR spectrometer (Spectrum One, USA). The spectra were recorded using the Spectrum v.5.3.1 (2004) software, in the wave number range of 4000-500 cm-1 with the scan number of 32 and at the resolution of 4 cm-1. The background spectrum was measured from the KBr disk (Lot. EA12323DA Sigma Aldrich, for spectroscopy) formed using a Specac manual hydraulic press at 15 tons for 10 min. Additionally, hydrogen absorption capacity was assessed through gravimetric methods such as Thermogravimetric analysis (TGA) to quantify the performance of the composites in hydrogen uptake under controlled conditions. Supplemental information about hydrogen absorption of the composites can be obtained also through XPS and Raman spectroscopy. This comprehensive approach enabled a detailed understanding of the material properties that influence storage efficiency.

3. Results

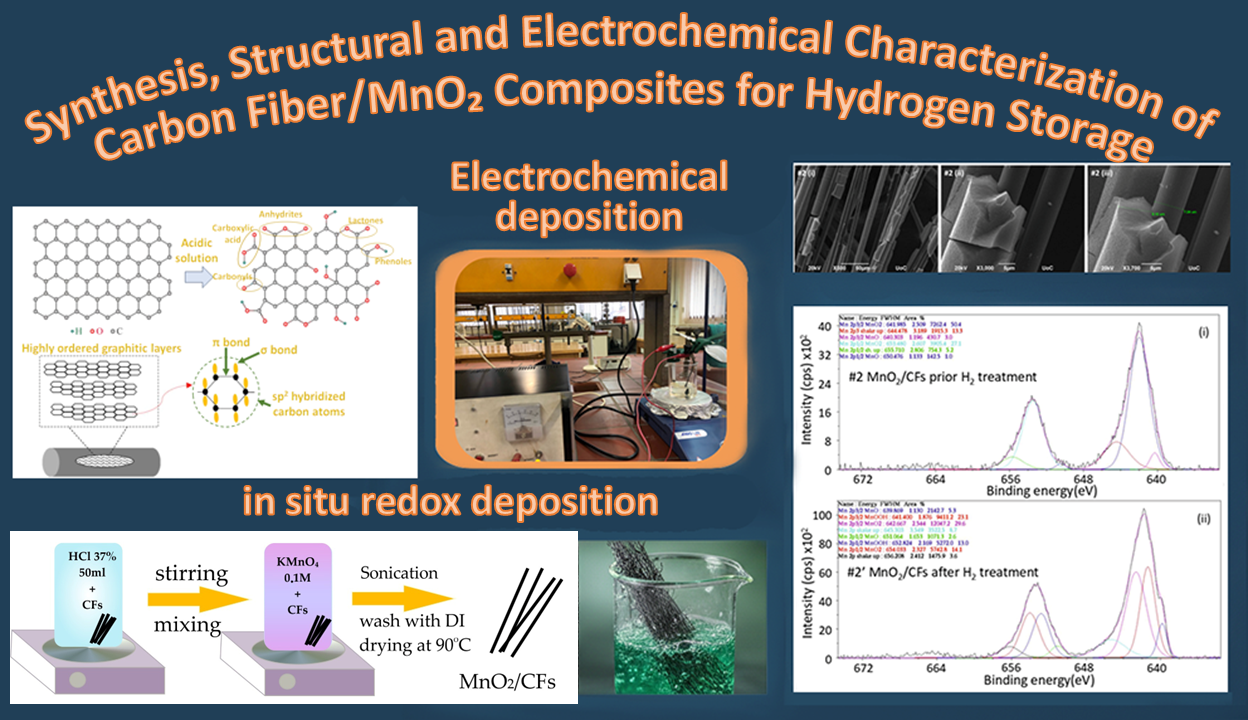
3.1. Morphological, Elemental and Structural Characterization

The final MnO2–CFs composite materials, synthesized via in situ redox deposition and electrochemical deposition methods prior to hydrogen exposure, were analyzed using EDS quantification to determine the manganese concentration, thereby evaluating the relative efficiency of each synthesis environment.
Theoretically, considering the redox deposition, a progressively increasing concentration of MnO2 on the sample surface is expected as the contact time between the fibers and the reagent increases [22]. This does not apply to the samples with reaction times of 2h and 6h respectively (Table 3), which, due to inadvertent handling errors or uncontrolled variables during the setup, may have influenced the reproducibility. The pronounced decrease in Mn% observed between the repetitions b and c during electrochemical depletion could be the result of procedural inconsistencies during sample preparation or measurement.
Further characterization was conducted on the samples with the highest manganese
content from each synthesis method—specifically, the 
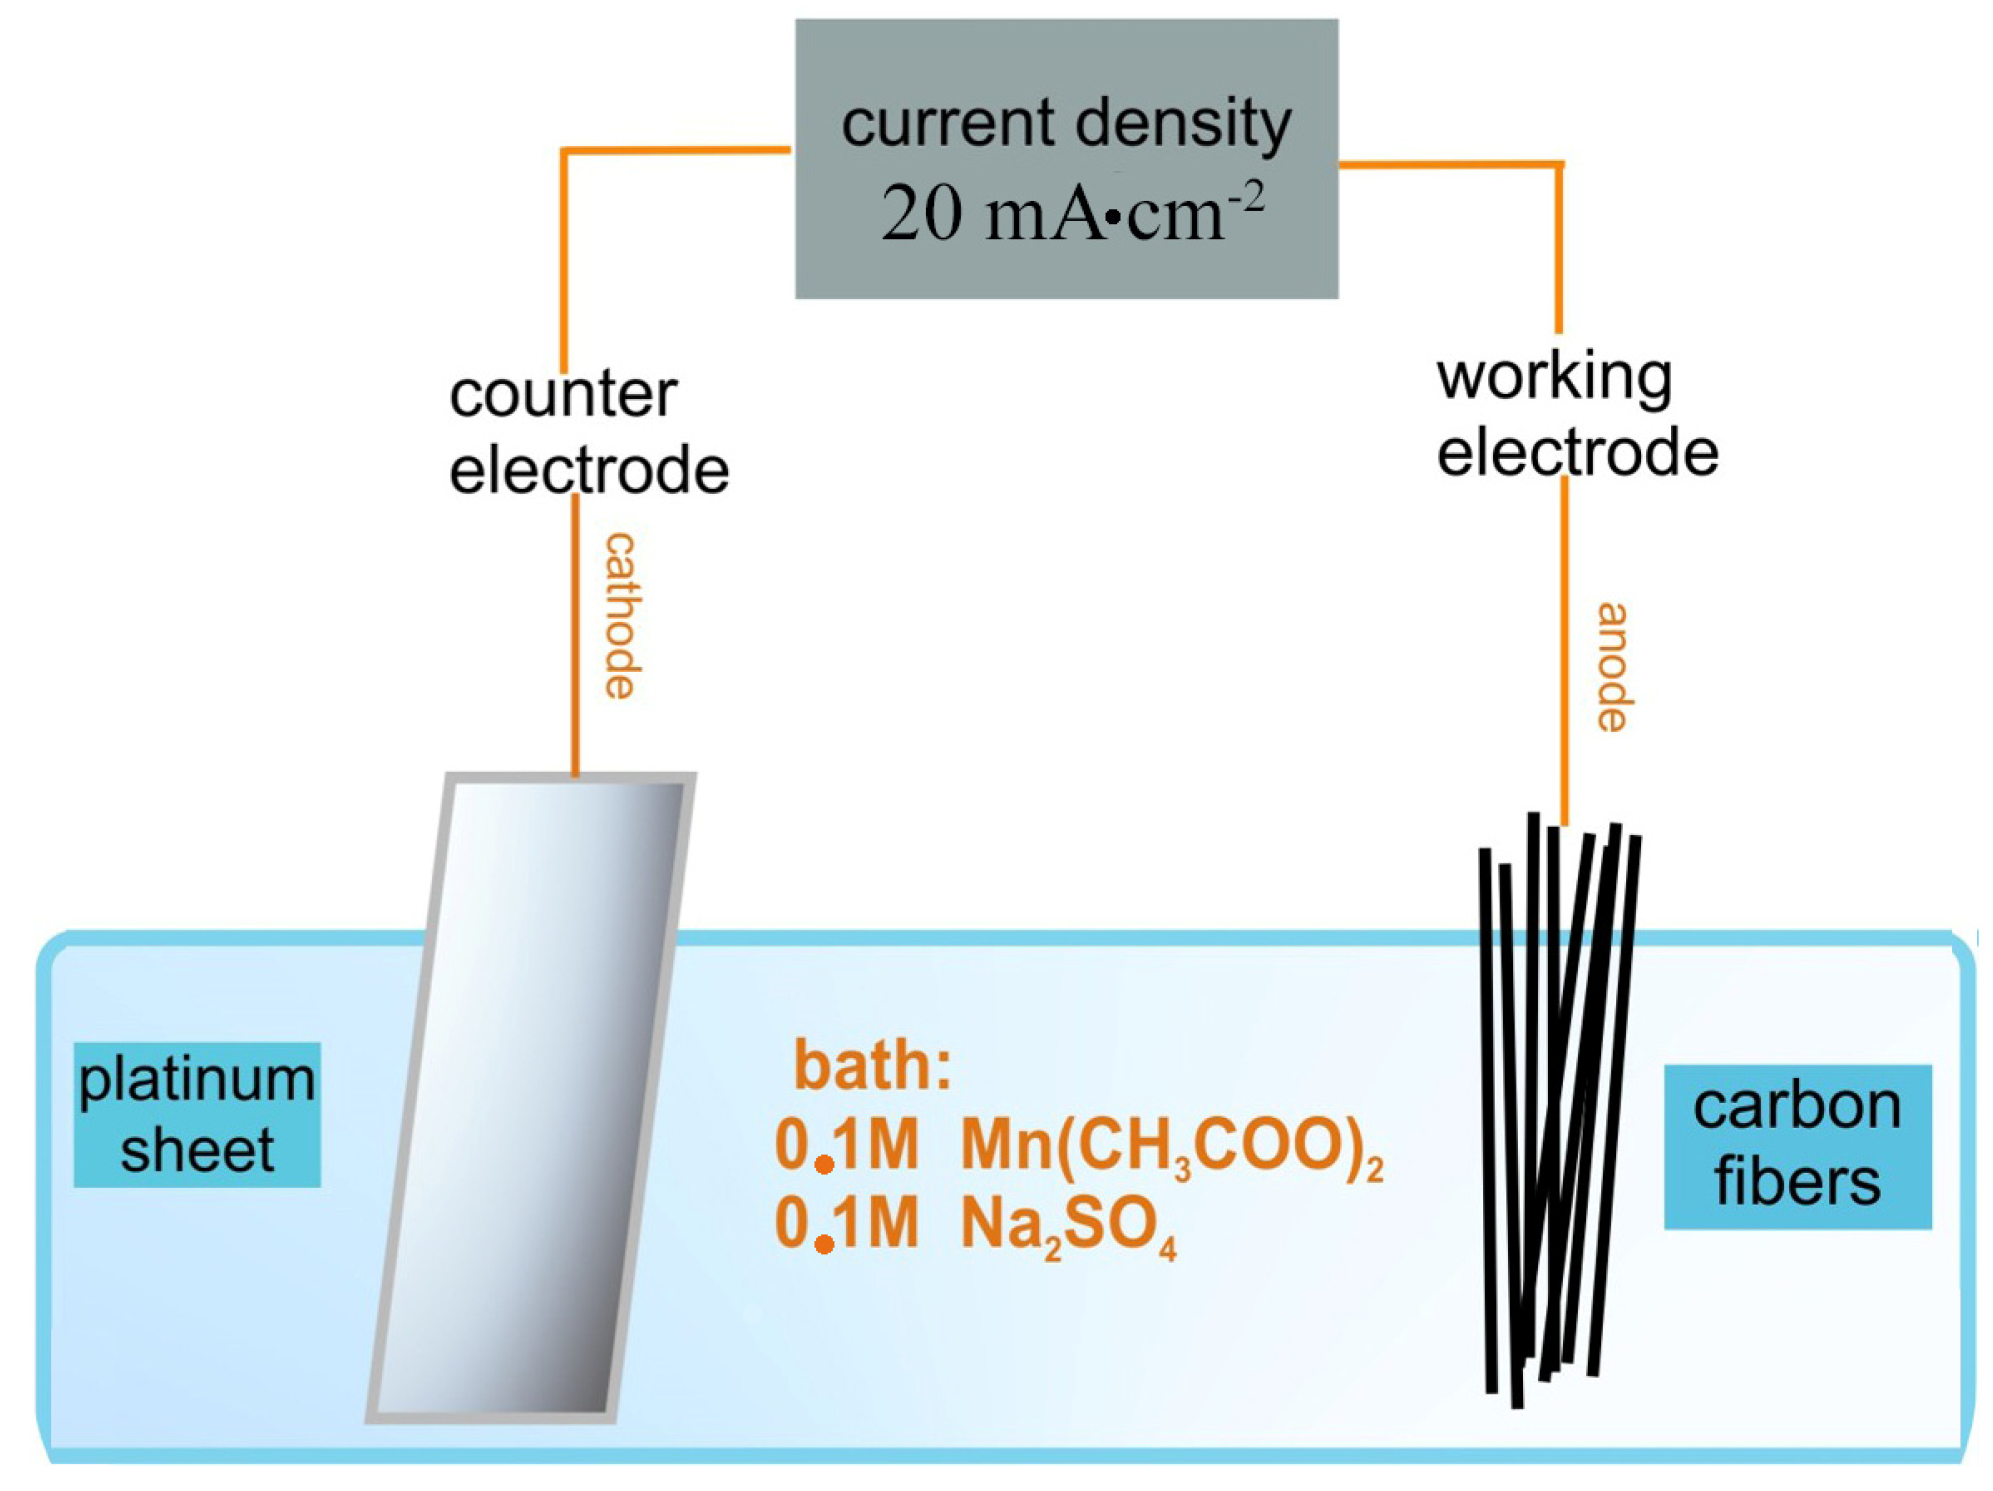
in situ redox deposition sample with a reaction duration of 24 h (Sample #1) and the electrochemical deposition sample with a reaction time of 20 min at 28 °C (Sample #2) (Table 4).
Based on the comparison of SEM/EDS results, conclusions can be drawn regarding the effectiveness of the in situ redox deposition method and electrodeposition synthesis for producing the desired material.
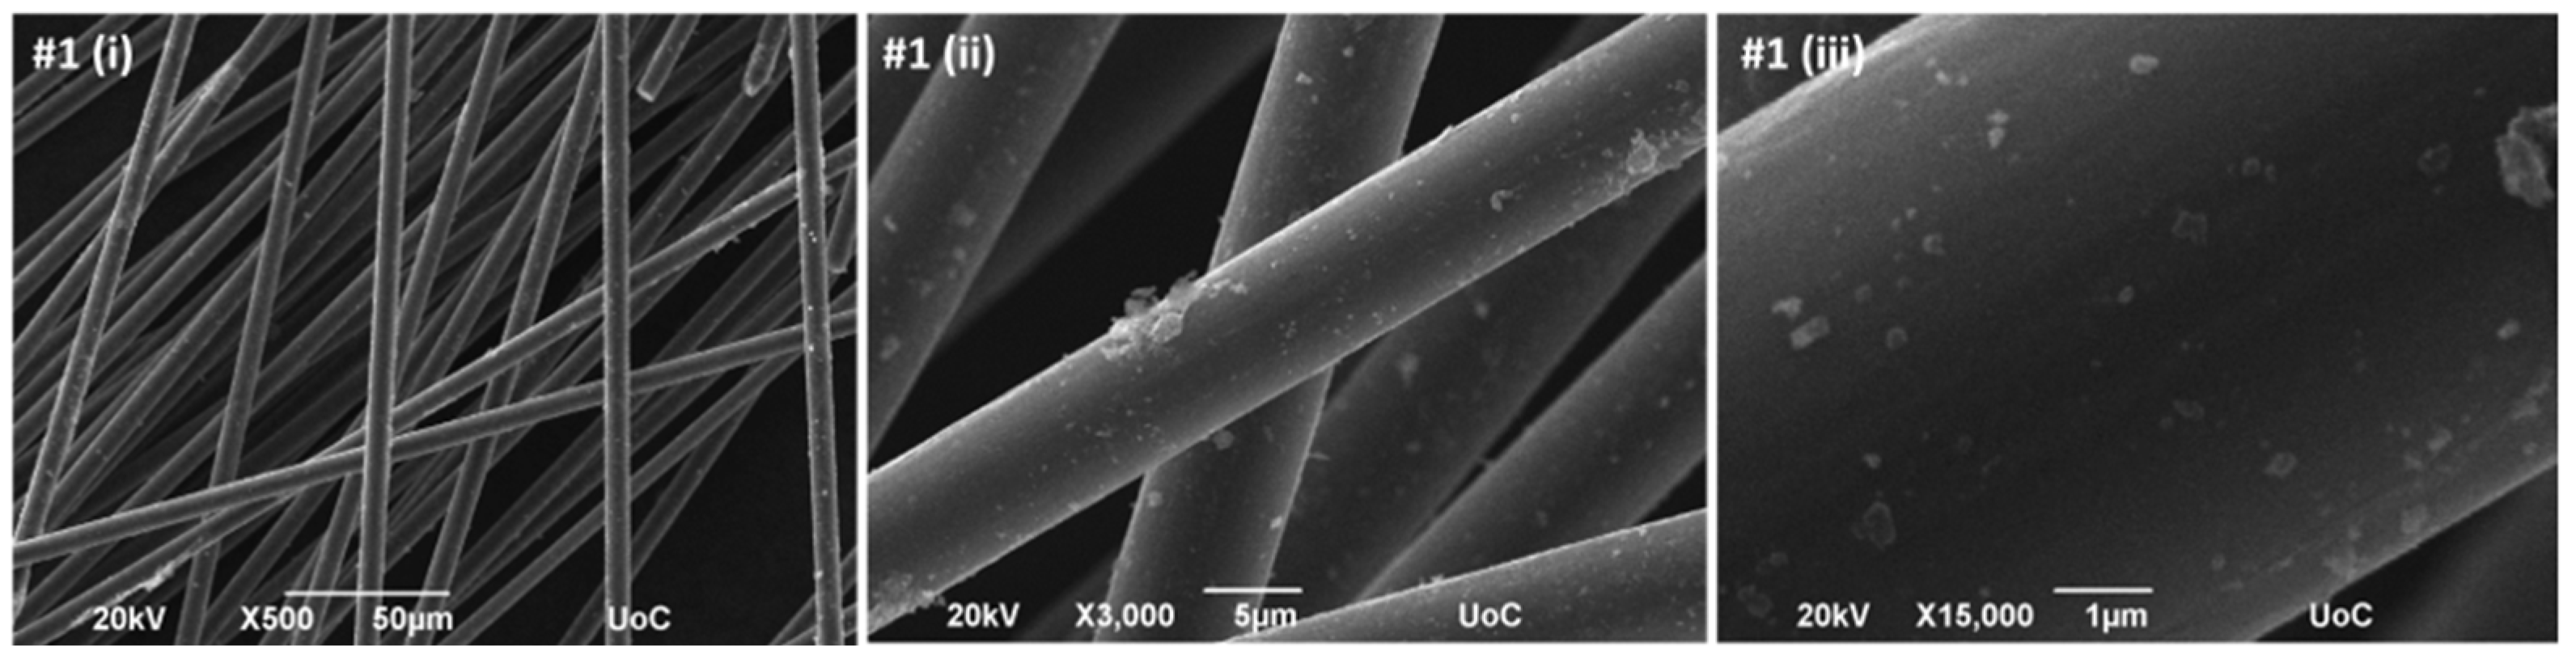
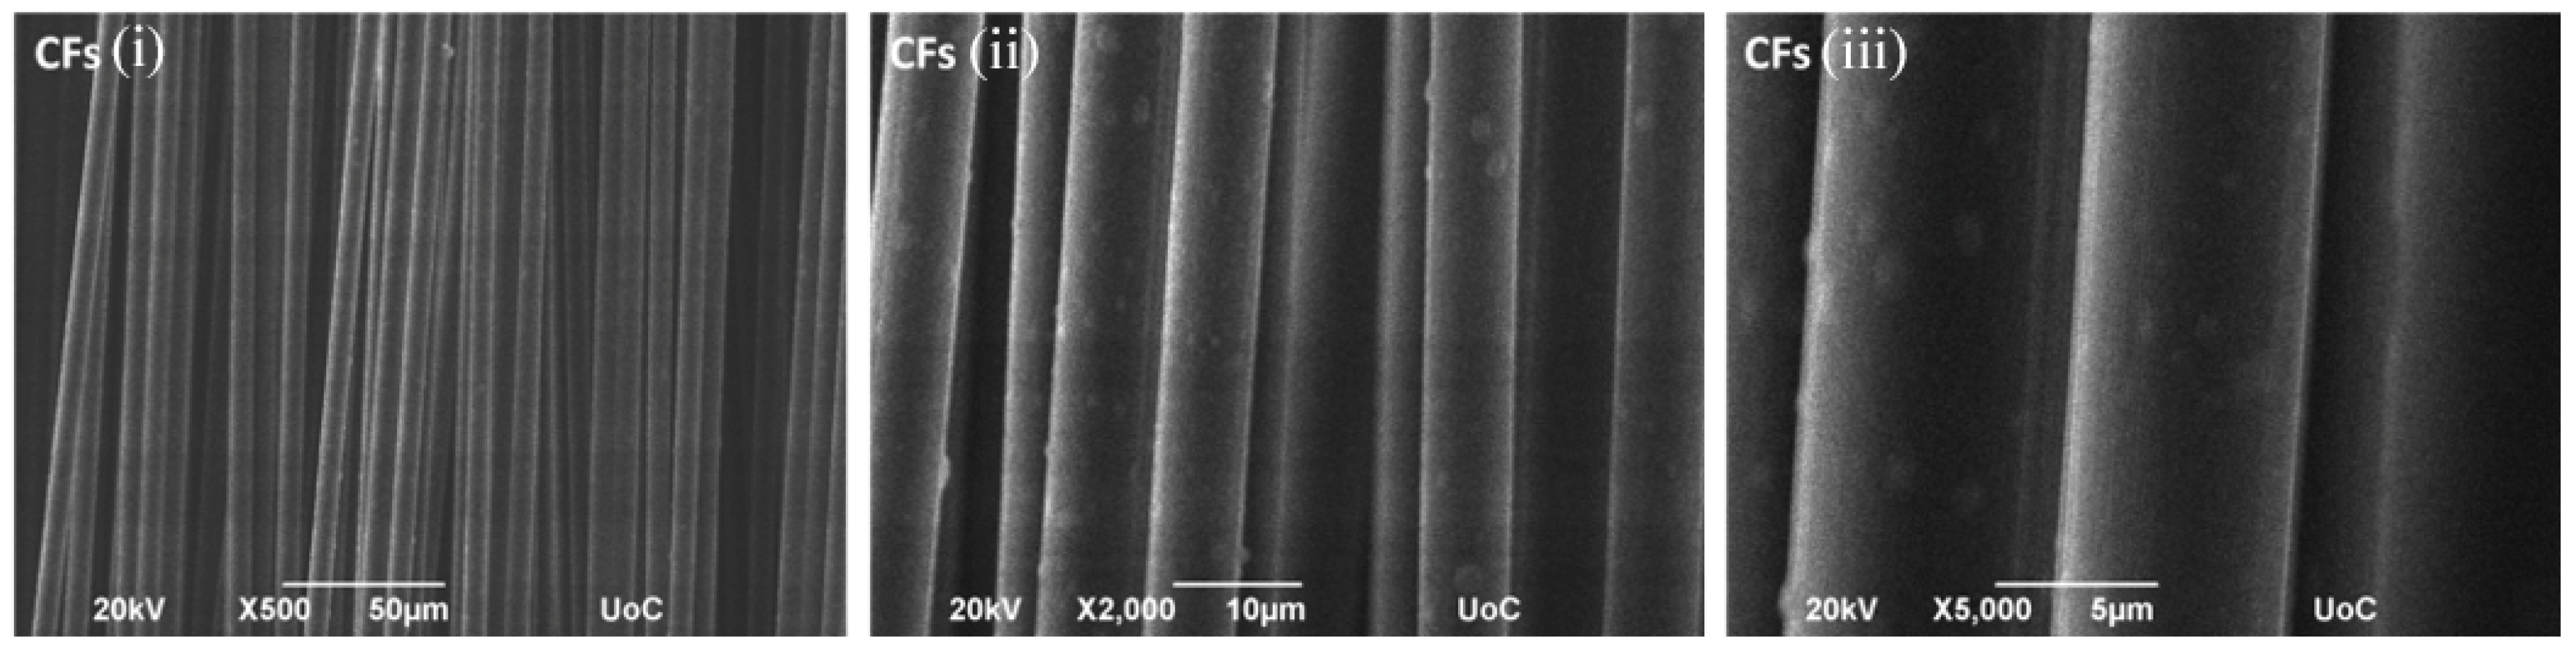
The SEM images of Sample #1 reveal dispersed bright speckled features across the carbon fiber surface (Figure 3), corresponding to MnO2 deposits. The distribution appears non-uniform, with areas of higher local concentration, while untreated CFs exhibit a relatively smooth and featureless surface (
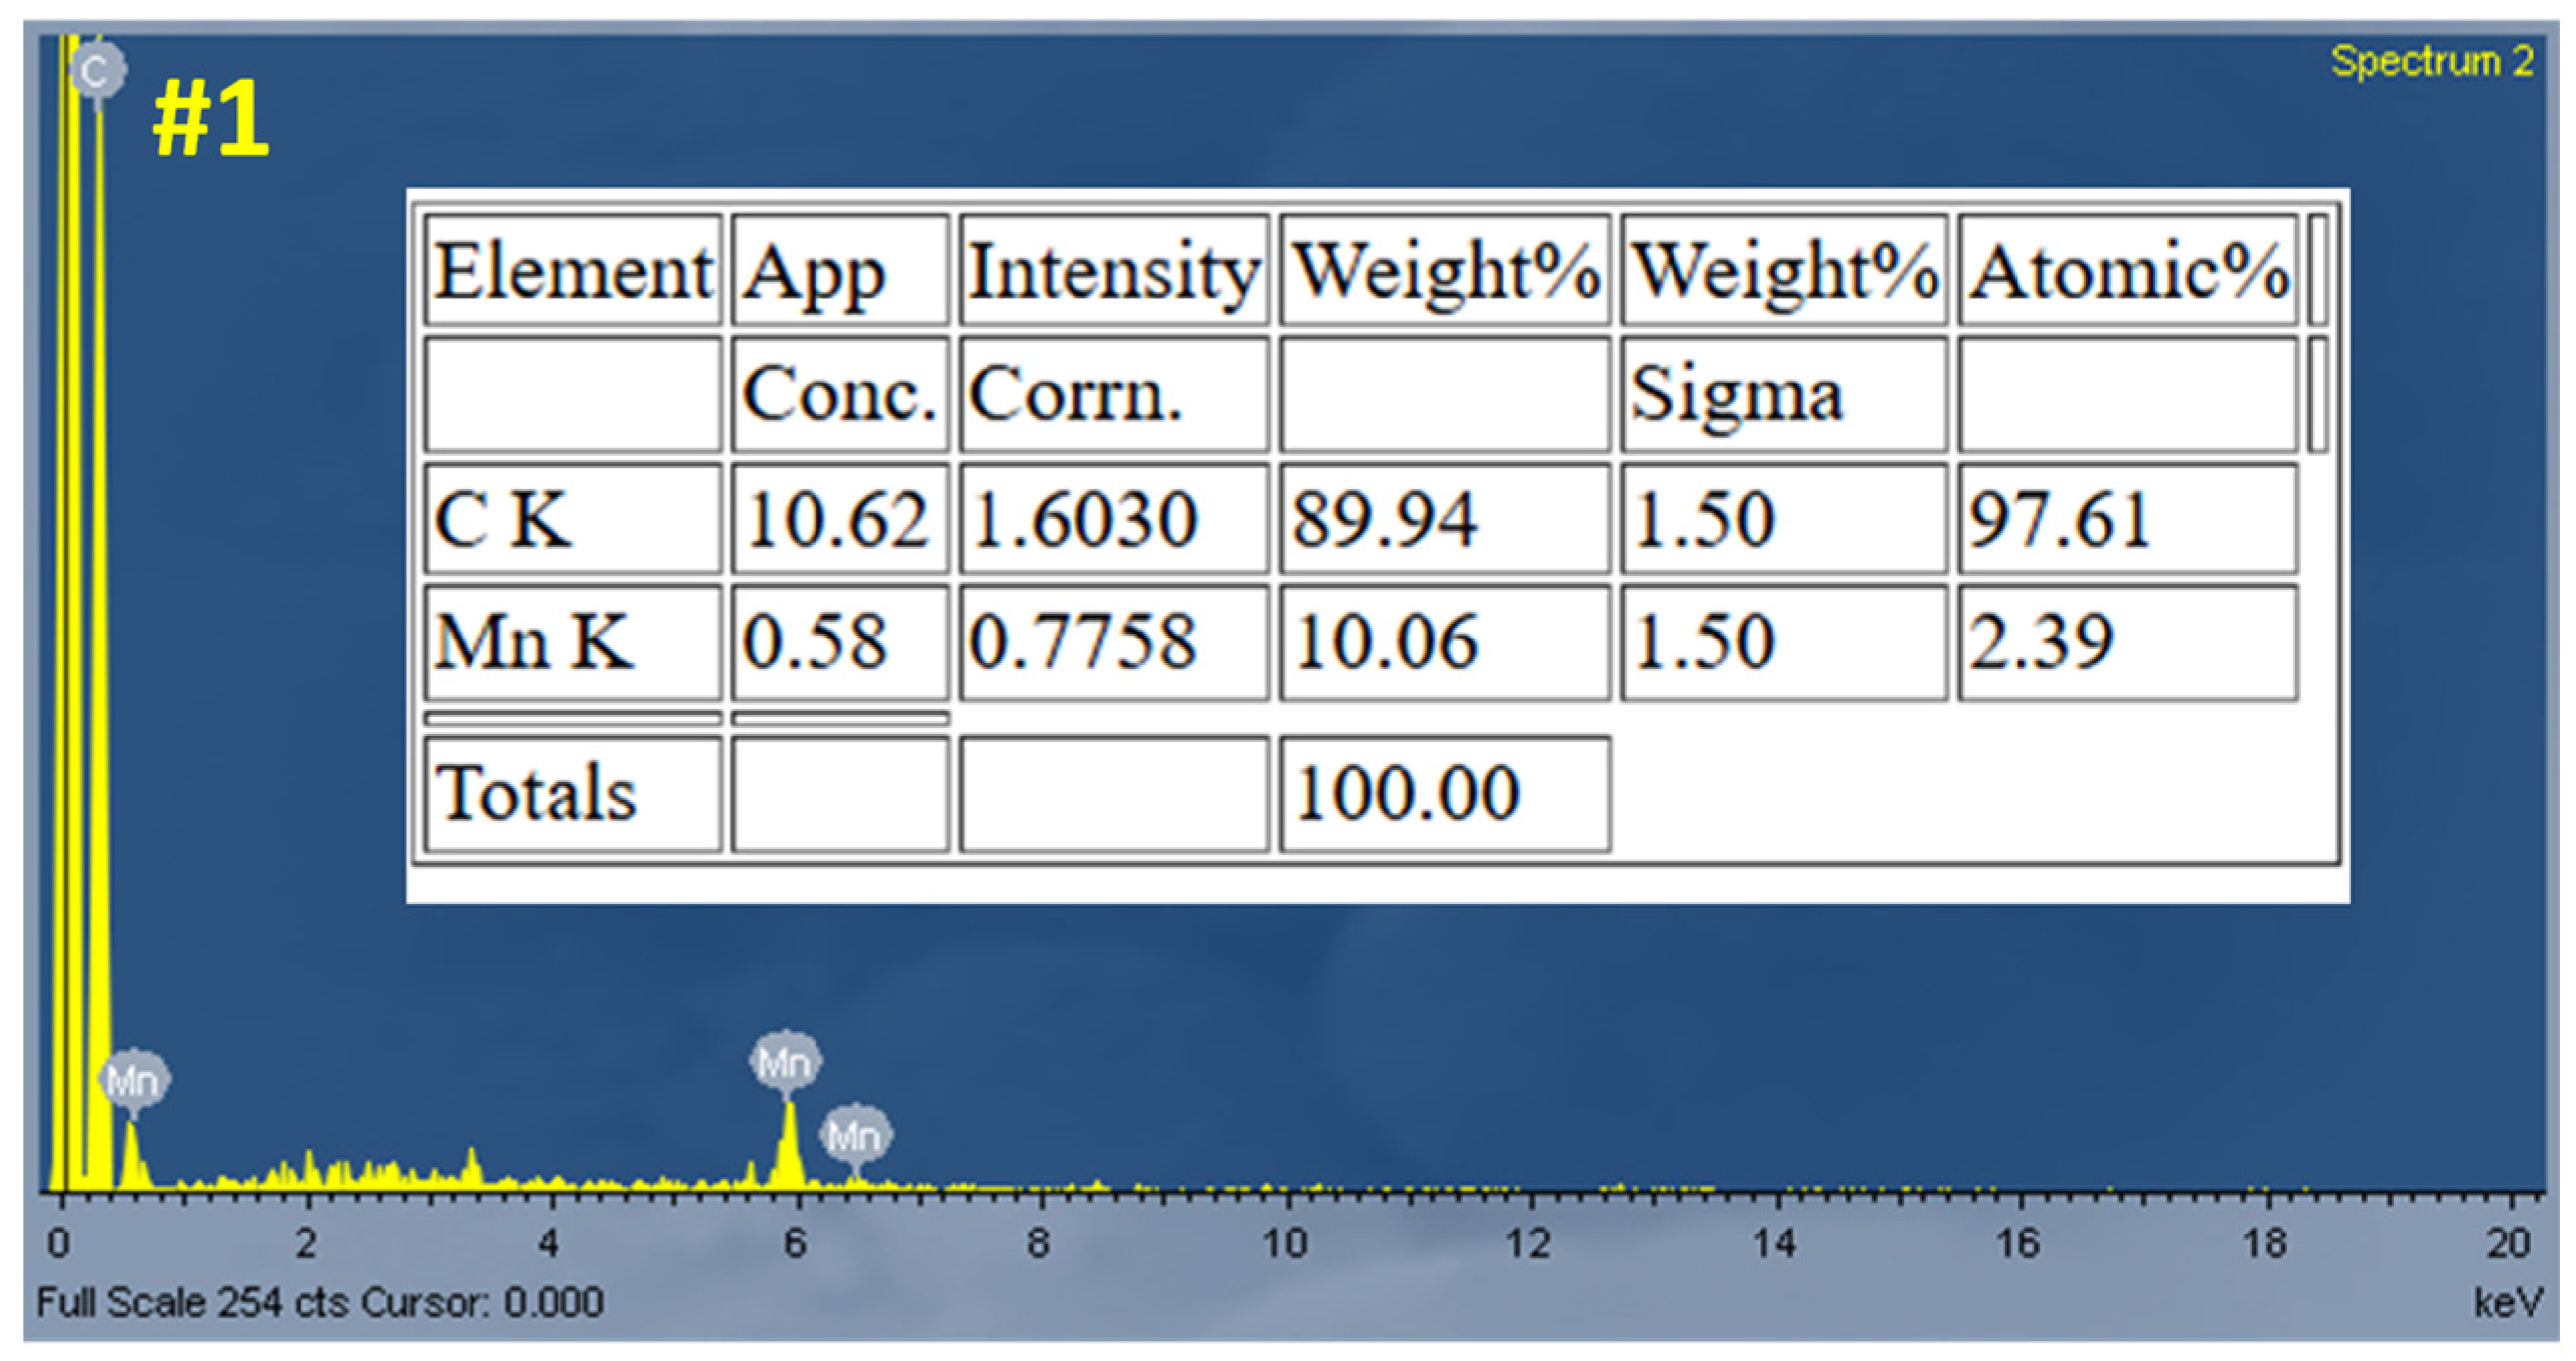
Figure 4). The EDS results of Sample #1 (Figure 5) confirm the presence of Mn on the fiber surface.
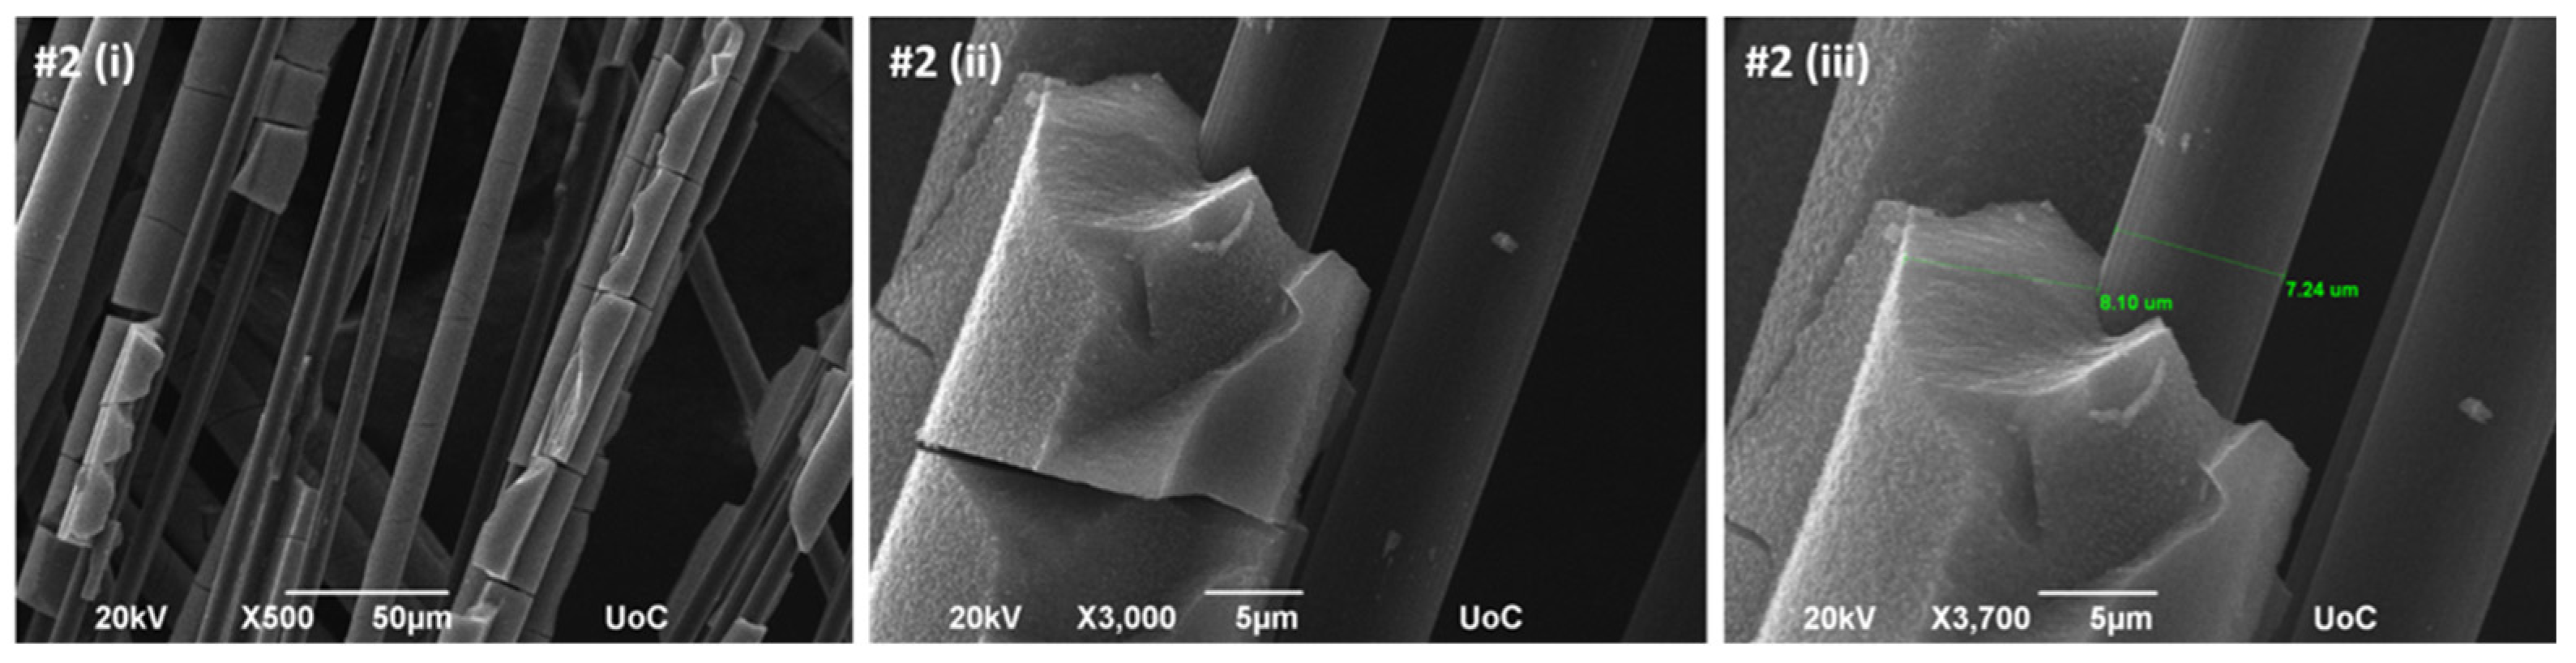
The electrochemically deposited MnO2 layer is relatively dense and uniform, with an approximate thickness of 8.10 µm (
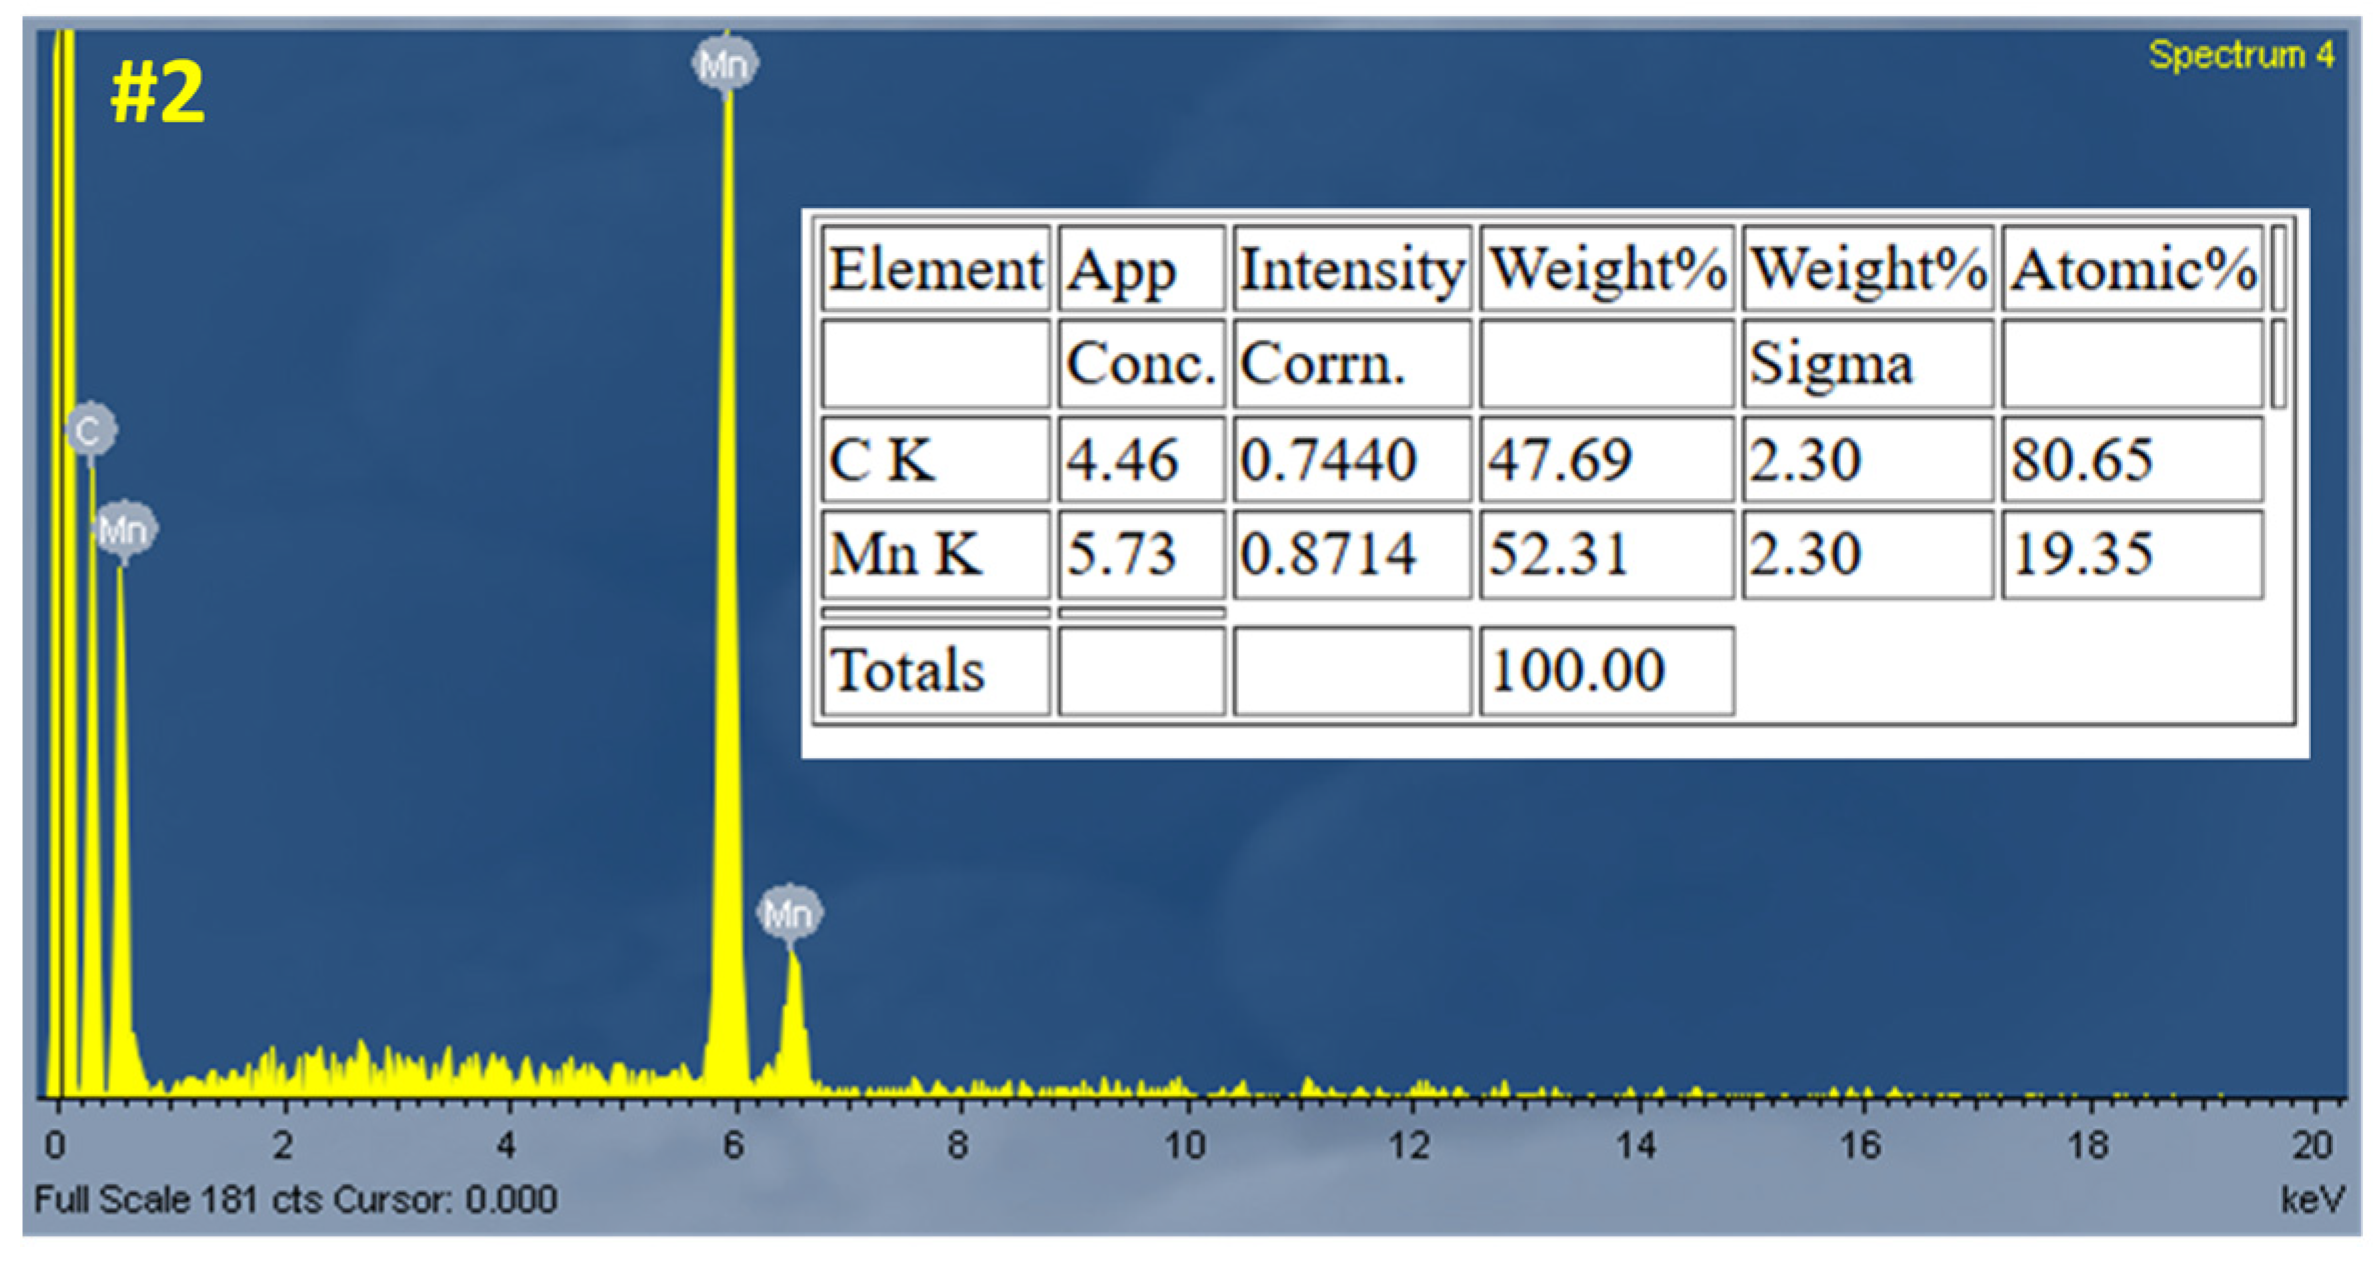
Figure 6). However, certain regions show thinner coverage or partial exposure of the underlying carbon fibers, indicating some degree of non-uniformity. The corresponding EDS analysis (Figure 7) confirms the successful deposition, showing strong Mn peaks with minimal impurities.
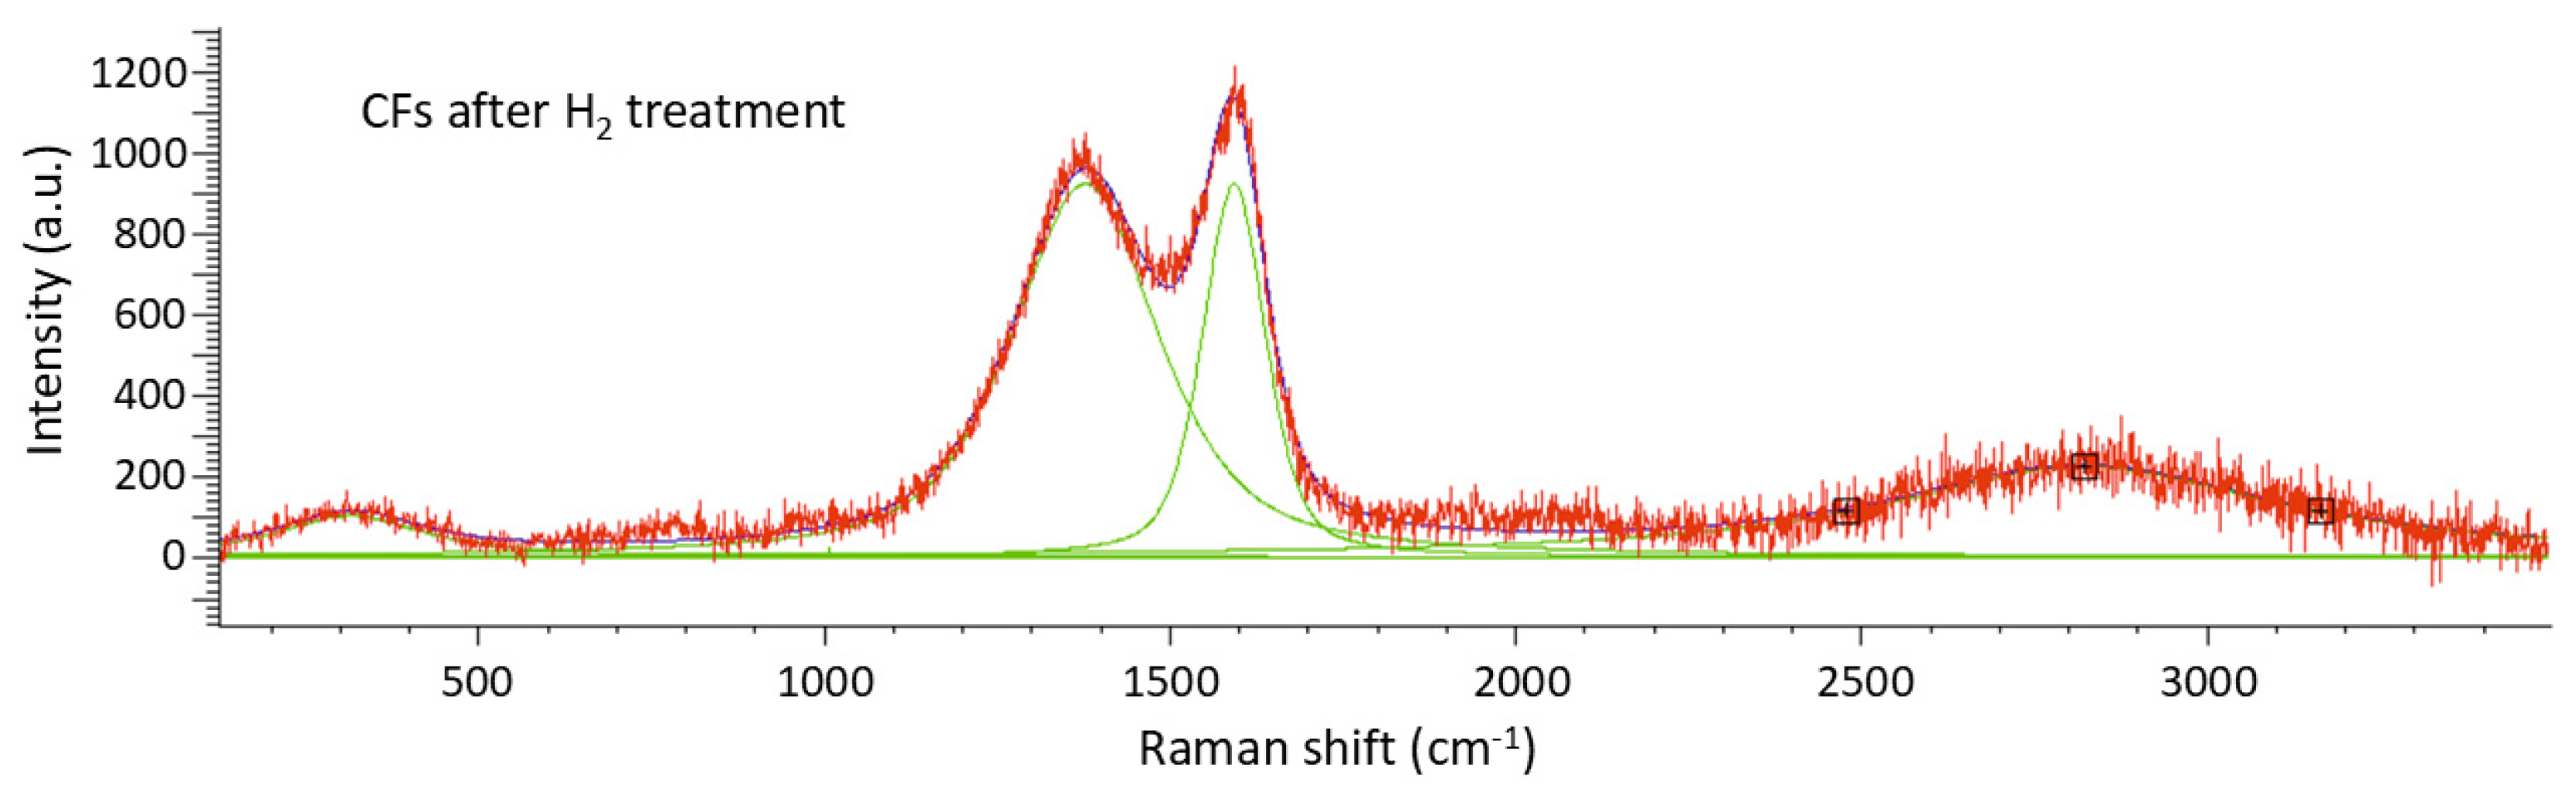
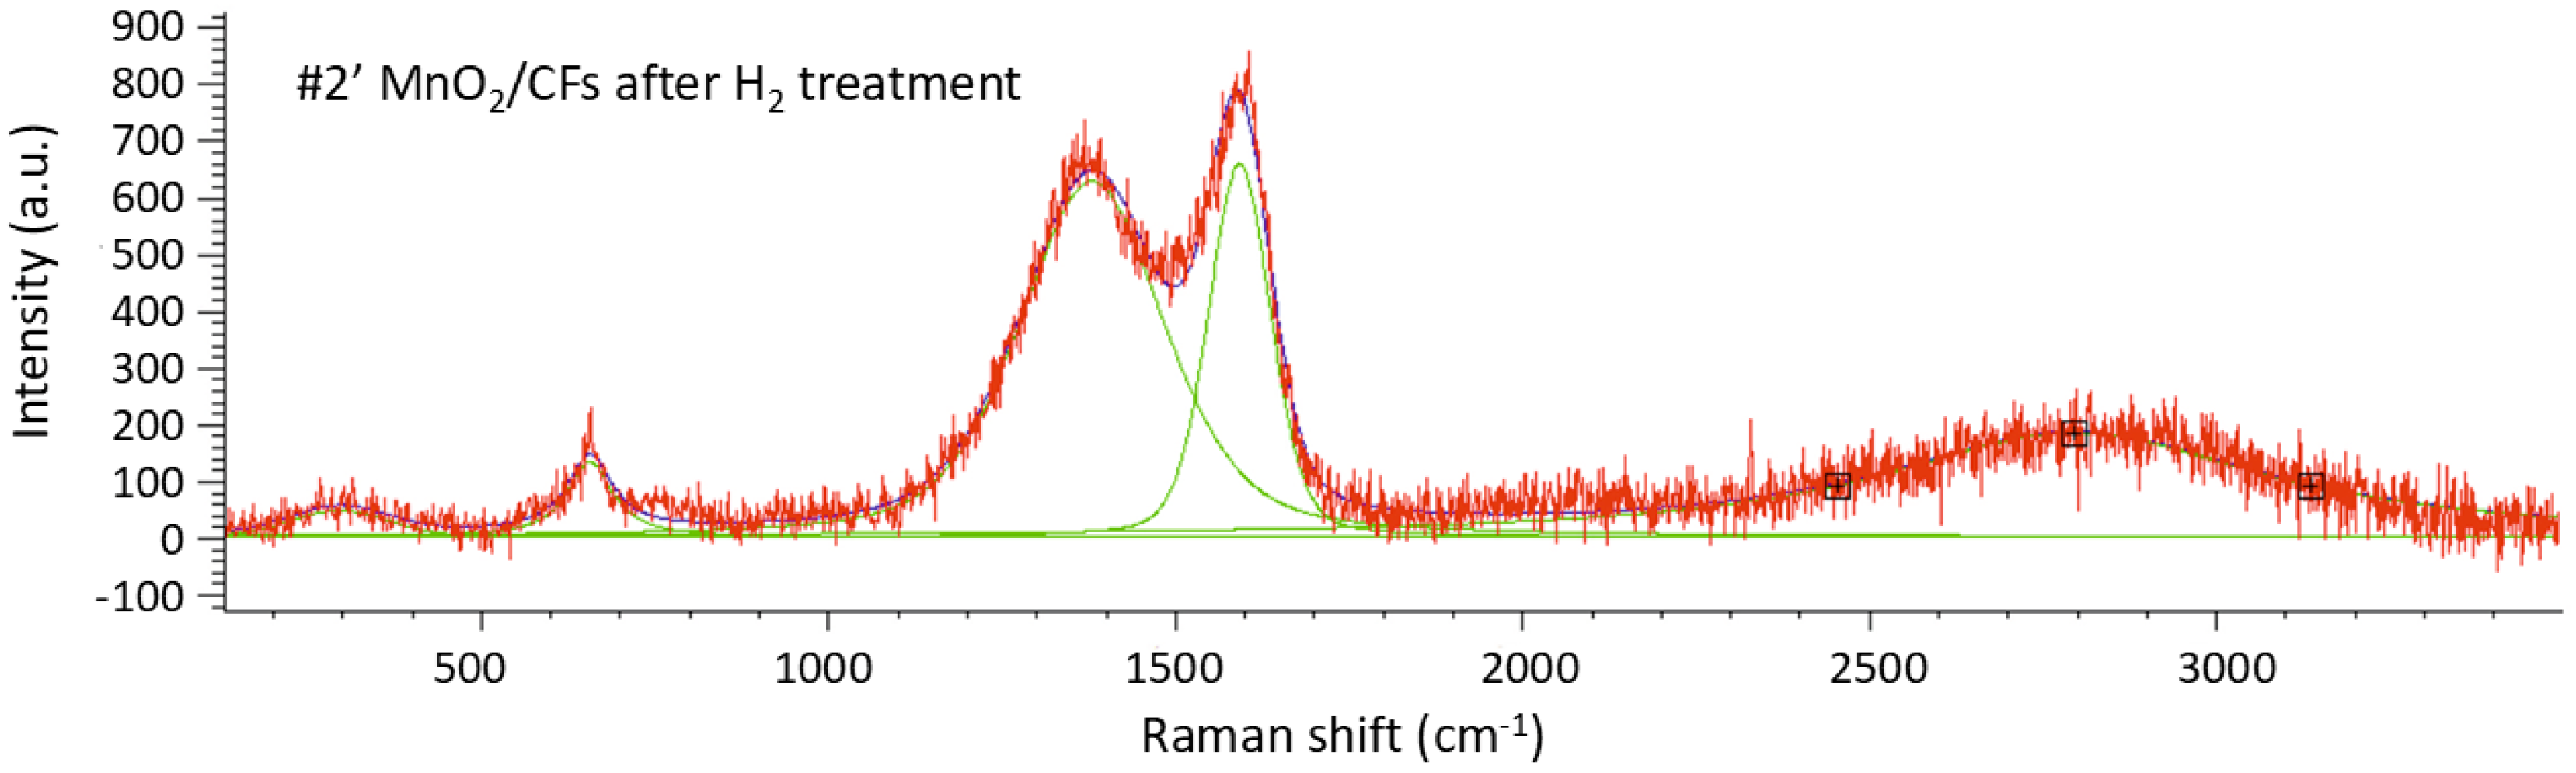
Raman spectroscopy reveals the characteristic D and G bands of carbon fibers at approximately 1350 cm−1 and 1580 cm−1, respectively, in plain activated carbon samples (Figure 8, Table 5) and the sample #2 composed electrochemically (Figure 9, Table 6). A comparative analysis between a MnO2-free sample and a MnO2-containing sample demonstrates the presence of a prominent phonon band at 650 cm−1, attributed to Mn–O A1g symmetric stretching vibrations, as well as a weaker band within the 200–500 cm−1 range, corresponding to Mn–O bending vibrations. In general, the MnO2-containing sample exhibits distinct peaks within the 200–800 cm−1 region—characteristic of manganese dioxide—which are absent in the MnO2-free sample. The ratio Id/Ig for sample #2 is equivalent to 2,51 using the peak areas while the sample number #9 exhibits Id/Ig = 2,38 both showcasing structural defects in the carbon structure. The structural defects were induced by acid treatment, conducted prior to deposition, which led to the formation of functional groups within the graphite matrix of the carbon fibers (CFs) [23,24]
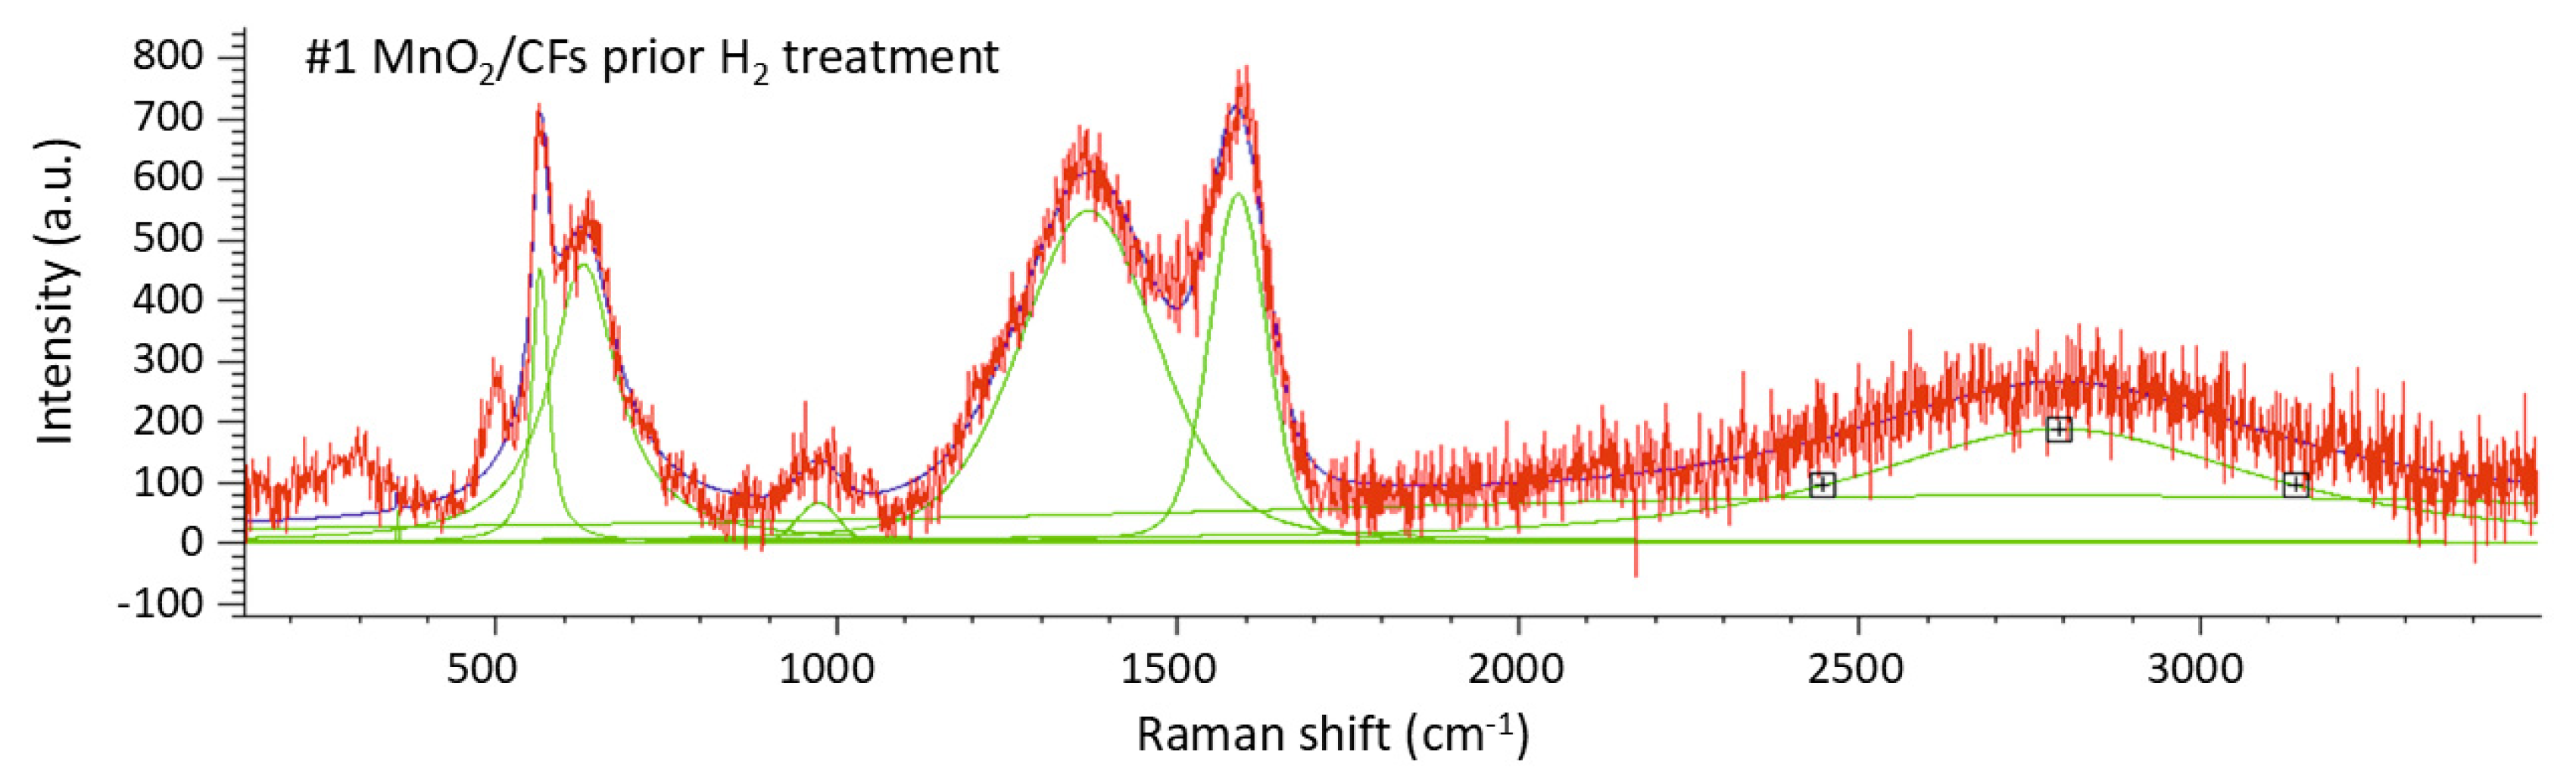
Raman spectroscopy was used to investigate the sample with a 24-hour chemical synthesis, both before (Figure 10, Table 7) and after exposure (Figure 11, Table 8) to hydrogen gas. The intensity ratio ID/IG for sample #1 is 2.37, calculated using the integrated areas of the respective peaks, while sample #1′ exhibits an ID/IG ratio of 2.81, indicating the presence of structural defects in the carbon framework in both cases.
The peaks observed in the range 200–800 cm−1 in both spectra can be attributed to the presence of MnO2. More specifically, for the sample prior to hydrogen exposure (Figure 10, Table 7), peaks 1 (~353 cm−1), 2 (~562 cm−1), 3 (~626 cm−1), and 4 (~971 cm−1) correspond to bending and twisting modes of Mn–O bonds (arising from Mn in different polymorphic forms). The highest of these four peaks (peak 4), which is absent in the spectrum of the hydrogen-exposed sample, may be associated with more stable or rigid MnO2 structures, such as β-MnO
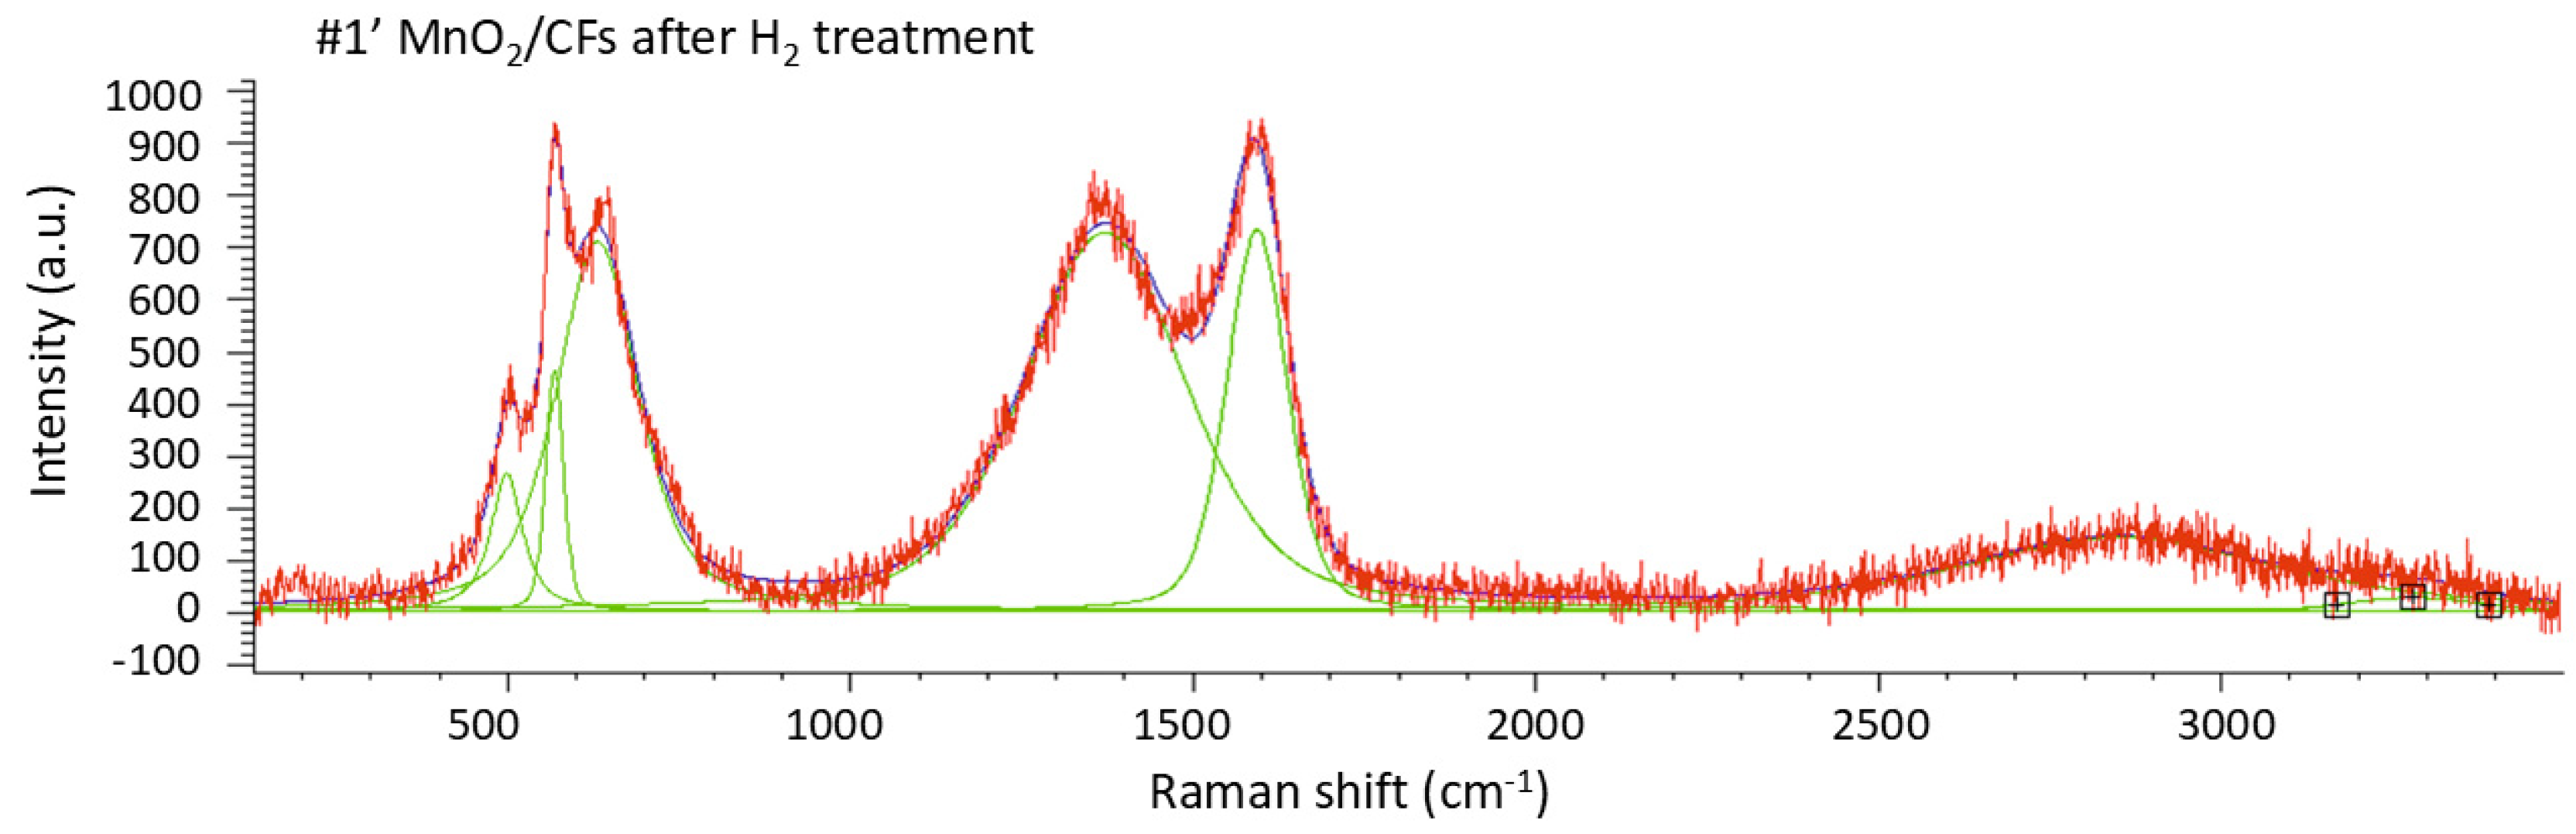
2. In the spectrum of the same material after hydrogen exposure (Figure 11, Table 8), the number of peaks within the 200–800 cm−1 range is reduced, their intensity increases, and a shift toward higher wavenumbers is observed. This behavior may be attributed to a phase transformation of manganese and/or its partial reduction to lower oxidation states, such as the formation of MnO [25,26].
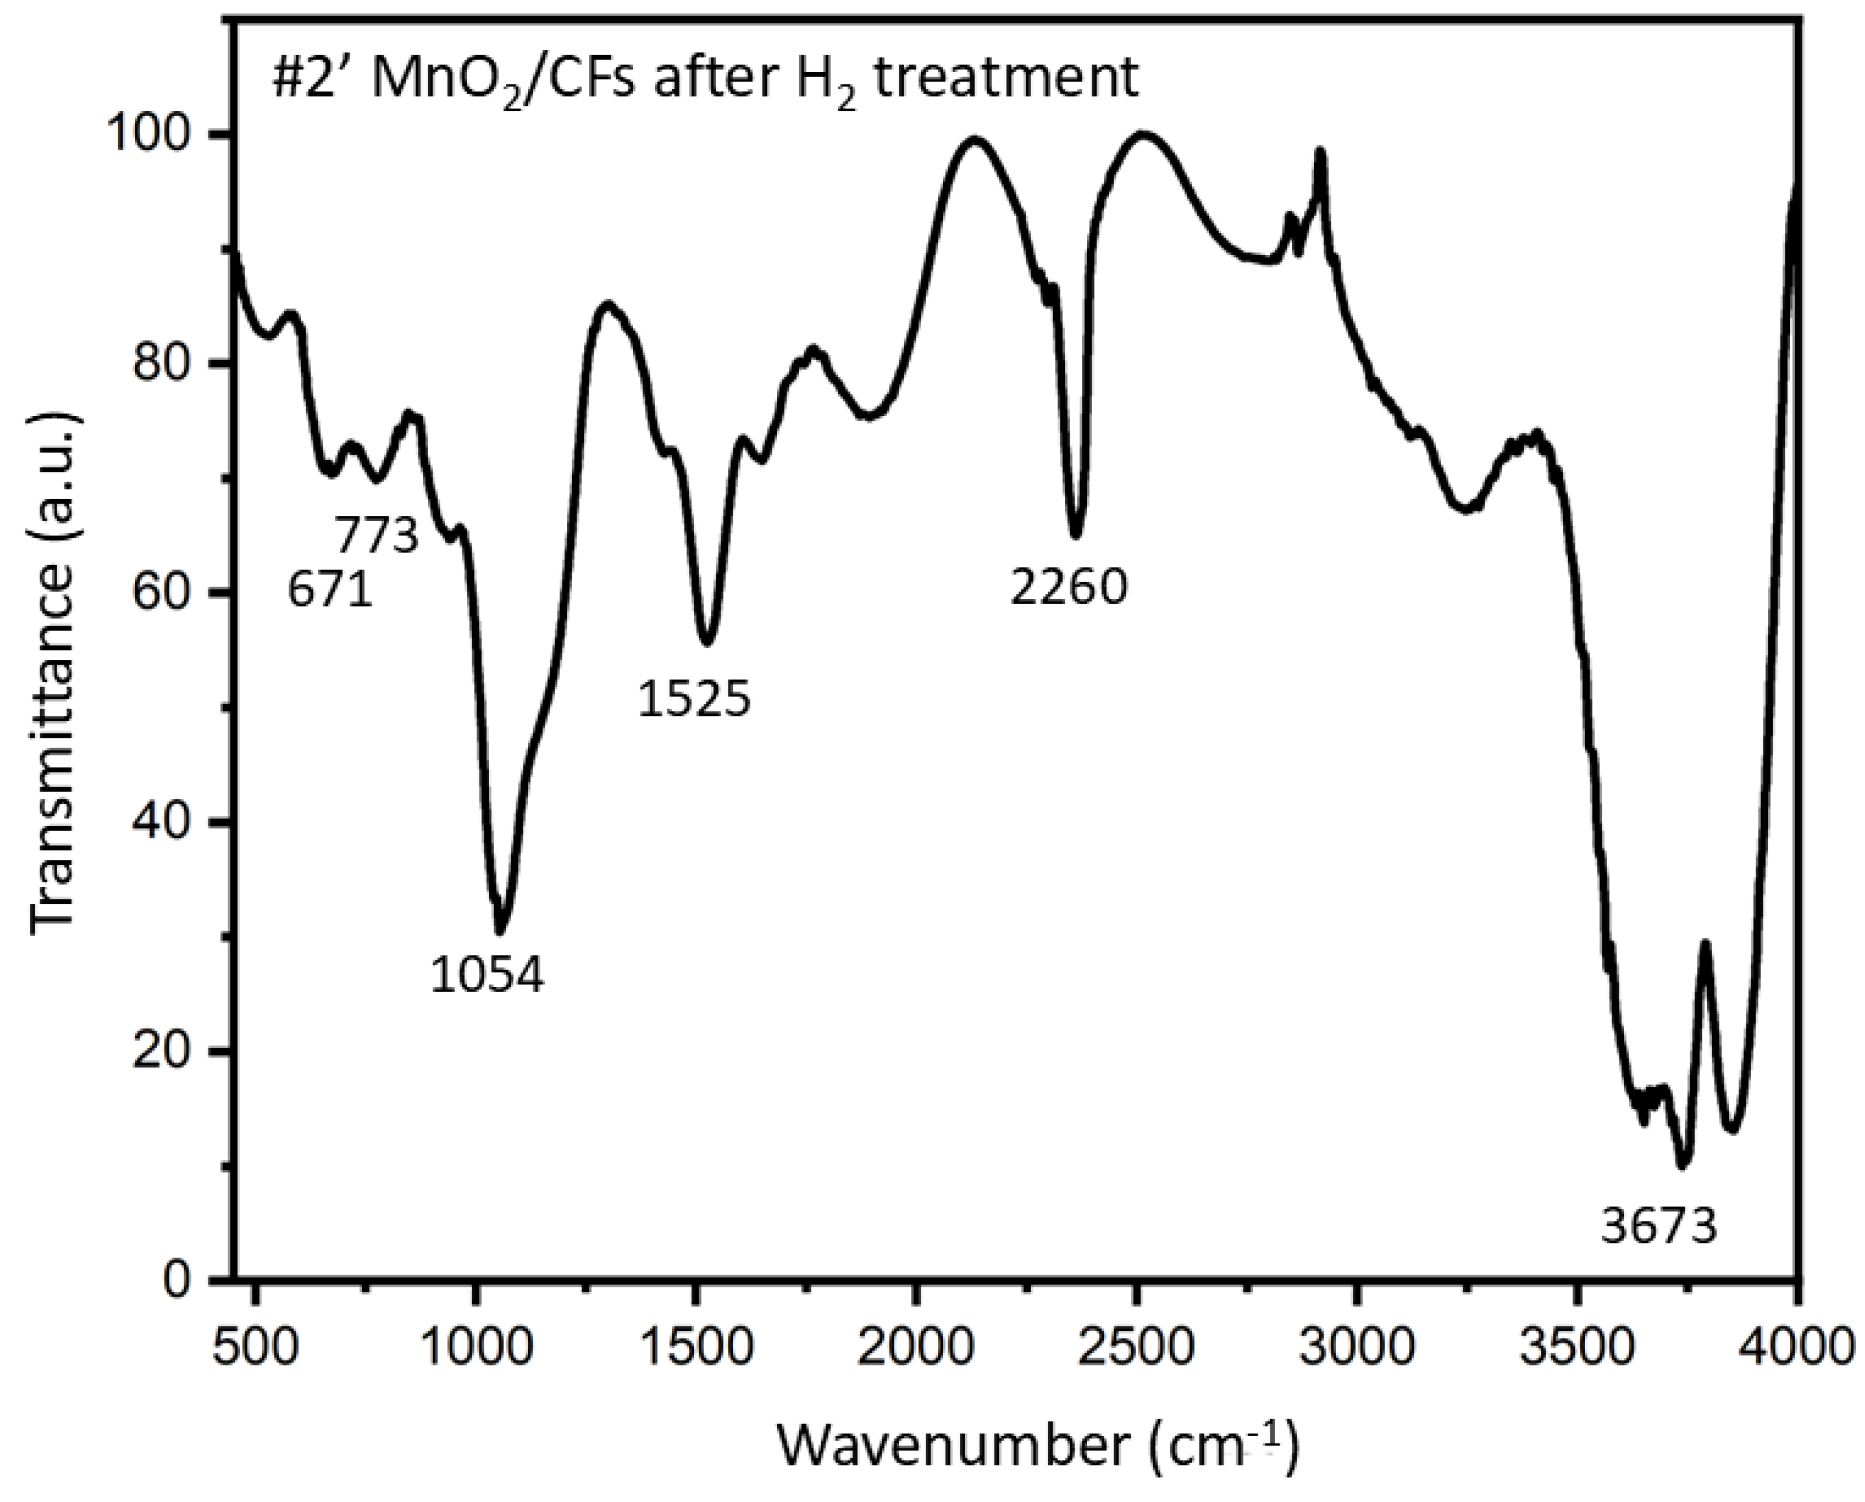
The structure of the synthesized fibers was further examined using FTIR spectroscopy. Specifically, Figure 12 presents the FTIR spectrum of sample #2′, which was synthesized via electrochemical deposition for 20 minutes at 28 °C and subsequently exposed to H2 treatment.
The broad band at 3500-3700 cm−1, corresponding to O–H bending vibrations, indicates the presence of hydroxyl groups, which may be attributed to either adsorbed water or the partial reduction of MnO2. The broad band at 2220-2260 cm−1 is assigned to C≡N stretching vibration; CFs made from polyacrylonitrile often retain small amounts of nitrile (–C≡N) groups. The band observed at 1054 cm−1 is likely associated with C–OH bending vibrations, suggesting surface oxidation of the carbon fibers. The peak at 1525 cm−1 corresponds to C=C bending vibrations, characteristic of the carbon fiber backbone. Alternatively, it may arise from O–H bending involving oxygen atoms coordinated to manganese [27,28]. Expected Mn–O bending absorptions typically occur in the region of 400–700 cm−1. In the recorded FTIR spectrum, several low-intensity peaks are indeed observed within this range, notably at 671 cm−1, which supports the presence of manganese oxides. Additionally, the peak at 773 cm−1 may be attributed to a characteristic absorption of manganese oxides with a tunnel-type structure [29].
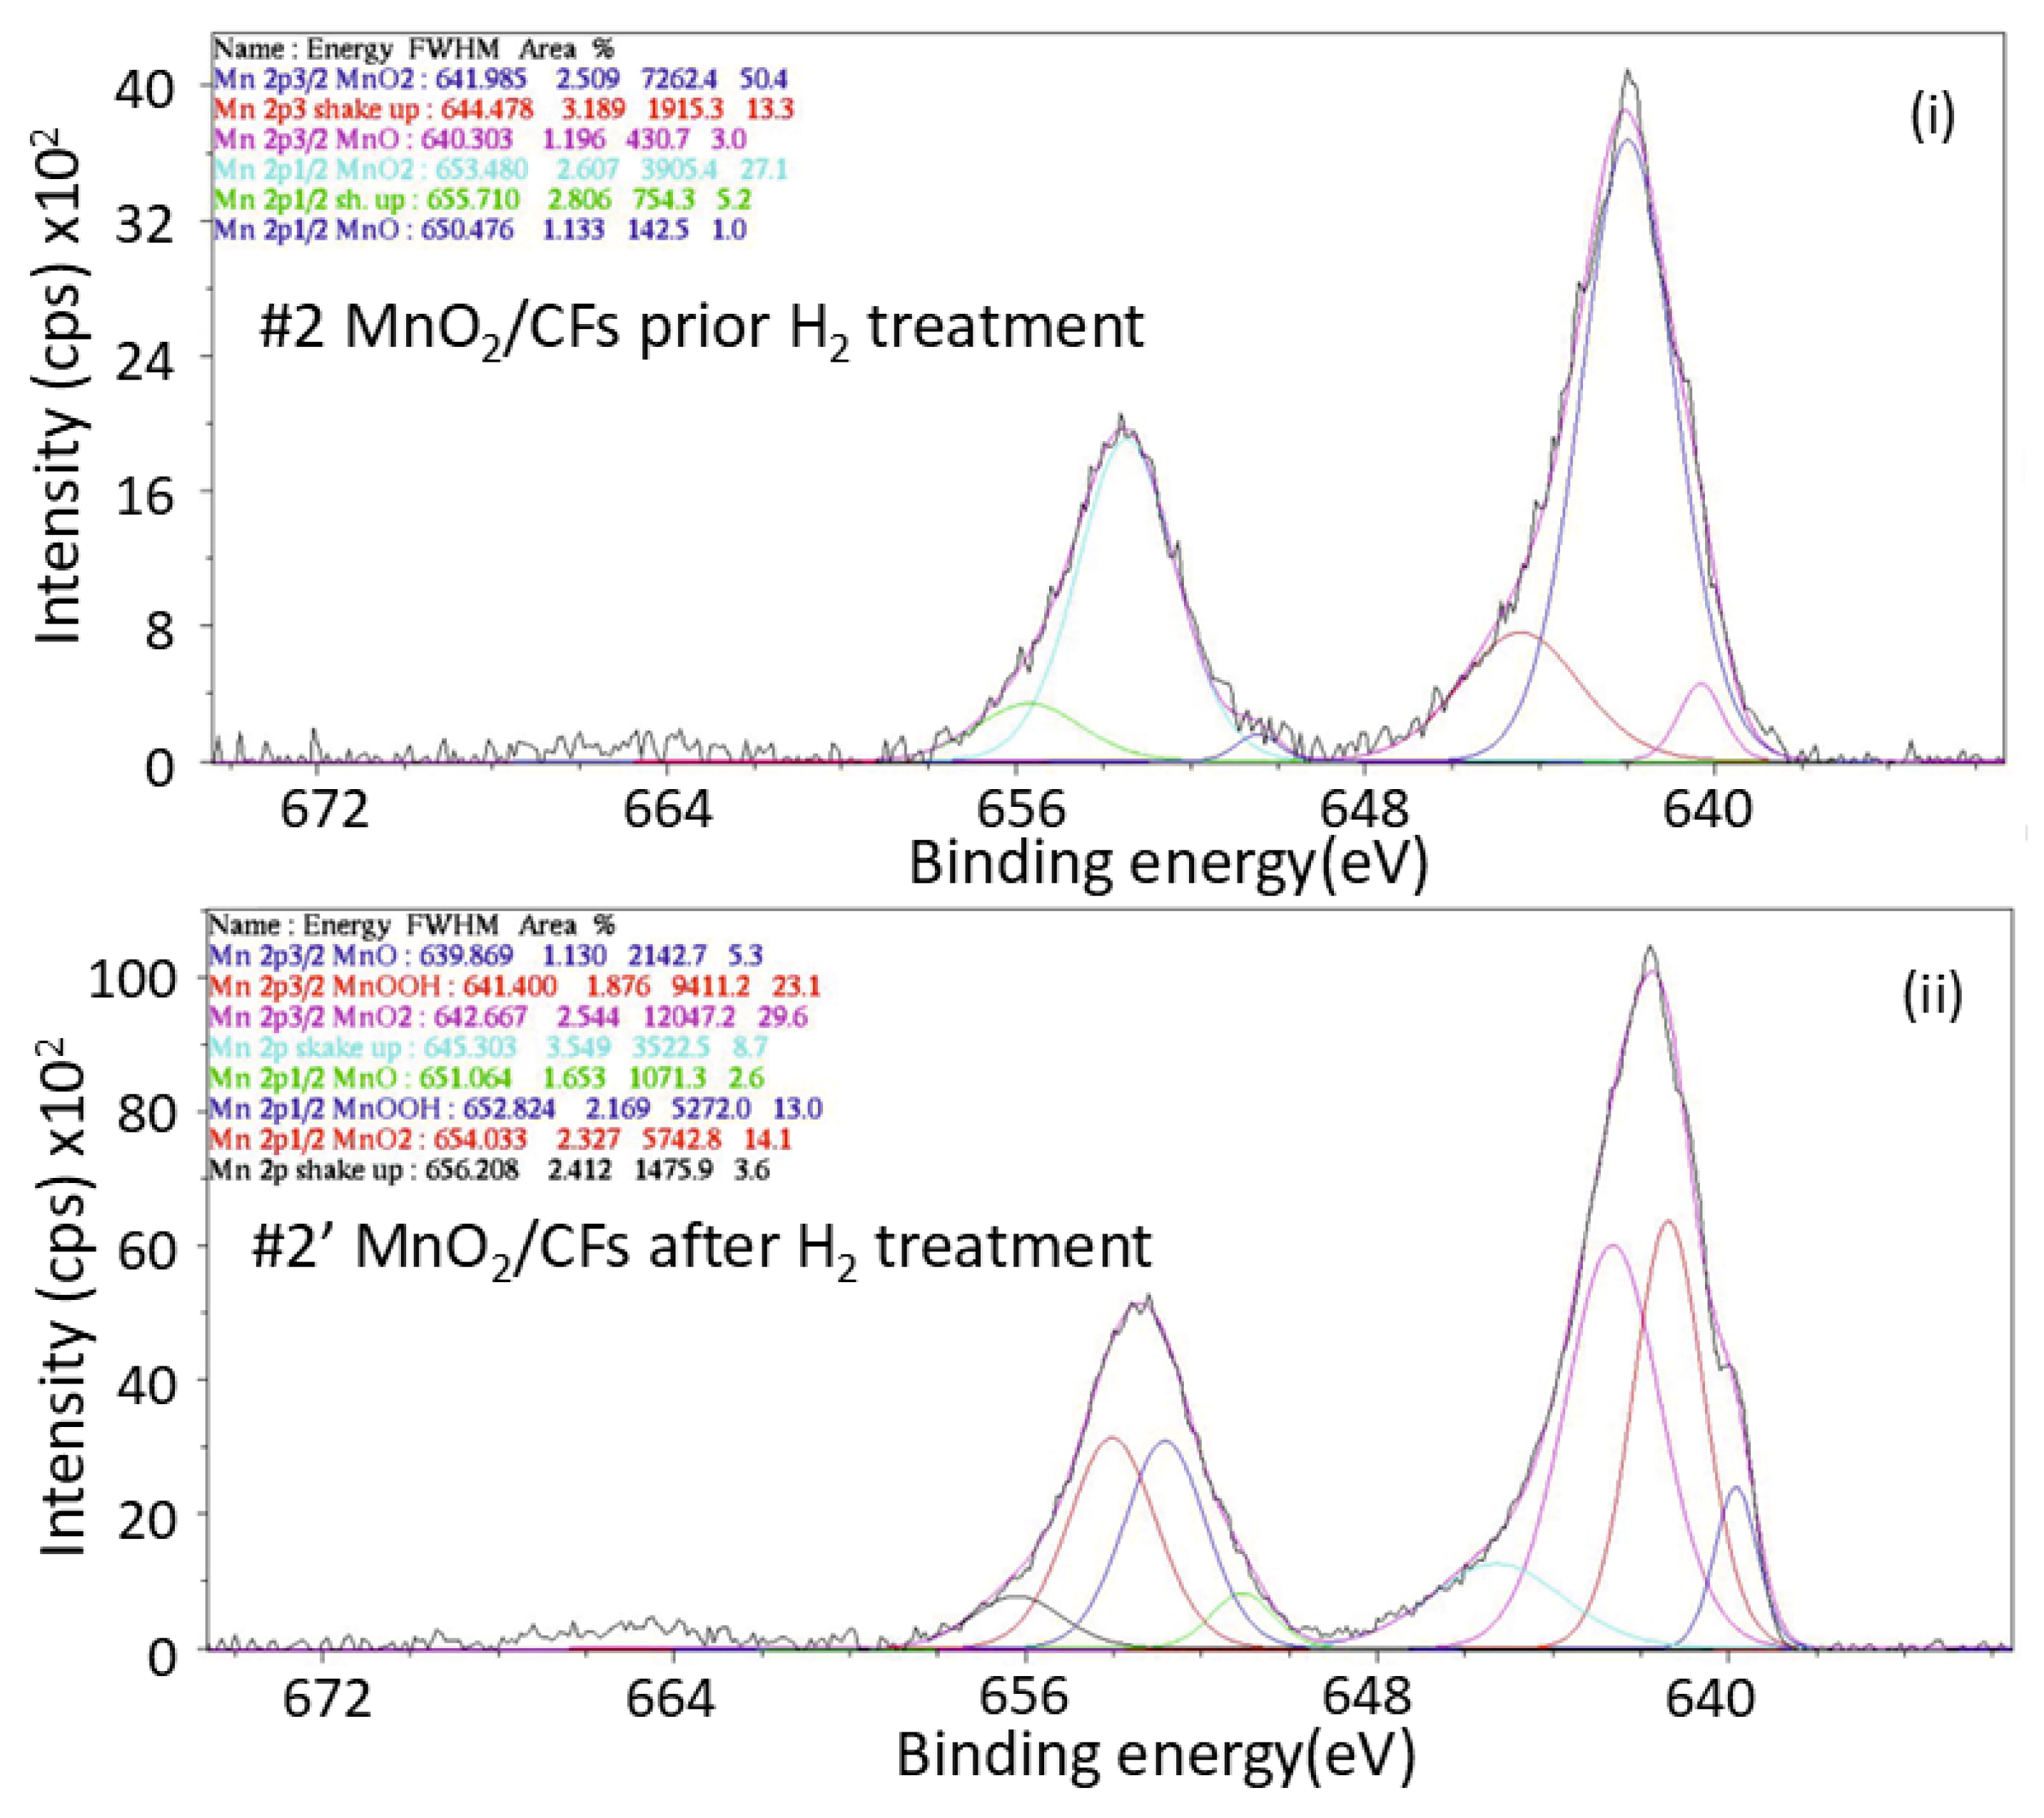
X-ray photoelectron spectroscopy (XPS) spectra of the MnO2/CFs produced electrochemically for 20min at 28℃ (sample #2) were used to determine the surface composition of the material before and after hydrogen exposure and to examine the oxidation state of Mn.
Figure 13. XPS spectrum of Mn 2p orbital for: (i) sample #2 prior exposure to H2 treatment, and (ii) sample #2′ after exposure to H2 treatment; (electrochemical synthesis, t = 20 min, T = 28 ℃).
Preprints 188583 g013
Based on the Mn 2p XPS spectra of Sample 2 prior to hydrogen exposure, the surface composition is predominantly manganese in the +4 oxidation state (Mn4+), corresponding to MnO2. This is evidenced by the characteristic Mn 2p3/2 and Mn 2p1/2 peaks observed at 641.985 eV and 653.480 eV, respectively (spin-energy difference of 11,495 eV), along with the presence of shake-up satellite features typically associated with Mn4+ [30]. Quantitative analysis indicates that Mn4+ accounts for approximately 96% of the total manganese signal. A minor contribution from Mn2+ (MnO) is also detected, represented by weaker peaks at 640.303 eV (2p3/2) and 650.476 eV (2p1/2), comprising about 4% of the surface Mn species.
Following hydrogen exposure, the Mn 2p spectrum reveals significant changes in the oxidation state distribution. New peaks appear at 639.869 eV (2p3/2) and 651.064 eV (2p1/2), corresponding to Mn2+ species, now constituting approximately 7.9% of the manganese signal. Additionally, peaks at 641.400 eV (2p3/2) and 652.824 eV (2p1/2) are attributed to Mn3+ species, which account for 36.1%. The proportion of Mn4+ consequently decreases to 56%, indicating a partial surface reduction of MnO2 upon hydrogen treatment. This suggests that not all Mn4+ species participated in the hydrogen storage process. [12,31,32]
Figure 14. 
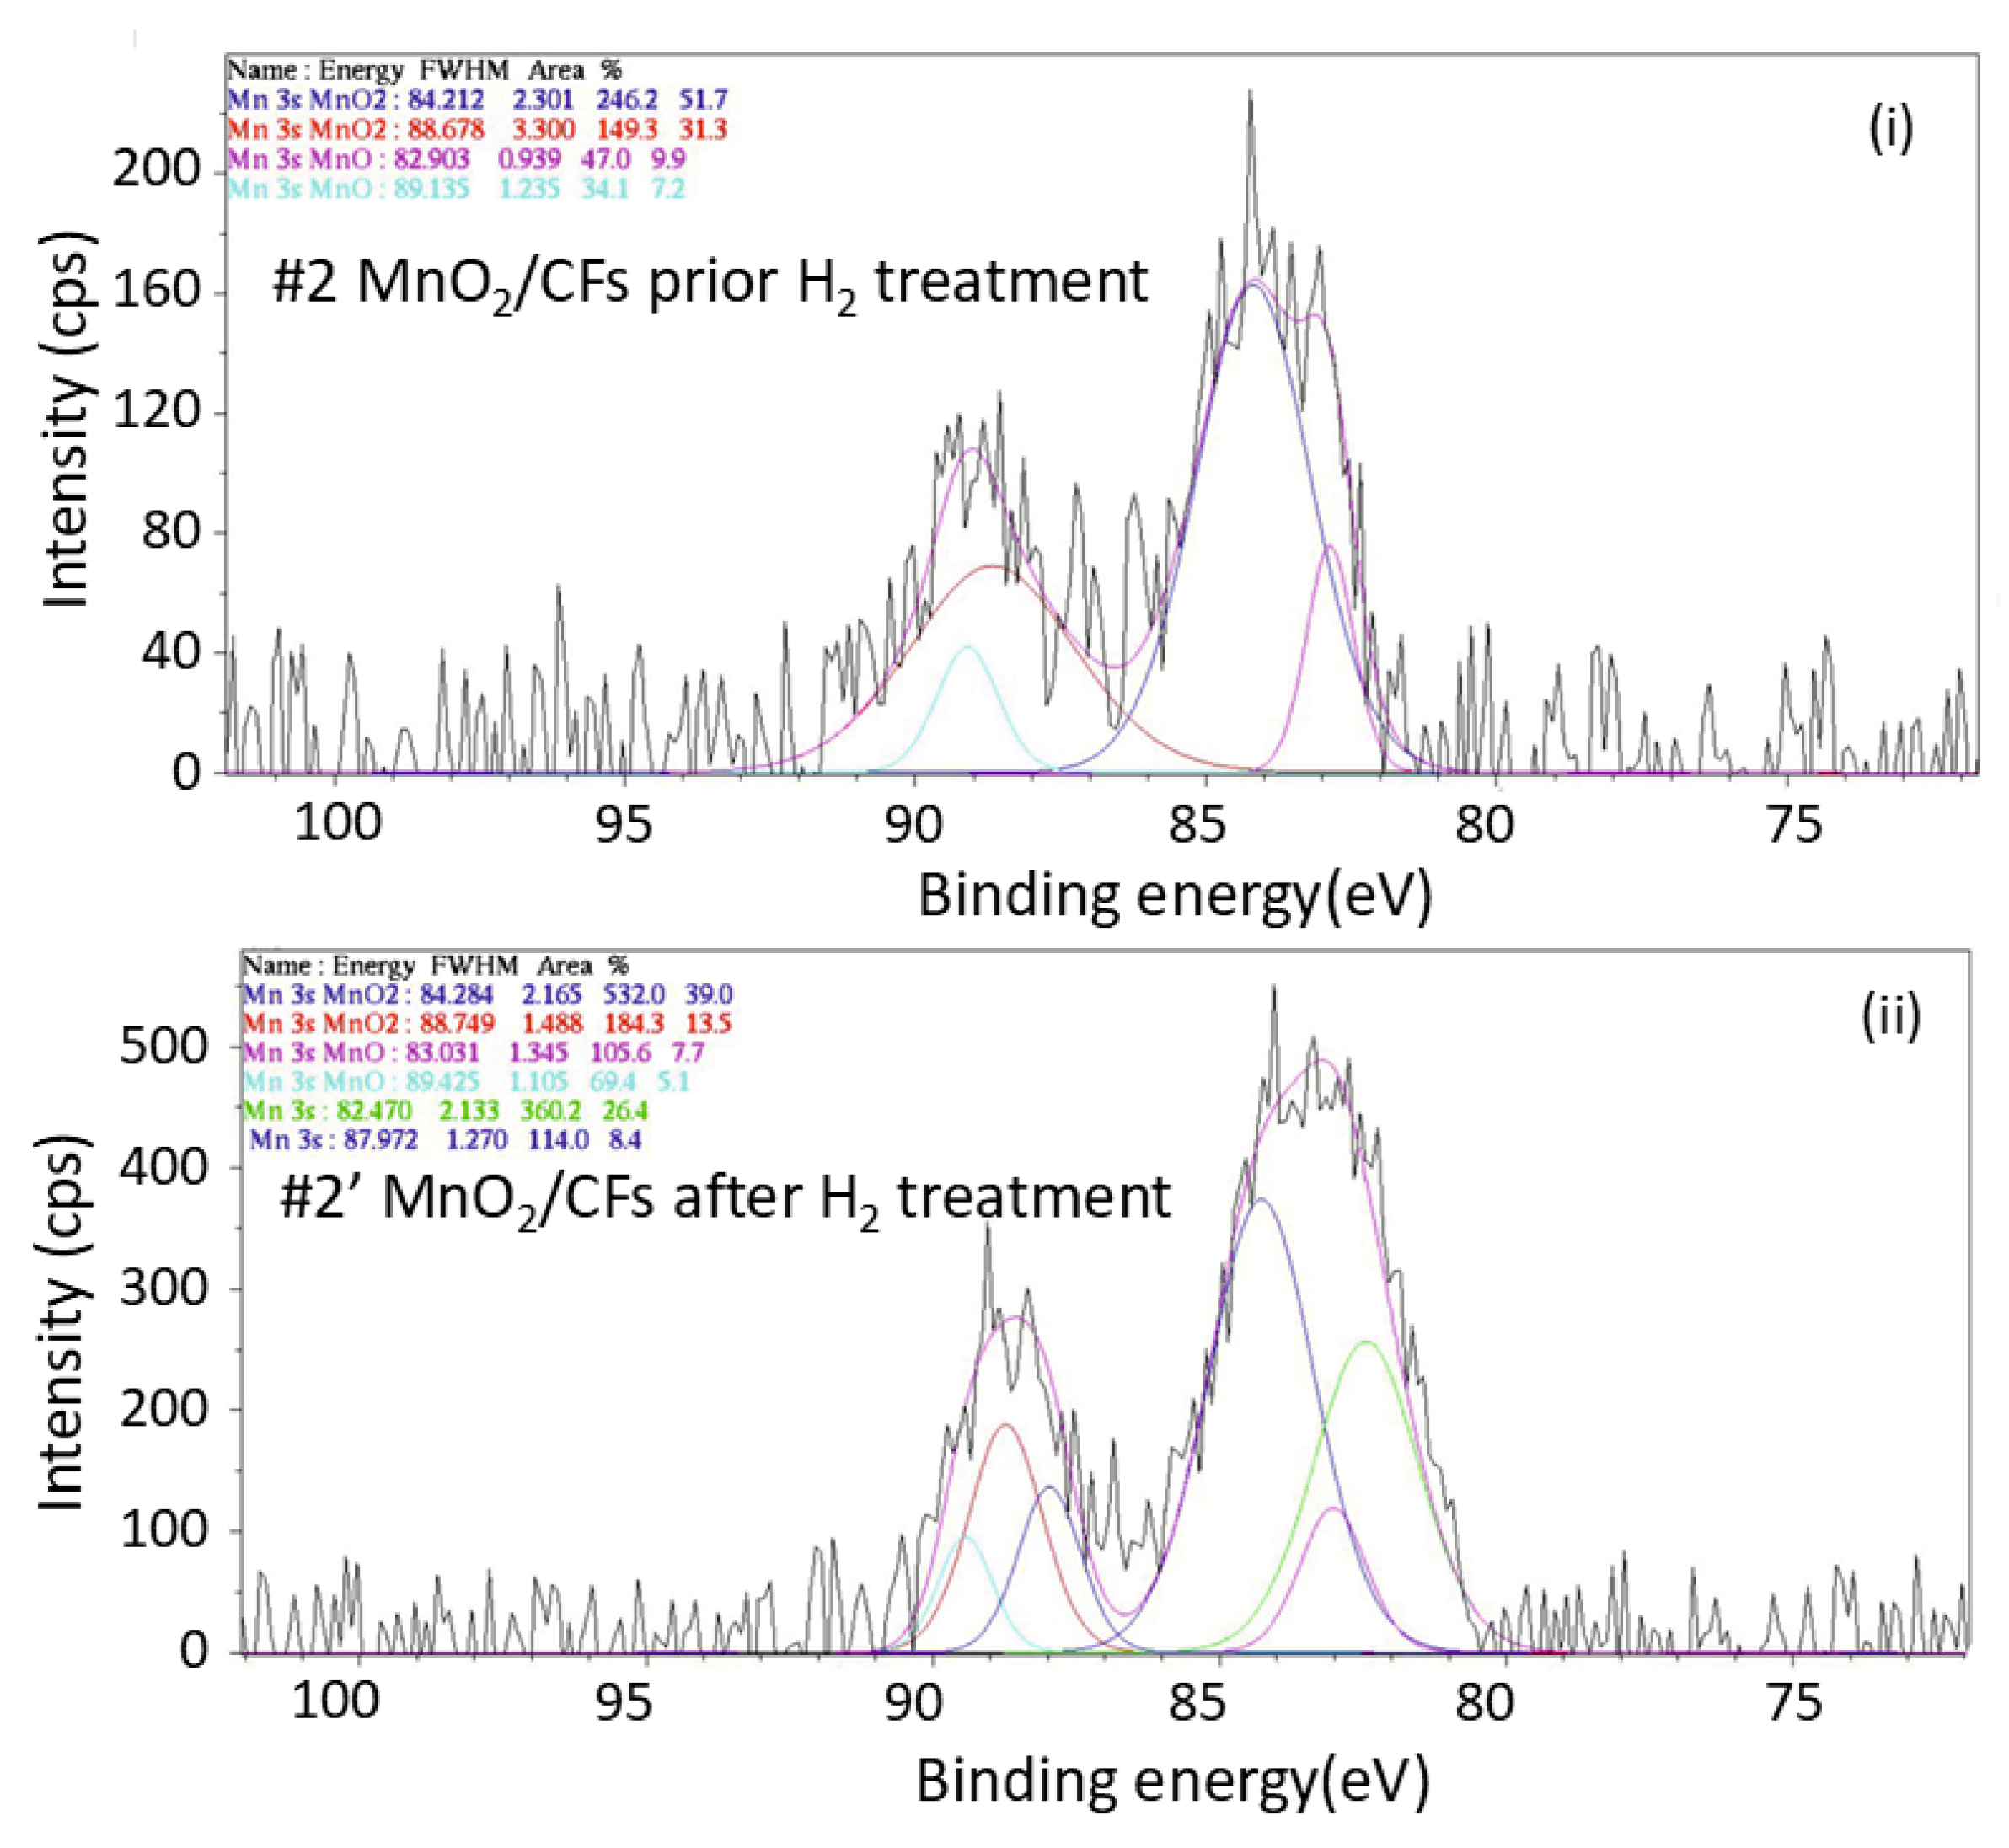
XPS spectrum of Mn 3s orbital for: (i) sample #2 prior exposure to H2 treatment, and (ii) sample #2′ after exposure to H2 treatment; (electrochemical synthesis, t = 20 min, T = 28 ℃).
Preprints 188583 g014
The comparison of Mn 3s XPS spectra between the two samples also confirms the partial reduction of MnO2 to lower oxidation states.
Figure 15. 
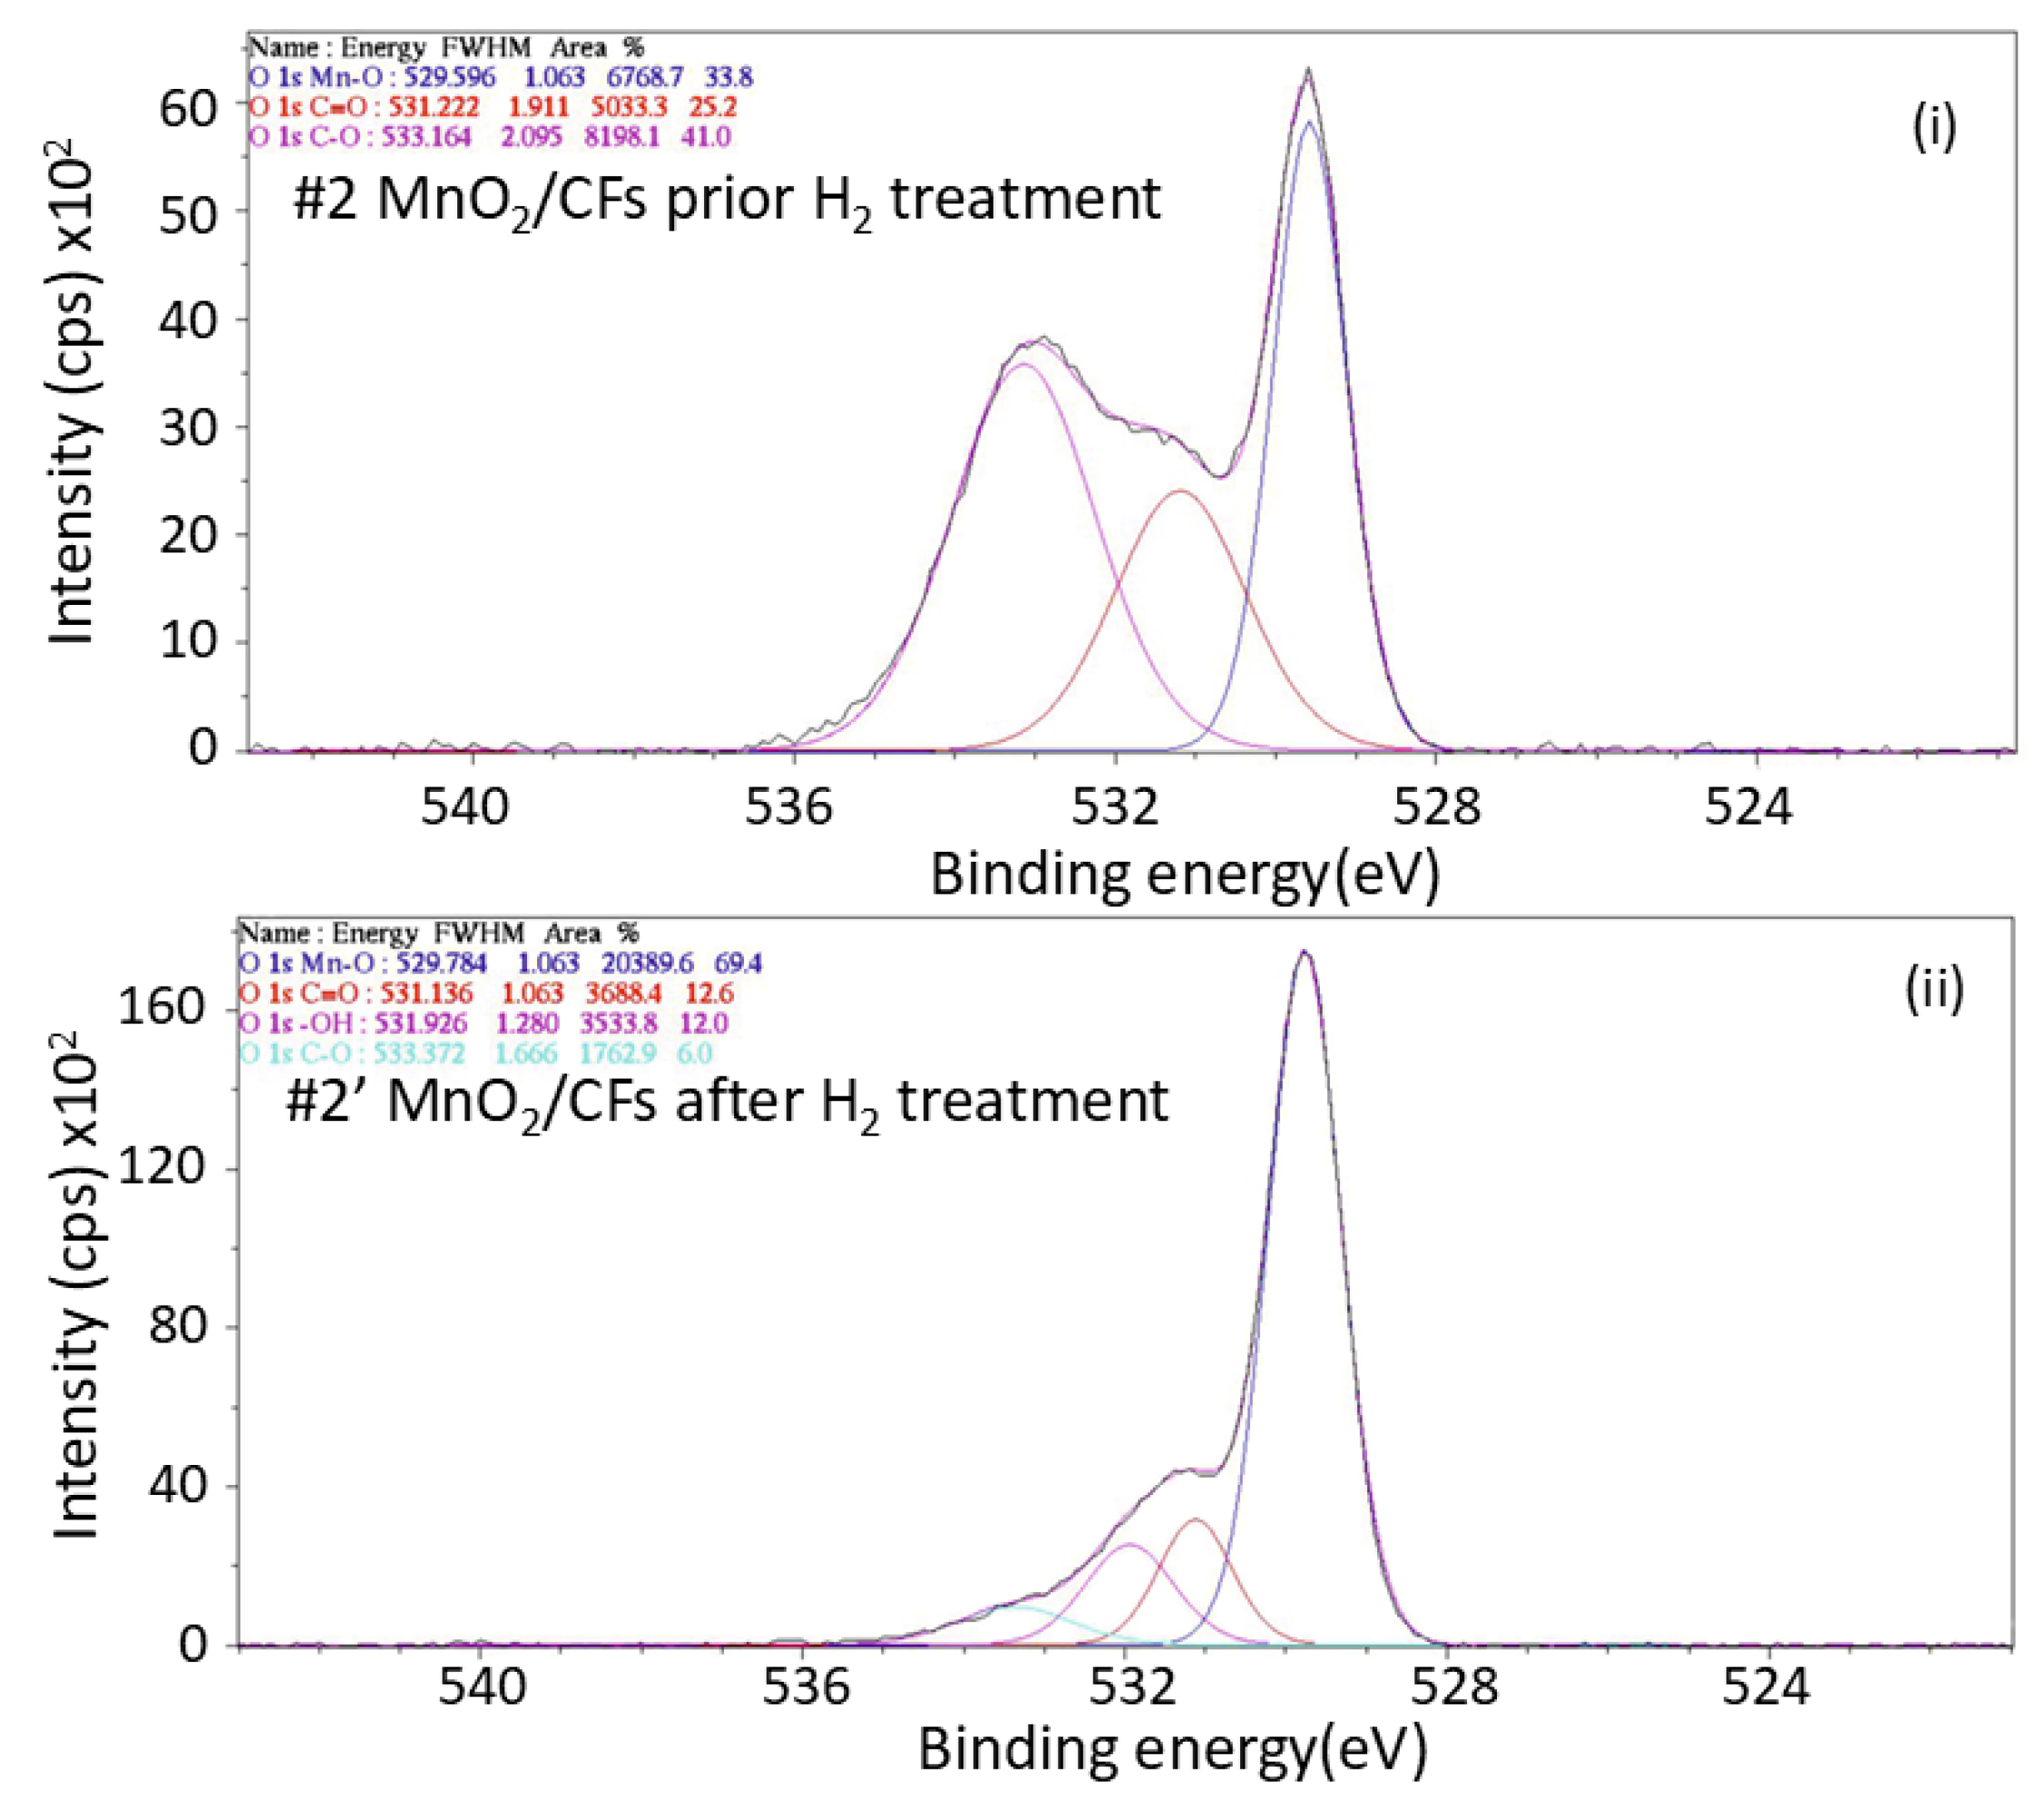
XPS spectrum of the O 1s orbital for: (i) sample #2 prior exposure to H2 treatment, and (ii) sample #2′ after exposure to H2 treatment; (electrochemical synthesis, t = 20 min, T = 28 ℃).
Preprints 188583 g015
The O 1s XPS spectra of MnO2/CFs provide information about the environment of O on the surface of the material before and after hydrogen exposure. In Figure 17 the band at 529.56 eV (33,8%) is attributed to the lattice oxygen in metal oxides meaning Mn-O bonds within the MnO2 structure.The band at 531.222eV (25.2%) corresponds to carbonyl oxygen (C=O) groups which may appear due to the previous oxidation of the carbon surface while the band at 533.162eV reveals the presence of C-O bonds (41%) which may occur due to air exposure. The XPS spectrum of O 1s after H conditioning showcases the same bands increased in concentration (69,4%) for the Mn-O bond at 529.784 eV while the peaks for C=O at 531.136 eV and C-O at 533.372 eV decreace at 12.6% an 6.0%. This phenomenon suggests that the hydrogen treatment might have reacted with or removed some of these oxidized carbon species, possibly through hydrogenation reactions forming volatile products like water or hydrocarbons. The band at 531.926 eV corresponds to -OH meaning the formation of a hydrolized manganese oxide and proving the reduction of Mn [14,33,34].
By integrating the data obtained from both the O 1s and Mn 2p XPS spectra, it is possible to quantify the percentage of MnO2 present on the surface of the material before and after hydrogen conditioning, although the quantitative comparison of the two samples is not comparable due to uneven deposition of the material, further information will be addressed in the Appendix A.

3.3. Thermal Behaviour Characterization-

The study of TGA diagrams of the synthesized MnO2/CFs materials under inert and oxidative atmospheres provides insight into the fiber composition and their hydrogen adsorption capacity. The thermogravimetric curve reflects various mass changes occurring during the decomposition process. The inclusion of the first derivative (DTG) in the diagram aids in detecting subtle mass changes that may not be clearly visible in the standard mass loss curve as a function of temperature [35].
TGA studies of carbon fibers in an oxidative environment (presence of O2) show a gradual mass loss of 1.6% up to 450 °C, followed by a sharp mass reduction between 500–820 °C, attributed to oxidative activity on the fiber surface. In contrast, carbon fibers in an inert atmosphere (N2), under the same heating rate (20 °C/min), exhibit minor mass changes, with a mass loss of approximately 1.2% between 200-450 °C [36]. Manganese dioxide (MnO2) in the presence of air (O2) exhibits a mass change at T ≈ 250–400 °C due to the reaction:
6MnO2 → 3Mn2O3 + 3O2
and another mass change at 400–600 °C attributed to the transformation [37]:
3Mn2O3 → 2Mn3O4 + 0.5O2
Under inert conditions (N2), the same transformations occur but at higher temperatures, with a mass loss of approximately 9% at T ≈ 500–600 °C, and an additional ~3% mass loss at 700–800 °C, corresponding to the same respective conversions [38].
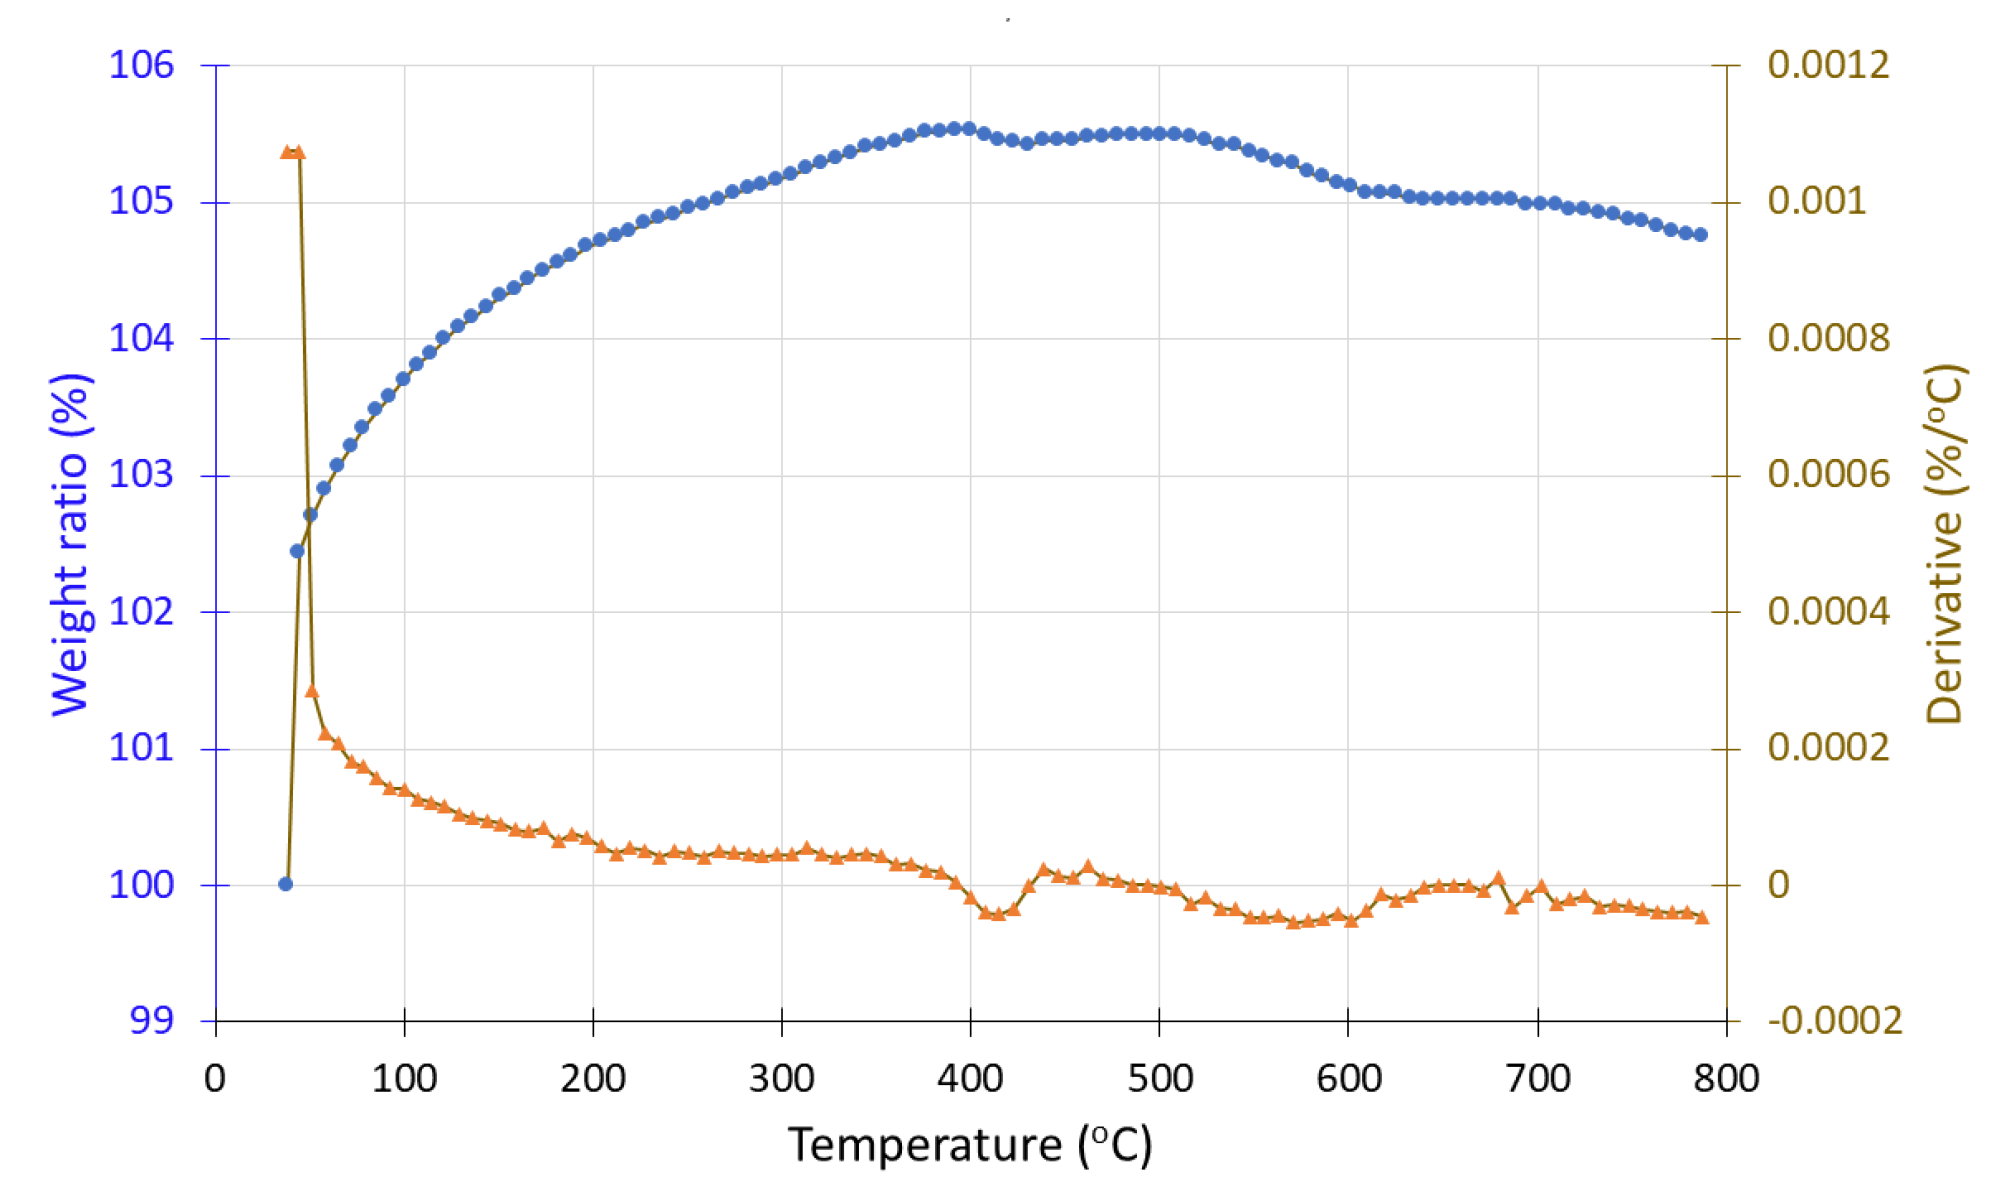
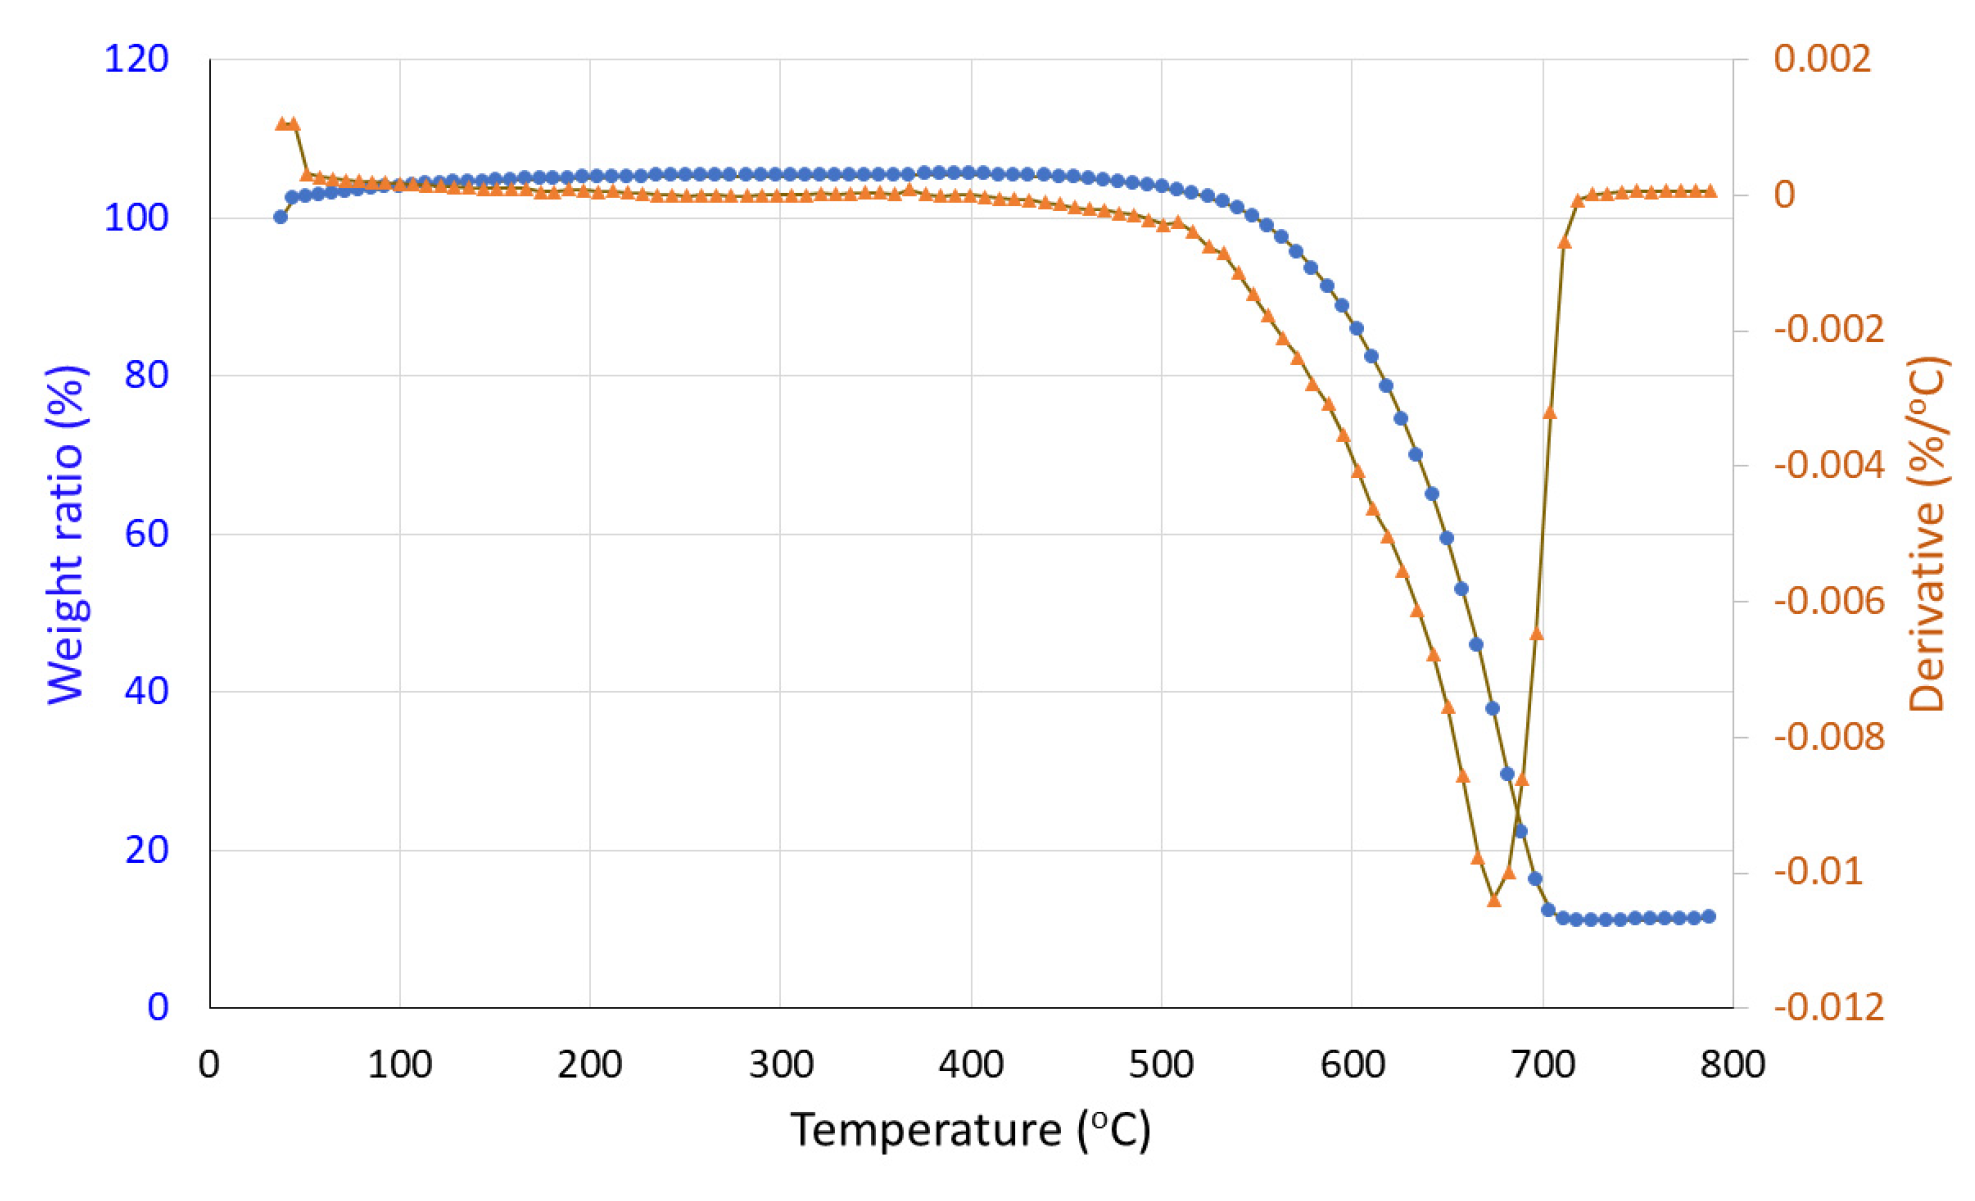
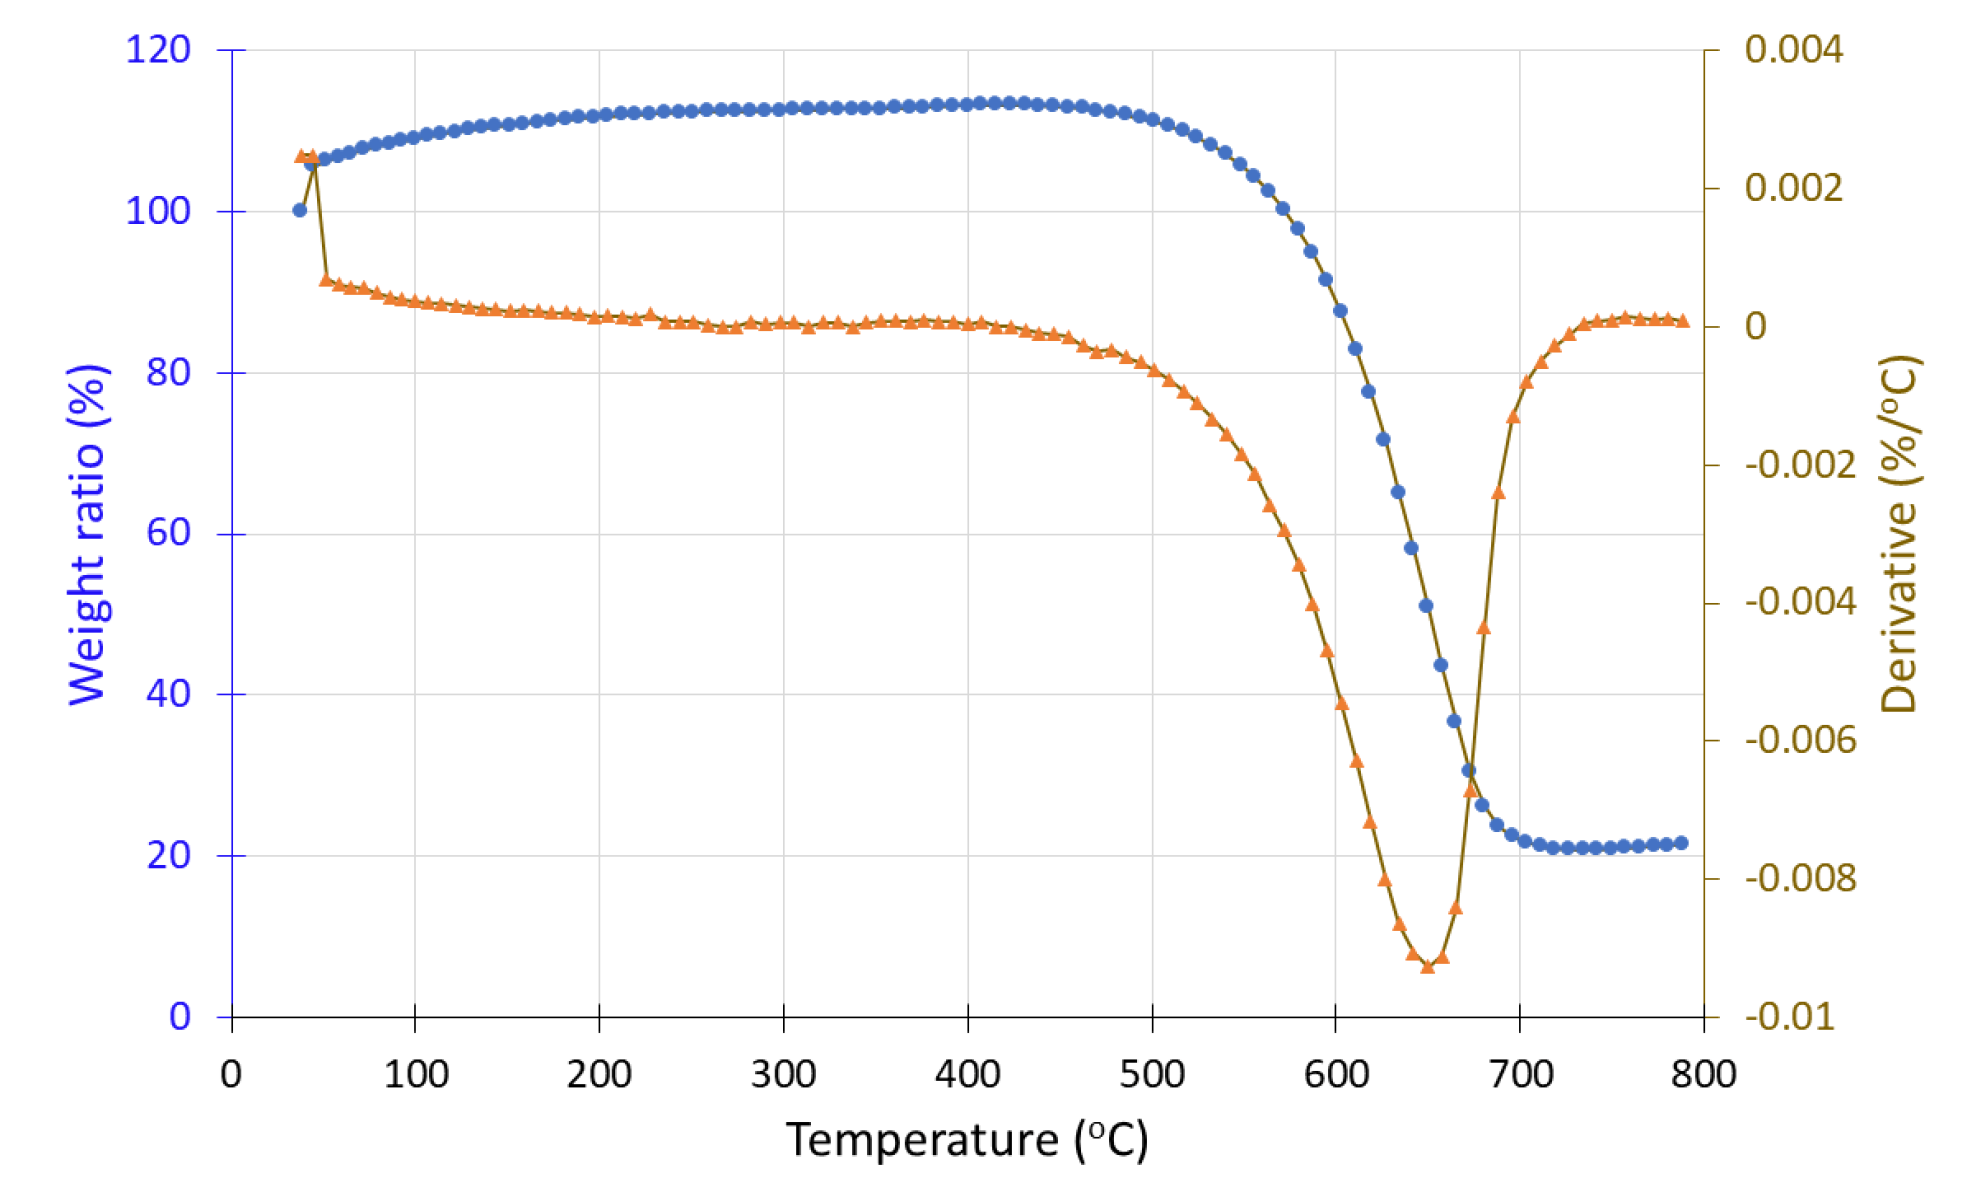
Both sample #1, before and sample #1′ after hydrogen exposure were studied under inert conditions (N2 atmosphere). In the case of sample #1, a mass increase from 100% to 105% is observed up to 500 °C, followed by a 1% mass loss. In contrast, the hydrogen-exposed sample (#1′) shows a continuous mass decrease from 400 °C to 800 °C. In DTG curve, a negative peak appears around 500 °C, corresponding to a mass loss of approximately 7%. A contradiction seems to exist because, according to the literature, MnO and Mn2O3, which are manganese oxide phases, are known to gain mass under inert conditions, and these forms should be present after hydrogen exposure (i.e., in sample #1′). However, the TGA results suggest its presence in the pre-exposure sample (#1), while the post-exposure sample (#1′) exhibits mass loss, indicative of MnO2 decomposition. This inconsistency may stem from an experimental error during sample handling, sampling procedures, or during the hydrogen exposure process.
Figure 16. Thermogravimetric analysis (TGA) curve of sample #1 (in situ redox deposition) before H2 treatment showing the weight loss (•) and the derivative (▲) as a function of temperature under inert atmosphere.
Preprints 188583 g016
Figure 17. Thermogravimetric analysis (TGA) curve of sample #1′ (in situ redox deposition) after H2 treatment showing the weight loss (•) and the derivative (▲) as a function of temperature under inert atmosphere.
Preprints 188583 g017
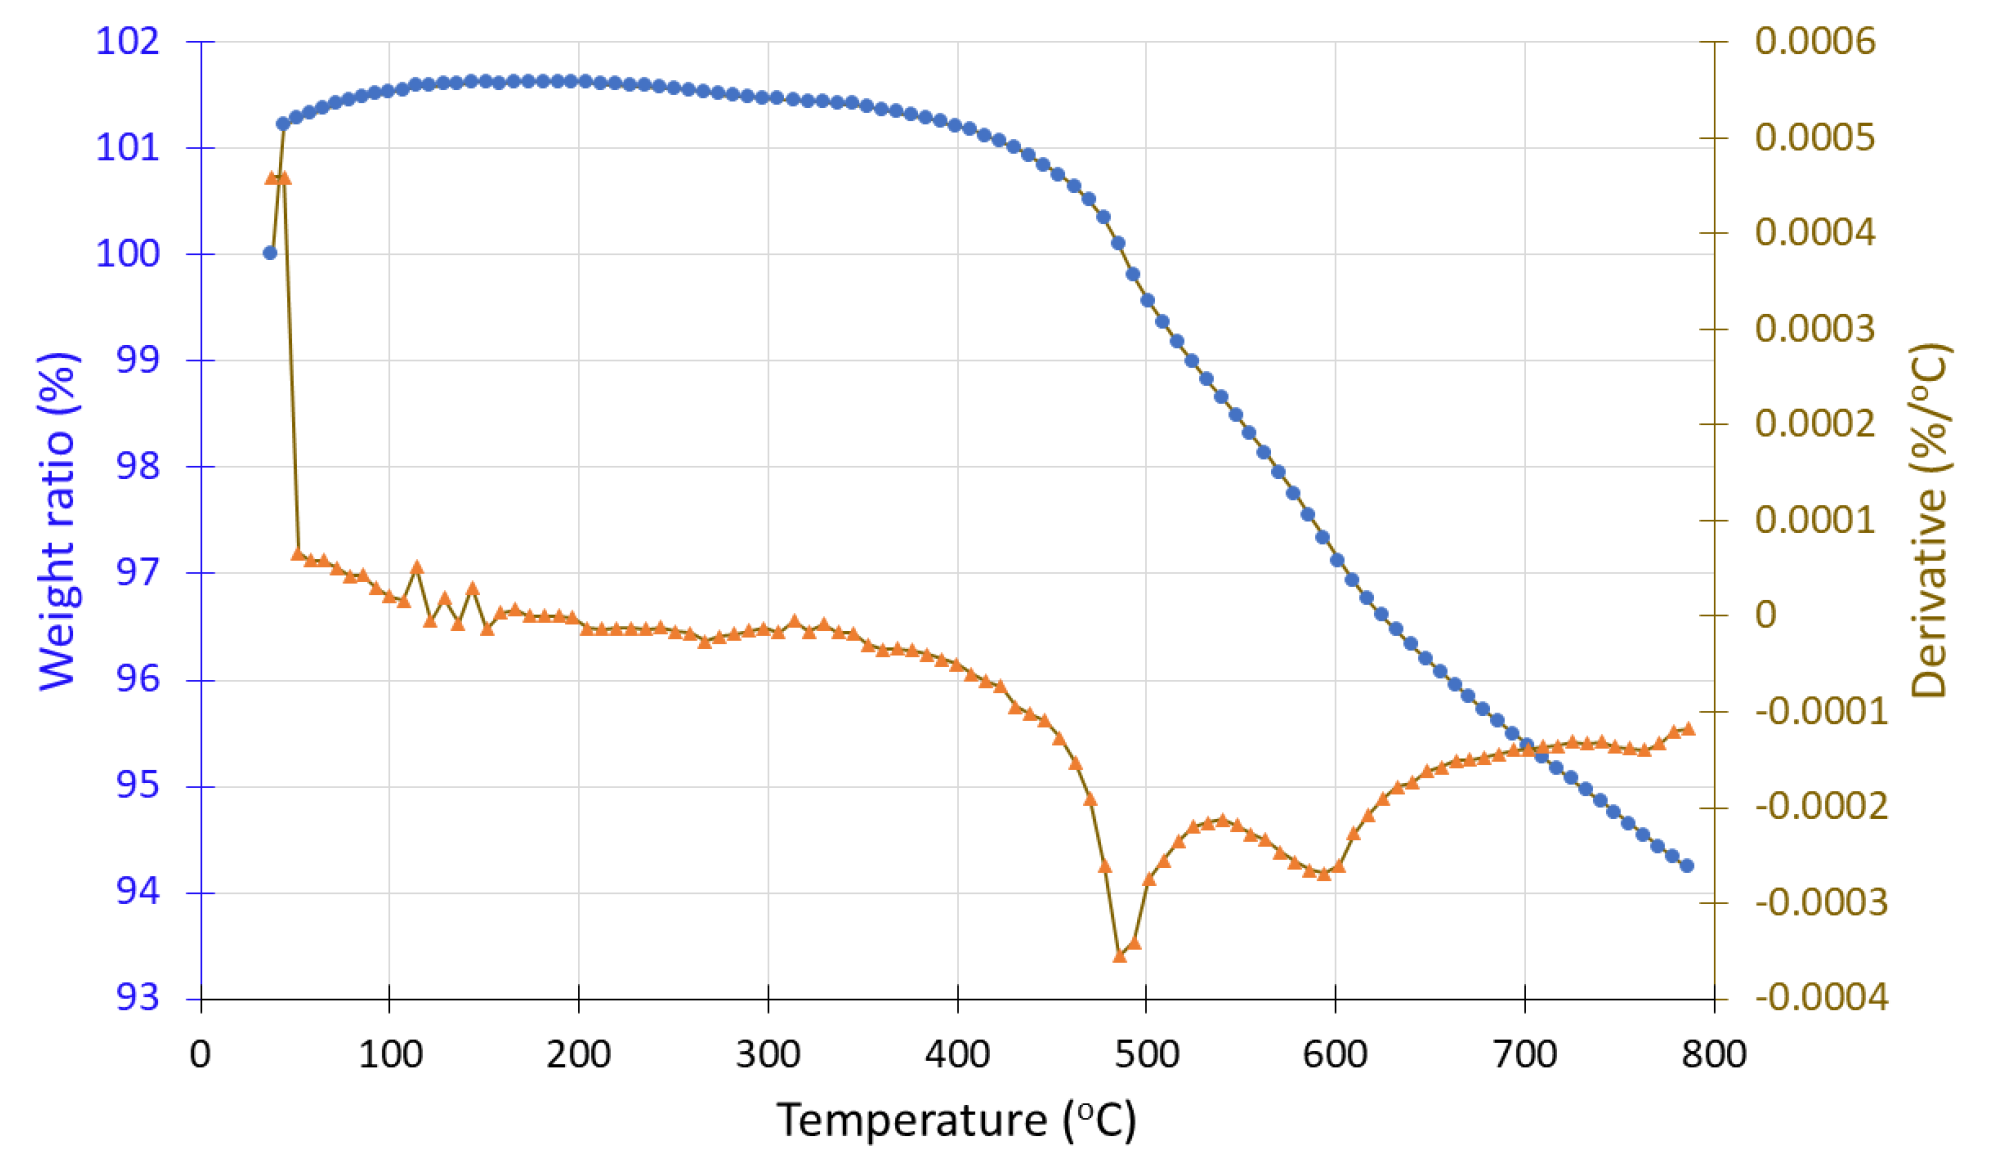
Samples #2 and #2′, before and after hydrogen exposure respectively, were analyzed under both inert (N2) and oxidizing (O2) atmospheres. In the TGA spectrum of sample #2, initial thermal stability is observed up to 500 °C, followed by a sharp mass loss of approximately 87%, reaching a plateau at 700 °C (Figure 18). Beyond this temperature, the residual mass stabilizes at 13%. Comparing these results with known TGA profiles of pure carbon fibers suggests that the remaining mass likely corresponds to the presence of MnO2 or other impurities. Weight loss in oxidizing environment may be attribued to the total decomposition of carbon fibers to gas CO2 which takes place at 400-600 °C. Similarly, in the hydrogen-treated sample (#2′), thermal stability is also maintained up to 500 °C, followed by a sharp mass loss of around 75%, resulting in a final residual mass of approximately 25% (Figure 19).The hydrogen treated sample is consisted of a bigger percent of MnO and MnOOH which are the reduction products of MnO2 Thus, in the hydrogen-treated sample, an increase of about 12% in residual mass is observed. This increase may be attributed to MnO2 transformations upon reduction, leading to the formation of manganese oxides with higher thermal stability and greater residual mass.
Under inert conditions (N
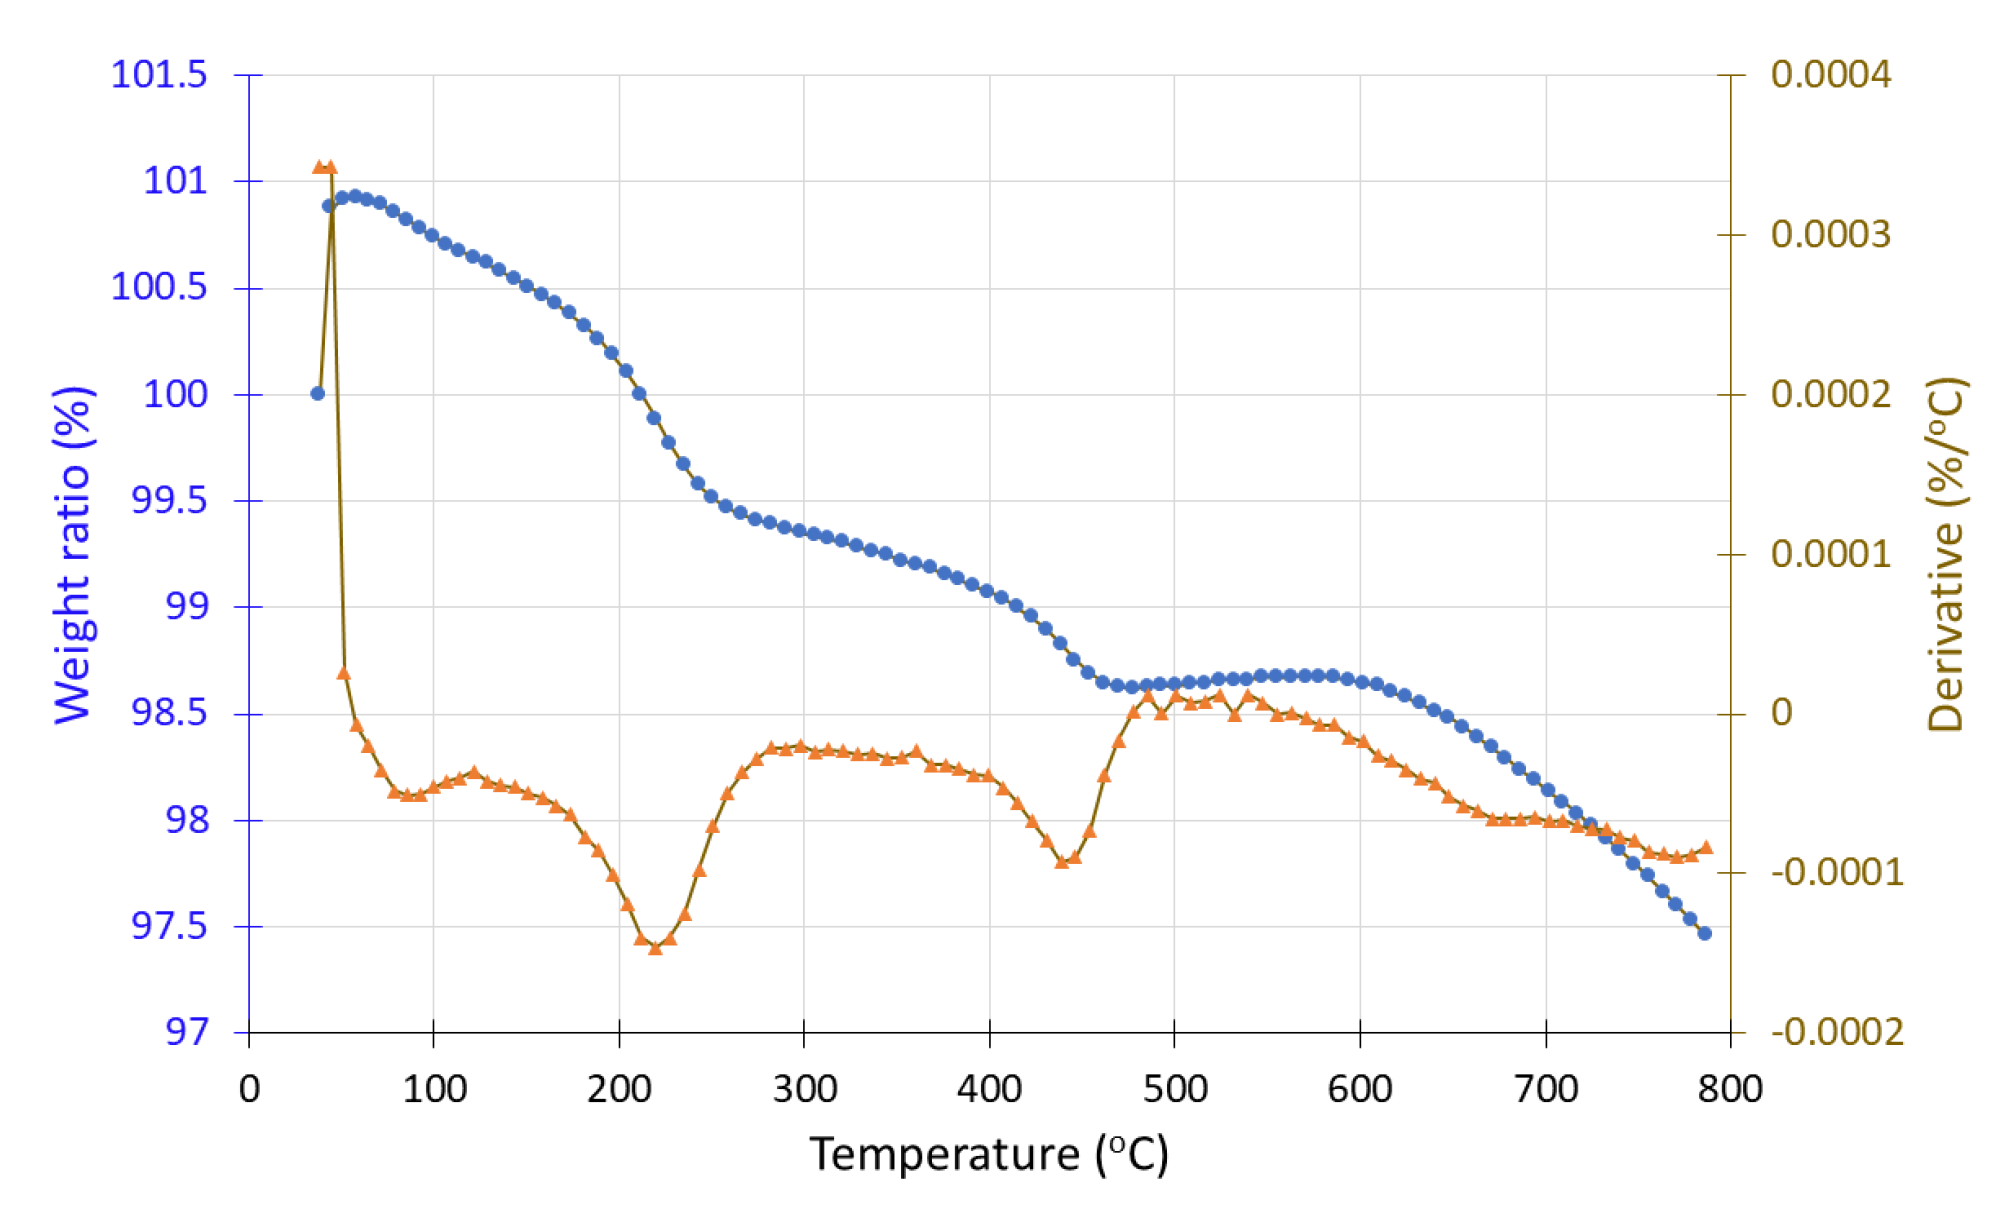
2), we observe the weight change attributed mainly on the behaviour of the deposited Mn oxides on the surface of CFs as the carbon fibers do not decompose under an inert atmosphere. More specifically, sample #2 exhibits a slight mass loss of approximately 0.5% up to 130 °C, with a DTG minimum peak at 70 °C (Figure 20). Between 150–300 °C, a gradual 0.5% mass decrease is observed, with a DTG peak at 250 °C, consistent with the typical TGA behavior of carbon fibers. In the range of 350–500 °C, a minor additional mass loss may be attributed to the conversion of MnO2 to Mn2O3 which occurs due to high temperature exposure and releases gas O2.
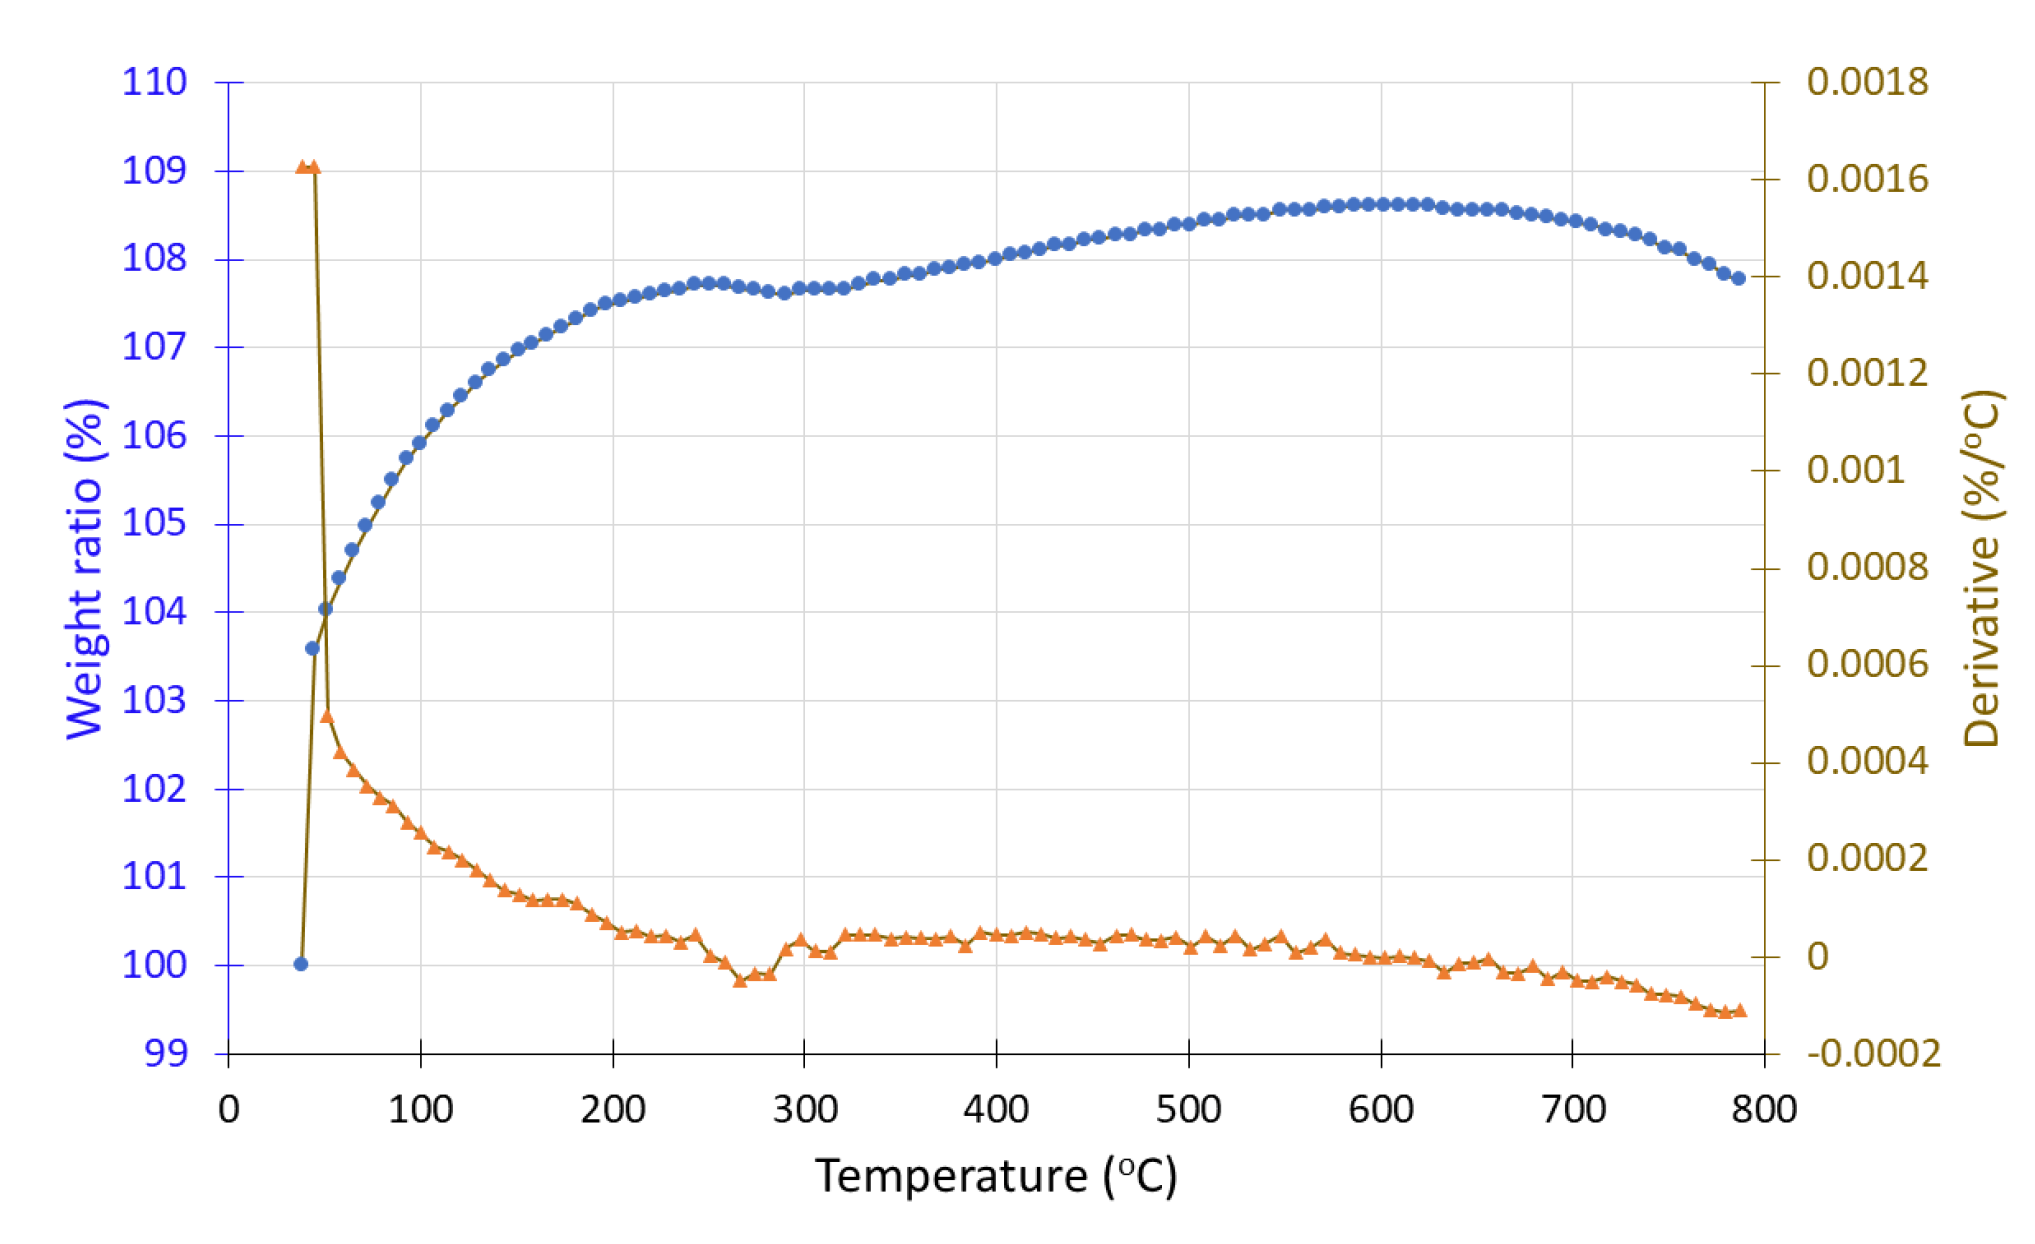
In contrast, sample #2′, after exposure to hydrogen, shows a gradual mass increase from 100% to 108% with rising temperature, a behavior that aligns with TGA data for MnO and Mn2O3 phases, which are known to undergo mass gain in inert environments due to their thermal oxidation characteristics [38].
Figure 21. Thermogravimetric analysis (TGA) curve of sample #2′ (electrochemical deposition) after H2 treatment showing the weight loss (•) and the derivative (▲) as a function of temperature under inert atmosphere.
Preprints 188583 g021

3.4. Electrochemical Response of CF-Electrodes Towards [Fe(CN)6]3-/4-

The electrochemical responses of bare CF and modified CF-based electrodes towards ferrocyanide/ferricyanide [Fe(CN)6]3-/4- standard redox system were studied by means of cyclic voltammetry method in aqueous KCl solution (1.0 mol∙L-1). The results obtained for all studied electrodes are presented in Table 9. Representative CVs are illustrated in 
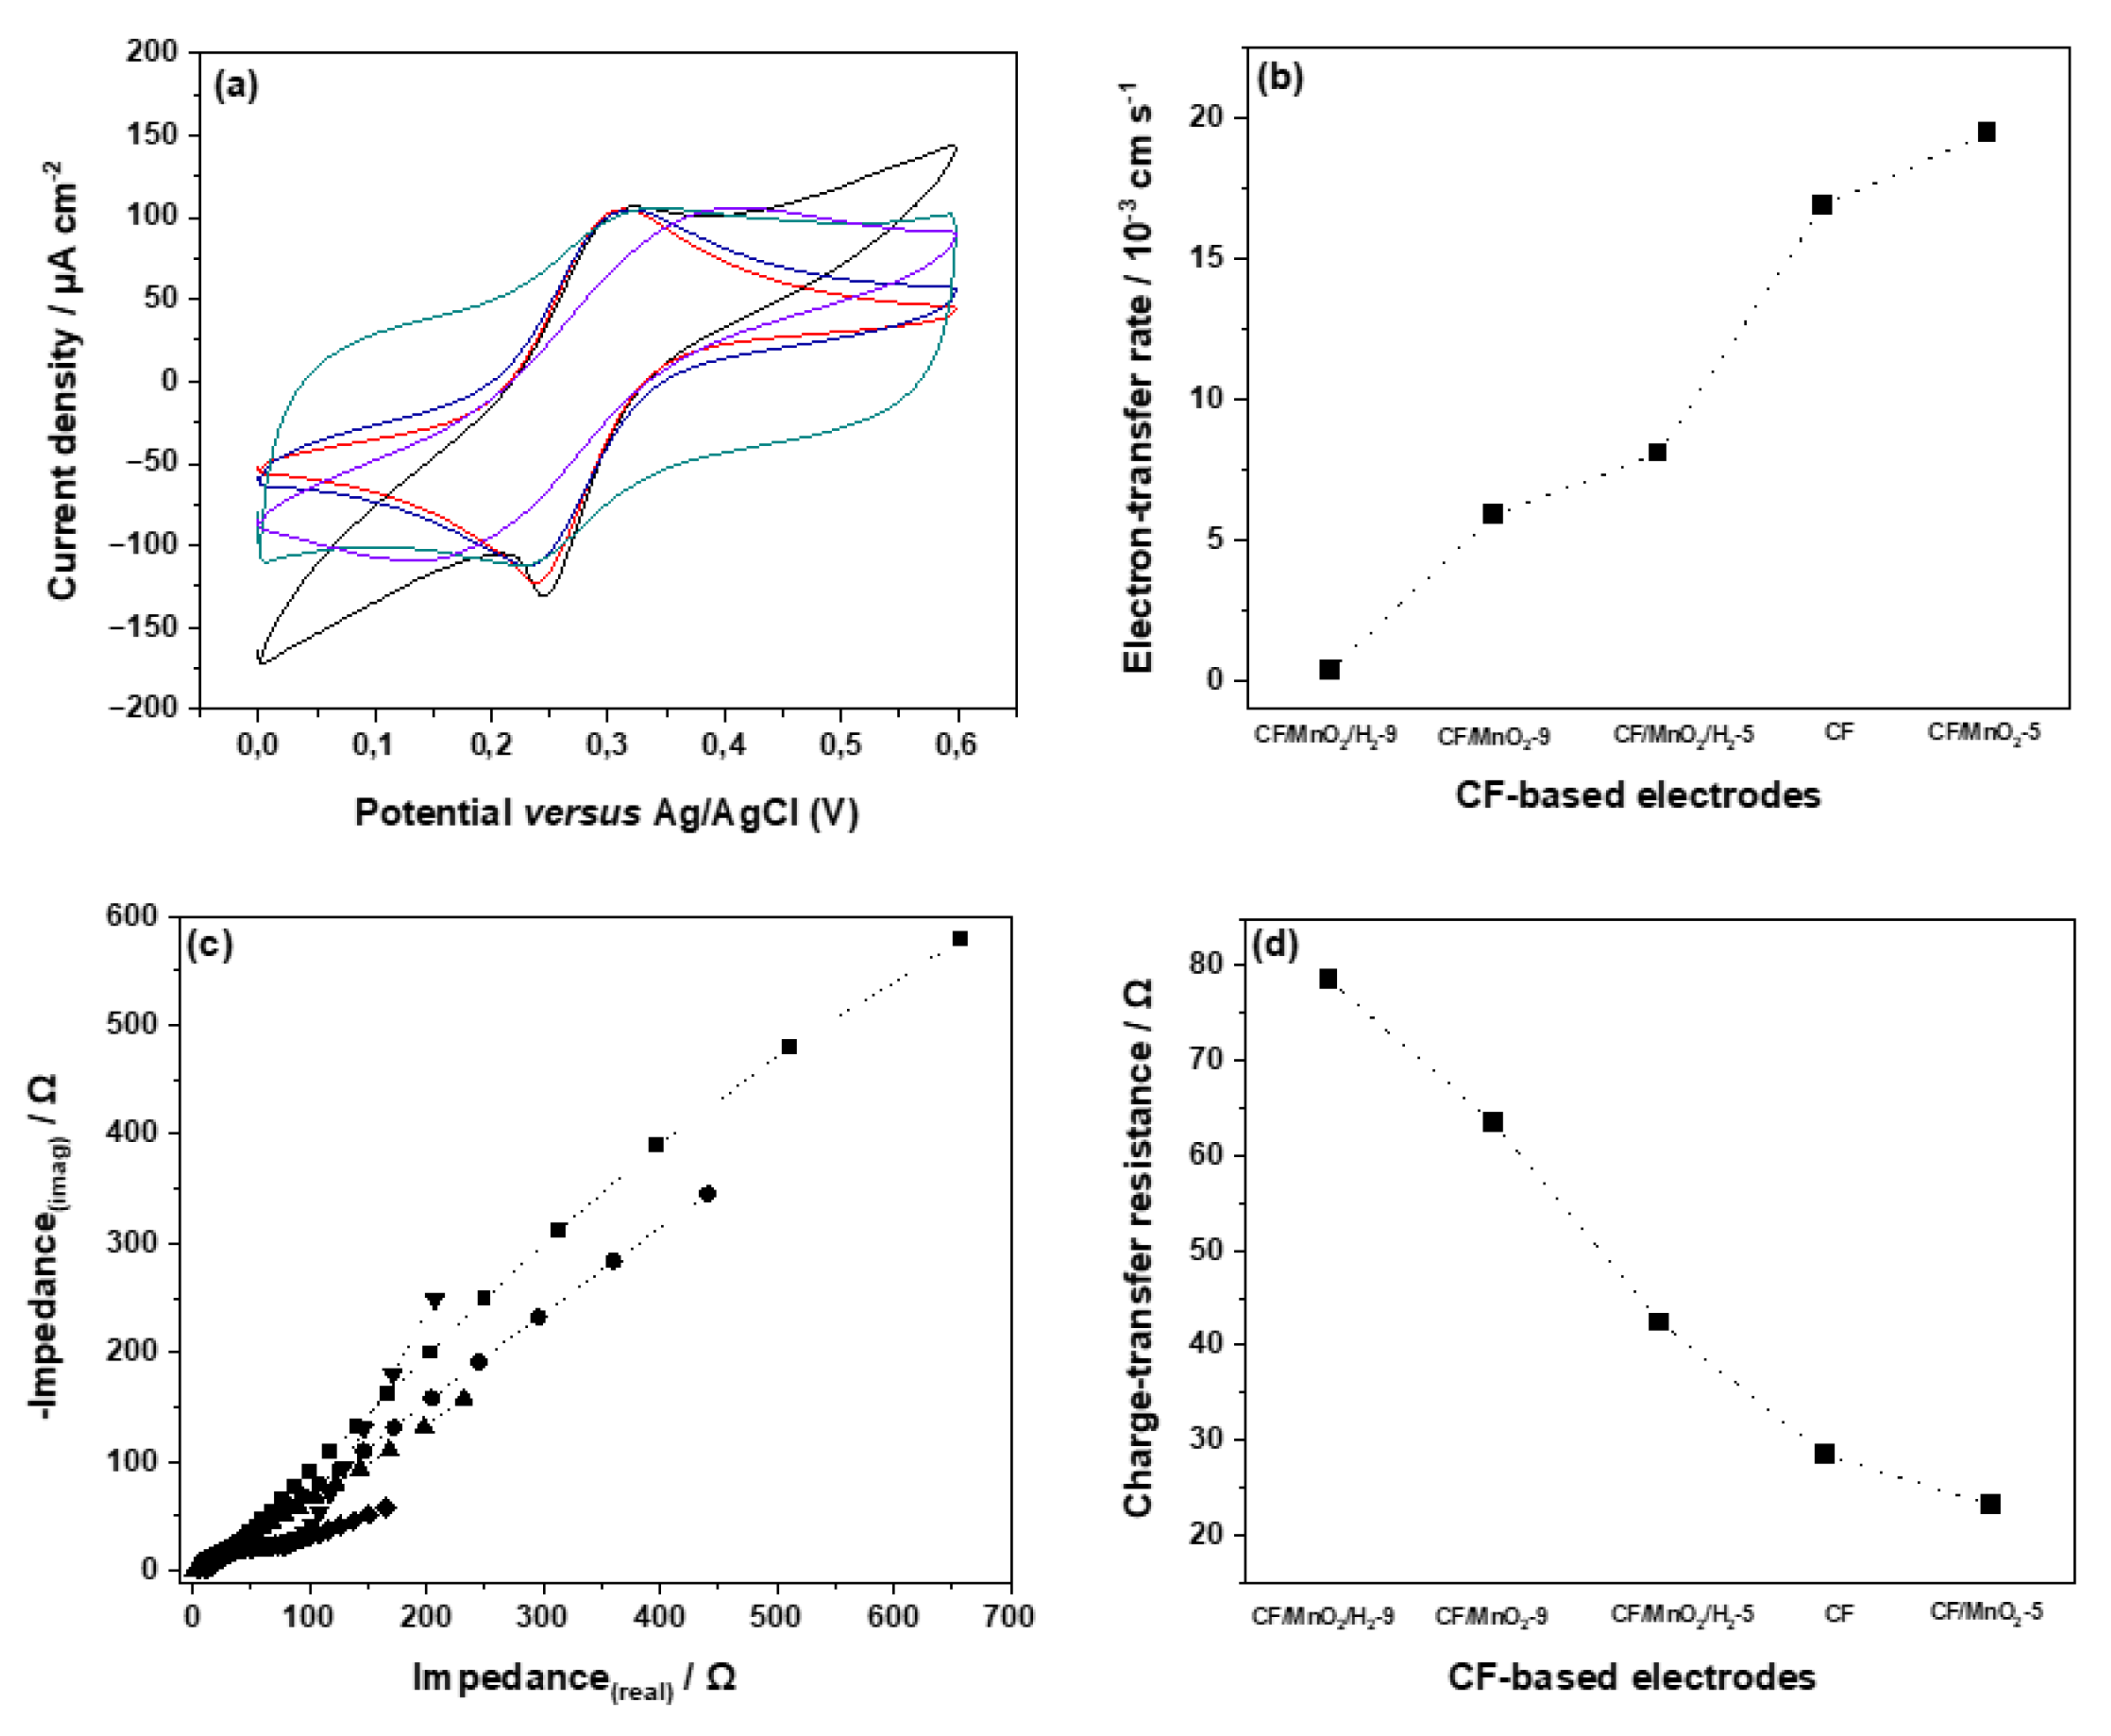
Figure 22a. In CV-curves depicted in Figure 22a, the redox system [Fe(CN)6]3-/4- exhibits a pair of reversible redox peaks on CF-based electrodes. The oxidation-reduction peak current ratio is equal to unity and independent of applied scan rate, indicating that there are no parallel chemical reactions coupled to the electrochemical process. Similarly, the oxidative and reductive peak currents are constant for numerous cycles, indicating that there are no chemical reactions coupled to the electron transfer process and confirming that the redox system is stable in time frame of the experiment and that the charge-transfer process occurring on CF-based electrodes is quite reversible. The half-wave potential estimated for [Fe(CN)6]3-/4- redox system on CF-based electrodes appears to be similar within experimental error (E1/2≈0,275 V vs. Ag/AgCl), something that is quite expectable for reversible redox systems. Furthermore, the anodic and cathodic peak currents were found to vary linearly with the square root of scan rate in the investigated range of 0,02-0,10 V·s-1, demonstrating that the studied redox system [Fe(CN)6]3-/4- is diffusion controlled on CF-based electrodes. From the extracted electrochemical parameters presented in Table 9 it can be clearly seen that the anodic and cathodic peak potential separation (ΔEp) estimated for [Fe(CN)6]3-/4- on bare CF and CF-based electrodes lies in the range from 0.068 to 0.236 V (at the scan rate of 0.02 V·s-1) demonstrating differences between charge-transfer kinetics of [Fe(CN)6]3-/4- on various CF-based composite films studied. Namely, the large peak separation of MnO2/CF #2 electrode (ΔEp=0.086 V) indicates poorer electron-transfer kinetics of [Fe(CN)6]3-/4- on this particular electrode compared to other electrodes studied. The electron-transfer kinetics of MnO2/CF #2 becomes even worse after the H2-treatment. Thus, on MnO2/CF/H2 #2 electrode fairly great value of peak potential separation has been estimated (ΔEp=0.236 V). The smallest peak potential separation has been obtained for MnO2/CF #1 electrode (ΔEp=0.068V), which is slightly smaller compared to that of bare CF electrode (ΔEp=0.070V), and tends to increase after H2-treatment. Consequently, on MnO2/CF/H2 #1 slightly greater peak potential separation value has been obtained (ΔEp=0.081 V) compared to untreated MnO2/CF #1 electrode. Consequently, the heterogeneous electron transfer rate constants (ks) determined for [Fe(CN)6]3-/4- on bare CF and CF-based electrodes by means of electrochemical absolute rate relation tends to increase with the following order: MnO2/CF/H2 #2 < MnO2/CF #2 < MnO2/CF/H2 #1 < CF < MnO2/CF #1 (Figure 22b). The EIS measurements were carried out on CF-based electrodes in presence of [Fe(CN)6]3-/4- redox system for the estimation of charge-transfer resistance (Rct) (Figure 22c). This parameter provides an estimation of the barrier to overall heterogeneous electron-transfer occurring at the electrode-electrolyte interface. The estimated Rct values are included in Table 9 along with the other electrochemical parameters of [Fe(CN)6]3-/4- on various CF-based electrodes. The Rct values obtained on various CF-based electrodes are presented graphically in Figure 22d. It is quite interesting that the charge-transfer resistance estimated by means of EIS tends to decrease with the order: MnO2/CF/H2 #2 < MnO2/CF #2 < MnO2/CF/H2 #1 < CF < MnO2/CF #1 (similarly to ks parameter), indicating that a diminishing of barrier of redox process with the simultaneous enhancement of electron-transfer kinetics takes place. For the estimation of lower limit of detection and sensitivity of CF and CF-based electrodes towards [Fe(CN)6]3-/4- the variation of oxidation peak current with the concentration of redox system in concentration range of 7.0×10⁻⁵-1.0×10⁻³ mol∙L-1 was examined. The electrochemical response of CF and CF-based electrodes towards [Fe(CN)6]3-/4- plotted as oxidation peak current density versus concentration of electroactive compound appears to be linear in investigated concentration range. From the standard deviation of electrochemical response and the slope of linear oxidation current-concentration plots, the lower limit of detections of bare CF and CF-based electrodes towards [Fe(CN)6]3-/4- were estimated and are included in Table 9. The results exhibit that the electrochemical quality of CF-based electrodes can be considered quite good.

4. Discussion

The comprehensive evaluation of the synthesized MnO2/CFs materials, conducted using various analytical techniques, confirmed the capability of these materials to store hydrogen on the fiber surface. During the experimental process, two distinct synthesis methods were employed: chemical deposition and electrochemical deposition. Both approaches yielded materials with the desired structural and chemical characteristics. However, the electrochemical method enabled more precise control over deposition parameters, leading to the formation of a denser and more uniform coating on the fiber surface, as evidenced by the SEM images of sample #2. Raman spectroscopy validated the surface modification of pure carbon fibers by the comparison of Id/Ig ratios which showcases the structural defects in the carbon framework. X-ray photoelectron spectroscopy (XPS) results prove that the product obtained electrochemically showcases partial reduction of Mn on the surface of the CFs when exposed to hydrogen gas and proves the formation of an MnOOH intermediate. The presence of the MnOOH intermediate can be validated by FTIR spectroscopy which showcases the presence of -OH groups in the prepared sample besides the Mn-O bonds The possible application of fabricated carbon fiber/MnO2 composites as materials in electrochemical sensors has been studied in presence of [Fe(CN)6]3-/4- in aqueous KCl solutions. The obtained results are rather promising and demonstrate the future potential application of carbon fiber/MnO2 composites as working electrodes in electroanalysis.
The investigation into the hydrogen storage capabilities of these materials requires further investigation as for the release mechanism of the bonded hydrogen, but suggests that the CFs/MnO2 composite represents a promising avenue for enhancing energy storage technologies. This approach aligns with the growing demand for sustainable energy solutions. Such composite materials hold potential for a variety of industrial applications. One proposed application involves incorporating the modified fibers into textile structures capable of surface hydrogen storage, suitable for use in portable electronic devices, hybrid storage systems, and fuel cells. Additionally, these materials could function as hydrogen sensors or serve as catalysts in hydrogen production and processing reactions. Another prospective application of MnO2/CFs lies in hydrogen storage tanks for fuel cell electric vehicles (FCEVs), either as a primary storage material or as a reinforcing component in advanced polymer composites.

5. Conclusions

The synthesis and characterization of carbon fiber/manganese dioxide (MnO2/CF) composites were successfully conducted using two distinct routes: in situ redox (chemical) deposition and electrochemical deposition. Based on the experimental analyses and results, the following conclusions were drawn:
1. Both synthesis methods yielded MnO2/CF composites with the desired structural and chemical features; however, the electrochemical deposition method produced a denser and more uniform MnO2 layer, resulting in significantly higher manganese loading (up to ~52 wt%) compared to the chemical method (~10 wt%). SEM and EDS analyses confirmed the successful deposition of MnO2 on the carbon fiber surface, which was further supported by the characteristic Mn–O vibrational bands observed in the Raman spectra.
2. XPS analysis revealed that Mn existed predominantly in the +4 oxidation state prior to hydrogen exposure and partially reduced to Mn3+ and Mn2+ upon exposure. MnO2 reduction was validated by the mass changes via TGA, in which the hydrogen-treated composites revealed different thermal behavior compared to untreated samples, consistent with oxide phase transitions.
3. The formation of an MnOOH intermediate reduction phase following hydrogen exposure can be indicated by the evident peaks at 641.4 eV (2p3/2) and 652.824 eV (2p1/2) of the XPS results. Complementary FTIR spectra identified –OH functional groups, as shown by distinct O–H bending vibrations.
4. Electrochemical characterization indicated that MnO2-modified CF electrodes exhibited good redox reversibility and enhanced charge-transfer kinetics. However, hydrogen exposure increased charge-transfer resistance slightly, likely due to surface modifications following hydrogen uptake.

Author Contributions

Conceptualization, L.P. and I.K.; methodology, L.P. and I.K.; validation, L.P. and I.K.; formal analysis, L.P.; investigation, L.P.; resources, L.P. and I.K.; writing—original draft preparation, L.P., N.G.T., M.Z., A.Z., E.V., D.G. and I.K.; writing—review and editing, L.P. and I.K.; visualization, I.K.; supervision, K.K. and I.K. All authors have read and agreed to the published version of the manuscript.

Funding

This research received no external funding.

Data Availability Statement

All data are presented in the manuscript.

Acknowledgments

The authors would like to thank Mrs. D. Schneider (TU Ilmenau) for electrochemistry experiments.

Conflicts of Interest

The authors declare that there are no conflicts of interest.

Abbreviations

The following abbreviations are used in this manuscript:
CF Carbon Fiber
CFAF Climate Change Action Fund
CFs/MnO2 Carbon Fiber/Manganese Dioxide Composite
CV Cyclic Voltammetry
DLD Delay Line Detector
EDS Energy Dispersive X-ray Spectroscopy
EIS Electrochemical Impedance Spectroscopy
FCEV Fuel Cell Electric Vehicle
FE-SEM Field Emission Scanning Electron Microscopy
FTIR Fourier Transform Infrared Spectroscopy
GC Gas Chromatograph
LOD Limit of Detection
MDPI Multidisciplinary Digital Publishing Institute
RAM (in context of “Lab RAM Aramis”) Raman Spectrometer brand
SEM Scanning Electron Microscopy
TGA Thermogravimetric Analysis
XPS X-ray Photoelectron Spectroscopy

Appendix A

This brief appendix discusses the quantification of XPS results, in order to approximately calculate the content of manganese oxides deposited onto the surface. To calculate the manganese content, the percentage of the Mn signal corresponding to MnO2 (as identified from the Mn 2p spectrum) is multiplied by the atomic percentage of Mn in the sample, as provided in the quantitative reference table (Table 7 and Table 8).
For the calculation of oxygen attributed to MnO2, the percentage of the O signal corresponding to the Mn–O bond (based on the O 1s spectrum) is multiplied by the percentage of the Mn signal associated with MnO2, and then by the atomic percentage of oxygen in the sample from the quantitative reference table.
Similarly, to calculate the oxygen content in MnO, the percentage of the O signal corresponding to the Mn–O bond is multiplied by the percentage of the Mn signal attributed to MnO, and then by the atomic percentage of oxygen in the sample.
The sum of the calculated Mn and O percentages represents the overall surface content of the compound (either MnO2 or MnO) on the material.
In this way, the surface percentages of MnO2 and MnO for sample #2 can be estimated both before and after hydrogen exposure. As previously mentioned, comparing MnO2 concentrations between different samples does not yield reliable conclusions. However, comparing the concentrations of MnO2 and MnO within the same sample can demonstrate the partial reduction of MnO2 on the material’s surface.
Table A1. Quantification Report of XPS for sample #2.
Peak Type Position FWHM Raw Area RSF Atomic Atomic Mass
BE (eV) (eV) (cps) (eV) Mass Conc % Conc %
C 1s Reg 284,700 2.681 15571.8 0.278 12.011 63.20 45.93
O 1s Reg 529,600 1.214 20220.0 0.780 15.999 27.17 26.30
Mn 2p Reg 642,000 3.023 20411.9 2.659 54.938 7.73 25.70
N 1s Reg 400,450 1.155 576.8 0.477 14.007 1.33 1.13
S 2p Reg 167,600 0.181 174.7 0.668 32.065 0.30 0.59
Na 1s Reg 1,070,850 0.289 526.8 1.685 22.990 0.26 0.36
Table A2. Quantification Report of XPS for sample #2′.
Peak Type Position FWHM Raw Area RSF Atomic Atomic Mass
BE (eV) (eV) (cps) (eV) Mass Conc % Conc %
C 1s Reg 284,600 1.214 10090.9 0.278 12.011 39.07 20.78
O 1s Reg 529,800 1.128 29392.6 0.780 15.999 37.67 26.69
Mn 2p Reg 641,800 3.012 56554.1 2.659 54.938 20.44 49.72
N 1s Reg 400,250 1.248 410.9 0.477 14.007 0.90 0.56
S 2p Reg 168,000 0.429 208.3 0.668 32.065 0.34 0.49
Na 1s Reg 1,071,400 1.460 2792.5 1.685 22.990 1.30 1.32
Cl 2p Reg 198,150 0.779 229.9 0.891 35.460 0.28 0.44
Table A3. Results of #2.
#2 %of MnO2 % O of MnO2 % atomic mass Mn % atomic mass O % of Mn of MnO2 %of O of MnO2 Total mass percentage of MnO2
0.960 0.324 7.730 27.170 7.42 8.82 16.24
% of MnO %O of MnO % atomic mass Mn % atomic mass O % of Mn of MnO %of O of MnO Total mass percentage of MnO
0.04 0.01352 7.73 27.17 0.31 0.37 0.68
Table A4. Results of #2′.
#2′ %of MnO2 % O of MnO2 % atomic mass Mn % atomic mass O % of Mn of MnO2 %of O of MnO2 Total mass percentage of MnO2
0.560 0.388 20.440 37.670 11.45 14.60 26.04
% of MnO %O of MnO % atomic mass Mn % atomic mass O % of Mn of MnO %of O of MnO Total mass percentage of MnO
0.079 0.055 20.440 37.670 1.61 2.07 3.68

References

  1. Bayramova, Z.; Ibadoghlu, G. Challenges and Opportunities Created by COP29 for Azerbaijan. 2024. [Google Scholar] [CrossRef]
  2. Nyangon, J.; Darekar, A. Advancements in Hydrogen Energy Systems: A Review of Levelized Costs, Financial Incentives and Technological Innovations. Innov. Green Dev. 2024, 3, 100149. [Google Scholar] [CrossRef]
  3. Roque, B.A.C.; Cavalcanti, M.H.C.; Brasileiro, P.P.F.; Gama, P.H.R.P.; dos Santos, V.A.; Converti, A.; Benachour, M.; Sarubbo, L.A. Hydrogen-Powered Future: Catalyzing Energy Transition, Industry Decarbonization and Sustainable Economic Development: A Review. Gondwana Res. 2025, 140, 159–180. [Google Scholar] [CrossRef]
  4. Agarwal, R. Transition to a Hydrogen-Based Economy: Possibilities and Challenges. Sustainability 2022, 14, 15975. [Google Scholar] [CrossRef]
  5. Pyle, D.S.; Gray, E.MacA.; Webb, C.J. Hydrogen Storage in Carbon Nanostructures via Spillover. Int J Hydrog. Energy 2016, 41, 19098–19113. [Google Scholar] [CrossRef]
  6. Ballantine, D.S.; Martin, S.J.; Ricco, A.J.; Frye, G.C.; Wohltjen, H.; White, R.M.; Zellers, E.T. Materials Characterization. In Acoustic Wave Sensors; Elsevier, 1997; pp. 150–221. [Google Scholar]
  7. Hossain Bhuiyan, M.M.; Siddique, Z. Hydrogen as an Alternative Fuel: A Comprehensive Review of Challenges and Opportunities in Production, Storage, and Transportation. Int J Hydrog. Energy 2025, 102, 1026–1044. [Google Scholar] [CrossRef]
  8. Rather, S. ullah Hydrogen Uptake of Manganese Oxide-Multiwalled Carbon Nanotube Composites. Int J Hydrog. Energy 2019, 44, 325–331. [Google Scholar] [CrossRef]
  9. Shah, S.S.; Aziz, Md.A.; Mohamedkhair, A.K.; Qasem, M.A.A.; Hakeem, A.S.; Nazal, M.K.; Yamani, Z.H. Preparation and Characterization of Manganese Oxide Nanoparticles-Coated Albizia Procera Derived Carbon for Electrochemical Water Oxidation. J. Mater. Sci. Mater. Electron. 2019, 30, 16087–16098. [Google Scholar] [CrossRef]
  10. Chi, H.Z.; Yin, S.; Cen, D.; Chen, K.; Hu, Y.; Qin, H.; Zhu, H. The Capacitive Behaviours of MnO2/Carbon Fiber Composite Electrode Prepared in the Presence of Sodium Tetraborate. J Alloys Compd 2016, 678, 42–50. [Google Scholar] [CrossRef]
  11. Rafique, A.; Massa, A.; Fontana, M.; Bianco, S.; Chiodoni, A.; Pirri, C.F.; Hernández, S.; Lamberti, A. Highly Uniform Anodically Deposited Film of MnO 2 Nanoflakes on Carbon Fibers for Flexible and Wearable Fiber-Shaped Supercapacitors. ACS Appl Mater Interfaces 2017, 9, 28386–28393. [Google Scholar] [CrossRef]
  12. Zhang, Y.; Luo, S.; Yang, G.; Yu, L.; Ye, S.; Jiang, C.; Wu, Y. Electrodeposited ε-MnO2 on Carbon Fibers as an Ideal Cathode Material for Aqueous Zinc-Ion Batteries. Mater Lett 2024, 361, 135993. [Google Scholar] [CrossRef]
  13. Wu, L.-K.; Xia, J.; Hou, G.-Y.; Cao, H.-Z.; Tang, Y.-P.; Zheng, G.-Q. Potentiodynamical Deposition of Nanostructured MnO2 Film at the Assist of Electrodeposited SiO2 as Template. Electrochim Acta 2016, 191, 375–384. [Google Scholar] [CrossRef]
  14. Wang, J.-G.; Yang, Y.; Huang, Z.-H.; Kang, F. Synthesis and Electrochemical Performance of MnO2/CNTs–Embedded Carbon Nanofibers Nanocomposites for Supercapacitors. Electrochim Acta 2012, 75, 213–219. [Google Scholar] [CrossRef]
  15. Liu, H.; Wang, C.; Kong, F.; Lu, C.; Tao, S.; Qian, B. Multiwalled Carbon Nanotubes Decorated Ɛ-MnO2 Nanoflowers Cathode with Oxygen Defect for Aqueous Zinc-Ion Batteries. J. Electroanal. Chem. 2024, 973, 118701. [Google Scholar] [CrossRef]
  16. Wang, L.; Li, J.; Gan, G.; Fan, S.; Chen, X.; Liang, F.; Wei, L.; Zhang, Z.; Hao, Z.; Li, X. Activated Carbon Fibers Prepared by One-Step Activation with CuCl 2 for Highly Efficient Gas Adsorption. Ind Eng Chem Res 2020, 59, 19793–19802. [Google Scholar] [CrossRef]
  17. Lee, S.-W.; Bak, S.-M.; Lee, C.-W.; Jaye, C.; Fischer, D.A.; Kim, B.-K.; Yang, X.-Q.; Nam, K.-W.; Kim, K.-B. Structural Changes in Reduced Graphene Oxide upon MnO 2 Deposition by the Redox Reaction between Carbon and Permanganate Ions. J. Phys. Chem. C 2014, 118, 2834–2843. [Google Scholar] [CrossRef]
  18. Wang, J.-G.; Yang, Y.; Huang, Z.-H.; Kang, F. Synthesis and Electrochemical Performance of MnO2/CNTs–Embedded Carbon Nanofibers Nanocomposites for Supercapacitors. Electrochim Acta 2012, 75, 213–219. [Google Scholar] [CrossRef]
  19. Baran, P.; Buczek, B.; Zarębska, K. Modified Activated Carbon as an Effective Hydrogen Adsorbent. Energ. (Basel) 2022, 15, 6122. [Google Scholar] [CrossRef]
  20. Sebastián, P.; Climent, V.; Feliu, J.M.; Gómez, E. Ionic Liquids in the Field of Metal Electrodeposition. In Encyclopedia of Interfacial Chemistry; Elsevier, 2018; pp. 690–700. [Google Scholar]
  21. Zhang, Y.; Luo, S.; Yang, G.; Yu, L.; Ye, S.; Jiang, C.; Wu, Y. Electrodeposited ε-MnO2 on Carbon Fibers as an Ideal Cathode Material for Aqueous Zinc-Ion Batteries. Mater Lett 2024, 361, 135993. [Google Scholar] [CrossRef]
  22. Lee, S.W.; Kim, J.; Chen, S.; Hammond, P.T.; Shao-Horn, Y. Carbon Nanotube/Manganese Oxide Ultrathin Film Electrodes for Electrochemical Capacitors. ACS Nano 2010, 4, 3889–3896. [Google Scholar] [CrossRef] [PubMed]
  23. Kainourgios, P.; Kartsonakis, I.A.; Charitidis, C.A. Synthesis and Characterization of SiO2@CNTs Microparticles: Evaluation of Microwave-Induced Heat Production. Fibers 2021, 9, 81. [Google Scholar] [CrossRef]
  24. Rafique, A.; Massa, A.; Fontana, M.; Bianco, S.; Chiodoni, A.; Pirri, C.F.; Hernández, S.; Lamberti, A. Highly Uniform Anodically Deposited Film of MnO 2 Nanoflakes on Carbon Fibers for Flexible and Wearable Fiber-Shaped Supercapacitors. ACS Appl Mater Interfaces 2017, 9, 28386–28393. [Google Scholar] [CrossRef] [PubMed]
  25. Post, J.E.; McKeown, D.A.; Heaney, P.J. Raman Spectroscopy Study of Manganese Oxides: Tunnel Structures. Am. Mineral. 2020, 105, 1175–1190. [Google Scholar] [CrossRef]
  26. Bernardini, S.; Ventura, G.D.; Mihailova, B.; Sodo, A. The Stability of Manganese Oxides Under Laser Irradiation During Raman Analyses: I. Compact Versus Channel Structures. J. Raman Spectrosc. 2025, 56, 95–112. [Google Scholar] [CrossRef]
  27. Yuan, A.; Wang, X.; Wang, Y.; Hu, J. Textural and Capacitive Characteristics of MnO2 Nanocrystals Derived from a Novel Solid-Reaction Route. Electrochim Acta 2009, 54, 1021–1026. [Google Scholar] [CrossRef]
  28. Hesse, M.; Meier, H.; Zeeh, B. George Socrates “Infrared and Raman Characterisitc Group Frequencies”; John Wiley & Sons, 2004. [Google Scholar]
  29. Golden, D.C.; Chen, C.C.; Dixon, J.B. Transformation of Birnessite to Buserite, Todorokite, and Manganite under Mild Hydrothermal Treatment. Clays Clay Min. 1987, 35, 271–280. [Google Scholar] [CrossRef]
  30. Xi, S.; Zhu, Y.; Yang, Y.; Liu, Y. Direct Synthesis of MnO 2 Nanorods on Carbon Cloth as Flexible Supercapacitor Electrode. J Nanomater 2017, 2017, 1–8. [Google Scholar] [CrossRef]
  31. Rafique, A.; Massa, A.; Fontana, M.; Bianco, S.; Chiodoni, A.; Pirri, C.F.; Hernández, S.; Lamberti, A. Highly Uniform Anodically Deposited Film of MnO 2 Nanoflakes on Carbon Fibers for Flexible and Wearable Fiber-Shaped Supercapacitors. ACS Appl Mater Interfaces 2017, 9, 28386–28393. [Google Scholar] [CrossRef] [PubMed]
  32. Chi, H.Z.; Yin, S.; Cen, D.; Chen, K.; Hu, Y.; Qin, H.; Zhu, H. The Capacitive Behaviours of MnO2/Carbon Fiber Composite Electrode Prepared in the Presence of Sodium Tetraborate. J Alloys Compd 2016, 678, 42–50. [Google Scholar] [CrossRef]
  33. Chi, H.Z.; Yin, S.; Cen, D.; Chen, K.; Hu, Y.; Qin, H.; Zhu, H. The Capacitive Behaviours of MnO2/Carbon Fiber Composite Electrode Prepared in the Presence of Sodium Tetraborate. J Alloys Compd 2016, 678, 42–50. [Google Scholar] [CrossRef]
  34. Rafique, A.; Massa, A.; Fontana, M.; Bianco, S.; Chiodoni, A.; Pirri, C.F.; Hernández, S.; Lamberti, A. Highly Uniform Anodically Deposited Film of MnO 2 Nanoflakes on Carbon Fibers for Flexible and Wearable Fiber-Shaped Supercapacitors. ACS Appl Mater Interfaces 2017, 9, 28386–28393. [Google Scholar] [CrossRef]
  35. De Blasio, C. Thermogravimetric Analysis (TGA). In Fundamentals of Biofuels Engineering and Technology; 2019; pp. 91–102. [Google Scholar]
  36. McKenzie, F.; Kandola, B.K.; Horrocks, A.R.; Erskine, E. Carbon Fibres: Effect of Various Thermo-Oxidative Environments on Structural and Performance Damage, Both Alone and in Composites. Carbon N Y 2024, 230, 119616. [Google Scholar] [CrossRef]
  37. Kelzenberg, S.; Eisenreich, N.; Knapp, S.; Koleczko, A.; Schuppler, H.; Fietzek, H. Chemical Kinetics of the Oxidation of Manganese and of the Decomposition of MnO 2 by XRD and TG Measurements. Propellants Explos. Pyrotech. 2019, 44, 714–724. [Google Scholar] [CrossRef]
  38. González, C.; Gutiérrez, J.I.; González-Velasco, J.R.; Cid, A.; Arranz, A.; Arranz, J.F. Transformations of Manganese Oxides under Different Thermal Conditions. J. Therm. Anal. 1996, 47, 93–102. [Google Scholar] [CrossRef]
Figure 1. In situ redox deposition scheme.
Preprints 188583 g001
Figure 2. Electrochemical deposition scheme.
Preprints 188583 g002
Figure 3. SEM image for sample #1 (in situ redox deposition synthesis of MnO2-CFs (24h): i) magnification x500, (ii) magnification x3,000, (iii) magnification x15,000.
Preprints 188583 g003
Figure 4. SEM spectroscopy for plain CFs: (i) magnification x500, (ii) magnification x2,000, (iii) magnification x5,000.
Preprints 188583 g004
Figure 5. EDS results for sample #1 (in situ redox deposition synthesis of MnO2-CFs for 24h).
Preprints 188583 g005
Figure 6. SEM image of sample #2 (electrochemical deposition at T=28 °C for 20 min): (i) magnification x500, (ii) magnification x3,000, (iii) magnification x3,700.
Preprints 188583 g006
Figure 7. EDS results of sample #2 (electrochemical deposition at T=28 °C for 20 minutes).
Preprints 188583 g007
Figure 8. Raman spectrum of CFs after activation and exposure to H2 treatment.
Preprints 188583 g008
Figure 9. Raman spectrum of sample #2 MnO2/CFs after exposure to H2 treatment.
Preprints 188583 g009
Figure 10. Raman spectrum of sample #1 MnO2/CFs prior exposure to H2 treatment.
Preprints 188583 g010
Figure 11. Raman spectrum of sample #1′ MnO2/CFs after exposure to H2 treatment.
Preprints 188583 g011
Figure 12. FTIR spectrum of sample #2′ after electrochemical deposition (20 min, 28 °C) and subsequent exposure to H2 treatment.
Preprints 188583 g012
Figure 18. TGA curve of sample #2 (electrochemical deposition) prior H2 treatment showing the weight loss (•) and the derivative (▲) as a function of temperature under oxidizing atmosphere.
Preprints 188583 g018
Figure 19. Thermogravimetric analysis (TGA) curve of sample #2′ (electrochemical deposition) after H2 treatment showing the weight loss (•) and the derivative (▲) as a function of temperature under oxidizing atmosphere.
Preprints 188583 g019
Figure 20. Thermogravimetric analysis (TGA) curve of sample #2 (electrochemical deposition) before H2 treatment showing the weight loss (•) and the derivative (▲) as a function of temperature under inert atmosphere.
Preprints 188583 g020
Figure 22. (a) CVs recorded for [Fe(CN)6]3-/4- (1.0 mol∙L-1 KCl) on CF (black line), MnO2/CF #1 (red line), MnO2/CF/H2 #1 (blue line), MnO2/CF #2 (green line), and MnO2/CF/H2 #2 (violet line) at 0.02 V∙s-1; (b) Electron-transfer rate constants estimated for [Fe(CN)6]3-/4- on CF-based electrodes; (c) EIS recorded for [Fe(CN)6]3-/4- (1.0 mol∙L-1 KCl) on CF (■), MnO2/CF #1 (●), MnO2/CF/H2 #1 (▲), MnO2/CF #2 (▼), and MnO2/CF/H2 #2 (♦) at +0.275 V (vs. Ag/AgCl) in frequency range of 0.1 Hz-100 kHz; (d) Charge-transfer resistances obtained for CF-based electrodes in presence of [Fe(CN)6]3-/4.
Preprints 188583 g022
Table 1. Tabulated conditions applied during in situ redox deposition synthesis.
Repetition Reaction time
a 30 min
b 2 h
c 6 h
d 24 h
Table 2. Tabulated conditions applied during electrochemical deposition synthesis.
Repetition Time (min) Temperature (oC) Applied Current (mA∙cm-2)
a 10 52 20
b 20 28 20
c 20 32 20
Table 3. Tabulated parameters of EDS quantification of the samples prepared via redox deposition.
Repetition Time Mn wt%
a 30 min -
b 2h 6.83
c 6h 2.52
d 24h 10.06
Table 4. Tabulated parameters of EDS quantification of the samples prepared via electrodeposition.
Repetition Time (min) Temperature (℃) Mn wt%
a 10 52 50.74
b 20 28 52.31
c 20 32 9.92
Table 5. Quantitative Analysis of Raman Spectra for CFs.
Curve Name Centre Width Height % Gaussian Type Area
Curve 1 311.866 259.422 101.985 8.08114 Mixed 40476.3
Curve 2 1004.12 0.412132 114.812 98.4956 Mixed 50.7287
Curve 3 1376.74 254.109 925.762 35.4027 Mixed 327352
Curve 4 1592.52 108.661 925.129 54.0504 Mixed 130393
Curve 5 2824.33 687.653 224.028 0 Mixed 241986
Table 6. Quantitative Analysis of Raman Spectra for MnO2/CFs sample #2.
Curve Name Centre Width Height % Gaussian Type Area
Curve 1 292.396 171.254 47.7561 83.8865 Mixed 9372.93
Curve 2 653.93 805.039 133.579 0 Mixed 16891.7
Curve 3 1379.26 248.724 630.836 56.0832 Mixed 201916
Curve 4 1592.34 106.583 662.124 72.8011 Mixed 84839.6
Curve 5 2797.97 681.391 184.505 0.470548 Mixed 1971.81
Table 7. Quantitative Analysis of Raman Spectra for MnO2/CFs sample #1 prior H2 treatment.
Curve Name Centre Width Height % Gaussian Type Area
Curve 1 353.026 0.579297 1016.37 67.3455 Mixed 724.089
Curve 2 562.878 28.9571 454.076 0.053997 Mixed 20650.4
Curve 3 626.482 121.264 461.668 0 Mixed 87983.7
Curve 4 971.854 69.172 65.5054 100 Mixed 4823.25
Curve 5 1385.85 240.686 550.434 67.3555 Mixed 162914
Curve 6 1588.74 100.056 578.524 76.5204 Mixed 68497.9
Curve 7 2706.68 3367.9 77.7396 0 Mixed 409360
Curve 8 2795.67 698.055 187.369 20.9356 Mixed 191797
Table 8. Quantitative Analysis of Raman Spectra for MnO2/CFs sample #1′ after H2 treatment.
Curve Name Centre Width Height % Gaussian Type Area
Curve 1 496.109 56.2559 265.365 14.3389 Mixed 22365.6
Curve 2 566.259 30.9976 463.747 65.3422 Mixed 17824.4
Curve 3 628.829 143.589 713.29 43.2667 Mixed 138445
Curve 4 1370.96 283.65 731.011 56.8463 Mixed 266025
Curve 5 1395.16 105.327 736.084 68.8728 Mixed 94747.2
Curve 6 2853.22 560.411 142.12 36.191 Mixed 110512
Curve 7 3283.12 220.931 25.8541 100 Mixed 6080.19
Table 9. Anodic peak potential (Epox), cathodic peak potential (Epred), half-wave potential (E1/2), anodic and cathodic peak potential separation (ΔEp), anodic and cathodic peak current ratios (ipox/ipred), anodic peak current density (ipox), active surface area (A), heterogeneous electron transfer rate constant (ks), charge-transfer resistance (Rct), and lower limit of detection (LOD) determined for standard redox system [Fe(CN)6]3-/4- (1.0 mol∙L-1 KCl) on bare CF, MnO2/CF #1, MnO2/CF/H2 #1, MnO2/CF #2, and MnO2/CF/H2 #2 electrodes at the scan rate of 0.02 V∙s-1.
Parameters CF-based Electrodes
CF MnO2/CF #1 MnO2/CF/H2 #1 MnO2/CF #2 MnO2/CF/H2 #2
Epox/V 0.314 0.307 0.315 0.320 0.393
Epred/V 0.244 0.239 0.234 0.234 0.157
E1/2/V(a) 0.279 0.273 0.274 0.277 0.275
ΔEp/V(b)(c) 0.070 0.068 0.081 0.086 0.236
ipox/ipred 0.90 0.90 0.93 0.93 0.94
A/cm2 0.55 0.81 1.74 1.56 4.64
ipox/μA·cm-2(c) 105 107 105 105 105
ks/10-3 cm·s-1(d) 16.9 19.5 8.1 5.9 0.34
Rct(e) 28.4 23.2 42.4 63.4 78.5
LOD/μM(f) 3.0 1.0 5.0 3.0 8.0
(a)The E1/2 values were determined as the average values of Epox and Epred; (b)The ΔEp values were estimated as ΔEp=Epox-Epred; (c)The values were determined at the concentration of 1,0×10⁻³ mol∙L-1 and the scan rate of 0,02 V∙s-1; (d)The ks values were determined from electrochemical absolute rate relation: ψ=(Do/DR)a/2ks(nπFvDo/RT)-1/2, where ψ is kinetic parameter, a the charge transfer coefficient (a≈0.5), Do, DR the diffusion coefficients of oxidized and reduced species, respectively (DoDR), and n the number of electrons involved in the redox reaction (n=1); (e)The EIS were analyzed by means of equivalent electrical circuit (Rs+(Cdl/(Rct+Zw))) (software Thales, version 4.15); (f)The LOD values were estimated by means of linear regression model.
Disclaimer/Publisher’s Note: The statements, opinions and data contained in all publications are solely those of the individual author(s) and contributor(s) and not of MDPI and/or the editor(s). MDPI and/or the editor(s) disclaim responsibility for any injury to people or property resulting from any ideas, methods, instructions or products referred to in the content.
Copyright: This open access article is published under a Creative Commons CC BY 4.0 license, which permit the free download, distribution, and reuse, provided that the author and preprint are cited in any reuse.
Prerpints.org logo

Preprints.org is a free preprint server supported by MDPI in Basel, Switzerland.

Subscribe

Disclaimer

Terms of Use

Privacy Policy

Privacy Settings

© 2025 MDPI (Basel, Switzerland) unless otherwise stated