
Submitted:
07 December 2025
Posted:
09 December 2025
You are already at the latest version
Abstract
Sabalan Dam Lake, located at ~4,800 m above sea level in northwestern Iran, serves as a strategic freshwater source for Ardabil Province. Despite its high-altitude and volcanic setting, recent evidence suggests emerging water quality degradation due to a combination of geogenic and anthropogenic stressors. This study presents the first integrated assessment of pollution status, sources, and spatial distribution in the lake and its inflowing rivers during the spring season. Water samples from nine representative stations were analyzed for physicochemical, microbiological, and heavy metal parameters (Pb, Cd, Zn, Cu), and results were evaluated against WHO, EPA, and Iranian national standards. GIS-based spatial interpolation was employed to identify pollution hotspots and link them to potential sources. Findings revealed that while most physicochemical parameters remained within permissible limits, lead (28.85–62.72 µg/L) and cadmium (11–23.94 µg/L) concentrations exceeded WHO and EPA thresholds by 2–8 times across all stations attributed to natural leaching from Sabalan’s andesitic-basaltic formations and anthropogenic inputs from upstream rural settlements. Microbiological contamination was widespread, with total coliforms (260–1,100 MPN/100mL) and fecal coliforms (0–1,150 MPN/100mL) indicating significant fecal intrusion, particularly near villages and livestock areas. The lake has shifted from an oligotrophic to a mesotrophic state (mean TP ≈ 20 µg/L), signaling early eutrophication. Spatial analysis identified three critical hotspots (Stations 2, 6, and 8) where geogenic metal release and rural pollution converge. These results challenge the assumption that high-altitude lakes are inherently pristine and underscore the dual vulnerability of volcanic reservoirs to natural and human-induced pressures. We recommend a dual-track management strategy: (1) geochemical mitigation (e.g., lime softening to reduce metal bioavailability) and (2) source control (e.g., decentralized wastewater systems, livestock exclusion zones). This study provides a replicable framework for assessing data-scarce, high-elevation reservoirs in arid and semi-arid regions globally.
Keywords:
water quality
; Sabalan Dam Lake
; heavy metals
; nutrient pollution
; microbial contamination
; GIS based assessment
; Iran
1. Introduction
Freshwater reservoirs are critical to water security in arid and semi arid regions, yet their ecological integrity is increasingly compromised by complex interactions between natural processes and anthropogenic activities. While lowland reservoirs often face well documented pressures from industrial discharge and urban wastewater, high altitude lakes particularly those in volcanic terrains remain understudied despite their vulnerability to diffuse pollution sources and geogenic contamination (Wang et al., 2023; Gao et al., 2023).
Sabalan Dam Lake, situated at approximately 4,800 m above sea level in northwestern Iran, exemplifies this knowledge gap. Fed by snowmelt and seasonal runoff from the Sabalan volcanic complex comprising andesitic and basaltic formations naturally enriched in trace metals such as lead (Pb) and cadmium (Cd) the lake serves as a primary water source for Ardabil Province. Surrounding land use is dominated by rural settlements, livestock grazing, and limited agriculture, with no centralized wastewater treatment infrastructure. Preliminary observations indicate emerging water quality issues, including summer algal blooms and microbial contamination, raising concerns about the lake’s suitability for drinking and irrigation.
Heavy metals, nutrients (e.g., nitrate, phosphate), and fecal indicators are among the most critical parameters for assessing reservoir safety due to their persistence, bioaccumulation potential, and direct health implications (WHO, 2022; EPA, 2023). In Iran, existing water quality studies have predominantly focused on large, low elevation reservoirs (e.g., Karaj, Dez), leaving high altitude systems like Sabalan largely excluded from national monitoring frameworks (Kazemnejad et al., 2010; Dehqani et al., 2021). Moreover, the integration of spatial analytical tools such as Geographic Information Systems (GIS) to map contamination gradients and identify pollution hotspots remains rare in Iranian environmental research, despite proven utility in global contexts (Isiuku & Enyoh, 2020).
To address these gaps, this study presents a comprehensive spring season assessment of water quality in Sabalan Dam Lake and its inflowing rivers. We analyzed physicochemical, microbiological, and heavy metal parameters (Pb, Cd, Zn, Cu, NO₃⁻, PO₄³⁻, total/fecal coliforms, heterotrophic plate count) across nine strategic sampling stations. Results were evaluated against WHO, U.S. EPA, and Iranian national standards (No. 2945), and GIS based spatial interpolation was employed to visualize contamination patterns and link them to potential sources geogenic, agricultural, and anthropogenic.
This research not only provides the first integrated water quality baseline for Sabalan Dam Lake but also offers a replicable methodological framework for assessing vulnerable alpine reservoirs in data scarce regions of arid and semi arid zones worldwide..
2. Literature Review
Water pollution in reservoirs—especially in arid and semi arid regions—has become a critical environmental and public health concern due to the confluence of anthropogenic pressures and natural geochemical processes (Wang et al., 2023). While extensive research has addressed contamination in lowland and industrialized basins, high altitude reservoirs, particularly those in volcanic settings, remain underrepresented in both global and national water quality monitoring frameworks (Gao et al., 2023; Dehqani et al., 2021).
In Iran, freshwater resources are increasingly compromised by unregulated agricultural expansion, inadequate rural sanitation, and industrial discharges. Studies on major reservoirs such as Karaj, Dez, and Lake Urmia have documented elevated levels of heavy metals (e.g., Pb, Cd), nutrient enrichment (NO₃⁻, PO₄³⁻), and fecal contamination—primarily linked to untreated domestic and agricultural runoff (Kazemnejad et al., 2010; Dehqani et al., 2021). For example, sediment analyses in western Lake Urmia revealed significant enrichment of Ni, Co, Cr, and Cd, with anthropogenic contributions confirmed through enrichment factor (EF) and principal component analysis (Dehqani et al., 2022). Similarly, research on the Maharlou Lake salt crust identified Cd as the predominant ecological risk driver, despite generally low overall metal contamination (Froughi et al., 2021).
However, these findings cannot be extrapolated to alpine systems like Sabalan Dam Lake. Located at ~4,800 m above sea level on the Sabalan volcanic complex—a geologic formation rich in andesitic and basaltic rocks—the lake is naturally prone to trace metal leaching (Abdi, 2008). Weathering of such lithologies can release Pb, Zn, and Cd into surface waters, complicating source attribution between natural (geogenic) and human induced contamination (Wang, 2023). This dual pressure is common in high altitude volcanic lakes globally but has rarely been quantified in the Iranian context.
Globally, integrated water quality assessments increasingly combine field monitoring with spatial tools. Gao et al. (2023) applied GIS and principal component analysis (PCA) to Xianghai Lake in Northeast China, identifying non point agricultural and livestock sources as the dominant contributors (31.65%) to water quality degradation. Similarly, Isiuku and Enyoh (2020) used spatial interpolation in Nigeria to map nitrate and phosphate hotspots, linking elevated levels to fertilizer runoff and inadequate sanitation. Such approaches remain virtually absent in Iranian alpine lake studies, despite their potential for precise source identification and targeted management (Samadi, 2021).
Microbiological contamination further exacerbates risks in remote reservoirs. In data scarce regions, fecal coliforms often serve as reliable indicators of sewage or livestock waste intrusion (WHO, 2022). In Lake Urmia’s catchment, microbial loads were directly correlated with proximity to rural settlements and unlined septic systems (Dehqani et al., 2022). Sabalan’s surrounding villages lacking centralized wastewater treatment likely contribute similar pathogenic loads, yet no peer reviewed study has quantified this risk.
Critically, while national standards exist (e.g., Iranian Standard No. 2945), routine monitoring in high altitude reservoirs is sporadic. This data gap impedes evidence based policy and delays intervention. Moreover, the interplay between geogenic metal release and diffuse anthropogenic inputs particularly in volcanic terrains demands a multi parameter, spatially explicit assessment that current Iranian literature lacks.
Therefore, this study addresses three key gaps:
- The absence of comprehensive water quality baselines for high altitude volcanic reservoirs in Iran;
- Limited integration of physicochemical, microbiological, and spatial (GIS) analyses in Iranian freshwater research;
- Inadequate source apportionment of pollution in sensitive alpine ecosystems where natural and anthropogenic drivers coexist.
By bridging these gaps, the research contributes both regionally—informing sustainable management of Sabalan Dam Lake—and globally—offering a replicable framework for data scarce, high elevation reservoirs in arid zones.
3. Methodology
3.1. Study Area and Sampling Design
Sabalan Dam Lake is located in Ardabil Province, northwestern Iran, at an elevation of approximately 4,800 m above sea level on the Sabalan volcanic complex. The lake is primarily fed by snowmelt and seasonal runoff from andesitic and basaltic formations. The surrounding catchment includes rural settlements, livestock grazing areas, and limited agricultural activity, with no centralized wastewater treatment infrastructure.
To capture spatial variability in water quality, nine representative sampling stations were established across the lake and its main inflowing rivers (Figure 1). Stations were strategically selected based on land use, proximity to human settlements, livestock density, and hydrological connectivity to the reservoir. Two stations were located within the lake (north and south shores), while seven were positioned along tributaries at varying distances upstream and downstream of villages and croplands.
Sampling was conducted during spring 2023, a critical period following snowmelt and prior to peak agricultural activity, to assess baseline contamination levels under relatively stable hydrological conditions.
3.2. Water Quality Parameters and Analytical Procedures
A comprehensive suite of 19 water quality parameters was measured, categorized as follows:
- −
- Physicochemical: pH, electrical conductivity (EC), temperature, turbidity, dissolved oxygen (DO), chemical oxygen demand (COD), total hardness, and total alkalinity.
- −
- Nutrients: Nitrate (NO₃⁻), nitrite (NO₂⁻), ammoniacal nitrogen (NH₃–N), and phosphate (PO₄³⁻).
- −
- Heavy metals: Lead (Pb), cadmium (Cd), zinc (Zn), and copper (Cu).
- −
- Microbiological indicators: Total coliforms, fecal coliforms, and heterotrophic plate count (HPC).
Field measurements of pH, EC, temperature, DO, and turbidity were conducted in situ using a portable HACH HQd multi parameter meter and HACH 2100 turbidimeter, calibrated daily with standard buffers and solutions.
Grab water samples (1 L) were collected in pre cleaned polyethylene bottles for chemical analysis and in sterilized glass containers for microbiological testing. Samples were immediately stored on ice (4 °C), transported to the laboratory within 6 hours, and analyzed according to Standard Methods (APHA, 2017):
- −
- COD was determined via the closed reflux titrimetric method.
- −
- Nutrients were quantified spectrophotometrically using a DR5000 spectrophotometer (HACH).
- −
- Hardness and alkalinity were measured by EDTA titration and acid–base titration, respectively.
- −
- Heavy metals were analyzed by anodic stripping voltammetry (ASV) using a Metrohm 797 VA Computrace system with a hanging mercury drop electrode (HMDE). The method detection limits were: Pb = 0.1 µg/L, Cd = 0.05 µg/L, Zn = 0.5 µg/L, Cu = 0.2 µg/L.
- −
- Microbiological indicators were assessed using the Most Probable Number (MPN) method for coliforms and the pour plate technique for HPC on nutrient agar (incubated at 37 °C for 48 h).
All laboratory analyses included blanks, duplicates, and certified reference materials to ensure accuracy and precision (recovery rates: 92–105%). “A summary of the measured parameters, analytical methods, detection limits, and regulatory thresholds is provided in Table 1.”
3.3. Quality Standards and Data Analysis
Measured concentrations were compared against WHO (2022), U.S. EPA (2023), and Iranian National Standard No. 2945 guidelines for drinking and irrigation water.
Spatial distribution maps of key pollutants (e.g., Pb, Cd, NO₃⁻, fecal coliforms) were generated using Inverse Distance Weighting (IDW) interpolation in ArcGIS 10.8. This allowed identification of pollution hotspots and correlation with nearby anthropogenic or geological sources.
Descriptive statistics (mean, min, max, standard deviation) and Pearson correlation matrices were computed using SPSS v.26 to evaluate interrelationships among parameters and infer potential pollution mechanisms.
4. Results and Discussion
4.1. Physicochemical Characteristics
The physicochemical parameters of water samples collected from nine stations across Sabalan Dam Lake and its inflowing rivers in spring 2023 are summarized in Table 1. The pH ranged from 7.56 to 8.65, falling within the WHO (6.5–8.5) and Iranian (6.5–9.0) permissible limits, indicating slightly alkaline conditions—likely influenced by carbonate rich geology (andesitic/basaltic lithologies) in the catchment. Electrical conductivity (EC) varied between 298 and 780 µS/cm, consistent with low to moderate total dissolved solids (TDS), and positively correlated with total hardness (r = 0.82, p < 0.01), suggesting a geogenic origin dominated by calcium and magnesium carbonates.
Turbidity exhibited high spatial variability (0.1–164 NTU), with the highest value recorded at Station 1 coinciding with high streamflow and sediment runoff from upstream grazing areas. This finding is consistent with field observations of eroded slopes and unregulated livestock access to riverbanks.
4.2. Nutrient Pollution and Trophic Status
Nitrate concentrations ranged from 0.1 to 6.2 mg/L, with stations downstream of villages (e.g., Stations 2, 7, 8, and 9) exceeding the WHO limit of 50 mg/L NO₃⁻ only when converted to NO₃⁻ N (1.59 mg/L mean, below the 10 mg/L NO₃⁻ N threshold). However, ammoniacal nitrogen (NH₃–N) reached 0.03 mg/L at Stations 3 and 8—indicative of recent fecal or organic waste input. Nitrite was undetectable across all sites.
Total phosphate concentrations varied from 0.02 to 0.49 mg/L, with a mean of 0.28 mg/L. Using total phosphorus (estimated as 2.5× phosphate), the lake’s trophic status was classified as mesotrophic (10–35 µg/L TP), a notable shift from historical oligotrophic conditions signaling early eutrophication. The strong negative correlation between phosphate and pH (r = –0.71, p < 0.05) suggests that phosphorus solubility increases under acidic microenvironments, possibly near organic decomposition zones.
4.3. Heavy Metal Contamination
Heavy metal analysis revealed concerning levels of lead (Pb) and cadmium (Cd) across all sampling stations (Table 2). Pb concentrations ranged from 28.85 to 62.72 µg/L, exceeding both WHO (10 µg/L) and EPA (15 µg/L) limits by 2–6 times. Cd ranged from 11 to 23.94 µg/L, surpassing WHO (3 µg/L) and EPA (5 µg/L) standards by 3–8 times. In contrast, Zn (82.86–160.64 µg/L) and Cu (2.1–10 µg/L) remained below regulatory thresholds.
These elevated Pb and Cd levels are likely attributable to geogenic leaching from the Sabalan volcanic complex, which is rich in sulfide bearing andesites and basalts known to contain trace metal deposits (Abdi, 2008). However, anthropogenic contributions cannot be ruled out particularly from unregulated waste disposal and historical mining activity in the upper catchment. The inverse relationship between metal concentrations and water hardness (r = –0.68 for Pb) aligns with established toxicological models: softer water increases metal bioavailability and ecotoxicological risk (EPA, 2001).
4.4. Microbiological Quality
Microbial indicators revealed widespread fecal contamination. Total coliforms ranged from 260 to 1,100 MPN/100mL, and fecal coliforms from 0 to 1,150 MPN/100mL—far exceeding the WHO and Iranian standard of zero for drinking water. Stations near rural settlements (e.g., Stations 3, 6, and 8) showed the highest counts, confirming livestock and inadequate sanitation as primary sources. Heterotrophic plate counts (150–500 CFU/100mL) also exceeded the Iranian limit of 200 CFU/100mL in 7 of 9 stations.
This microbial load poses significant public health risks, particularly since the lake supplies drinking water to downstream communities. Even with conventional chlorination, high organic and microbial loads can lead to the formation of carcinogenic disinfection by products (e.g., trihalomethanes), as noted in similar highland reservoirs in Turkey and India (Gao et al., 2023).
4.5. Spatial Patterns and Source Apportionment via GIS
GIS based IDW interpolation (Figure 2, Figure 3, Figure 4, Figure 5 and Figure 6) revealed three critical hotspots of multi parameter pollution:
Station 8: High Pb, Cd, NH₃–N, fecal coliforms linked to a downstream village with unlined septic systems.
Station 2: Elevated turbidity, COD, and phosphate associated with agricultural runoff and livestock grazing.
Station 6 (northern lake shore): Accumulation zone for contaminants transported via inflowing rivers.
Figure 7.
Final raster layer of pollution level of Lake Sabalan.
These hotspots align with findings from Xianghai Lake in China, where non point agricultural and livestock sources contributed 31.65% of water quality degradation (Gao et al., 2023). Unlike lowland reservoirs impacted by industrial discharge, Sabalan’s pollution is driven by diffuse rural sources combined with natural metal leaching—a dual pressure dynamic common in volcanic highland lakes but rarely quantified in Iran.
4.6. Implications for Water Use and Management
While physicochemical parameters (except metals) are generally within acceptable ranges for irrigation, none of the stations meet drinking water standards due to Pb, Cd, and microbial contamination. This challenges the assumption that high altitude lakes are inherently pristine. The co occurrence of geogenic and anthropogenic stressors necessitates a dual track management strategy:
Geogenic mitigation: Implement metal removal pretreatment (e.g., lime softening to increase hardness and reduce metal solubility).
Anthropogenic control: Construct decentralized wastewater systems for upstream villages, regulate livestock access to watercourses, and promote eco tourism zoning to minimize organic loading.
Moreover, the shift toward mesotrophy demands proactive nutrient management—particularly phosphate control—to prevent algal blooms during summer stratification.
5. Conclusion
This study provides the first integrated assessment of water quality in Sabalan Dam Lake a high altitude reservoir in northwestern Iran combining field monitoring, laboratory analysis, and GIS based spatial interpolation. The findings reveal that while key physicochemical parameters (e.g., pH, DO, COD) generally fall within permissible limits for drinking and irrigation, critical contamination risks persist due to elevated levels of lead (Pb) and cadmium (Cd), as well as widespread microbiological pollution.
Concentrations of Pb (28.85–62.72 µg/L) and Cd (11–23.94 µg/L) exceeded WHO and EPA thresholds by 2–8 times across all sampling stations, likely resulting from the combined effects of geogenic leaching from the Sabalan volcanic complex and anthropogenic inputs from upstream rural communities. Concurrently, fecal coliform counts (0–1,150 MPN/100mL) and total coliforms (260–1,100 MPN/100mL) far above the zero tolerance standard for drinking water—confirm significant contamination from untreated domestic and livestock waste, particularly near villages and grazing zones.
Spatial analysis identified three critical hotspots (Stations 2, 6, and 8) where nutrient, metal, and microbial loads converge, driven by land use patterns rather than industrial discharge—a distinct pollution dynamic compared to lowland reservoirs in Iran. Furthermore, the lake has shifted toward a mesotrophic state (mean TP ≈ 20 µg/L), signaling early eutrophication linked to phosphate inputs and declining pH, which enhances metal bioavailability and ecological risk.
These results challenge the assumption that high altitude lakes are inherently pristine and underscore the vulnerability of volcanic alpine reservoirs to dual stressors: natural metal rich geology and diffuse rural pollution. Consequently, Sabalan Dam Lake does not currently meet national or international standards for direct drinking water use without advanced treatment.
To safeguard this strategic water resource, we recommend a dual track management approach:
Geogenic mitigation through lime softening or coagulation to increase water hardness and reduce metal solubility;
Anthropogenic control via decentralized wastewater systems, livestock exclusion zones along watercourses, and eco tourism zoning to minimize organic loading.
This study not only informs local water security in Ardabil Province but also offers a replicable framework for assessing and managing data scarce, high elevation reservoirs in arid and semi arid regions globally—where climate change and rural development are intensifying pressure on fragile freshwater ecosystems.
References
- Abdi, H. Geochemical assessment of heavy metals in volcanic regions of Northwest Iran. Environmental Geology 2008, 55(3), 601–610. [Google Scholar] [CrossRef]
- APHA. Standard methods for the examination of water and wastewater, 22nd ed.; American Public Health Association, 2017. [Google Scholar]
- Davoudi Moghaddam, D.; Haghizadeh, A.; Tahmasebipour, N.; Zeinivand, H. Spatial and temporal water quality analysis of a semi-arid river for drinking and irrigation purposes using water quality indices and GIS. Ecopersia 2021, 9(2), 79–93. [Google Scholar]
- Dehqani, M.; Parikhani, H.; Lak, R.; Asadzadeh, F. Heavy metal pollution in western Lake Urmia sediments. Environmental Monitoring and Assessment 2021, 193(12), 789. [Google Scholar] [CrossRef]
- Dehqani, M.; Parikhani, H.; Lak, R.; Asadzadeh, F. Source apportionment of nutrients and pathogens in Lake Urmia’s watershed. Journal of Arid Environments 2022, 198, 104682. [Google Scholar] [CrossRef]
- EPA. 2001 Update of ambient water quality criteria for cadmium; U.S. Environmental Protection Agency, Office of Water, 2001. [Google Scholar]
- EPA. National primary drinking water regulations. U.S. Environmental Protection Agency. 2023. Available online: https://www.epa.gov/ground-water-and-drinking-water/national-primary-drinking-water-regulations.
- Ephsy, D.; Raja, S. Characterization of microplastics and its pollution load index in freshwater Kumaraswamy Lake of Coimbatore, India. Environmental Toxicology and Pharmacology 2023, 101, 104207. [Google Scholar] [CrossRef] [PubMed]
- Froughi, F.; Sadeghi, A.; Khanian, A. A.; Shirzadmehr, Z. Ecological risk of heavy metals in Maharlou Lake salt crust, southwest Iran. Environmental Geochemistry and Health 2021, 43(10), 4567–4582. [Google Scholar] [CrossRef]
- Gao, J.; Deng, G.; Jiang, H.; Wen, Y. Water quality pollution assessment and source apportionment of lake wetlands: A case study of Xianghai Lake in the Northeast China Plain. Journal of Environmental Management 2023, 344, 118398. [Google Scholar] [CrossRef] [PubMed]
- Isiuku, B. O.; Enyoh, C. E. Pollution and health risks assessment of nitrate and phosphate in Southeastern Nigeria. Environmental Advances 2020, 2, 100018. [Google Scholar] [CrossRef]
- Kazemnejad, F.; Niknam, R.; Zare Mehrjerdi, M. Water quality assessment of Sardabroud River using physicochemical parameters. Journal of Natural Resources Science & Technology 2010, 5(2), 101–110. [Google Scholar]
- Naddafi, K.; Farzadkia, M.; Ghasemi, M. Heavy metal pollution in freshwater ecosystems of Iran: A systematic review and meta-analysis. Environmental Science and Pollution Research 2021, 28(34), 46871–46885. [Google Scholar] [CrossRef]
- Prathep, A. Spatial and temporal variations in diversity and percentage cover of macroalgae at Sirinart Marine National Park, Phuket Province, Thailand. ScienceAsia 2005, 31(3), 225–233. [Google Scholar] [CrossRef]
- Samadi, A. Impacts of drought and salt dust storms on human health around Lake Urmia. Iranian Journal of Public Health 2021, 50 Suppl. 1, 45–52. [Google Scholar] [CrossRef]
- UNEP. Global water quality assessment: Status and trends; United Nations Environment Programme, 2021. [Google Scholar]
- Wang, C. Regulating phytoplankton-available suspended particulate phosphorus (P) to control internal P pollution in lakes: Conclusions from a short review. Chemosphere 2023, 331, 138833. [Google Scholar] [CrossRef] [PubMed]
- WHO. Guidelines for drinking-water quality, 4th ed.; World Health Organization, 2022; Available online: https://www.who.int/publications/i/item/9789241549950.
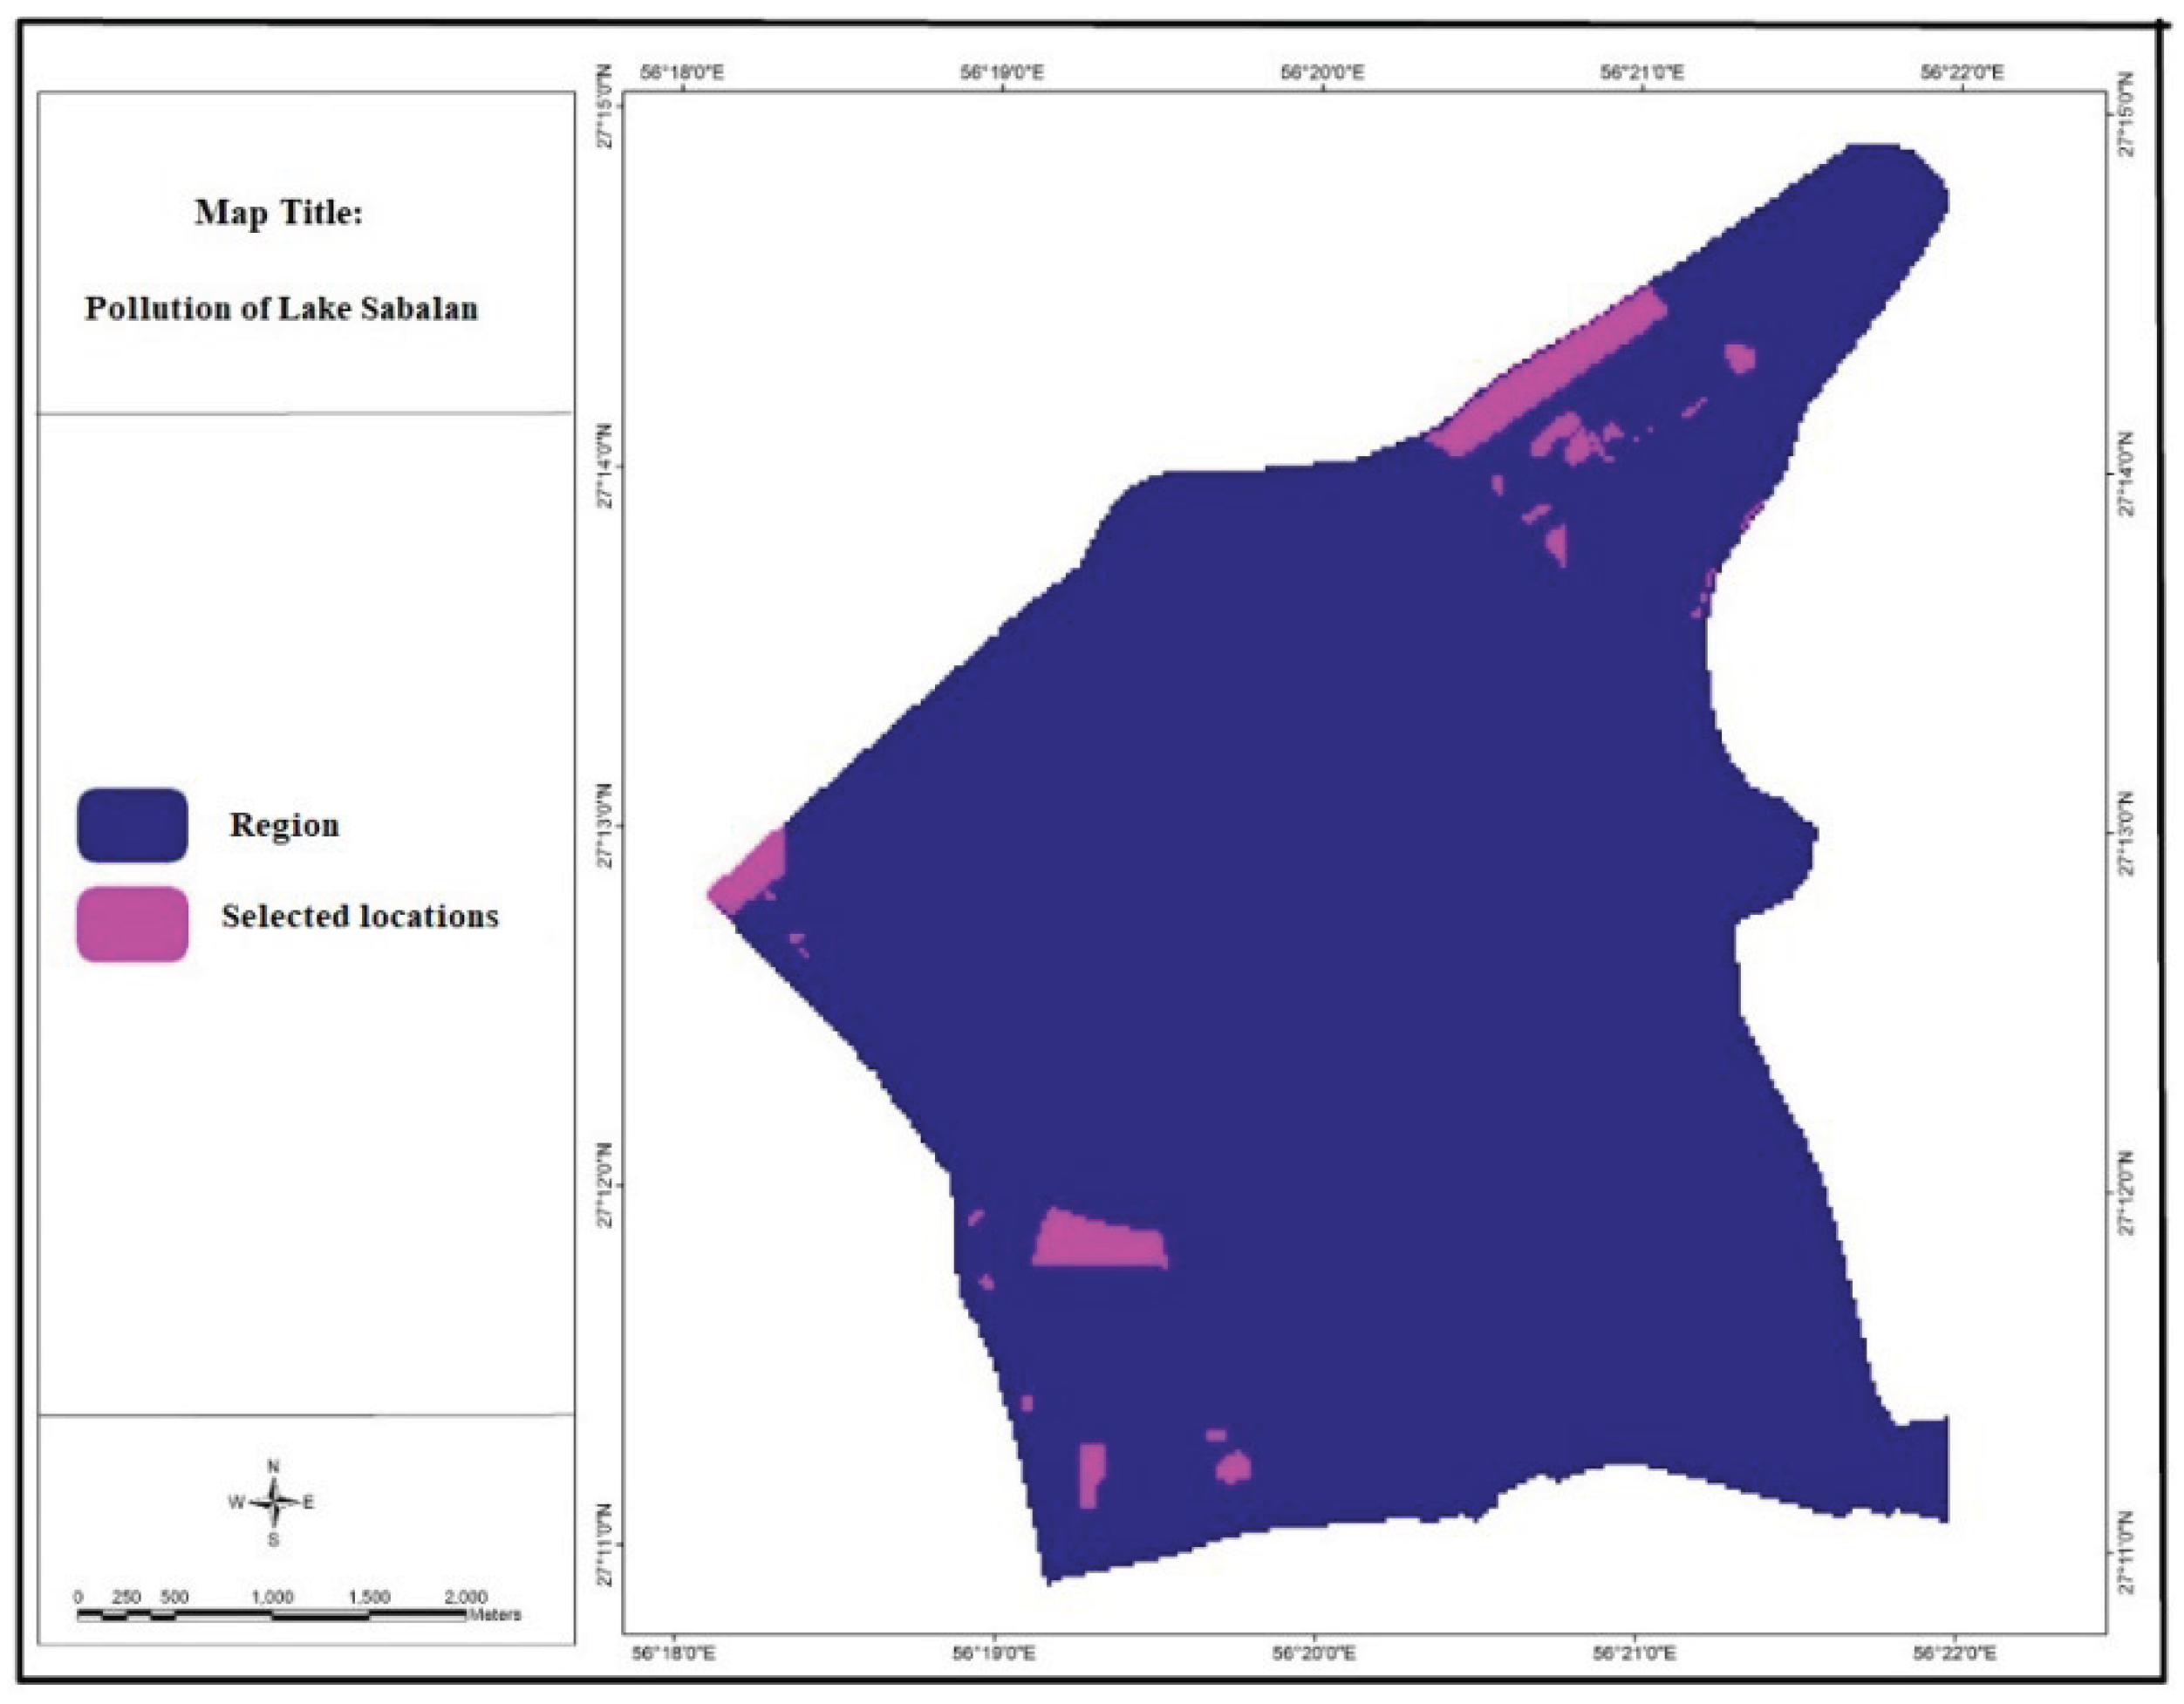
Figure 1.
Geographical location and sampling stations.
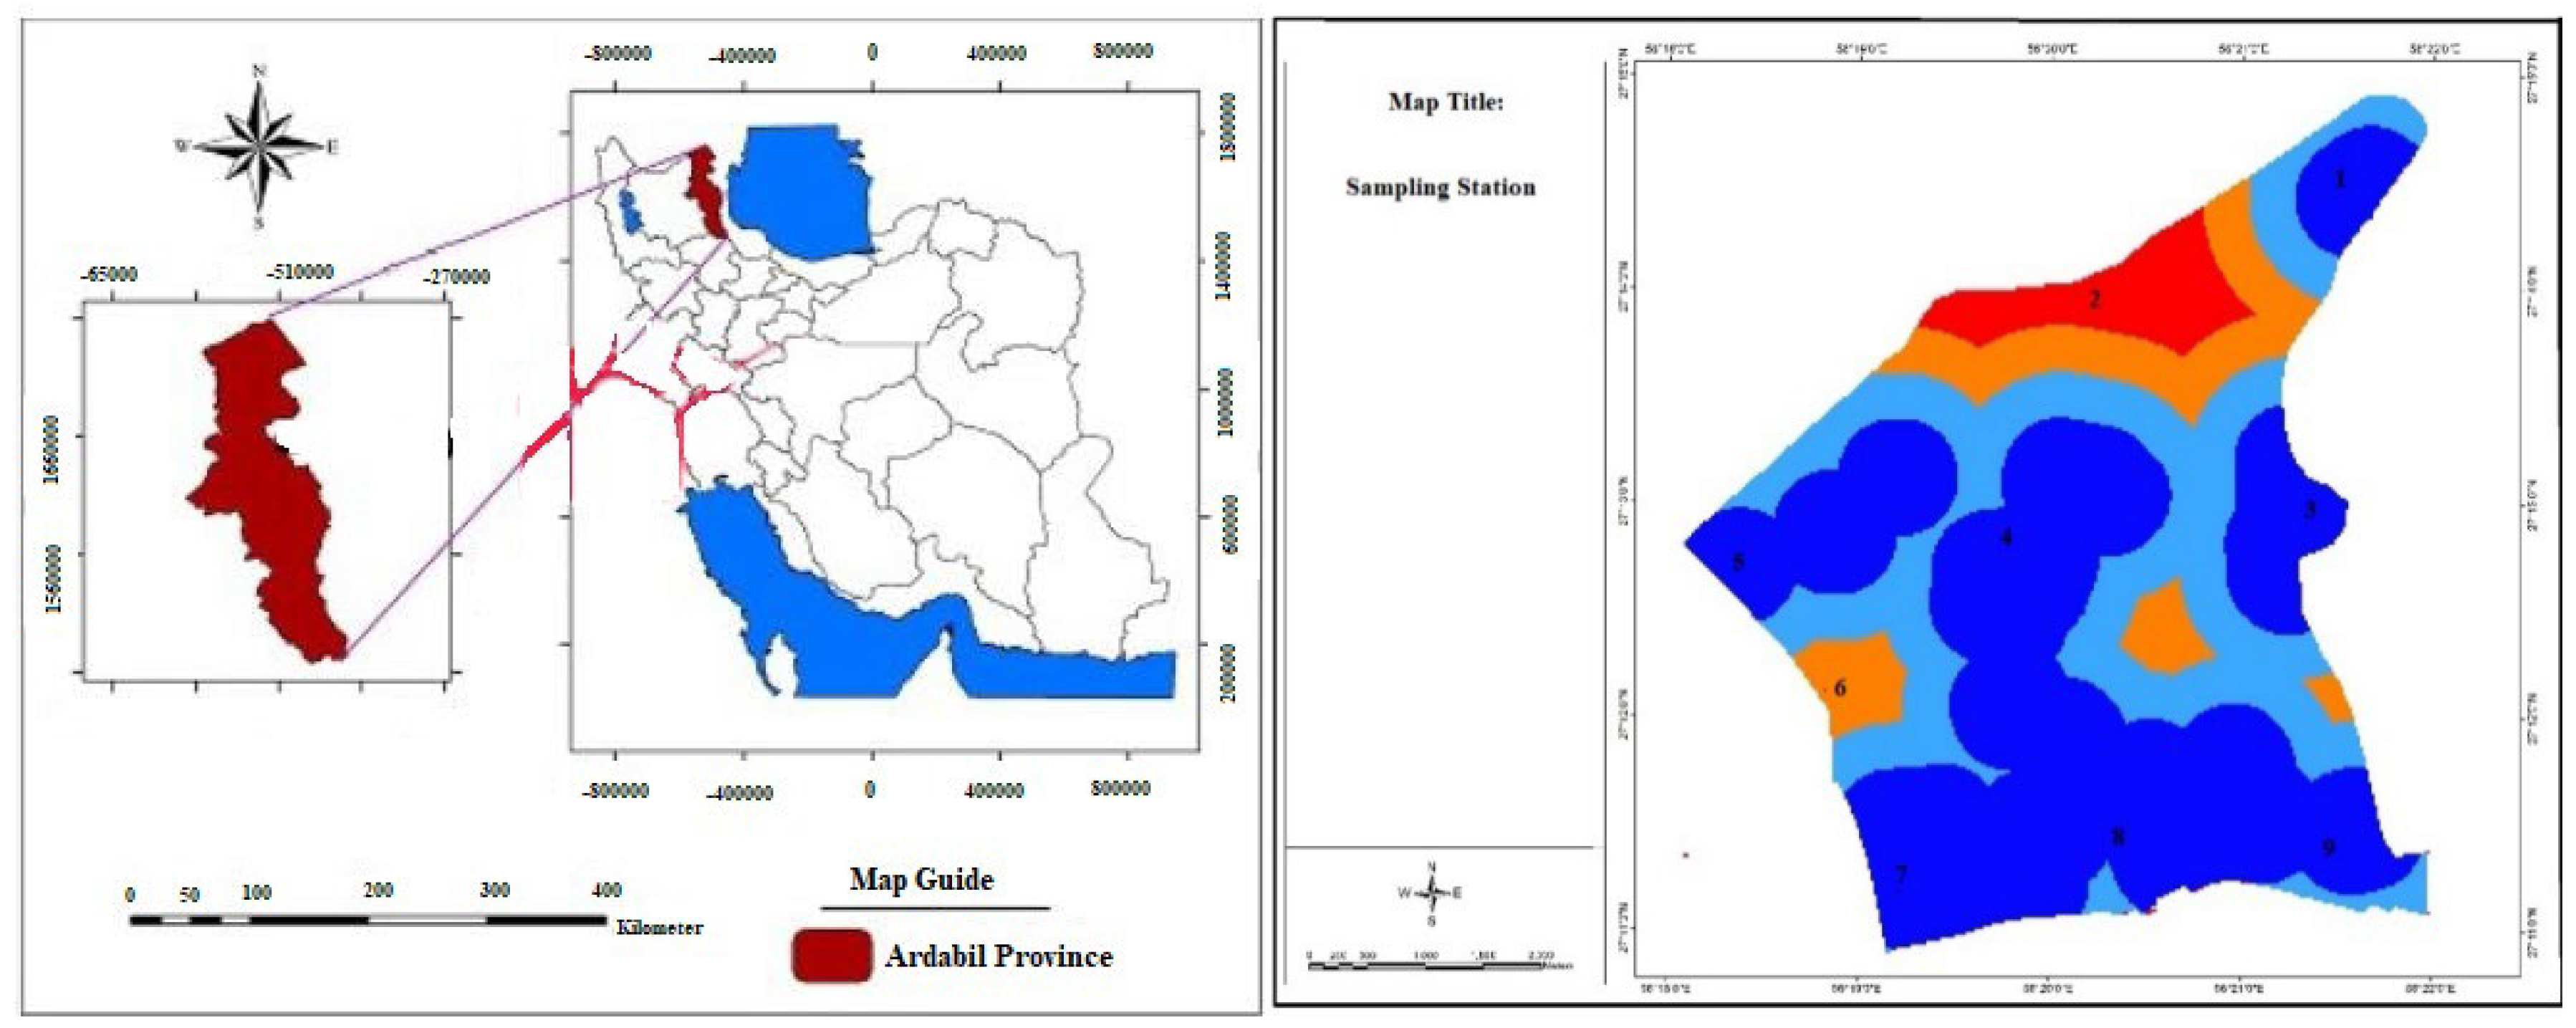
Figure 2.
Oxygen and cadmium concentrations in Sabalan Lake pollution.
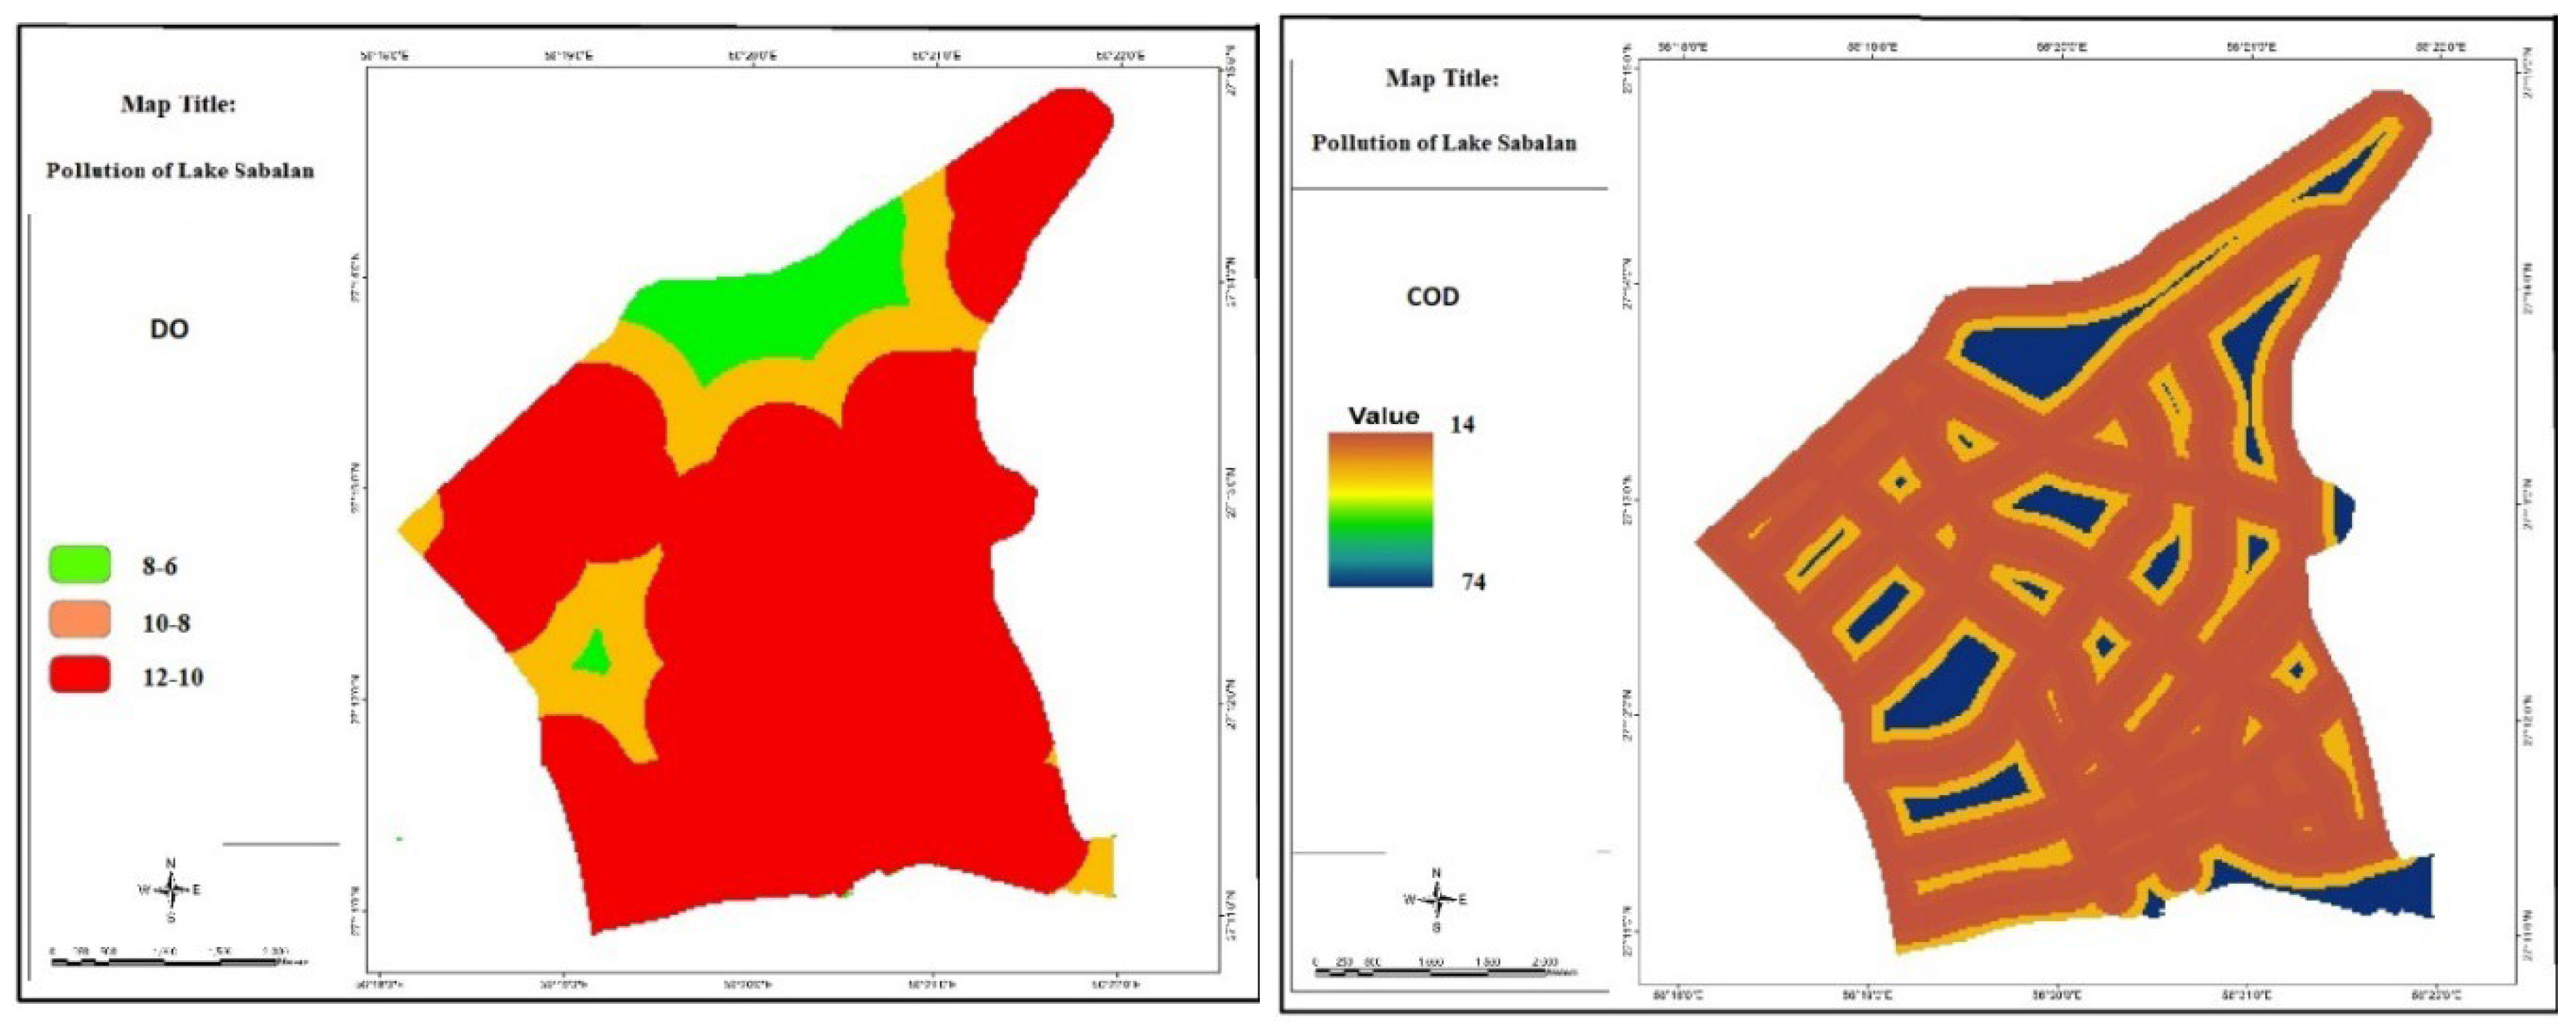
Figure 3.
Concentrations of total nitrate (right) and ammonia nitrate (left) in the pollution of Lake Sabalan.
Figure 3.
Concentrations of total nitrate (right) and ammonia nitrate (left) in the pollution of Lake Sabalan.
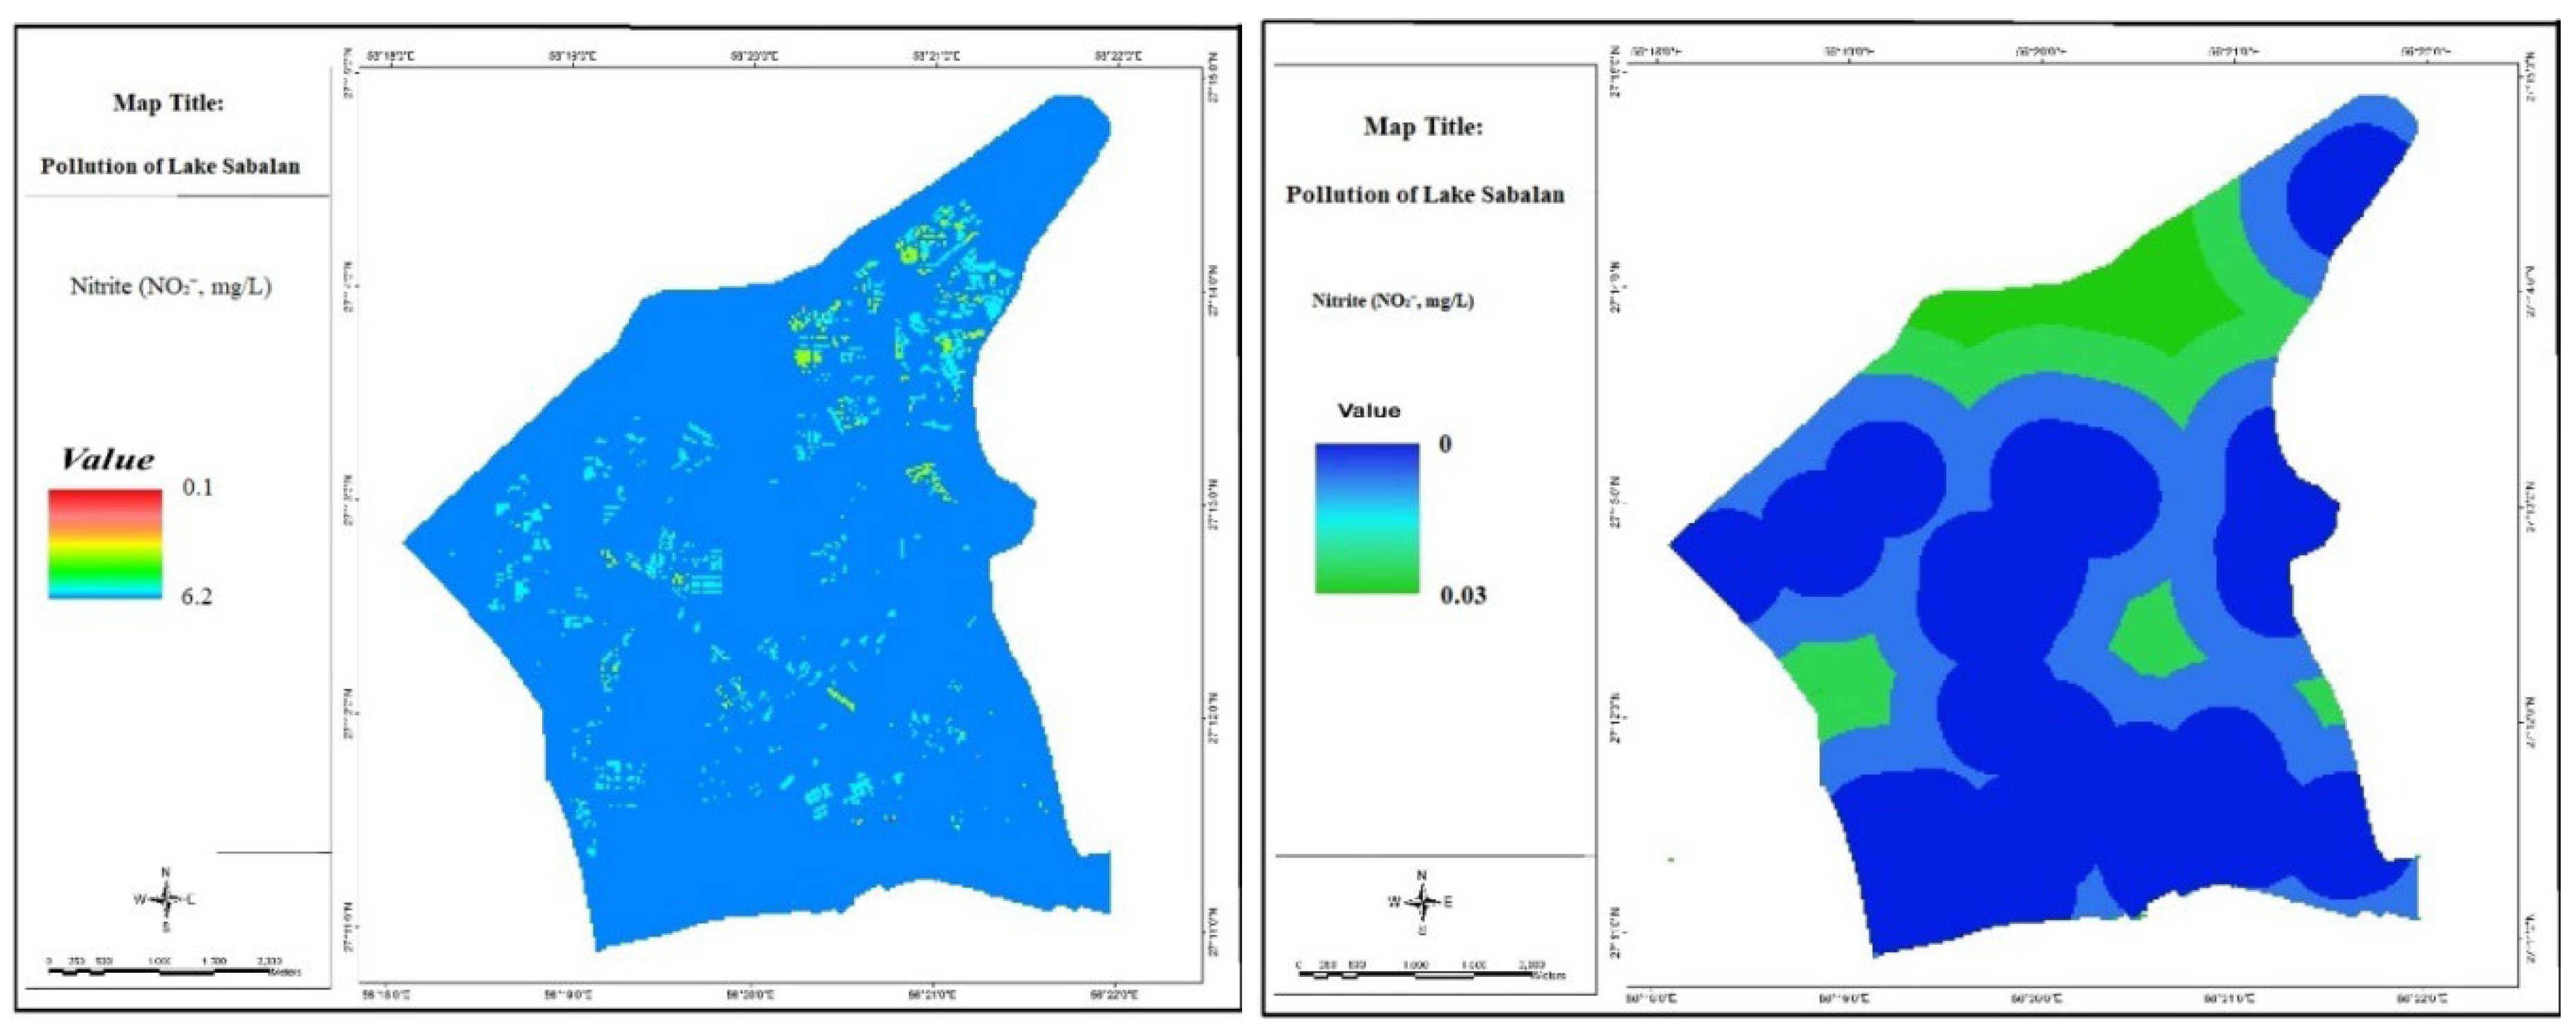
Figure 4.
Concentrations of phosphate (left) and alkalinity (right) in the pollution of Lake Sabalan.
Figure 4.
Concentrations of phosphate (left) and alkalinity (right) in the pollution of Lake Sabalan.
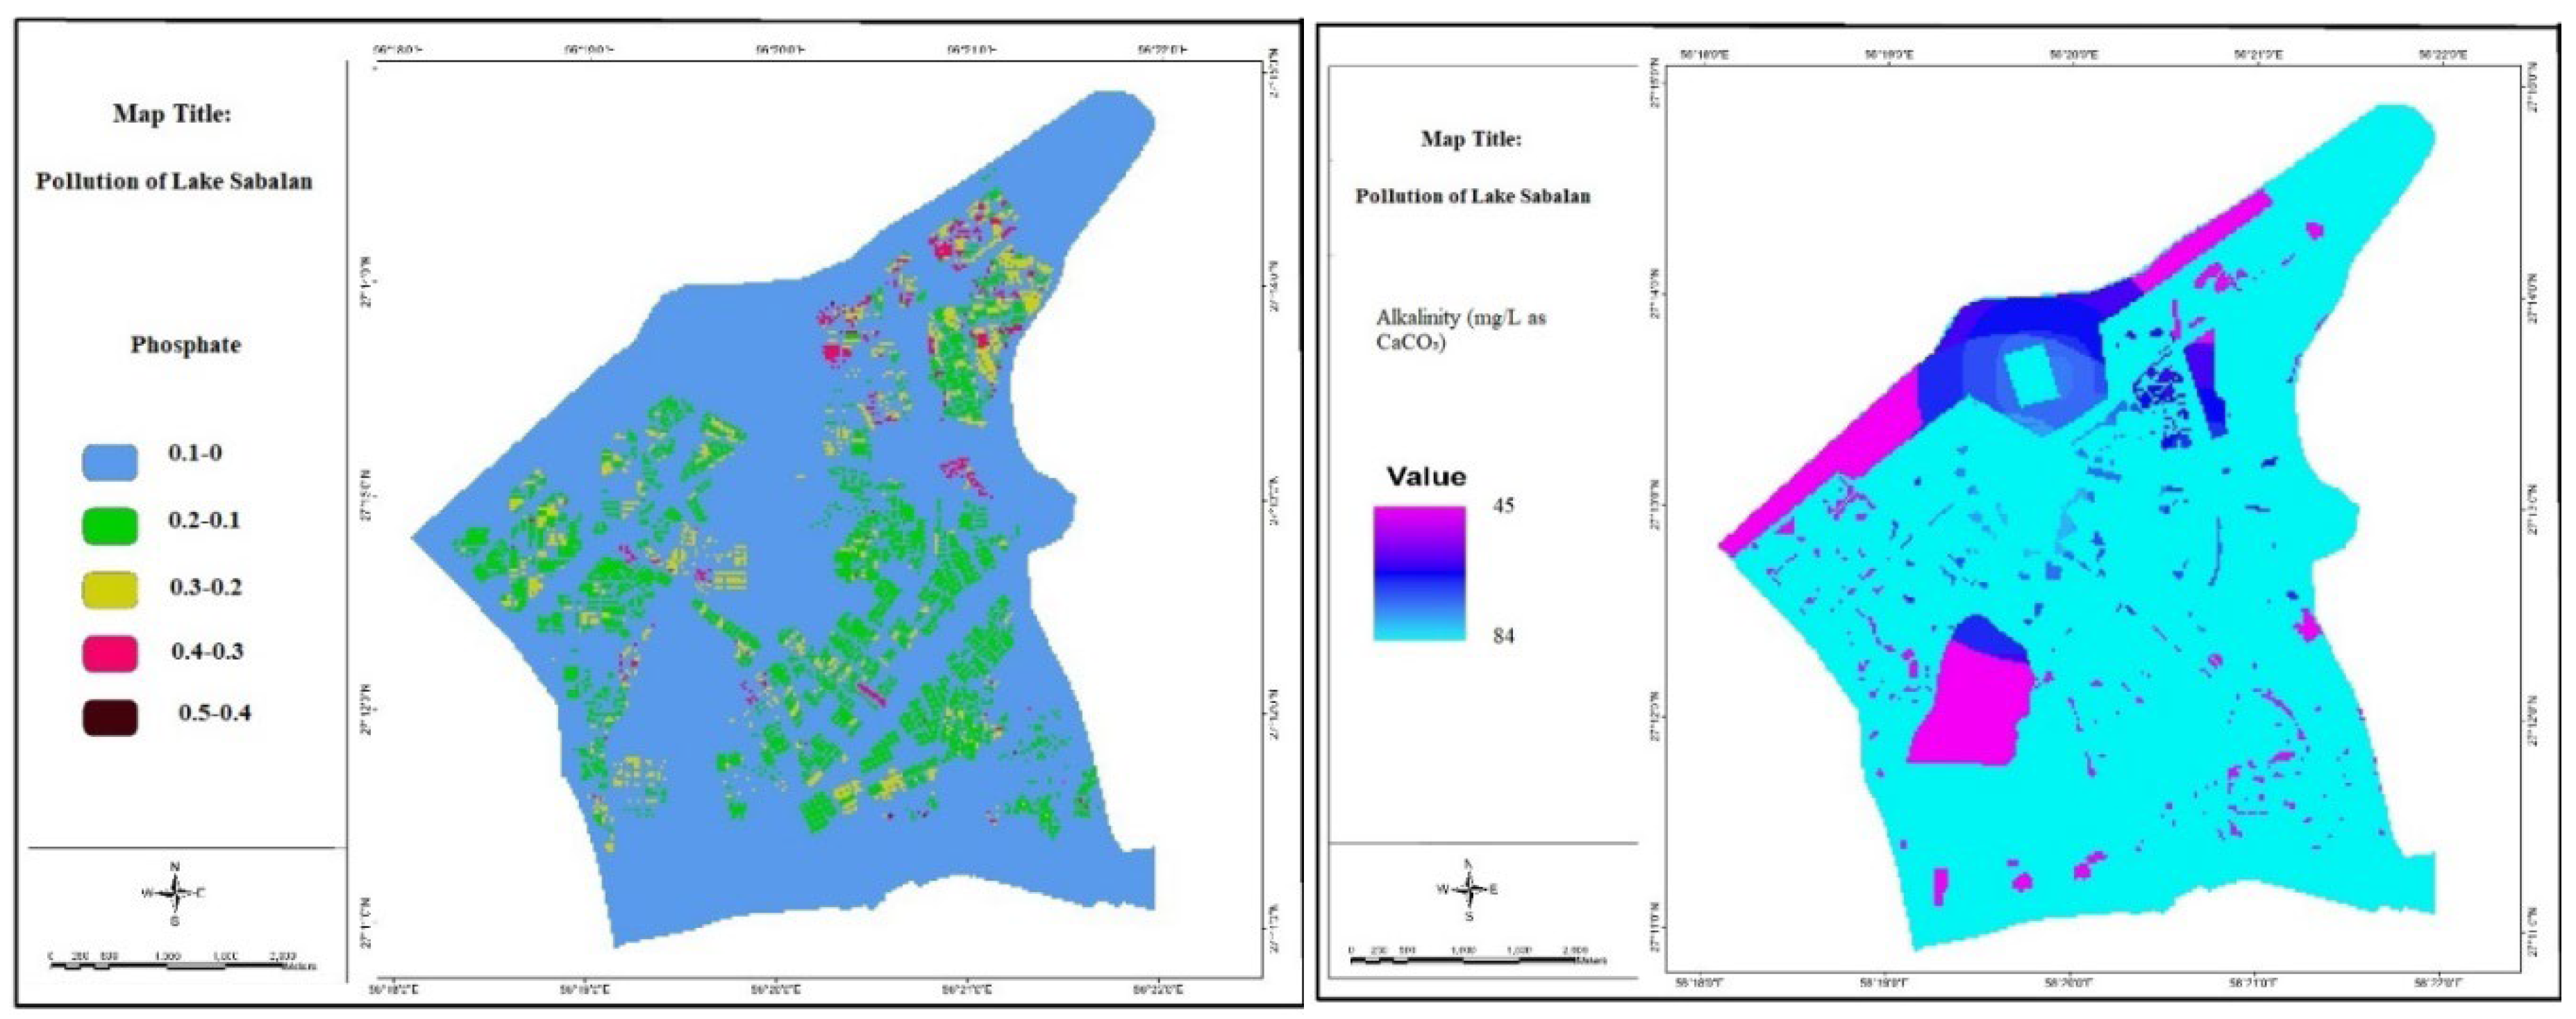
Figure 5.
Concentrations of lead (left) and cadmium (right) in the pollution of Lake Sabalan.
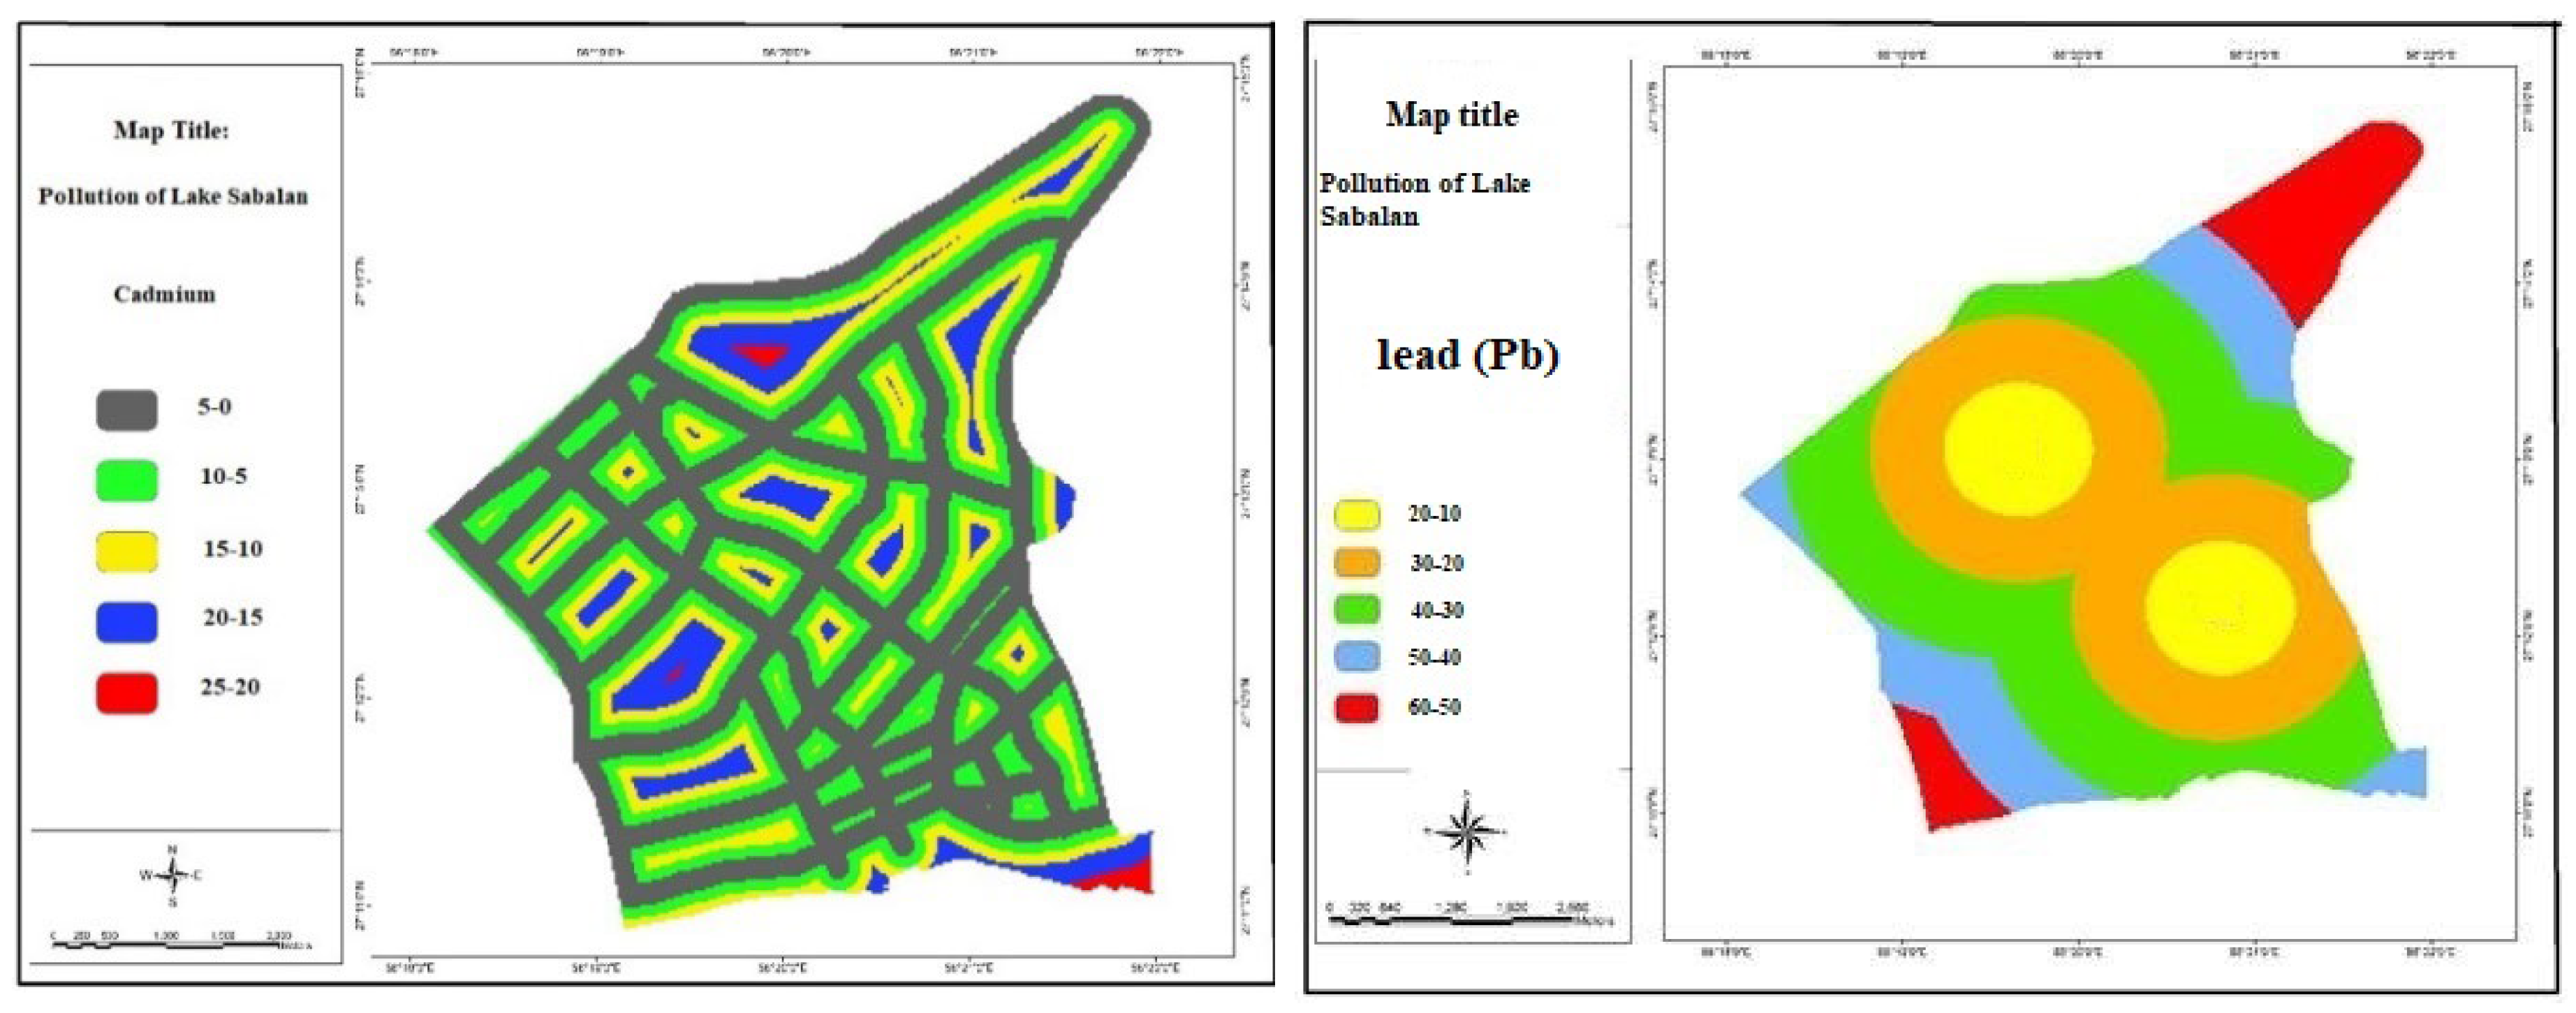
Figure 6.
Total coliform (left) and fecal coliform (right) levels in Sabalan Lake pollution.
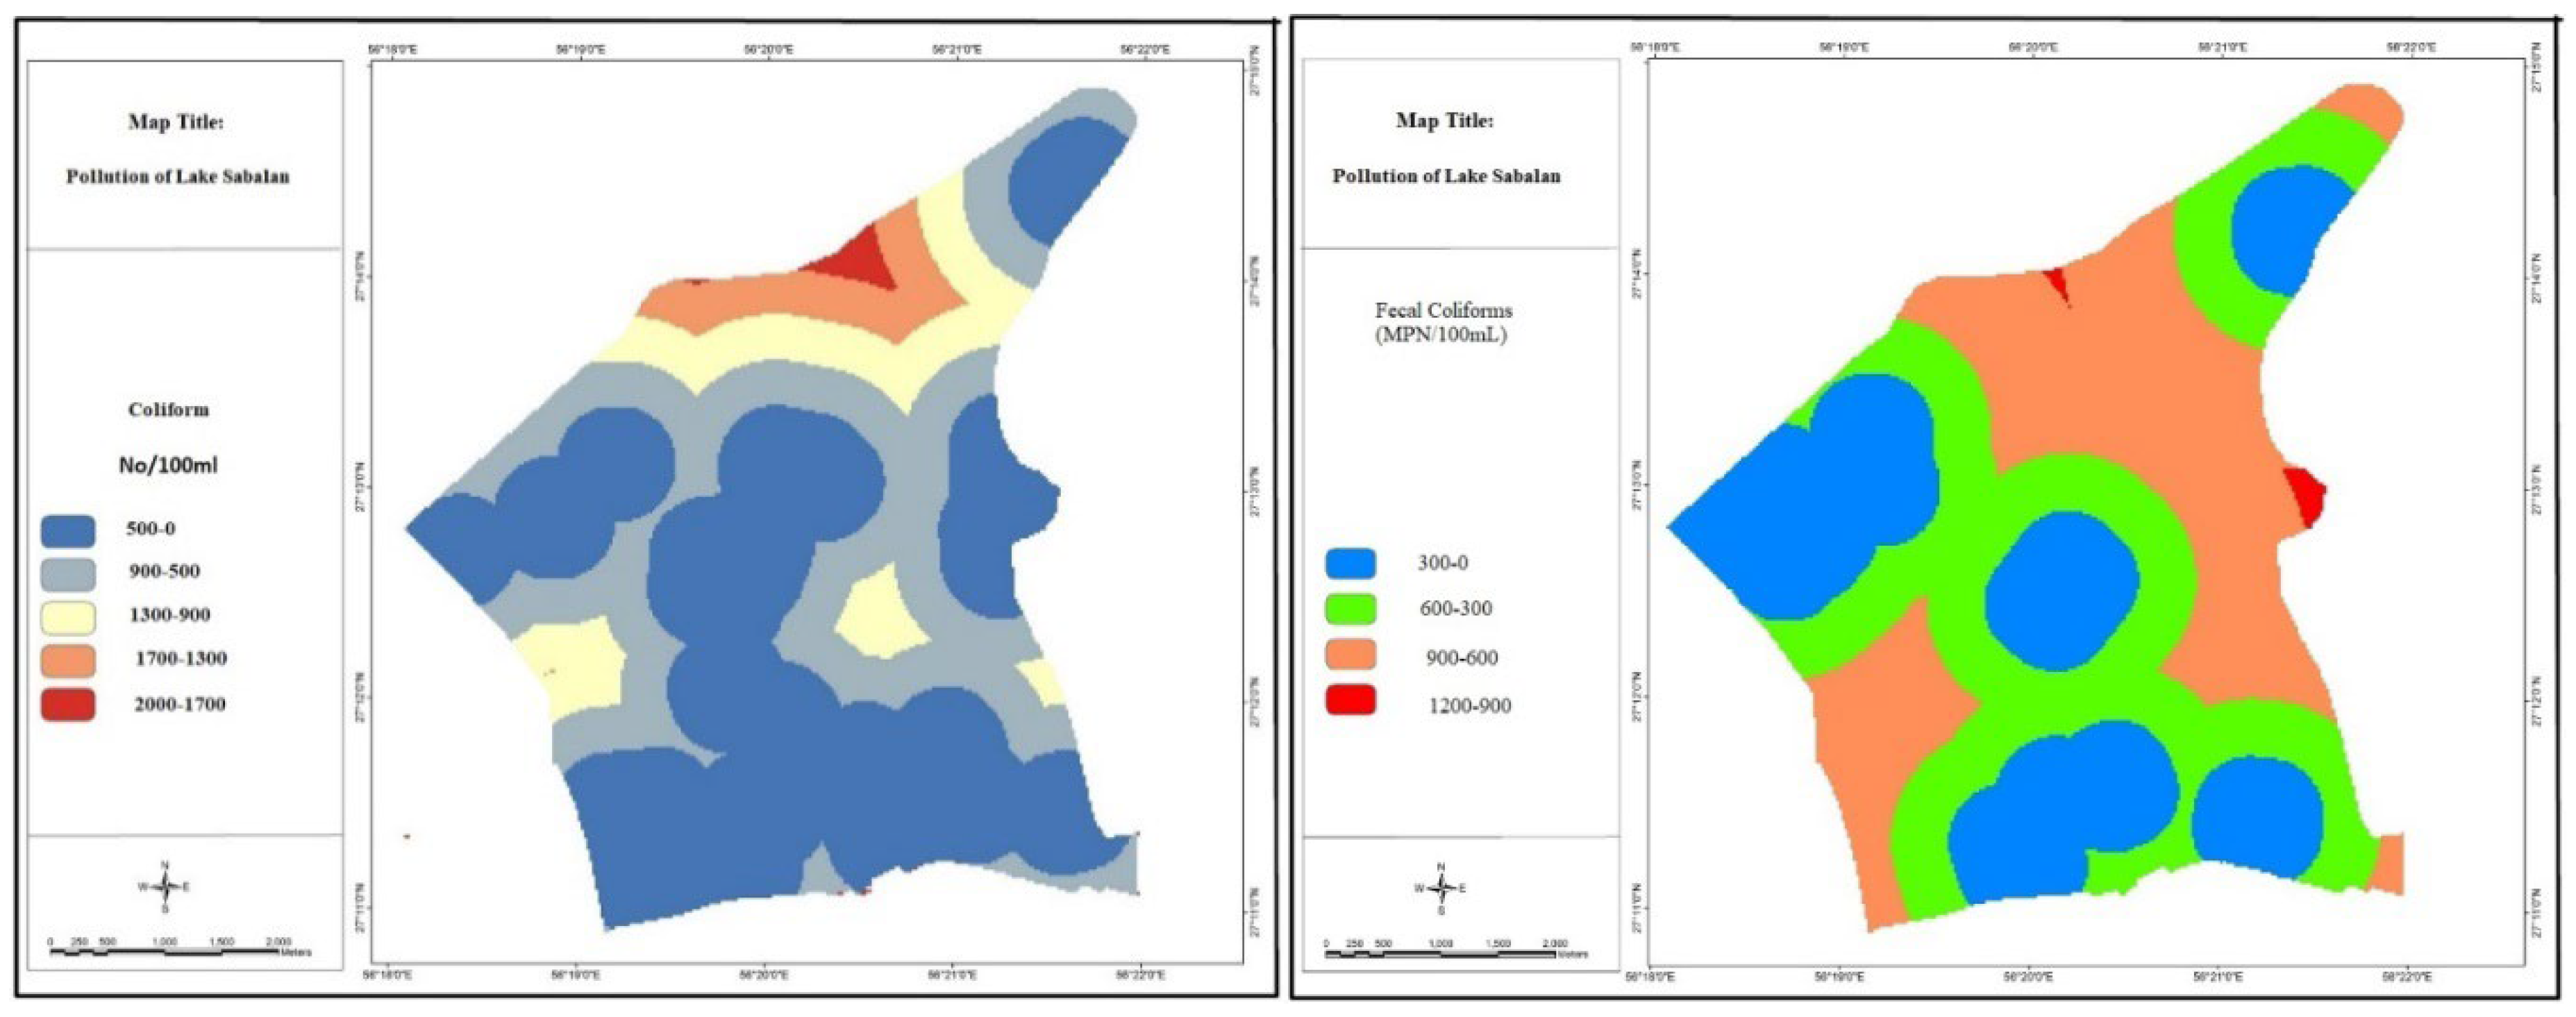

Table 1.
Descriptive statistics of all water quality parameters (min, max, mean, SD) vs. WHO/EPA/Iranian standards.
Table 1.
Descriptive statistics of all water quality parameters (min, max, mean, SD) vs. WHO/EPA/Iranian standards.
| Parameter Category | Parameter | Analytical Method | Instrument | Detection Limit | WHO (2022) | EPA (2023) | Iranian Std. (No. 2945) |
| Physicochemical |
pH | Potentiometry | HACH HQd | — | 6.5–8.5 | 6.5–8.5 | 6.5–9.0 |
| EC (μS/cm) | Conductometry | HACH HQd | — | — | — | — | |
| DO (mg/L) | Electrochemical probe | HACH HQd | 0.1 mg/L | >5 | >5 | — | |
| Turbidity (NTU) | Nephelometry | HACH 2100 | 0.1 NTU | <5 | <5 | <5 | |
| Temperature (°C) | Thermometry | Mercury thermometer | — | — | — | — | |
| COD (mg/L) | Closed reflux titrimetry | — | 10 mg/L | — | — | — | |
| Total Hardness (mg/L as CaCO₃) | EDTA titration | Burette | — | 500 | 500 | 500 | |
| Alkalinity (mg/L as CaCO₃) | Acid–base titration | Burette | — | — | — | — | |
| Nutrients |
Nitrate (NO₃⁻, mg/L) | Spectrophotometry (cadmium reduction) | HACH DR5000 | 0.01 mg/L | 50 | 10 | 50 |
| Nitrite (NO₂⁻, mg/L) | Spectrophotometry (diazotization) | HACH DR5000 | 0.005 mg/L | 3 | 1 | 3 | |
| Ammonia N (mg/L) | Spectrophotometry (Nessler method) | HACH DR5000 | 0.02 mg/L | 0.5 | 0.5 | 0.5 | |
| Phosphate (PO₄³⁻, mg/L) | Spectrophotometry (molybdenum blue) | HACH DR5000 | 0.01 mg/L | 0.3 | 0.1 | 0.3 | |
| Heavy Metals |
Pb (μg/L) | Anodic stripping voltammetry (ASV) | Metrohm 797 VA Computrace | 0.1 μg/L | 10 | 15 | 10 |
| Cd (μg/L) | Anodic stripping voltammetry (ASV) | Metrohm 797 VA Computrace | 0.05 μg/L | 3 | 5 | 10 | |
| Zn (μg/L) | Anodic stripping voltammetry (ASV) | Metrohm 797 VA Computrace | 0.5 μg/L | 3000 | 5000 | — | |
| Cu (μg/L) | Anodic stripping voltammetry (ASV) | Metrohm 797 VA Computrace | 0.2 μg/L | 1000 | 1300 | — | |
| Microbiological |
Total Coliforms (MPN/100mL) | Most Probable Number (MPN) | Multiple tube fermentation | 1 MPN/100mL | 0 | 0 | 0 |
| Fecal Coliforms (MPN/100mL) | Most Probable Number (MPN) | Multiple tube fermentation | 1 MPN/100mL | 0 | 0 | 0 | |
| HPC (CFU/100mL) | Pour plate method | Nutrient agar | 10 CFU/100mL | 500 | 500 | 200 |
Table 2.
Descriptive statistics of water quality parameters across nine sampling stations in Sabalan Dam Lake (spring 2023) compared with WHO (2022), U.S. EPA (2023), and Iranian National Standard No. 2945.
Table 2.
Descriptive statistics of water quality parameters across nine sampling stations in Sabalan Dam Lake (spring 2023) compared with WHO (2022), U.S. EPA (2023), and Iranian National Standard No. 2945.
| Parameter | Unit | Min | Max | Mean | SD | WHO | EPA | Iranian Std. |
| Physical & General | ||||||||
| Temperature | °C | 13.0 | 21.3 | 16.08 | 2.62 | – | – | – |
| pH | – | 7.56 | 8.65 | 8.19 | 0.25 | 6.5–8.5 | 6.5–8.5 | 6.5–9.0 |
| EC | µS/cm | 298 | 780 | 444.89 | 116.96 | – | – | – |
| Turbidity | NTU | 0.1 | 164 | 26.01 | 31.15 | <5 | <5 | <5 |
| DO | mg/L | 6.45 | 10.22 | 8.95 | 0.67 | >5 | >5 | – |
| COD | mg/L | 15 | 75 | 44 | 19.78 | – | – | – |
| Total Hardness | mg/L as CaCO₃ | 168 | 420 | 228.67 | 49.19 | 500 | 500 | 500 |
| Alkalinity | mg/L as CaCO₃ | 45 | 84 | 65.56 | 16.05 | – | – | – |
| Nutrients | ||||||||
| Nitrate (NO₃⁻) | mg/L | 0.1 | 6.2 | 1.59 | 2.00 | 50 | 10 | 50 |
| Nitrite (NO₂⁻) | mg/L | 0 | 0 | 0 | 0 | 3 | 1 | 3 |
| Ammonia N (NH₃–N) | mg/L | 0 | 0.03 | 0.01 | 0.01 | 0.5 | 0.5 | 0.5 |
| Phosphate (PO₄³⁻) | mg/L | 0.02 | 0.49 | 0.28 | 0.10 | 0.3 | 0.1 | 0.3 |
| Heavy Metals | ||||||||
| Lead (Pb) | µg/L | 28.85 | 62.72 | 37.00 | 6.56 | 10 | 15 | 10 |
| Cadmium (Cd) | µg/L | 11.00 | 23.94 | 14.74 | 2.91 | 3 | 5 | 10 |
| Zinc (Zn) | µg/L | 82.86 | 160.64 | 103.21 | 16.95 | 3000 | 5000 | – |
| Copper (Cu) | µg/L | 2.1 | 10.28 | 4.79 | 1.66 | 1000 | 1300 | – |
| Microbiological | ||||||||
| Total Coliforms | MPN/100 mL | 260 | 1100 | 793.33 | 340.74 | 0 | 0 | 0 |
| Fecal Coliforms | MPN/100 mL | 0 | 1150 | 291.00 | 292.44 | 0 | 0 | 0 |
| Heterotrophic Plate Count | CFU/100 mL | 150 | 500 | 422.22 | 103.70 | 500 | 500 | 200 |
Dissolved oxygen (DO) concentrations ranged from 6.45 to 10.22 mg/L well above the EPA threshold of 5 mg/L for freshwater ecosystems. Higher DO levels in the lake’s southern basin (Stations 6 and 9) may reflect lower organic loading and recent snowmelt induced mixing. In contrast, DO at Station 8 (downstream of rural settlements) was notably lower, aligning with elevated COD (75 mg/L), and suggesting oxygen consumption by biodegradable organic matter from untreated domestic and livestock waste.
Disclaimer/Publisher’s Note: The statements, opinions and data contained in all publications are solely those of the individual author(s) and contributor(s) and not of MDPI and/or the editor(s). MDPI and/or the editor(s) disclaim responsibility for any injury to people or property resulting from any ideas, methods, instructions or products referred to in the content. |
© 2025 by the authors. Licensee MDPI, Basel, Switzerland. This article is an open access article distributed under the terms and conditions of the Creative Commons Attribution (CC BY) license (http://creativecommons.org/licenses/by/4.0/).
Copyright: This open access article is published under a Creative Commons CC BY 4.0 license, which permit the free download, distribution, and reuse, provided that the author and preprint are cited in any reuse.


