
Submitted:
07 December 2025
Posted:
09 December 2025
You are already at the latest version
Abstract
Building Information Modelling (BIM) has changed the landscape of the architectural, engineering and construction industry in the recent past decades. However, BIM is not well-researched in most of developing countries such as Malawi; few or no studies address BIM adoption in the country. Therefore, this study seeks to examine the status of BIM in the Malawi construction industry through a well-structured survey. A non-probability and purposive sampling were adopted in this study. A total of 265 questionnaires were sent out. A total of 143 questionnaires were filled that is a 54% response rate. The research has revealed that construction experts are aware of BIM though the level of up take is quite low. Architects in Malawi are the most knowledgeable, seconded by land surveyors and then engineers. Similarly, it was revealed that majority of construction experts in Malawi have less than two years’ experience in the use of BIM. And have applied BIM in less than two projects using basic software such as AutoCAD, seconded by Civil 3D. Hence, this is clear evidence that BIM usage is in the initial stage and is just picking up in the country. And the research has shown that the majority of experts in Malawi are on level 1 of BIM usage which is the first stage of BIM adoption and is characterized by use of 3D models and output representation. Therefore, there is need for robust sensitization on the benefits of BIM and the training to improve its uptake in the construction industry in the country.
Keywords:
building information modelling (BIM)
; Malawi
; construction sector
; status
1. Introduction
Building Information Modelling (BIM) has changed the landscape of the architectural, engineering and construction industry in the recent past decades. It has been proven through hundreds of research studies that BIM usage improves services delivery in the industry.
However, the global status of BIM varies from developed to developing countries [1]. Research has shown that there have been great strides in progress and achievements in use of BIM in developed countries than in developing countries [2]. Hence developing countries have to play catch-up to ensure that they can realize the benefits of BIM which have been achieved by their counterparts.
The Gross Domestic Product (GDP) of Malawi was worth 14.08 billion US dollars in 2023 [3]. According to the Malawi National Statistics Office (2022), in 2021 the construction sector contributed approximately 2.3% of the Malawi’s GDP whilst the transport sector contributed 3.1%. This makes Malawi fall into the least developed countries category and requires a lot of effort, input and efficient use of available resources to take the country to another development level. Infrastructure development is a catalyst for economic development of a country and a vibrant construction industry is key to achieve the required economic development. Hence the Malawi Vision 2063 which is the long-term strategic plan for the country has included infrastructure development as an enabler for economic growth of the country [4] However, the strategic plan has also stated some challenges that have constrained progress in infrastructure development, the largest being lack of access to long-term development financing.
On the other hand, the construction industry is also riddled with its own challenges. One of the major challenges is lack of enabling environment for the construction industry players to thrive. According to a study by Kulemeka et al (2015), the small and medium scaled contractors (SMCs) contribute quite a lot in the construction industry in Malawi. Out of the 1,368 small to medium scale contracts outsourced by Roads Authority between 2007/2008 and 2010/2011 financial years (FYs), 1,327 were executed by SMCs. This represents 97% percent of the work implemented in that period. However, these SMCs face challenges like high lending interest regimes offered by financial institutions; stringent conditions to access capital; fluctuation of currency; stringent requirements for obtaining bonds; and high taxes [5]. These challenges affect the capacity and inhibits potential of growth of these SMCs. National Construction Industry Council (NCIC) was established in 1996 to regulate the construction industry in Malawi (Malawi Government 1996). Some of the NCIC mandate is to promote and develop the construction industry in Malawi by giving priority to Malawian firms and to facilitate Malawian firms to have access to resources for the development of their operations. As much as NCIC, through the past two decades has been working towards these mandates, however facilitating Malawian firms to have access to resources has been very alluding. Malawi Roads Authority (2009) mentions that financial restrictions remain the dominant constraint facing local contractors in Malawi and leads to their inability to invest in equipment and the necessary human resources. This was also collaborated by Chilipunde (2010) that access to finance remains a dominant constraint to small-and medium-sized enterprises as they have limited access to capital in Malawi. Therefore, deliberate efforts should be done in capacitating these contractors which are a backbone of the construction industry in the country. A study by Mmadi (2023) stated that the evaluation of the road funding model highlighted a significant perception gap between desired and actual infrastructure quality, with stakeholders rating road conditions as poor. The research projected a substantial funding shortfall of US$3.5 Billion by 2037, equivalent to 28% of Malawi’s GDP, due to growing demand and inadequate financing. Despite efficient revenue collection mechanisms, the model struggled to meet infrastructure development needs [6].
The use of Public-Private Partnerships (PPP) is a still a new concept in Malawi. Malawi’s annual infrastructure funding requirements were pegged at $0.6 billion for the period 2006 – 2015 and face an infrastructure funding deficit of $300 million annually. Its annual capability in meeting this deficit is $175 million from the two largest funding sources thus the public sector and donors [7]. In this case, the use of PPP could bridge the deficit. However, its use is quite limited in infrastructure development and there is no clear understanding or perception of the required PPP enabling environments and framework arrangements to assess risk transfer and Value for Money which is vital in steering successful PPPs and motivate private sector investment [8]. In Malawi, the PPP Act and Policy were established in 2011 and was repealed in 2022 [9]. This Act of Parliament outlines the establishment of the Public-Private Partnerships Commission (PPPC) and its roles in the PPP. However, the achievements of the PPPC have been limited in infrastructure development. The major challenges have been difficulties in securing credits from financial institutions, low political commitment, lack of transparency and competitiveness in the procurement process, and lack of technical and managerial expertise [10]. Therefore, development of such enabling environment and structures is very vital to facilitate the country’s infrastructure development.
At project implementation level, the construction industry has a lot of challenges as well. Some of the major challenges are poor project communication, lack of stakeholder participation, low productivity, and high error and rework rates [11]. According to the road projects data at Roads Authority, the major project implementation challenges are poor quality of work, failure to complete projects on time, and poor tender preparation and estimation [5]. According to Chagunda (2017), the challenges of the Malawian roads sector include: design errors, design changes, delayed site handovers, increased quantities, devaluation of the currency, abnormal rainfall, missing BOQ items, additional work, change of supervision consultant, delayed payment, limited payments, non-availability of fuel, breakdown of plant and vehicles, delayed approval of designs, delayed approval of addendum, non-availability of base gravel, delays in evaluating and agreeing on claims, tendering procedures, contractor’s delays and variations. The challenges result in project delays, poor quality, and cost overrun, affecting the industry’s growth [12].
The other area of concern is slow uptake of the use of sustainable construction practices (SCPs). The Malawi government introduced the National Construction Industry Policy 2015 in line with the establishment of the NCIC Act. The objective of the policy was to ensure a transformed, sustainable, and quality-driven construction industry in Malawi. Therefore, the policy outlined the general guidelines for implementing sustainable practices in infrastructure projects in country. However, the major challenge for low adoption and implementation of the policy has been lack of awareness and knowledge, which has impeded the successful completion of sustainable infrastructure projects [13]. This low adoption and implementation of the policy has resulted in construction of non-climate resilient infrastructure in the country. The poor economic status of the country forces the majority of locals to use mud mortar in place of cement, resulting in weak housing infrastructure that is vulnerable to natural disasters [14]. This highlights a gap between the policy regulations and the successful implementation of sustainable construction practices (SCPs) in the Malawian construction industry. A study by Malik et al (2025) on challenges of implementing sustainable practices is Malawi revealed that higher costs of sustainable building processes, lack of information on sustainable building products, and higher costs of sustainable building materials are the major challenges.
Aggregating all these challenges, it can be observed that a paradigm shift has to happen in the construction industry in Malawi to bring efficiency in the industry. Considering that public resources are limited and project implementation is facing a lot of challenges, the need for innovative, robust and effective project management systems in the construction industry cannot be over emphasized. Therefore, use of tools such as BIM can ensure efficient use of the limited public resources in the sector. Studies have shown that BIM use increases productivity in the construction industry and improves design, construction and maintenance practices [15]. According to McGraw Hill Construction (2012), Architectural, Engineering and Construction (AEC) respondents reported reduced project cost, reduced schedule duration, and increased project profit, as the long-term benefits of BIM use. In a later survey, the majority of AEC professionals (85% and 88%, respectively) identified reduced final cost and completion time as the benefits of BIM utilization on complex projects [15]. Additionally, several studies have indicated that the use of BIM improves effectiveness, efficiency, and quality at the construction task-level as well as contribute to higher quality overall project deliverables [16].
Other literature has also revealed that the BIM process improves the quality of required information for decision-making and risk management practices in projects [17]. Companies that utilize BIM, benefit from gaining a competitive advantage, increasing market access and maintaining repeat business. According to McGraw Hill Construction (2012), use of BIM leads to reduced errors in construction documents, fewer change orders and reduced rework as well as decreased number of claims and litigation. Almost 74% of the AEC professionals reported a 5% decrease in the number of requests for information (RFIs) on projects implementing BIM.
Research by[17] indicated that improved coordination and construction planning, and enhanced exchange of information and knowledge management were some of the major benefits of BIM. Use of BIM also helps with the delivery of sustainable buildings and achieving more energy-efficient design [15]. Construction professionals in the industry use BIM for 3D visualisation, constructability review, clash detection, feasibility analysis, quantity take-off and cost estimate, 4D/scheduling, environmental/LEED analysis, creating shop drawings, and facility management [18,19]. Hence BIM use has a lot advantages to the construction industry.
However, BIM adoption and implementation in Malawi in its infancy. According to [20], BIM is not well-researched in Malawi; few or no studies address BIM adoption and implementation in the country. The limited research which has been carried out on BIM in the country has covered organisational readiness of the Malawian construction industry, critical factors influencing BIM implementation for public projects, challenges related to BIM implementation and drivers for BIM Implementation [10,20]–[22]. Therefore, this study seeks to examine the status of BIM in the Malawi construction industry. The study seeks to understand the level of awareness, skills and use among professionals in the construction industry in the country. The study has used the three BIM Status indexes of “depth of implementation,” “level of proficiency,” and “years of using BIM,” [23]. These indices or variables have been used in a lot of surveys for analysing the engagement level of BIM users.
The findings of the study could provide an indication of the level of skills set in BIM among the construction industry professional in the country and in return offer practical recommendations and strategies for improving BIM adoption and implementation. Furthermore, the study can benefit the Malawian construction industry by assessing how construction professionals could be assisted to utilize innovative tools for improving project efficiency.
2. Literature Review
2.1. Building Information Modelling (BIM)
BIM has evolved a lot over the past decades. In the 1990s and early 2000s, researchers signalled that BIM (although not well defined or widespread at the time) was one of the most promising advances in the construction industry [24]. However, in the last decade, the evolution has been very fast and the impact in the architectural, engineering and construction (AEC) industry has been massive. This is as predicted by Miettinen & Paavola (2014) that BIM would evolve rapidly through conscious experimentation and learning from practitioners. This view suggested that in parallel with the integration of systems, through standardisation and national guidelines and differentiation through the development of competing software platforms, the use and development of BIM would progress at an alarming speed [25]. Over the past decade, interest in BIM has been growing exponentially and BIM shows potential not only in the design and construction of buildings, but also has great potential for integration into infrastructure asset management [24].
BIM maturity refers to the quality, repeatability and degrees of excellence in delivering a BIM-enabled service or product [26]. In the United Kingdom, the government adopted the Bew-Richards model of BIM maturity as a standard for adoption maturity stages [27]. This is a four staged maturity level from 0 to 3. Level 0 involves basic CAD features using only drawings, lines, arcs and text. Level 1 includes some basic 3D elements and beginning of BIM. Level 2 involves collaborative BIM and level 3 is the full integration of BIM in project management [28,29]. These BIM maturity stages enable construction industry stakeholders fully understand the development of BIM use from basic level to an advanced level of use.
BIM adoption has been varying from country to country even in the developed countries. From various studies by McGraw Hill Construction (2014, 2019), the adoption level of BIM is quite high in developed countries than developing countries. However, the early adopter include United States of America, United Kingdom, Finland, Norway, Denmark, Hongkong, Australia and Singapore [30]. Prinslooo & Bekker (2025) opined that the three largest construction industries in the world, China, the United States and India, utilize BIM on all public infrastructure projects, due to the multitude of benefits of its adoption and implementation most of which result in cost savings. As stated by Olugboyega & Windapo (2021), although BIM implementation and BIM adoption are interrelated and usually used interchangeably, however both have different meanings, taxonomy, and thresholds. While BIM implementation seeks BIM use through legislation and policies, BIM adoption, on the other hand, is concerned with BIM usage or explorations through expertise and applications [31,32]. Therefore, it has been observed that BIM adoption is easier in the private sector, thus consultants and contractors due to their quest for efficient ways of managing projects so that they can cut costs and maximise profits [20]. Nevertheless, for proper and systematic use of BIM, then policies and legislation are very important for sustainability. In order to understand the process taken by the early adopter countries, a review of each country has been done as outlined in the paragraphs below.
The United States of America (USA) is believed to be one of the forerunner countries for BIM adoption. Therefore, many public sector bodies at different levels in the USA have established BIM programs, set up BIM goals and implementation roadmaps, and published BIM standards [33]. In 2007, for example, the United States National Institute for Building Sciences (NIBS) published the National Building Information Modelling Standard (NBIMS-USTM). And in the same year, the assessment of BIM adoption was carried out in North America which was quite low. However, after the production of the standards, the adoption rate surged quite a lot. According to McGraw-Hill (2012), adoption of BIM surged from 28% in 2007 to 71% in 2012 in North America.
On the other hand, the United Kingdom (UK) is one of the early adopter of BIM through various initiatives in construction management information. The UK government produced a blue print paper, the Government Construction Strategy (GCS) in May 2011 whose purpose was to minimise public projects costs by 15% to 20% by year 2015 [27]. This paper also mandated use of level 2 BIM for all public projects by 2016 [27]. The BIM Working Group also recommended several strategies in support of the government plan. Due to these initiatives, the UK government adopted the BIM development four staged maturity levels which were developed by Richards & Bew (2008). These various initiatives and mandates enabled UK construction industry to embrace use of BIM at a fast pace. The BIM adoption rate in the UK steadily increased from 31.0% in 2010 to 54.0% in 2013 and 80% in 2019 [30,34]. Standards developed in the United Kingdom from 2007 onwards have formed the basis of international standard ISO 19650, launched in January 2019 [35].
Denmark mandated the use of BIM technology in all government funded projects in 2007. Therefore, all players in the public sector projects were required to follow new methods, digital routines and tools [36]. Additionally, the Danish Enterprise and Construction Authority introduced a series of guidelines associated with 3D through its Digital Construction Program. This was done to meet the specifications in file and database based CAD/BIM applications such as 3D Working Methods and Layer, 3D CAD Manual 2006, Object Structures 2006 and 3D Working Method [36]. Hence, federal organisation, municipalities, universities and some private agencies started implementing BIM. Then in June 2011, the Danish Parliament mandated that all local and regional projects valued over Euro2.7 million use BIM and this created a major impact across the whole nation [34].
In Singapore, BIM adoption was facilitated by Government initiative. In 2008, the Government of Singapore introduced the world’s first BIM electronic submission of projects [34]. And as a follow up, the Building and Construction Authority (BCA) implemented the BIM Roadmap in 2011 with a few strategies that had been identified to mandate the use of BIM in all public projects by 2015. Hence all public sector organisations introduced BIM requirements for all new public sector building projects started in 2012. In the same year, the Singapore BIM Guide version 1.0 was published in order to give clarity on the requirements of BIM usage at different project levels. And version 2 was released in 2013 which was aimed encouraging BIM adoption [37].
In Finland, the use of BIM was initiated by a government owned enterprise, Senate Properties. From year 2001, Senate Properties implemented a few pilot projects to establish and explore the use of BIM [34]. In 2007, Senate Properties published BIM Requirements which was the first global effort to use IFC-based BIM to cover all design domains of construction [34]. Additionally, Senate Properties and BuildingSMART Finland developed a series called “Common BIM Requirements 2007” in 2012. These are thirteen series of guidelines covering BIM 3D to 8D[38].
The Norwegian Agency of Public Construction and Property (the Statsbygg) is the major AEC/FM sector client in Norway. The Statsbygg was tasked by the Norwegian Parliament to improve efficiency in the construction sector by formulating and engaging in research and development projects leading to process simplification and more efficient utilisation of ICT tools in the sector [34]. Hence Statsbygg initiated the use of BIM and implemented a BIM pilot project in Northern Norway in 2003 [34]. Thereafter, in May 2007 Statsbygg announced the use of digital BIM for all Statsgygg’s buildings, throughout their entire lifespan. In the following year, Statsgygg produced BIM Manual version 1 in order to deal with the BIM and IFC format adoption [39]. The manual has been upgraded in due course and improvements have been done in the system for preparing, submitting and handling electronic planning proposals and planning applications [40]. Similarly to all early adopters, adoption of BIM in Norway was Government driven.
The Hong Kong Housing Authority started using BIM on trial in a few public rental housing projects in year 2006. The Housing Authority had set a target of year 2014 or 2015 for full implementation of BIM [36]. Additionally, the Housing Authority established a BIM Centre and published BIM Standard manuals, User Guides and Library for ease of BIM implementation [41]. On the other hand, the Hong Long Institute of Building Information Modelling (HKIBIM) was established and it was the first professional institute in the world for promotion and facilitating BIM application [36]. The role of HKIBIM was for creating communication channel and coordinating BIM implementation among stakeholder [41].
In Australia, the government commissioned a national BIM initiative in 2012 and recommended use of 3D collaborative BIM in all public building projects by 2016 [42]. However, nothing much happened from the initiative apart from some projects adopting use BIM. It was observed that one of the possible reason or failure of uptake was isolated and inconsistent work of different states. This uncoordinated effort among states made it difficult to establish a national mandate. Hence, the Parliament of the Commonwealth of Australia released a smart ICT report, recommending mandating BIM on all government infrastructure projects costing over $50 million [43]. Although the general progress of BIM adoption was still slow, but some states such as Queensland took a proactive approach. In 2017, Queensland government drafted some policies and principles on mandating BIM and released a guideline to enable BIM on road projects. In the next year, Queensland government announced the policy to mandate BIM on all government construction projects costing over $50 million and this requirement would be expanded to all built assets by 2023 [44]. Hence this enabled BIM usage to spur in Australia as well.
The most common denominator of early BIM adopters was the quest to improve efficiency of the construction sector. Therefore, this led to the relevant agencies in those countries seek innovative methods hence adopting use of BIM. Once the piloting of BIM had produced positive results, then the governments-initiated production of guidelines and mandates with defined timelines to adopt BIM in the whole construction sector. This in turn resulted in exponential growth and adoption of BIM. Apart from early adopters, most developed countries have a higher adoption rate of above 70% (see Table 2.1).

Table 2.1.
BIM Adoption Rate of Developed Countries.
| ▪ Country | BIM Adoption | Year | Reference |
|---|---|---|---|
| ▪ UK | 70% | 2019 | [33,35,45] |
| ▪ Brazil | 72% | 2015 | [46,47] |
| ▪ Germany | 71% | 2015 | [23,45,48] |
| ▪ France | 70% | 2015 | [23,47] |
| ▪ Canada | 70% | 2016 | [33,35,45] |
| ▪ New Zealand | 80% | 2019 | [49,50] |
| ▪ Australia | 80% | 2019 | [44,49,51] |
| ▪ China | 82% | 2016 | [35,52] |
| ▪ Denmark | 80% | 2016 | [33,45,48] |
On the other hand, BIM adoption and implementation in Africa is slow and lagging that of developed countries [2]. According to a study by Saka & Chan (2019), the first publication in Africa on BIM was in 2010. Interestingly, the number of annual publications had gone up to 28 by 2018, showing similar pattern with the global growth in BIM publication. The distribution of papers across the African continent varies, with the North having the highest number of publications of 52 from three major countries of Egypt, Morrocco and Algeria, followed by the West with 26 from three major countries of Nigeria, Ghana, Cote d’voire and the South with 13 from two major countries of South Africa and Zambia, and lastly the Central, with 2 from Cameron and the Central African Republic [2]. The high number of BIM publications from Egypt, Nigeria, and South Africa equally matches with the high level of awareness in in these countries as well [2].
The awareness level has been growing in Africa although does not directly translate to implementation. In Sub Saharan Africa , a study in Kenya in year 2018, indicated an awareness level of 88.7% amongst its construction sector professions [53]. This is quite high compared to a lot of developing countries. Whilst in Nigeria, a similar study revealed that BIM awareness rate was at 84% in year 2021, compare to 30% which was reported by another study in year 2015 [54]; [55]. In South Africa, BIM awareness level has also been increasing from 44% in 2014 to 91% in 2024 [30]. The general consensus among researchers is that BIM awareness is increasing in the construction industry due to the tangible positive contribution it is providing.
Research has revealed that knowledge of BIM benefits influences construction industry practitioners to foster BIM implementation [56]. Therefore, various BIM implementation benefits in construction projects have been identified and classified by numerous researchers from various countries. According to Chan et al (2019), factors such as better cost estimates and control, better understanding of design, and reduction in construction cost, are the three most significant benefits of BIM implementation in Hong Kong. A research carried out in Malaysia identified top five benefits of implementation of BIM as increasing productivity and efficiency; assessing time and cost associated with design change; eliminating clashes in design; improving multiparty communication and maintain synchronized communication; and integrating construction scheduling and planning [56]. In Nigeria, the top five identified benefits were facilities management; health and safety; energy management; time saving; and better coordination [57]. Whilst a study carried out in Austria highlighted cost saving; time saving; improved team work; improved data management; and improved understanding of project as the top five benefits [58]. Earlier study in the UK, indicated the top five benefits as: cost reduction or control; time reduction or control; communication improvement; coordination improvement; and quality increase or control [16]. Hence the benefits of BIM implementation are quite varied but very important in project management.
According to the M8/M73/M74 Motorway Improvements Project, there were several other benefits that accrued from the adoption of BIM in this project. The main benefits can be classified in the following categories: improved coordination, faster and easier clash detection; and substantial efficiency gains in design change management. There was evidence of other intangible benefits as well. For example, the use of 4D and 5D models helped optimize construction programming besides being a powerful visualization & communication tool which enabled the identification of problems in advance of construction and also helped extract material quantities much more efficiently [59,60] Research specific to less complex building projects seems to be limited. Won and Lee (2016), conducted a case study of pre-cast parking garage structures on which BIM was used for designing and review, 3D design coordination, phase planning, quantity take-off, and construction system design. BIM use on this project resulted in the improved communication, work efficiency, technological capability, and in equipping personnel with advanced BIM skills. Hence, it can be observed that use of BIM in both complex and simple projects assist to achieve project efficiency. Table 2.2 provides the most significant benefits of BIM implementation in construction projects reported various studies.
Research has shown that a lot of countries in the infant stage of BIM adoption use basic software. This is due to the fact that once an organisation starts using BIM, gradual acquisition of relevant software is done on need bases. The first stage is to improve the data management from the traditional method to 3D production of output. Then the other BIM stages are implemented in due course of the technology use. The traditional software mostly used in AutoCAD and Revit for production of bill of quantities [89]. The other software used mainly in road design is Civil Designer [90].
3. Methodology
The study was carried out in Malawi, one of the developing economies in Africa. The structured questionnaire was used to collect data. A non-probability sampling approach was adopted and purposive sampling was considered more applicable to this study. In this case, the Malawian construction industry professional stakeholders were earmarked for the survey. The list of potential informants was collected from the professional bodies of architects, quantity surveyors, land surveyors and engineers. The e-questionnaire was used to facilitate data collection and management.
A total of 265 questionnaires were sent out to active construction professionals. Considering a confidence level of 95%, the sample size was estimated using formula in equation 1 according to Yamane (1973):
Equation 1:
n = N = 265 = 159
(1+N(e2)) (1+265 x (0.052))
Where n = sample size; N = population size; e = margin of error.
The ideal calculated sample size for this study from the above calculation was 159 completed questionnaires. This aimed at adequately representing the population of active construction professionals in Malawi. A total of 143 questionnaires were filled, representing 54% response rate.
The ideal sample size could not be achieved due to a number of reasons. Firstly, some respondents were not willing to participate. Secondly, logistical constraints affected the number of respondents as this was a self-administered questionnaire, following up of respondents was not easy. And finally, time constraint affected the responses since the study had to be concluded in a specific period. Hence a total number of respondents was 143. Despite falling short of the initial target, recent literature supports that a sample size of 143 can still yield statistically significant results in survey research. This sample size aligns with findings from Bagozzi and Yi (2012) and Xiong et al. (2015), who indicate that while larger samples enhance precision, samples between 100 and 200 remain sufficiently reliable for drawing meaningful conclusions. Furthermore, Kotrlik and Higgins (2001) states that studies which use factor analysis require a minimum of 100 observations. Additionally, Sataloff and Vontela (2021) states that response rates between 40% and 75% are adequate for such research. Moser and Kalton (1999) asserts that a study can only be considered biased if the response rate is below 30%. In this study, the response rate was 54%. Hence, this validates the robustness of the sample use in this study and ensures the validity and relevance of the findings.
The respondents were construction experts covering architects, engineers, land surveyors and quantity surveyors. In percentage terms, 17% of the respondents were architects, 55% were engineers, 17% were land surveyors and 12% were quantity surveyors.
Table 3.1.
shows the profile of respondents.
| ▪ | Architects | Engineers | Land Surveyors | Quantity Surveyors | Total |
|---|---|---|---|---|---|
| ▪ No. | 24 | 78 | 24 | 17 | 143 |
| ▪ %age | 16.8 | 54.5 | 16.8 | 11.9 | 100 |
The questionnaire had two main parts. The first was general profile of the respondents. The second was awareness and use of BIM technology. In the first part of profile of respondents, six questions were prepared asking for information about organization such as the name of organization, profession, the contact person and his/her experience, and date of responding. The second part of the questionnaire covered questions concerning BIM technology. The questions ranged from awareness of BIM, level of usage, adoption factors, benefits, software usage, capabilities and general comments.
A total of six questions on status and use of BIM were used to check the status of BIM among professionals in Malawi. The first area of survey was awareness of BIM by the professionals. The aim was to assess the awareness level of the professional about BIM technology. As stated by Kolatic et al (2019), BIM awareness is a good incentive for further BIM implementation. On the other hand, the lack of awareness is the reason for the slow adoption and implementation of BIM technology Al-Ashmori et al (2020). Awareness has raised a non-exhaustive list of challenges to the BIM adoption and implementation such as; trusting new technology, building BIM skills, proper BIM-based tools selection, understanding the BIM project scope, and handling contracts Al-Ashmori et al (2020). Therefore, increasing awareness will help overcome challenges affecting BIM adoption and implementation and consequently benefiting from this technology. Hence, the knowledge of awareness level assists authorities strategize on BIM uptake in the construction industry.
The second area of the survey was years of use of BIM. The survey checked with professionals on how many years they have used BIM technology in their practice. The duration of using BIM technology can be used to decipher the competency of the professional in using BIM. As stated by Succar et al (2013), core competencies reflect the personal abilities of individuals enabling them to conduct a measurable activity or deliver a measurable outcome in use of BIM. These abilities can be acquired or improved through practice, education, training and/or development. BIM years of experience is a significant factor in realising the potential benefits of BIM [91]. Hence the more the number of years of use of BIM enable the practioners recognise a lot more benefits of use of the technology.
The third area was projects done using BIM. The number of projects carried out using BIM is linked to BIM skills of the professional or institution [92]. Therefore, this variable indicates that the experience gained by repetitive activities sharpens the skills of professionals and these skills are reflected by improvements in succeeding projects.
The other area was software used for BIM. On the software market, there are hundreds of software which are used in the construction industry. However, the implementation processes of BIM moves away from using conventional Computer Aided Drafting (CAD) into the use of common standards and object orientated representations [93]. This is accomplished by making a single and centralised 3D digital model as a primary tool for production of a more increasing documentation requirement, such as schedules, plans and bills of quantities [94]. Choice of software depends on so many things such as exposure, interoperability, workability, availability and so many other factors. Therefore, common BIM software used varies from architects, engineers and quantity surveyors. Autodesk Revit, Civil 3D and SRT Vision CPM are the most common types of software for architects, engineers and quantity surveyors respectively for the BIM works to achieve interoperability [95]. Hence the type of software used can show the advancement level in use of BIM.
Then the level of use of BIM. This was based on the maturity level of use of BIM. Generally, the characteristics of the output of BIM use shows the level at which the technology is being used. The results could be a different nth dimension. Hence the respondents were asked to indicate their level of use of BIM which would also be used to check their knowledge level in BIM maturity.
The last area was awareness of BIM benefits. The awareness of BIM benefits drives adoption of BIM. Two methods of systematic literature review and meta-analysis were used to come up with list of relevant BIM benefits for this paper. In the literature review, inclusions and exclusion criteria was used which considered empirical papers, quantitative studies, published in peer reviewed journals, with sufficient statistical and in English language. The search was conducted across four major databases: Web of Science (WoS), Scopus, Emerald Insight, and Taylor & Francis. The strategy employed a combination of keywords, Boolean operators, and wildcards to create distinct search concepts, which were then combined to narrow down the results. The key words used in the search were ‘BIM benefit awareness,’ ‘intention to use BIM,’ and ‘BIM use behavior.’ In addition to these, 32 studies were found through citations and a general Google search. A total of 787 studies were found. Following the de-duplication process, the researchers were left with 609 studies. A total of 114 studies were excluded because they were not published in open-access journals, and 495 studies were retained. Title and abstract screening eliminated 297 studies, retaining 198 studies. Detailed screening removed 121 studies for lack of relevance to the study’s purpose, retaining 77 studies. Following quality screening and reporting format of results, 69 studies were removed, leaving 8 studies, from which data were extracted. Then, the meta-analysis, was conducted on synthesis of data from studies that may have used different terminologies for similar constructs. Therefore, a careful operationalization process was undertaken to map the measures from the included studies to the core constructs of the meta-analysis: "Performance Expectancy" and "BIM Adoption." This mapping was based on the conceptual definitions of the constructs as measured in the original studies. All statistical analyses were conducted using Jamovi software (version 2.6.44) with the metafor package. Raw statistical data (e.g., correlation coefficients) from each study were converted into Fisher’s Z-transformed effect sizes to stabilize variance before pooling. A random-effects model was employed to calculate the combined effect size, accounting for both within-study and between-study variance. Heterogeneity was assessed using the I2 and Q statistics. Publication bias was evaluated using funnel plots and Egger’s regression test. The relationships between performance expectancy and intention to use, and intention to use and BIM adoption, were synthesized through meta-regression models where the intercept represented the overall combined effect size. A p-value of less than 0.05 was considered statistically significant.
And lastly, the list of benefits of BIM from the literature review were used in the questionnaire survey. A total of 25 benefits were identified [60,96]–[101]. These identified benefits were categorised into two major categories of “Functional Enhancement” and “Output Improvement.” The list of benefits were rated according to their importance. The respondents, based on their experience, they evaluated the degree of BIM benefits importance in construction projects following a 5-point Likert scale (i.e., 1 — least important, 2 — small importance, 3 — average importance, 4 — moderate importance, 5 — most important).
After collecting the raw data of questionnaire, the data was analysed using Statistical Package for the Social Sciences (SPSS) version 29.0 program. Before the analysis, the data was cleaned and coded using Microsoft Excel. Descriptive analysis (mean item score), median, and standard deviation were performed. Descriptive analysis was used to present the participants’ demographics and rank the variables which were in the study. The reliability of the survey instrument was tested using Cronbach’s Alpha [102]. The analysis yielded a coefficient of above 0.70 indicating high internal consistency among the variables under study [103]. The software does not only assist in managing large volumes of data: it also assists with transparency, reliability, and validation of data [104]. The software platform provided a systematic way to organise and interrogate both quantitative and qualitative data from different sources. This allowed the current study to create different folders for the data.
The data analysis covered both qualitative and quantitative data. The purpose of data analysis is to provide information about variables and the relationship between or among them. Data may be regarded as raw facts and figures. In order to turn it to information which can be used by a decision marker, then it has to be analysed and put it in a format of use which can be understood. Hence, the purpose of data analysis is to provide evidence of relationship and to aid understanding to support decision making [105].
4. Results
4.1. Awareness of BIM
The results of awareness level of the professionals about BIM technology are presented in Table 4.1.
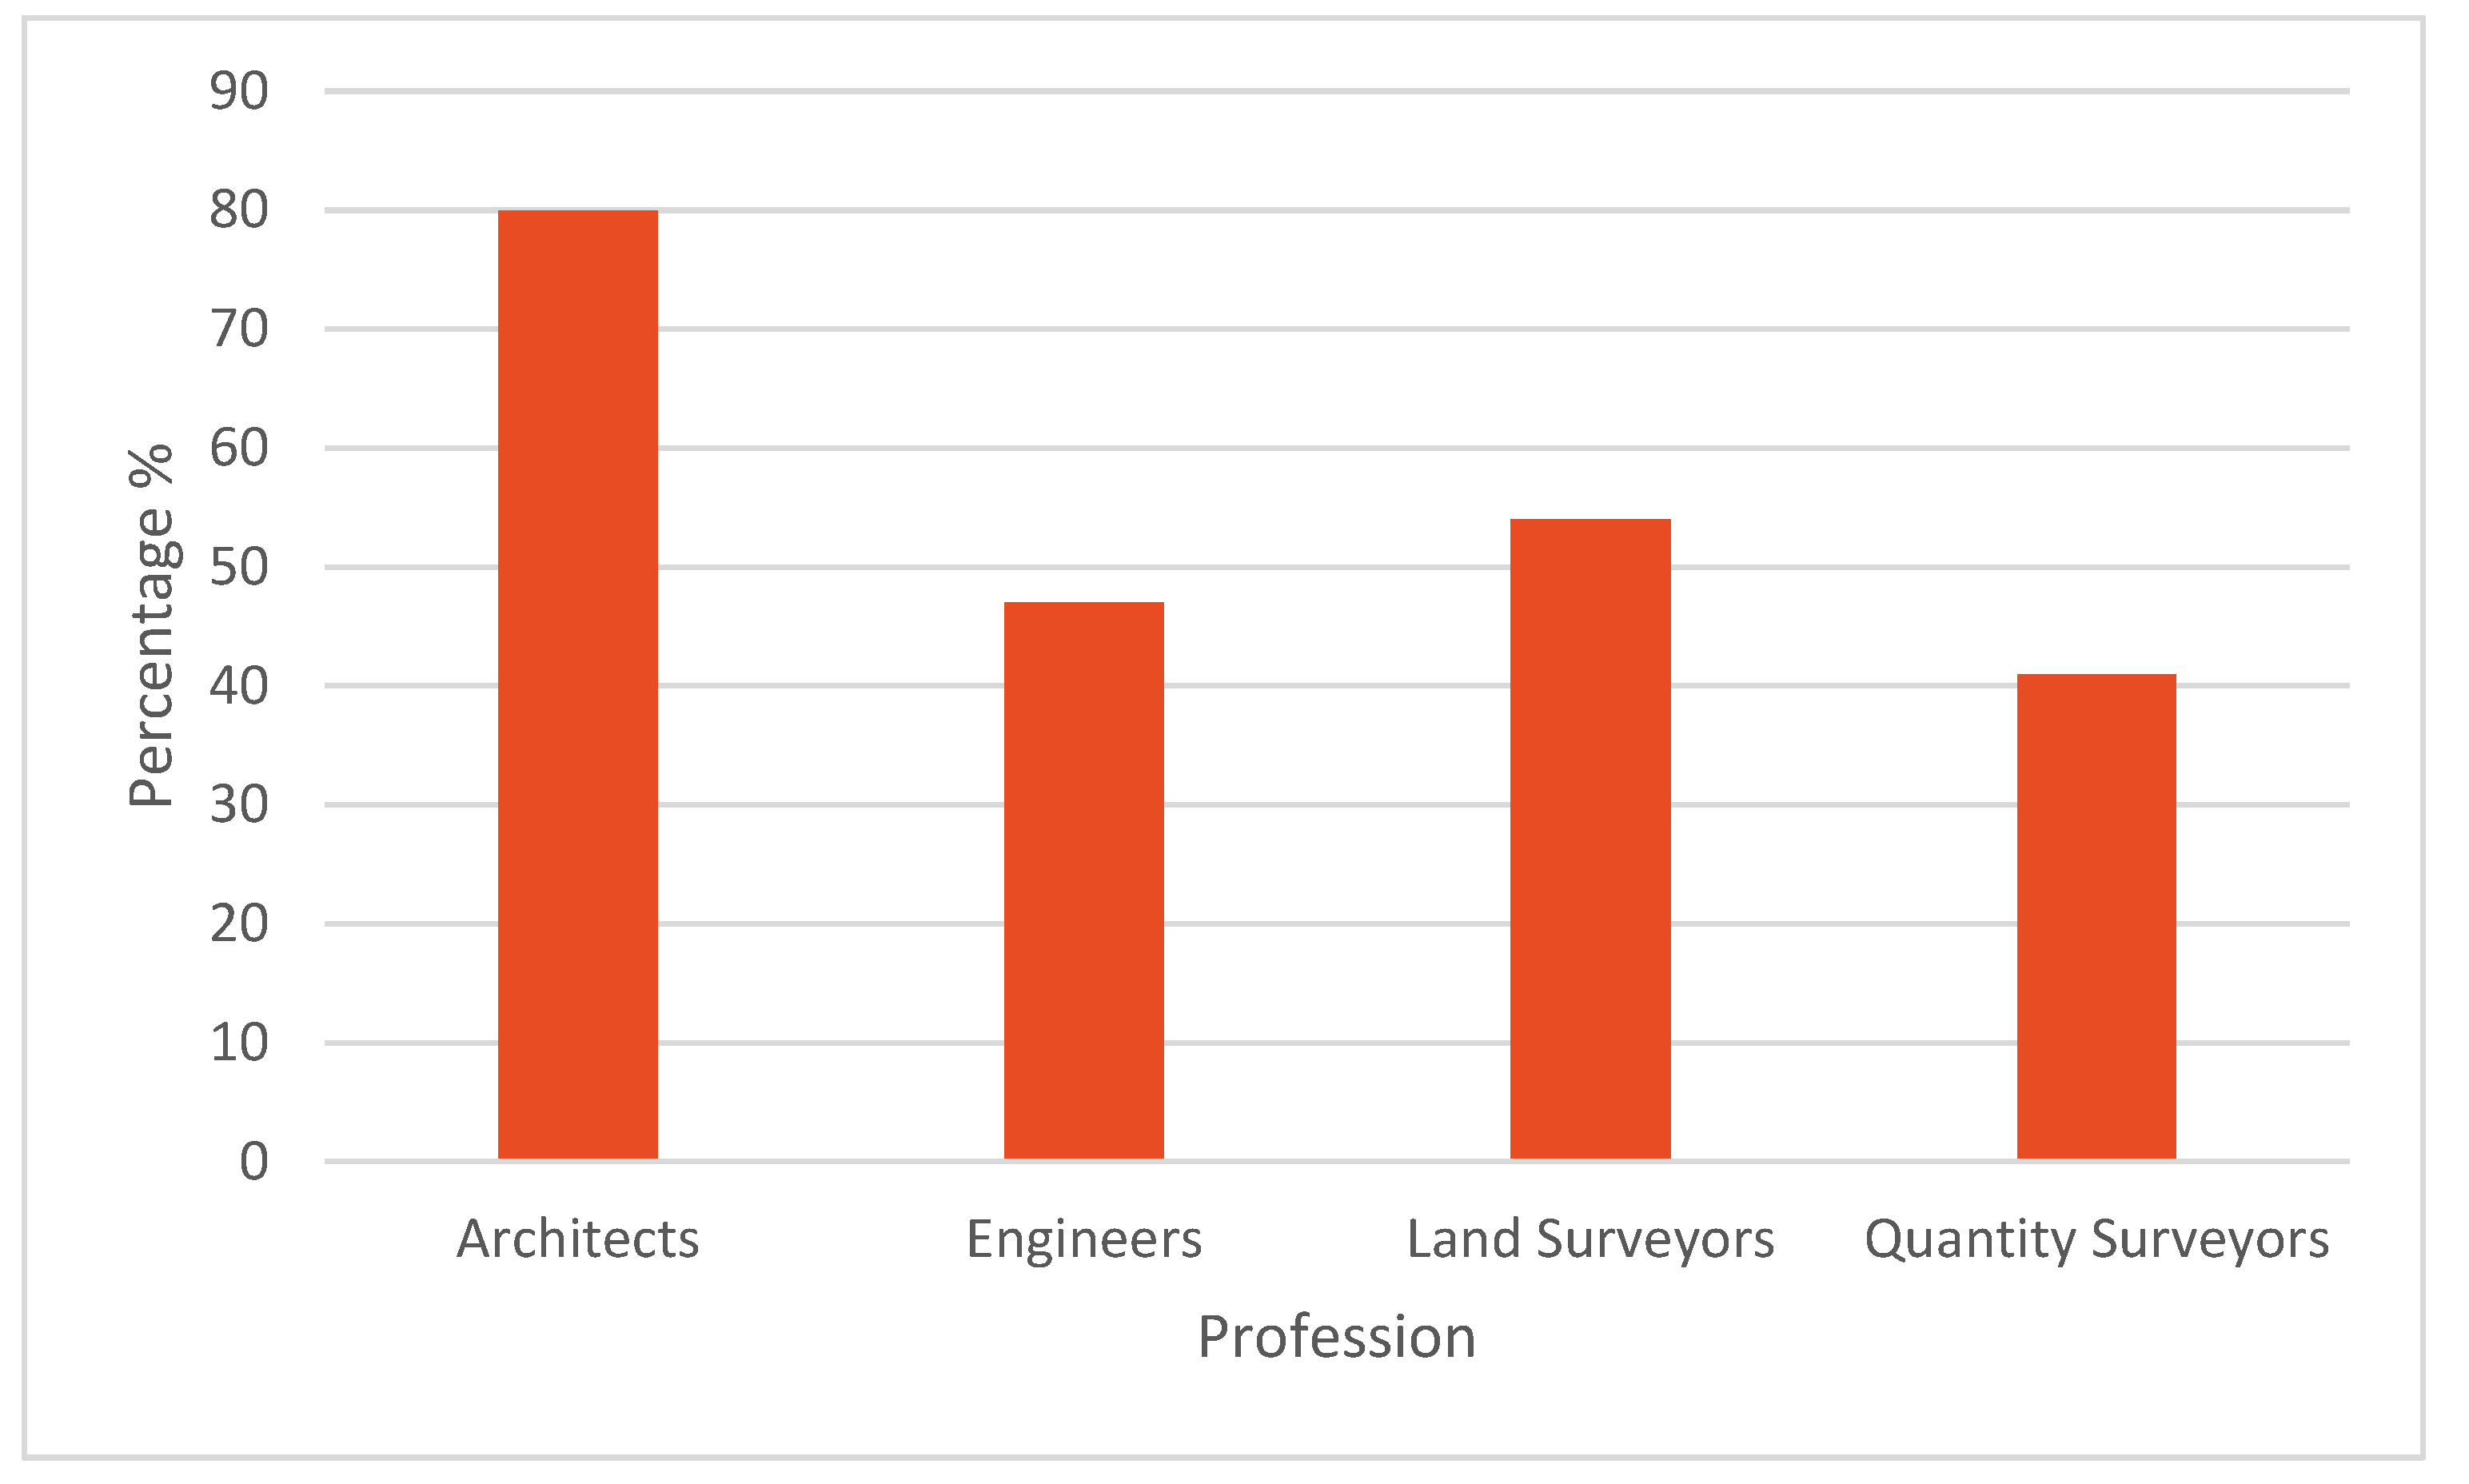
From Table 4.1 above, the results show that 52.4% of the sample were aware of BIM. However, 47.6% were not aware of the existence of BIM. Therefore, the results were further segregated into professional level. Amongst the professionals, about 80% of architects are aware of BIM, followed by land surveyors at 54%, engineers at 47% and quantity surveyors at 41%. This could be attributed to the fact that BIM was initially very prominent in the building sector before it was introduced to the other sectors [81,106]. It is evident that architects have been using BIM for a long time than the other professional groups, resulting in the high awareness level in this professional group. Figure 4.1 shows the results according to professional groups of the respondents.
Figure 4.1.
BIM Awareness as per professional groups.
Comparing with other countries in the region, Kenya indicate an awareness level of 88.7% amongst its construction sector professions [53]. Whilst in Nigeria, a similar study revealed that BIM awareness rate was increasing and was at 84% [54] compare to 30% which was reported by another study [55]. In South Africa, the awareness level of BIM has also been increasing from 44% in 2014 to 91% in 2024 [30]. [106]. Considering awareness levels in other African countries, Malawi’s current awareness level of 52.4% seems to be on the lower side comparing with other countries in Sub Sahara Africa. This shows that Malawi is lagging behind in the knowledge of BIM in the region. As stated by Gamil & Rahman (2019), proper introduction guidelines and promotion of BIM technology enhances BIM awareness. However, these two have never taken place in Malawi and BIM approach is yet to be institutionalised in the Country. Hence, BIM awareness and use is basically still a personal initiative.
4.3. Years of Use of BIM
Years of use of BIM is another variable for measurement of BIM competency. Table 4.2 shows the survey results of this variable.
Table 4.2.
Years of use of BIM.
| Frequency | Percent | Valid Percent | Cumulative Percent | ||
| Valid | Less than 2 years | 34 | 23.8 | 45.3 | 45.3 |
| Between 2 and 5 years | 17 | 11.9 | 22.7 | 68.0 | |
| Between 6 and 8 years | 8 | 5.6 | 10.7 | 78.7 | |
| Between 9 and 12 years | 7 | 4.9 | 9.3 | 88.0 | |
| Over 12 years | 9 | 6.3 | 12.0 | 100.0 | |
| Total | 75 | 52.4 | 100.0 | ||
| Missing | 68 | 47.6 | |||
| Total | 143 | 100.0 | |||
The results in Table 4.2 shows that 45.3 % of the respondents have used BIM less than two years whilst 22.7% have used BIM between 2 and 5 years. only 10.7% of the respondents have used BIM for the period between 6 and 8 years and, only 9.3% have used it for 9 to 12 years. Finally, 12% of the respondents have used BIM for over 12 years. Therefore, the results show that the majority of the professionals totalling to 68% have used BIM in less than 5 years. This implies that the use of BIM by the professionals is in its infancy in Malawi. Hence it requires a lot of sensitisation to increase the uptake in use of BIM among the construction profession.
Further analysis of the results was done to segregate various professions and Figure 4.2 shows the period of BIM usage by various professions.
Figure 4.2.
Duration of use of BIM according to Profession.
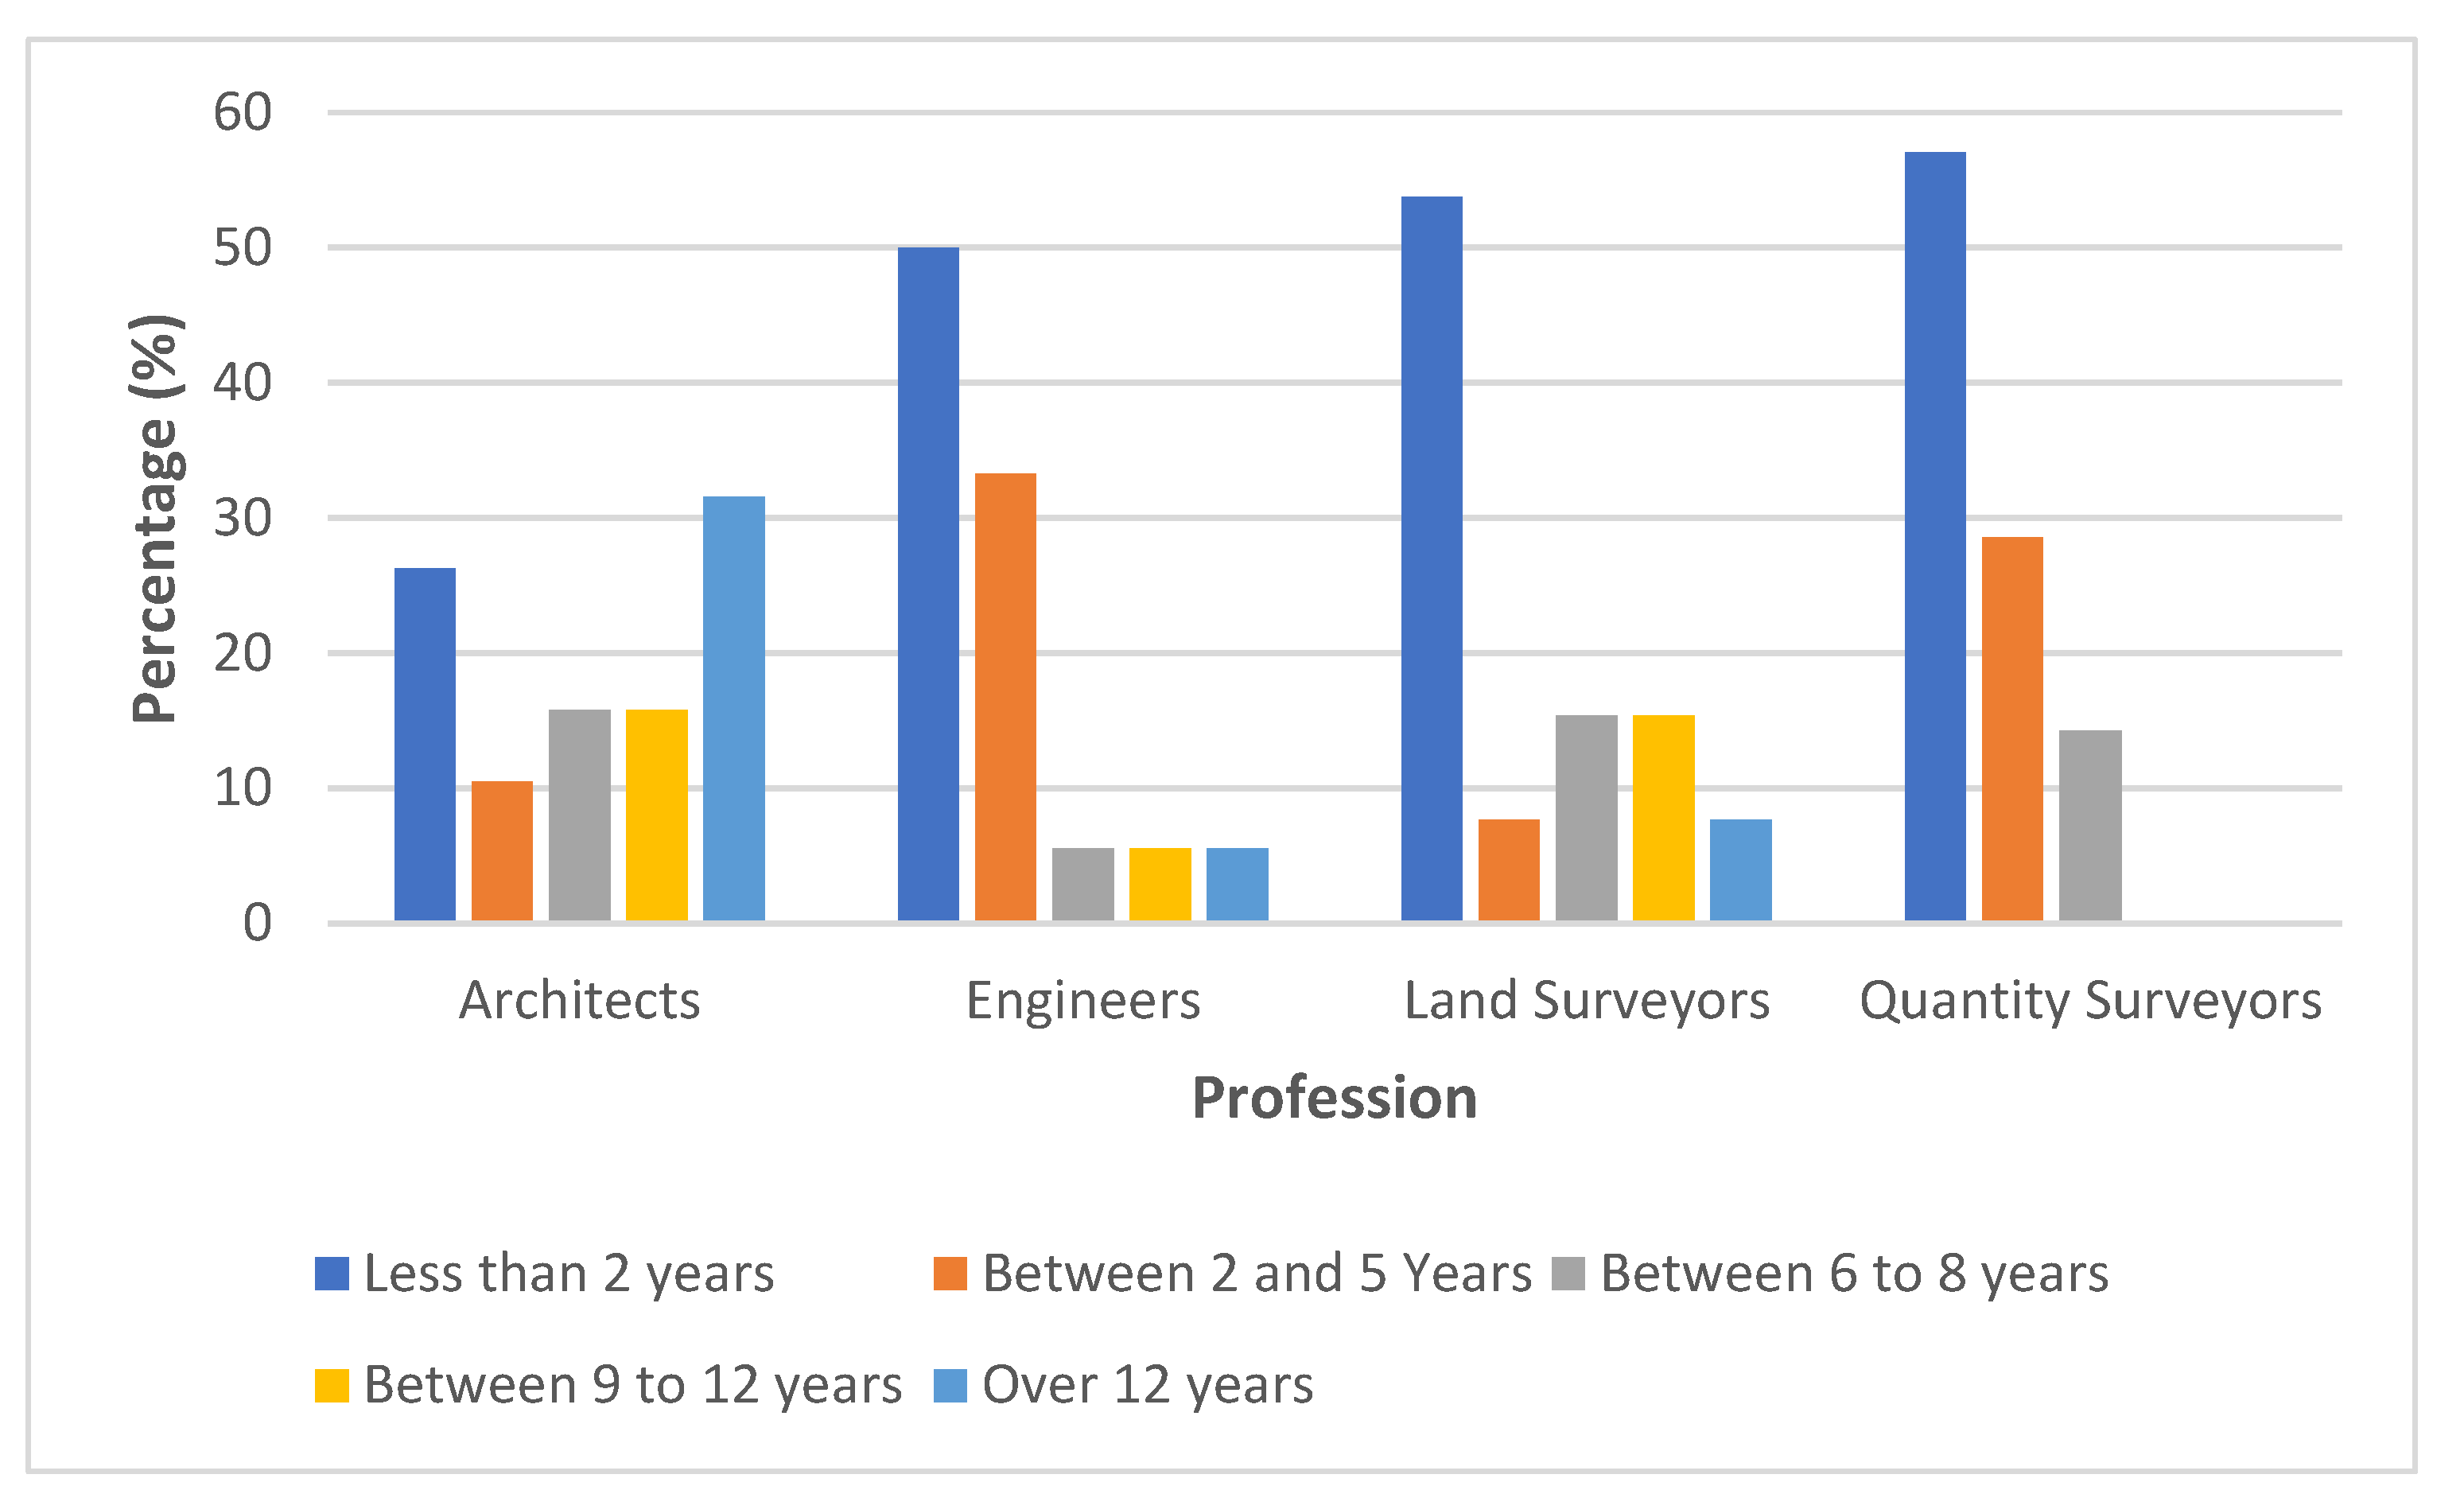
It is evident in Figure 4.2 that the architects have the highest percentage of BIM usage for over 12 years with 32%. This is followed by land surveyors with 7%, and engineers with 5% and lastly quantity surveyors with 0%. On the other end, considering use of BIM for less than 2 years, Quantity Surveyors are highest with 58% of the respondents, seconded by Land Surveyors with 53%, thirdly engineers with 50% and architects with 27%. In comparison, the results show strong correlation between awareness level and period of BIM usage . The higher the awareness level, the higher the use by that professional group. In this case the architects are leading the pack of the profession due to the genesis of BIM which is in buildings sector [106]. The graph for architects shows small variance in number of years of use than the other professions which is evidence of consistent knowledge level within the profession.
4.3. Number of Projects Done Using BIM
The number of projects done using BIM is an indicator of competency level for a user. Table 4.3 presents results on number of projects done using BIM.
Table 4.3.
Number of Projects Undertaken using BIM.
| Frequency | Percent | Valid Percent | Cumulative Percent | ||
|---|---|---|---|---|---|
| Valid | Less than 2 projects | 39 | 27.3 | 52.0 | 52.0 |
| Between 2 and 5 projects | 15 | 10.5 | 20.0 | 72.0 | |
| Between 6 and 8 projects | 4 | 2.8 | 5.3 | 77.3 | |
| Between 9 and 12 projects | 2 | 1.4 | 2.7 | 80.0 | |
| Over 12 projects | 15 | 10.5 | 20.0 | 100.0 | |
| Total | 75 | 52.4 | 100.0 | ||
| Missing | 68 | 47.6 | |||
| Total | 143 | 100.0 | |||
From Table 4.3 above, the results show that 52% of the respondents have done less than two projects using BIM, and 20% of respondents have done between two and five projects. This shows that 70% of the respondents have done less than five projects using BIM. This agrees with the number of years which respondents have used BIM as shown in section 4.3 above. Furthermore, it was observed that 20% of the respondents have done more than 12 projects.
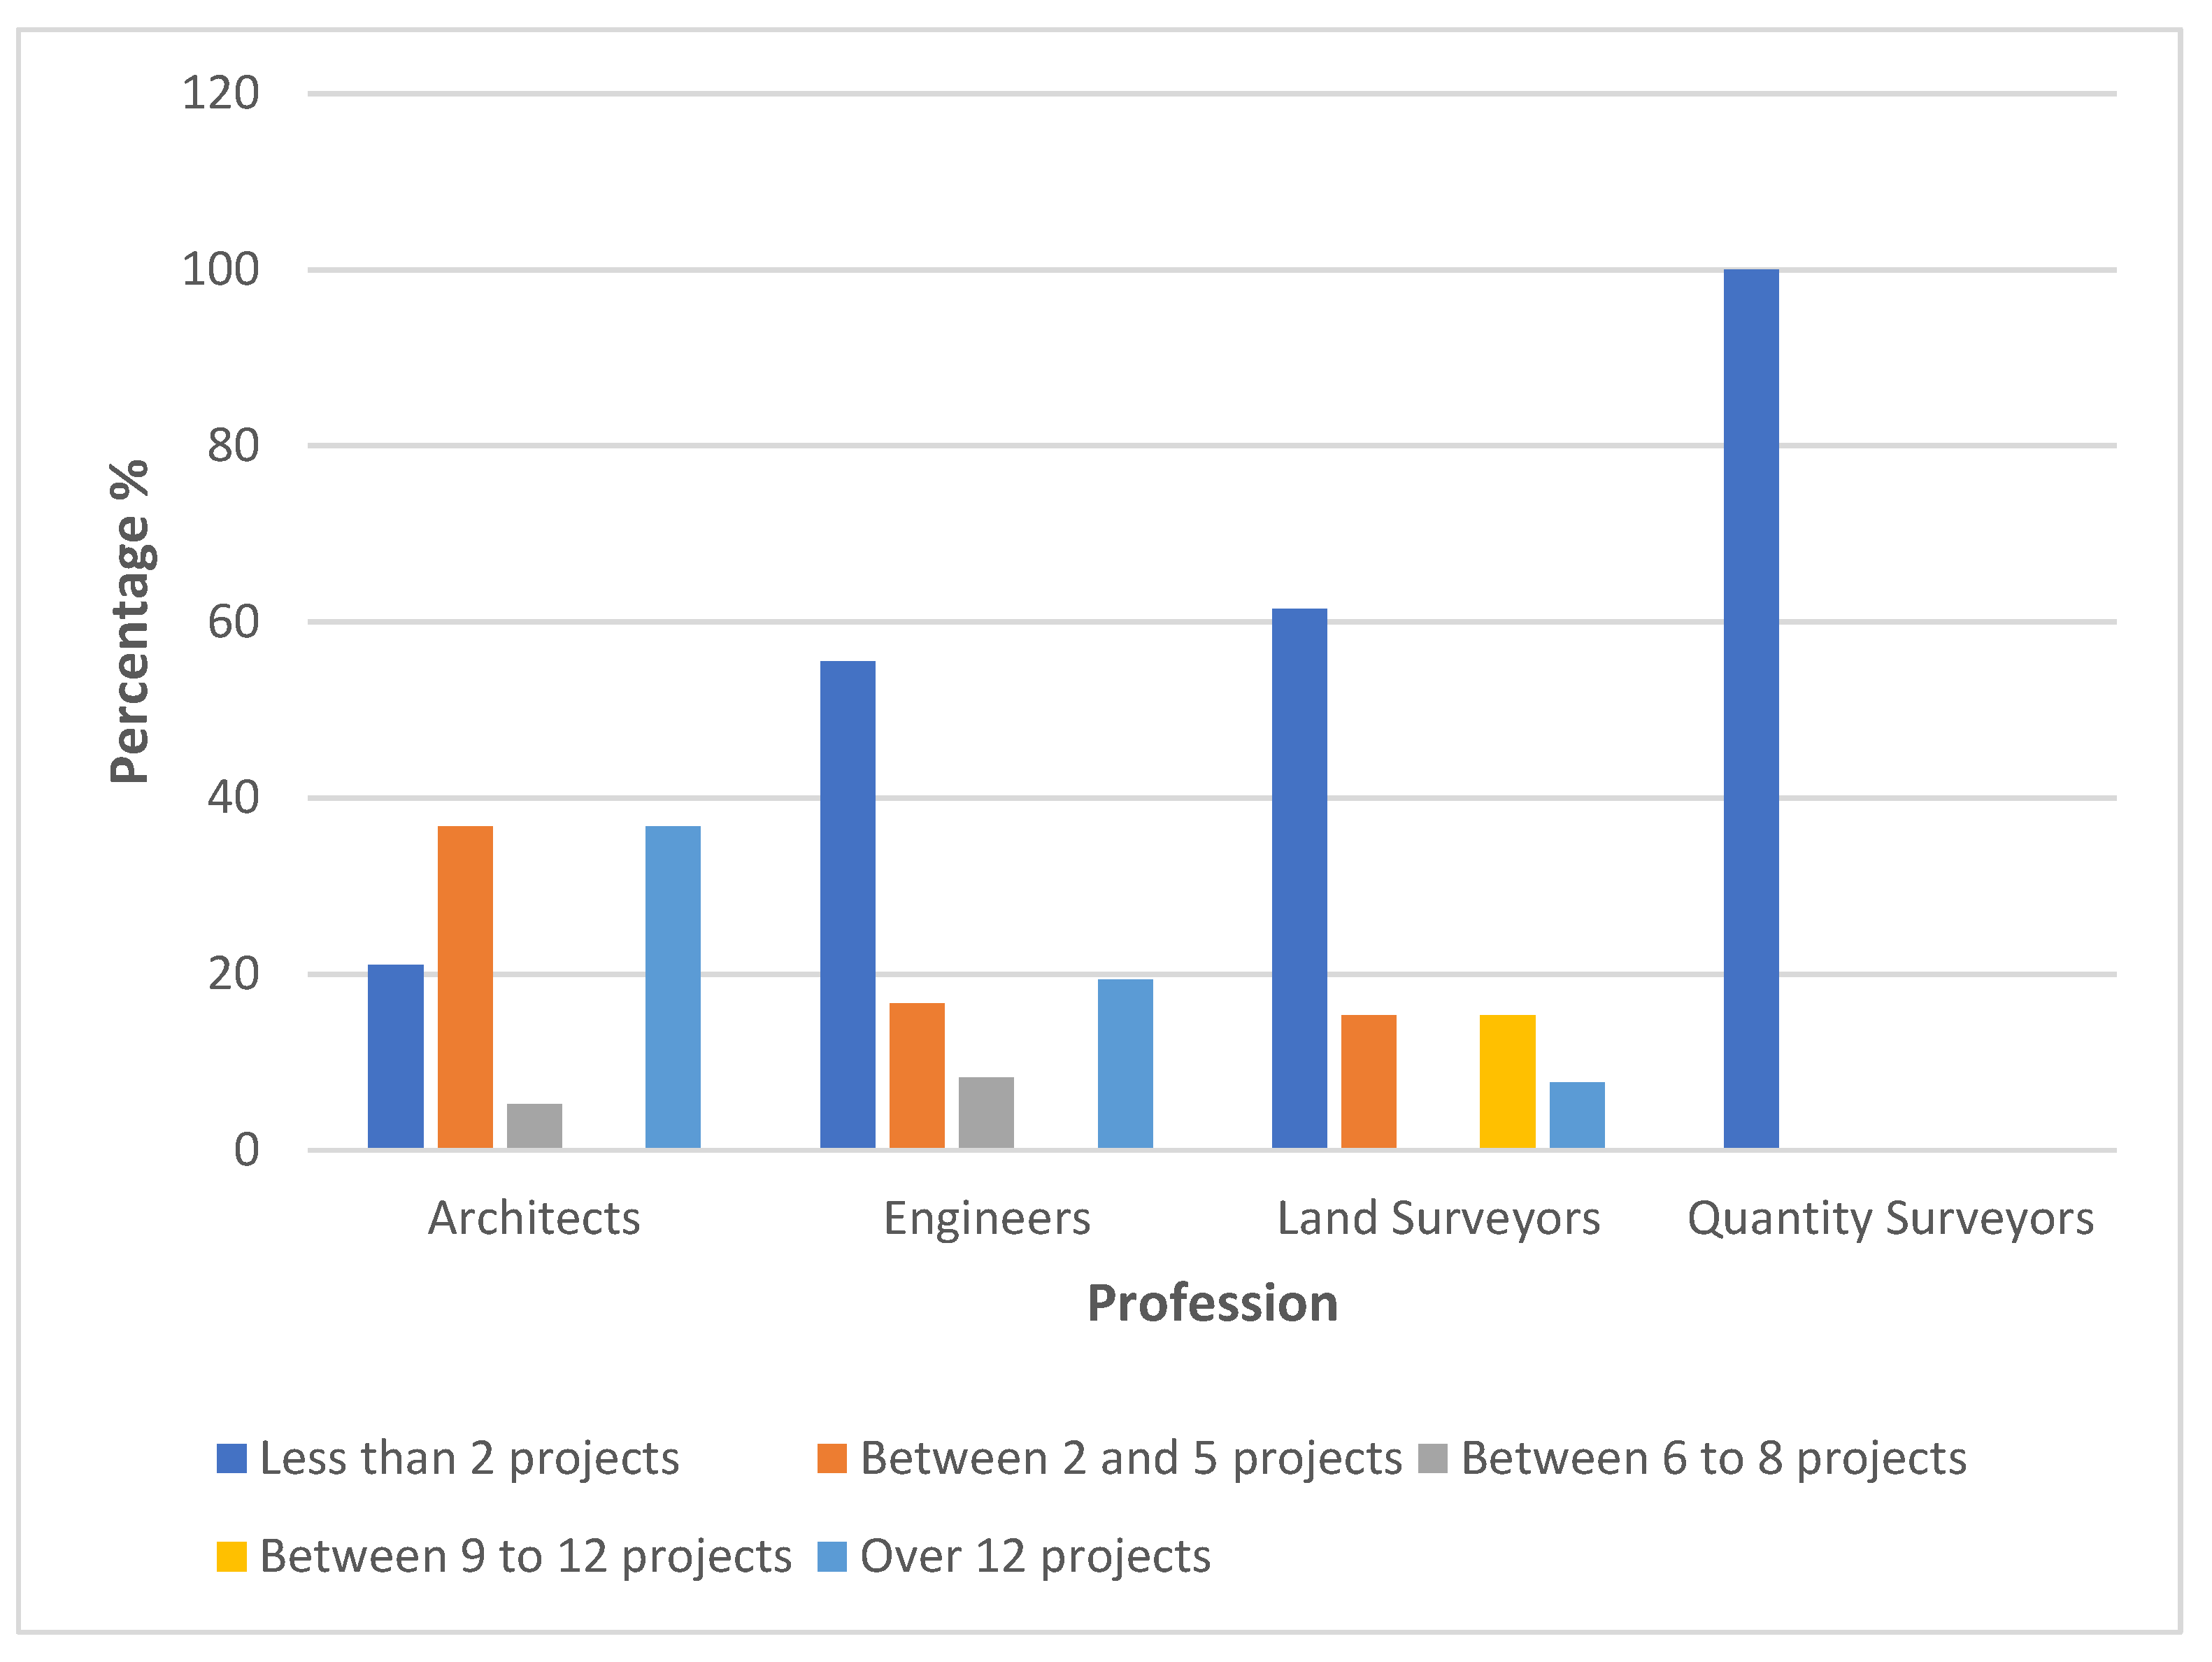
Then the results were further analysed by segregating into professional groups. The results show that Architects have carried out a lot of projects in this category of over 12 projects with 38% followed by engineers and land surveyors at 19% and 8%, respectively, and 0% by quantity surveyors. Figure 4.3 shows the segregated analysis of the results per profession.
Figure 4.3.
Projects done by Profession.
4.3. Software used for BIM
As indicated in Section 3.0, the choice of software depends on factors such as exposure, interoperability, workability, availability and so many other factors. Hence the study considered the most common software used in the construction industry in Malawi which is also common in practices from other countries that have just adopted BIM technology as outlined in section 2.0. Figure 4.4 shows the level of usage of software used in BIM projects.
Figure 4.4.
Software used in BIM Projects.
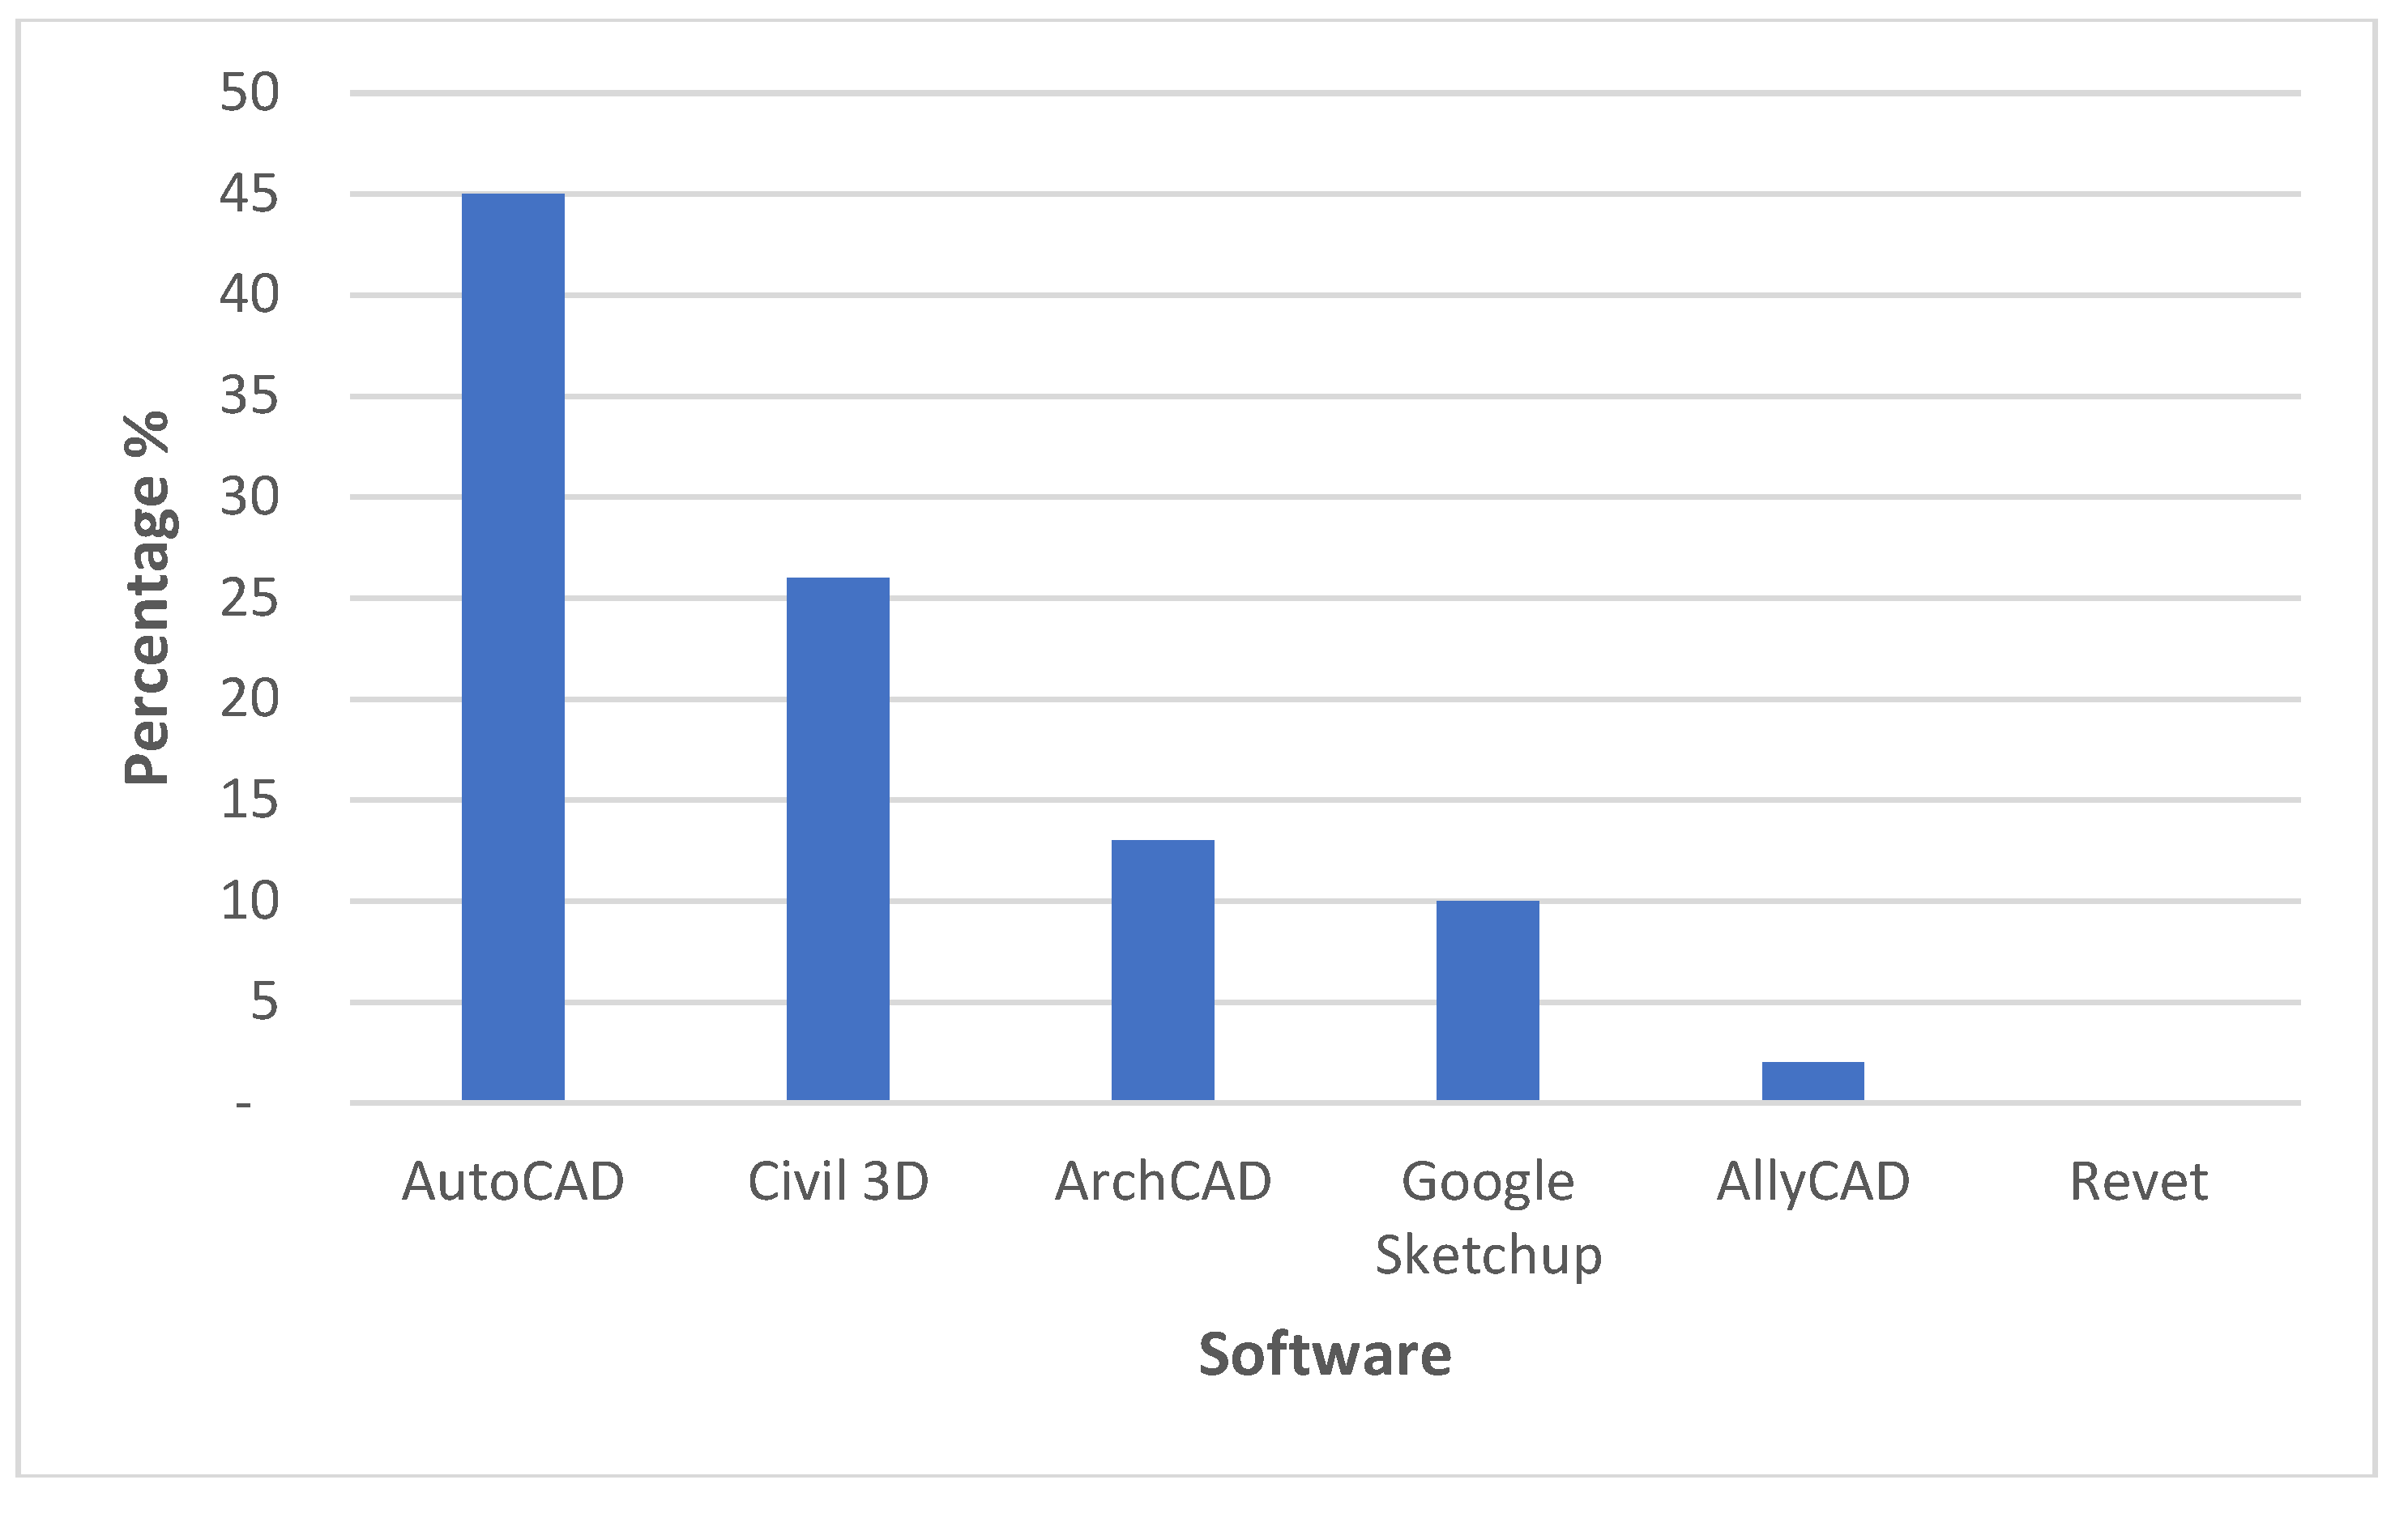
It is evident from Figure 4.4 that 46% of respondents use AutoCAD for BIM works, whilst 27% use Civil 3D. The least used software in Malawi is AllyCAD at 2.2% and Revet is not used at all. To further analyse the results, the use of software was segregated by the use at professional level and results are shown in Figure 4.5.
Figure 4.5.
Use of Software by Profession.
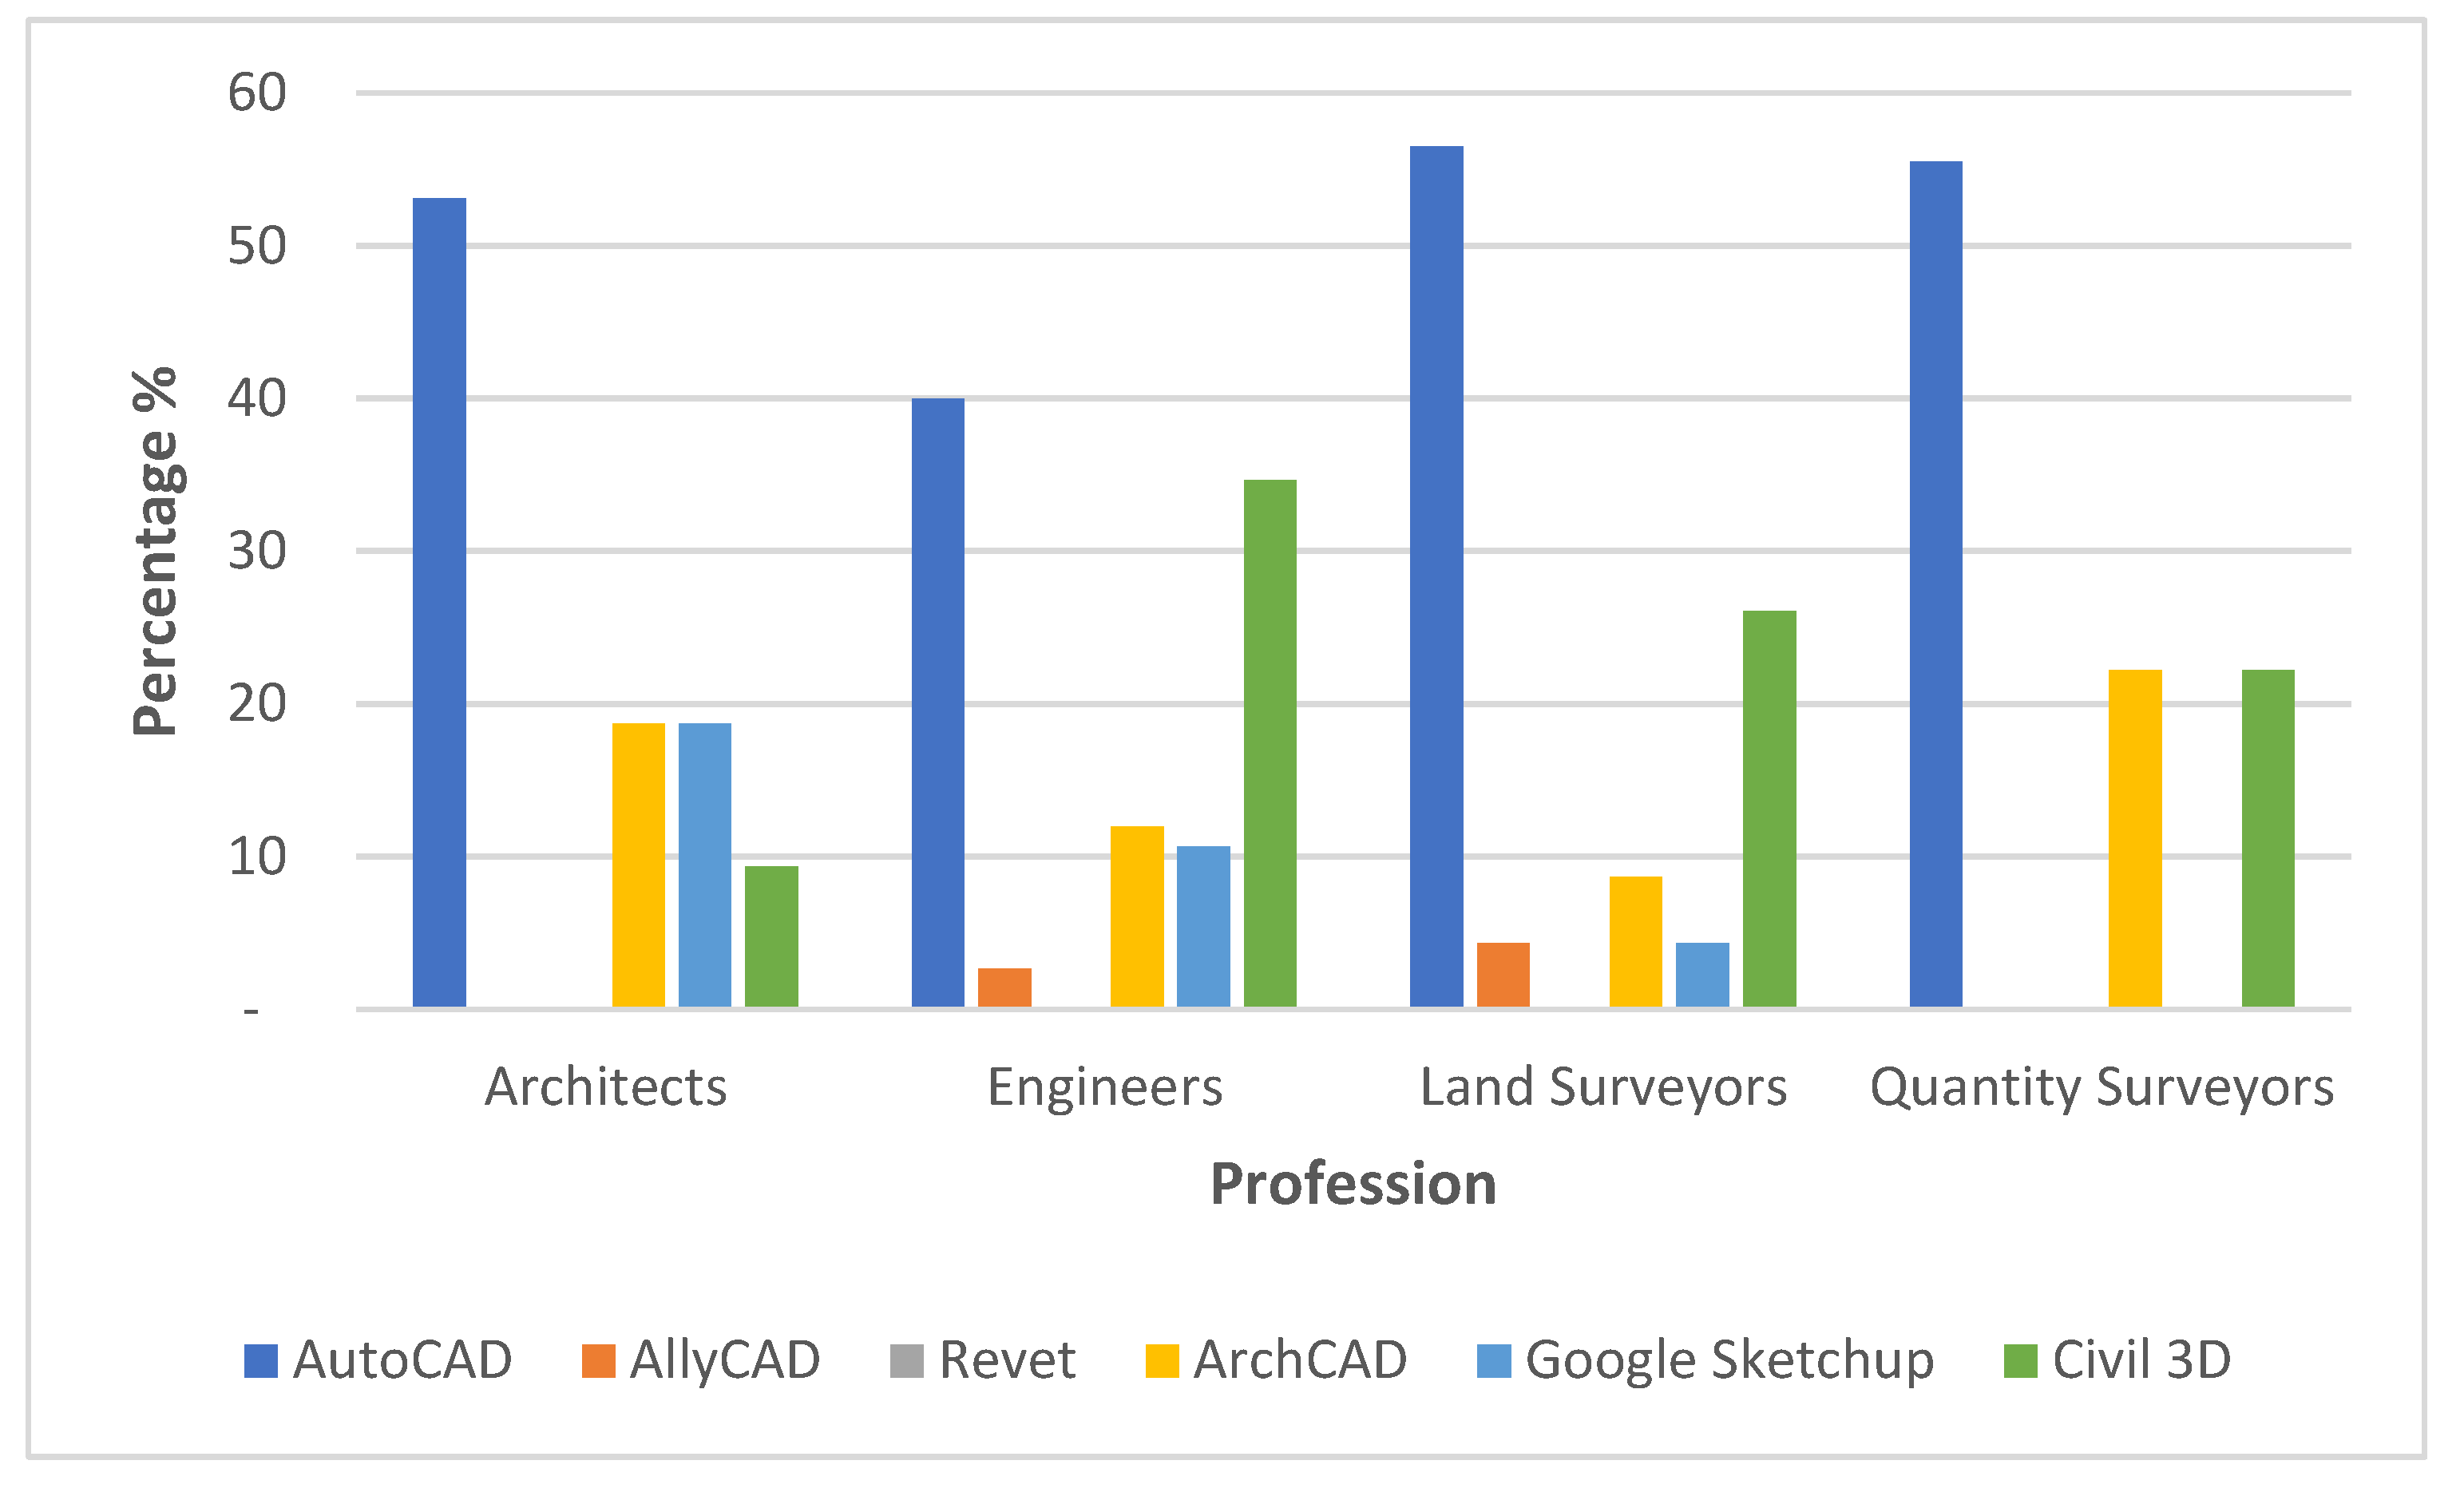
It is observed that the most used software by all professions is AutoCAD. The second most used software is Civil3D, which is mostly used by engineers, land surveyors and quantity surveyors. Architects use ArchCAD and Google Sketchup at second position. The least used software is Revet which is only used in small percentage by engineers and land surveyors. The type of software most used by profession is a very good indicator of the level of use of BIM by the profession.
4.3. Level of Use of BIM
The level of use of BIM is based on the maturity level of use of BIM as described in section 2.1. Figure 4.6 shows the results of the level of use of BIM.
Figure 4.6.
Level of Use of BIM.
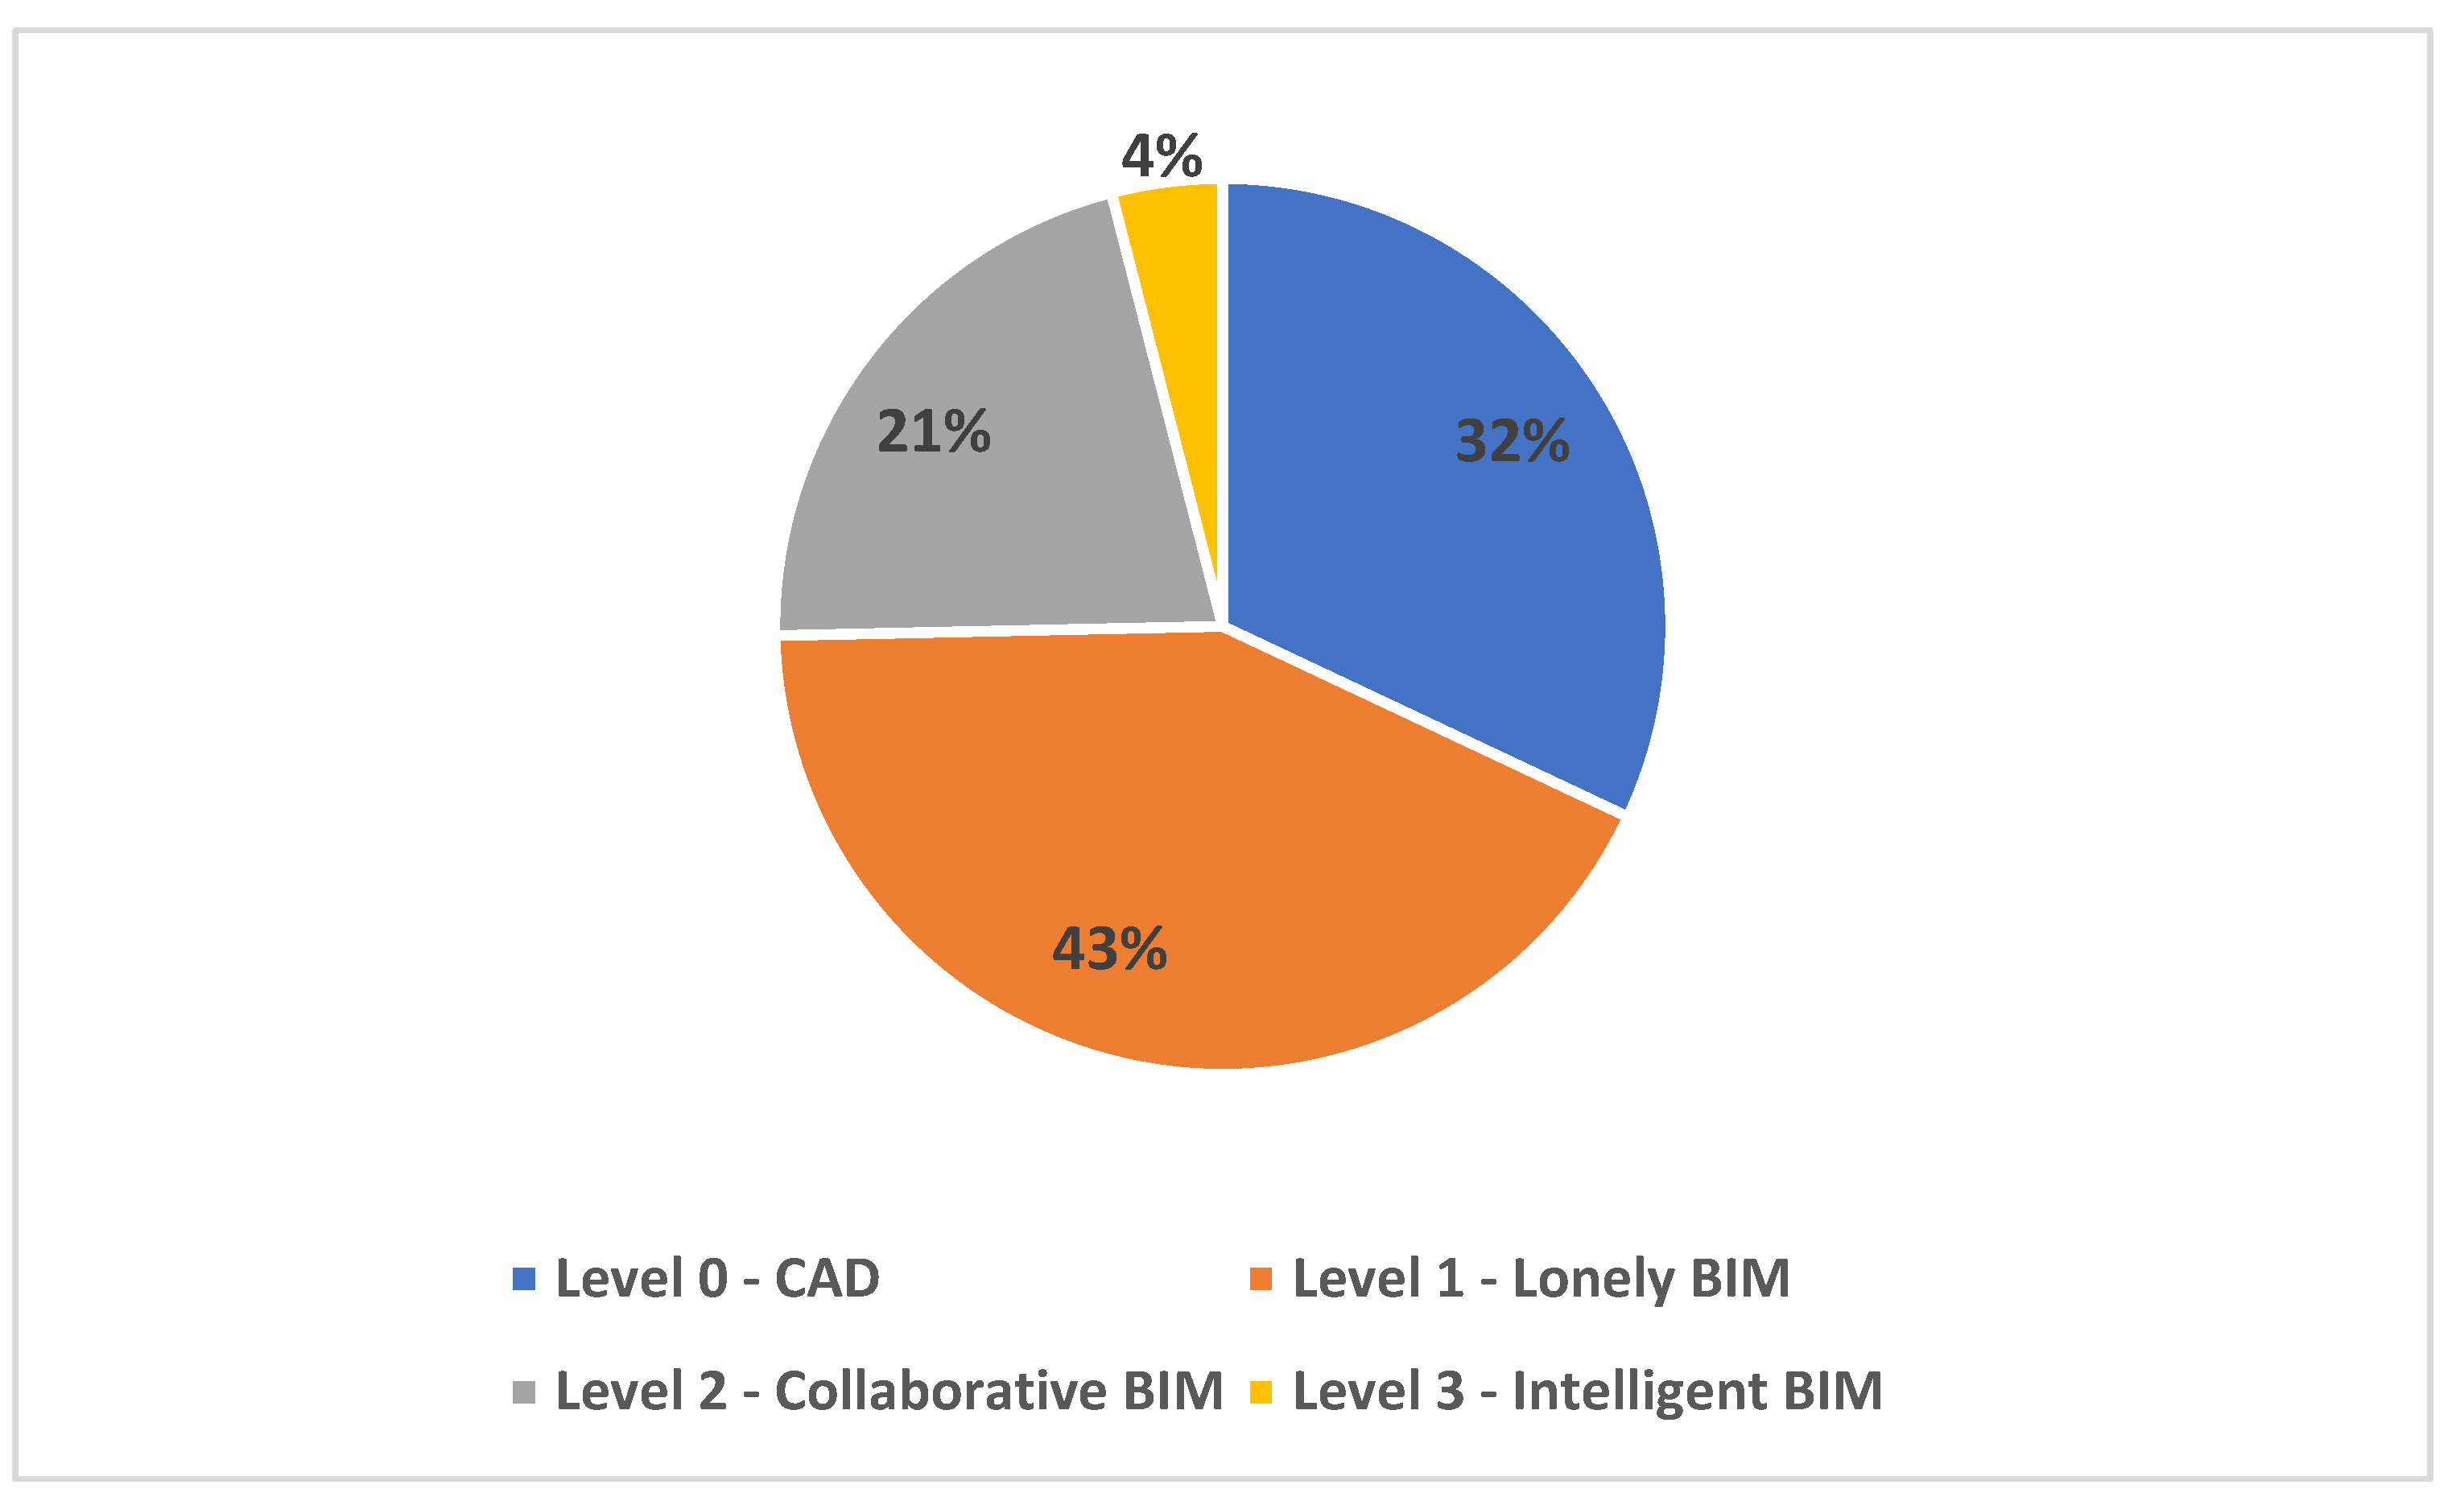
Figure 4.6 shows that 32% of the respondents indicated that they were at Stage 0 of BIM whilst 42.7% indicated that they were at Stage 1 of BIM. 21.3% indicated that they were at Stage 2, and only 4% of the respondents indicated that they were at Stage 3 of BIM implementation. Further analysis was done by segregating the results into professional groups, Figure 4.7 shows the segregated results by profession.
Figure 4.7.
Level of BIM use by Profession.
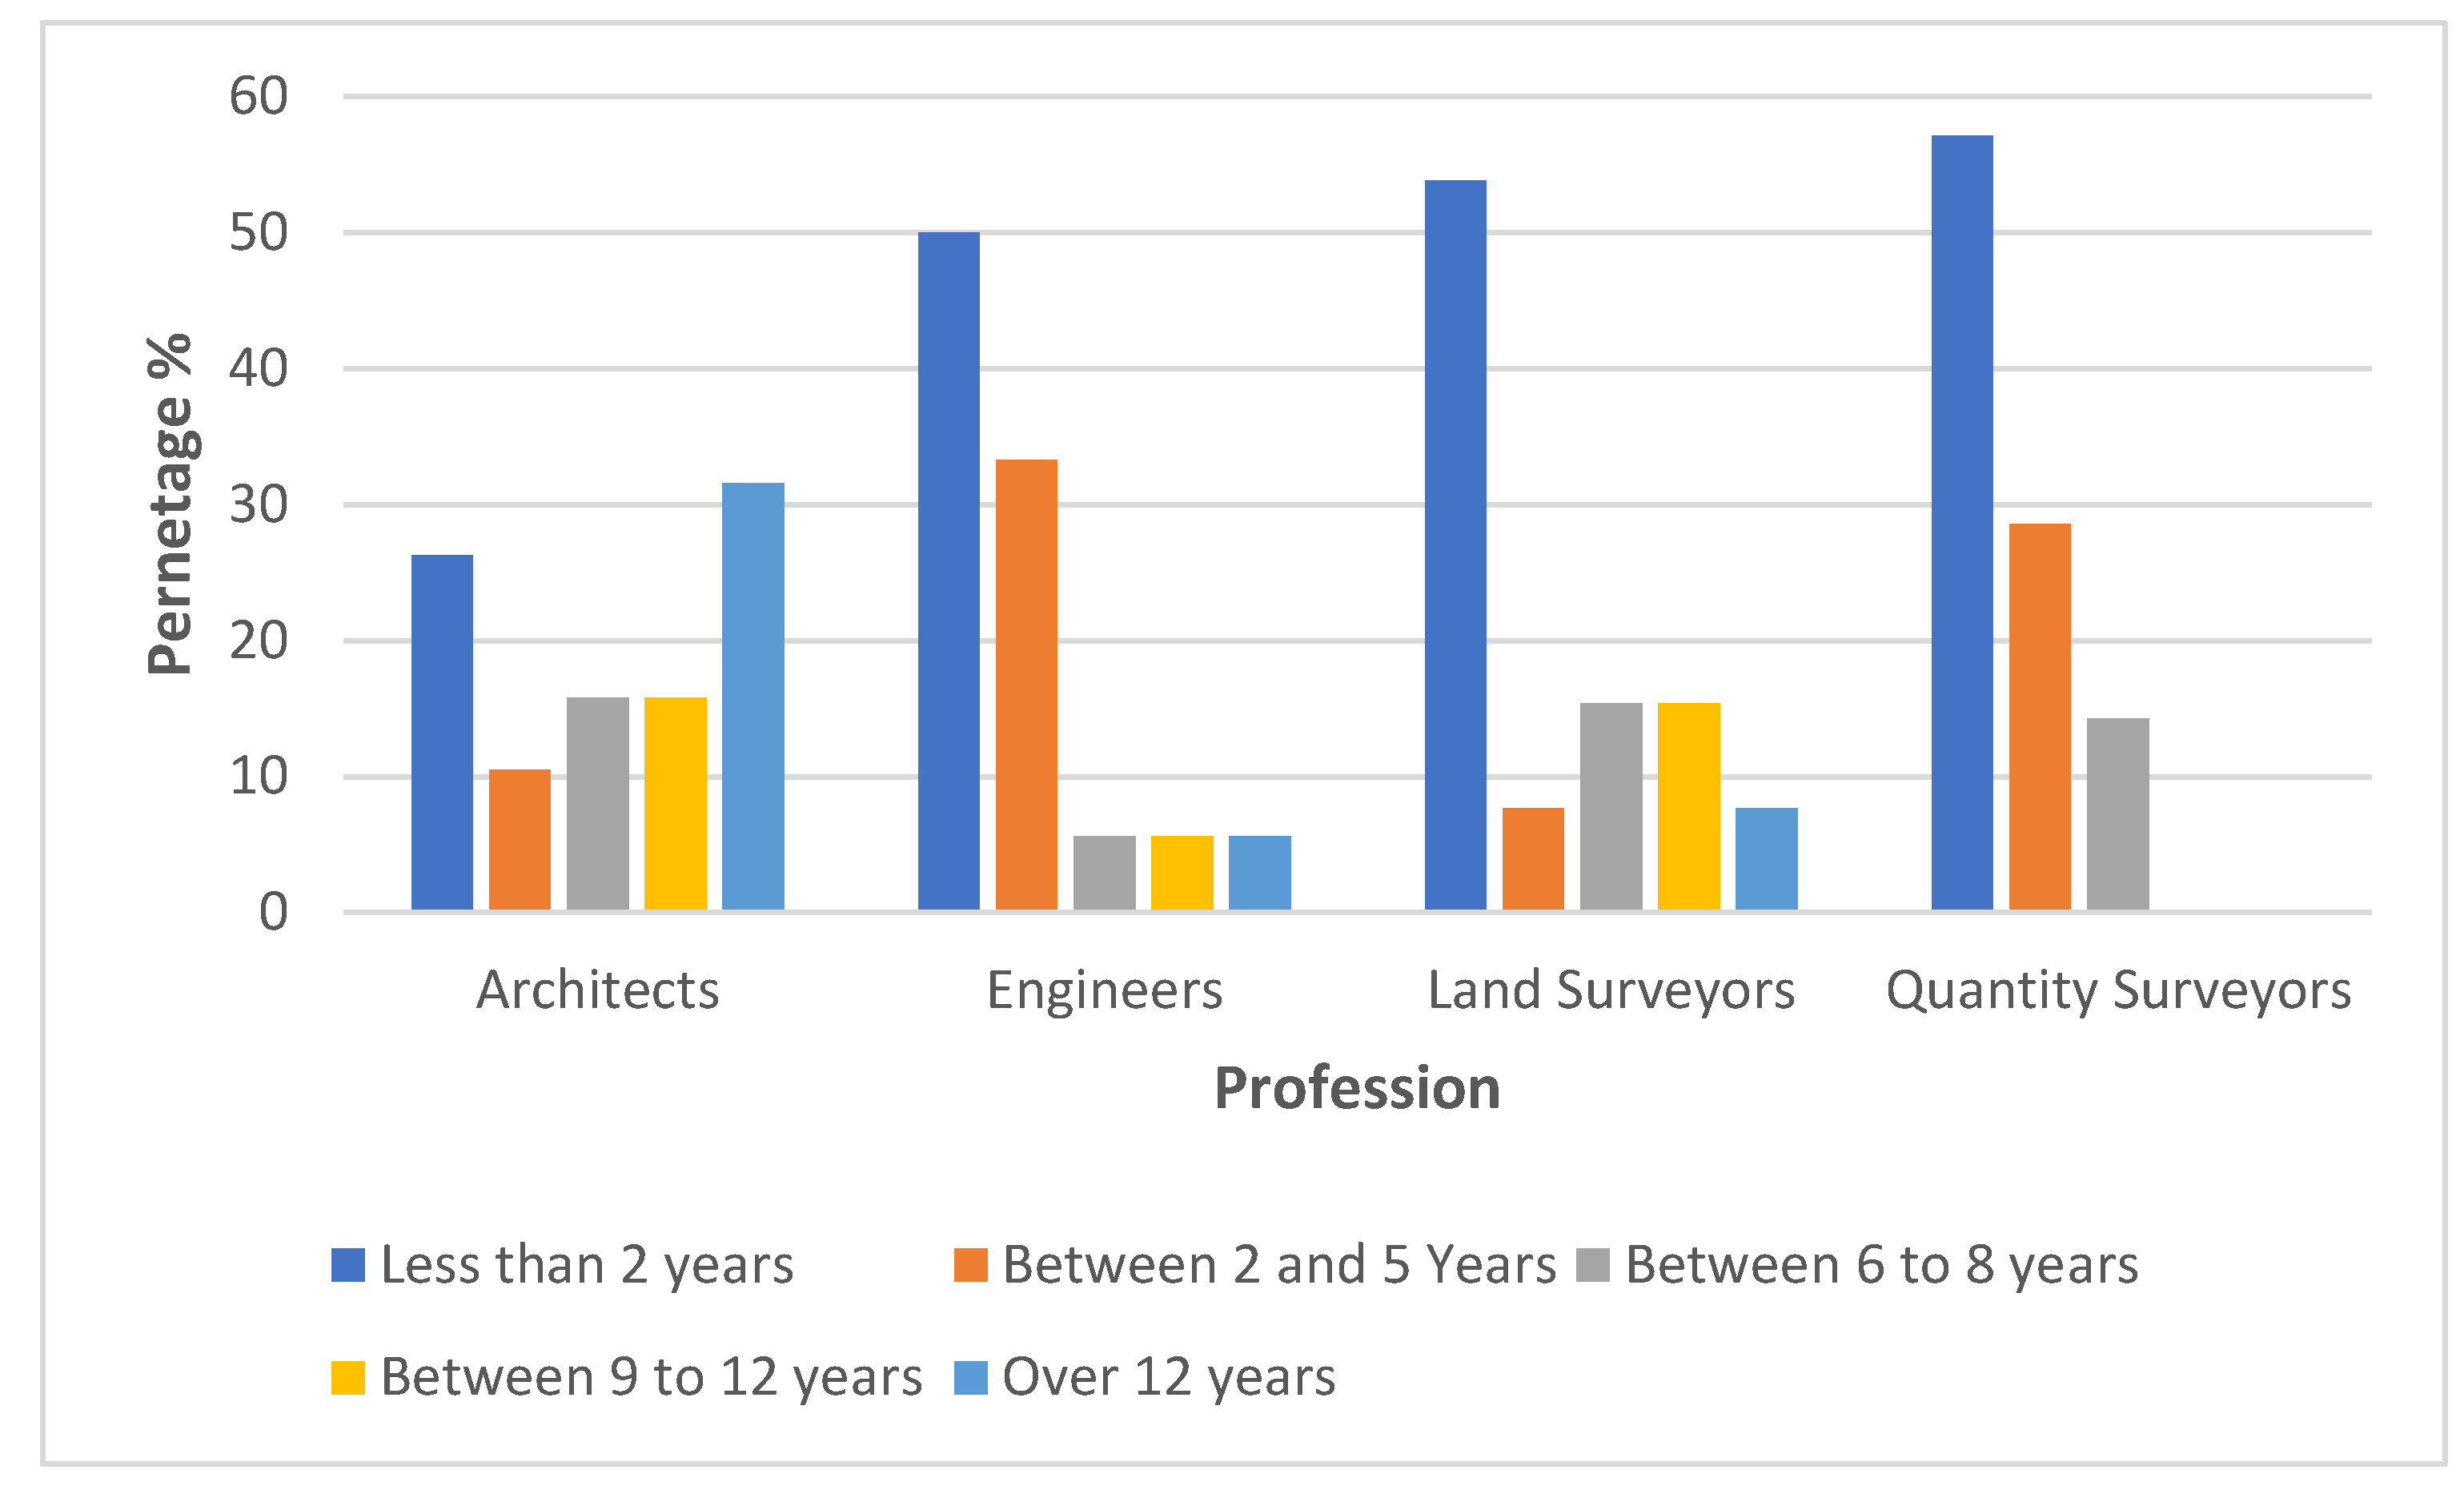
Figure 4.7 shows that most of the Architects, Engineers and Quantity Surveyors are at Level 1. And most of the Land Surveyors are at level zero. The distribution graph of Architects shows an even distribution which shows that Architects have been using BIM Technology for some time compared to other professions. And this is seconded by engineers. The graph has also shown that only two professions are at Level 3, thus Architects and Engineers.
Therefore, these results on the level of BIM show strong corelation with type of software used as discussed in the preceding section. Level 1 is lonely BIM which includes some basic 3D elements and it is the beginning of BIM. Hence use of AutoCAD and Civil 3D by most experts substantiates the fact that most profession are just starting using BIM and is still in its early stage.
4.3. A Meta-analysis of BIM Benefits
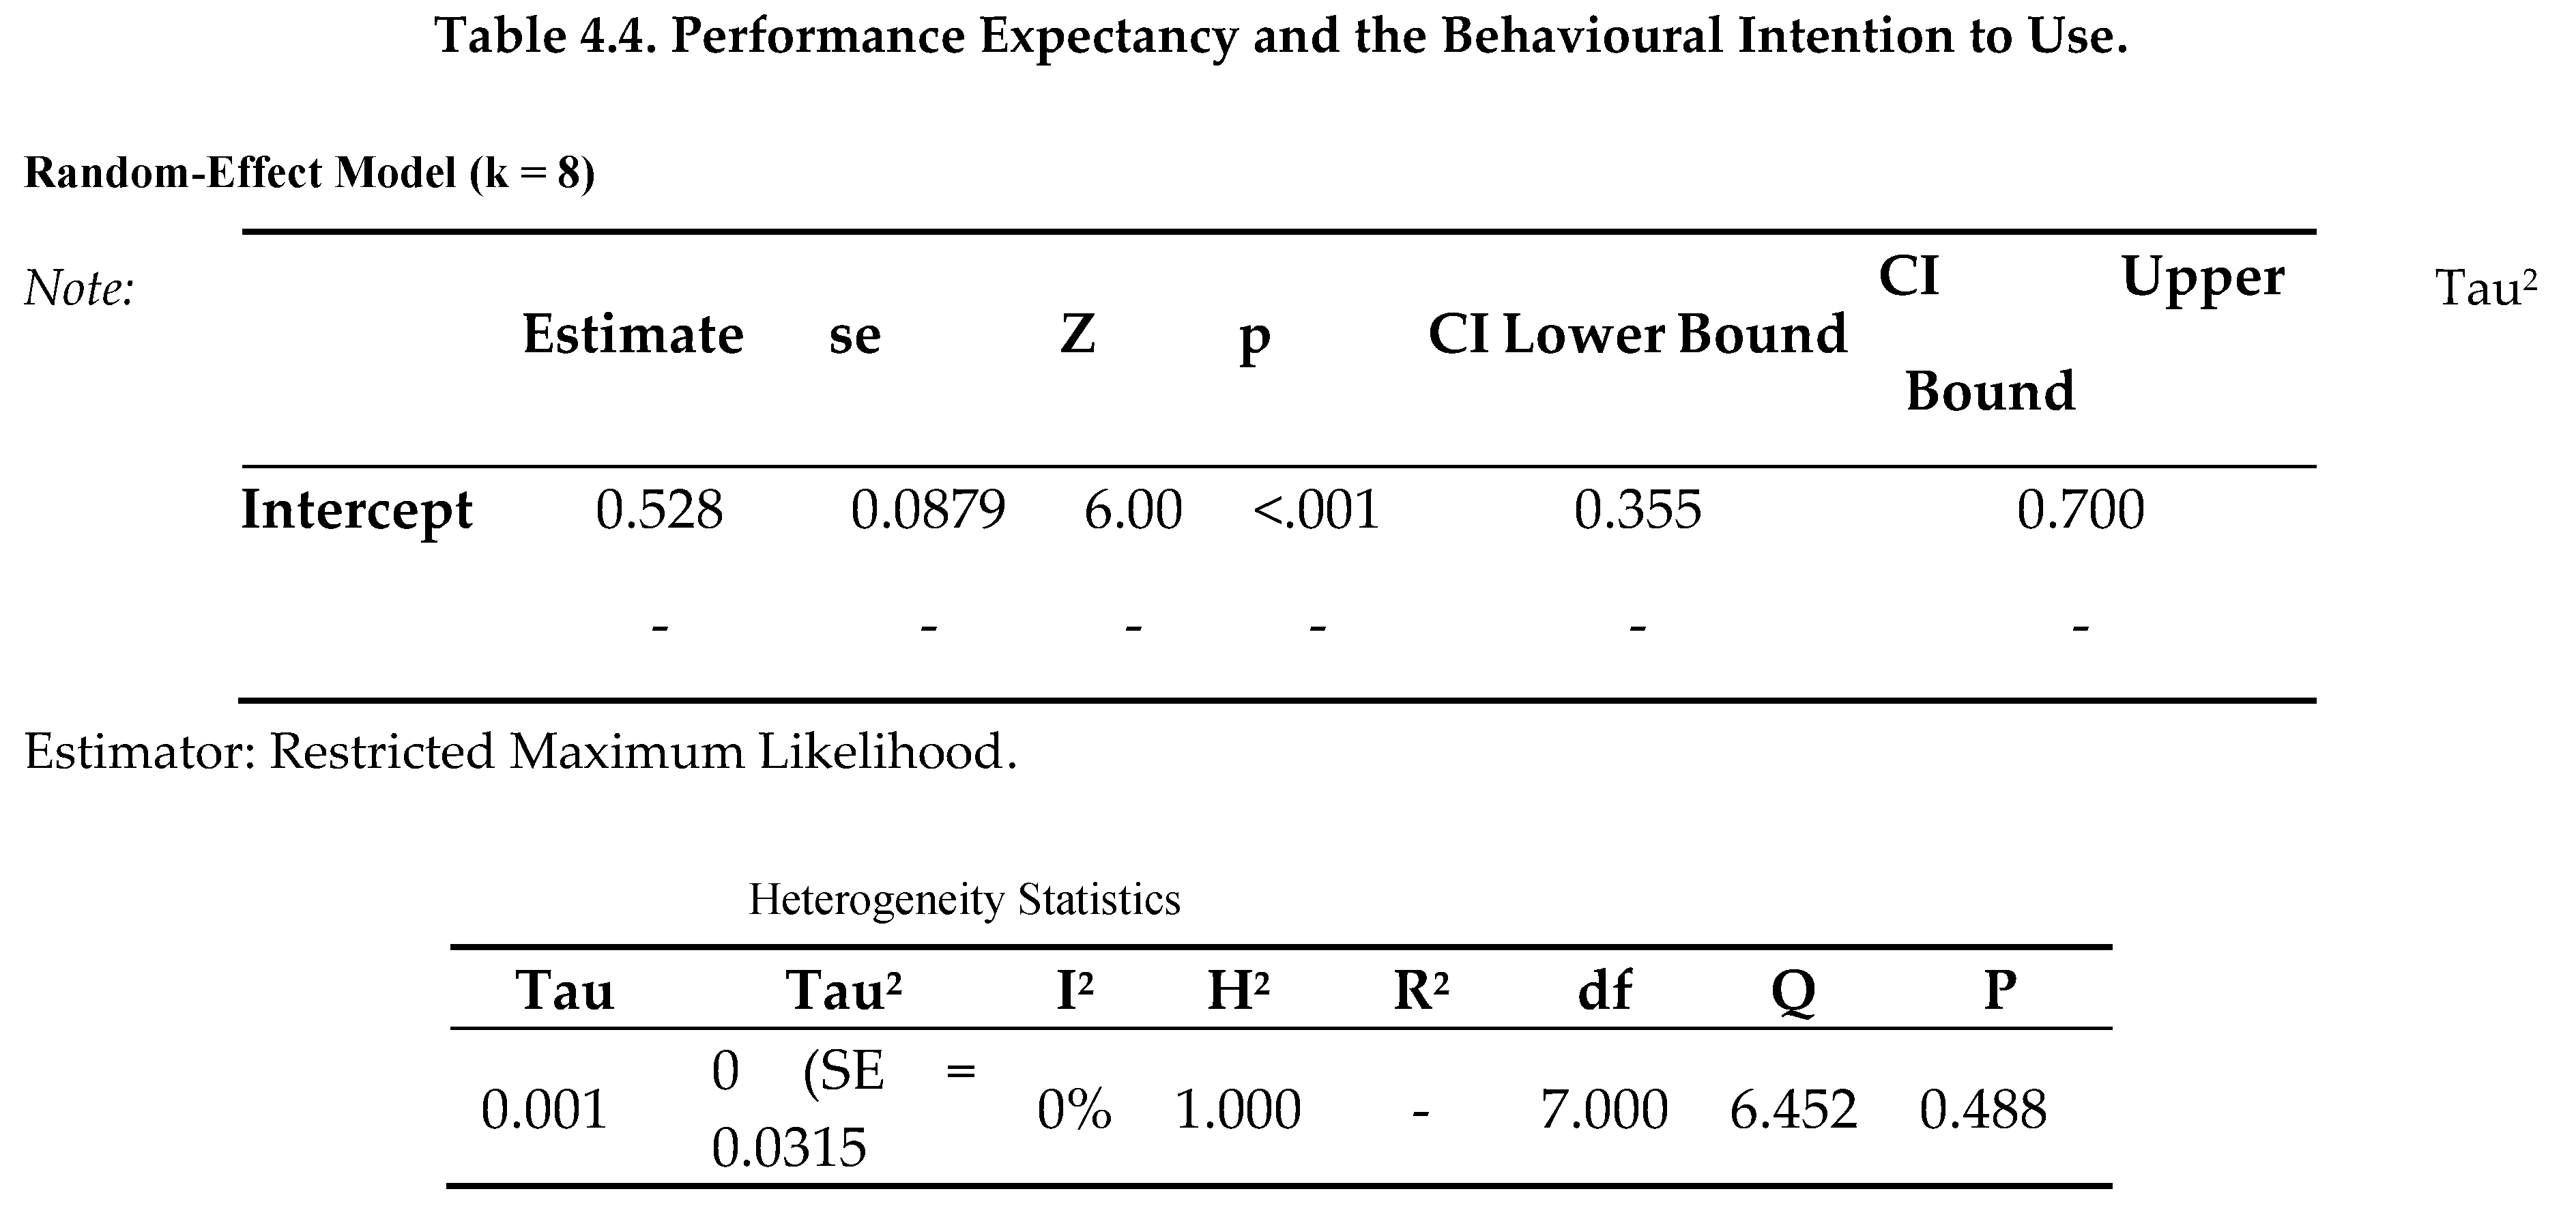
A meta-analysis of the BIM benefits was carried out to analyse results which were collected from a systematic literature review. Three areas of analysis were conducted thus: relationship between performance expectancy and the behavioural intention to use, and influence of intention to use BIM on BIM adoption. The meta-analysis results indicate a strong positive relationship between performance expectancy and the behavioural intention to use BIM in the construction industry. The combined effect size, represented by the intercept, is 0.528, which is statistically significant (p<0.001), with a 95% confidence interval of [0.355, 0.700]. This suggests that, across the eight studies analysed, higher perceived benefits (awareness of benefits) of BIM are consistently associated with a greater intention to adopt BIM technology. Table 4.4 shows the analysis results of the relationship between performance expectancy and behavioural intention to use BIM.
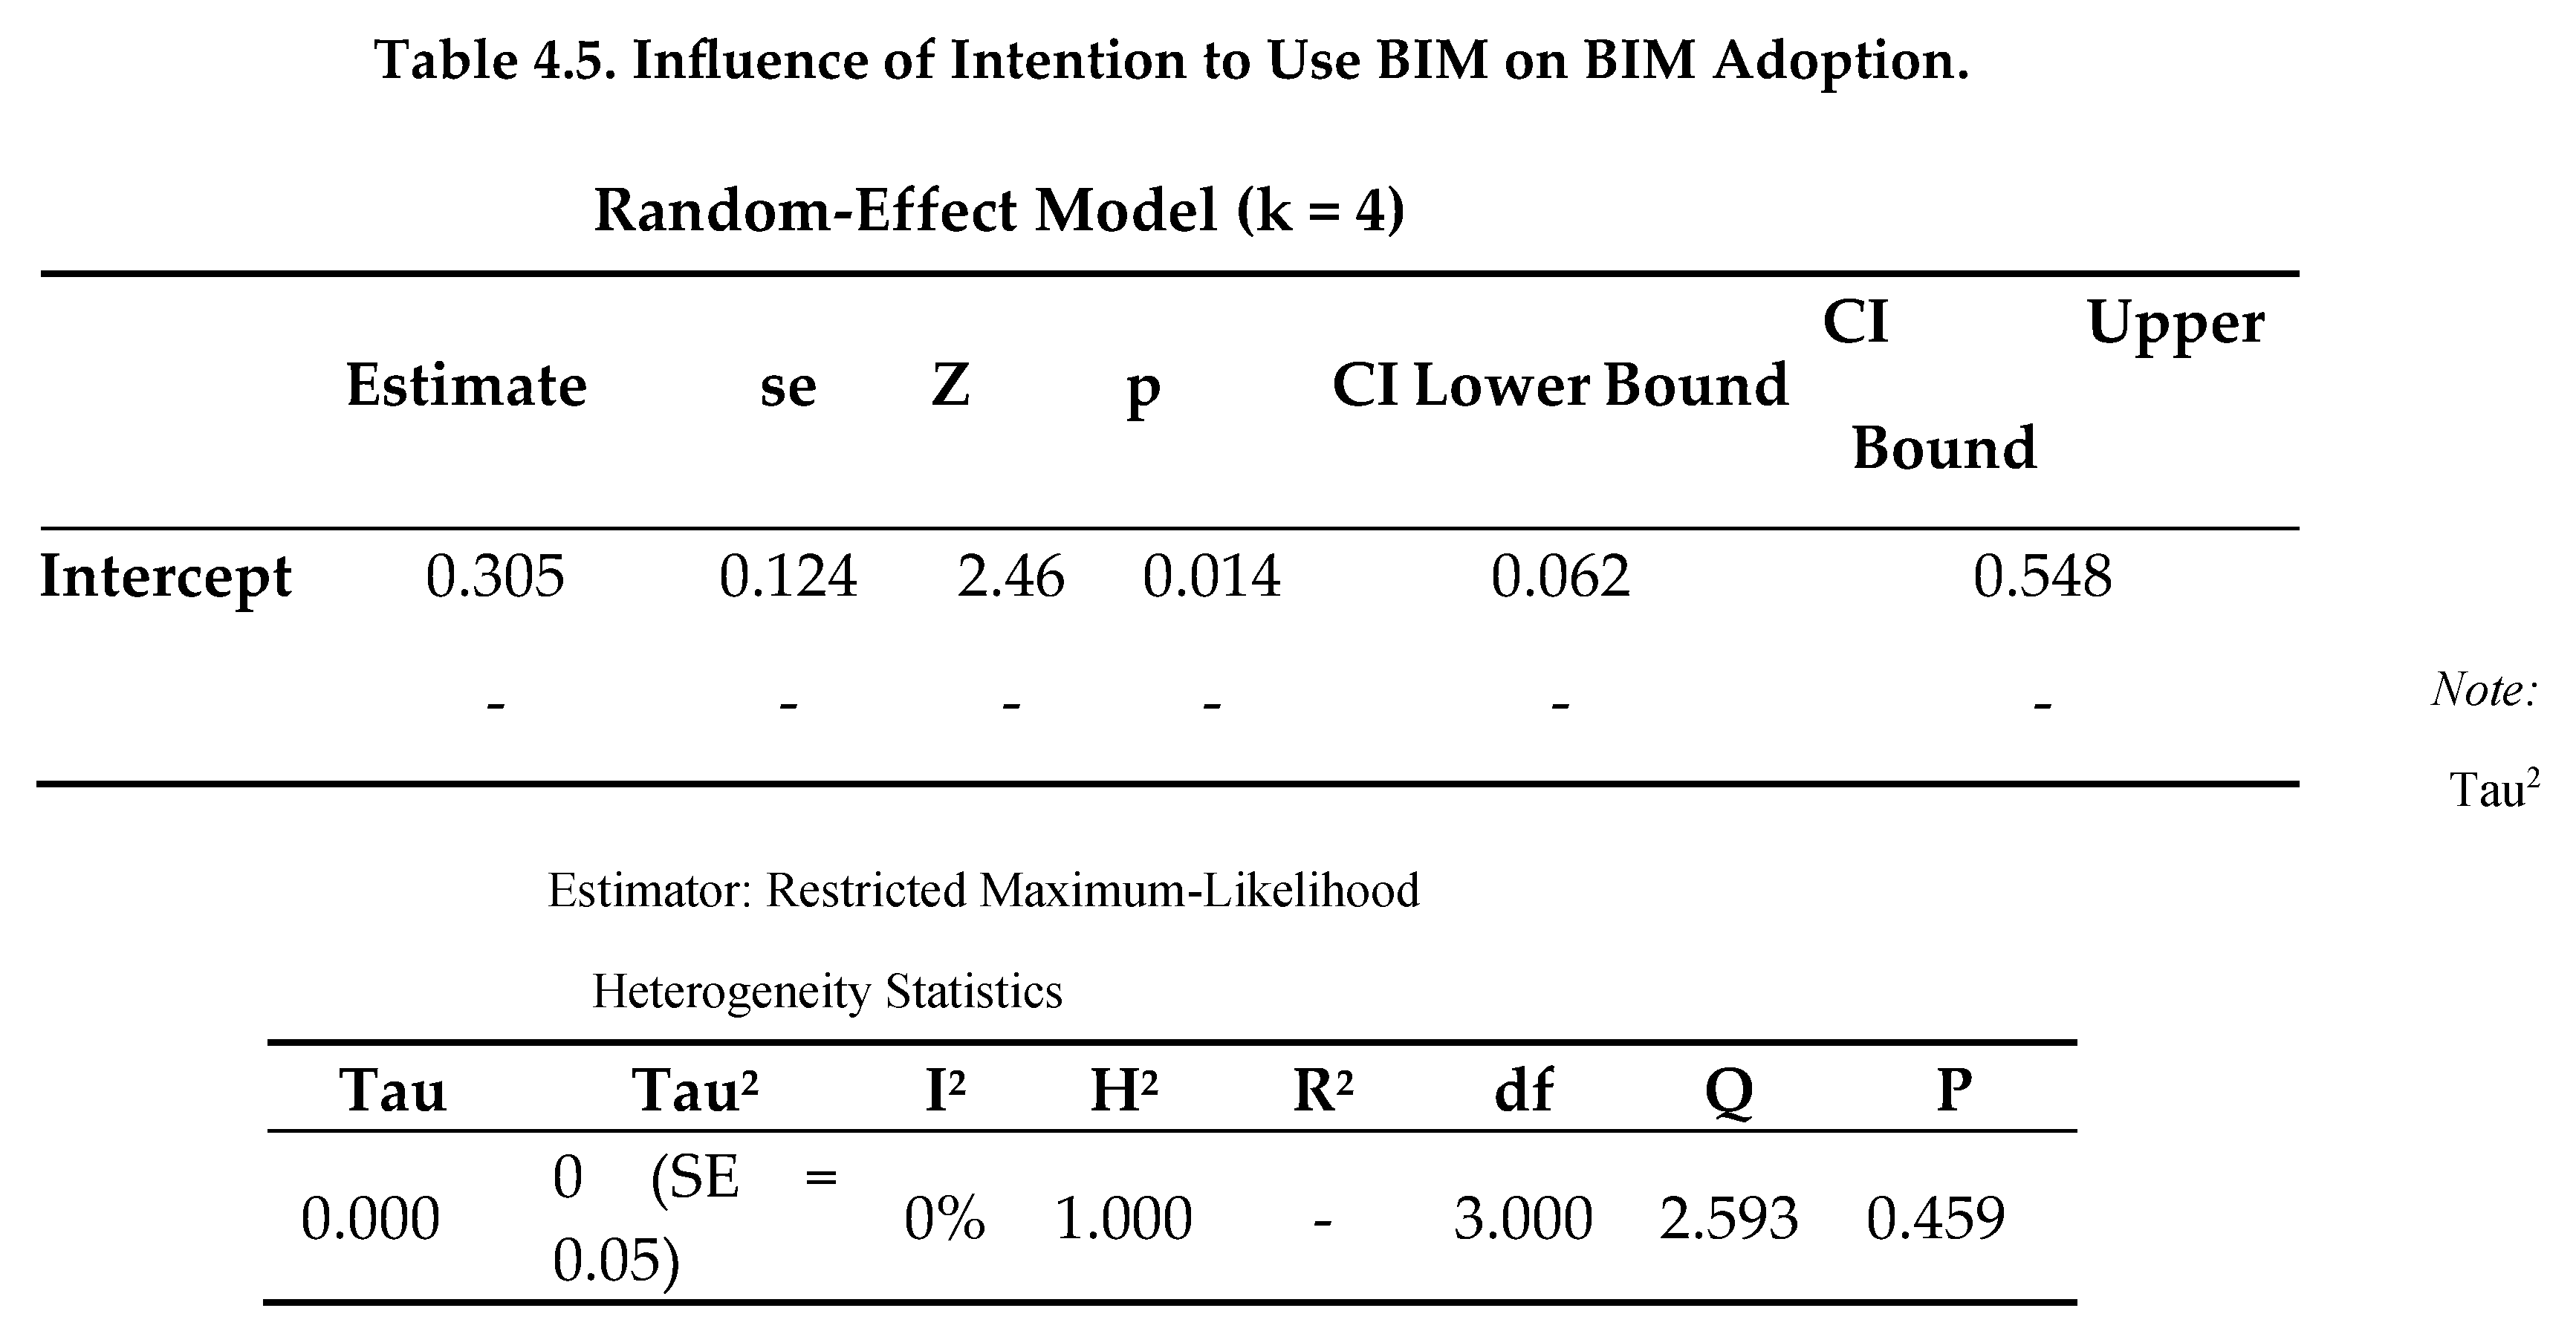
The second area of meta-analysis was influence of intention to use BIM on BIM adoption. The results showed a significant positive finding. The overall combined effect size, represented by the intercept of 0.305, is statistically significant (p=0.014), with a 95% confidence interval ranging from [0.062, 0.548]. This result suggests that a higher intention to use BIM is consistently and positively associated with its actual adoption of BIM. Table 4.5 shows these results on influence of intention to use BIM on BIM adoption.
The last area of meta-analysis was heterogeneity assessment. Figure 4.8 shows the heterogeneity assessment results.
Figure 4.8.
Heterogeneity Assessment.
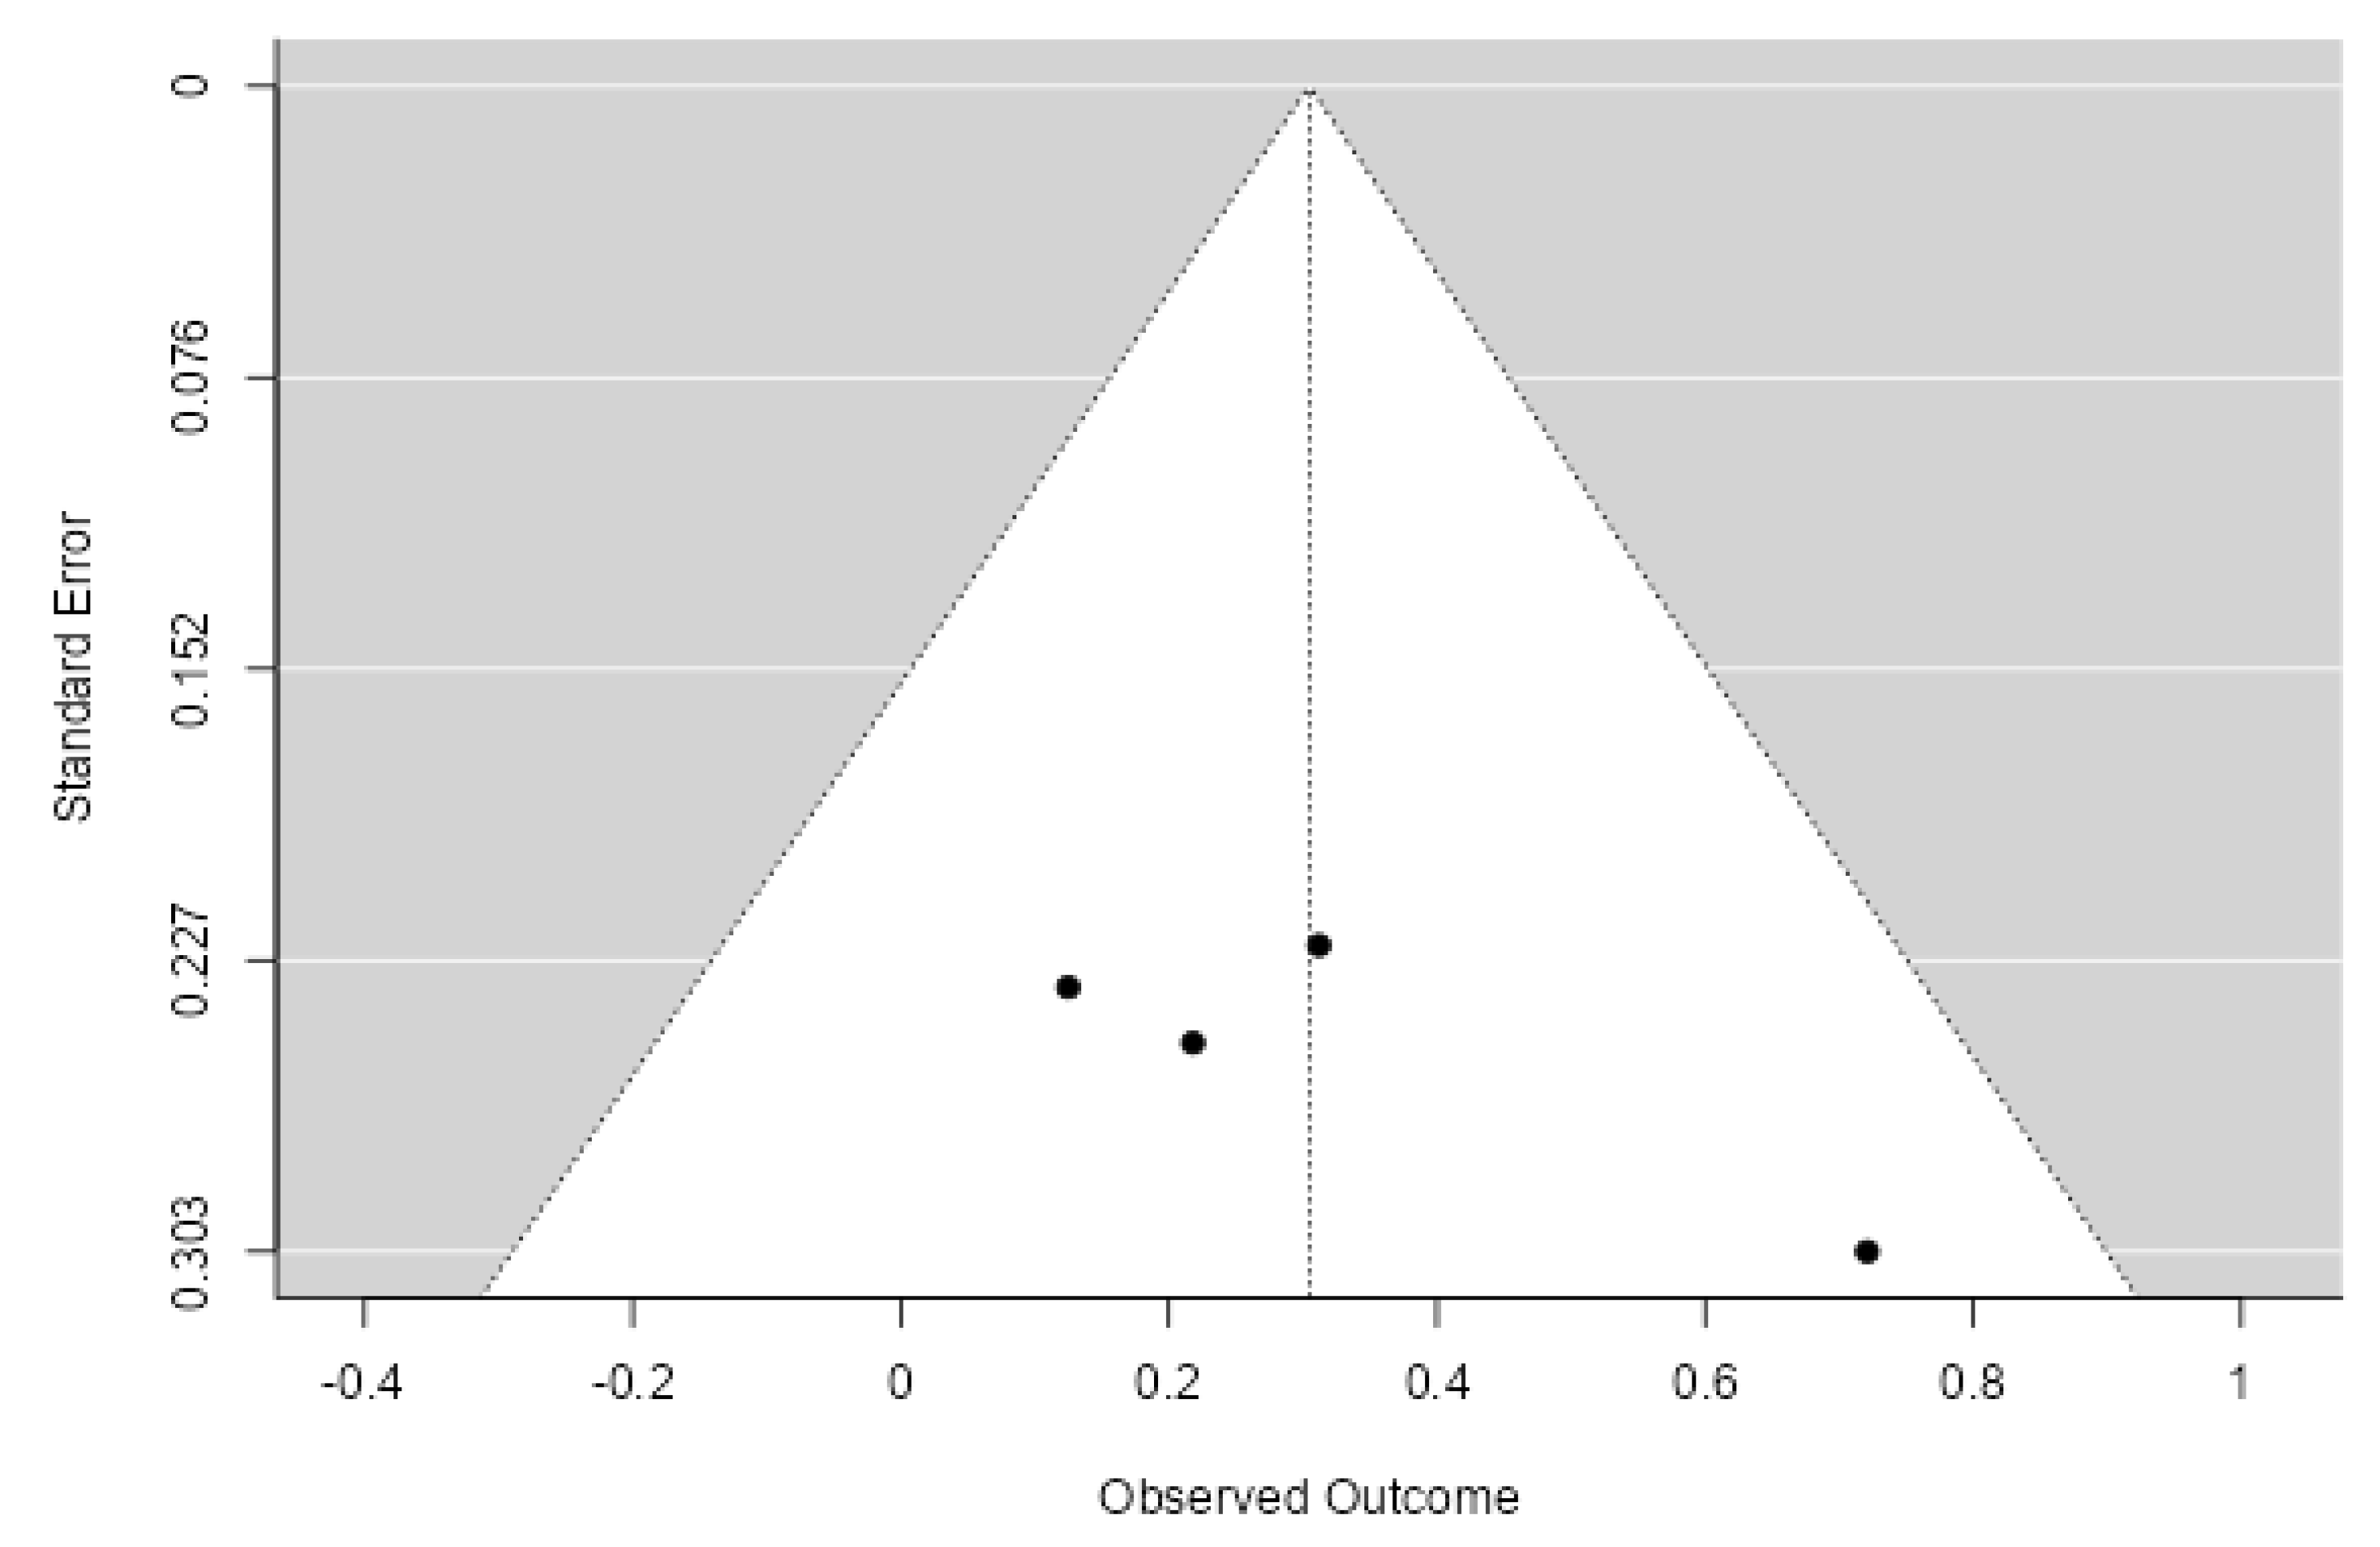
Figure 4.8 shows that the heterogeneity assessment analyses reveal minimal heterogeneity among the included studies, as evidenced by several key metrics. The I² statistic is 0%, which means that none of the observed variability in effect sizes is due to true differences between the studies. This is further supported by the Q-statistic (Q=6.452) and its corresponding p-value (p=0.488), which is non-significant. A non-significant p-value for the Q-statistic suggests that the observed variation in effect sizes is no more than what would be expected by chance. Furthermore, Tau and Tau² are measures of the amount of heterogeneity or true variance in the effect sizes across the studies. The Tau² value of 0, as indicated in Table 4.5 indicates there is no true heterogeneity in the population effect sizes.
Thereafter, the using the questionnaire, the respondents were asked to indicate whether they were aware of the BIM benefits. Figure 4.9 presents the results of the awareness of BIM benefits.
Figure 4.9.
Awareness of BIM benefits.
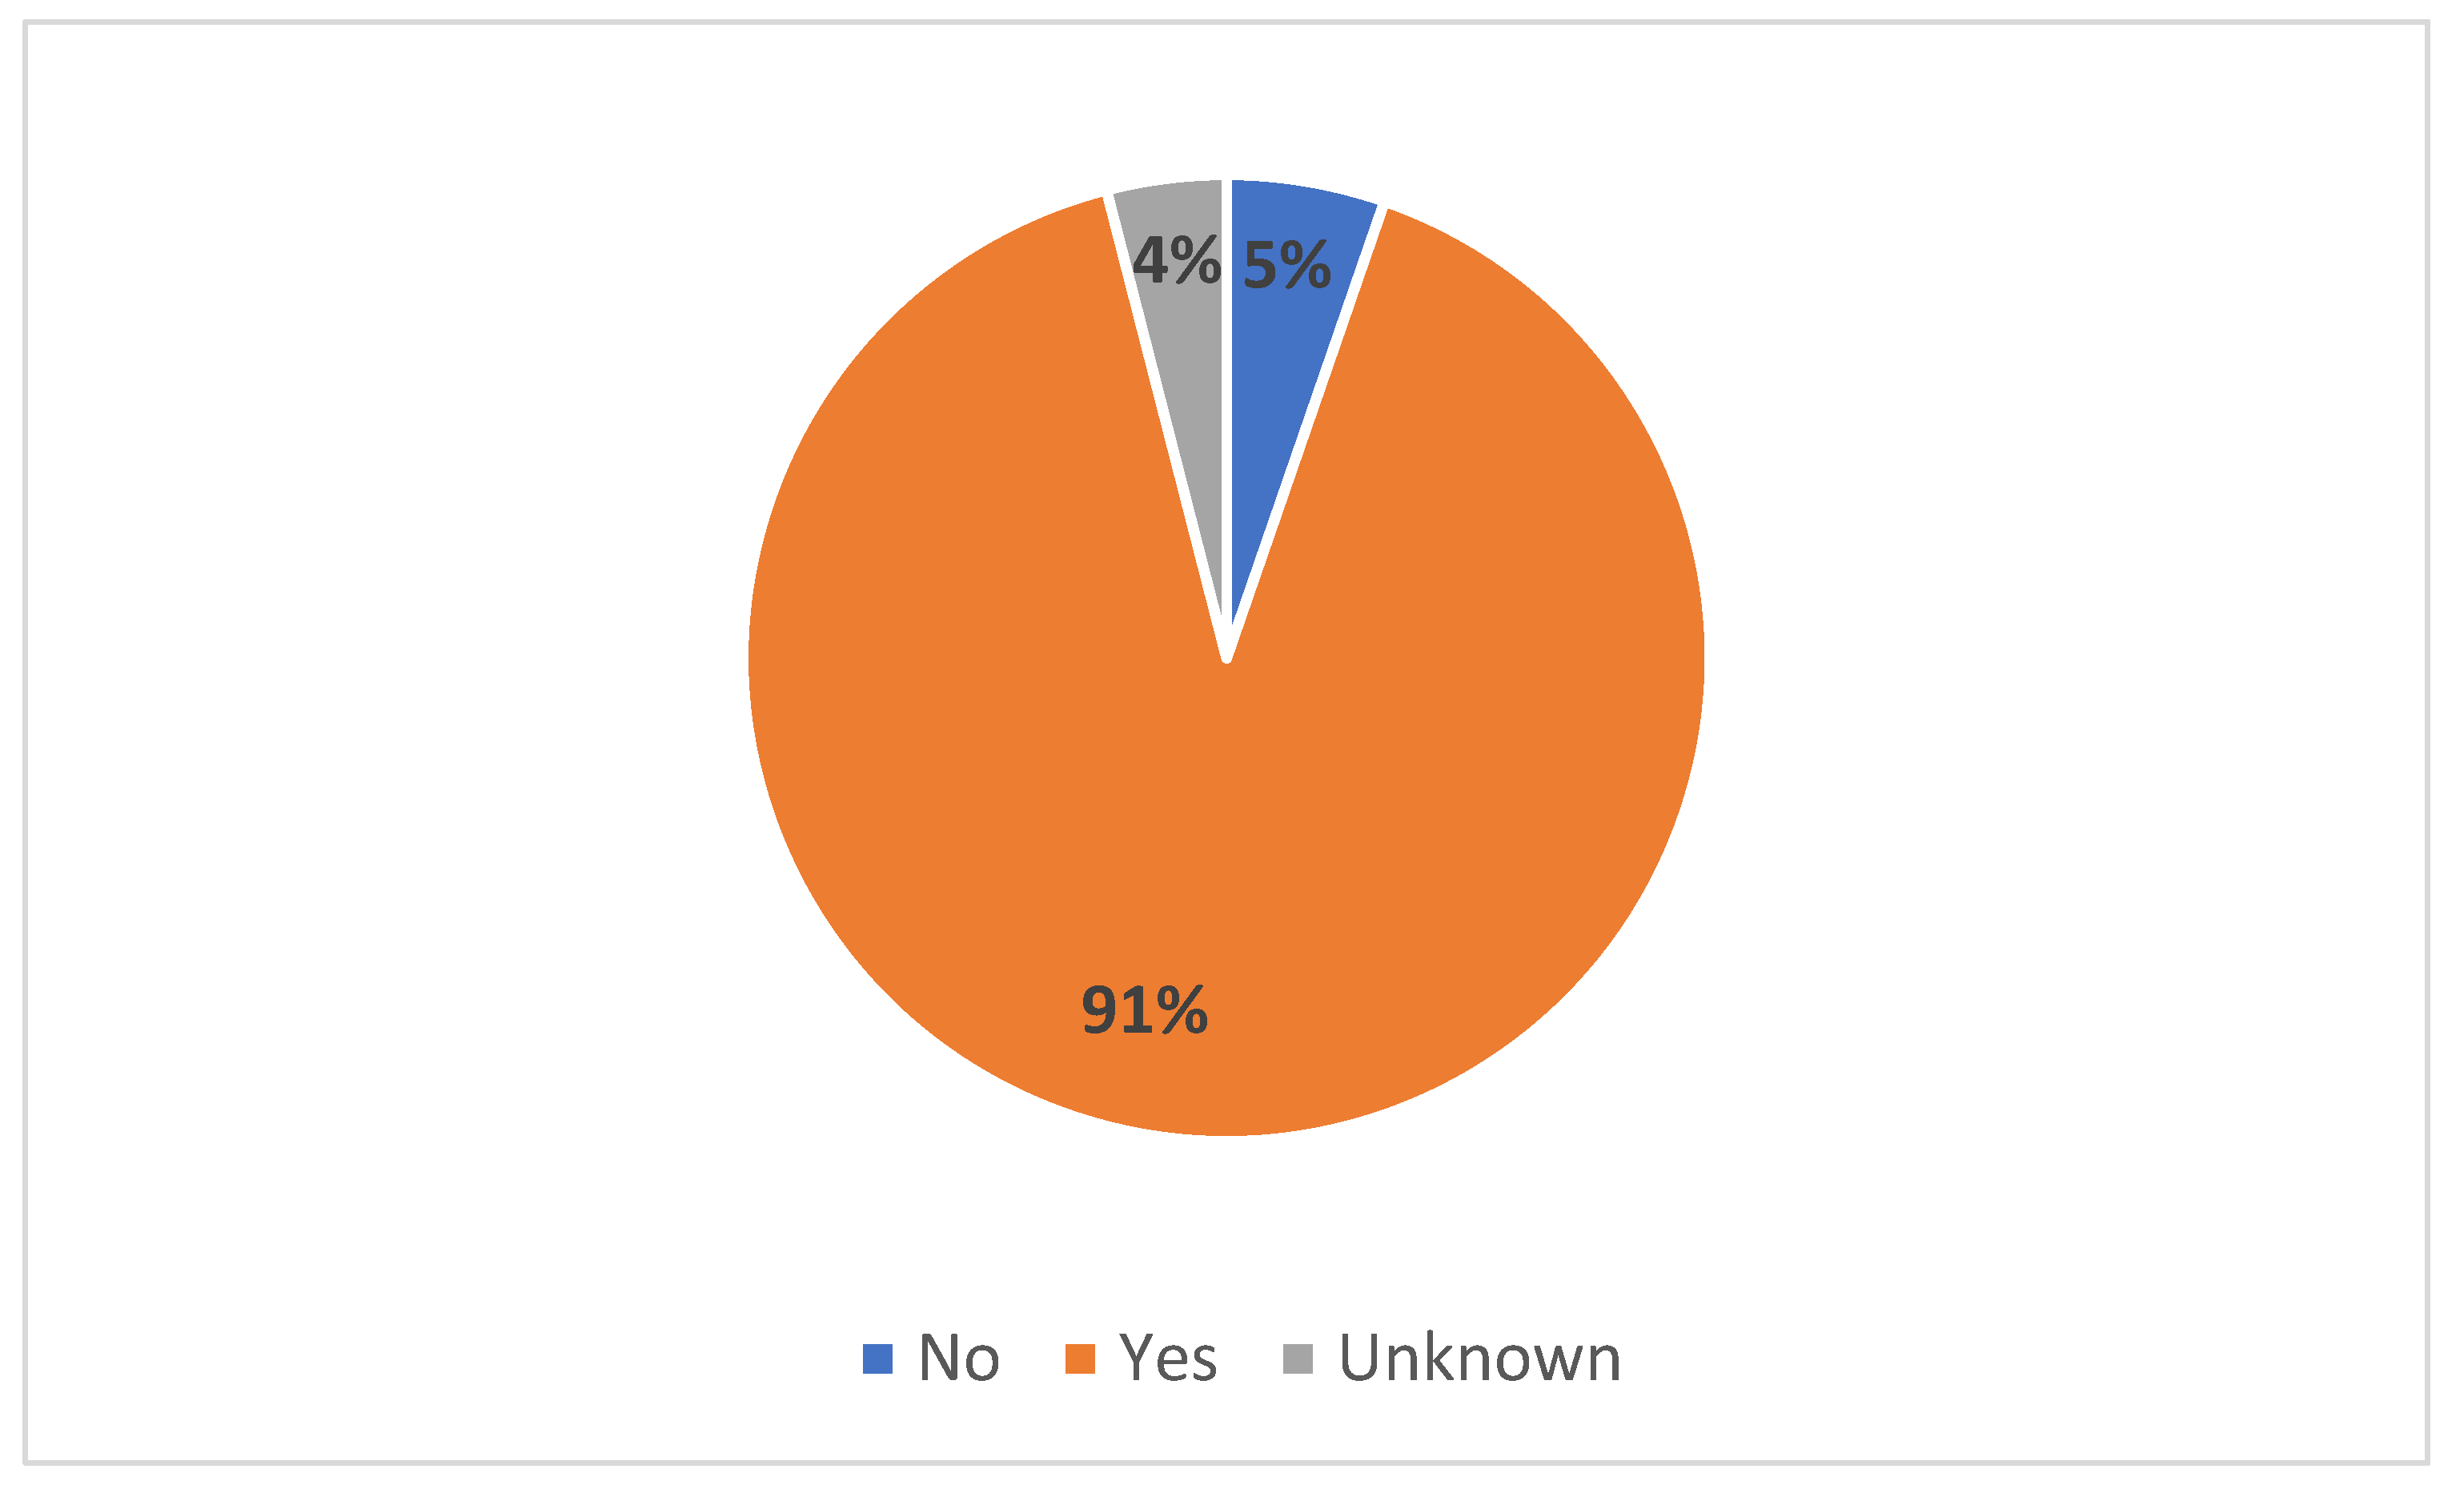
Figure 4.9 is showing that 90.6% of the respondents were aware of the BIM benefits. 5.3% were not aware and 4% had no idea. Considering the high percentage of awareness, this is a positive indication that BIM technology uptake can easily take place when promoted.
Then the respondents had to rate the importance of the 25 BIM benefits variables which were selected from literature review. Table 4.6 presents the results of the analysis of the rate of importance of the selected BIM benefits.
Table 4.6.
Ranking of Benefits of BIM.
| Factor | 1 | 2 | 3 | 4 | 5 | Total | RII | Rank | |
|---|---|---|---|---|---|---|---|---|---|
| B1 | Enhanced design analysis and efficiency due to produced element details | 0 | 2 | 8 | 13 | 48 | 71 | 0.9 | 1 |
| B2 | Generation of accurate and consistent 3D drawings at any stage | 1 | 3 | 3 | 18 | 45 | 70 | 0.89 | 2 |
| B3 | Enhance collaboration between project parties | 1 | 1 | 8 | 16 | 45 | 71 | 0.89 | 3 |
| B4 | Earlier and more accurate design visualisation | 1 | 1 | 6 | 21 | 41 | 70 | 0.89 | 4 |
| B5 | Improved design quality | 0 | 3 | 5 | 22 | 38 | 68 | 0.88 | 5 |
| B6 | Enhance communication between project parties | 2 | 1 | 7 | 22 | 39 | 71 | 0.87 | 6 |
| B7 | Reduced redesign challenges during project implementation | 1 | 1 | 8 | 23 | 35 | 68 | 0.86 | 7 |
| B8 | Potentially improved maintenance of the infrastructure due to the as-built model | 1 | 2 | 8 | 23 | 36 | 70 | 0.86 | 8 |
| B9 | Improved communication among various divisions of the same company | 1 | 2 | 10 | 20 | 37 | 70 | 0.86 | 9 |
| B10 | Greater productivity due to easy retrieval of information. | 2 | 2 | 7 | 23 | 35 | 69 | 0.85 | 10 |
| B11 | Enhanced work coordination with subcontractors/supply chain | 2 | 5 | 9 | 16 | 38 | 70 | 0.84 | 11 |
| B12 | Improved coordination in the construction phase | 1 | 3 | 12 | 20 | 34 | 70 | 0.84 | 11 |
| B13 | Reduce reworking during construction | 3 | 3 | 11 | 16 | 37 | 70 | 0.83 | 13 |
| B14 | Improved management of projects schedule milestones | 2 | 6 | 5 | 23 | 34 | 70 | 0.83 | 13 |
| B15 | Potentially improved whole life asset management | 2 | 4 | 10 | 19 | 35 | 70 | 0.83 | 13 |
| B16 | Improved maintenance due to level of details produced | 4 | 4 | 6 | 21 | 34 | 69 | 0.82 | 16 |
| B17 | Efficiencies from reuse of data or details (enter once, use many times) | 4 | 2 | 10 | 21 | 33 | 70 | 0.82 | 17 |
| B18 | Improved site analysis | 0 | 5 | 13 | 27 | 25 | 70 | 0.81 | 18 |
| B19 | Greater predictability of project time and cost | 2 | 6 | 13 | 17 | 32 | 70 | 0.8 | 19 |
| B20 | Improved conflict detection | 3 | 5 | 10 | 23 | 29 | 70 | 0.8 | 20 |
| B21 | Improve project information management | 1 | 4 | 4 | 4 | 14 | 27 | 0.79 | 21 |
| B22 | Fewer change/variation orders at the construction stage | 5 | 8 | 9 | 17 | 31 | 70 | 0.77 | 22 |
| B23 | Improved human resources management | 1 | 9 | 15 | 21 | 24 | 70 | 0.77 | 23 |
| B24 | Enhanced management of security and safety information | 2 | 9 | 14 | 25 | 20 | 70 | 0.75 | 24 |
| B25 | Allowing accurate site logistics | 3 | 6 | 22 | 14 | 24 | 69 | 0.74 | 25 |
According to the results in Table 4.6, enhanced design analysis and efficiency due to produced element details came first with RII of 0.90. Second was generation of accurate and consistent 3D drawings at any stage with RII of 0.89. Third was enhance collaboration between project parties with RII of 0.89. Fourth was easier and more accurate design visualization with RII of 0.89 and fifth was improved design quality with 0.88.
In order to show details of the results on the rating of each of the BIM benefits, a graphical representation was done. Figure 4.10 shows this graphical representation of the analysis of the factors.
Figure 4.10.
Respondents Ranking on BIM Benefits.
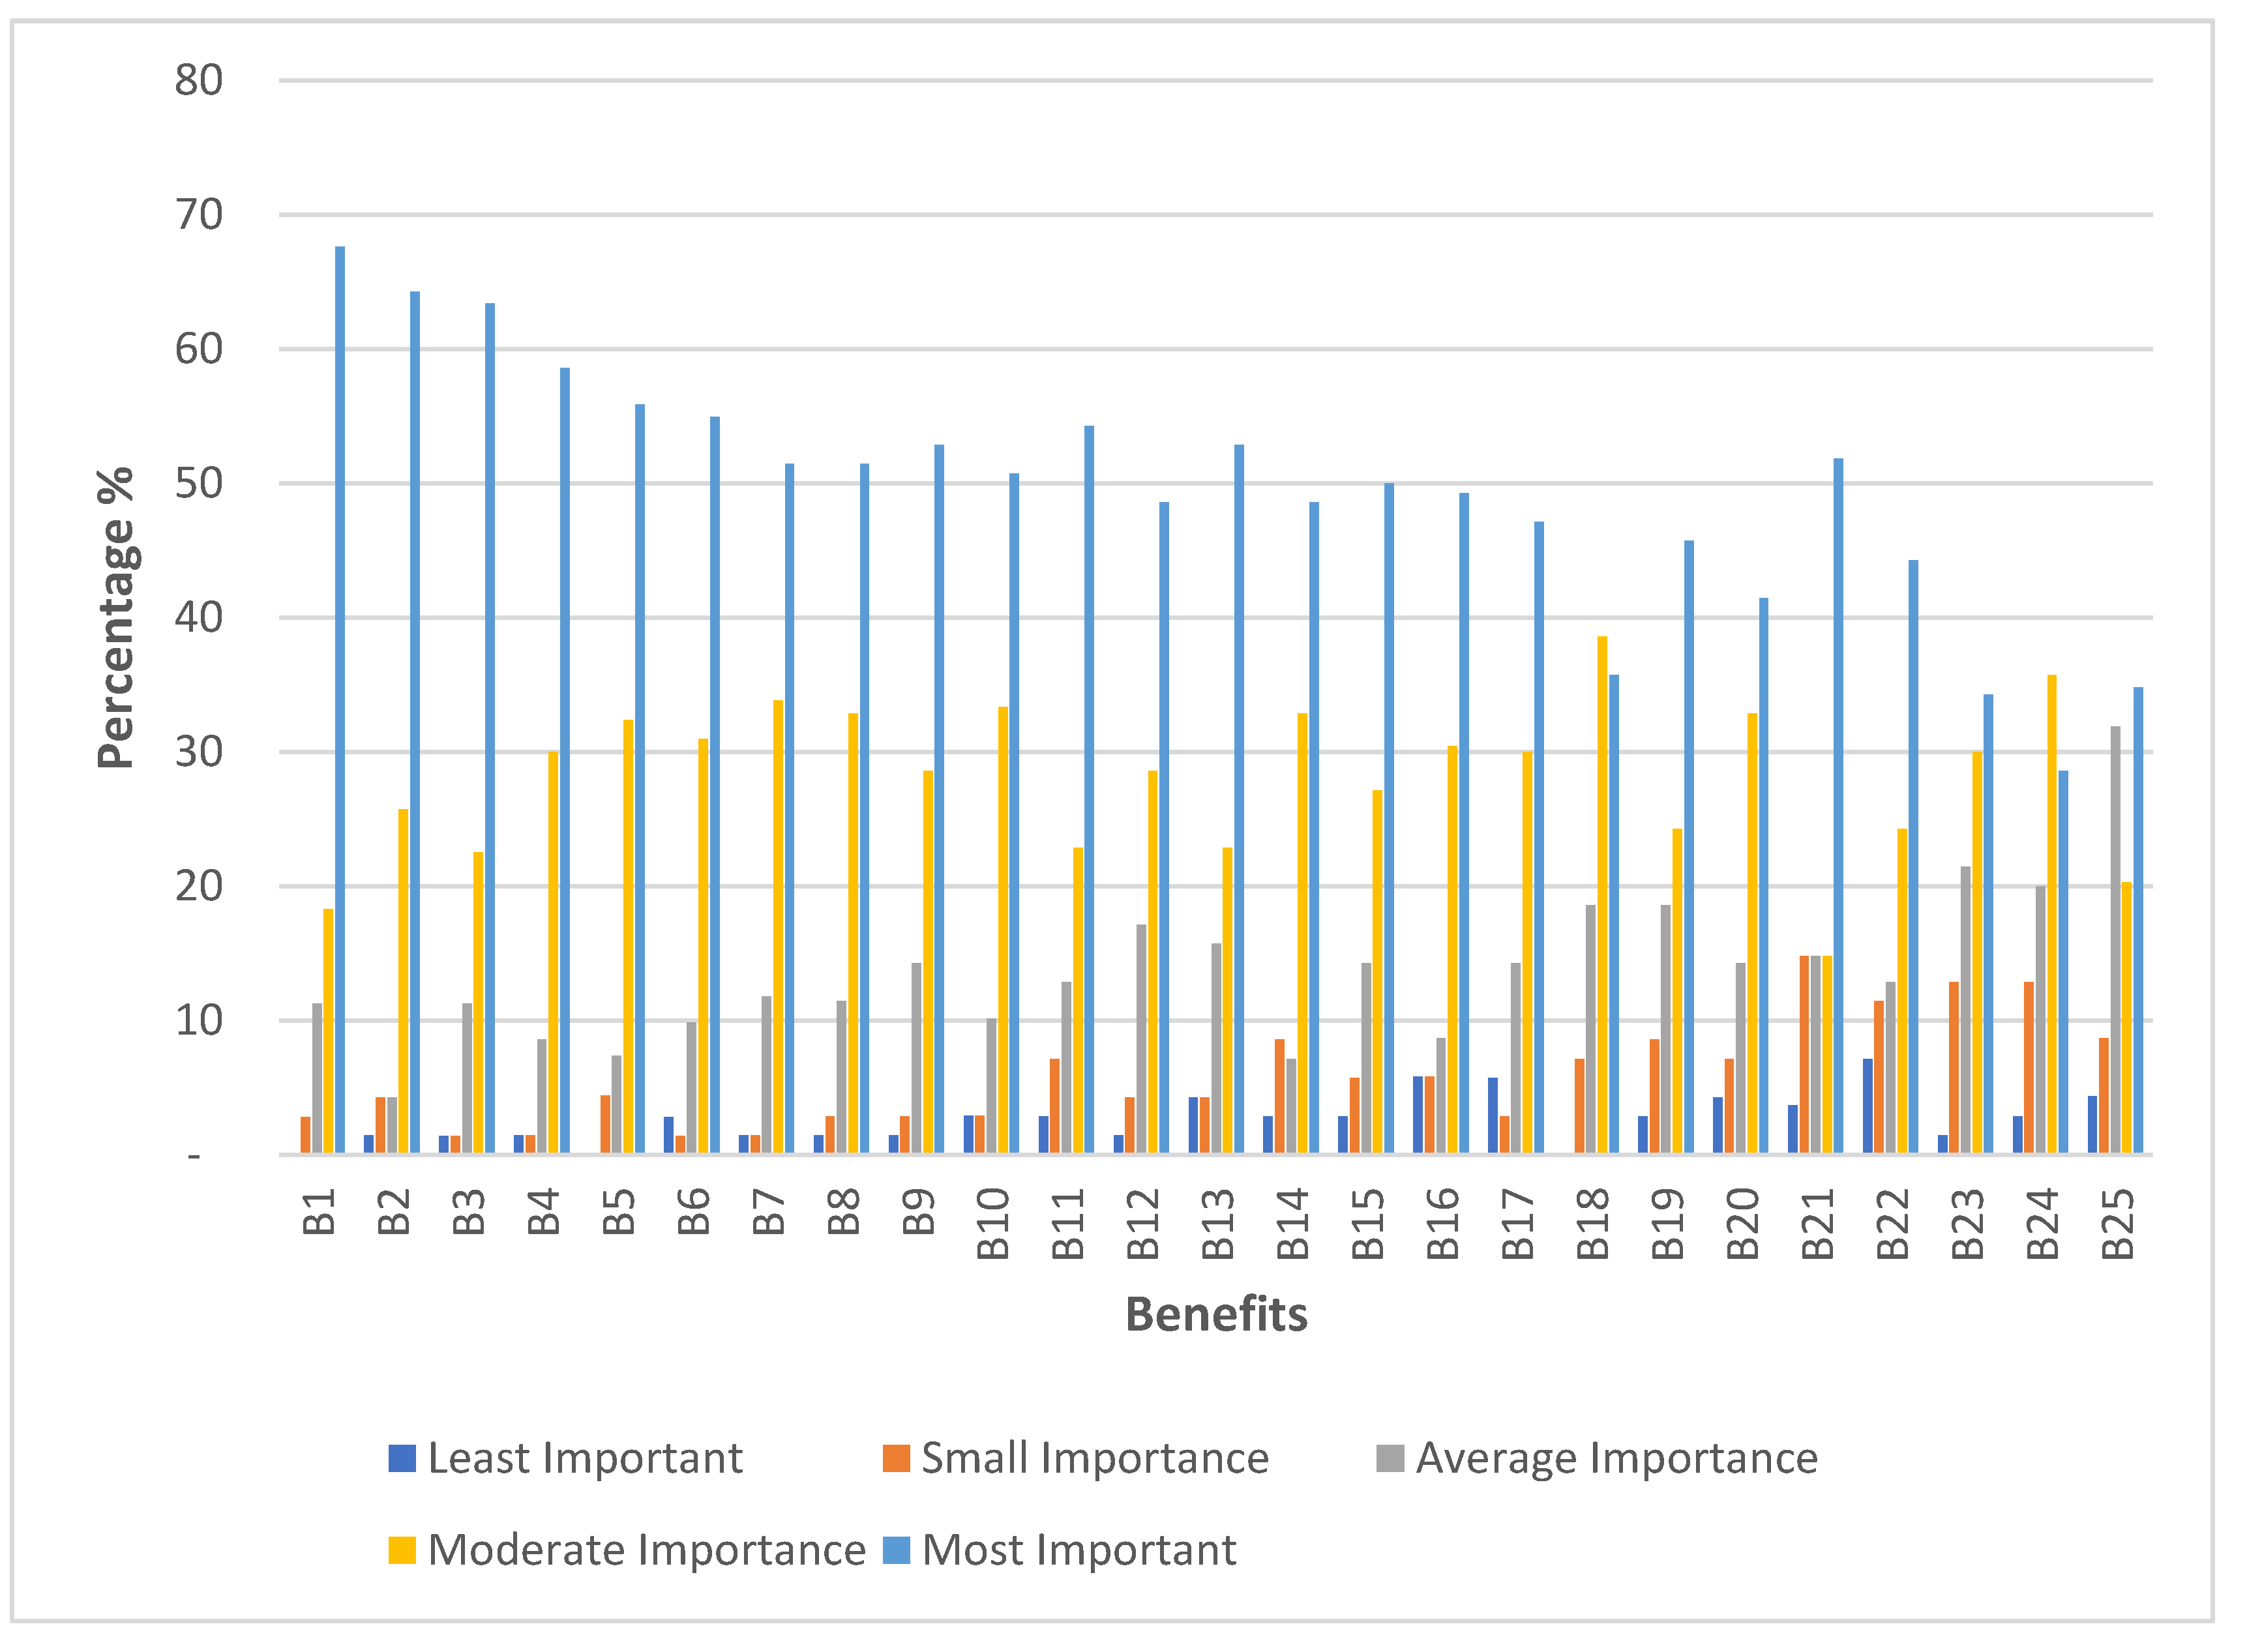
Considering the factors in detail, Figure 4.10 indicates that 68% of the respondent indicated that enhanced design analysis and efficiency due to produced element details is the most important factor, whereas 18%, 11%, 3% and 0% of the respondents indicated that the importance level was moderate, average, small and least important respectively. Similarly, ratings for each of the 25 factors has been shown likewise.
5. Conclusions
Considering the above results, the general status of BIM implementation in Malawi is in its infancy. The paper has highlighted several areas which construction experts were reviewed and the analysis of the results is as below.
Awareness of BIM – The research has revealed that construction experts are aware of BIM. However, architects top the list in knowledge wise than the other construction experts. As indicated above, this is mainly due to the fact that BIM started with the buildings sector and then grew to be used in the other infrastructure sectors such as roads, airports and railways.
Years of Use – The majority of construction experts in Malawi have less than two years’ experience in use of BIM. This is a clear testament that BIM use is just picking up in the country.
Number of Projects Done – Considering the number of projects done by construction experts, the results revealed that the majority of experts have done less than two projects using BIM. However, a considerable number of architects have carried out a number of projects than other experts. This is a clear indication that architects are way ahead the other experts in BIM usage.
Software Used – The most used software for BIM technology is Malawi is AutoCAD and seconded by Civil 3D. AutoCAD is a basic sketching software which is versatile and commonly used in technical drawings. Hence as one advances in using BIM in higher levels, more advanced software has to be used. Hence use of Civil 3D has been introduced to handle a bit complex drawing. Then the next level is use of software which can transfer data from one software to the other to link data such as for costing or scheduling. The issue of data interoperability comes in and also software compatibility.
Level of Use of BIM – The research has shown that the majority of experts in Malawi are on level 1 of BIM usage. level one is the first stage of BIM adoption which is characterized by use of 3D models and output representation.
Awareness of BIM Benefits – The study has showed that the majority of the construction experts are aware of the benefits of BIM. The high awareness level of BIM benefits could be due to the phenomena of reflection when responding to questions by the construction experts during the survey.
6. Recommendations
Considering the current status of BIM technology in Malawi, deliberate effort has to be done to improve the use of BIM in the construction industry. The first is that the Government has to produce policies and guidelines to promote use of BIM since at the meantime use of BIM is a personal or institutional initiative. Secondly, BIM technology has to be included in the curriculum of institutions of higher learning. This will ensure mainstreaming BIM technology in the university syllabus which can positively influence the construction industry. Construction institutions should be encouraged to undertake research and development in BIM technology. And lastly, institutions who have the intention to use BIM technology have to be promoted since it is consistency and positivity which contributes to BIM adoption and use.
Author Contributions
Conceptualization, J.C. and I.K.; methodology and publication search, J.C. and W.K..; analysis, J.C..; writing—original draft preparation and writing, J.C..; review and editing, I.K. and W.K.; supervision—I.K. and W.K. All authors have read and agreed to the published version of the manuscript.
Funding
This research received no external funding.
Data Availability Statement
Data is available upon request.
Conflicts of Interest
The authors declare no conflict of interest.
References
- Arellano, K.; Andrade, A.; Castillo, T.; Herrera, R. F. Assessment of BIM use in the early stages of implementation. Rev. Ing. Constr. 2021, 36(no. 3), 311–321. [Google Scholar] [CrossRef]
- Saka, A. B.; Chan, D. W. M. A scientometric review and metasynthesis of building information modelling (BIM) research in Africa. Buildings 2019, 9(no. 4). [Google Scholar] [CrossRef]
- World Bank, A Narrow Path to Prosperity. 2023. Available online: https://documents.worldbank.org/en/publication/documents-reports/documentdetail/099121123151012043/p17753704298250df0b05d02489cfd76b51.
- Government of Malawi, “Malawi 2063,” Malawi ’s Vision. In An inclusively wealthy self-reliant nation; 2020; pp. 1–92.
- Kulemeka, P. J.; Kululanga, G.; Morton, D. Critical Factors Inhibiting Performance of Small- and Medium-Scale Contractors in Sub-Saharan Region: A Case for Malawi. J. Constr. Eng. 2015, 2015, 1–17. [Google Scholar] [CrossRef]
- Mmadi, S. Enhancing Road Infrastructure Financing in Malawi: A Comprehensive Analysis & Recommendations. Int. J. Multidiscip. Res. 2023, 5(no. 5). [Google Scholar] [CrossRef]
- Foster, V.; Shkaratan, M. Malawi’s Infrastructure A Continental Perspective. 2011. Available online: http://econ.worldbank.org.
- Sukasuka, G. N.; Manase, D. Best Practice Guide to Procurement Challenges of Public-Private Partnerships in Infrastrcture Development in Malawi. J. Constr. Proj. Manag. Innov. 2016, 6, 1503–1518. [Google Scholar]
- Government of Malawi. “Public-Private-Partnership-ACT-2022,” no. 23. 2022. Available online: https://api.pppc.mw/storage/547/Public-Private-Partnership-ACT-2022-and-Policy(2)-(003)-editing-(005).pdf.
- Adetoro, P.; Kululanga, G.; Mkandawire, T.; Malik, A. A Critical Analysis of Factors Influencing BIM Implementation for Public Projects in Developing Countries: A Case Study of Malawi. Buildings 2025, 15(no. 3). [Google Scholar] [CrossRef]
- Chilipunde, R. L. Contraints and Challenges Faced by Small, Medium and Micro Enterprise Contractors in Malawi; 2010. [Google Scholar]
- Emuze, F.; Kadangwe, S. Diagnostic view of road projects in Malawi. Proc. Inst. Civ. Eng. Munic. Eng. 2014, 167(no. 1), 44–55. [Google Scholar] [CrossRef]
- Hershey, R.; Kalina, M.; Kafodya, I.; Tilley, E. A sustainable alternative to traditional building materials: assessing stabilised soil blocks for performance and cost in Malawi. Int. J. Sustain. Eng. 2023, 16(no. 1), 155–165. [Google Scholar] [CrossRef]
- Kafodya, *!!! REPLACE !!!*; Basuroy, D.; Marangu, J. M.; Kululanga, G.; Maddalena, R.; Novelli, V. I. Mechanical Performance and Physico-Chemical Properties of Limestone Calcined Clay Cement (LC3) in Malawi. Buildings 2023, 13(no. 3). [Google Scholar] [CrossRef]
- Antwi-Afari, M. F.; Li, H.; Pärn, E. A.; Edwards, D. J. Critical success factors for implementing building information modelling (BIM): A longitudinal review. Autom. Constr. 2018, 91, 100–110. [Google Scholar] [CrossRef]
- Bryde, D.; Broquetas, M.; Volm, J. M. The project benefits of building information modelling (BIM). Int. J. Proj. Manag. 2013, 31(no. 7), 971–980. [Google Scholar] [CrossRef]
- Ahn, E.; Kim, M. BIM awareness and acceptance by architecture students in Asia. J. Asian Archit. Build. Eng. 2016, 15(no. 3), 419–424. [Google Scholar] [CrossRef]
- Gheisari, M.; Irizarry, J. Investigating human and technological requirements for successful implementation of a BIM-based mobile augmented reality environment in facility management practices. Facilities 2016, 34(no. 1–2), 69–84. [Google Scholar] [CrossRef]
- Fernández-Mora, V.; Navarro, I. J.; Yepes, V. Integration of the structural project into the BIM paradigm: A literature review. J. Build. Eng. 2021, 53, 2022. [Google Scholar] [CrossRef]
- Ndwandwe, M.; Kuotcha, W.; Mkandawire, T. Organizational Readiness for Building Information Modeling Implementation in Malawi: Awareness and Competence. Buildings 2024, 14(no. 8). [Google Scholar] [CrossRef]
- Ndwandwe, M.; Kuotcha, W.; Mkandawire, T. Building information modeling: implementation challenges in the Malawian construction industry. Front. Built Environ. 2024, 10. [Google Scholar] [CrossRef]
- Chagunda, G.; Kuotcha, W.; Kafodya, I. Factors influencing Building Information (BIM) implementation in developing countries. Build. Smart, Resilient Sustain. Infrastruct. Dev. Ctries. 2023, 273–280. [Google Scholar] [CrossRef]
- Jung, W.; Lee, G. The Status of BIM Adoption on Six Continents. Int. J. Civ. Environ. Eng. 2015, 9(no. 5), 512–516. Available online: www.sciencedirect.com.
- Borkowski, A. S. Evolution of BIM: Epistemology, Genesis and Division into Periods. J. Inf. Technol. Constr. 2023, 28, 646–661. [Google Scholar] [CrossRef]
- Miettinen, R.; Paavola, S. Beyond the BIM utopia: Approaches to the development and implementation of building information modeling. Autom. Constr. 2014, 43, 84–91. [Google Scholar] [CrossRef]
- Succar, B. Building information modelling framework: A research and delivery foundation for industry stakeholders. Autom. Constr. 2009, 18(no. 3), 357–375. [Google Scholar] [CrossRef]
- UK Government, “Government Construction Strategy,” Construction, no. May, p. 43, 2011, [Online]. Available online: www.cabinetoffice.gov.uk.
- Succar, B. Building information modelling framework: A research and delivery foundation for industry stakeholders. Autom. Constr. 2009, 18(no. 3), 357–375. [Google Scholar] [CrossRef]
- Shilov, *!!! REPLACE !!!*; Shilova, L. To the question of the building information modeling technologies transition to a new development level. E3S Web of Conferences 2021, 281. [Google Scholar] [CrossRef]
- Prinsloo, D.; Bekker, M. C. BIM adoption & implementation trends in the South African AEC industry. Procedia Comput. Sci. 2025, 256, 1921–1928. [Google Scholar] [CrossRef]
- Fazeli, A.; Jalaei, F.; Khanzadi, M.; Banihashemi, S. BIM-integrated TOPSIS-Fuzzy framework to optimize selection of sustainable building components. Int. J. Constr. Manag. 2019, 22(no. 7), 1240–1259. [Google Scholar] [CrossRef]
- Najjar, K.; Tam, V. W. Y.; Di Gregorio, L. T.; Evangelista, A. C. J.; Hammad, A. W. A.; Haddad, A. Integrating parametric analysis with building information modeling to improve energy performance of construction projects. Energies 2019, 12(no. 8). [Google Scholar] [CrossRef]
- Safour, R.; Ahmed, S.; Zaarour, B. BIM Adoption around the World. Int. J. BIM Eng. Sci. 2021, 4(no. 2), 31–44. [Google Scholar] [CrossRef]
- Harun, A. N.; Samad, S. A.; Nawi, M. N. M.; Haron, N. A. Existing practices of building information modeling (BIM) implementation in the public sector. Int. J. Supply Chain Manag. 2016, 5(no. 4), 166–177. [Google Scholar]
- Hammoud, E. Al. Comparing BIM Adoption Around the World, Syria’s Current Status and Future. International Journal of BIM and Engineering Science 2021, 64–78. [Google Scholar] [CrossRef]
- Wong, A. K. D.; Wong, F. K. W.; Nadeem, A. Attributes of building information modelling implementations in various countries. Archit. Eng. Des. Manag. 2010, 6, 288–302. [Google Scholar] [CrossRef]
- L. Liao and E. A. L. Teo. Critical Success Factors for enhancing the Building Information Modelling implementation in building projects in Singapore. J. Civ. Eng. Manag. 2017, 23(no. 8), 1029–1044. [CrossRef]
- S. Kubba, Green Building Design and Construction. Hayton Joe, 2017.
- Fürstenberg, D.; Lædre, O. Application of BIM design manuals: A case study. 27th Annu. Conf. Int. Gr. Lean Constr. IGLC 2019, 145, 145–156. [Google Scholar] [CrossRef]
- Aagesen, G.; Krogstie, J. Handbook on Business Process Management 1. Handb. Bus. Process Manag. 1 2010, 213–235. [Google Scholar] [CrossRef]
- Haron, A.; Devi, P.; Hassim, S.; Alias, A. H.; Tahir, M. M.; Harun, A. N. Project management practice and its effects on project success in Malaysian construction industry. IOP Conf. Ser. Mater. Sci. Eng. 2018, 291(no. 1), 0–7. [Google Scholar] [CrossRef]
- Lee, S. H.; Kim, B. G. IFC extension for road structures and digital modeling. Procedia Eng. 2011, 14, 1037–1042. [Google Scholar] [CrossRef]
- World Bank, Benchmarking Infrastructure Development 2020. 2020.
- The Queensland Government, “Building Information Modelling (BIM) for Transport and Main Roads Guideline,” no. May, pp. 1–21, 2024, [Online]. Available: file:///C:/Users/Deinsam/Downloads/BIM-Guideline.pdf.
- Ullah, K.; Lill, I.; Witt, E. An overview of BIM adoption in the construction industry: Benefits and barriers. In Emerald Reach Proceedings Series; Emerald Group Holdings Ltd., 2019; vol. 2, pp. 297–303. [Google Scholar]
- Edirisinghe, R.; London, K. Comparative Analysis of International and National Level BIM Standardization Efforts and BIM adoption. Proc. 32nd CIB W78 Conf. 2015, 27th-29th Oct. 2015, Eindhoven, Netherlands, 2015; pp. 149–158. [Google Scholar]
- Cheng, J. C. P.; Lu, Q. A review of the efforts and roles of the public sector for BIM adoption worldwide. Journal of Information Technology in Construction 20(October), 442–478.
- Walasek, D.; Barszcz, A. Analysis of the Adoption Rate of Building Information Modeling [BIM] and its Return on Investment [ROI]. in Procedia Engineering 2017, 172, 1227–1234. [Google Scholar] [CrossRef]
- Hamma-adama, M.; Kouider, T. A Review on Building Information Modelling in Nigeria and Its Potentials. World Acad. Sci. Eng. Technol. Int. J. Civ. Environ. Eng. 2018, 12(no. 11), 1113–1119. [Google Scholar]
- Nassereddine, H.; Hatoum, M. B.; Hanna, A. S. Overview of the State-of-Practice of BIM in the AEC Industry in the United States. Proc. Int. Symp. Autom. Robot. Constr. 2022, 524–531. [Google Scholar] [CrossRef]
- Ahankoob, A.; Abbasnejad, B.; Aranda-Mena, G. Building Information Modelling (BIM) Acceptance and Learning Experiences in Undergraduate Construction Education: A Technology Acceptance Model (TAM) Perspective—An Australian Case Study. Buildings 2025, 15. [Google Scholar] [CrossRef]
- Herr, A. M.; Fischer, T. BIM adoption across the Chinese AEC industries: An extended BIM adoption model. J. Comput. Des. Eng. 2019, 6(no. 2), 173–178. [Google Scholar] [CrossRef]
- Mutonyi, *!!! REPLACE !!!*; Cloete, C. Adoption of Building Information Modelling in the construction industry in Kenya design quality is influenced by the number of. Acta Structilia 2018, 25(no. 2), 1–38. [Google Scholar]
- Olorunfemi, E.; Oyewobi, L.; Olanrewaju, O.; Olorunfemi, R. “Competencies and the Penetration Status of Building Information Modelling Among Built Environment Professionals in Nigeria,” 2021. Available online: https://www.researchgate.net/publication/352787164.
- Balah, M.; Akut, L. Assessment of Building Information Modeling (BIM) Knowledge in the Nigerian Construction Industry. Int. J. Civ. Environ. Eng. IJCEE-IJENS 2015, 15, 1. [Google Scholar]
- Al-Ashmori, Y. Y. , BIM benefits and its influence on the BIM implementation in Malaysia. Ain Shams Eng. J. 2020, vol. 11(no. 4), 1013–1019. [Google Scholar] [CrossRef]
- A. B. Saka, D. W. M. Chan, and F. M. F. Siu, “Adoption of Building Information Modelling in Small and Medium-Sized Enterprises in Developing Countries : A System Dynamics Approach .,” CIB World Build. Congr. 2019, no. June, 2019.
- Hong, Y.; Hammad, A. W. A.; Sepasgozar, S.; Akbarnezhad, A. BIM adoption model for small and medium construction organisations in Australia. Eng. Constr. Archit. Manag. 2019, vol. 26(no. 2), 154–183. [Google Scholar] [CrossRef]
- Alhasan, S.; Kumar, B.; Thanikal, J. V. Effectiveness of implementing 5D functions of Building information modeling on professions of quantity surveying - A review. Int. J. Civ. Eng. Technol. 2017, vol. 8(no. 5), 783–800. [Google Scholar]
- Kumar, B.; Cai, H.; Hastak, M. An assessment of benefits of using BIM on an infrastructure project. Int. Conf. Sustain. Infrastruct. 2017 Technol. - Proc. Int. Conf. Sustain. Infrastruct. 2017, 2017, 88–95. [Google Scholar] [CrossRef]
- S. Azhar, “Building Information Modeling (BIM): Trends, Benefits, Risks, and Challenges for the AEC Industry,” 2011.
- Masood, R.; Kharal, M. K. N.; Nasir, A. R. Is BIM adoption advantageous for construction industry of Pakistan? in Procedia Engineering 2014, vol. 77, 229–238. [Google Scholar] [CrossRef]
- Fazli, A.; Fathi, S.; Enferadi, M. H.; Fazli, M.; Fathi, B. Appraising Effectiveness of Building Information Management (BIM) in Project Management. Procedia Technol. 2014, vol. 16, 1116–1125. [Google Scholar] [CrossRef]
- Mesároš, *!!! REPLACE !!!*; Mandičák, T. Exploitation and Benefits of BIM in Construction Project Management. IOP Conference Series: Materials Science and Engineering 2017, vol. 245(no. 6). [Google Scholar] [CrossRef]
- Mohd Noor, M. N.; Junaidi, S. R.; Ramly, M. K. A. Adoption of Building Information Modelling (BIM): Factors Contribution and benefits. J. Inf. Syst. Technol. Manag. 2018, vol. 3(no. 10), 47–63. Available online: www.jistm.com.
- Al Hattab, M.; Hamzeh, F. Using social network theory and simulation to compare traditional versus BIM-lean practice for design error management. Autom. Constr. 2015, vol. 52, 59–69. [Google Scholar] [CrossRef]
- Aranda-Mena, G.; Crawford, J.; Chevez, A.; Froese, T. Building information modelling demystified: does it make business sense to adopt BIM? Int. J. Manag. Proj. Bus. 2009, vol. 2(no. 3), 419–434. [Google Scholar] [CrossRef]
- Dakhil, A.; Alshawi, M. Client’s Role in Building Disaster Management through Building Information Modelling. Procedia Econ. Financ. 2014, vol. 18, 47–54. [Google Scholar] [CrossRef]
- Lee, G.; Park, H. K.; Won, J. D 3 City project - Economic impact of BIM-assisted design validation. Automation in Construction 2012, vol. 22, 577–586. [Google Scholar] [CrossRef]
- Sacks, *!!! REPLACE !!!*; Radosavljevic, M.; Bonen, B. A Building Information Modelling Based Production Control System for Construction; 2010; pp. 1–13. [Google Scholar]
- Azhar, M. Khalfan; Maqsood, T. Building Information Modeling (BIM): Now and Beyond; 2012. [Google Scholar]
- Yan, H.; Damian, P. Benefits and barriers of building information modelling. 12th Int. Conf. Comput. Build. Eng. 2008, pp. 1–5. Available online: https://hdl.handle.net/2134/23773.
- Pan, Y.; Zhang, L. Integrating BIM and AI for Smart Construction Management: Current Status and Future Directions. In Archives of Computational Methods in Engineering; Springer Science and Business Media B.V., 01 Mar 2023; vol. 30, no. 2, pp. 1081–1110. [Google Scholar] [CrossRef]
- Akinade, O. O. , Waste minimisation through deconstruction: A BIM based Deconstructability Assessment Score (BIM-DAS). Resour. Conserv. Recycl. 2015, vol. 105, 167–176. [Google Scholar] [CrossRef]
- Zhang, J.-K.; Lee, *!!! REPLACE !!!*; Venugopal, M.; Teizer, J.; Eastman, C. M. A Framework for Automatic Safety Checking of Building Information Models; 2012. [Google Scholar]
- Abdalla, B. , Comparative Analysis of Building Information Modeling (BIM) Patterns and Trends in the United Arab Emirates (UAE) with Developed Countries. Buildings 2023, vol. 13(no. 3). [Google Scholar] [CrossRef]
- Borrmann; Forster, C.; Liebich, T.; König, M.; Tulke, J. Germany’s Governmental BIM Initiative – The BIM4INFRA2020 Project Implementing the BIM Roadmap. Lect. Notes Civ. Eng. 2021, vol. 98, 452–465. [Google Scholar] [CrossRef]
- Eastman; Teicholz, P.; Sacks, R.; Liston, K. BIM Handbook, 2nd ed.; John Wiley & Sons, 2011; vol. 6, no. 11. [Google Scholar]
- Chan, W. M.; Olawumi, T. O.; Ho, A. M. L. Perceived benefits of and barriers to Building Information Modelling (BIM) implementation in construction: The case of Hong Kong. J. Build. Eng. 2019, vol. 25, 100764. [Google Scholar] [CrossRef]
- Zhao, P. A.; Wang, C. C. A Comparison of Using Traditional Cost Estimating Software and BIM for Construction Cost Control. In ICCREM 2014: Smart Construction and Management in the Context of New Technology - Proceedings of the 2014 International Conference on Construction and Real Estate Management; 2014; pp. 256–264. [Google Scholar] [CrossRef]
- Chong, H. Y.; Lopez, R.; Wang, J.; Wang, X.; Zhao, Z. Comparative Analysis on the Adoption and Use of BIM in Road Infrastructure Projects. J. Manag. Eng. 2016, vol. 32(no. 6), 1–13. [Google Scholar] [CrossRef]
- Sanem Bayar, M.; Aziz, Z.; Tezel, A.; Arayici, Y.; Biscaya, S. Optimizing Handover of As-Built Data Using Bim for Highways. BIM Acad. Forum Conf., 2016. [Google Scholar]
- Masood, R.; Kharal, M. K. N.; Nasir, A. R. Is BIM adoption advantageous for construction industry of Pakistan? Procedia Eng. 2014, vol. 77, 229–238. [Google Scholar] [CrossRef]
- Azhar, S. “D., a.M.Asce,” Build. Inf. Model. Trends, Benefits, Risks, Challenges AEC Ind. 2011, vol. 11(no. 3), 241–252. [Google Scholar]
- Ghaffarianhoseini, A. , Building Information Modelling (BIM) uptake: Clear benefits, understanding its implementation, risks and challenges. Renew. Sustain. Energy Rev. 2017, vol. 75, 1046–1053. [Google Scholar] [CrossRef]
- Russell; Cho, Y. K.; Cylwik, E. Learning Opportunities and Career Implications of Experience with BIM/VDC. Pract. Period. Struct. Des. Constr. 2014, vol. 19(no. 1), 111–121. [Google Scholar] [CrossRef]
- Doumbouya, L.; Gao, G.; Guan, C. Adoption of the Building Information Modeling (BIM) for Construction Project Effectiveness: The Review of BIM Benefits. Am. J. Civ. Eng. Archit. 2016, vol. 4(no. 3), 74–79. [Google Scholar] [CrossRef]
- Migilinskas; Popov, V.; Juocevicius, V.; Ustinovichius, L. The benefits, obstacles and problems of practical bim implementation. Procedia Engineering 2013, vol. 57, 767–774. [Google Scholar] [CrossRef]
- Haider; Khan, U.; Nazir, A.; Humayon, M. Cost comparison of a building project by manual and BIM. Civ. Eng. J. 2020, vol. 6(no. 1), 34–49. [Google Scholar] [CrossRef]
- Biancardo, S. A.; Capano, A.; de Oliveira, S. G.; Tibaut, A. Integration of BIM and procedural modeling tools for road design. Infrastructures 2020, vol. 5(no. 4). [Google Scholar] [CrossRef]
- Abbasnejad, B.; Nepal, M. P.; Mirhosseini, S. A.; Moud, H. I.; Ahankoob, A. Modelling the Key Enablers of Organizational Building Information Modelling (BIM) Implementation: An Interpretive Structural Modelling (ISM) Approach. Journal of Information Technology in Construction 2021, 26, 974–1008. [Google Scholar] [CrossRef]
- Latupeirissa, J. E.; Arrang, H. Sustainability factors of building information modeling (BIM) for a successful construction project management life cycle in Indonesia. J. Build. Pathol. Rehabil. 2024, vol. 9(no. 1). [Google Scholar] [CrossRef]
- Rosli, M. F.; Razak, A. S.; Ameryounus, M. To BIM or not to BIM: A pilot study on University of Malaya’s architectural students’ software preference. 2016. [Google Scholar]
- Pittard, S.; Sell, P. BIM and Quantity Surveying, 1st ed.; Routledge: Oxon OX14, 2016. [Google Scholar]
- D’Amico, *!!! REPLACE !!!*; D’Ascanio, L.; De Falco, M. C.; Ferrante, C.; Presta, D.; Tosti, F. BIM for infrastructure: An efficient process to achieve 4D and 5D digital dimensions. Eur. Transp. - Trasp. Eur. 2020, no. 77. [Google Scholar] [CrossRef]
- Cao, Y.; Huang, L.; Aziz, N. M.; Kamaruzzaman, S. N. Building Information Modelling (BIM) Capabilities in the Design and Planning of Rural Settlements in China: A Systematic Review. Land 2022, vol. 11(no. 10), 1–36. [Google Scholar] [CrossRef]
- Li, J.; Li, N.; Peng, J.; Cui, H.; Wu, Z. A review of currently applied building information modeling tools of constructions in China. In Journal of Cleaner Production; Elsevier Ltd, 10 Nov 2018; vol. 201, pp. 358–368. [Google Scholar] [CrossRef]
- Samimpay, R.; Saghatforoush, E. Benefits of Implementing Building Information Modeling (BIM) in Infrastructure Projects. J. Eng. Proj. Prod. Manag. 2020, vol. 10(no. 2), 123–140. [Google Scholar] [CrossRef]
- Kara and Y. Abut, “The Benefits of Building Information Modeling (BIM) for Roads and Engineering Structures,” 10th Int. Baskent Congr. Phys. Eng. Appl. Sci., no. November, pp. 109–114, 2023.
- Mota, P.; Machado, F.; Biotto, C.; Mota, R.; Mota, B. BIM for production: Benefits and challenges for its application in a design-bid-build project. In 27th Annu. Conf. Int. Gr. Lean Constr. IGLC 2019; 2019; pp. 687–698. [Google Scholar] [CrossRef]
- Chan, D. W. M.; Olawumi, T. O.; Ho, A. M. L. Critical success factors for building information modelling (BIM) implementation in Hong Kong. Eng. Constr. Archit. Manag. 2019, vol. 26(no. 9), 1838–1854. [Google Scholar] [CrossRef]
- Saunders, M.; Philip, L.; Thornhill, A. Research Methods For Business Students, Fifth Edit., no. Ninth edition; Pearson Education Limited: Essex, 2023. [Google Scholar]
- Tavakol, M.; Dennick, R. Making sense of Cronbach’s alpha. International journal of medical education 2011, vol. 2., 53–55. [Google Scholar] [CrossRef]
- Maclnnes, J. An Introduction to Secondary Data Analysis with IBM SPPS Statistics, 1st Editio ed; SAGE Publications Ltd, 2017. [Google Scholar]
- Fellows, R.; Liu, A. Impact of participants’ values on construction sustainability. Proc. Inst. Civ. Eng. Eng. Sustain. 2008, vol. 161(no. 4), 219–227. [Google Scholar] [CrossRef]
- Bazán, Á. M.; Alberti, M. G.; Álvarez, A. A.; Trigueros, J. A. New perspectives for bim usage in transportation infrastructure projects. Appl. Sci. 2020, vol. 10(no. 20), 1–22. [Google Scholar] [CrossRef]
Table 2.2.
Most Significant Benefits of BIM.
| Category | Benefit | References |
|---|---|---|
| Functional Enhancement | Enhance communication between project parties | [58,61,62,63] |
| Improve project information management | [64,65] | |
| Enhance collaboration between project parties | [60,66] | |
| Enhanced design analysis and efficiency due to produced element details | [61], [67,68,69,70] | |
| Improved human resources management | [61,71] | |
| Reduce reworking during construction | [61,62,72], [63,66] |
|
| Reduced redesign challenges during project implementation | [61,62,63] | |
| Improved site analysis | [61,62,63,66] |
|
| Greater productivity due to easy retrieval of information. | [64,66] | |
| Enhanced work coordination with subcontractors/supply chain | [66,73] | |
| Improved conflict detection | [60,64] | |
| ] | Enhanced management of security and safety information | [62,63,74,75] |
| Allowing accurate site logistics | [72], [61,62,63,66] | |
| Improved coordination in the construction phase | [62,63,76] | |
| Improved communication among various divisions of the same company | [58,61,62,63,77] | |
| Potentially improved whole life asset management | [61], [23,63,68,78] | |
| Output Improvement | Improved design quality | [63,72] |
| Earlier and more accurate design visualisation | [58,66,79] | |
| Generation of accurate and consistent 3D drawings at any stage | [78,80,81] | |
| Greater predictability of project time and cost | [82], [61], [63,68,79,83] | |
| Improved management of projects schedule milestones | [68,69,84] | |
| Fewer change/variation orders at the construction stage | [68,69,85,86] | |
| Efficiencies from reuse of data or details (enter once, use many times) | [68,69,87] | |
| Improved maintenance due to level of details produced | [85,87] | |
| Potentially improved maintenance of the infrastructure due to the as-built model | [85,87,88] |
Table 4.1.
Awareness of Building Information Modelling (BIM).
| Frequency | Percent | Valid Percent | Cumulative Percent | ||
|---|---|---|---|---|---|
| Valid | No | 68 | 47.6 | 47.6 | 47.6 |
| Yes | 75 | 52.4 | 52.4 | 100.0 | |
| Total | 143 | 100.0 | 100.0 | ||
Disclaimer/Publisher’s Note: The statements, opinions and data contained in all publications are solely those of the individual author(s) and contributor(s) and not of MDPI and/or the editor(s). MDPI and/or the editor(s) disclaim responsibility for any injury to people or property resulting from any ideas, methods, instructions or products referred to in the content. |
© 2025 by the authors. Licensee MDPI, Basel, Switzerland. This article is an open access article distributed under the terms and conditions of the Creative Commons Attribution (CC BY) license (http://creativecommons.org/licenses/by/4.0/).
Copyright: This open access article is published under a Creative Commons CC BY 4.0 license, which permit the free download, distribution, and reuse, provided that the author and preprint are cited in any reuse.


