
Submitted:
05 December 2025
Posted:
08 December 2025
You are already at the latest version
Abstract
Traditional air temperature-based climate indices can be of high uncertainty in regions where ground observations are scarce. In this study we demonstrate how satellite-based heat indices can overcome the lack of station data. We calculate Summer Days and Tropical Nights indices defined by the Expert Team on Climate Change Detection and Indices (ETCCDI) for Switzerland and Europe, based on long-term Land Surface Temperature (LST) satellite climate data being available through EUMETSATs Satellite Application Facility on Climate Monitoring (CM SAF). Furthermore, we developed a novel "Extremely Hot Days index", particularly tailored to satellite-based LST data. We find that these satellite-based indices are highly correlated with station-based indices in Switzerland with coefficients of determination R2 of 0.86, 0.84 and 0.81. Results show strong increase in the satellite-based climate indices of up to 12 days per decade since 1991 in parts of Europe such as the Po Valley. With the new Extremely Hot Days index we find a pronounced increase of up to 12 days per decade along the Mediterranean coast, complementary to traditional indices. This demonstrates that satellite-based LST has a high value for accurately monitoring heatwaves. The presented methods can be applied globally wherever stable satellite data is available.
Keywords:
satellite data
; CM SAF
; land surface temperature
; heatwaves
; climate monitoring
; heat indices
; ETCCDI
1. Introduction
Heatwaves have profound impacts on ecosystems worldwide, threatening animals and plants, altering carbon fluxes, and posing unprecedented challenges to human societies [1,2,3,4]. It is now well established that increasing mean temperature due to climate change leads to an increase in intensity of extreme events even if the global warming is kept within 1.5 °C [5,6]. More than 175,000 people die from heat-related causes each year in Europe, according to the World Health Organization (WHO). Globally, at least 500,000 deaths per years are estimated to be related to heatwaves. Understanding the dynamics and predictability of heatwaves is therefore essential. Adaptation to heatwaves and preventing at least some of their harm, requires an understanding of temperature extremes in past, present and future.
To understand the spatio-temporal patterns of temperature extremes it is highly useful to rely on a set of standardized and meaningful climate metrics. The joint Ccl/WCRP/JCOMM Expert Team on Climate Change Detection and Indices (ETCCDI) has developed a series of standard climate indices, including temperature-based heat indices [7]. The modern sets of such indices, among which the most widely used is the ETCCDI collection, are statistically robust, cover a wide range of climate conditions, and have a high signal-to-noise ratio. The World Meteorological Organization (WMO) encourages the application of indices, stating that by using the same definitions of extremes and analyzing the data in a standardized way, it is possible to compare results from different places and to obtain coherent pictures of change around the world.
Many studies have shown increasing trends in Europe for temperature extremes and various climate indices. For example, Domínguez-Castro et al. [8] published a set of climate indices including 42 temperature-based indices for Europe. In Donat et al. [9] a gridded dataset for extreme temperatures and precipitations is presented with significant increasing trends in Europe. Dong et al. [10] also shows increasing trends for temperature extremes, Summer Days and Tropical Nights using gridded datasets both from interpolated observations and modeled data such as ERA5.
Tropical Nights over Europe have been particularly studied. Yavaşlı and Erlat [11] focused on the Mediterranean regions and found marked increases in Tropical Nights, especially in urban areas where they report trends up to 24.2 days per decade. Olcina Cantos et al. [12] and Correa et al. [13] showed a significant Tropical Nights increase in Spain during the second half of the 20th Century up to 10 days per decade, especially along the Mediterranean coast. All three studies highlight the influence of sea surface temperature (SST) as a contributing factor in coastal areas. The Mediterranean coastal regions are, however, not the only ones to experience Tropical Nights increase in Europe. In Switzerland, the number of Tropical Nights has increased over the Swiss Plateau and the south of Ticino in the last 50 years [14]. Moreover, Dailidienė et al. [15] have shown that the Southeast Baltic Sea coast is also affected by heatwaves and Tropical Nights increase in combination with SST warming.
The variable commonly used for the calculation of heat indices is the Near-Surface Air Temperature (NSAT), which is measured at ground stations. Data availability is thus directly related to the density of the observation networks and gridded NSAT datasets are produced either from reanalysis data or by interpolation of station measurements. Recently, Thompson et al. [16] have outlined that there is a strong disagreement between reanalysis products when assessing the most extreme days in data-sparse regions such as Africa. The lack of good quality data over Africa is particularly problematic as the continent is considered as one of the most vulnerable to heatwaves [16].
Satellite-based heat indices can overcome those limitations. Satellites provide observation-based gridded data, which is particularly interesting for regions suffering a lack of station coverage. Satellites measure, among other things, Land Surface Temperature (LST), which is a different physical variable compared to air temperature. There is a strong relationship between these two variables [17,18]. Good [19] showed that the amplitude of the LST diurnal cycle is usually stronger and that the maximum is reached earlier for LST than for NSAT. The author also points out that LST and NSAT are closest during nighttime or under cloudy conditions with moderate to high wind. Satellite-based LST measurements thus offer not only gridded observations with high spatial and temporal resolution, but also an independent variable which complements NSAT to monitor climate change [20,21].
Progress in satellite data recalibration in the recent years has enabled the emergence of stable satellite datasets covering long enough time periods for climatological studies, as shown for example for Europe in Good et al. [22] or Tetzlaff et al. [23]. Tetzlaff et al. [23] have performed a rigorous stability analysis on the new European Organisation for the Exploitation of Meteorological Satellites’ (EUMETSAT) Satellite Application Facility on Climate Monitoring (CM SAF) LST climate data record and have shown that the LST data are stable within for the last 30 years. For Europe significant trends in CM SAF LST data of are obtained, which match the station-based T2m trends of and further outline the stability of the CM SAF climate data record [24].
With the first stable satellite-based Land Surface Temperature Climate Data Records (CDR) for the current WMO reference period 1991-2020 being available, this study aims to demonstrate that meaningful heat indices can be derived from satellite-based Land Surface Temperature observations. To prove our concept, we selected Switzerland and Europe as test region as particularly dense and high quality homogenized air temperature data are available for validation.
We first show that meaningful "traditional" heat indices can be derived from the stable CM SAF LST Climate Data Records. For that purpose, we investigate the ETCCDI Summer Days index and Tropical Nights index, implemented for MeteoSwiss’s operational heatwave monitoring [25] and compare the LST- and NSAT-based Summer Days indices in Switzerland.
Second, we highlight the benefit of adding percentile-based indices for LST-based heatwave monitoring. The ETCCDI also provides a wide range of indices with thresholds calculated from the temperatures distributions rather than being arbitrary constant values. Furthermore Good et al. [26] use the percentile LST as threshold to identify the hottest regions of the planet. Hence, percentile-based indices can be considered to be LST-specific. In this study we therefore also propose a LST-specific, percentile-based new heat index and demonstrate how it can complement heat monitoring in Europe.
Third, we calculate "traditional" and "new" heat indices for Europe on a 0.05° latitude and longitude grid and discuss the LST-based indices in the general context of climate change.
2. Data and Methods
2.1. Satellite Data
The LST data used in this study is a Climate Data Record (CDR) from the EUMETSAT CM SAF. It is calculated from Meteosat first (MFG) and second (MSG) generation geostationary satellites observations. The period analyzed ranges from 1991 to 2004 for MFG and from 2005 to 2020 for MSG at hourly resolution, thus covering the entire new WMO reference period (1991-2020). The area extents between latitude and longitude with a spatial resolution of 0.05°, corresponding to about 5 grid cells for most parts of Europe.
In this study we analyse the CM SAF SUMET v.2.0 CDR [23] and the CM SAF LandFlux v.1.0 CDR [27,28] produced with the GeoSatClim software v.2.0. The CM SAF SUMET CDR contains clear-sky LST, while the CM SAF LandFlux CDR contains Surface Incoming Solar Radiation (SIS). The SIS is used to filter between daytime and nighttime. In addition to the LST CDR available from CM SAF, MeteoSwiss runs the Meteosat processing for LST using the CM SAF software GeoSatClim v.2.0. The processing covers the Swiss domain ranging from 45.025°N to 48.975°N in latitude and from 5.025°E to 10.975°E in longitude. The MeteoSwiss processing extends the CM SAF LST data beyond 2020 until present. For Switzerland, this data was analyzed covering the period 1991-2024.
2.1.1. Quality of the Satellite Data Sets
The CM SAF SUMET v.2.0 data are accurate and stable. Tetzlaff et al. [23] report a bias of less than 1 for monthly LST averages as compared to station measurements from LST reference sites. SUMET LST data also have an excellent agreement with homogenized station-based NSAT measurements from the EUSTACE project in Europe [23]. Tetzlaff et al. [23] performed rigorous stability tests following the method proposed by Good et al. [22]. Tetzlaff et al. [23] observe a trend in bias of about in the difference between the CM SAF LST and the EUSTACE NSAT anomalies. A comprehensive evaluation against ESAs Land Surface Temperature Climate Change Initiative (CCI) stable Moderate Resolution Imaging Spectroradiometer (MODIS) Aqua LSTs also outlines the stability of the LST data within over Europe for 1991-2020 [23]. This proves that the SUMET v.2.0 data is stable within in Europe. Yearly NSAT anomalies in Europe are in the order of compared to the reference period 1991-2020. Hence, the CM SAF SUMET CDR is more than sufficient to depict temperature anomalies in Europe. Tetzlaff et al. [23] therefore suggest that the CM SAF version 2.0 LSTs can be used as complementary temperature measure to characterize climate change in Europe over the entire new WMO 1991-2020 norm period.
2.2. Station Data
2.3. Heat Indices Definition
In this study we calculate three different heat indices: the Summer Days index, the Tropical Nights index and the Extremely Hot Days index.
With the Summer Days and Tropical Nights indices we selected two ETCCDI heat indices, which are currently implemented for MeteoSwiss’s operational heat monitoring. ETCCDI defines the Summer Days index as the number of days per year with maximum temperatures above 25°C and the Tropical Nights index as the number of days with the minimum temperature above 20°C. MeteoSwiss uses slightly modified indices setting by changing the operator from ">" to "≥". In this study, we strictly follow the MeteoSwiss Tropical Nights and Summer Days indices definition, i.e. we use the "≥" operator for both indices. Hence, we define the Tropical Nights index as the number of days per year with and the Summer Days index as the number of days per year with . By doing so, we can directly compare the satellite-based LST indices to the highly precise NSAT-based heat indices in Switzerland, which are calculated from homogenized station data [30]. For the Tropical Nights index we also filter the data to restrict the retrieval of the minimum temperature to the night. For this purpose we use a mask based on CM SAF Land Flux Solar Incoming Shortwave radiation (SIS). We exclude all timestamps with a non-zero solar radiation observation. A night ranges therefore from the first timestamp in the late afternoon/evening without SIS observation to the last in the early morning the following day. In this way we ensure that the minimum temperature of the night is used, while avoiding counting the same night twice.
The Extremely Hot Days index is a new index we propose for LST-based heat monitoring, i.e. this is an index not defined by ETCCDI. We define the Extremely Hot Days index as the number of days per year with maximum temperatures equal or above 39°C. The 39°C threshold is retrieved from the satellite-based LST data as the percentile temperature (rounded to integer) from the distributions of all LSTs at all space-time locations in the Swiss domain1. The percentile is chosen to isolate the most extreme events. The reasoning of this choice is to define a LST-based index that a) reflects the extreme hot conditions in the current climate, b) reflects the significantly larger amplitudes of the diurnal LST cycle compared to NSAT, c) is retrieved from the LST data itself, and d) is representative of a specific region, i.e. by choosing the percentile over all data points in the Swiss domain, extreme hot days are more likely to occur in lowlands than in the Alpine region. The latter also ensures that the threshold is relatively high and has an impact on human health. Since NSAT and LST have distinct different amplitudes of the diurnal maximum, we also calculate the percentile temperature (rounded to integer) from the distribution of all NSATs at all considered Swiss stations (). We then use the two different threshold settings ( and ) for NSAT and satellite-based LST respectively to calculate the Extremely Hot Days index. In this way we ensure that we are looking at similar pattern of the tails of the NSAT and LST-based distributions. By doing so, we define a new heat index specifically adapted to LST which accounts for the recorded temperatures the last years.
In this study, we newly introduce the concept of Relative Indices for all three selected satellite-based heat indices. Satellite-based LST data are restricted to clear-sky conditions, i.e. there are no measurements available beneath clouds. As a result, the number of valid observations can vary substantially across time and space, due to seasonal patterns in cloud cover. This decreases the number of available observations per year and results in less observations fulfilling the criteria of a specific index, thus introducing a bias. To mitigate this, we define relative indices as the fraction of valid satellite observations that meet the index condition, rather than absolute counts.
This fraction is calculated as the ratio of number of days matching the index condition (e.g ) versus total number of days with a available from satellite observations. Furthermore, since cloud cover (and thus observation frequency) might vary seasonally, we first compute these fractions on a monthly basis, then average across months to obtain a yearly value. This ensures that each month contributes equally to the annual index, regardless of how many clear-sky observations were available. The average yearly percentage of a given index is given by the following Equation 1:
With the number of days matching the condition (e.g. the number of Tropical Nights) in the month m and the year y, and the total number of valid observations in month m and year y. The monthly-based formulation thus reduces the bias introduced by seasonally variable cloud cover and ensures that each month’s contribution to the annual index is preserved regardless of the number of observations.
The definitions of the three heat indices considered in this study are summarized in Table 2.
Despite the extensive quality control, we detected outliers in the in the CM SAF SUMET LST v.2.0 dataset for specific grid cells and days and removed those values. We therefore exclude the following days for all locations and from all datasets:
- January 9 to 16, 2001
- December 12 to 22, 2006
- October 16 to 23, 2016
- May 7 to 14, 2018
In this paper we focus on land only heat indices and we have therefore removed all grid cells containing lakes. The mask is done by hand based on visual appreciation. Grid cells close to a lake on which one of the considered stations is located are not removed.
2.4. Comparison with Swiss Station Data
We compare the Tropical Nights, the Summer Days and the Extremely Hot Days indices calculated from the CM SAF clear-sky satellite-based LST data and station-based NSAT measurements in Switzerland.
- LST-CS: "LST clear-sky": CM SAF SUMET v.2.0 clear-sky observations.
- NSAT: "Near-Surface Air Temperature": Homogenized 2m air temperature measurements from SwissMetNet station data.
We selected 14 stations from the SwissMetNet used for operational heatwave monitoring to calculate heat indices. Those stations are equally distributed in Switzerland and are labeled as indicated in Table 1. For each considered station we calculate the NSAT-based indices and we select the closest grid point in the LST dataset to calculate the corresponding LST-based indices. Please note that we applied the same methodology to derive the indices from both NSAT and LST data to ensure full consistency.
2.5. European and Swiss Gridded Data
For the area wide indices, i.e. all indices maps presented in Figure 2 to Figure 10, we restrictively used the satellite-based SUMET v.2.0 clear-sky LST observations:
- LST-CS: "LST clear-sky": CM SAF SUMET v.2.0 clear-sky observations.
In order to be able to compare our results with the literature, we convert relative indices (in fraction of days satisfying the index condition) back into absolute indices (in days per year). To do this, we simply multiply the fraction of the relative index (from Eq. 1) by 365, thus obtaining an all sky equivalent product (see e.g. Figure 2 to Figure 10)
2.6. Trend Calculation
Following the method implemented at MeteoSwiss for NSAT-based heat indices we fit a logistic regression through the data [31]. The relative trend is given as the difference between the predicted values at the end and start of the time period, normalized by the mean predicted value over the entire period. The absolute trend is computed as the change in units per decade. To assess the significance of the trends, we use the p-values from the regression model and adjust for multiple hypothesis testing using the False Discovery Rate (FDR) correction method proposed by Benjamini and Hochberg [32], thus accounting for the large number of spatially correlated grid points analyzed.
3. Results and Interpretation
3.1. Switzerland
3.1.1. Tropical Nights Index
There is a strong agreement between satellite-based and NSAT retrieved Tropical Nights. Overall, we observe a good correlation () between the NSAT and LST Tropical Nights indices for the Swiss stations (Figure 1, Table 3). The relative number of Tropical Nights calculated from NSAT, averaged over the Swiss stations, is strongly correlated () with the satellite-based LST Tropical Nights. The mean absolute bias in the LST-CS observations compared to NSAT is with 0.3% very small (Figure 1).
The relative number of Tropical Nights per year ranges from 0% to 4% for both the satellite-based LST data and the NSAT data (Figure 1). The annual differences between the satellite-based LST-CS Tropical Nights and NSAT data is lower than 0.5% for all years, except 2003. Hence, there is no systematic bias in the clear-sky LST observations compared to the all-sky NSAT data for Tropical Nights. This is an important result, regarding the ongoing discussion, that using clear-sky data alone might introduce a bias in heat monitoring.
There is a distinct difference between the LST-CS and NSAT Tropical Nights for the 2003, a year with a millennial heatwave in Europe. With about 3.2% Tropical Nights in 2003, this year is a clear outlier in the NSAT data, while we observe only about 1.3% Tropical Nights in 2003 with LST-CS. The 1.3% are in the order of magnitude of Tropical Nights observed in 1994, 2006, 2013, 2019; hence years without a strong heatwave in Switzerland (Figure 1). The 2003 heatwave in Switzerland was caused by a persistent anticyclonic situation over central and southern Europe, leading to a prolonged clear-sky period. We can only speculate that radiative cooling might have played some secondary role in this heatwave event leading to a more rapid cooling of the Earth surface than the near-surface air layer. The difference between air temperature and surface temperature in 2003 is interesting to further investigate. It highlights the complementary nature of satellite-based LST observations, which is currently not addressed in heat wave monitoring.
In Switzerland we observe an increase in the relative number of Tropical Nights between 1991 and 2023 in both the NSAT and LST data at the Swiss stations (Figure 1). Based on the logistic regression we find an average increase in relative number of Tropical Nights per year of 0.38% per decade2 for NSAT, while we observe an increase of 0.53% per decade for LST-CS. Hence, a warming trend is seen in the satellite-based clear-sky observations (LST-CS, Figure 1). Looking in detail at the stations, we observe that for three locations (GVE, LUZ, SMA) the trends are statistically significant at the 5% significance level for both variables (p-value < 0.05), BAS, KLO, OTL, STG show a significant trend only for NSAT, NEU has a significant trend only for LST and one as well (PAY) shows no statistically significant trend (5% significance level) for neither LST nor NSAT (not shown).
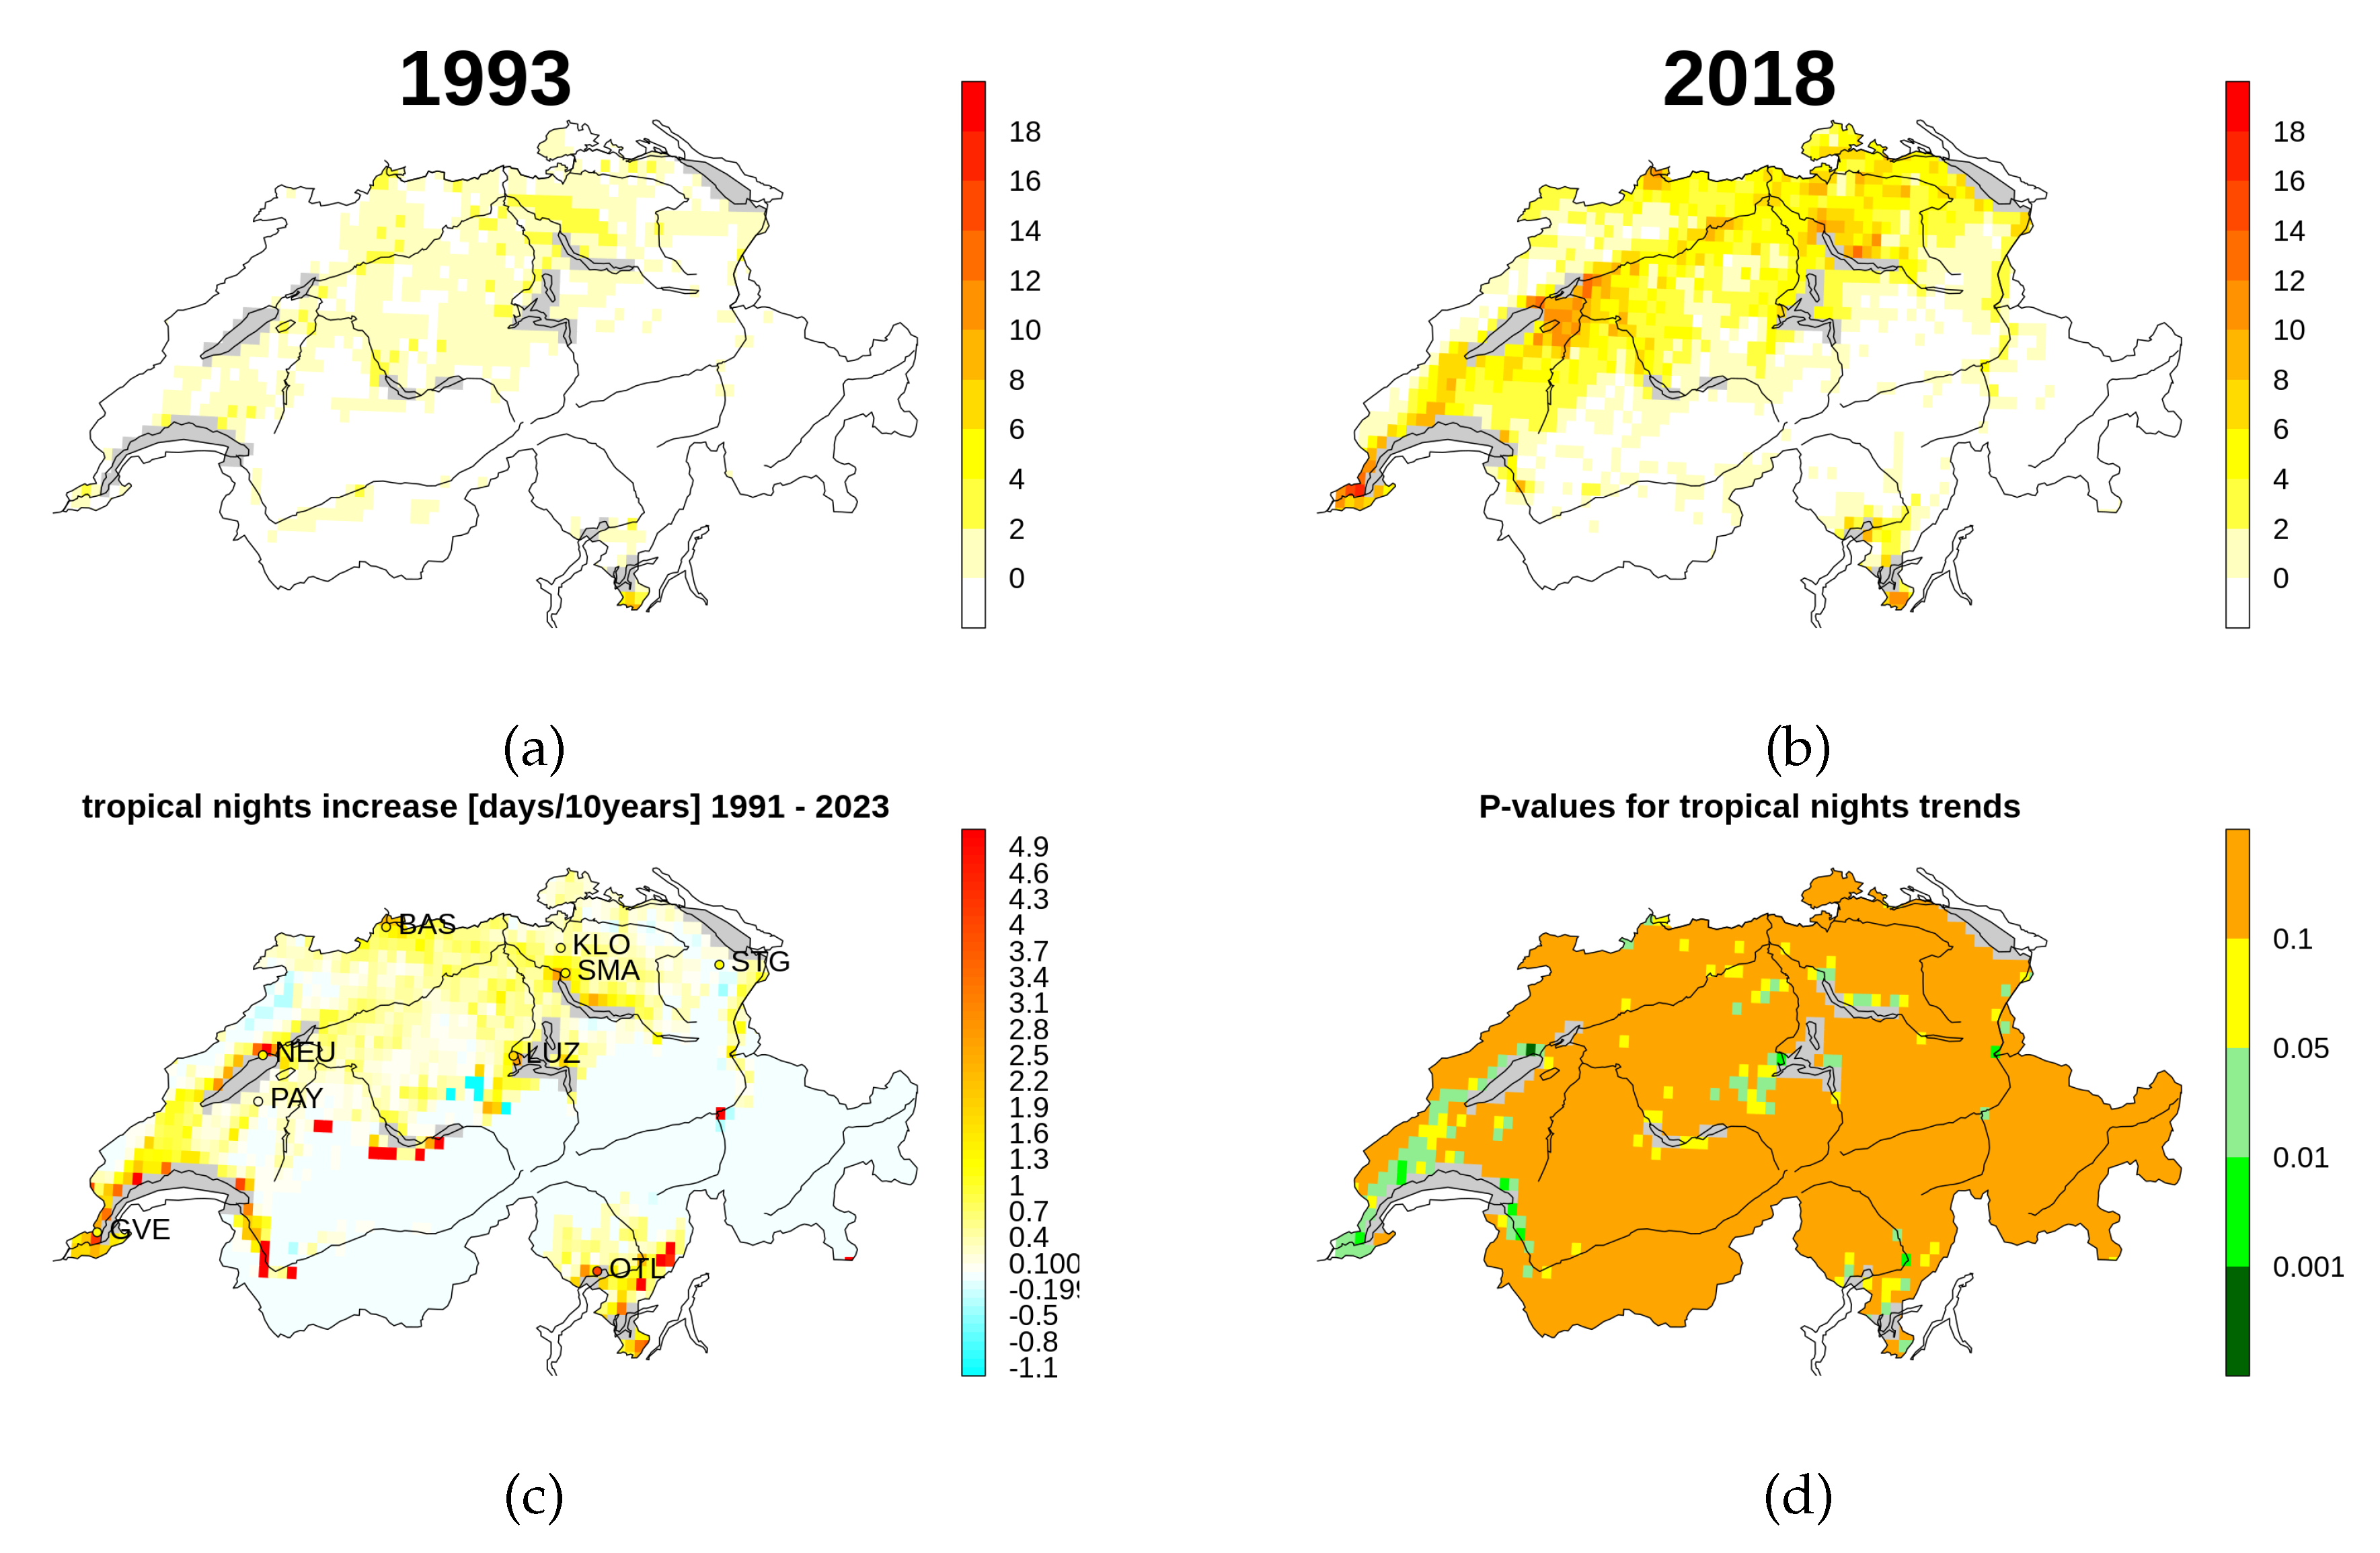
Motivated by the good agreement of satellite and station-based Tropical Night indices at selected stations, we have calculated the annual number of Tropical Nights based on LST-CS satellite data on a regular grid for entire Switzerland (Figure 2). Please note that we transferred the relative indices (%) to absolute indices (days per year) by multiplying the relative indices by 365 to produce maps which can be easily compared to standard indices. When comparing the number of Tropical Nights in 1993 and 2018 (Figure 2 a) and b)), we see up to 15 more days with Tropical Nights in the urbanized regions of Switzerland, such as Zurich, Basel, Geneva as well as in the southern most part of Ticino. For all regions, except for the central Alps, we observe a consistent positive trend in Tropical Nights of 1 to 5 days per decade (Figure 2). The strongest increase of five Tropical Nights per year over the period 1991 to 2023 is observed in Ticino and along lakes in Switzerland. Please note that the observed trends (Figure 2 d)) are not statistically significant at the 5% significance level in most parts of Switzerland. Hence, the Tropical Night trends need to be handled with care. However, in some regions, such as the region around and north of the Lake Geneva, there are pixels with significant trends (5% significance level), Figure 2 d). We therefore expect that, with longer LST-based time-series available in the future, we can statistically prove our findings.
The results are consistent with the findings of Rippstein et al. [14] reporting an increase in Tropical Nights from 1990 to 2020 in the main Swiss cities, in Ticino and on the Swiss Plateau based on ECMWF Reanalysis v5 (ERA5) NSAT data: e.g. they reported an increase from 5 to 16 nights in Zurich, from 14 to 47 nights in Ticino, from 10 to 51 nights in Geneva and from 3 to 30 nights in Basel-City. Using the satellite-based CM SAF SUMET LST-CS, we observe an increase at a similar magnitude namely in the order of 4-5 days/decade in the period 1991 to 2023 for the major cities in Switzerland and southern Ticino (Figure 2 c)). Particularly interesting for climate studies is the strong contrast between rural and urban regions as observed in years with strong heatwaves (e.g. 2018, Figure 2 b)). Rural areas in northern Switzerland are, with 2 to 6 Tropical Nights, far less affected than city hotspots, which have 16 to 20 days with surface temperatures exceeding the Tropical Nights threshold in 2018 (Figure 2 a) and b)). Moreover, we see a particularly strong increase of up to 5 days/decade in some Alpine valleys which should be further investigated.
Figure 2.
Tropical Night index in Switzerland for the years (a) 1993 and (b) 2018 calculated from satellite-based CM SAF SUMET v.2.0 clear-sky LST observations (LST-CS). The trend over the period 1991-2023 and associated adjusted p-values are provided in (c) and (d). The abbreviations in c) refer to SwissMetNet stations with the station trends provided as color coded circles at the station locations.
3.1.2. Summer Days
The relative Summer Days indices retrieved from the satellite-based clear-sky LST data (LST-CS) are highly correlated with NSAT-based station averages with an of 0.86. (Table 3). The relative number of LST-CS Summer Days per year nicely follow the NSAT data with only marginal differences despite 2003 (Figure 3).
With LST-CS we observe between 7% to 20 % Summer Days per year, while we observe 6% to 18 % with NSAT. (Figure 3).
At Swiss stations we observe an increase in the NSAT data of 1.47% of available days per decade, while LST-CS shows an increase of 2.30%/decade between 1991 and 2023. The LST-CS-based Summer Days trend is thus slightly higher compared to NSAT. The average trend over all locations is significant at the 5% significance level for both variables. Looking at single stations (not shown) we observe a significant increase (5% significance level) for both variables at nine locations (BAS, DAV, GVE, KLO, LUZ, NEU, PAY, SIO, SMA), while at two locations (ENG, OTL) the trends are significant only for NSAT, and at three locations (BER, SAM, STG) the trends are significant only for LST. As for the Tropical Nights index, the LST-CS data do not fully reproduce the 2003 heatwave pattern (Figure 3). With LST-CS we record 4% less Summer Days as compared to NSAT. Again, as both the LST-CS and NSAT-based trends are statistically significant, some of the observed differences between NSAT and LST-CS might reflect different warming pattern in the air temperature and Earth surface and need to be further investigated in the context of climate change. Based on this analysis, we conclude that the NSAT-based Summer Days index can be closely reproduced with satellite-based clear-sky observations (LST-CS) in Switzerland.
The LST-CS Summer Days map for Switzerland (Figure 4, a)) shows high numbers of Summer Days in almost all parts of Switzerland, including the Alps, back to the 1990s. This index is hence very well suited for area wide heatwave monitoring in Switzerland. We observe pronounced positive trends for Summer Days, in most of the Swiss Plateau (Figure 4 c) and d)). The increase is particularly strong along the Jura, in the Rhine and Rhone valleys as well as in south Ticino with trends indicating an increase of more than 7 days per decade (Figure 4 c)). Please note again that the trend (Figure 4) is only statistically significant (5% significance level) in parts of the Swiss Plateau and in Ticino, hence in regions which experience a particularly strong Summer Days signal. Again, we require longer time series to increase statistical robustness.
Zubler et al. [33] analyzed the evolution of Summer Days in Switzerland under different emission scenarios in climate model simulations. While the number of Summer Days hardly exceeded 100 per year for their reference period (1980-2009), the climate model, under the scenarios A1B and A2, predicts a doubling of Summer Days for the Swiss Plateau, the Rhone valley and Ticino, where Summer Days could represent more than three months per year by the end of the century. In LST-CS we observe up to 90 Summer Days per year in the 1990s and up to 140 Summer Days in the last years as illustrated by Figure 4 a) and b). Figure 3 c) shows an average trend per decade of about 3 to 7 days per decade since the 1990s, which is significant (5% significance level) in most of the regions where we observe the strongest warming signal. We conclude that the Summer Days index, retrieved from satellite-based LST, is well suited to monitor heat waves in entire Switzerland.
3.1.3. Extremely Hot Days
Finally, we introduce the novel "Extremely Hot Days index", which for the study area equates to for NSAT and for LST-CS. The relative Extremely Hot Days index retrieved from satellite-based LSTs is highly correlated with the station-based NSAT index in Switzerland ( of 0.81, Figure 5). In Switzerland we observe up to 2% (LST-CS) and 3% (NSAT) days per year with maximum temperatures exceeding 39 °C (LST-CS) and 33 °C (NSAT). Again, the Extremely Hot Days index calculated from the clear-sky LST (LST-CS) does not have a significant clear-sky bias as compared to NSAT. Please note that the 2003 heatwave is less pronounced when looking at the tail of the temperature distributions. In contrast, the 2015 and 2023 heatwaves are well depicted also in the satellite-based (LST-CS) Extremely Hot Days index. As discussed previously, the different behavior of LST and NSAT can provide further insights to the land-atmosphere coupling during different heatwave events in Switzerland.
The increase of Extremely Hot Days at the considered Swiss stations is 0.3%/decade of days with available observations for NSAT, while we observe for LST an increase of 0.6%/decade (LST-CS) for 1991-2023 as illustrated in Figure 5. The observed trend difference is dominated by the about 2% more Extremely Hot Days depicted in the NSAT compared to LST-CS in 2003 (Figure 5). This Extremely Hot Days index has been particularly designed to pick up differences in Near-Surface Air Temperature (NSAT) and the surface skin temperature (LST) at the tail of the temperature distribution. Among the 14 stations considered (not shown), the trends are significant (5% significance level) for both variables at three locations (BAS, KLO, SIO). At four locations (BER, GVE, PAY, SMA) only LST is significant while for the other seven locations (DAV, ENG, LUZ, NEU, OTL, SAM, STG) there is either no observation or the trends are statistically not significant at a 5% significance level for either variables (not shown).
While days with Extremely Hot LSTs (LST-CS) were hardly present in 1993, they have become more common in recent years with about 8 to 10 days on most of the Swiss Plateau and even up to 20 in the cities of Geneva, Basel and Zurich in 2018 (LST-CS, Figure 6 a) and b)). High altitude alpine regions do not experience any Extremely Hot Days, while we observe 2 to 10 days per decade more Extremely Hot Days over the Swiss Plateau during the analyzed period. In some parts of the Prealps, the Rhone and Rhine valley a high number of Extremely Hot Days appeared in the very recent years in regions which did not experienced extreme temperatures before, which caused the high trends in those regions. The trends are not statistically significant at 5% significance level, very likely due to the low number of observations (Figure 6 d)).
The year-on-year change in the number of Extremely Hot Days (Figure 7) clearly highlights the warming process in Switzerland. There are almost no Extremely Hot Days during the 1990s, while from 2015 onward we count about 10 extreme hot days on the Swiss Plateau each year, occasionally even reaching more than 20 days for some hot spots in 2015, 2022 and 2023 (Figure 7). City hot spots start appearing for the first time in 2003 on the satellite-based Extremely Hot Days maps and are consistently present from 2015 onward (Figure 7), suggesting this new Extremely Hot Days index is very well suited to monitor city hot spots. From 2015 onward, we observe around the cities of Geneva, Basel and Zurich about 20 Extremely Hot Days per year with a sharp transition to the rural regions of Swiss plateau as illustrated by Figure 7. We therefore recommend this index to monitor urban climate change in Switzerland.
3.2. Europe
Finally we expand our study on the European domain analyzing gridded LST-CS-based heat indices solely.
3.3. Tropical Nights
There is a strong increase in Tropical Nights in Europe between 1993 and 2018 in LST-CS (Figure 8 a) and b)). While northern Europe is barely affected in 1993, we observe Tropical Nights as far north as Finland and central Sweden in 2018. This comes along with positive trends over the period 1991-2020 in most European regions, with the strongest increases south of the Alps, in the Po valley, and along the Mediterranean coast. In most parts of Europe the trends are not significant at a 5% significance level when looking at single grid cells, but the small scale patterns are particularly interesting. On the displayed trend map and partly also on the 2018 map (Figure 8, b) and c)), major cities in Spain and Italy such as Milan, Bologna, Madrid, Roma and Barcelona are clearly visible with a particularly strong increase of up to 12 days per decade compared to suburban regions. The Mediterranean coast of Spain shows strong warming pattern with small scale changes further inland. Hence, the satellite-based LST Tropical Nights observations enable the identification and direct comparison of cities and zones in Europe which are particularly vulnerable to climate change (Figure 8).
The Tropical Nights reported by Correa et al. [13] in Spain for NSAT stations are very coherent with the hot spots and trends we observe in this the satellite-based Tropical Nights map (Figure 8). The hot spots reported by Correa et al. [13] along the Spanish coast and in Madrid correspond to those regions where the the satellite-based Tropical Nights trends are strongest. Correa et al. [13] report 7 to 15 more Tropical Nights per decade along the Spanish coast, while we observe 8 to 12 more Tropical Nights per decade. In addition, Correa et al. [13] point to strong Tropical Nights hot spots in urban regions of Spain such as Madrid and Valencia in recent years, which are clearly visible on the satellite-LST based Tropical Nights index. Moreover, small scale patterns, such as the nearly negligible increase in Tropical Nights along the Spanish Mediterranean coast reported by Correa et al. [13], are fully confirmed by the satellite-based observations. The satellite-based observations (Figure 8 show much more details than Figure 10 in Correa et al. [13]) resolving spatial pattern and urban hot spots. In the recent literature there are distinct different Tropical Night trends reported along the Mediterranean coast (24.2 days per decade in Yavaşlı and Erlat [11], 7 to 15 days in Correa et al. [13] for Spain and 7 to 9 days in Fioravanti et al. [34] for Italy). Our findings reinforce the two latter publications and highlight the potential of satellite-based LST to monitor heat in large areas consistently. The observed increase in Tropical Nights along the coast line is likely linked to the sea surface temperature increase [11,12,13]. Over Scandinavia, a large parts of south-western Norway is still unaffected by Tropical Nights, while the inland regions of Sweden are experiencing a net increase. Although a clear difference is visible between the single years 1993 and 2018 (Figure 8 a) and b)), the Baltic States do not show significant trends, thus we can not reproduce the significant increase reported by Dailidienė et al. [15] along the Baltic Sea coast. The British Isles also remain mostly unaffected in LST-CS.
Our results clearly show that the satellite-based Tropical Nights index is well suited to monitor heat over Europe. Hot spots with strong warming signals can be clearly identified on this satellite-based Tropical Nights index. It also provides good insights regarding the onset of Tropical nights in northern and central Europe, but remains limited for trend analysis as in most areas as the trends are not significant. The signal captured by satellites is similar to the NSAT signal thus proving that traditional indices can be reproduced using satellite data.
3.3.1. Summer Days
The number of Summer Days in Europe has strongly increased between 1991 and 2020 with significant positive trends up to 12 days per decade, especially in eastern Europe and Rhone Valley (Figure 9 c) and d)). In Scandinavia, northern UK and Ireland we do not register a high amount of Summer Days. Spain and southern Italy do not experience a strong increase in Summer Days, while we observe a particularly strong increase of up to 10 days along the French Mediterranean coast, the Po valley and along the southern Atlantic coast. For many parts in central and eastern Europe the Summer Days trends are statistically significant at a 5% significance level. It is particularly interesting that European Summer Days hotspots are not always aligned with Tropical Nights hotspots, particularly not along the coastlines. Fioravanti et al. [34] report an increase of 10-13 Summer Days per decade in Italy, which we also identify for northern Italy. Again, we observe interesting small scale variations with low numbers of Summer Days in southern Italy (Figure 9). For northern Europe the 25 °C threshold is too high such that Summer Days are too rare events and inter-annual variability dominates the trends. Our results are well aligned with previous work, such as Dong et al. [10] who shows a similar general pattern of Summer Days increase in Europe during the late 20th and early 21st Centuries (see their Figure 2). As for Tropical Nights, the satellite-based Summer Days index shows details which are not visible on typically interpolated NSAT-based maps.
3.3.2. Extremely Hot Days
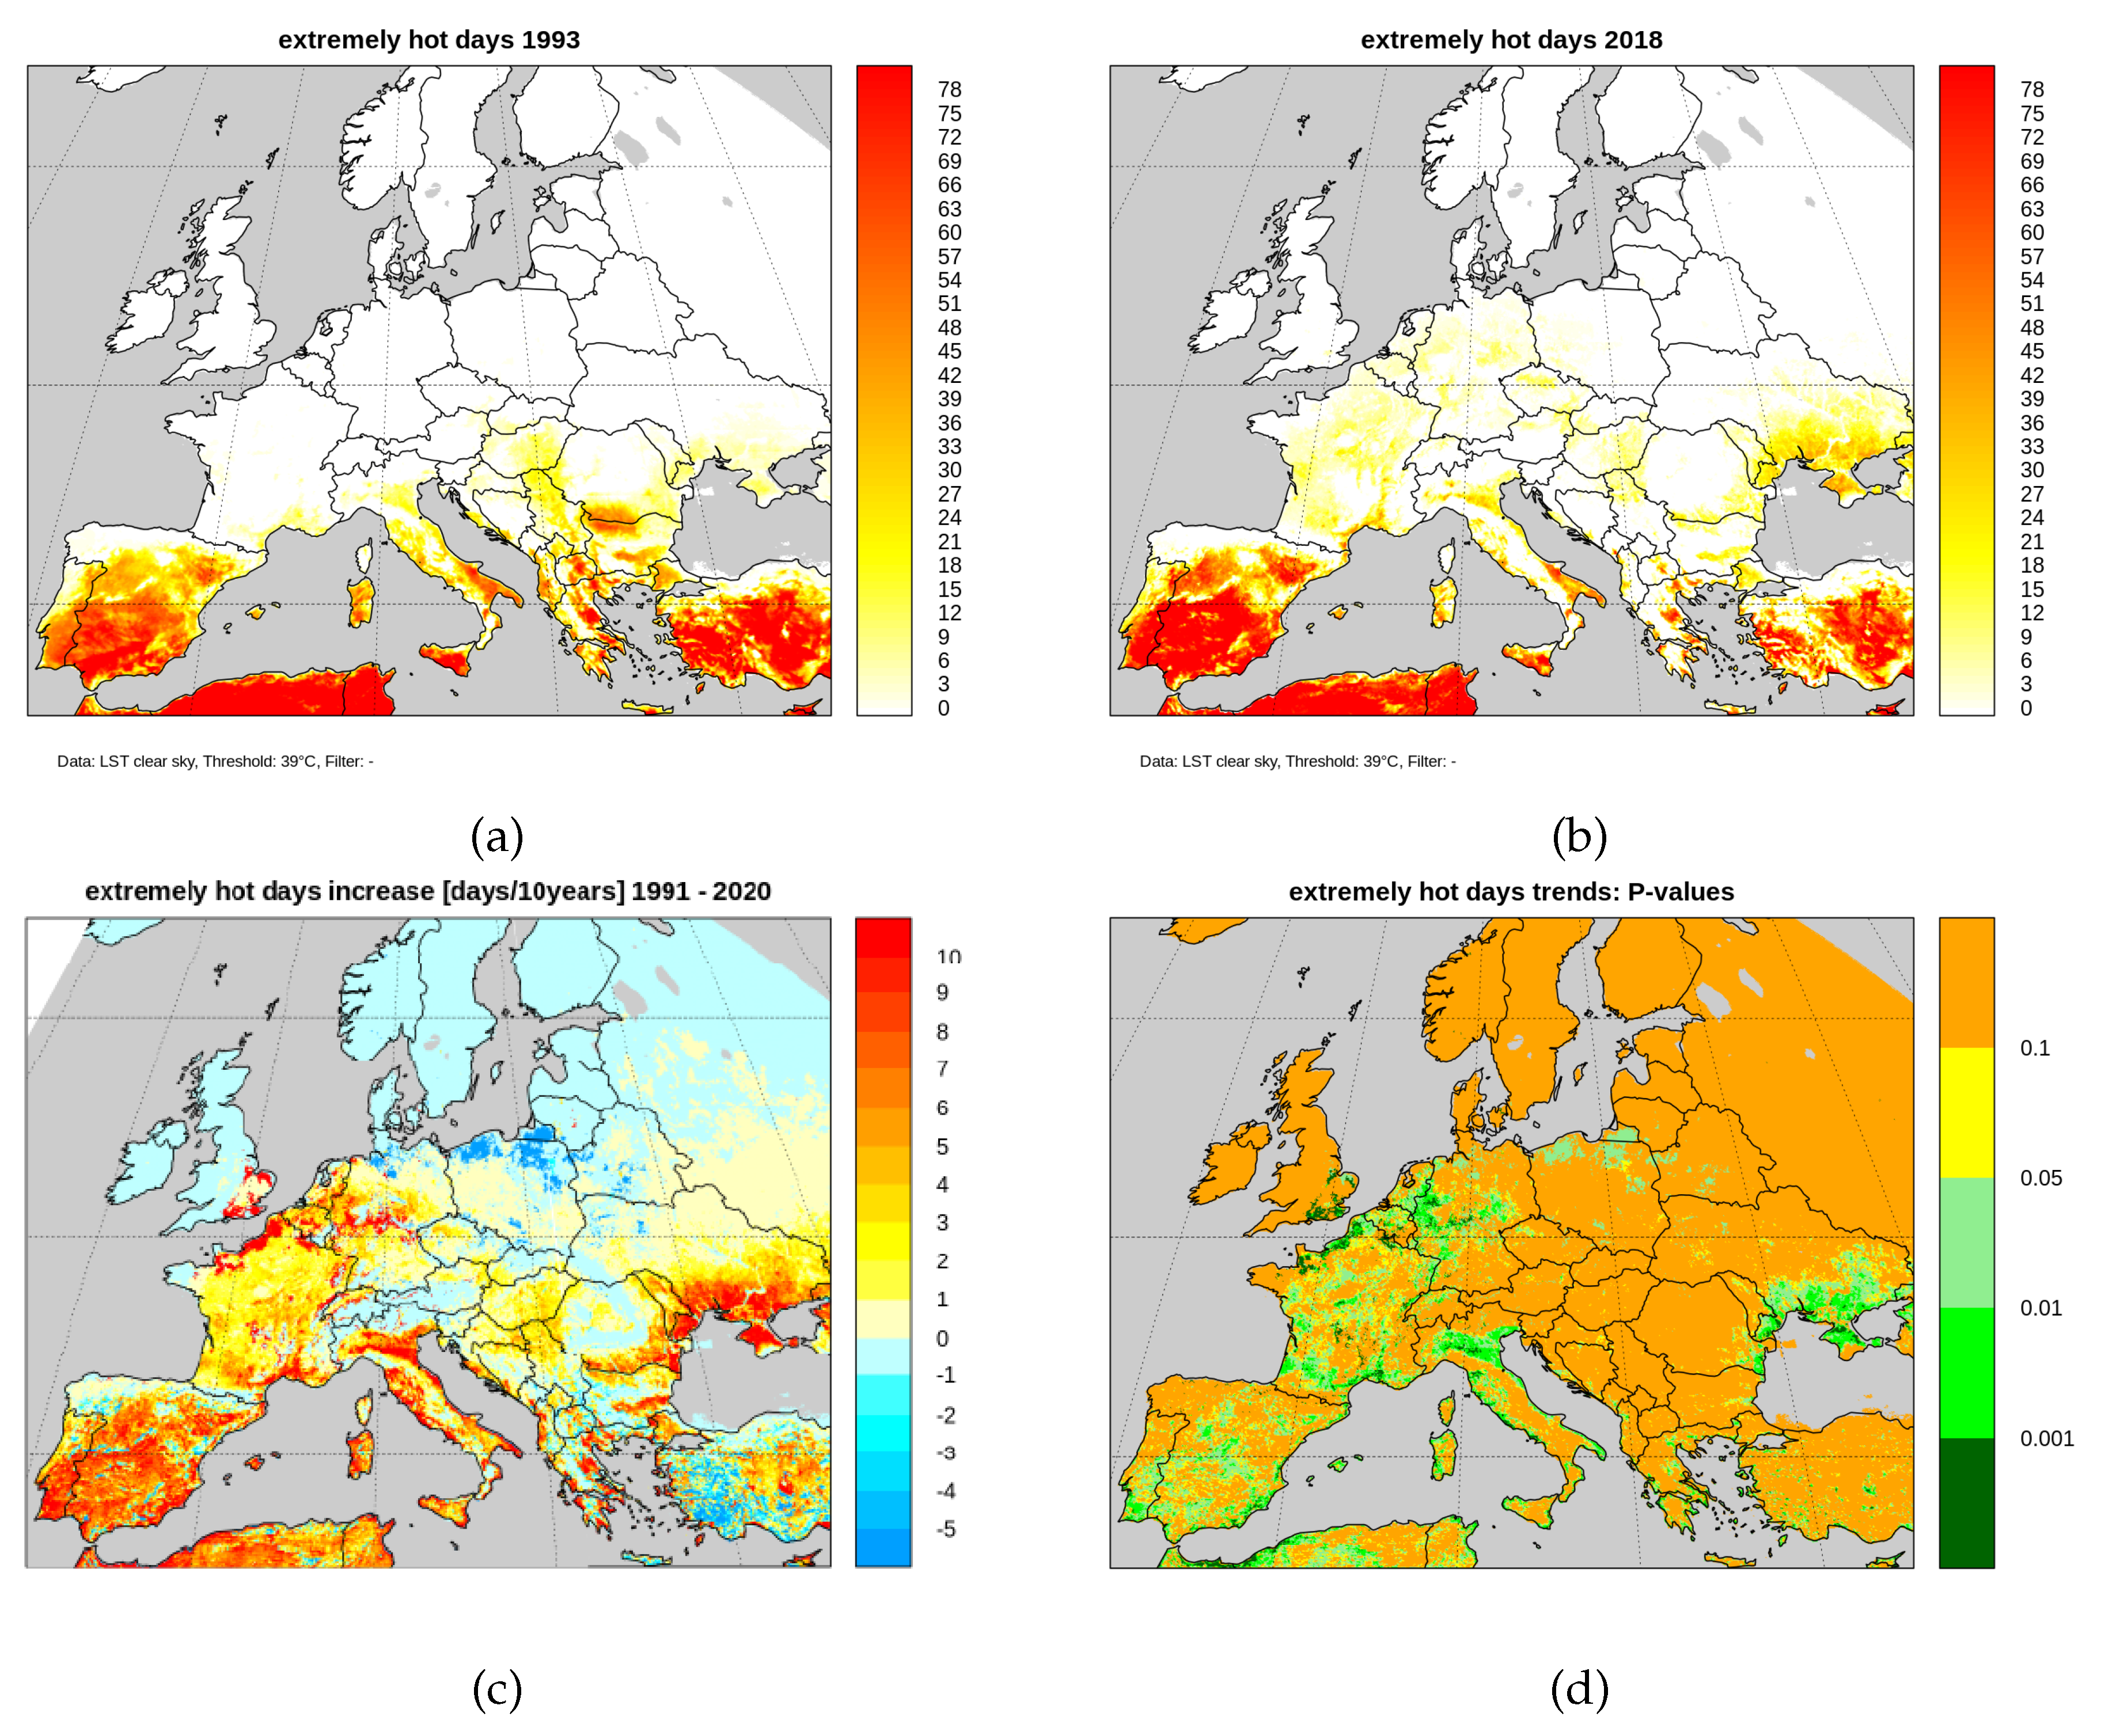
The Extremely Hot Days index complements the Summer Days and Tropical Nights indices. We observe patterns which are different to either the Summer Days or Tropical Nights indices: 1) We observe a strong increase of 7 to 10 days per decade in Extremely Hot Days in central Spain and its southern coastlines, 2) a strong increase of 7 to 10 days per decade in the Po-Valley and in the northern part of the Italian Mediterranean coast and 3) the appearance of extremely hot surface temperatures along both sites of the English Channel (Figure 10). The threshold setting is too high to capture a signal in northern Europe and the high mountains in Europe. The trends are significant (5% significance level) only in regions which show the strongest trends, such as in southern Spain and Portugal as well as in northern Africa (Figure 10 c)). This suggests that the 39 °C threshold reveals a warming signal that the 25 °C threshold fails to capture and which should be further investigate in the context of climate change. Southern Ukraine stands out as having widespread significant positive trends for both indices. Although the warming trends are less significant in northern Europe, it is clearly visible that Germany and France have been experiencing more Extremely Hot Days in 2018 (around 20) than in 1993 where there were less than 5 observations (Figure 10 a) and b)). With this new LST-specific index we show that we can capture a signal for the regions across Europe warming up rapidly, thus opening the way to monitor extreme heat also in the hottest regions of the world such as northern Africa where the station coverage is sparse.
Figure 10.
Extremely Hot Days index in Europe for the years (a) 1993 and (b) 2018 calculated from satellite-based CM SAF SUMET v.2.0 clear-sky LST observations (LST-CS). The trend over the period 1991-2020 and associated adjusted p-values are provided in (c) and (d).
Figure 10.
Extremely Hot Days index in Europe for the years (a) 1993 and (b) 2018 calculated from satellite-based CM SAF SUMET v.2.0 clear-sky LST observations (LST-CS). The trend over the period 1991-2020 and associated adjusted p-values are provided in (c) and (d).
4. Discussion and Conclusions
In this study we demonstrate that Land Surface Temperature (LST) derived from satellites observations can be used to monitor heatwaves in a changing climate. Satellite-based heat indices will allow a characterization of heatwaves in regions with sparse in-situ station coverage, such as Africa, and hence might overcome the reported strong disagreement of reanalysis products [16] in those regions.
We calculated heat indices from satellite-based LST: two indices (Tropical Nights and Summer Days) are defined by ETCCDI and one index (Extremely Hot Days) we defined as complementary measure specifically for LST. To calculate satellite-based LST heat indices we developed and tested approaches that account for the fact that satellite-based observations are only available for clear-sky conditions in comparison to station-based NSAT observations. We were able to show that by calculating relative indices, which account for the variable number of clear-sky observations, NSAT-based heat indices can be closely reproduced. A comparison of satellite-based and highly precise NSAT-based Tropical Nights, Summer Days and Extremely Hot Days indices in Switzerland shows a strong correlation () of 0.84, 0.86 and 0.81, respectively. We conclude that by taking into account differences in the nature of satellite-based and station-based data, and by introducing some small adjustments in the way satellite-based indices are calculated, we can establish meaningful and comparable heat indices.
While satellite-based LST and station-based NSAT heat indices are comparable, our study has shown that there are also differences and that both types of indices may aid our understanding of heatwaves. For example, we observed that there is a disagreement in heat indices for the 2003 heatwave in Switzerland. Closely investigating the surface-atmosphere warming processes during this heatwave may help us to understand why the different heat indices disagree and which surface-atmosphere interaction processes may be relevant here.
The water and energy cycle have a strong relationship through a coupling of the land surface and lower atmosphere. The land surface-air temperature difference (NSAT-LST) is also an essential parameter reflecting the coupling process and the spatiotemporal variations and influencing factors of NSAT-LST remain not well explored [35]. Satellite-based LST provide the unique opportunity to further exploit spatial-temporal NSAT-LST patterns and we therefore suggest to define indices accordingly. A portion of the NSAT-LST trend difference observed in this study likely reflects the annual NSAT-LST increase reported by [35] due to climate change.
For the period 1991 to 2020 patterns and trends are coherent with recent NSAT-based observation for the two ETCCDI indices in Europe [10,11,12,13]. The satellite-based Tropical Nights and Summer Days indices are complementary and show unprecedented spatial patterns in observational data, such as e.g. a strong increase of up to 12 Tropical Nights per decade along the Mediterranean Coast in Spain and in urban hot spots in the Po Valley. Summer Days are increasing with up to 12 days per decade in Southern France and the Po Valley. The newly defined Extremely Hot Days index shows a strong increase, up to 10 days per decade, of days with extremely hot temperatures in the Po Valley, along the Mediterranean coast and the English channel. Those regions are hence particularly vulnerable in the current climate.
The percentile-based approach introduced in this study through the Extremely Hot Days index should be further investigated. The question of how to best define thresholds for extremely high temperatures remains debated [36,37,38], and further work needs to be done to define suitable region-based indices.
We also strongly suggest that future research should inter-compare LST data from different, independent satellite systems. Good et al. [22] have outlined that LST data derived from some polar orbiting satellite in the framework of the ESA CCI LST project are also stable in time. Despite the different acquisition times, night-time indices such as e.g. Tropical Nights, should correlate well with the here presented CM SAF LST indices.
Our study outlines the complementary nature of the satellite-based heat indices and the large potential to establish LST-based indices for heat wave monitoring.
Author Contributions
A.C. conceived the study, led the data analysis, and drafted the manuscript. A.T. designed the study, participated in the data collection, and revised the manuscript critically. J.B. and E.G. provided valuable input for the data analysis and critically reviewed the results. J.S., V.S., C.G. and I.T. contributed to the interpretation of the results and provided critical revisions. A.R. and M.S. contributed to project administration. All authors approved the final version of the manuscript.
Data Availability Statement
The data that support the findings of this study are openly available in Land Surface Temperature Dataset from Meteosat First and Second Generation - Edition 2:
Acknowledgments:
The work was carried out using satellite data from EUMETSAT’s Satellite Application Facility on Climate Monitoring (CM SAF). We thank MeteoSwiss for the supply of the satellite data for the Swiss domain. The station based Near-Surface Air Temperature are taken from the SwissMetNet, the automatic measurement network of MeteoSwiss. This work was conducted as a Use Case study in the CM SAF project. The authors acknowledges the financial support of the EUMETSAT member states. We thank MeteoSwiss for providing the code to calculate station-based heat indicators. Furthermore, we acknowledge Michael Begert and Rebekka Pösselt for their valuable discussions and support on the station-based heatwave indices. J. Blannin and E. Good were funded by the Met Office Climate Science for Service Partnership (CSSP) China project under the International Science Partnerships Fund (ISPF), and through the ESA within the framework of the Land Surface Temperature project under the CCI (LST_cci), contract number 4000123553/18/I-NB, and were supported by NERC [NERC grant reference number NE/X019071/1, “U.K. EO Climate Information Service”]. J.B and E.G are grateful to the ESA for creating the CCI program, which has strengthened the consistency of the many research communities related to developing, processing, qualifying, and using satellite CDRs.
Conflicts of Interest
The authors declare no conflicts of interest
Abbreviations
The following abbreviations are used in this manuscript:
| CDR | Climate Data Record |
| CM SAF | Satellite Application Facility on Climate Monitoring |
| CS | Clear-Sky |
| ECMWF | European Centre for Medium-Range Weather Forecasts |
| ESA | European Space Agency |
| ETCCDI | Expert Team on Climate Change Detection and Indices |
| FDR | False Discovery Rate |
| WHO | World Health Organisation |
| LST | Land Surface Temperature |
| MFG | Meteosat First Generation |
| MSG | Meteosat Second Generation |
| NSAT | Near Surface Air Temperature |
| WMO | World Meteorological Organization |
References
- Sergio, F.; Blas, J.; Hiraldo, F. Animal responses to natural disturbance and climate extremes: a review. Global and Planetary Change 2018, 161, 28–40. [CrossRef]
- Eyshi Rezaei, E.; Webber, H.; Gaiser, T.; Naab, J.; Ewert, F. Heat stress in cereals: Mechanisms and modelling. European Journal of Agronomy 2015, 64, 98–113. [CrossRef]
- Qu, L.P.; Chen, J.; Xiao, J.; De Boeck, H.J.; Dong, G.; Jiang, S.C.; Hu, Y.L.; Wang, Y.X.; Shao, C.L. The complexity of heatwaves impact on terrestrial ecosystem carbon fluxes: Factors, mechanisms and a multi-stage analytical approach. Environmental Research 2024, 240, 117495. [CrossRef]
- PoshtMashhadi, A.; Ijadi Maghsoodi, A.; Wood, L.C. The impact of extreme temperatures on emergency department visits: A systematic review of heatwaves, cold waves, and daily temperature variations. Science of The Total Environment 2025, 970, 178869. [CrossRef]
- Wolf, T.; Lyne, K.; Martinez, G.S.; Kendrovski, V. The Health Effects of Climate Change in the WHO European Region. Climate 2015, 3, 901–936. [CrossRef]
- Yin, C.; Yang, Y.; Chen, X.; Yue, X.; Liu, Y.; Xin, Y. Changes in global heat waves and its socioeconomic exposure in a warmer future. Climate Risk Management 2022, 38, 100459. [CrossRef]
- Klein Tank, A.M.G.; Zwiers, F.W.; Zhang, X. Guidelines on analysis of extremes in a changing climate in support of informed decisions for adaptation. Technical Report WCDMP-No. 72, World Meteorological Organization, 2009.
- Domínguez-Castro, F.; Reig, F.; Vicente-Serrano, S.M.; Aguilar, E.; Peña-Angulo, D.; Noguera, I.; Revuelto, J.; van der Schrier, G.; El Kenawy, A.M. A multidecadal assessment of climate indices over Europe. Scientific Data 2020, 7, 125. [CrossRef]
- Donat, M.G.; Alexander, L.V.; Yang, H.; Durre, I.; Vose, R.; Dunn, R.J.H.; Willett, K.M.; Aguilar, E.; Brunet, M.; Caesar, J.; et al. Updated analyses of temperature and precipitation extreme indices since the beginning of the twentieth century: The HadEX2 dataset. Journal of Geophysical Research: Atmospheres 2013, 118, 2098–2118. [CrossRef]
- Dong, B.; Sutton, R.T.; Shaffrey, L. Understanding the rapid summer warming and changes in temperature extremes since the mid-1990s over Western Europe. Climate Dynamics 2017, 48, 1537–1554. [CrossRef]
- Yavaşlı, D.D.; Erlat, E. Tropical nights in the Mediterranean: A spatiotemporal analysis of trends from 1950 to 2022. International Journal of Climatology 2024, 44, 1472–1488, [https://rmets.onlinelibrary.wiley.com/doi/pdf/10.1002/joc.8394]. [CrossRef]
- Olcina Cantos, J.; Serrano-Notivoli, R.; Miró, J.; Meseguer-Ruiz, O. Tropical nights on the Spanish Mediterranean coast, 1950-2014. Climate Research 2019, 78, 225–236. [CrossRef]
- Correa, J.; Dorta, P.; López-Díez, A.; Díaz-Pacheco, J. Analysis of tropical nights in Spain (1970–2023): Minimum temperatures as an indicator of climate change. International Journal of Climatology 2024, 44, 3006–3027, [https://rmets.onlinelibrary.wiley.com/doi/pdf/10.1002/joc.8510]. [CrossRef]
- Rippstein, V.; de Schrijver, E.; Eckert, S.; Vicedo-Cabrera, A.M. Trends in tropical nights and their effects on mortality in Switzerland across 50 years. PLOS Climate 2023, 2, e0000162. [CrossRef]
- Dailidienė, I.; Servaitė, I.; Dailidė, R.; Vasiliauskienė, E.; Rapolienė, L.; Povilanskas, R.; Valiukas, D. Increasing Trends of Heat Waves and Tropical Nights in Coastal Regions (The Case Study of Lithuania Seaside Cities). Sustainability 2023, 15. [CrossRef]
- Thompson, V.; Mitchell, D.; Hegerl, G.C.; Collins, M.; Leach, N.J.; Slingo, J.M. The most at-risk regions in the world for high-impact heatwaves. Nature Communications 2023, 14, 2152. [CrossRef]
- Gallo, K.; Hale, R.; Tarpley, D.; Yu, Y. Evaluation of the Relationship between Air and Land Surface Temperature under Clear- and Cloudy-Sky Conditions. Journal of Applied Meteorology and Climatology 2011, 50, 767 – 775. [CrossRef]
- Good, E.J.; Ghent, D.J.; Bulgin, C.E.; Remedios, J.J. A spatiotemporal analysis of the relationship between near-surface air temperature and satellite land surface temperatures using 17 years of data from the ATSR series. Journal of Geophysical Research: Atmospheres 2017, 122, 9185–9210, [https://agupubs.onlinelibrary.wiley.com/doi/pdf/10.1002/2017JD026880]. [CrossRef]
- Good, E.J. An in situ-based analysis of the relationship between land surface “skin” and screen-level air temperatures. Journal of Geophysical Research: Atmospheres 2016, 121, 8801–8819, [https://agupubs.onlinelibrary.wiley.com/doi/pdf/10.1002/2016JD025318]. [CrossRef]
- Jin, M. Analysis of Land Skin Temperature Using AVHRR Observations. Bulletin of the American Meteorological Society 2004, 85, 587 – 600. [CrossRef]
- Jin, M.; Dickinson, R.E. Land surface skin temperature climatology: benefitting from the strengths of satellite observations. Environmental Research Letters 2010, 5, 044004. [CrossRef]
- Good, E.J.; Aldred, F.M.; Ghent, D.J.; Veal, K.L.; Jimenez, C. An Analysis of the Stability and Trends in the LST_cci Land Surface Temperature Datasets Over Europe. Earth and Space Science 2022, 9, e2022EA002317, [https://agupubs.onlinelibrary.wiley.com/doi/pdf/10.1029/2022EA002317]. e2022EA002317 2022EA002317, . [CrossRef]
- Tetzlaff, A.; Bourgeois, Q.; Bojanowski, J.; Göttsche, F.; Trigo, I. Validation Report CM SAF Land Surface Temperature. Technical report, Climate Monitoring Satellite Application Facility, Darmstadt, Germany, 2023.
- Tetzlaff, A.; Bourgeois, Q.; Stöckli, R.; Schröder, M.; Hollmann, R. CM SAF Land SUrface Temperature dataset from METeosat First and Second Generation - Edition 2 (SUMET Ed. 2), 2024. [CrossRef]
- MeteoSchweiz. Von den Warnungen bis zur Klimatologie – das Thema Hitze an der MeteoSchweiz. Technical Report 276, Bundesamt für Meteorologie und Klimatologie, MeteoSchweiz, 2021.
- Good, E.; Blannin, B.; Waring, A.; Veal, K.; Ghent, D. Sidebar 2.1: Super extreme land surface temperature hotspots. In State of the Climate in 2024; 2025; Vol. 106, pp. S37–S39. [CrossRef]
- Bourgeois, Q.; Duguay-Tetzlaff, A. Algorithm Technical Base Document. Meteosat Surface Radiation Budget Edition 1. Technical report, CM SAF, EUMETSAT, 2023.
- Moutier, W.; Bourgeois, Q.; Tetzlaff, A.; Clerbaux, N.; Stöckli, R.; Schröder, M.; Hollmann, R. CM SAF Surface Radiation and Fluxes from Meteosat First and Second Generation - Edition 1 (LANDFLUX Ed. 1), 2024. [CrossRef]
- John, V.O.; Tabata, T.; Rüthrich, F.; Roebeling, R.; Hewison, T.; Stöckli, R.; Schulz, J. On the Methods for Recalibrating Geostationary Longwave Channels Using Polar Orbiting Infrared Sounders. Remote Sensing 2019, 11, 1171. [CrossRef]
- Begert, M.; Schlegel, T.; Kirchhofer, W. Homogeneous temperature and precipitation series of Switzerland from 1864 to 2000. International Journal of Climatology 2005, 25, 65–80, [https://rmets.onlinelibrary.wiley.com/doi/pdf/10.1002/joc.1118]. [CrossRef]
- Frei, C.; Schär, C. Detection Probability of Trends in Rare Events: Theory and Application to Heavy Precipitation in the Alpine Region. Journal of Climate 2001, 14, 1568 – 1584. [CrossRef]
- Benjamini, Y.; Hochberg, Y. Controlling the False Discovery Rate: A Practical and Powerful Approach to Multiple Testing. Journal of the Royal Statistical Society. Series B (Methodological) 1995, 57, 289–300.
- Zubler, E.; Scherrer, S.; Croci-Maspoli, M.; Liniger, M.; Appenzeller, C. Key climate indices in Switzerland; expected changes in a future climate. Climatic Change 2014, 123, 255–271. [CrossRef]
- Fioravanti, G.; Piervitali, E.; Desiato, F. Recent changes of temperature extremes over Italy: an index-based analysis. Theoretical and Applied Climatology 2016, 123, 473–486. [CrossRef]
- Jiang, K.; Pan, Z.; Pan, F.; Wang, J.; Han, G.; Song, Y.; Zhang, Z.; Huang, N.; Ma, S.; Chen, X.; et al. The global spatiotemporal heterogeneity of land surface-air temperature difference and its influencing factors. Science of The Total Environment 2022, 838, 156214. [CrossRef]
- Zhang, X.; Hegerl, G.; Zwiers, F.W.; Kenyon, J. Avoiding Inhomogeneity in Percentile-Based Indices of Temperature Extremes. Journal of Climate 2005, 18, 1641 – 1651. [CrossRef]
- Sulikowska, A.; Wypych, A. Summer temperature extremes in Europe: how does the definition affect the results? Theoretical and Applied Climatology 2020, 141, 19–30. [CrossRef]
- Dunn, R.J.H.; Morice, C.P. On the effect of reference periods on trends in percentile-based extreme temperature indices. Environmental Research Letters 2022, 17, 034026. [CrossRef]
| 1 | See Section 2.1 for the exact definition of "Swiss domain" |
| 2 | recall a relative number of Tropical Nights per year of 1% corresponds to 3.65 days in the case of a year with an observation every day |
Figure 1.
Tropical Nights index calculated from station-based NSAT measurements and satellite-based LST data: relative number of nights per year satisfying the index conditions over the considered stations (average over all stations, 1991-2023). NSAT, blue: Near-Surface Air Temperature; LST-CS, orange: CM SAF SUMET v.2.0 clear-sky LST.
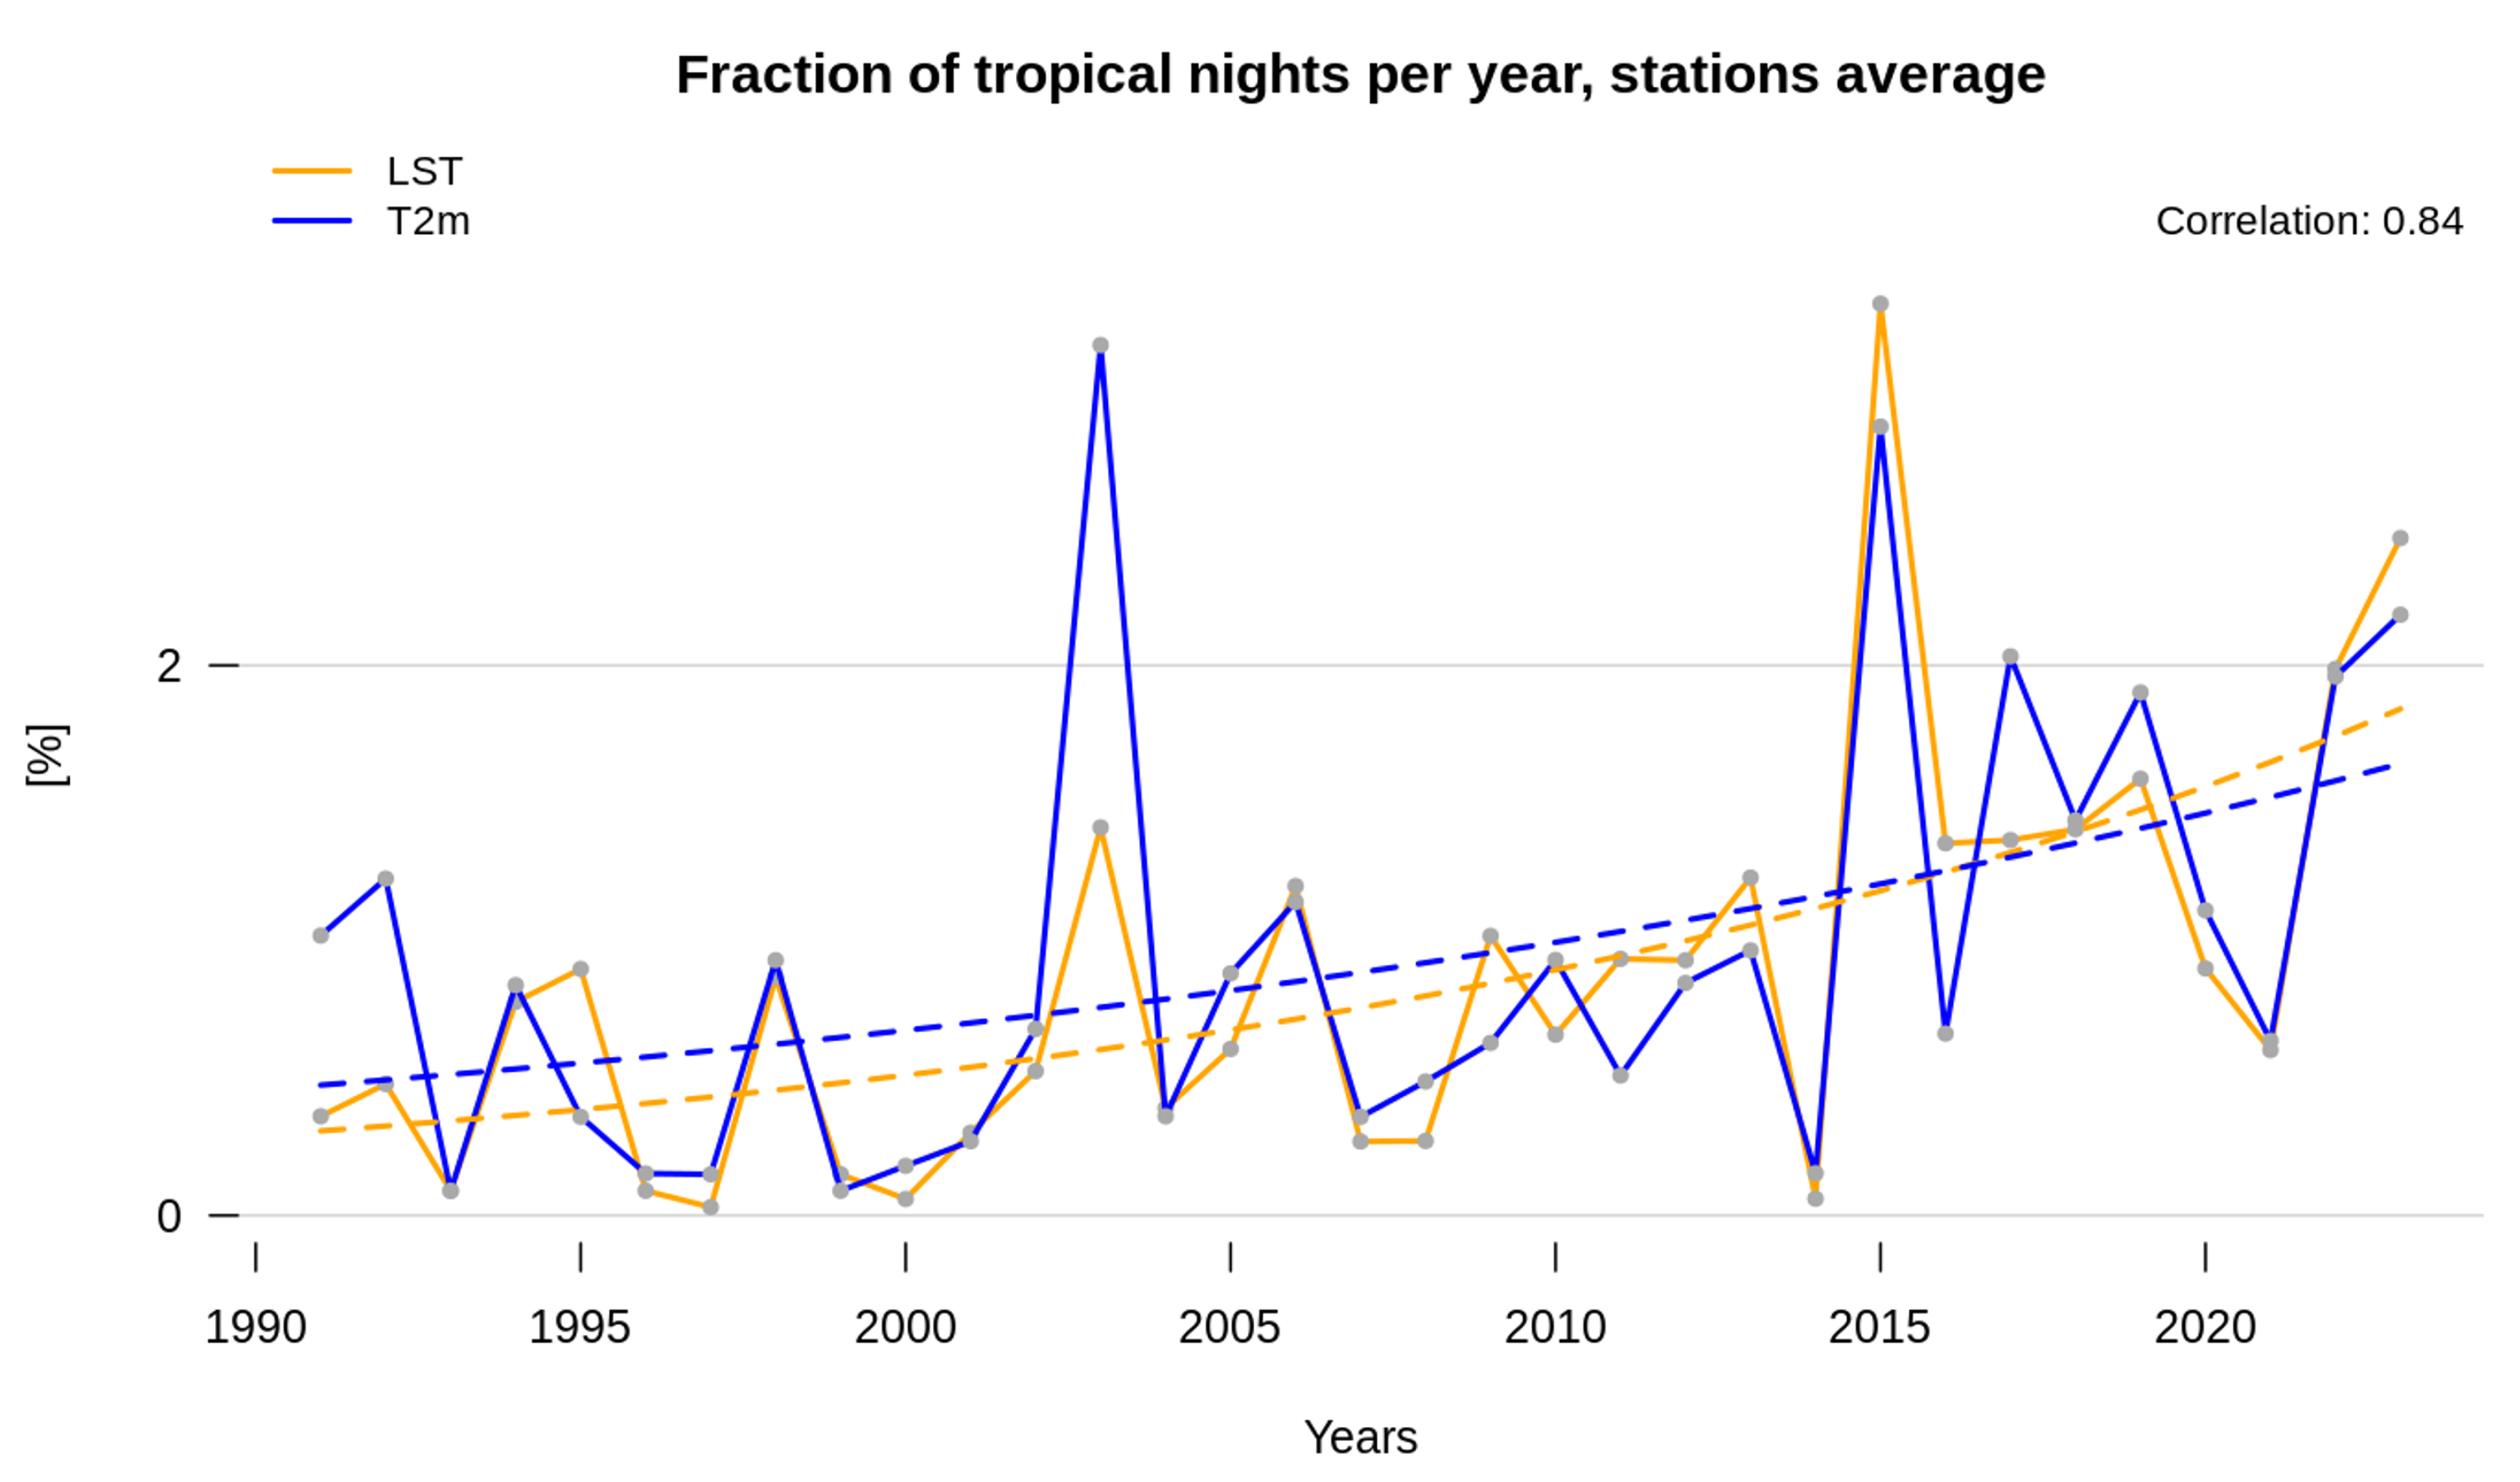
Figure 3.
Summer Day index calculated from station-based Swiss Near-Surface Air Temperature (NSAT) measurements and satellite-based LST data. Relative number of summer days per year satisfying the index conditions over the considered stations (average over all stations, 1991-2023). NSAT, blue: Near-Surface Air Temperature; LST-CS, orange: CM SAF SUMET v.2.0 clear-sky LST.
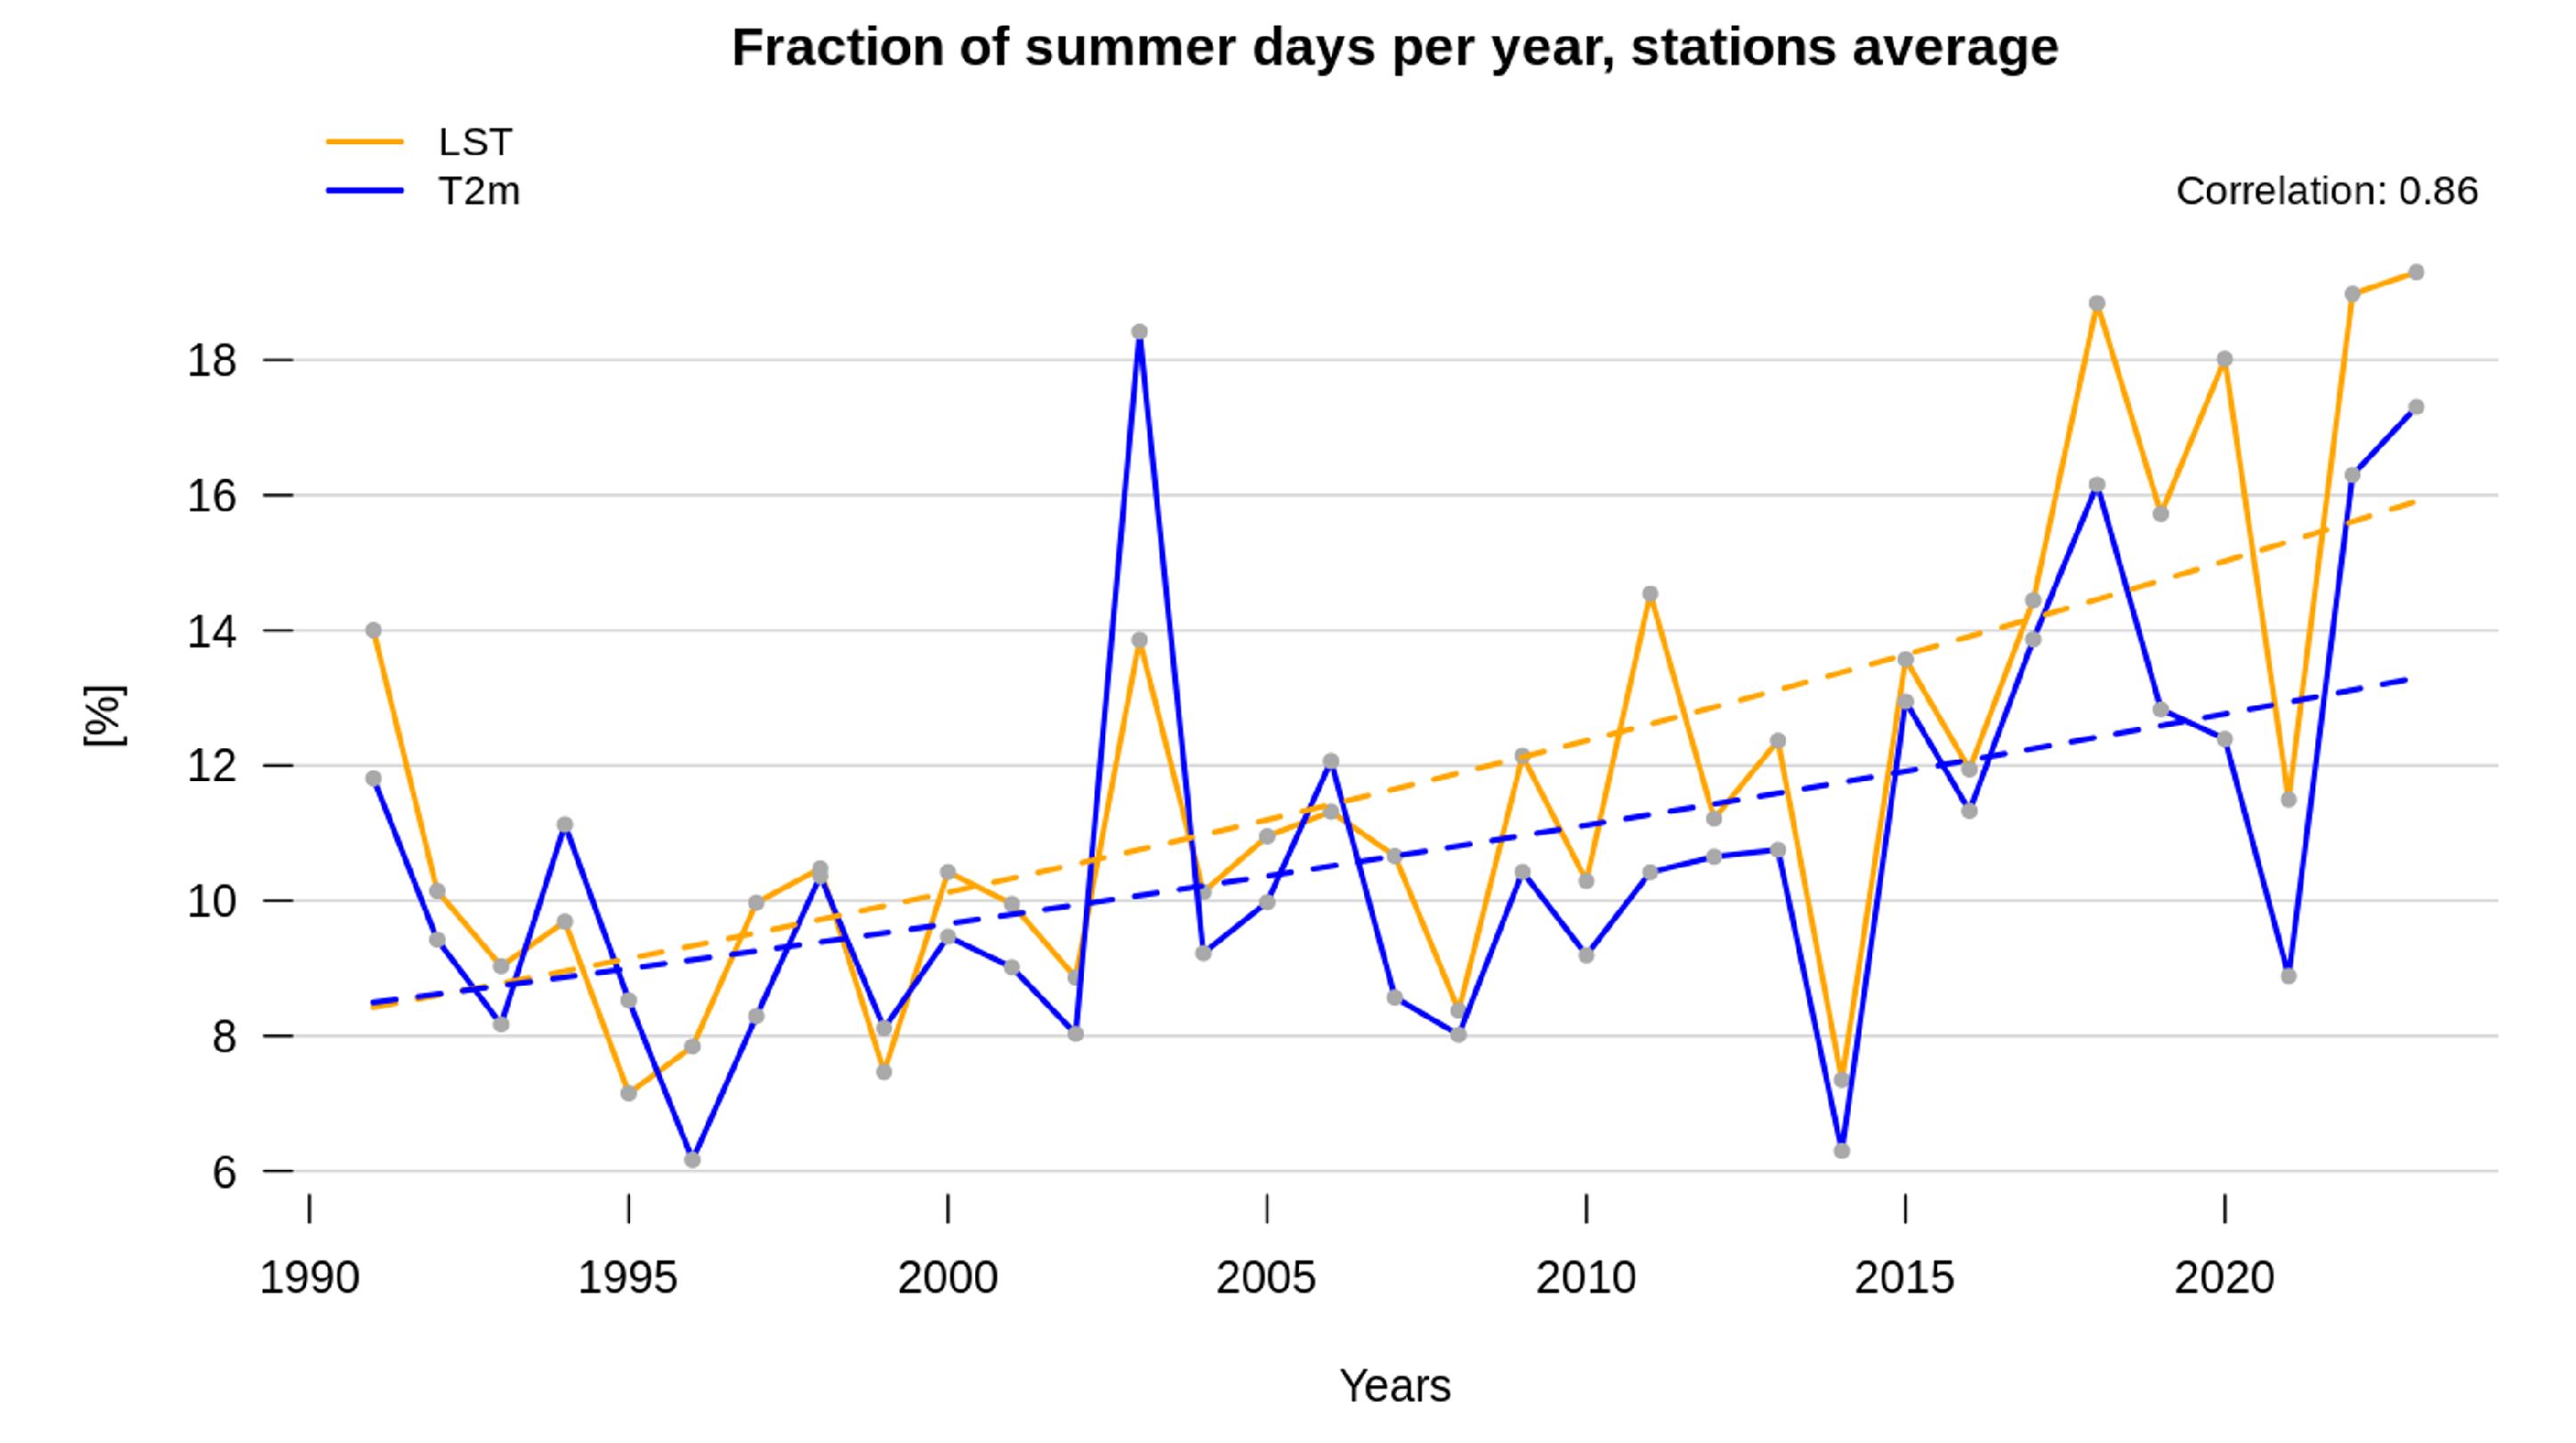
Figure 4.
Summer Day index in Switzerland for the years (a) 1993 and (b) 2018 calculated from satellite-based CM SAF SUMET v.2.0 clear-sky LST observations (LST-CS). The trend over the period 1991-2023 and associated adjusted p-values are provided in (c) and (d). The abbreviations in c) refer to SwissMetNet stations with the station trends provided as color coded circles at the station locations.
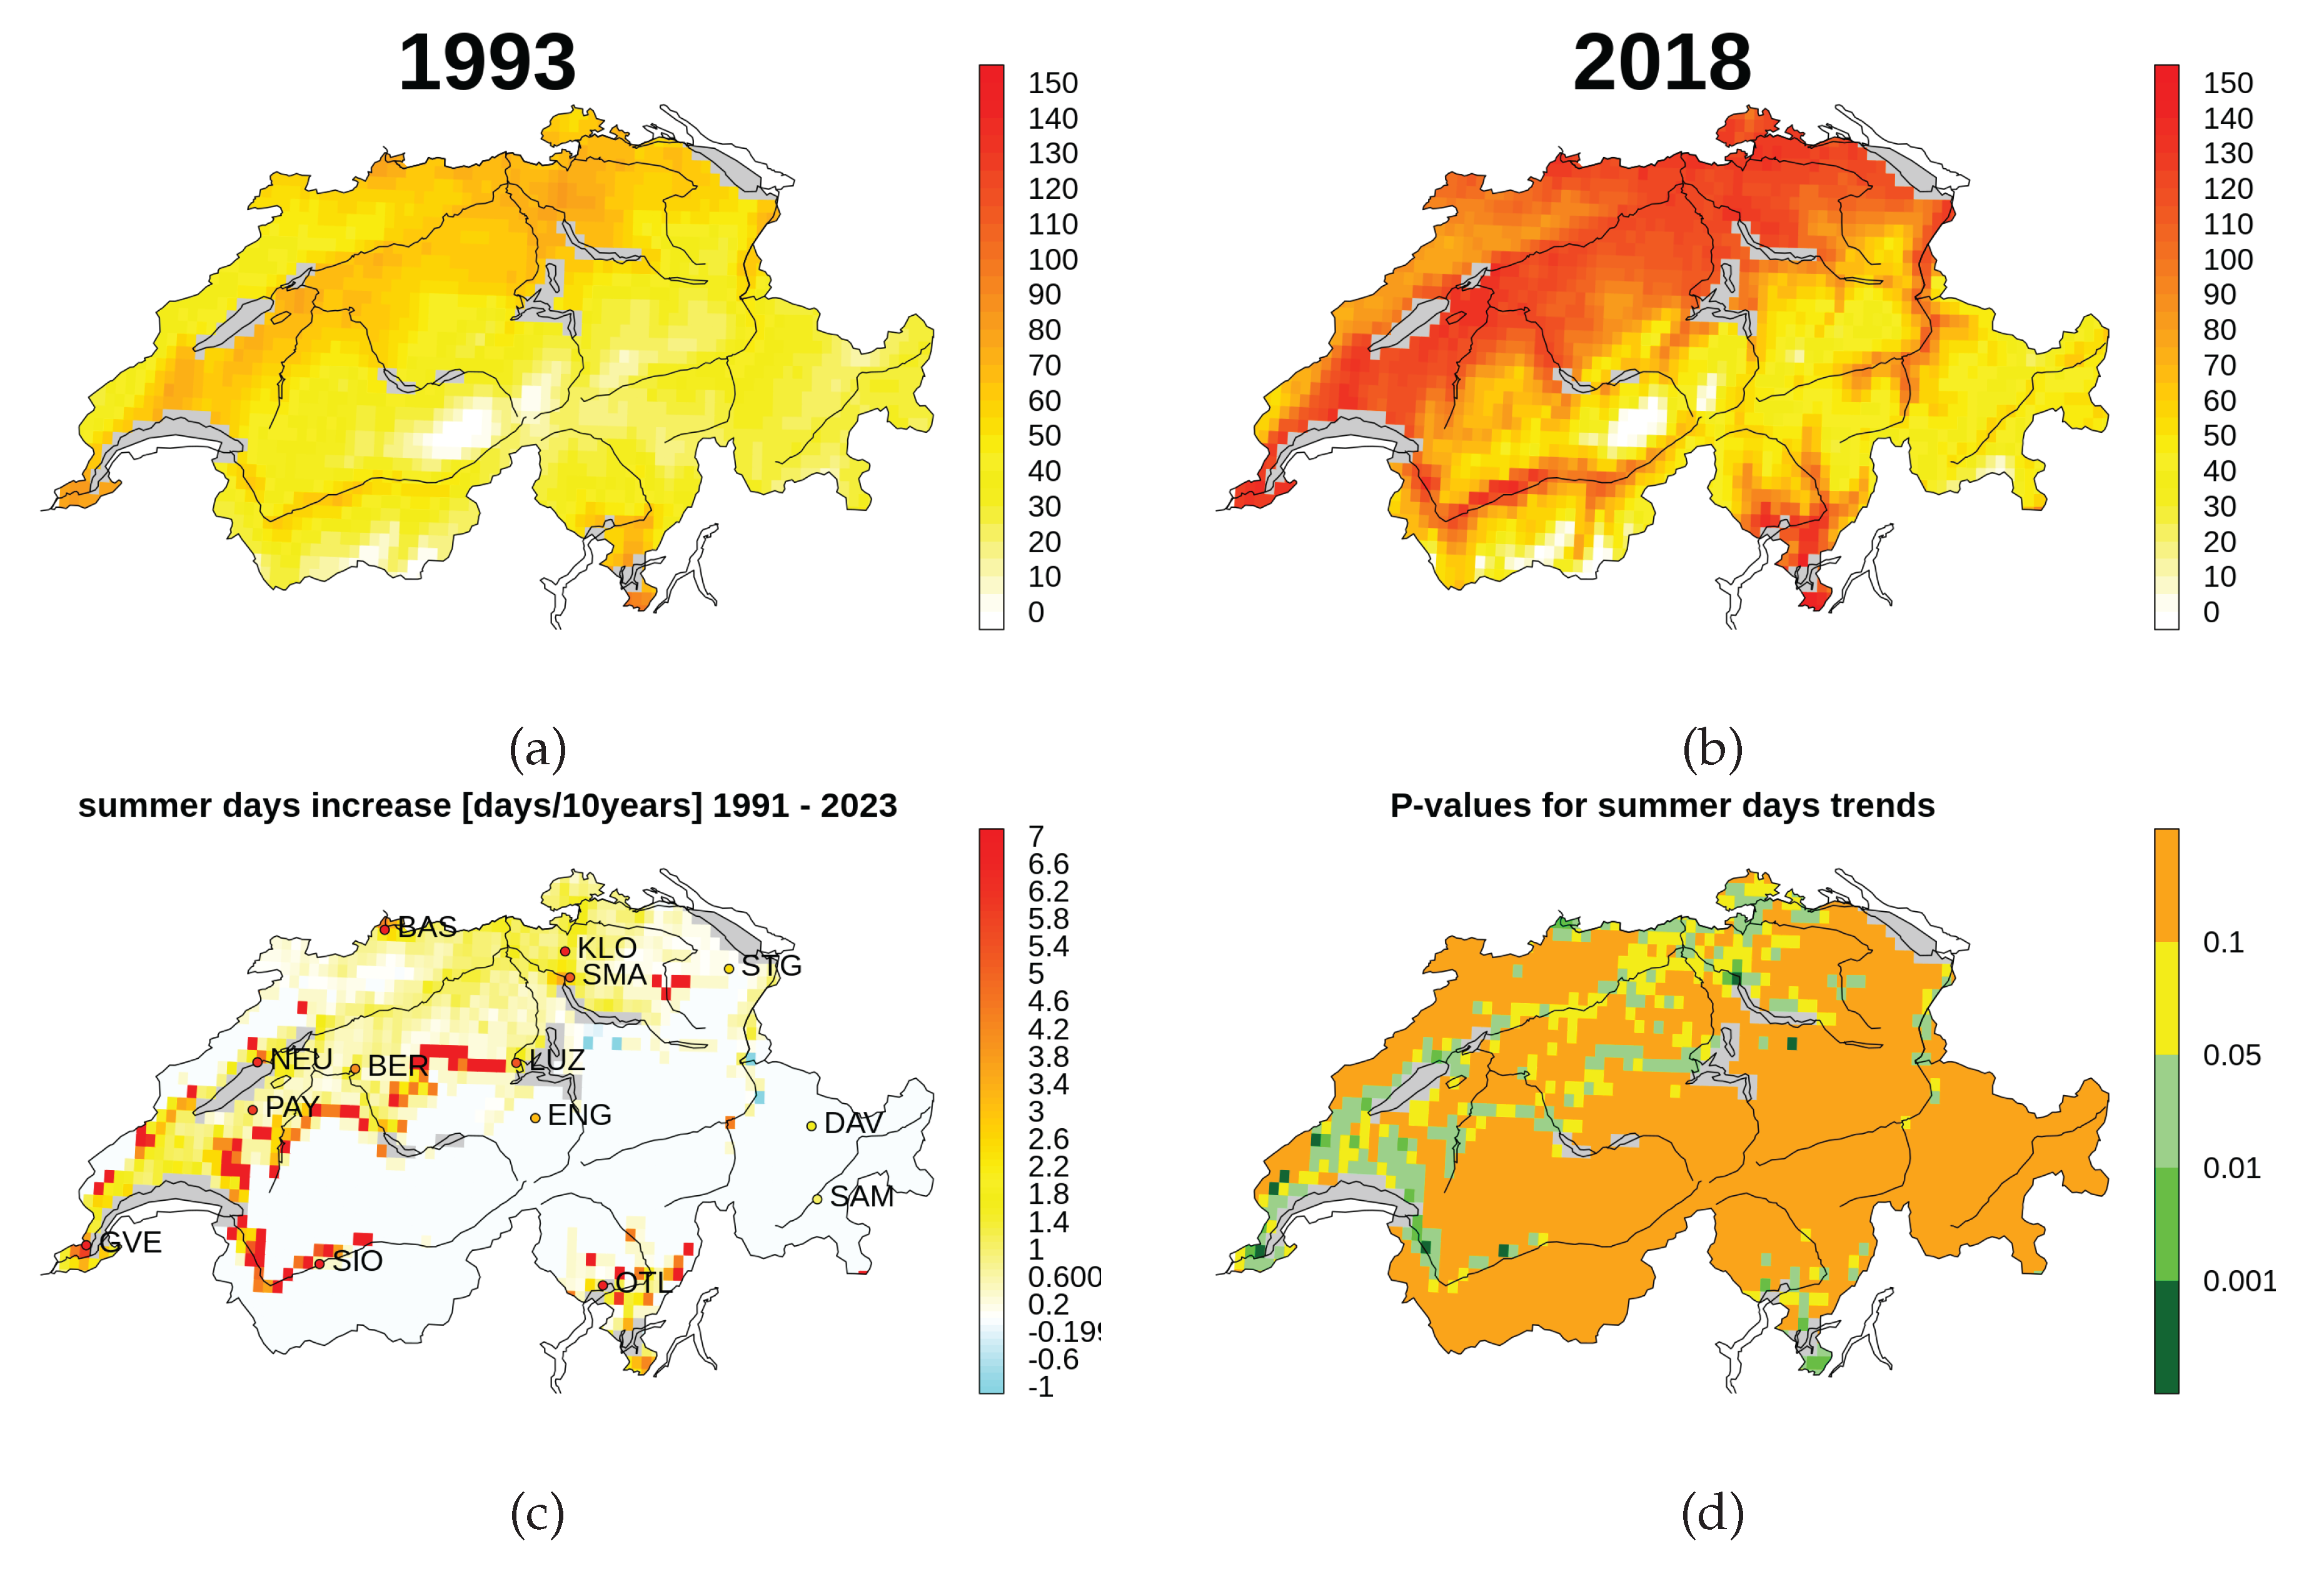
Figure 5.
Extremely Hot Days index calculated from station-based Swiss Near-Surface Air Temperature (NSAT) measurements and satellite-based LST data. Relative number of days with available data per year satisfying the index conditions over the considered stations (average over all stations, 1991-2023). NSAT, blue: Near-Surface Air Temperature; LST-CS, orange: CM SAF SUMET v.2.0 clear-sky LST.
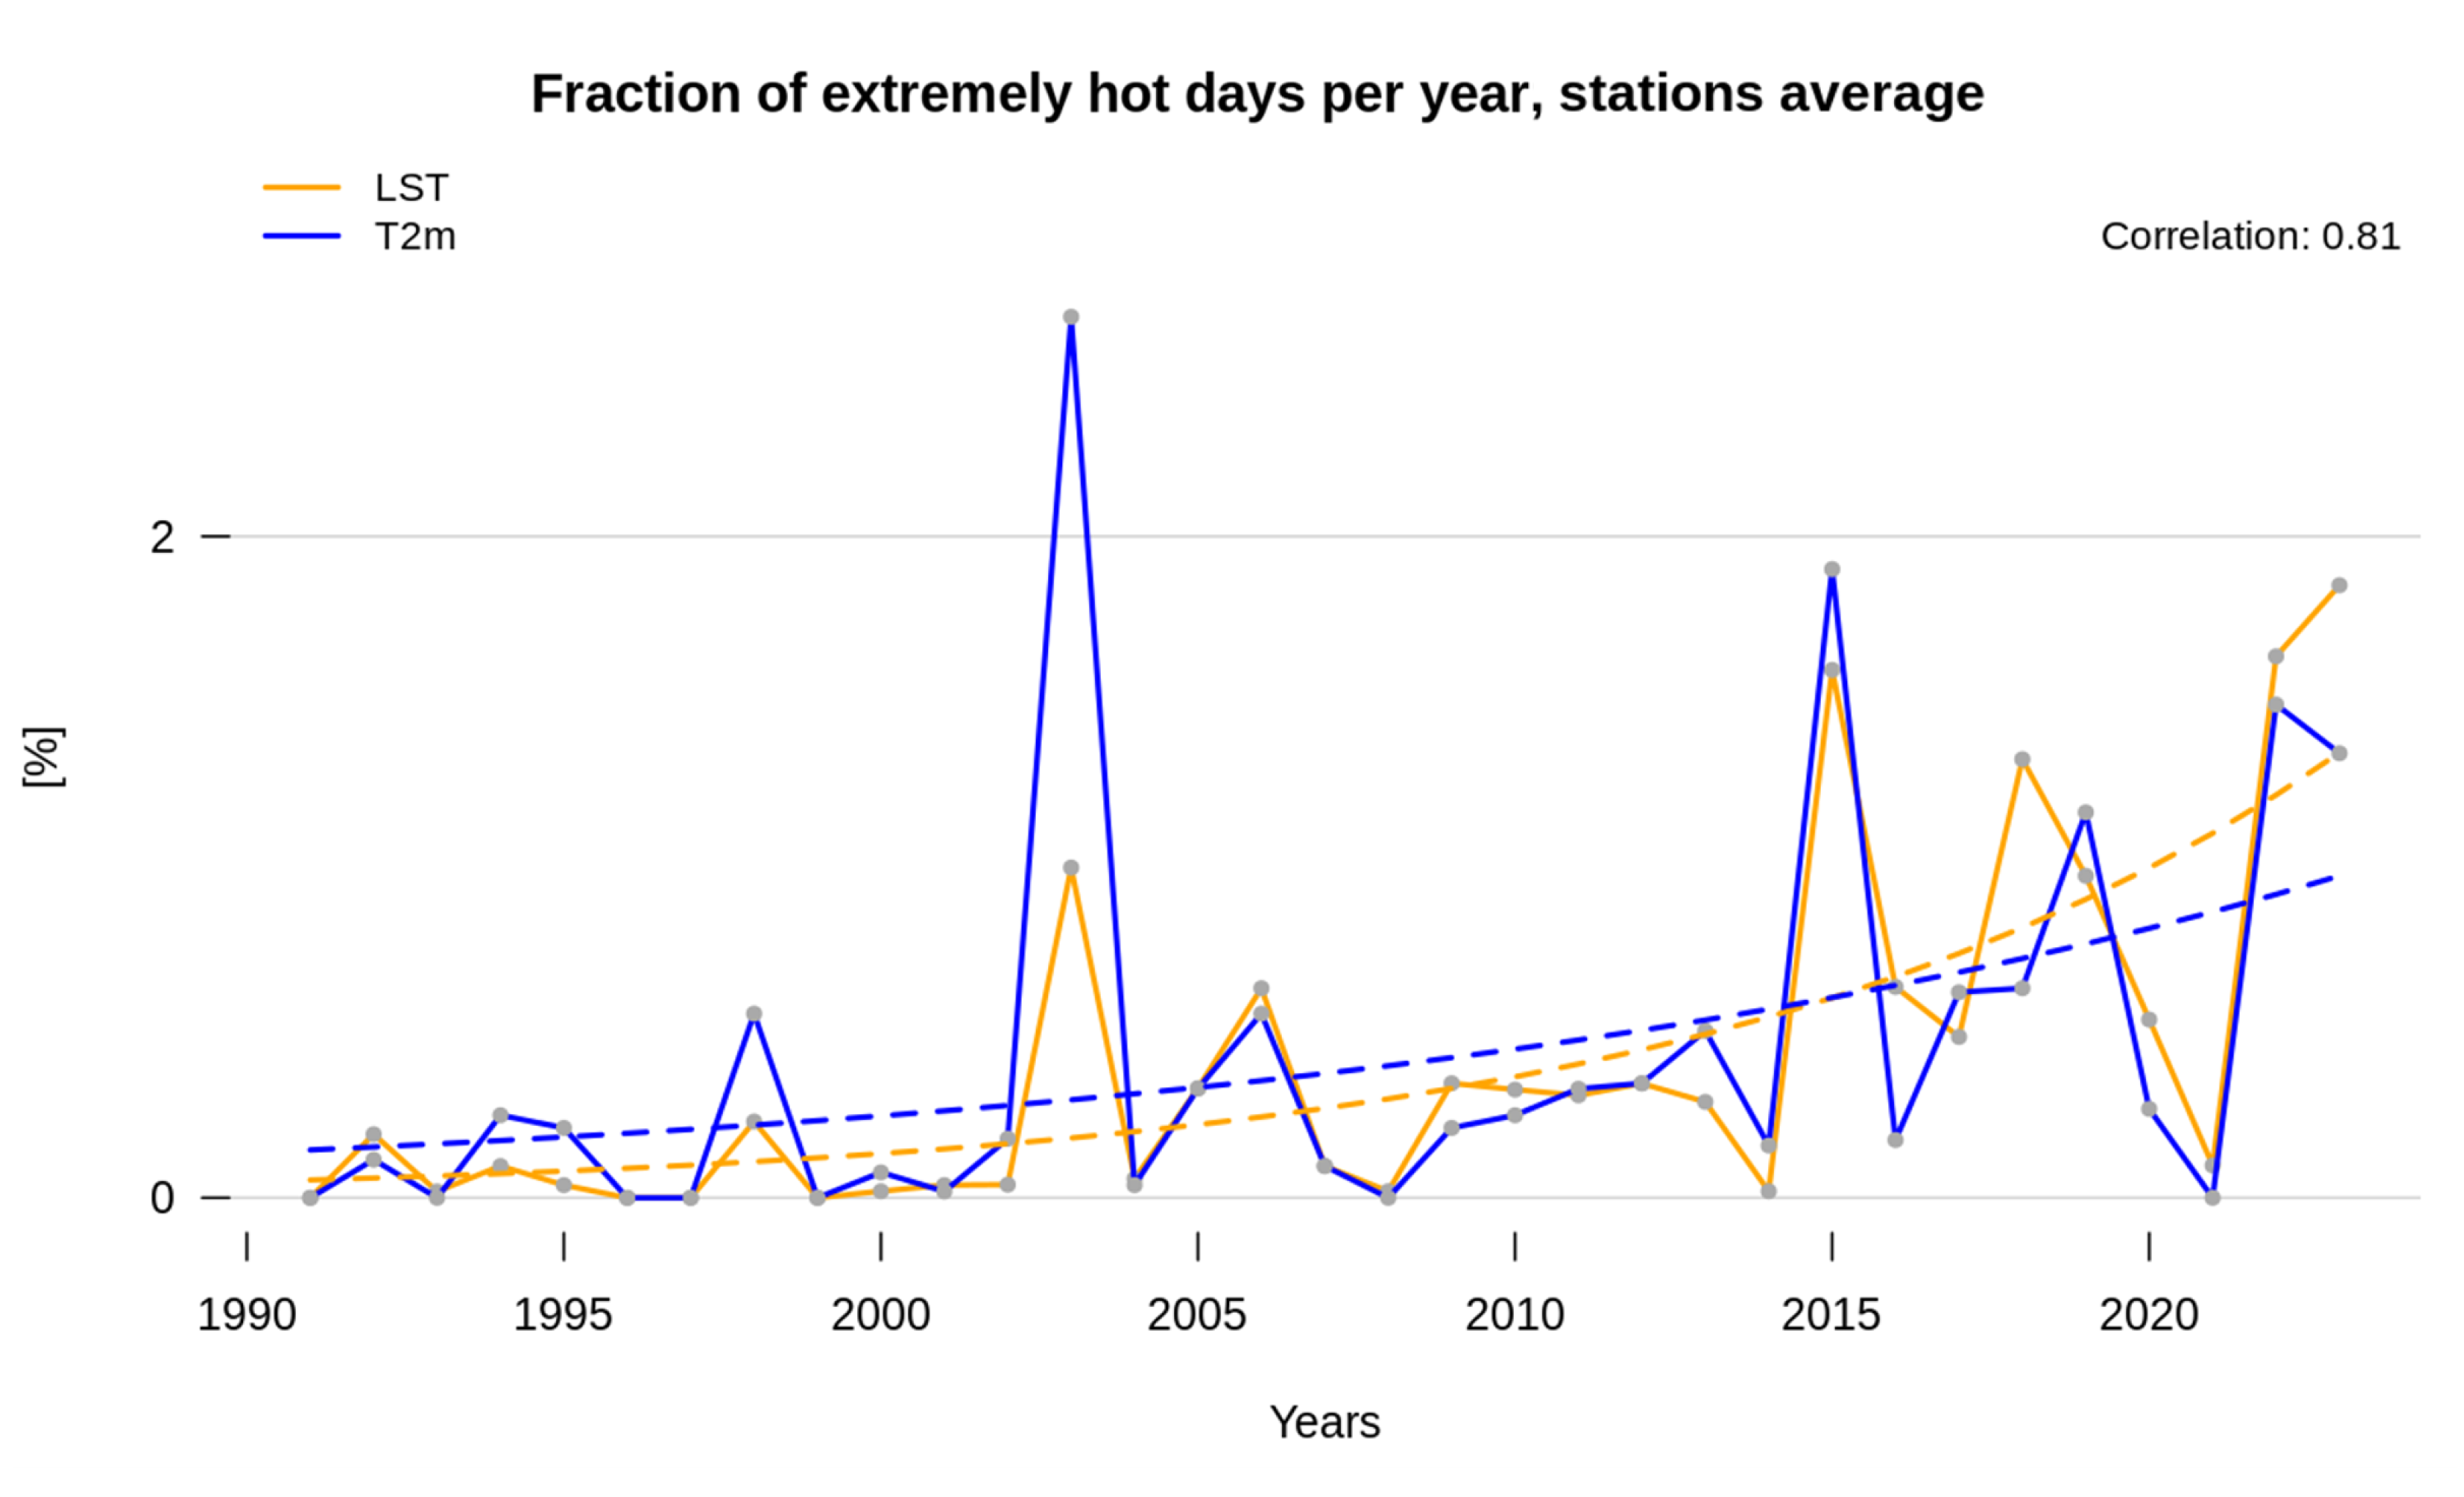
Figure 6.
Extremely Hot Days index in Switzerland for the years (a) 1993 and (b) 2018 calculated from satellite-based CM SAF SUMET v.2.0 clear-sky Land Surface Temperature observations (LST-CS). The trend over the period 1991-2023 and associated adjusted p-values are provided in (c) and (d). The abbreviations in c) refer to SwissMetNet stations with the station trends provided as color coded circles at the station locations.
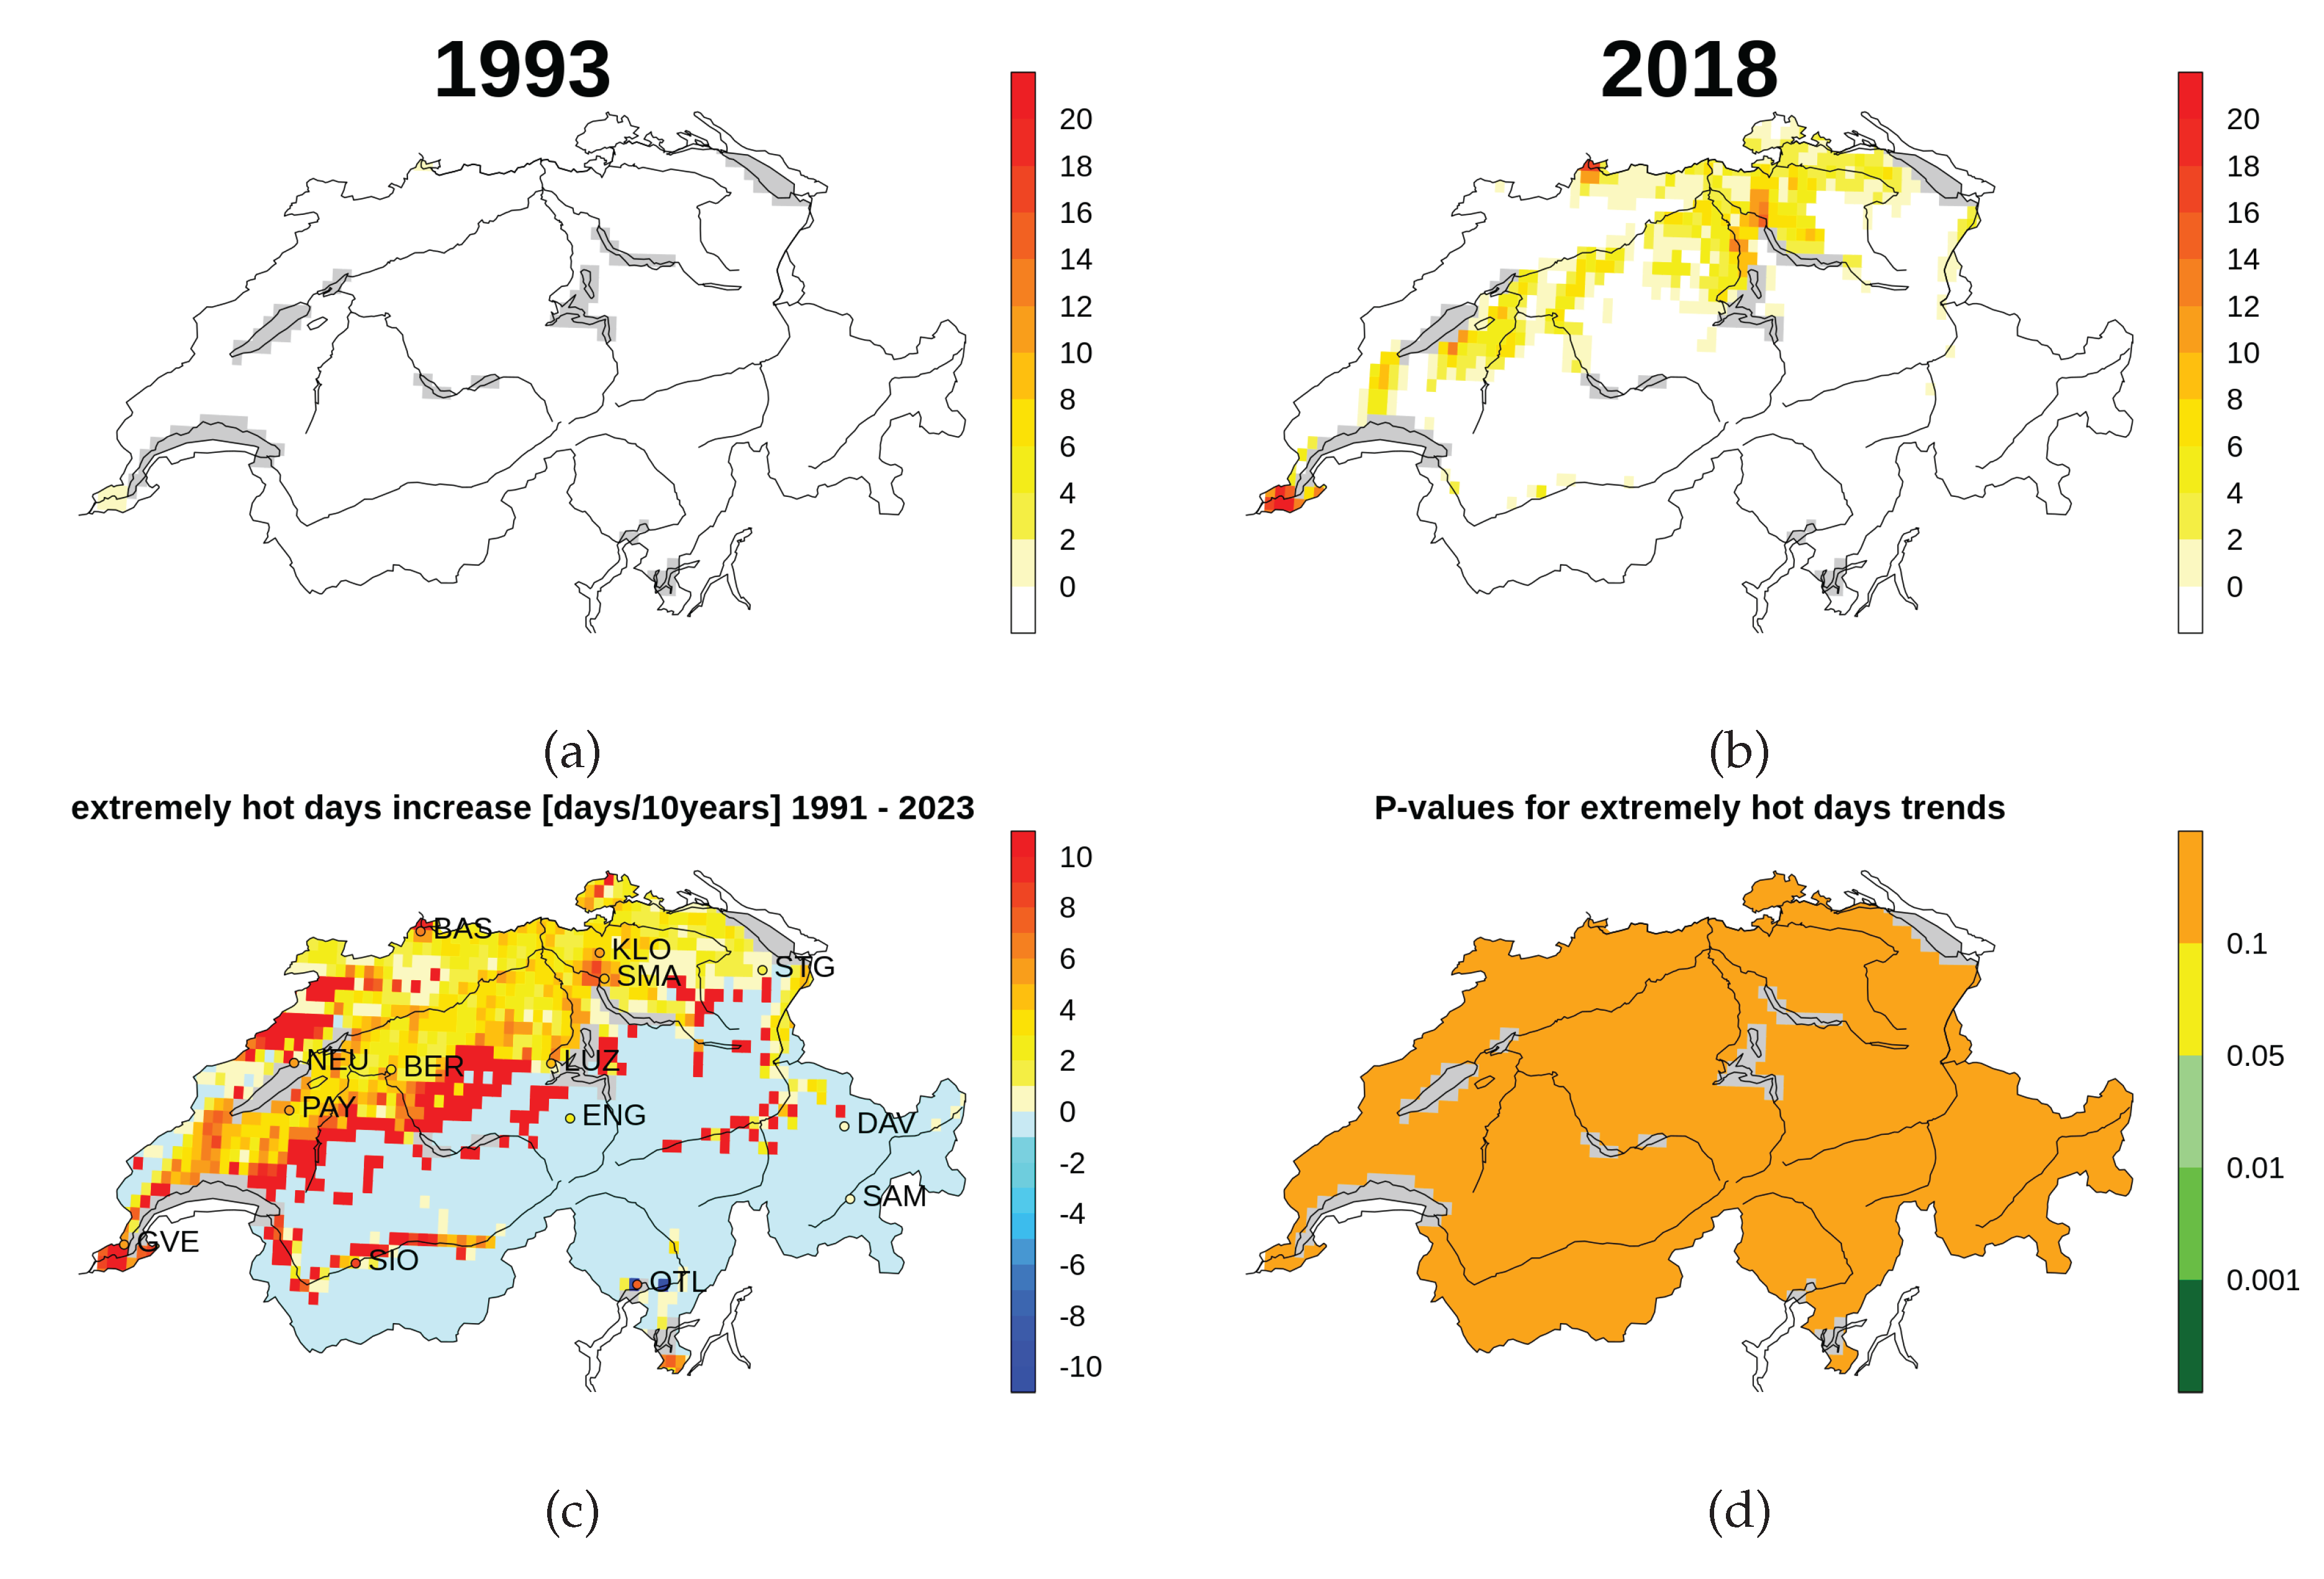
Figure 7.
Number of Extremely Hot Days per year in Switzerland over the entire 1991-2023 period.
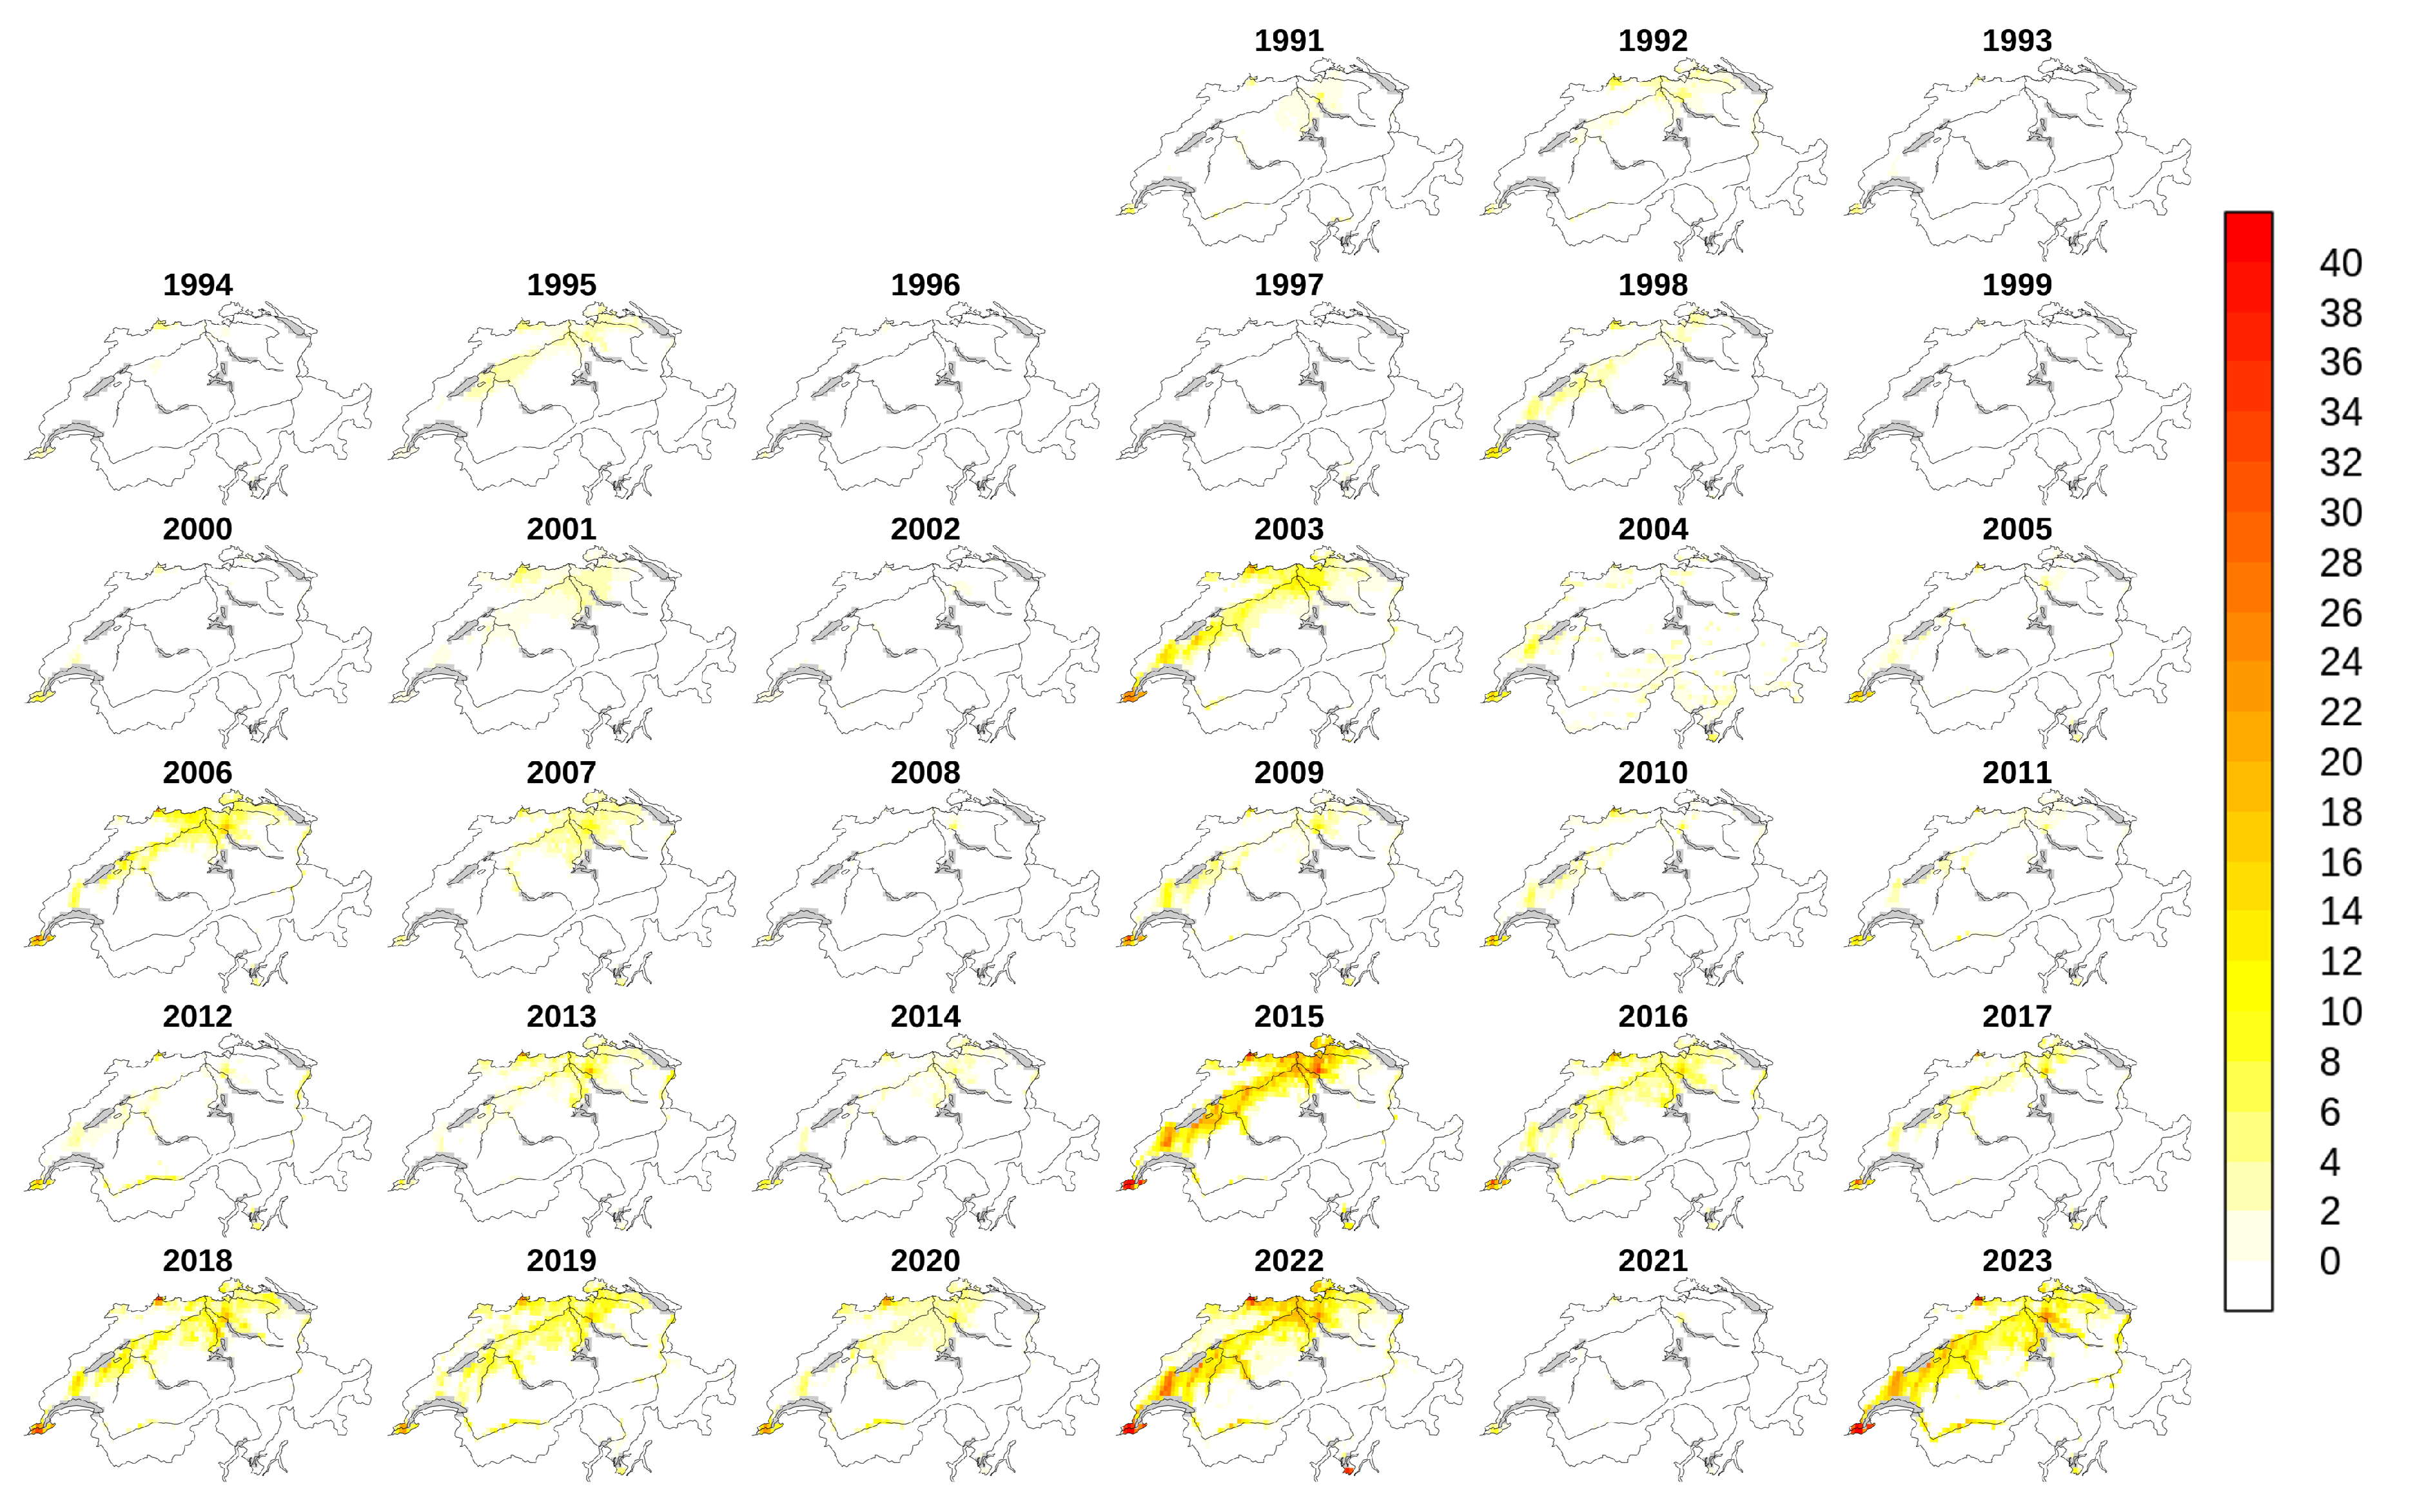
Figure 8.
Tropical Night index in Europe for the years (a) 1993 and (b) 2018 calculated from satellite-based CM SAF SUMET v.2.0 clear-sky Land Surface Temperature observations (LST-CS). The trend over the period 1991-2020 and associated adjusted p-values are provided in (c) and (d).
Figure 8.
Tropical Night index in Europe for the years (a) 1993 and (b) 2018 calculated from satellite-based CM SAF SUMET v.2.0 clear-sky Land Surface Temperature observations (LST-CS). The trend over the period 1991-2020 and associated adjusted p-values are provided in (c) and (d).
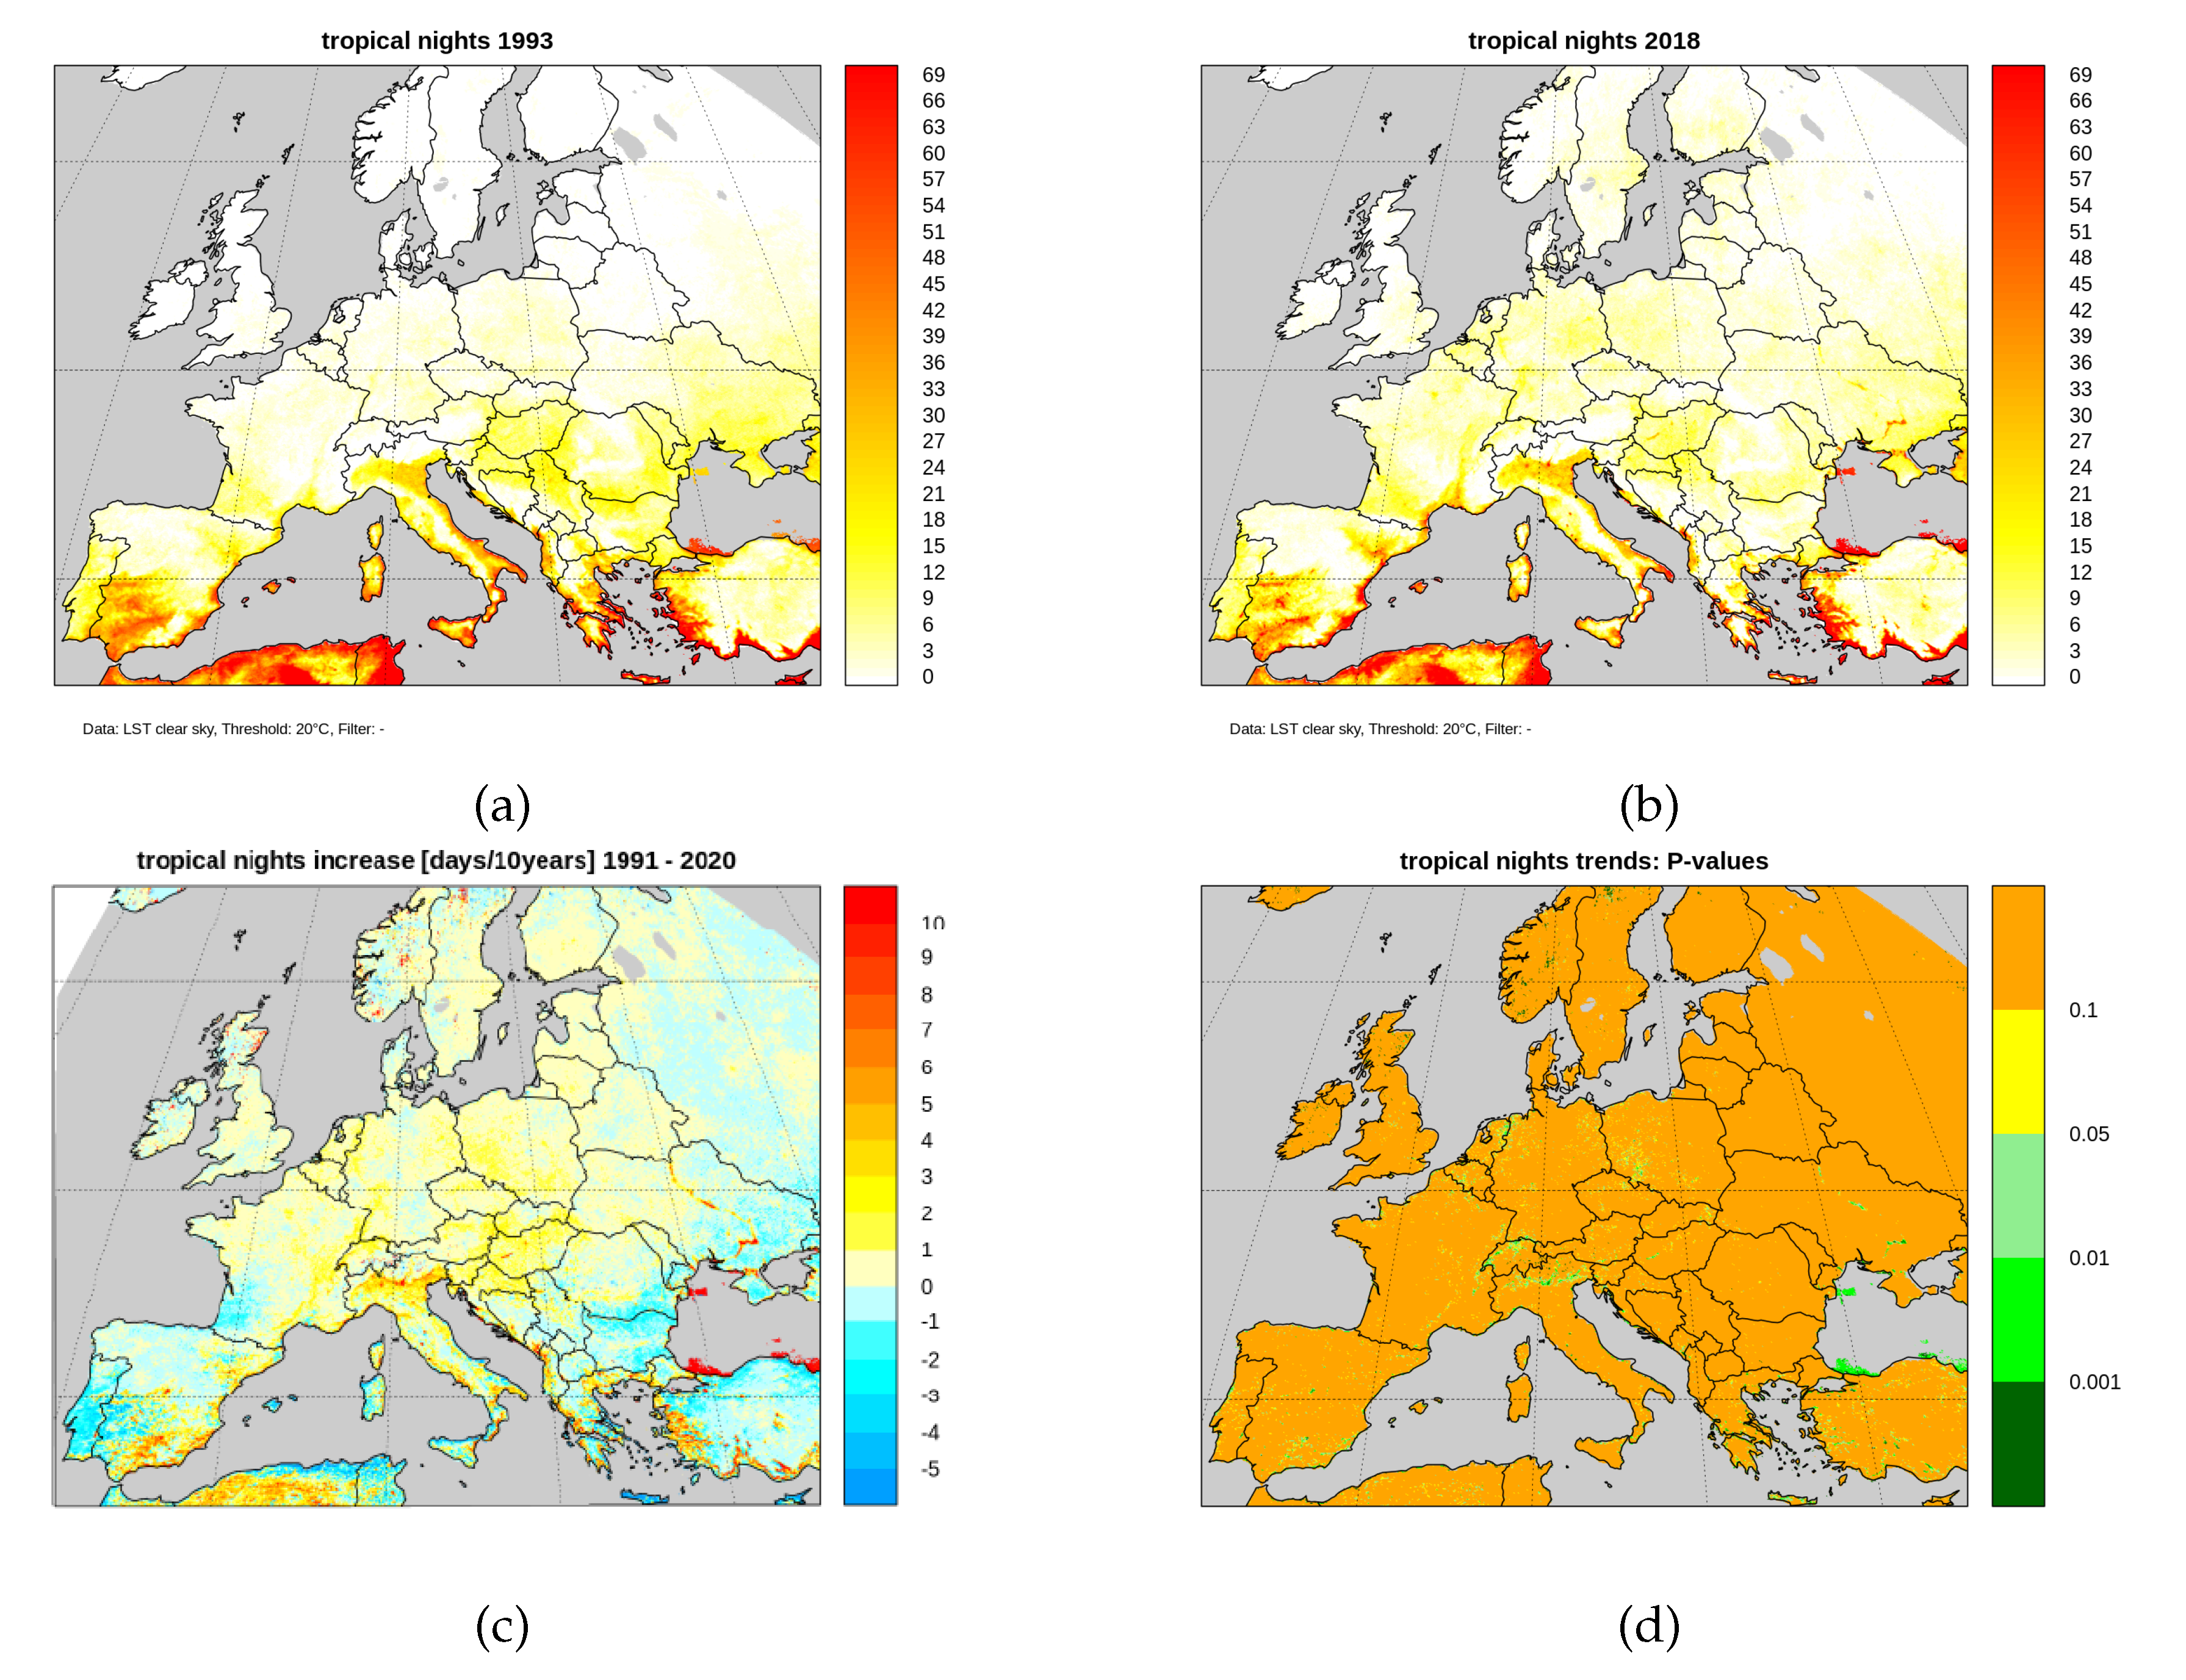
Figure 9.
Summer Days index in Europe for the years (a) 1993 and (b) 2018 calculated from satellite-based CM SAF SUMET v.2.0 clear-sky LST observations (LST-CS). The trend over the period 1991-2020 and associated adjusted p-values are provided in (c) and (d).
Figure 9.
Summer Days index in Europe for the years (a) 1993 and (b) 2018 calculated from satellite-based CM SAF SUMET v.2.0 clear-sky LST observations (LST-CS). The trend over the period 1991-2020 and associated adjusted p-values are provided in (c) and (d).
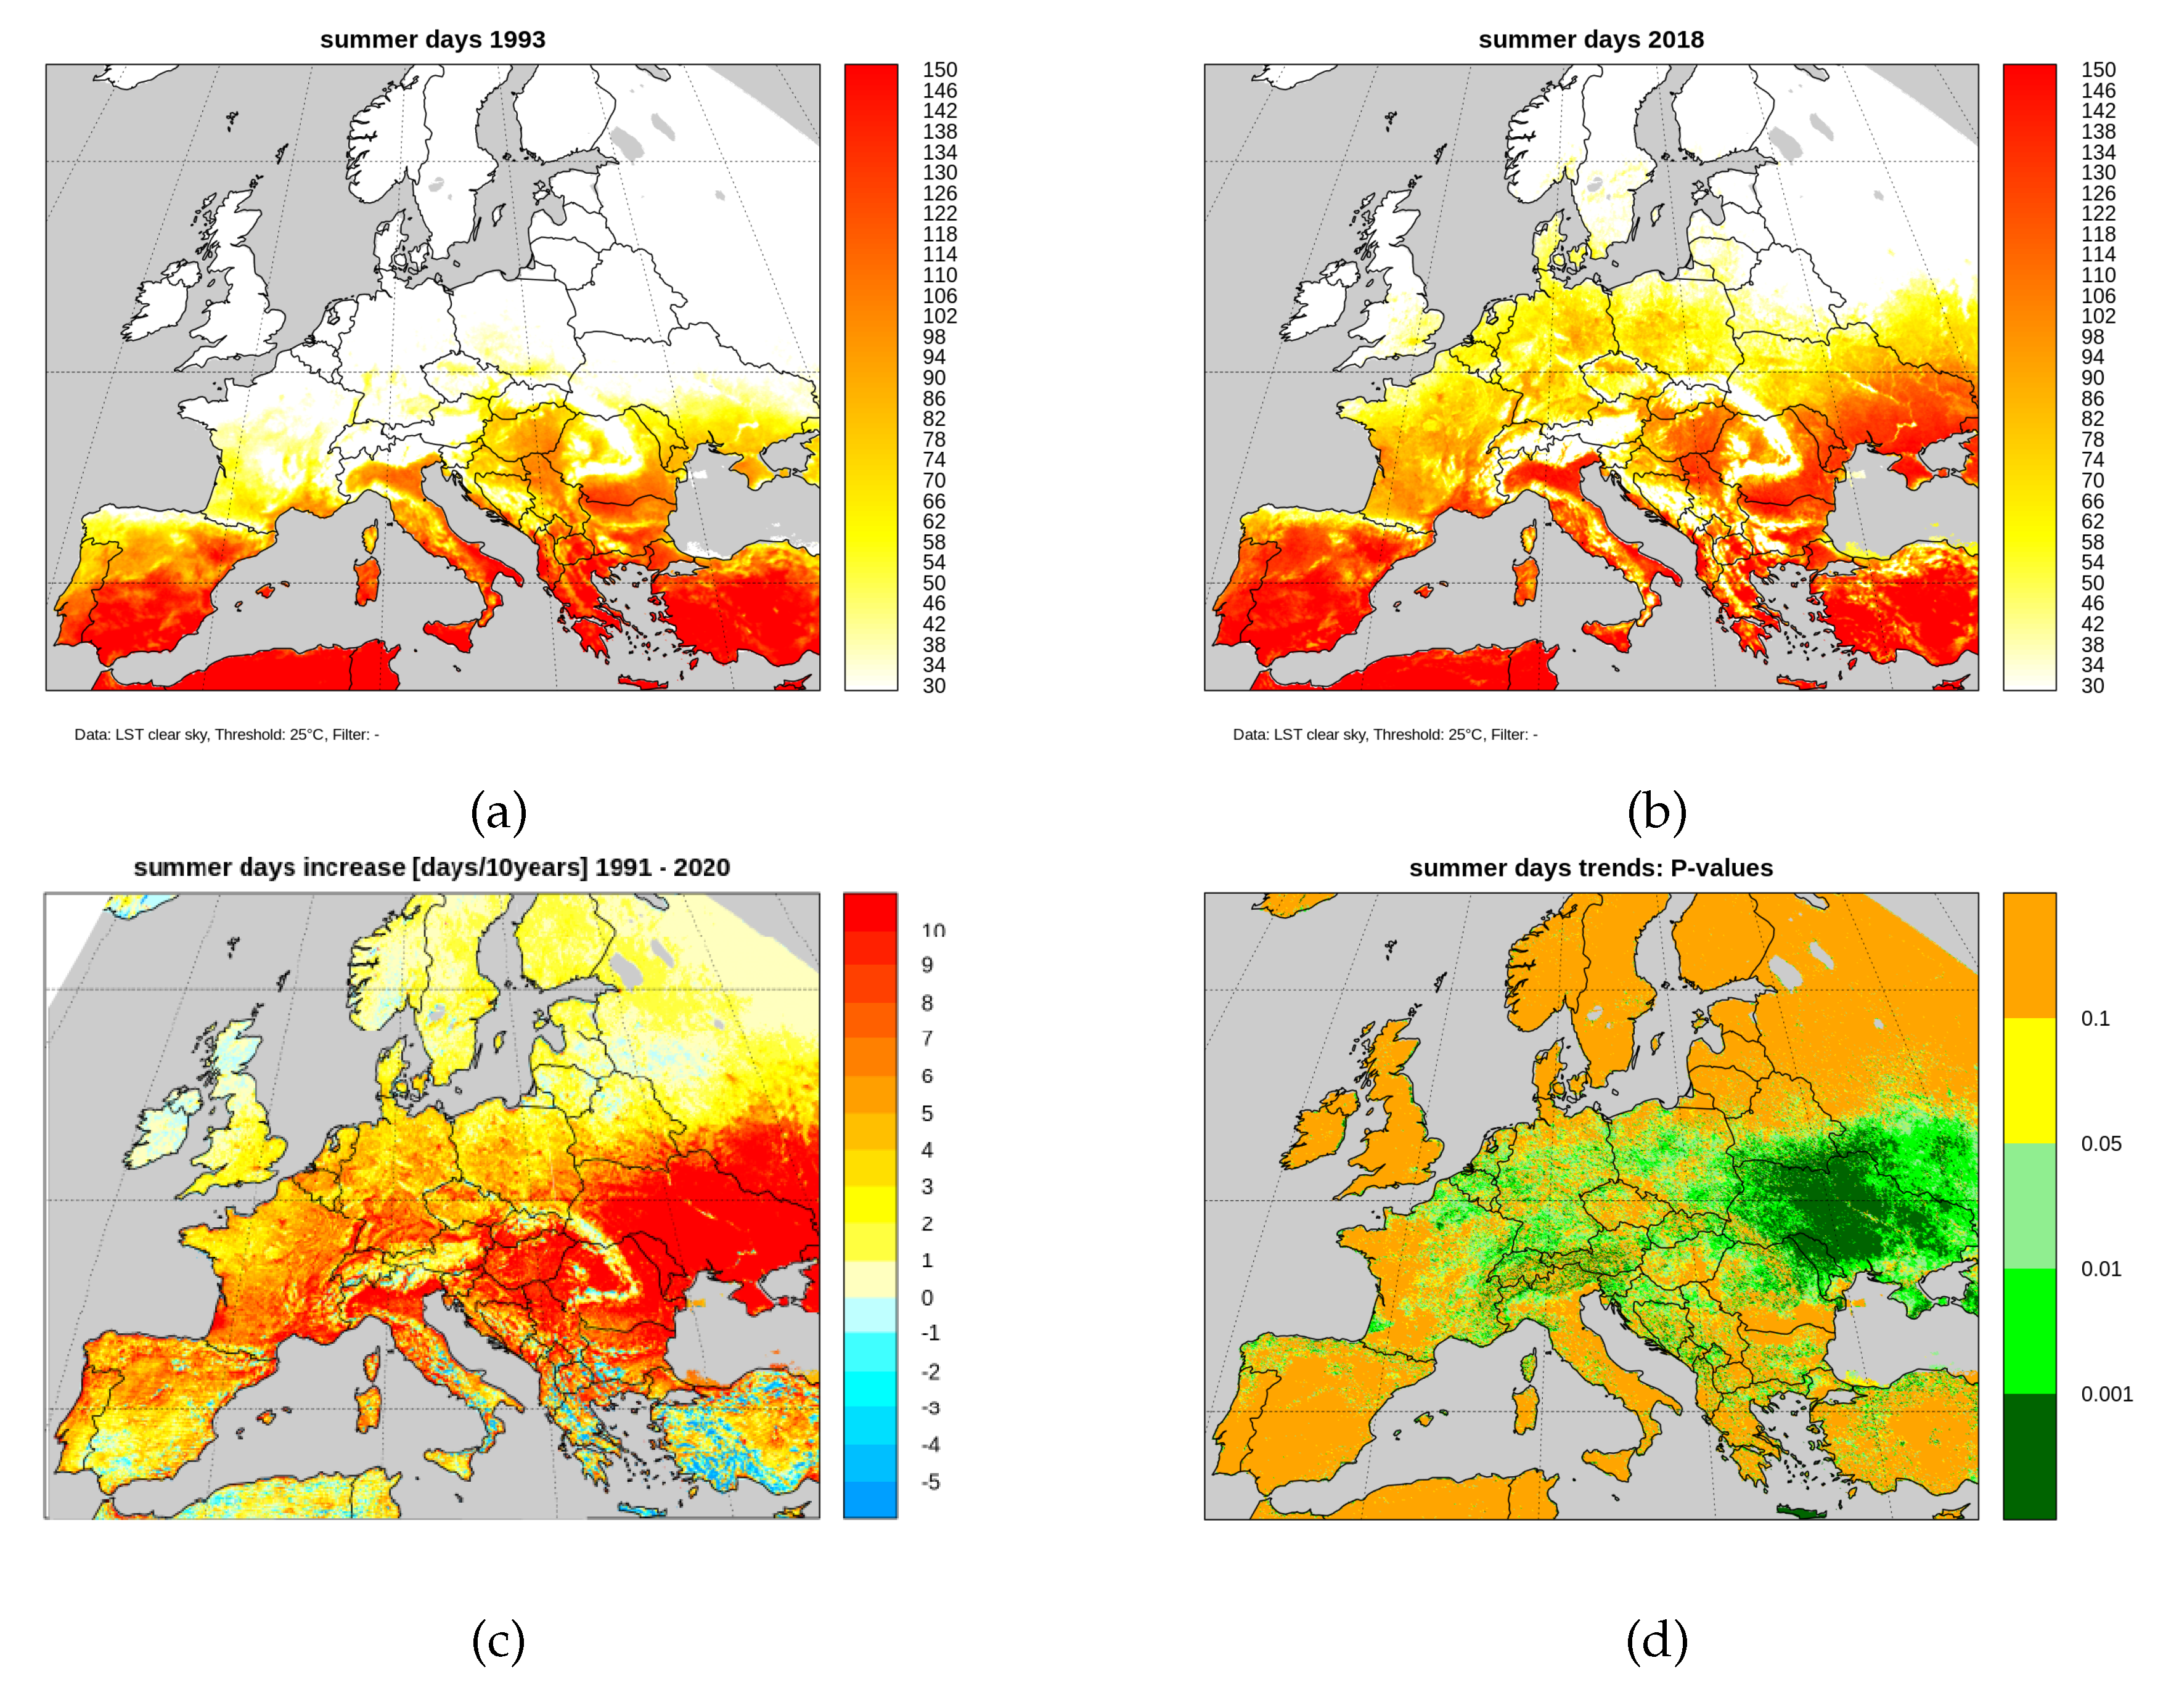

Table 1.
Stations of the SwissMetNet providing the NSAT data used in this study.
| SwissMetNet stations | |||
|---|---|---|---|
| Name | Abbreviation | Latitude | Longitude |
| Basel | BAS | 47.541142 | 7.583525 |
| Bern | BER | 46.990744 | 7.464061 |
| Davos | DAV | 46.812969 | 9.843558 |
| Engelberg | ENG | 46.821639 | 8.410514 |
| Fluntern | SMA | 47.377925 | 8.565742 |
| Geneve | GVE | 46.247519 | 6.127742 |
| Kloten | KLO | 47.479611 | 8.535961 |
| Locarno | OTL | 46.172256 | 8.787494 |
| Luzern | LUZ | 47.036439 | 8.301022 |
| Neuchatel | NEU | 47.000067 | 6.953297 |
| Payerne | PAY | 46.811581 | 6.942469 |
| Samedan | SAM | 46.526247 | 9.879469 |
| Sion | SIO | 46.21865 | 7.330203 |
| St. Gallen | STG | 47.425475 | 9.398528 |
Table 2.
Definition of the heat indices considered in this study.
| Heat indices | |
|---|---|
| Tropical Nights | |
| Summer Days | |
| Extremely Hot Days | |
Table 3.
Correlations ( coefficients) between satellite-based clear-sky LST and station-based NSAT heat indices averaged over all Swiss stations for the period 1991-2023. (Figure 1, Figure 3, Figure 5).
| Correlations of satellite-based LST-CS with station-based NSAT heat indices | ||
|---|---|---|
| Tropical Nights | Summer Days | Extremely Hot Days |
| 0.84 | 0.86 | 0.81 |
Disclaimer/Publisher’s Note: The statements, opinions and data contained in all publications are solely those of the individual author(s) and contributor(s) and not of MDPI and/or the editor(s). MDPI and/or the editor(s) disclaim responsibility for any injury to people or property resulting from any ideas, methods, instructions or products referred to in the content. |
© 2025 by the authors. Licensee MDPI, Basel, Switzerland. This article is an open access article distributed under the terms and conditions of the Creative Commons Attribution (CC BY) license (http://creativecommons.org/licenses/by/4.0/).
Copyright: This open access article is published under a Creative Commons CC BY 4.0 license, which permit the free download, distribution, and reuse, provided that the author and preprint are cited in any reuse.


