
Submitted:
03 December 2025
Posted:
05 December 2025
You are already at the latest version
Abstract
This paper presents an outline of the problems facing the Polish energy sector. It high-lights the significant role of wind energy in the National Power System, while limiting the possibility of installing new wind farms. It is suggested that repowering and ex-tending the operational life of wind turbines will be an important solution to this problem. The possibility of using data from existing turbines to inform operational strategies was analyzed. Historical data was obtained for selected wind turbines and statistically analyzed. The main goal of the study was to develop regression models for wind conditions and electricity production. The best fit between the actual distribu-tions of the analyzed variables and selected theoretical distributions was determined. It was demonstrated that in the analyzed case, the Log-Normal distribution provided a better fit than the Weibull distribution, preferred by the energy industry.
Keywords:
wind turbines
; operation strategy
; regression analysis
; variable distributions
; forecasting
1. Introduction
1.1. National Power System (NPS) in Poland
Wind energy is a significant component of the National Power System (NPS) in Poland. Its share is systematically increasing. According to the Polish Energy Policy, the planned installed capacity of wind turbines by 2030 would reach 14.5 GW. The forecast of the Ministry of Climate and Environment is slightly higher, projecting approximately 15.8 GW from onshore wind farms and approximately 5.9 GW from offshore wind farms [1]. At the same time, coal-based electricity production is expected to steadily decline. Publications [2,3] indicate that the share of coal sources has fallen to 43.2%, with a total capacity of 18.7 GW for hard coal-fired power plants (30.7% of the NPS structure) and 7.6 GW for lignite-fired power plants (12.5%). At the same time, due to rising living standards, demand for electricity will increase. In the study provided by the government [4] it is indicated that in 2040 the structure of the Polish power system, for 72 GW of installed capacity, is to be based on approximately 50% of renewable sources and only approximately 19% on conventional coal sources.
The share of coal in the NPS will soon begin to decline. Coal-fired power plant retirements are expected in the coming years. Up to 8 GW could disappear from the market after 2025, as capacity contracts expire and cannot be renewed. The next large wave of retirements will occur in 2029–2030, when the 5-year contracts concluded in the fourth capacity market auction expire. These were coal-fired units modernized between 2024 and 2028. Nearly 6 GW of coal-fired power will then disappear from the market. The third wave will occur by the end of 2035 at the latest, due to the expiration of 15-year contracts for new coal-fired units [5].
However, fossil fuel-based power plants are an essential element of energy system balancing. The system based on steam and hydroelectric power plants relied on large, centralized, and dispatchable synchronous generators. Sufficient system inertia was generated as a byproduct of the synchronous generators’ operation. Thermal generation is capacity-limited, associated with significant variable costs, and the basic units (coal-fired and nuclear power plants) are inflexible. Innovative technologies, such as converters, energy storage, and ICT infrastructure, will enable a shift away from the dominant influence of steam power plants on energy system stability. Mathematical models are being developed that use forecasting techniques to address the uncertainty and variability of renewable energy generation capacity, while load modeling is intended to capture the behavior of new load types. The interplay of innovative technologies, mathematical models, and demand response are key elements of a successful energy transition [6].
One of the fastest-growing components of the NPS is photovoltaics. Based on data from the official report by the energy market regulator URE [7], PV installations in Poland produced less energy than wind sources in October 2025, reaching 1.2 TWh (22.3% of RES generation), which represents a 19.8% increase over the year. Installed capacity in PV installations at the beginning of July was 23.7 GW, an increase of 22.4% over the year. Prosumer installations account for approximately 12.7 GW, an increase of 10.0% over the year. The change in the structure of generation sources in NPS in Poland is shown in Figure 1.
Wind farms, meanwhile, produced 3.2 TWh of electricity in October 2025 (58.0% of renewable energy generation). This is 51.0% more than in October 2024. Installed capacity in wind farms at the beginning of August was 11.1 GW – a 7.3% increase year-on-year.
Biomass plants produced approximately 1.0 TWh in September, and hydropower plants produced 0.1 TWh.
However, the unpredictability of renewable energy sources is a significant problem, also in Poland [8,9]. This significantly affects the energy system and must be regulated by the grid operator. In situations where the total power supplied in a given hour is higher than the current demand, it is necessary to use electricity storage, export surplus energy, or even shut down renewable energy sources [1].
In the latest report from November 6, 2025, [10] states that in October 2025, the system operator was forced to disconnect renewable energy generation units (curtailment) for 209 hours (an average of 28% of the monthly hours) over a 20-day period (Figure 2). These situations occurred mainly around noon and at night. Generation was limited to 140.2 GWh of electricity, including 34.9 GWh from photovoltaics and 105.2 GWh from wind sources (3.1% of potential production). However, for most of the year, curtailment mainly concerns large-scale photovoltaic installations. This high level of renewable energy reduction is a result of the need to maintain power system stability while the flexibility of coal-fired power sources is low.
Thanks to its advantages related to installation technology, photovoltaic technology has become recognized as the fastest growing source of electricity generation in the world and a driving force for energy transformation, and in some countries it is expected to further increase the installed capacity in the near future [11,12].
In this context, renewable energy sources in general, and photovoltaics in particular, have significantly increased their role in the energy production mix in various countries in recent years, and their presence has led to changes in the strategies of power grid operation [13].
These policies must continue to evolve in the future so that renewable energy sources become the basis for electricity generation and the transformation towards greater decarbonisation of sectors such as energy demand in buildings, air conditioning and transport [14,15,16].
In recent years, the Polish NPS has seen a rapid increase in the use of renewable energy sources and their structure [17,18]. As shown in Figure 1, the structure of renewable energy use has changed. Initially, coal-fired power plants co-firing solid biofuels were used, which was the first step in the green transformation (2012). However, this solution was only temporary and used in decommissioned installations. After a transitional period, wind power was installed (2017). The decline in PV installation prices and regulations enabling the installation of micro-installations resulted in an increase in the installed capacity of these installations (2022).
One of the main barriers to wind energy in Poland is location restrictions. These limit the ability to connect new installations to the electricity grid. Another significant limitation is the minimum distance of 700 meters from residential buildings. This has limited the location options for new installations. It is estimated that this has reduced the potential installed capacity by approximately 60–70% compared to the potential for a distance of 500 meters. The introduction of the 10H rule, which used to indicate the distance of the turbine from buildings depending on the height of the tower, also contributed to the reduction in the number of wind farms installed (Figure 3).
As can be seen from the analysis of the map presented in Figure 4, the Starorypin wind farm analyzed later in the article, would not have been built under the current legal conditions due to the failure to maintain the distance between the turbines and the wind turbines.
The construction of new wind turbines requires an investment process. One of its stages is a cost-effectiveness analysis. This should be based on wind parameter measurement studies. Therefore, it is necessary to:
- obtain a decision on building conditions for one or more measurement masts;
- construct the measurement mast(s) and collect data for at least one year.
Then, based on the collected data, an analysis of wind measurements is carried out, a multi-variant selection of turbines is made, productivity is estimated, and the location of individual turbine sets is determined.
1.2. Operation Strategy of Wind Power Plants
Due to the operational processes of wind turbines, they age, requiring operational decisions. Manufacturers declare a wind turbine service life of 25–30 years. The standard design life of a wind turbine is at least 20 years, consistent with the International Electrotechnical Commission (IEC) standard [19]. This period is also confirmed by research conducted by scientists. Many studies are related to fatigue [20,21,22]. As Wang et al. report, the turbine tower should be monitored after 20 years to prevent damage caused by changing wind conditions [18]. The authors also point to the reliability of key components. Jiang et al. show that the gearbox is one of the most critical components in terms of failure rate [24]. Hill et al. demonstrate that some components have typical lifespans of 6–12 years, which affects the actual operation over a period of 20+ years [25]. The generator, gearbox and bearings are also subject to analysis and are indicated as risk-generating elements that should be taken into account in the operation process [26].
Another aspect stems from the relative age compared to the progress of technological innovations on the market, which may affect the profitability of the project (e.g. increased efficiency and higher energy production are some of the key benefits of new turbine technologies, which may affect the return on investment – ROI – of a wind farm [27].
According to Woo et al. [28], at the end of a wind farm’s life, operators must decide whether to maximize the return on investment through lifetime extension and repowering, or to decommission the farm. The following scenarios are assumed:
Lifetime extension means extending the operation of a wind farm beyond the period specified in applicable agreements. To extend its life, turbines must have sufficient remaining service life without compromising safety. Their suitability for continued operation will be determined by technical assessments, including analysis of environmental conditions (e.g., wind speed) and operating conditions at a given location [29].
Turbine serviceability is an important consideration, but decisions about life extension are also based on economic factors. In this case, key components can be replaced or remanufactured to ensure reliability and optimal operation. Operators can develop life extension strategies based on component analysis, inspection requirements, and recommendations [28], supported by decision support tools [30,31,32].
Repowering involves replacing old turbines with new, more efficient technologies, it may also involve improving the electrical interconnection system to increase the stability of the power system. Repowering may be partial, involving the replacement of specific components to extend the unit’s lifespan and/or increase its power output. Partial repowering is a relatively new solution and often involves the use of larger rotors [28]. There is no clear definition of partial repowering, some authors refer to it as “revamping” [33].
Full repowering, on the other hand, means completely replacing the turbines—often with larger and more efficient models. Although repowering as an end-of-life option can reduce operating and maintenance costs by reducing turbine failure rates, it also requires economic justification [34].
In most cases, repowering requires obtaining new administrative approvals [35]. These processes are often similar to those for new projects in terms of the scope of required documentation.
Decommissioning involves removing the turbines and foundations and restoring the site to a condition close to its original condition. Full decommissioning is usually subject to appropriate legal arrangements. In some circumstances, decommissioning may be unavoidable, for example, due to changes in land use [36]. However, decommissioning is usually viewed as a last resort, less desirable than life extension or repowering.
However, each of these decisions is associated with the generation of worn turbine components that need to be recycled [27,37].
Making decisions regarding operational strategy requires analyses that clearly demonstrate the validity of the changes [28]. The decision-making process regarding repowering or extending the turbine’s life depends largely on identifying potential benefits. One of the factors may be estimating the difference between the energy produced by the currently operating turbine and the planned new unit. Having a mathematical model of the new turbine’s energy production allows for the identification of benefits for the investor.
Physical wear of the turbine is also important in the operational strategy. During the operation of a wind turbine, the blade coatings deteriorate and resistance increases. Changes in this resistance cause changes in the turbine’s power curve. The resulting models can also be used to analyze turbine blade wear. Blade damage can also increase harmful noise and vibration levels [38,39,40].
The overall goal of this research is to develop a method for forecasting and determining a rational operational strategy for wind turbines using mathematical models, including statistical and numerical tools, and artificial intelligence. The purpose of this paper is to present the results of research on the degree of fit between theoretical random variable distributions and actual data, and the feasibility of applying these results to develop a mathematical model that will facilitate the forecasting of electricity production depending on average wind speed. The research results presented in this paper were developed based on operational data obtained from SCADA software for the Starorypin wind farm [18].
2. Materials and Methods
2.1. Object of Analysis
The study was conducted at the Starorypin wind farm. It consists of three wind turbines. Characteristic turbine data are presented in Table 1. The farm is located in Poland and has geographic coordinates N53.084477, E19.440905 (Figure 4).
As part of the study, historical data were acquired and statistically analyzed. The main goal of the study was to develop regression models for wind conditions and electricity production. These models are intended to determine the average weekly amount of electricity produced by wind turbines depending on the average weekly wind speed. The established models were based on historical values obtained from the SCADA system. Therefore, they are appropriate for the analyzed wind turbines. This is due to the lack of analysis of other factors that may depend on the wind turbine location. Such factors include terrain roughness, daytime temperature, and other confounding factors [41,42].
As part of the analysis, three linear regression models were developed. The impact of average weekly wind speed on the amount of energy produced was analyzed. The analysis was conducted for the entire year 2024. The analysis was performed for three facilities: WT1, WT2, and WT3.
The regression models were developed based on operational data obtained from the SCADA system. The actual data included the average weekly wind speed [m/s] and average weekly electricity production [kWh] during the considered time period. Wind speed is measured by a sensor located on the wind turbine nacelle.
The analysis was based on data obtained from the SCADA system. A linear regression model was developed. This model determines the relationship between the average weekly amount of electricity produced (Em) and the average weekly wind speed (Vm). Treating wind as the explanatory variable and energy as the dependent variable, a regression model was constructed using the classical least squares method.
3. Results and discussion
As part of the study, regression models were developed for the WT1, WT2, and WT3 wind turbines tested. Daily wind and electricity production data for the year 2024 were analyzed. Table 2, Table 3 and Table 4 present the statistics of the developed regression model.
A script was created in the MASS Python package to generate two types of graphs:
1. A graph of wind speed (Wind) and electricity (Energy) for consecutive weeks in 2024, (Figure 5, Figure 7 and Figure 9)
2. A scatterplot of points (Wind - Energy) including the regression model line, (Figure 6, Figure 8 and Figure 10).
The first graph added a line of values for consecutive weeks resulting from the regression model. Due to the large disparity between wind speed (Wind) and electricity (Energy) values and the model values, the graph was equipped with two vertical axes: the left one for energy and model values, and the right one for wind speed.
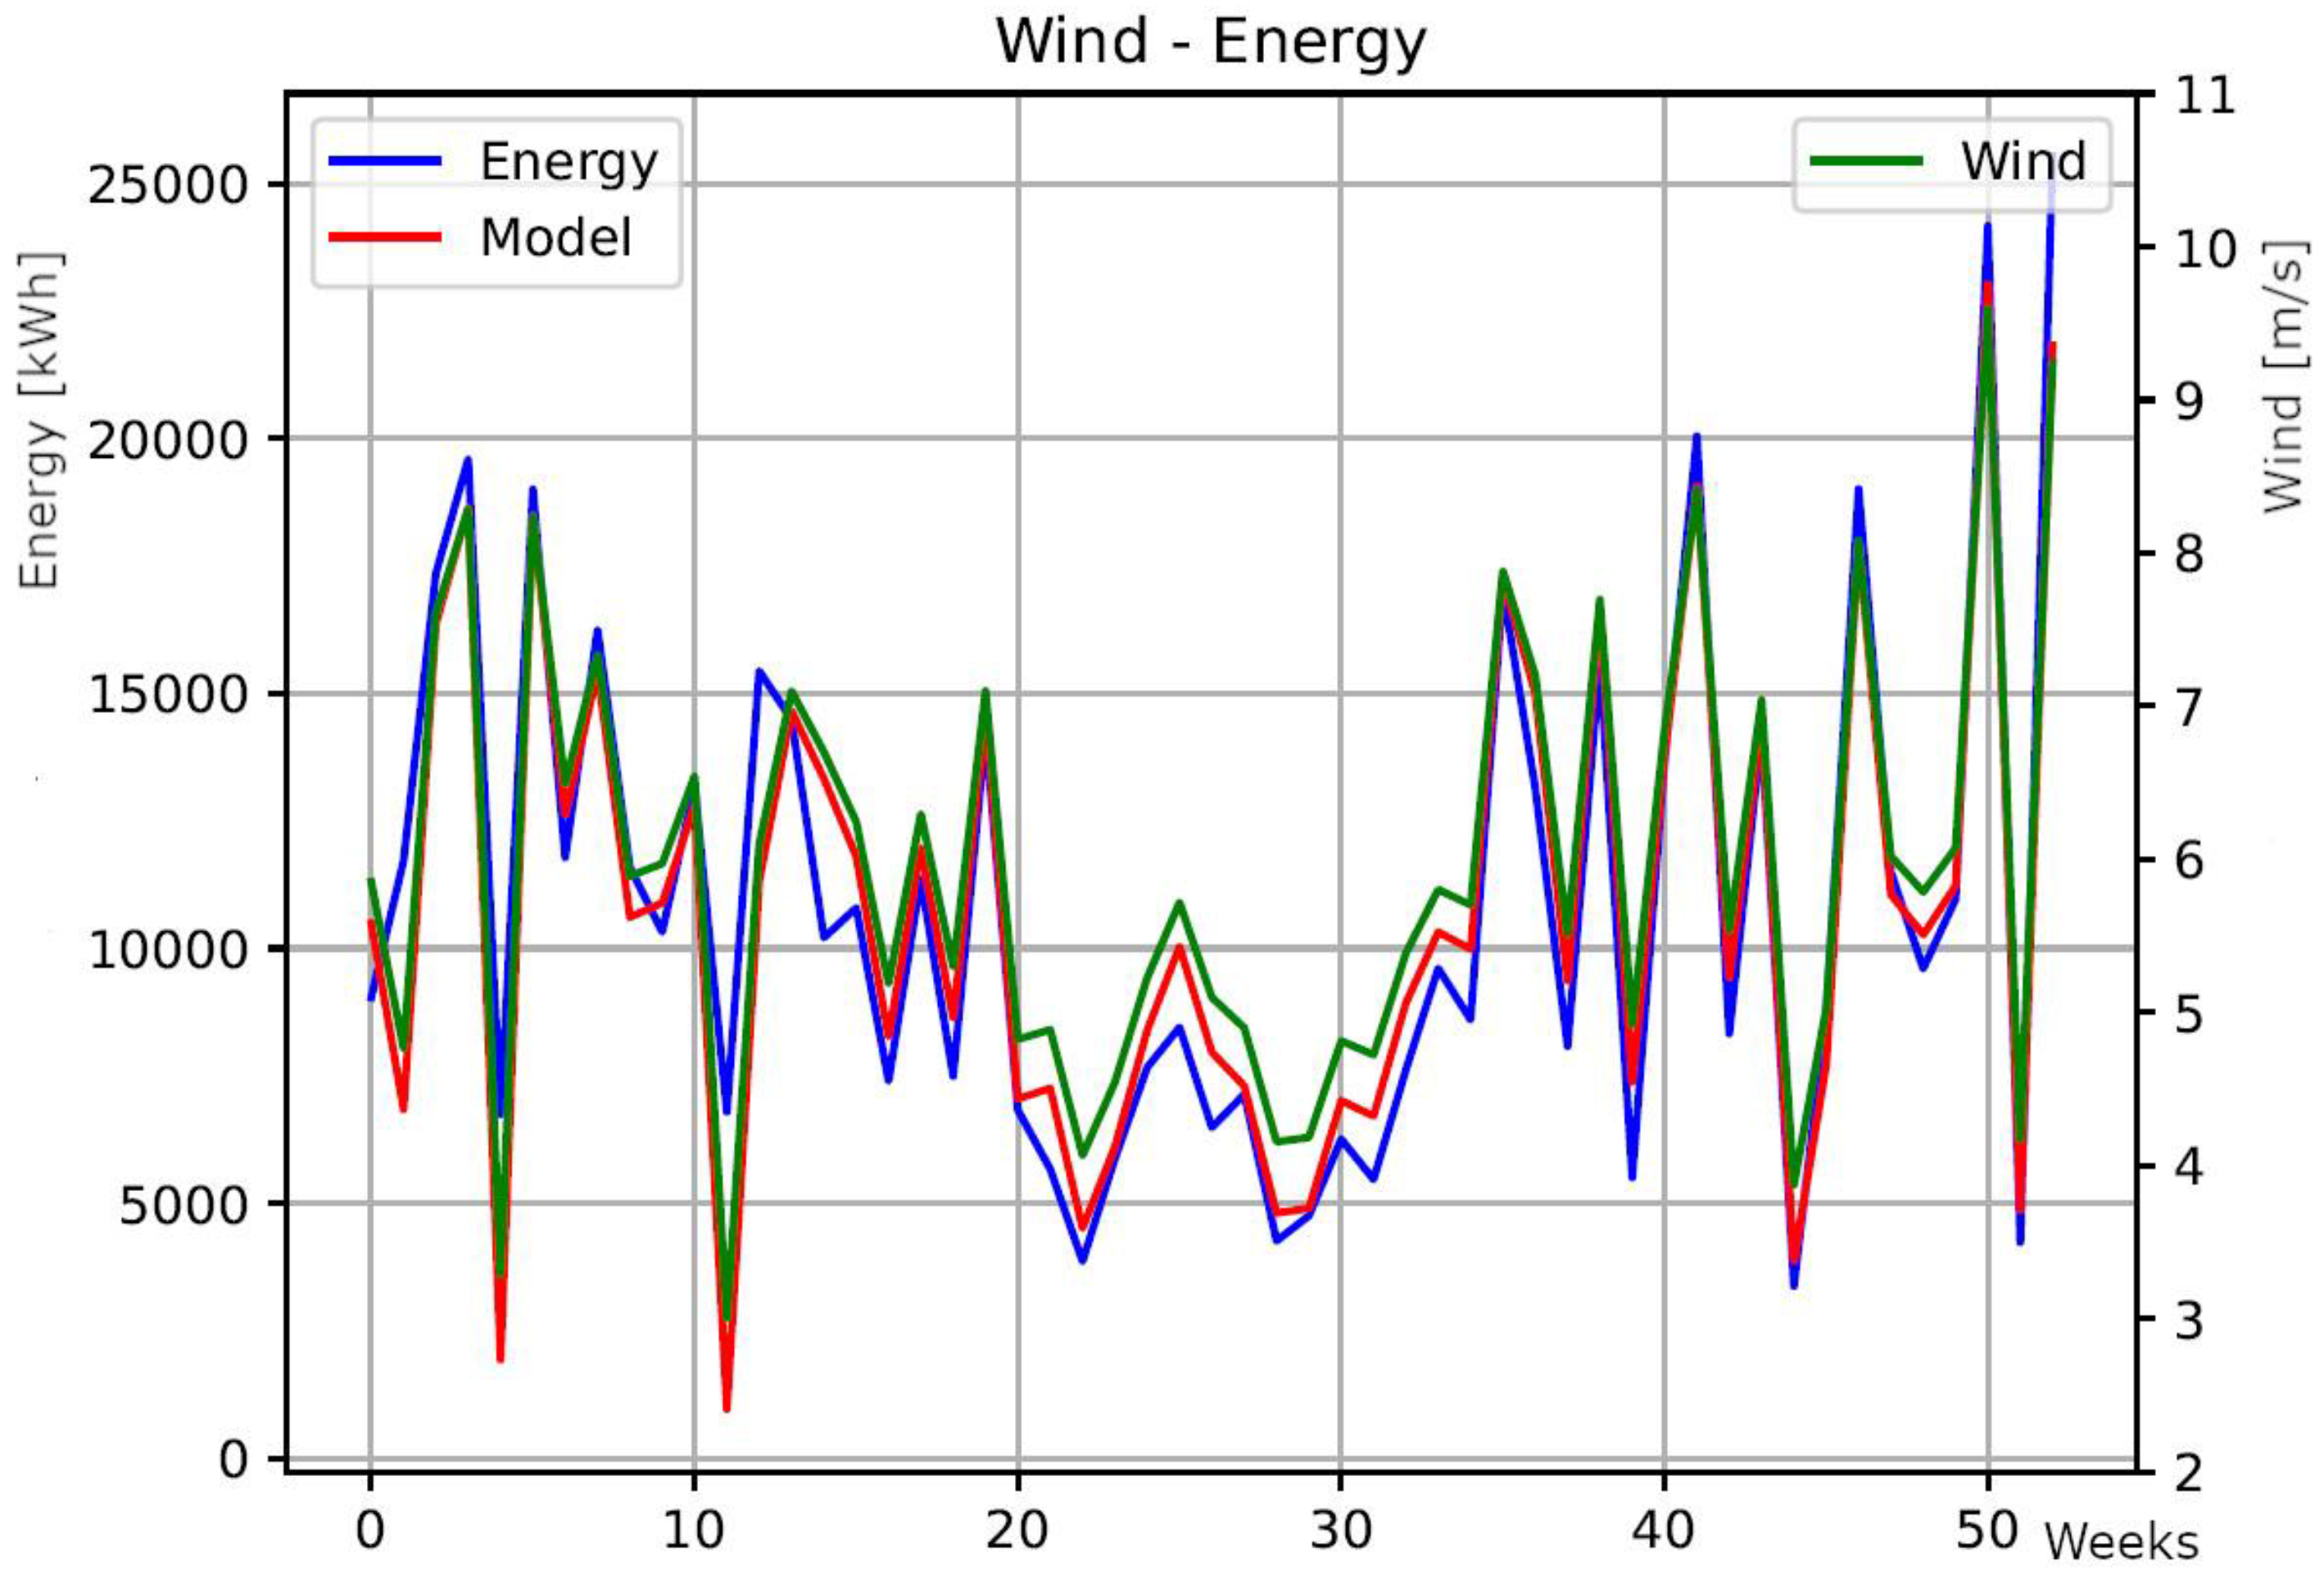
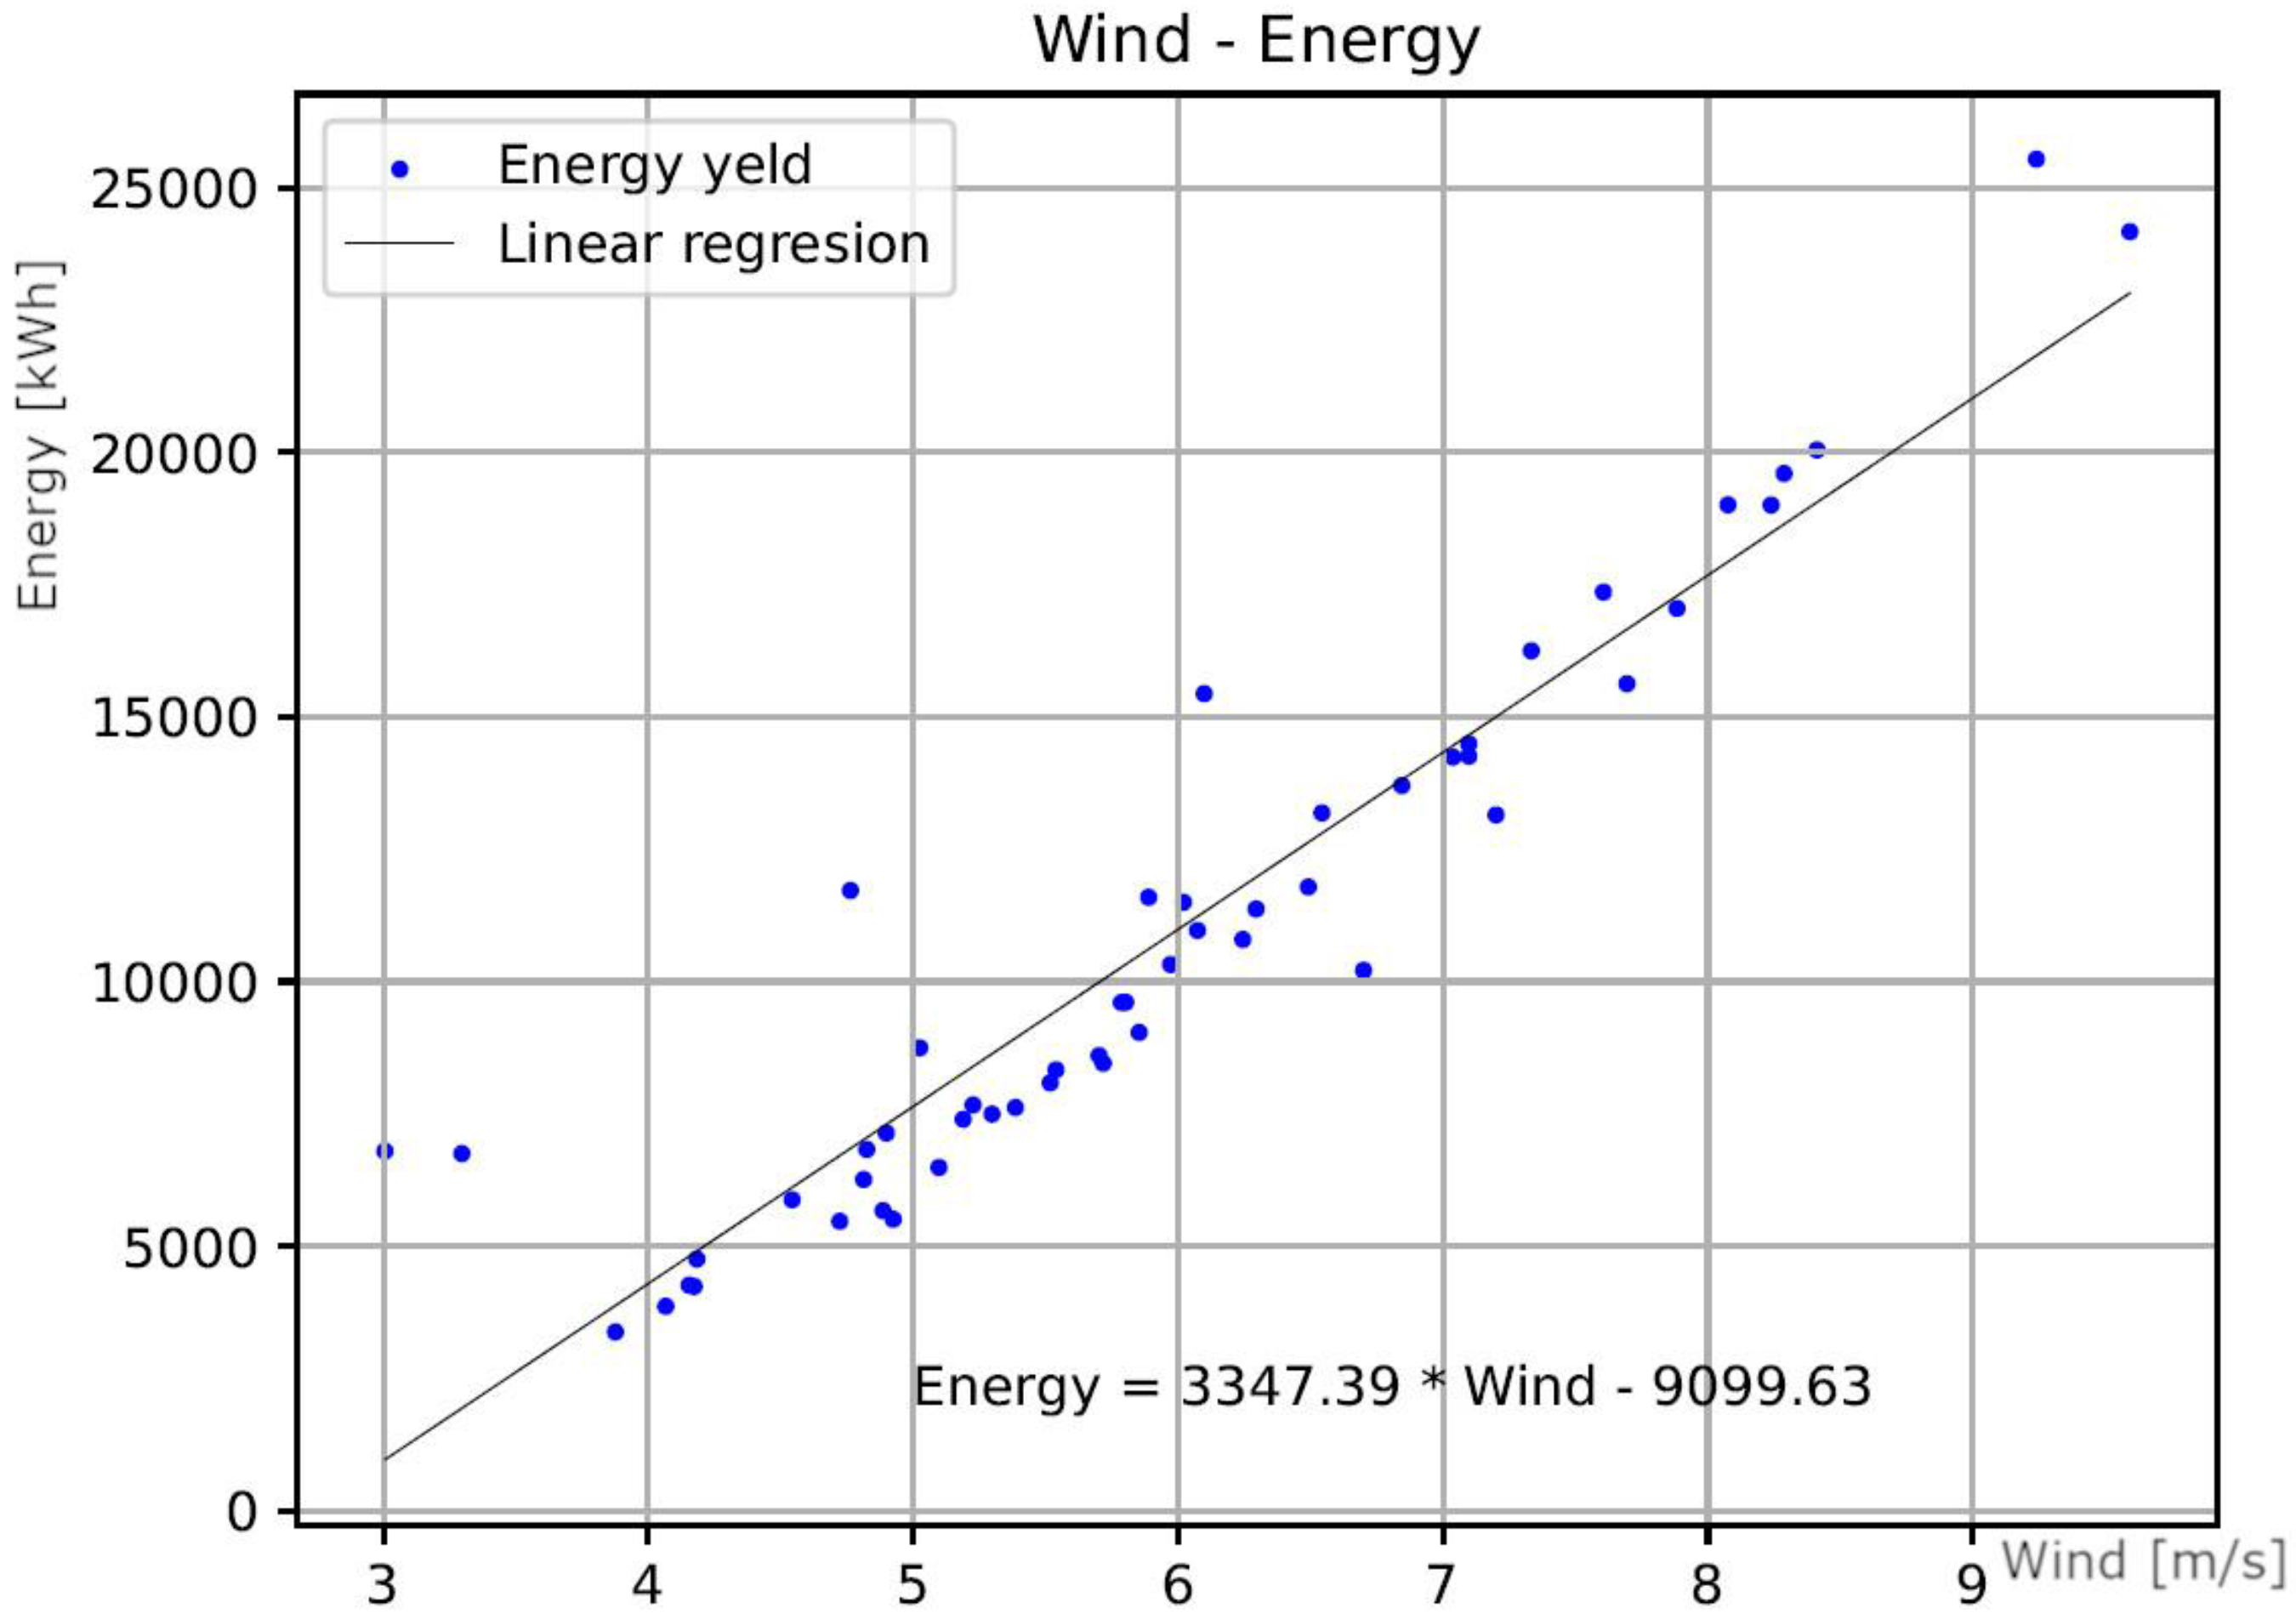
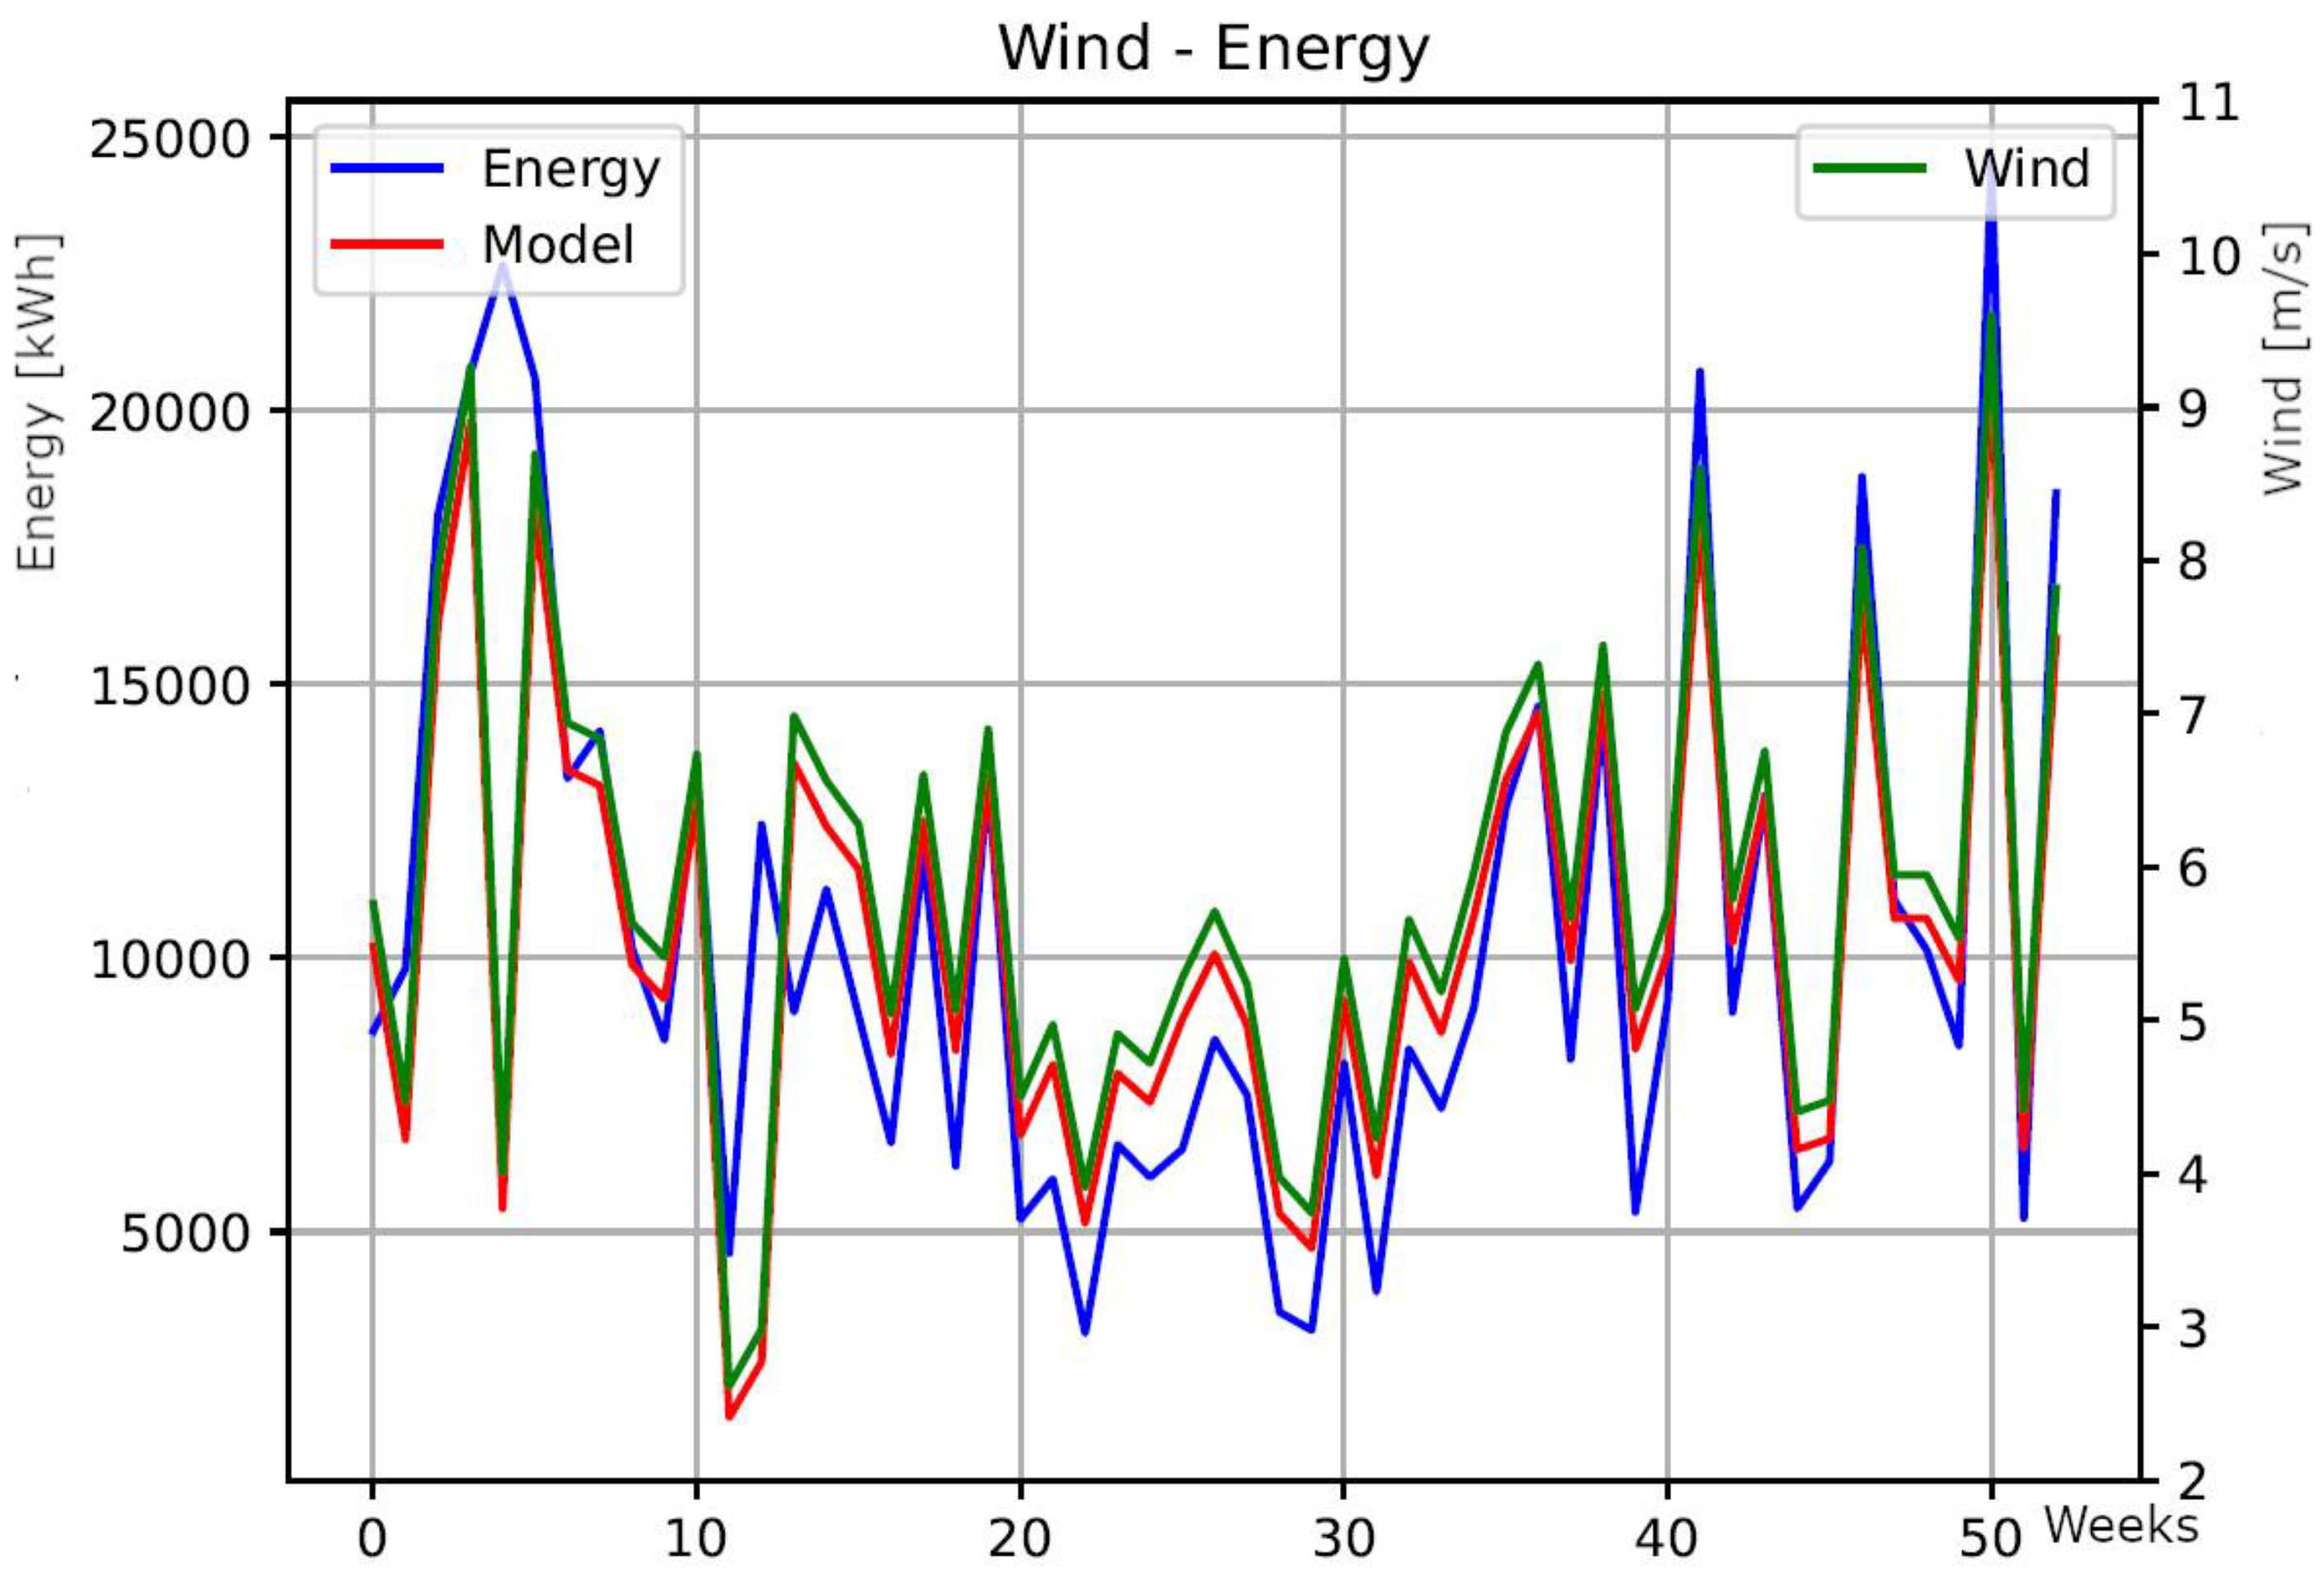
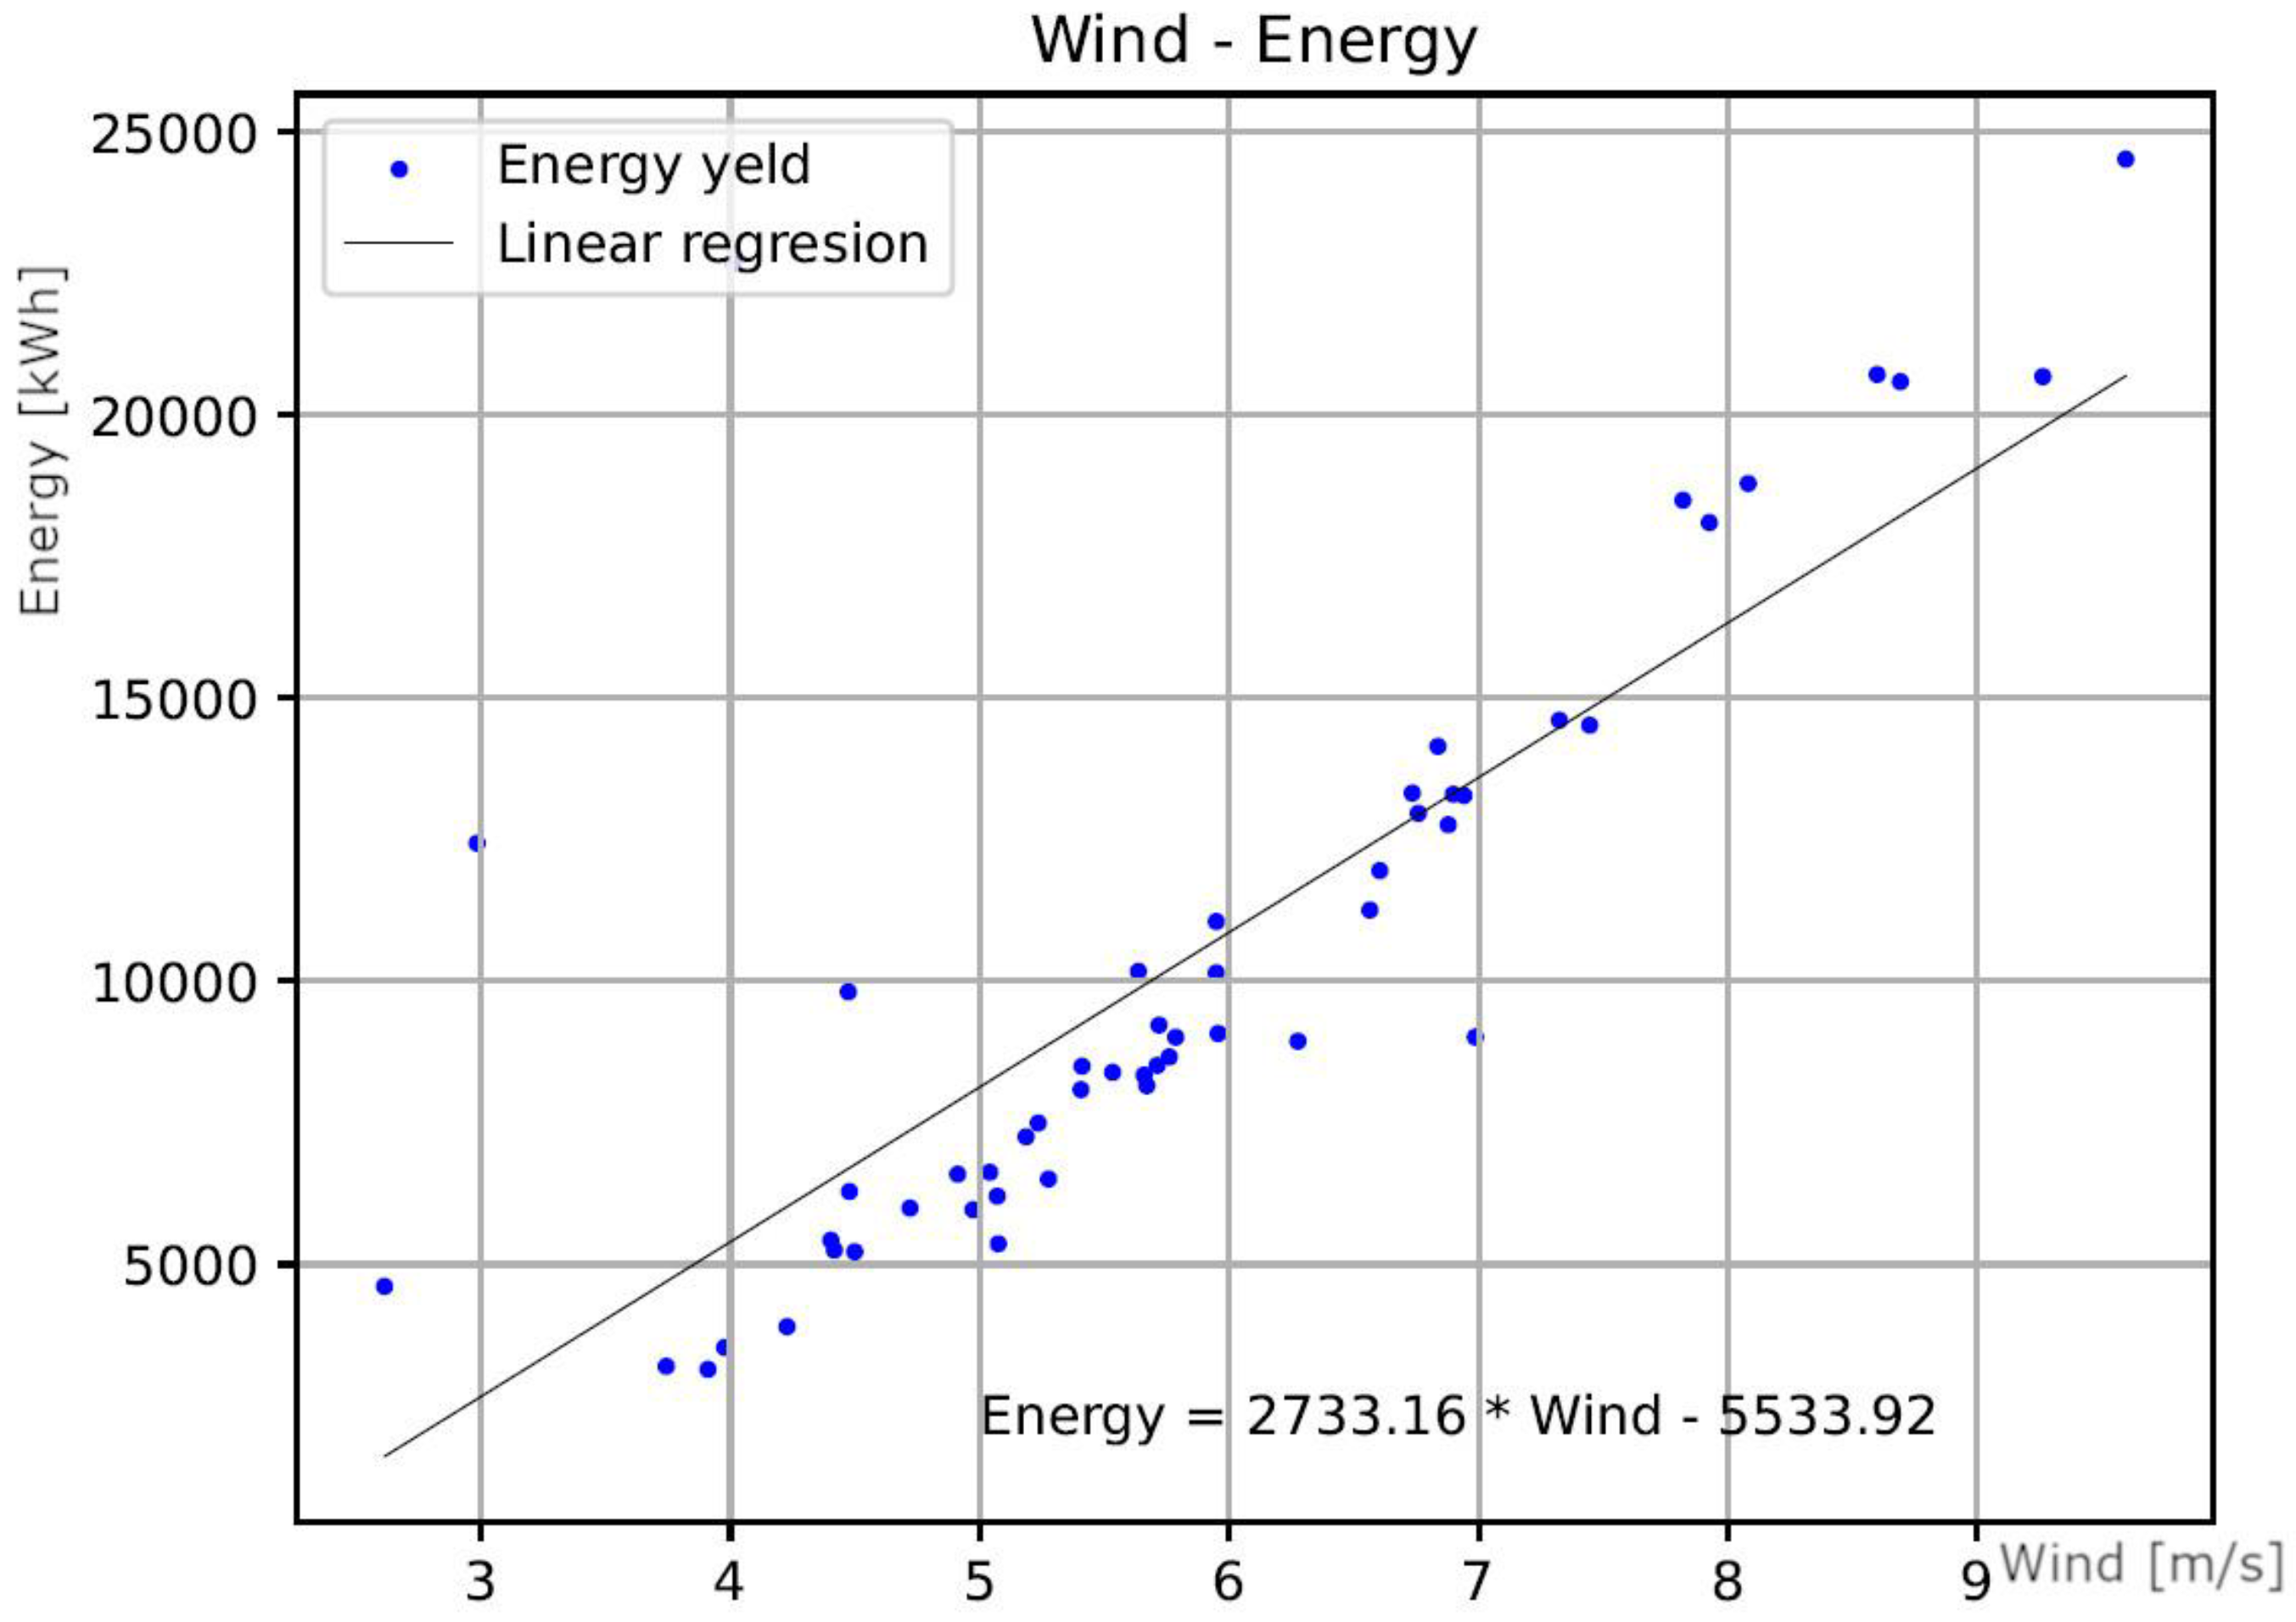
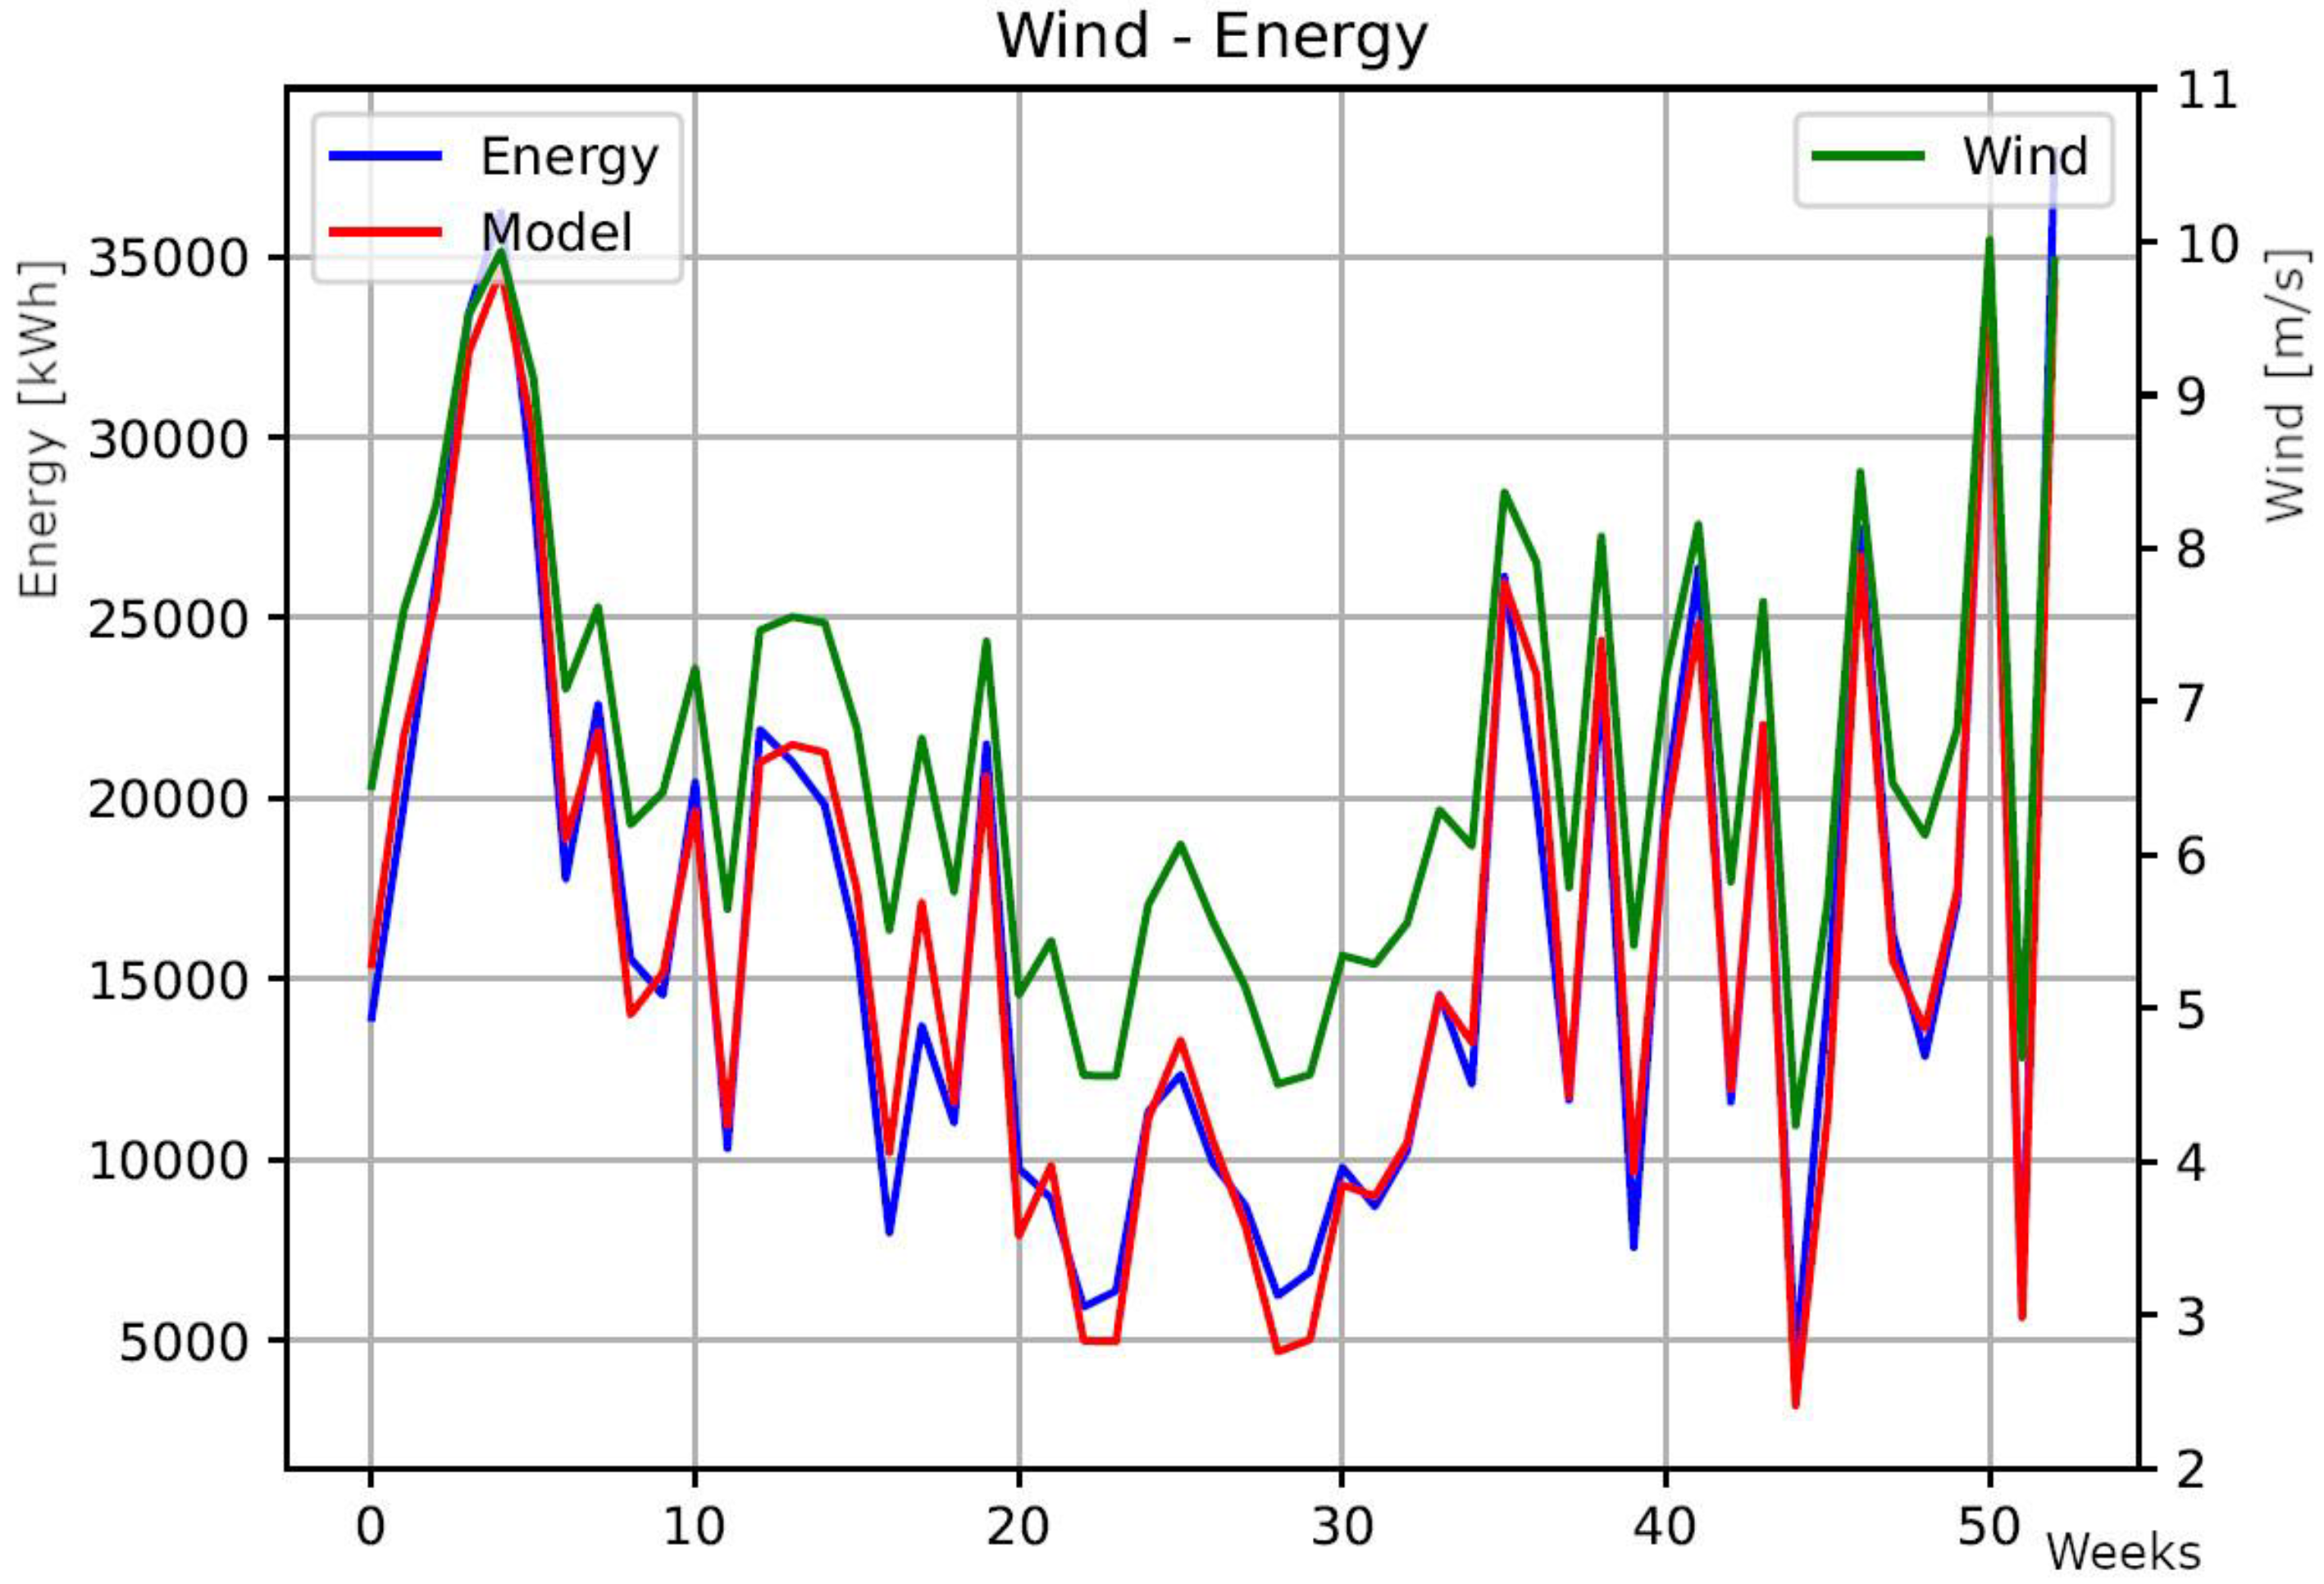
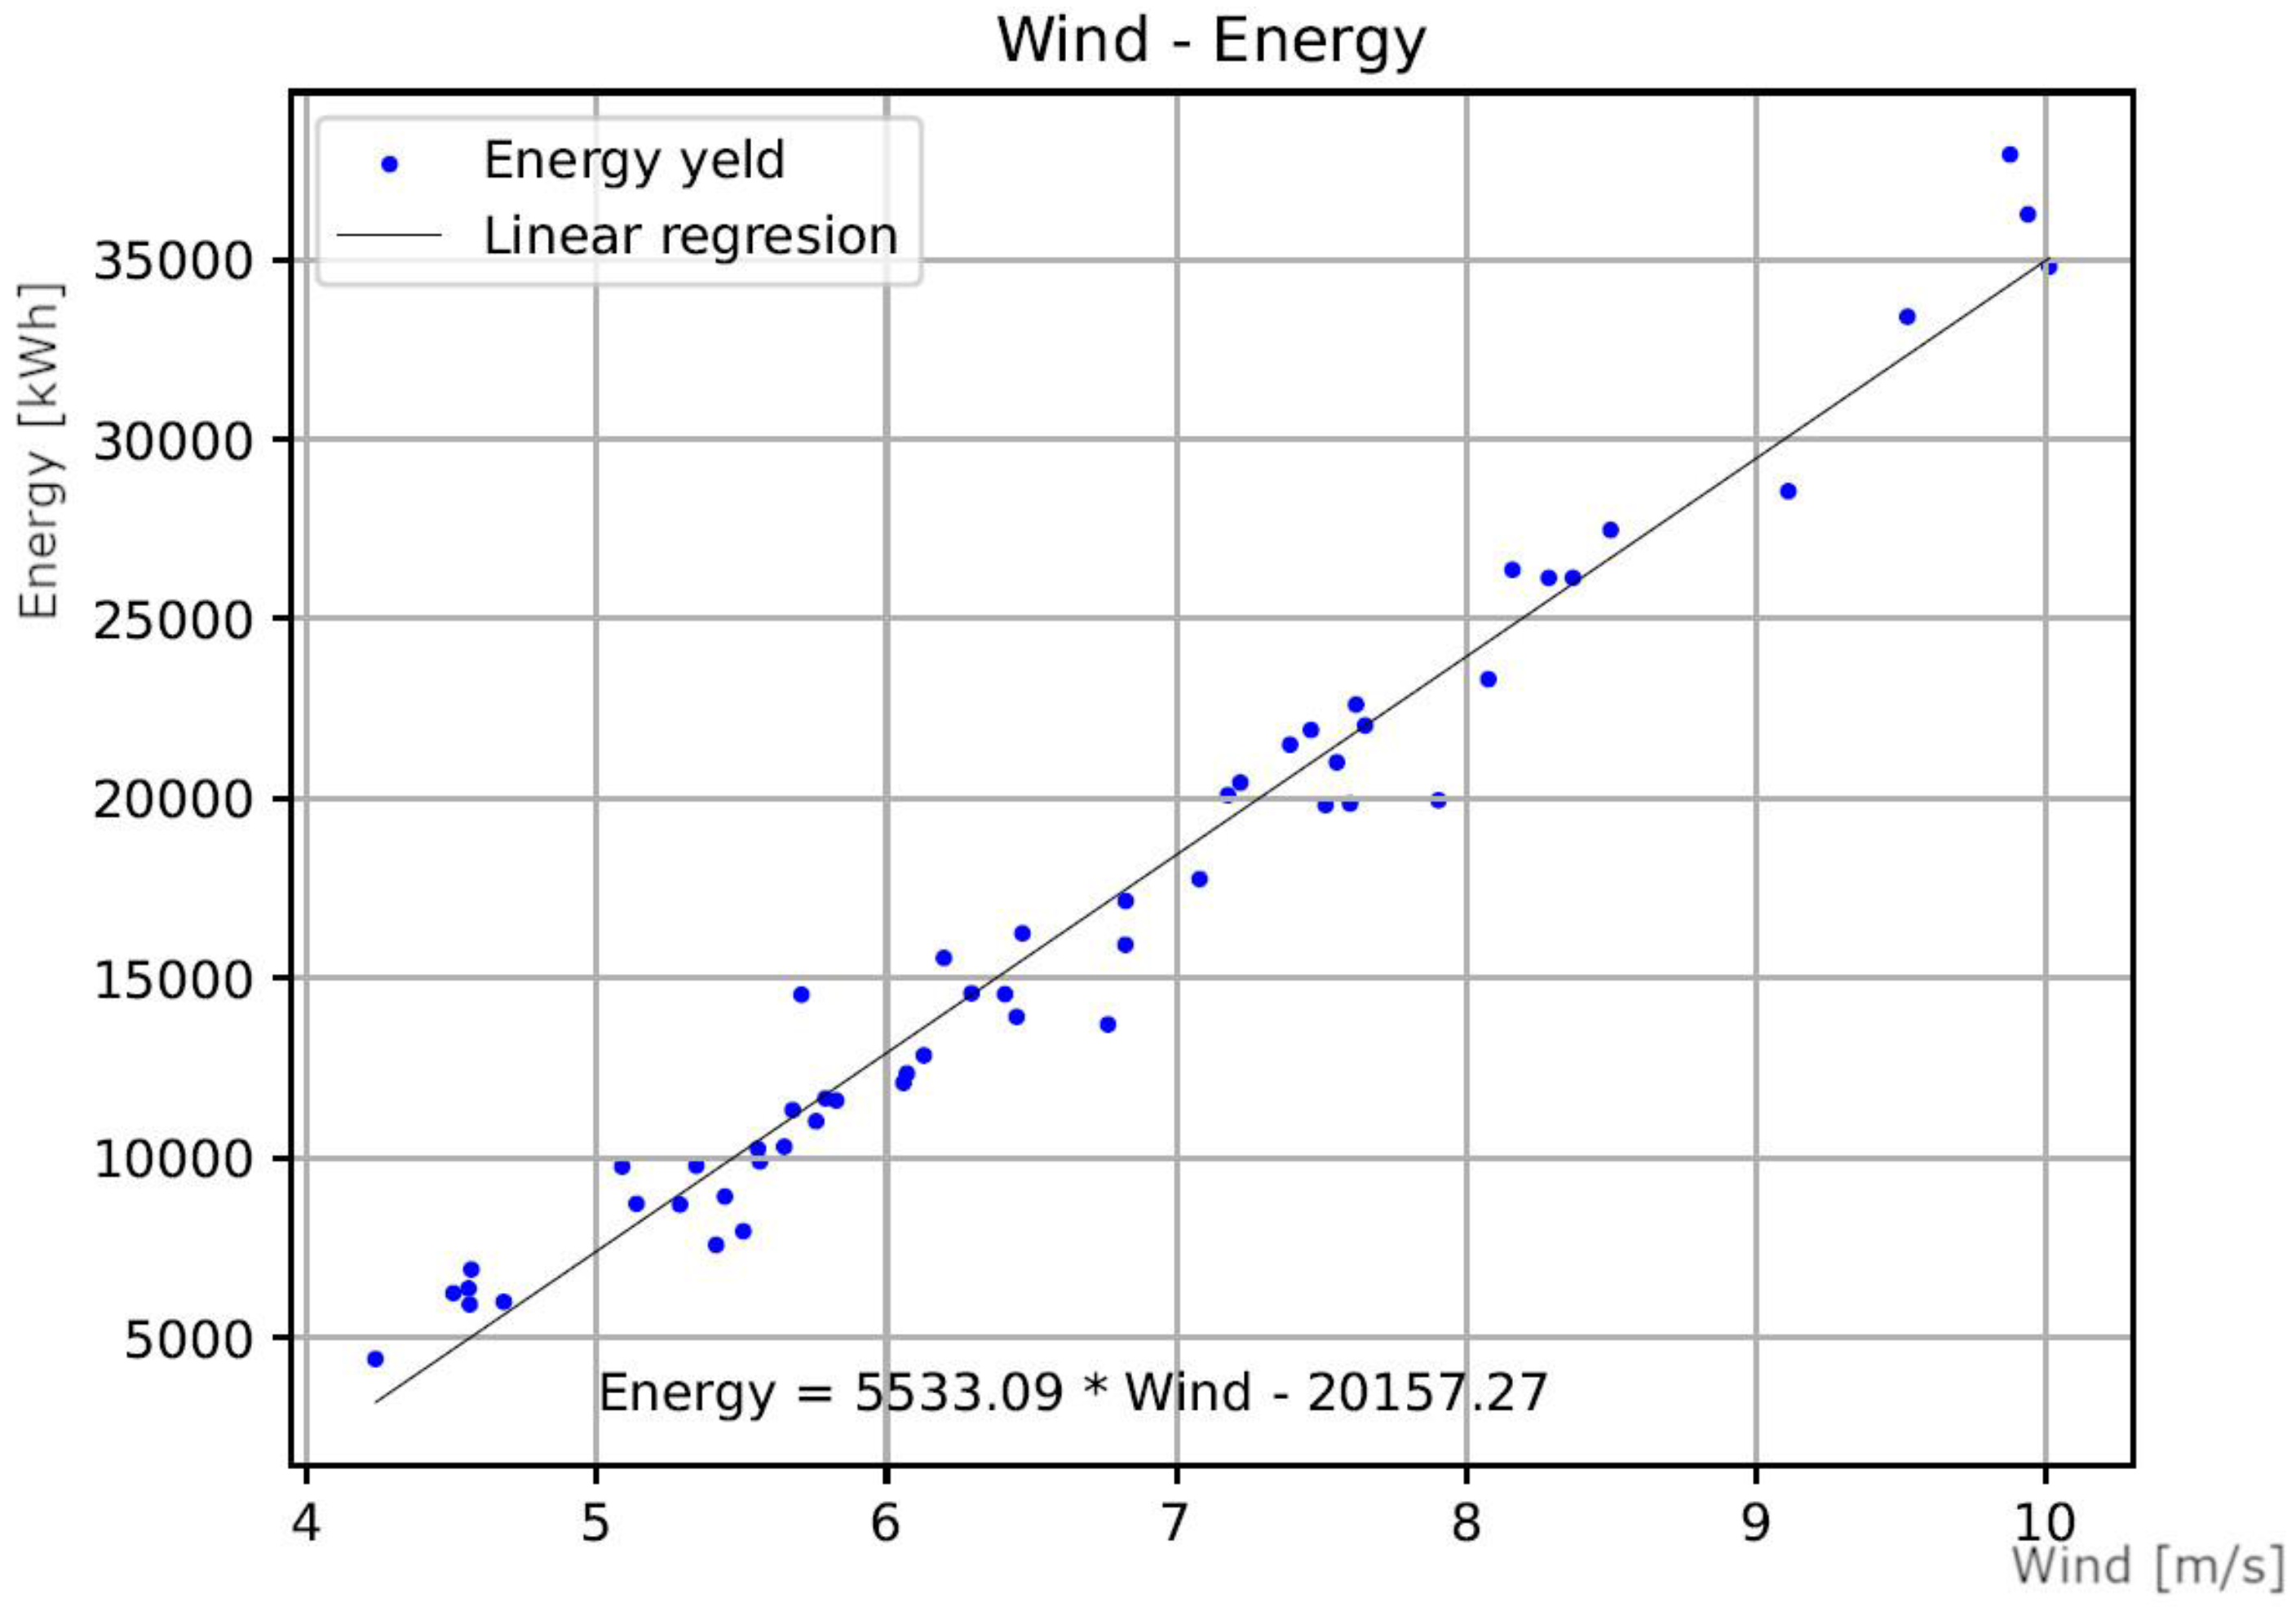
Figure 5.
Average weekly energy [kWh] generated by the WT1 in the following weeks of 2024 determined on the basis of real data (SCADA) and for the linear regression model.
Figure 5.
Average weekly energy [kWh] generated by the WT1 in the following weeks of 2024 determined on the basis of real data (SCADA) and for the linear regression model.
Figure 6.
Wind–Energy Scatter Plot with Regression Line for WT1.
Figure 7.
Average weekly energy [kWh] generated by the WT2 in the following weeks of 2024 determined on the basis of real data (SCADA) and for the linear regression model.
Figure 7.
Average weekly energy [kWh] generated by the WT2 in the following weeks of 2024 determined on the basis of real data (SCADA) and for the linear regression model.
Figure 8.
Wind–Energy Scatter Plot with Regression Line for WT2.
Figure 9.
Average weekly energy [kWh] generated by the WT3 in the following weeks of 2024 determined on the basis of real data (SCADA) and for the linear regression model.
Figure 9.
Average weekly energy [kWh] generated by the WT3 in the following weeks of 2024 determined on the basis of real data (SCADA) and for the linear regression model.
Figure 10.
Wind–Energy Scatter Plot with Regression Line for WT3.
To use historical data for inference and forecasting electricity production, we analyzed the fit of actual data obtained from the WT1, WT2, and WT3 wind turbine tests to theoretical distributions of a random variable. Goodness-of-fit tests were performed for four selected theoretical distributions: exponential, normal, lognormal, and Weibull. For the Wind variable (wind speed) containing average wind values for consecutive weeks in 2024, and for the Energy variable (electricity) containing average energy values for consecutive weeks in 2024, parameters for the selected statistical distributions were calculated and graphs were created containing:
1. a data histogram,
2. empirical density (black line),
3. theoretical density with estimated distribution parameters (red line).
Calculations, research results, and their graphical visualization were performed in the R environment [43] and using the MASS package in Python (distribution parameters, Kolmogorov-Smirnov test value and p-value). The best fit of the actual distributions of the analyzed variables to the selected theoretical distributions was determined based on the Kolmogorov-Smirnov test value and p-value.
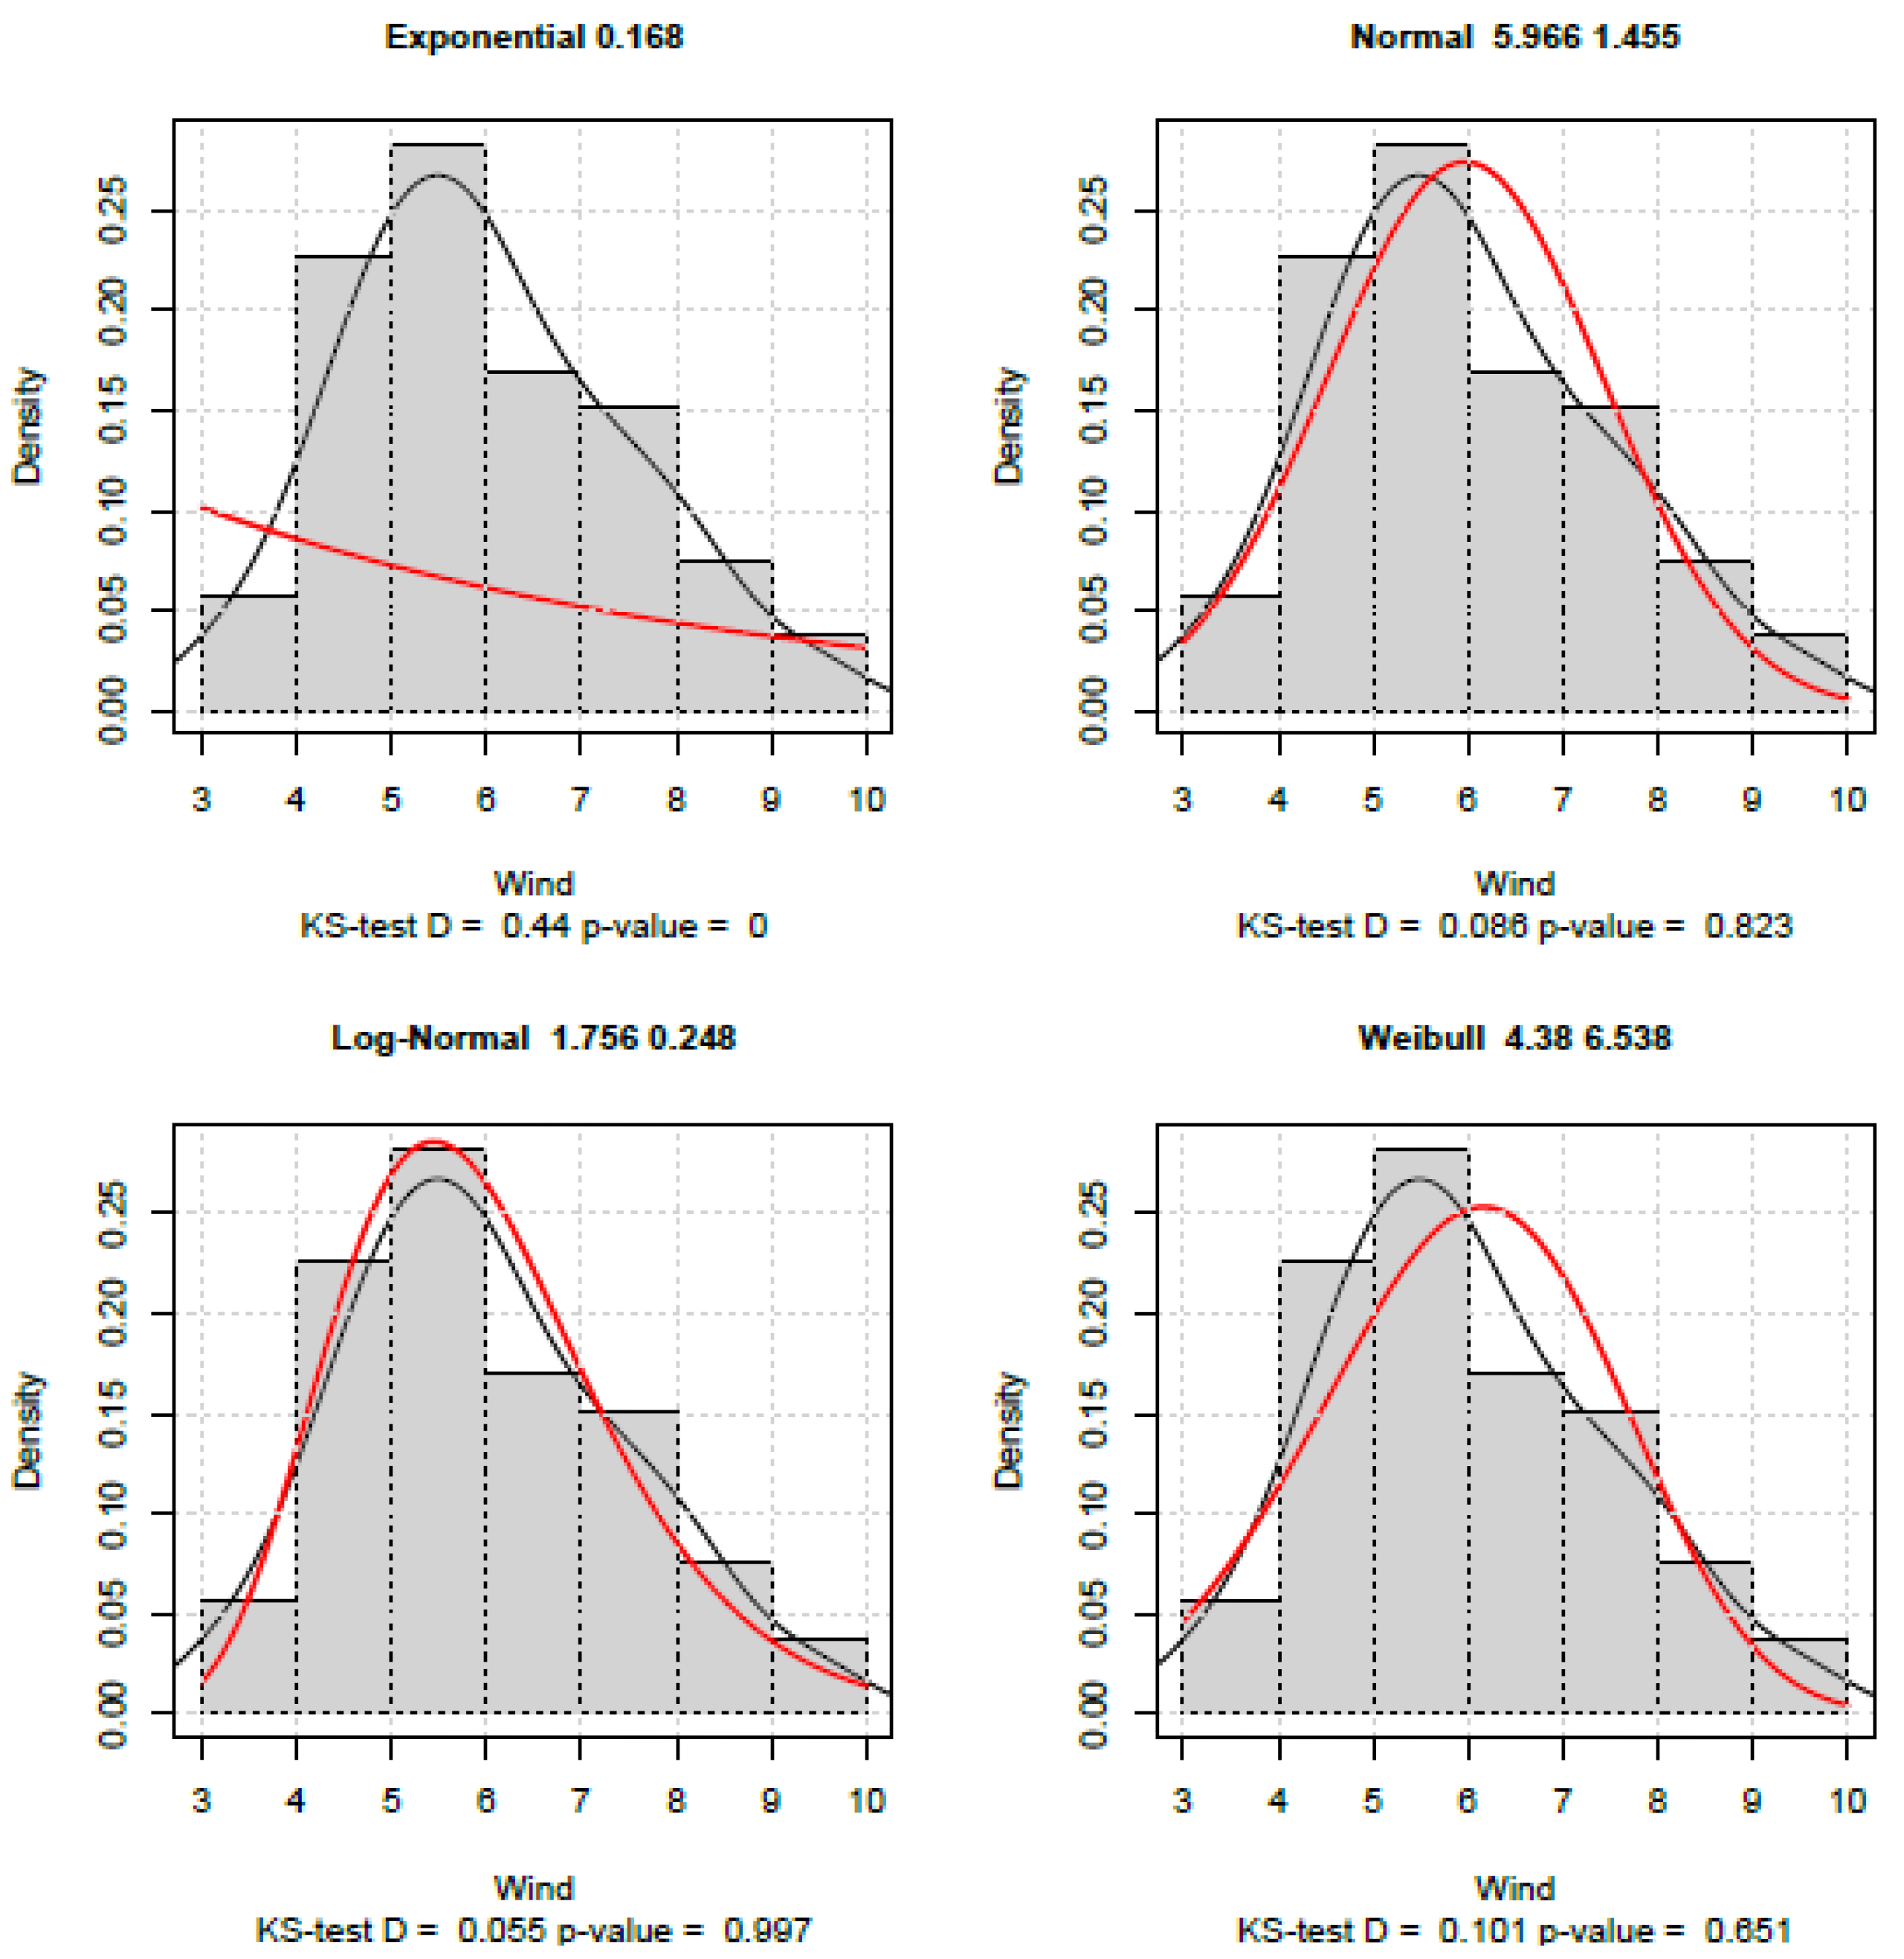
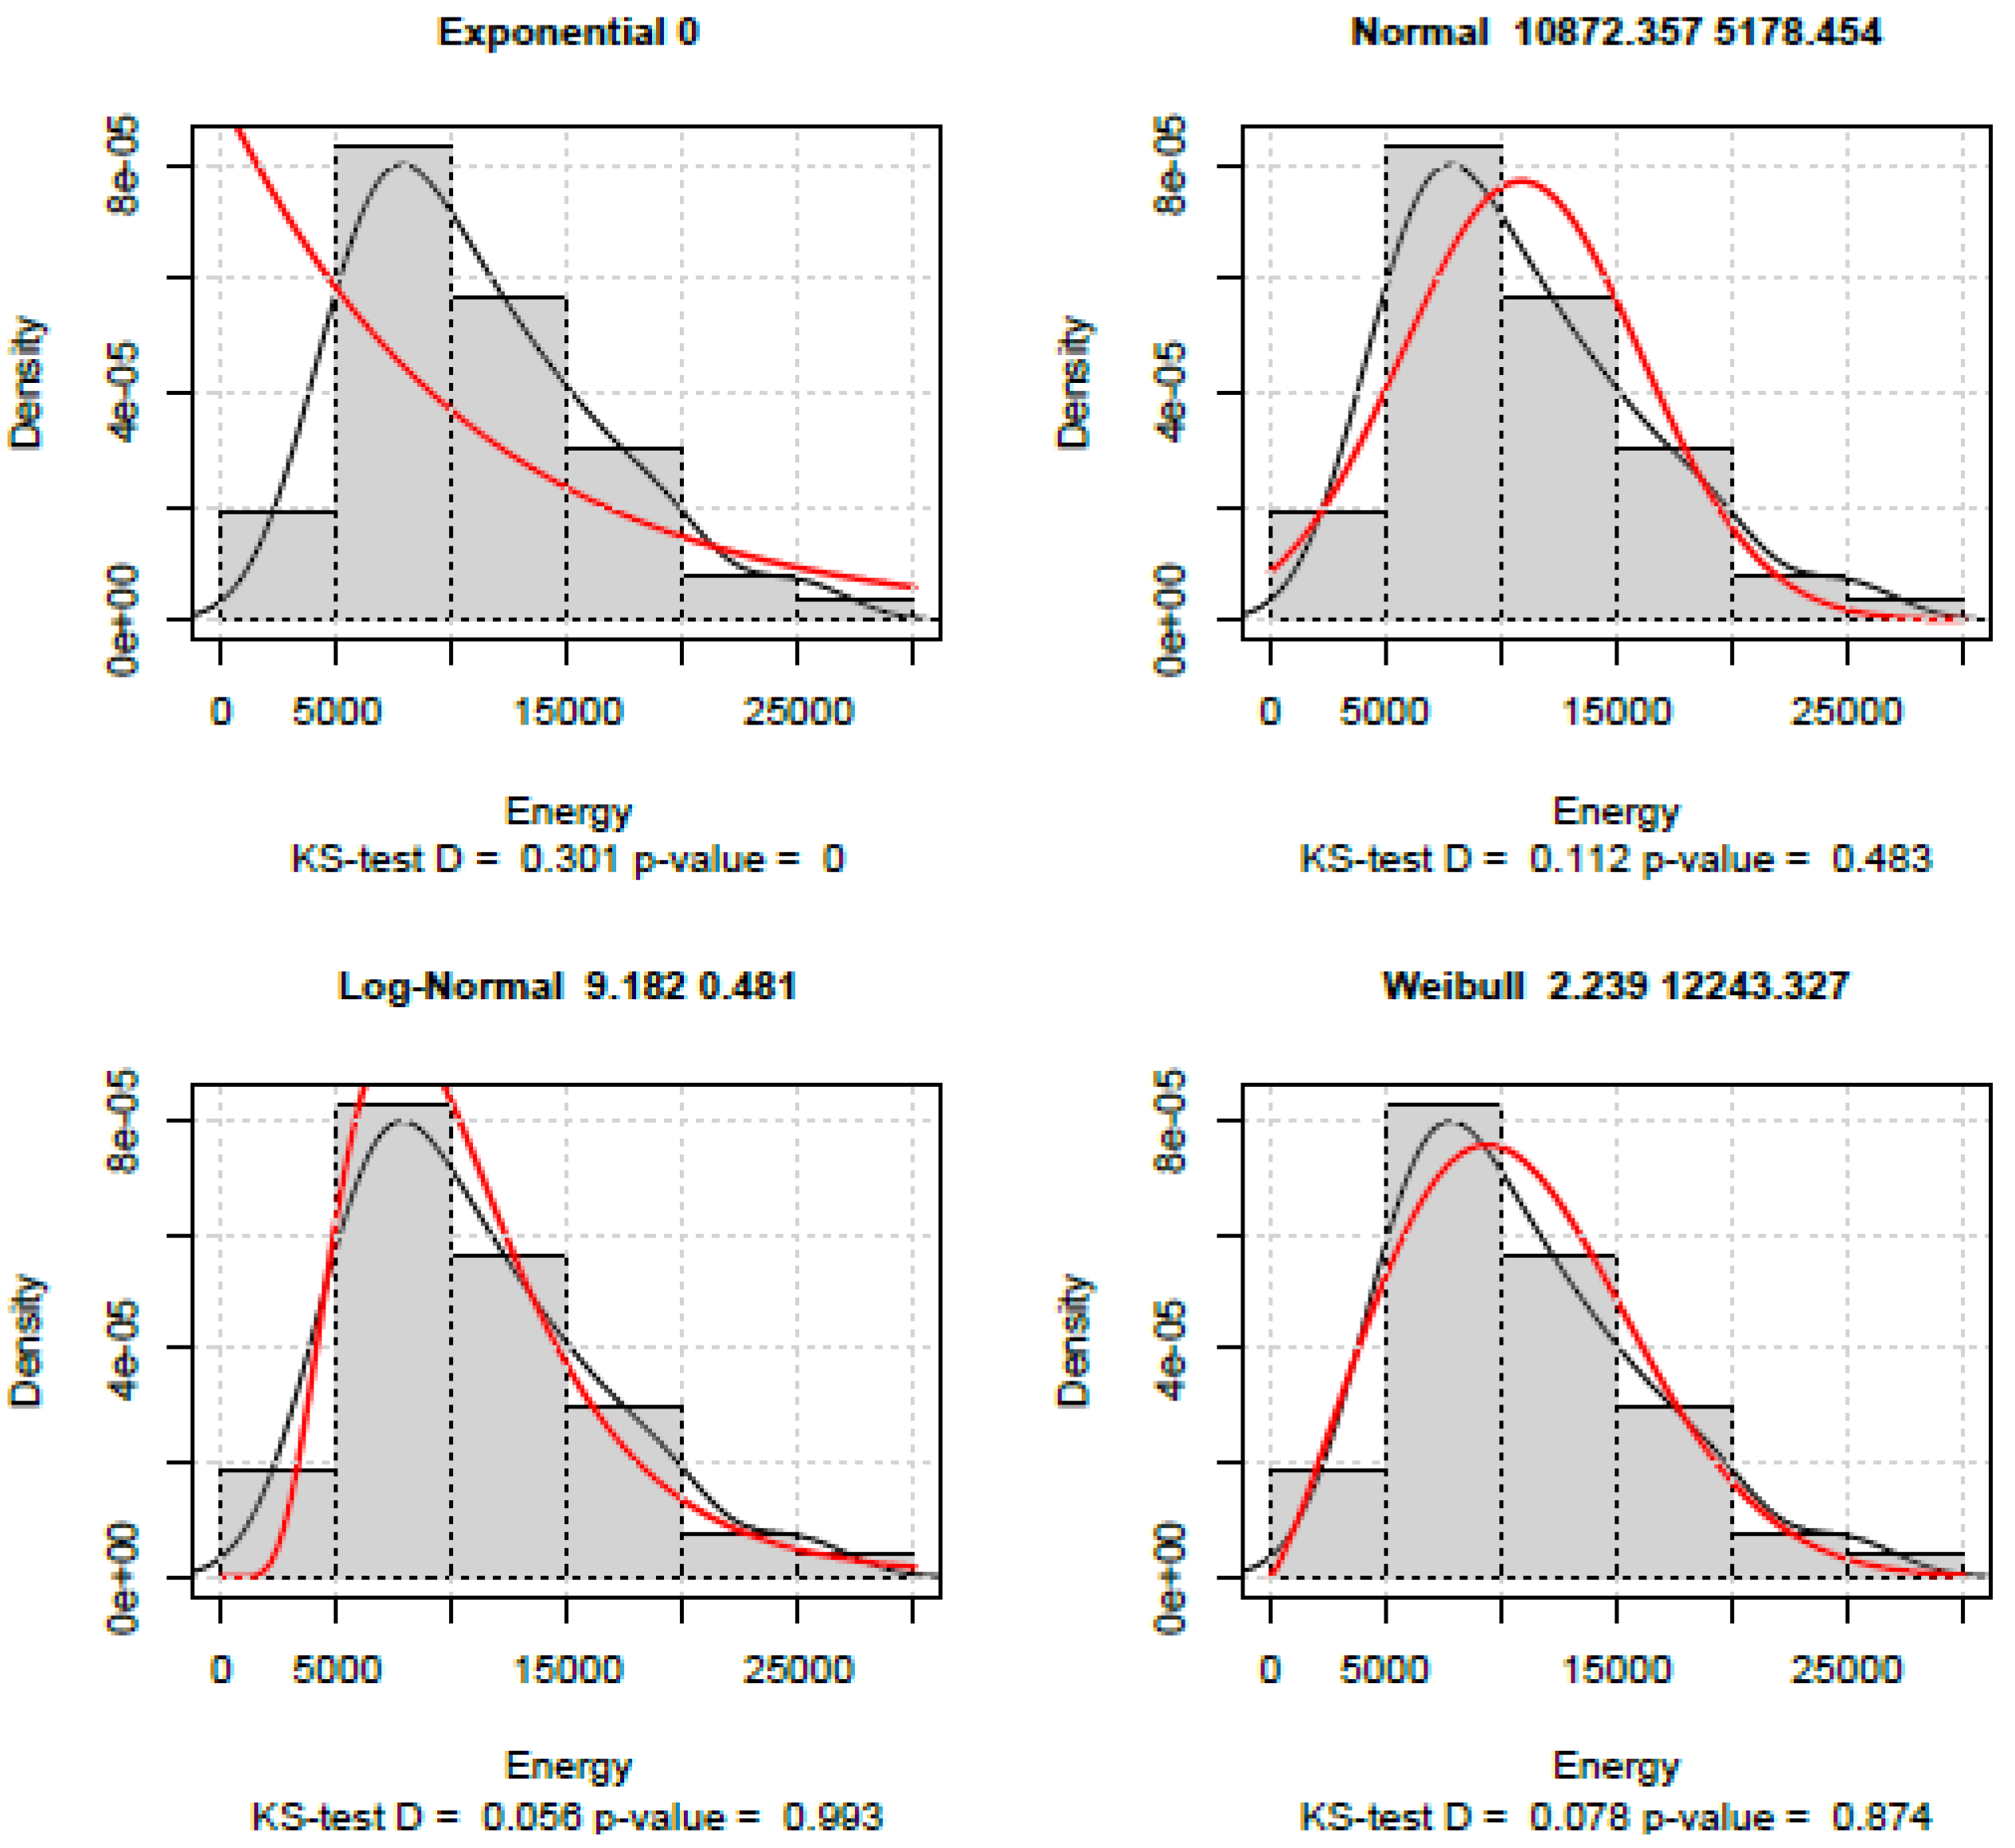
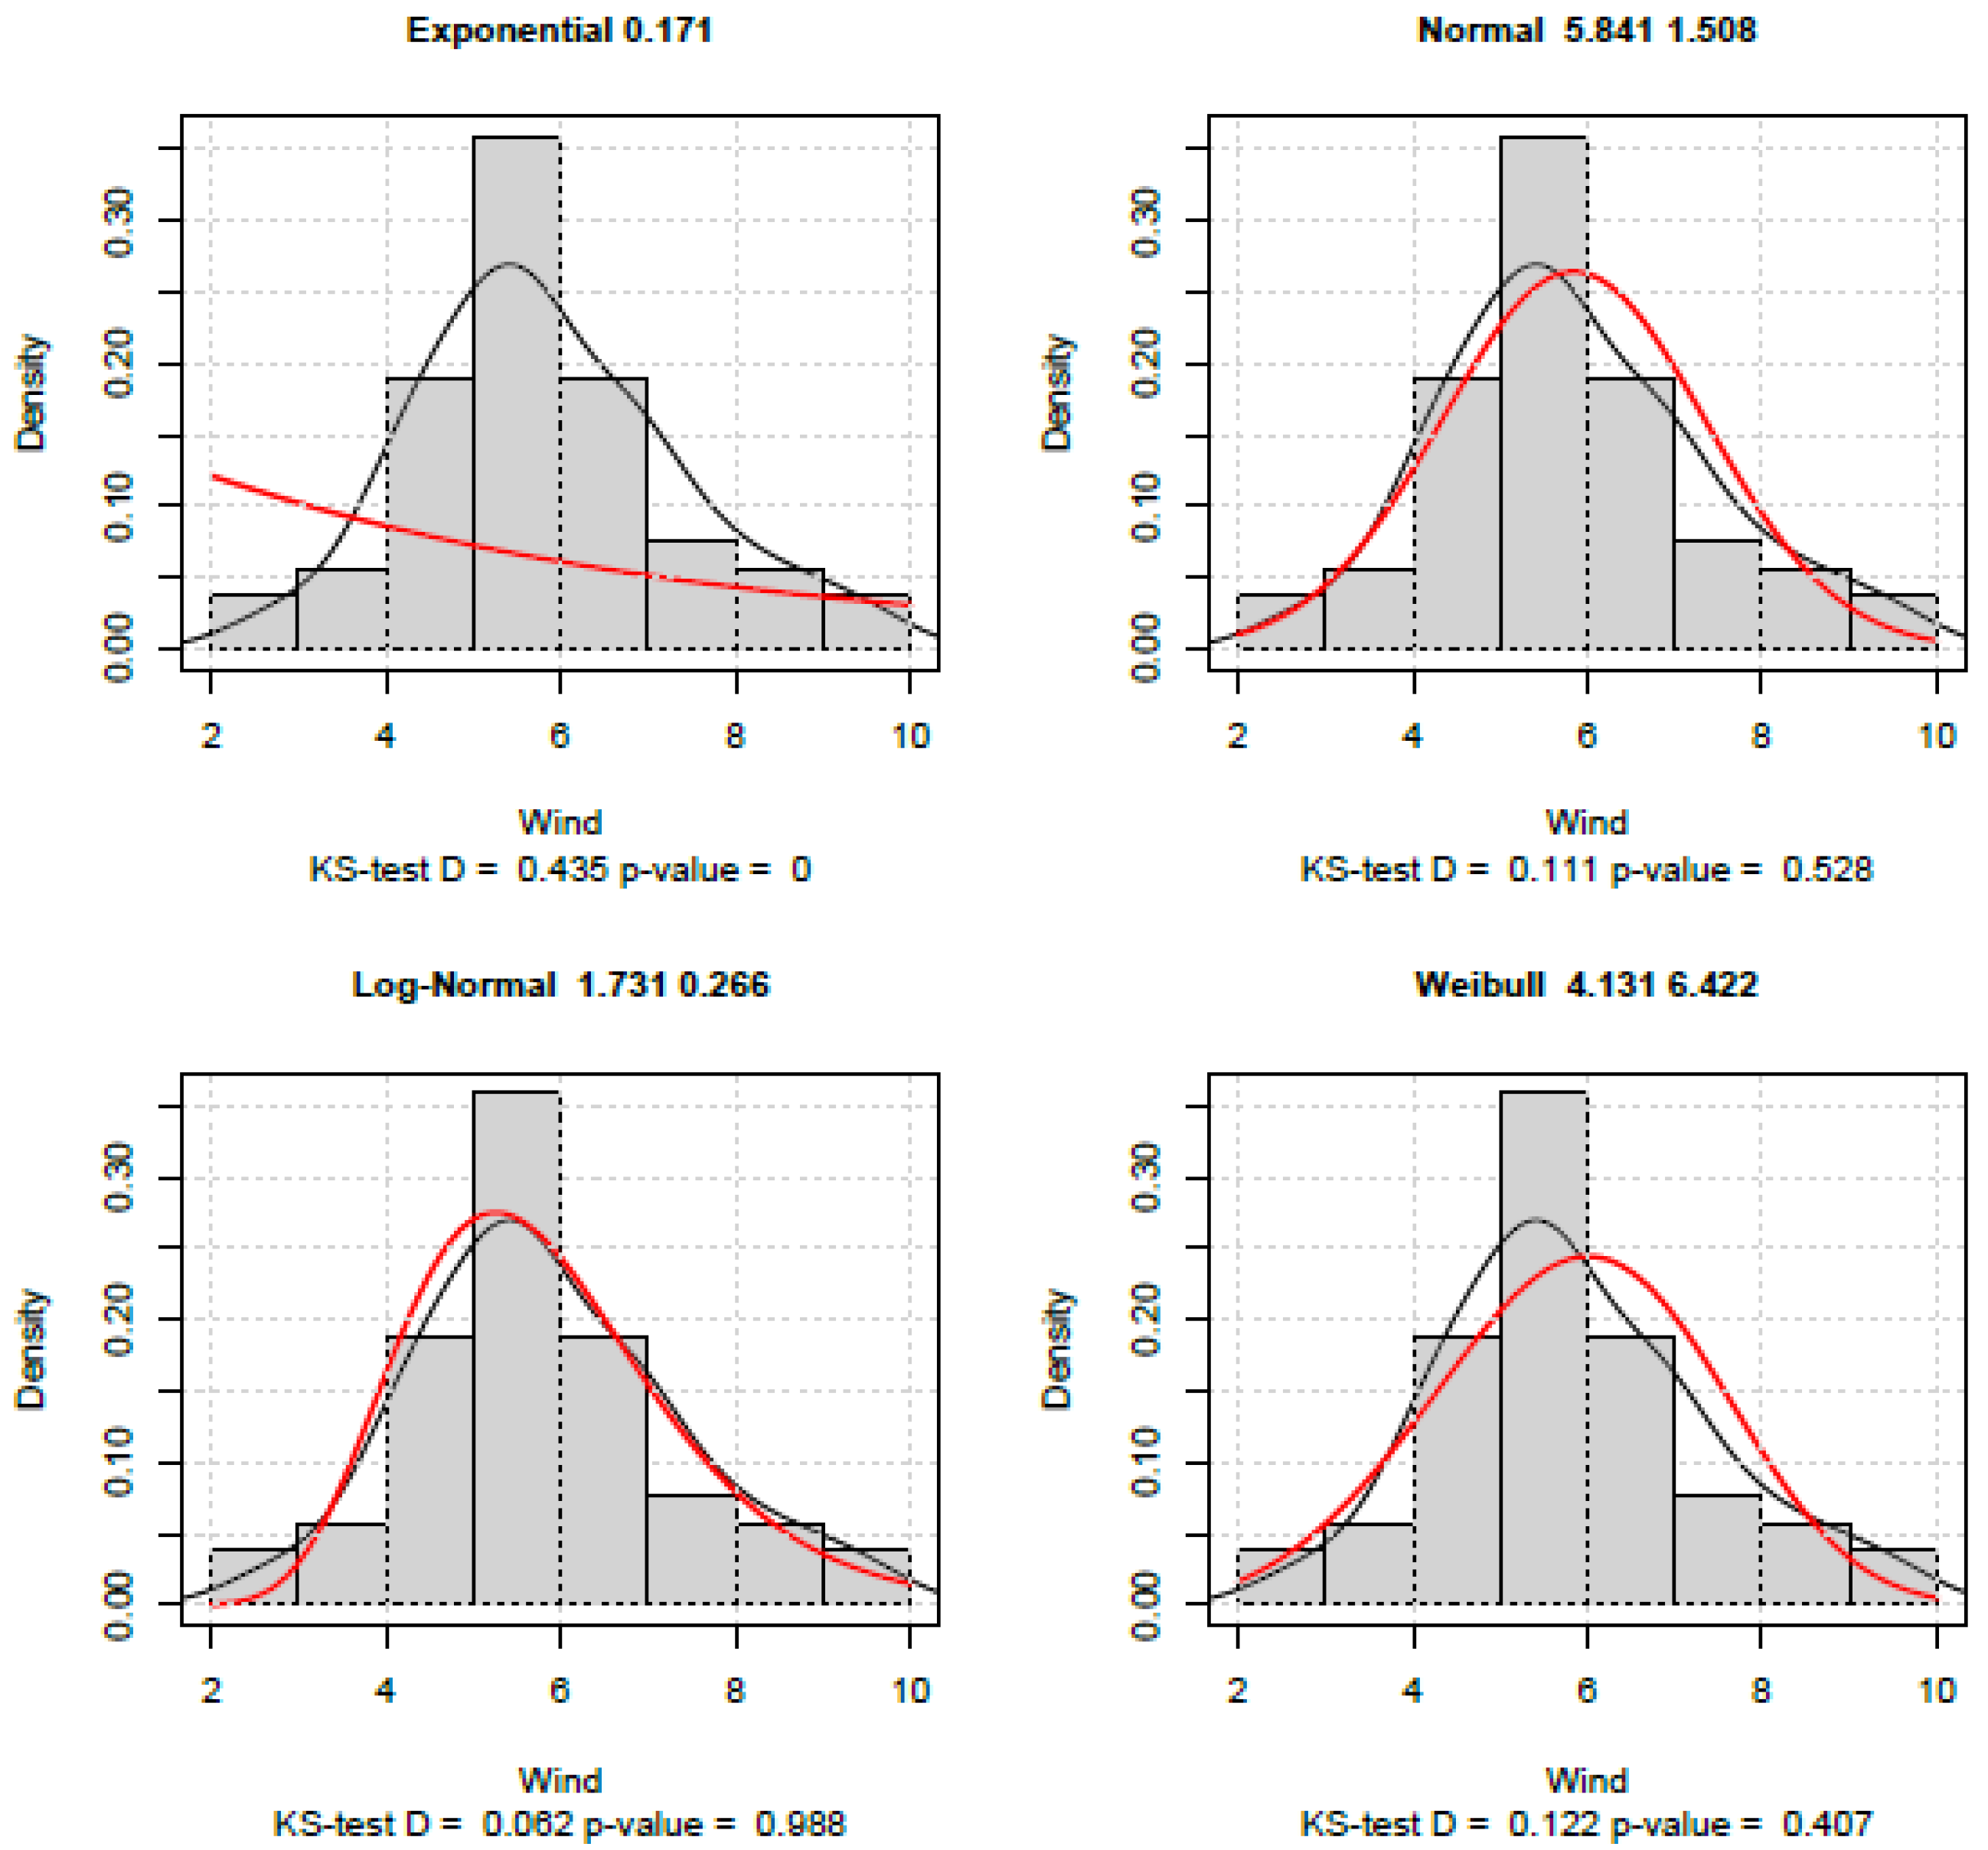
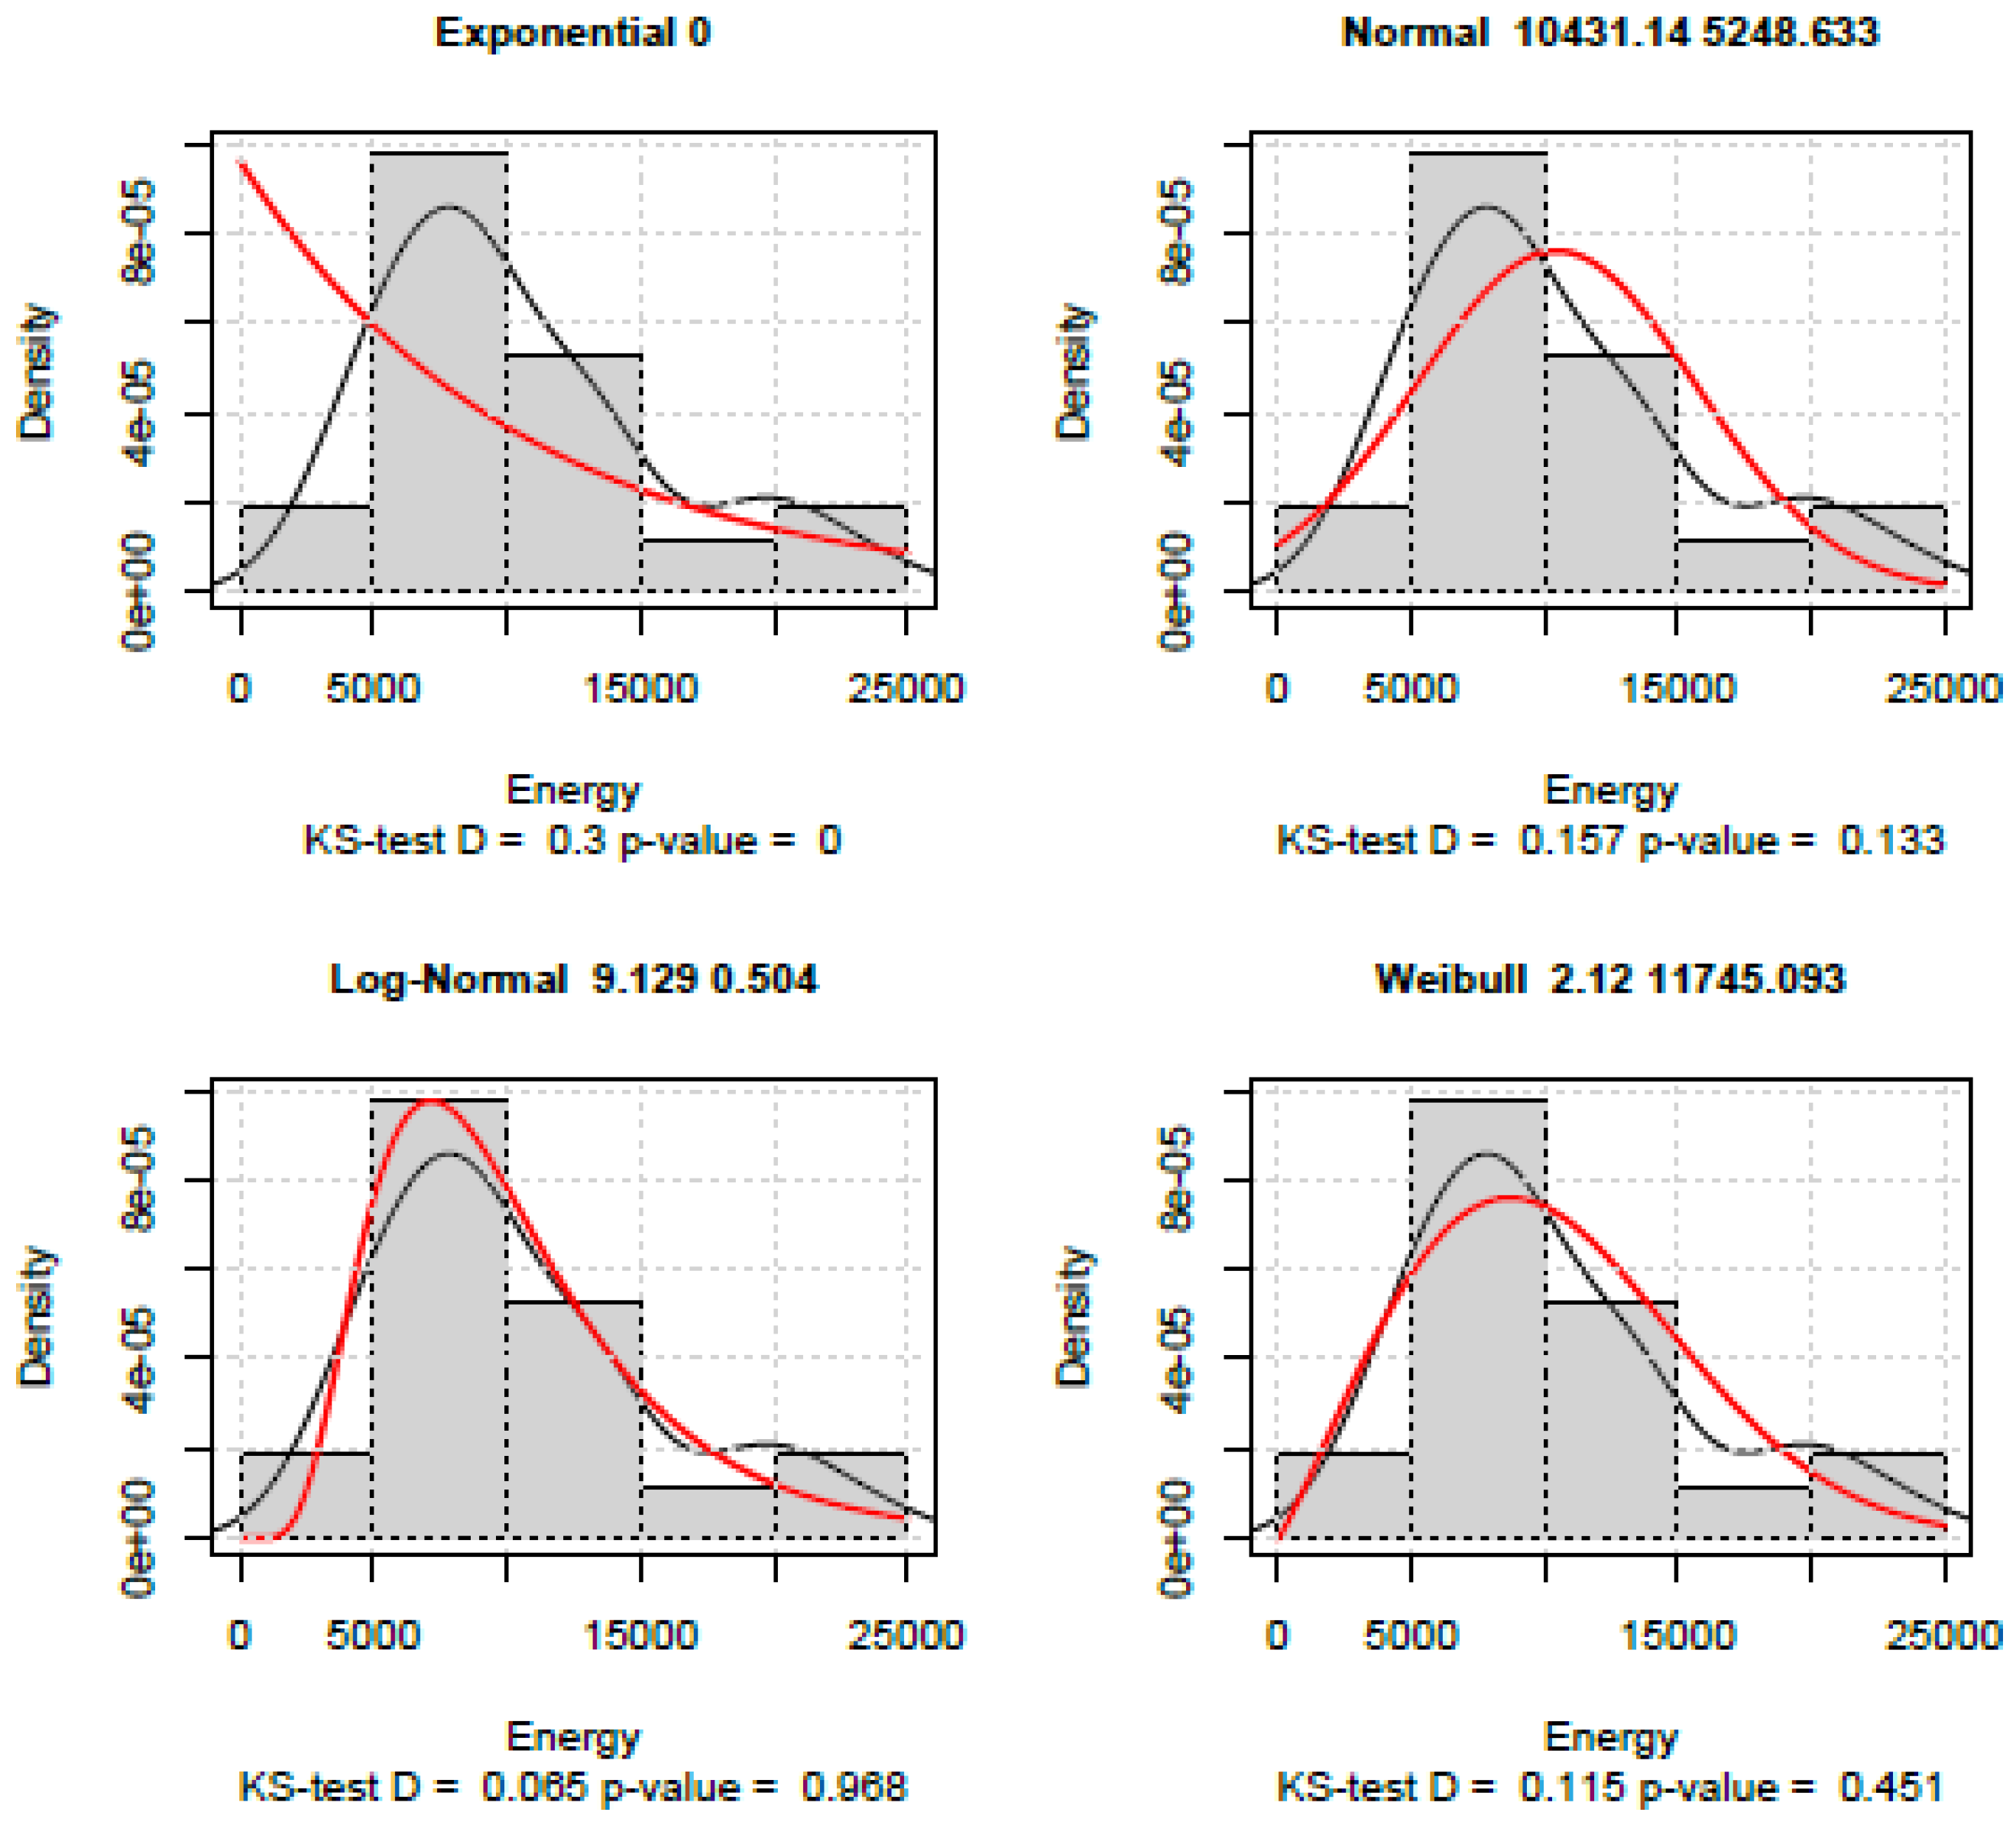
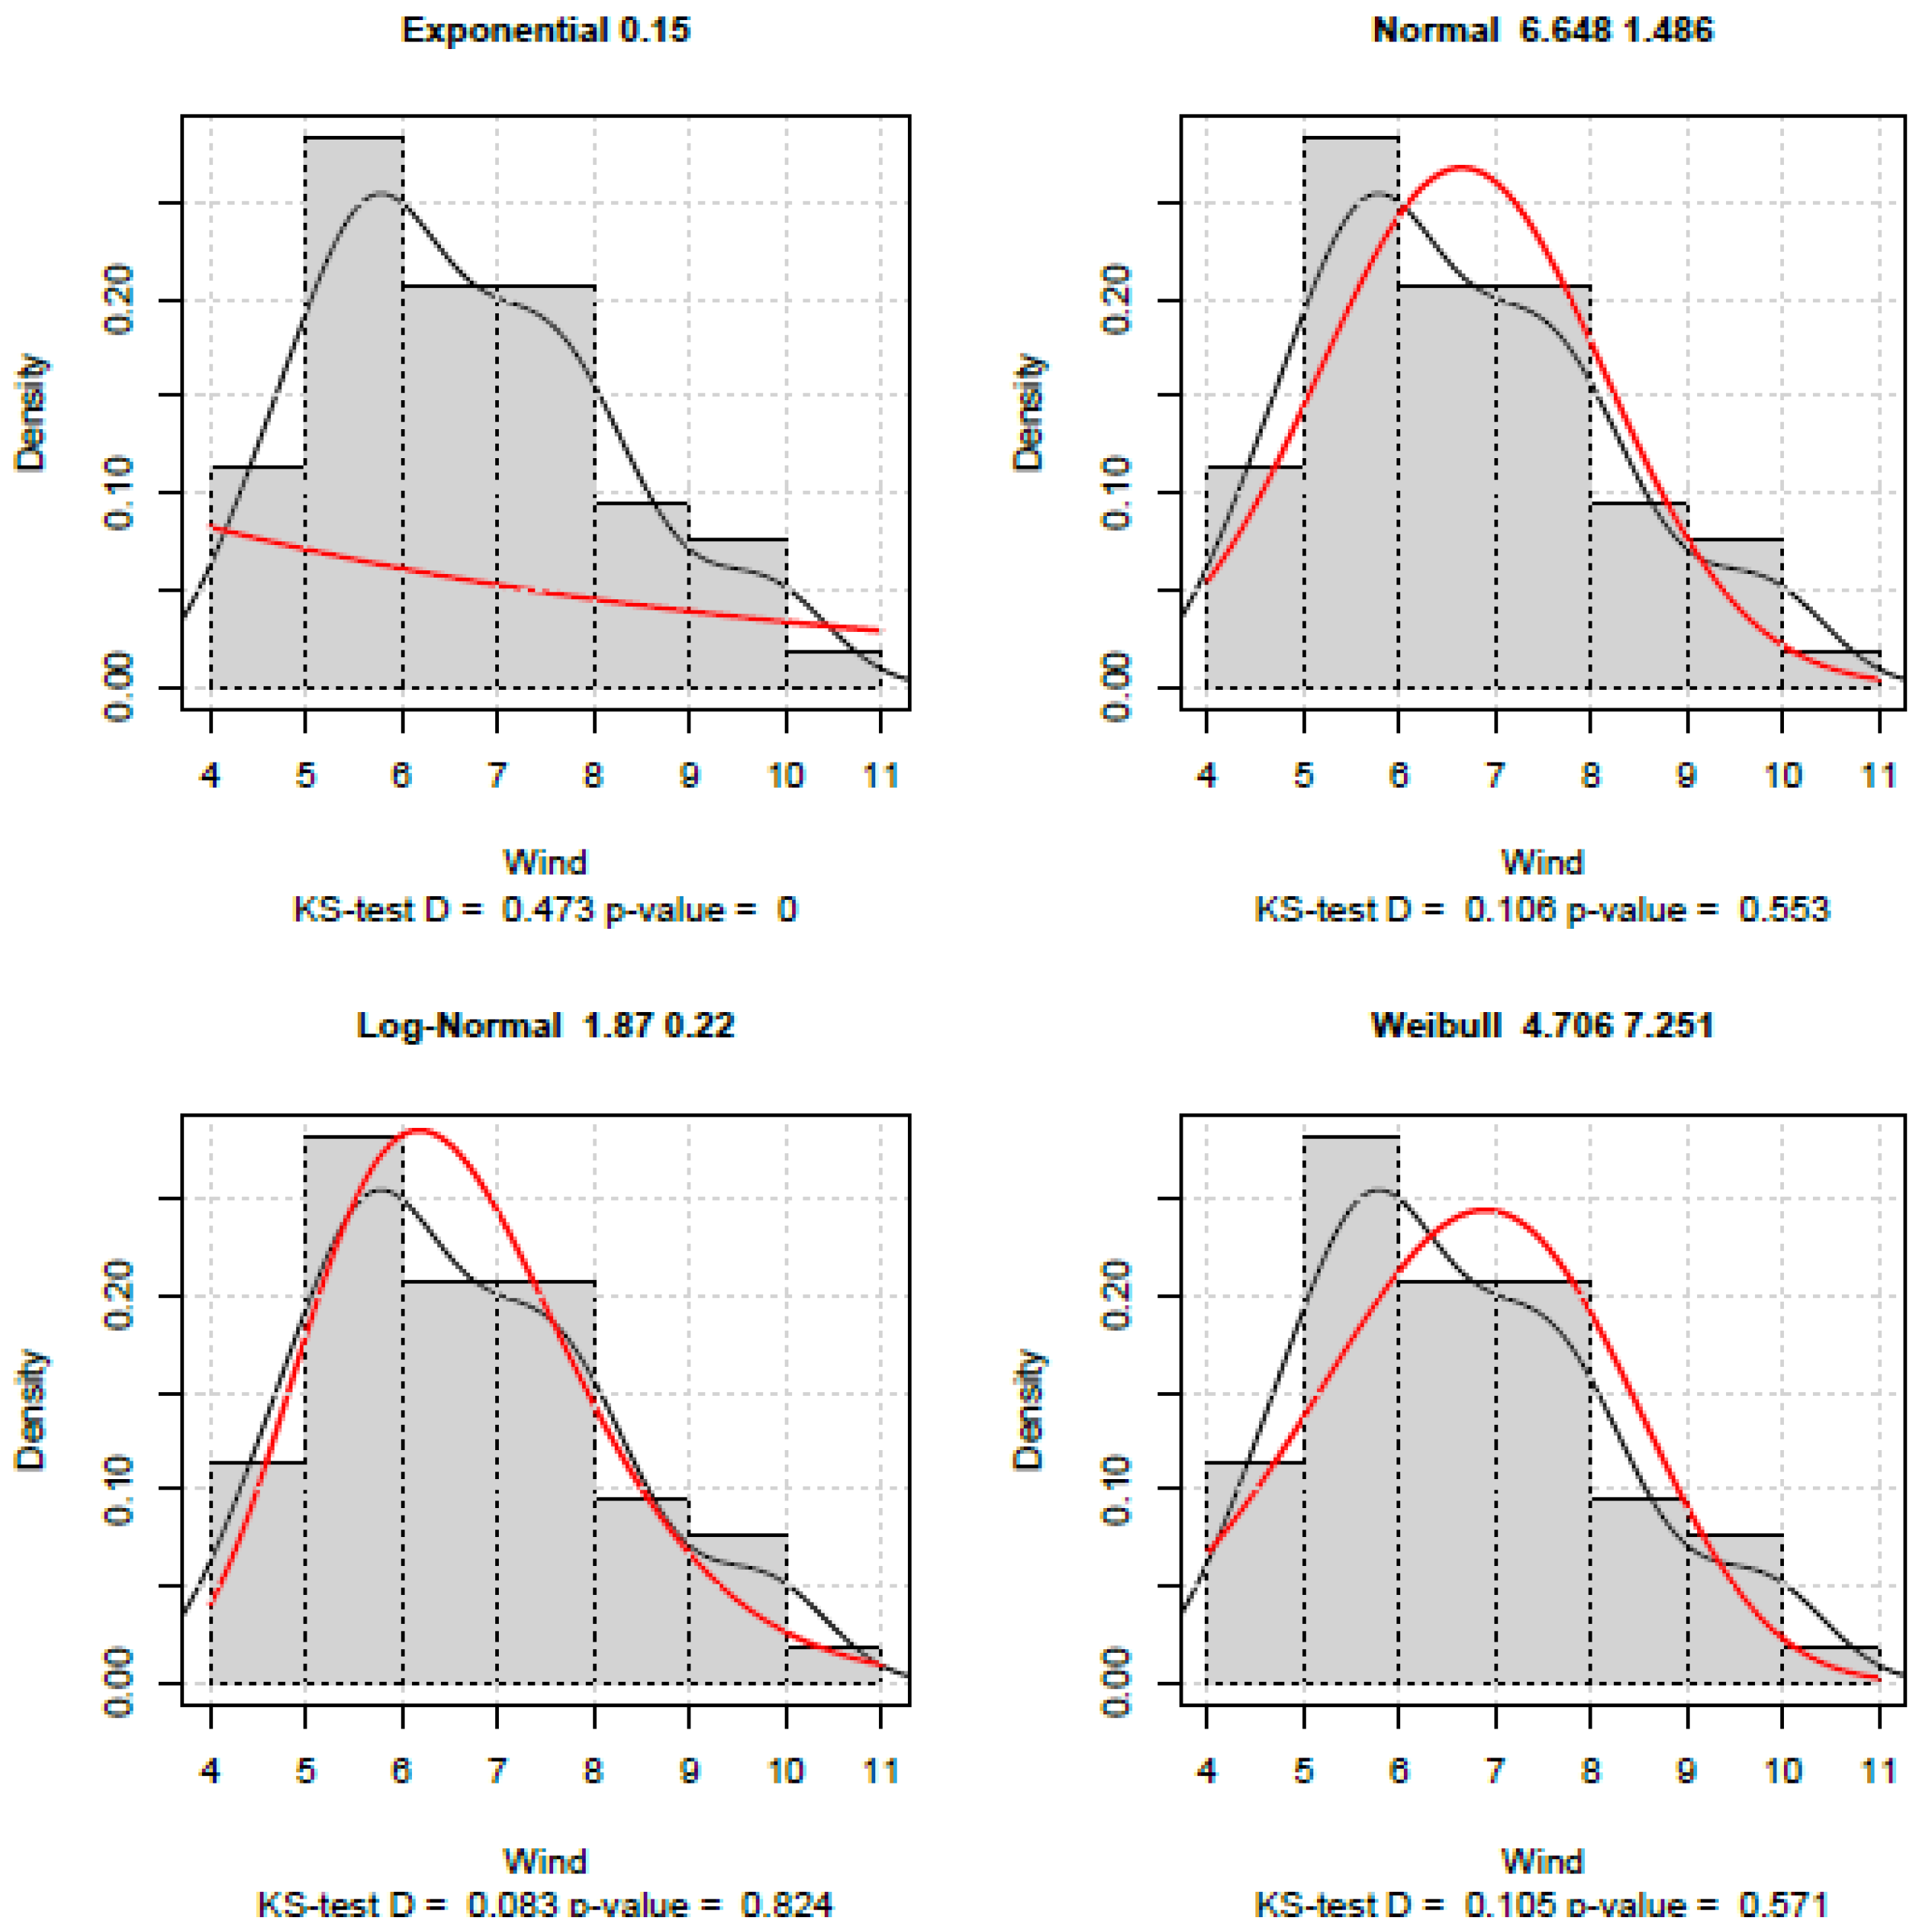
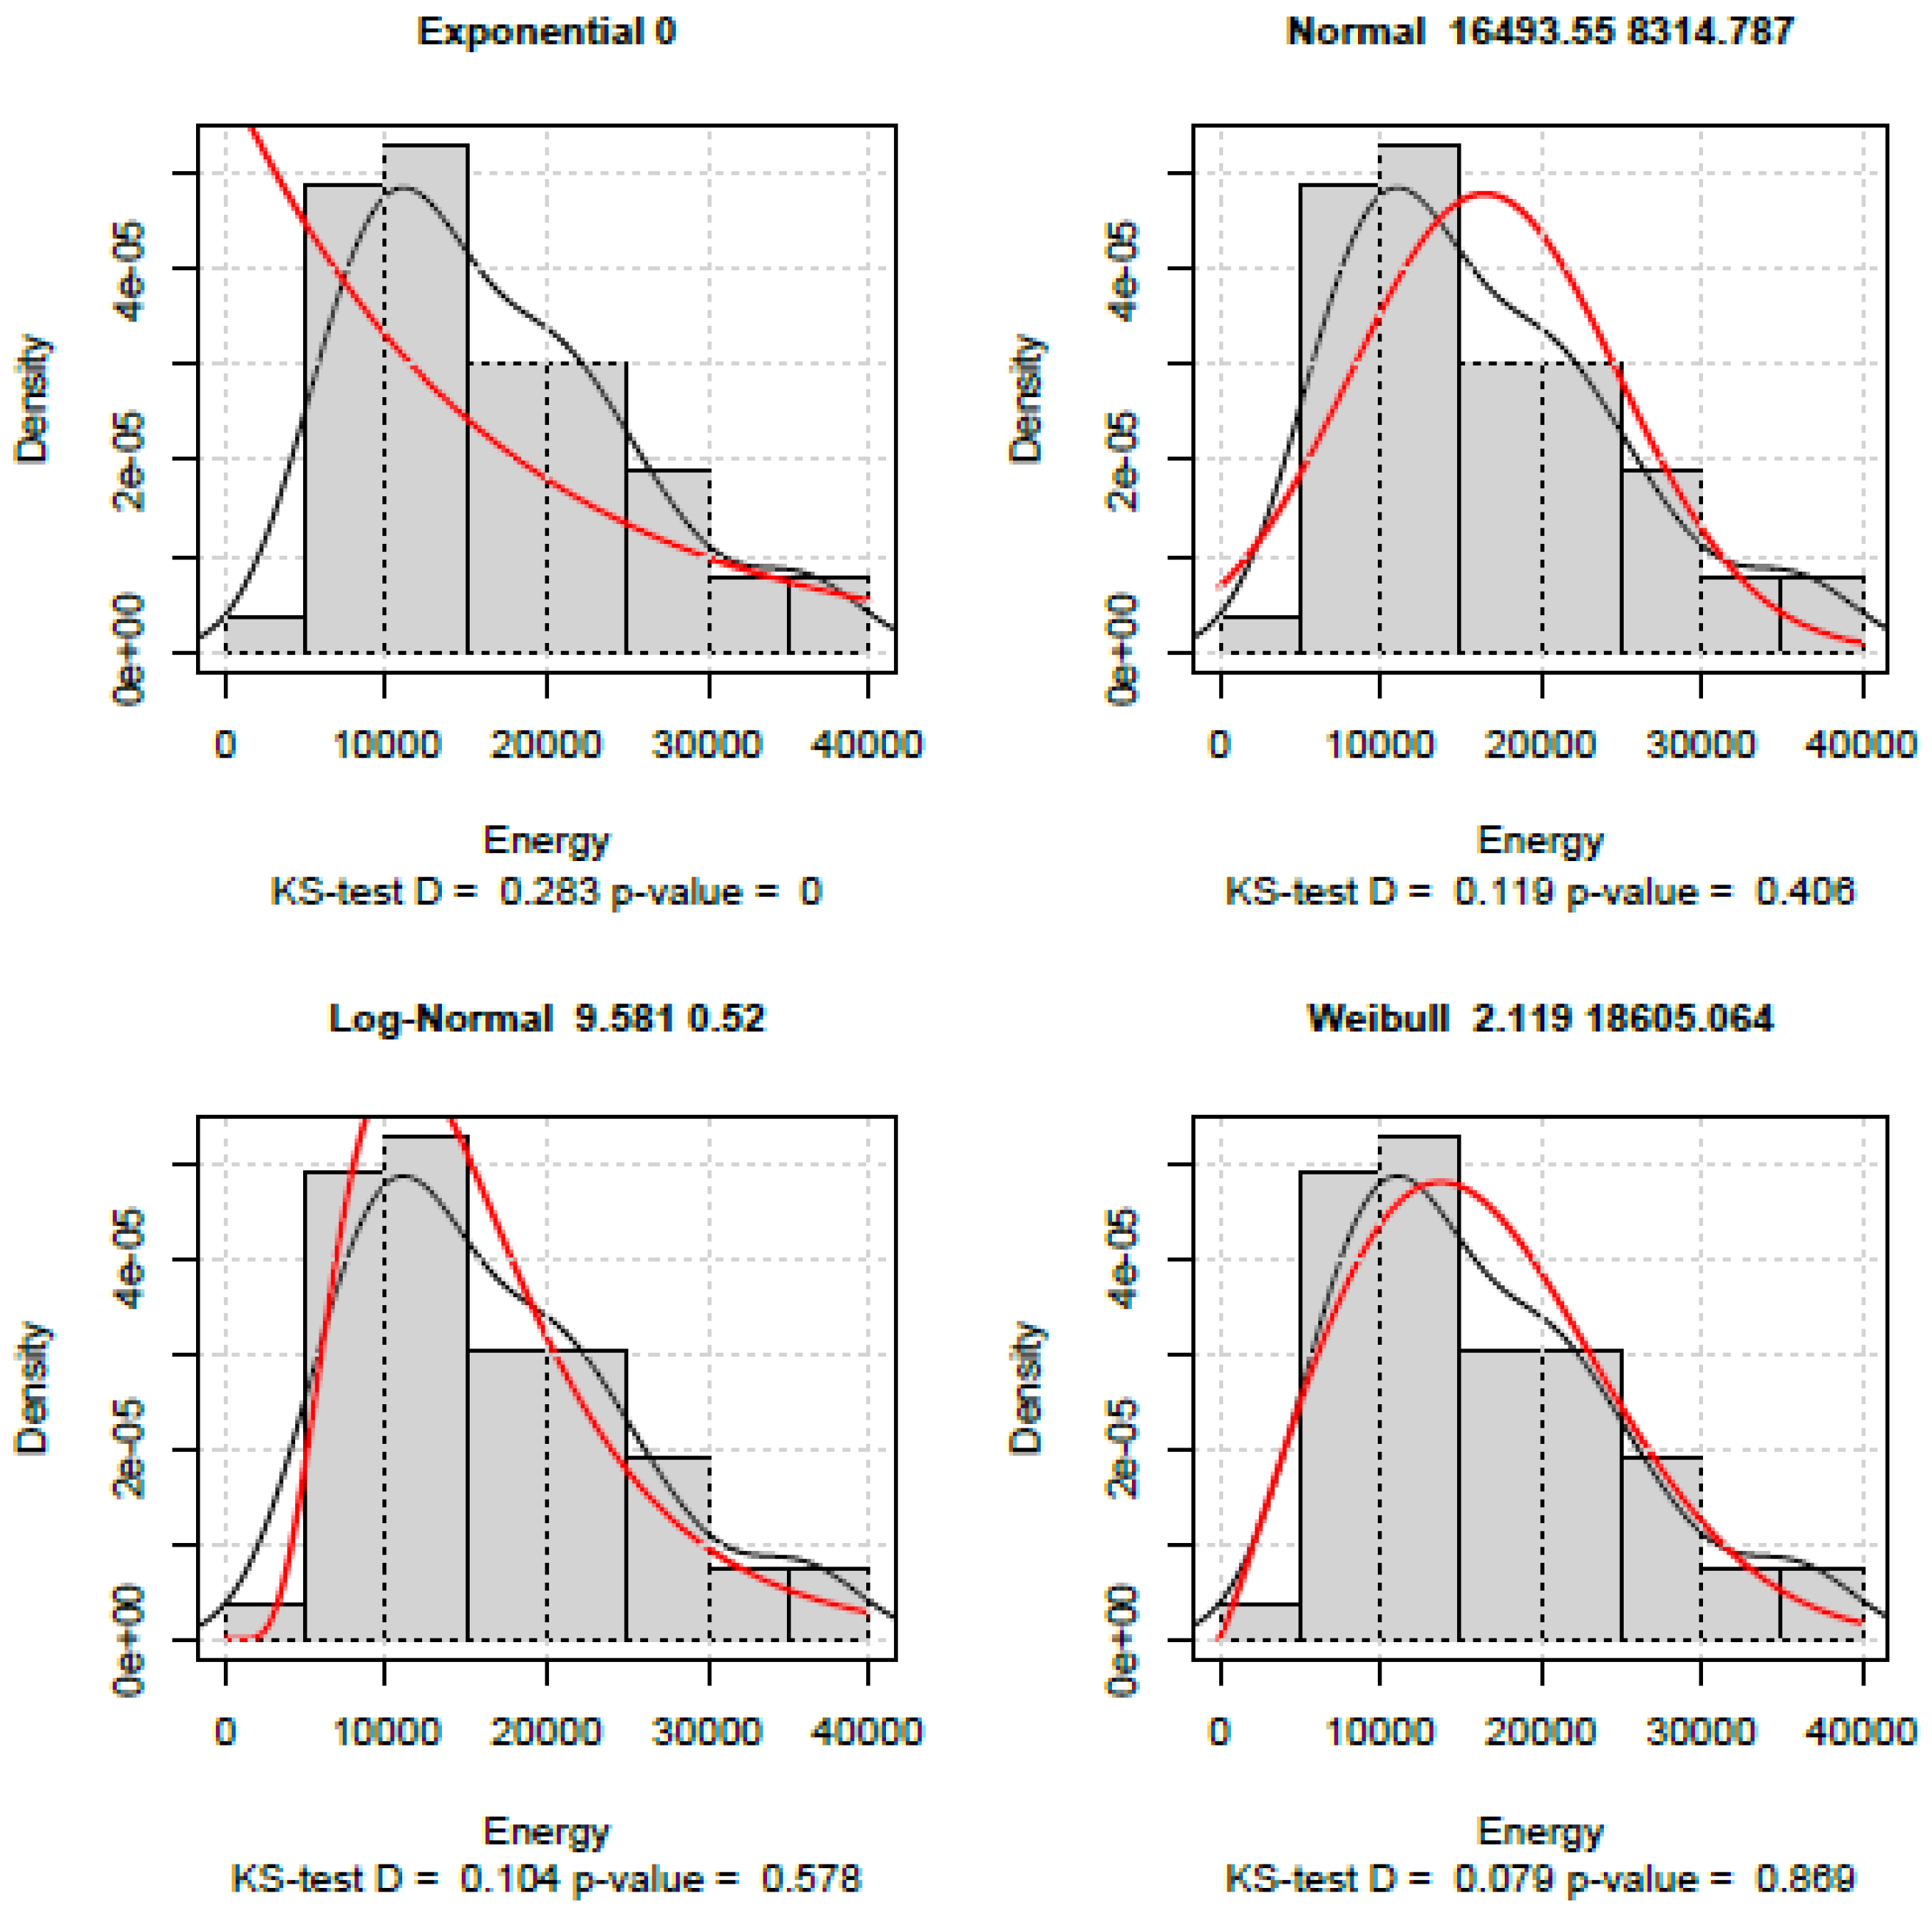
Figure 11.
Fits of the actual wind speed distribution (Wind) to four selected theoretical distributions – the best fit was obtained for the Log-Normal distribution (WT1 wind turbine).
Figure 11.
Fits of the actual wind speed distribution (Wind) to four selected theoretical distributions – the best fit was obtained for the Log-Normal distribution (WT1 wind turbine).
Figure 12.
Fits of the actual wind speed distribution (Energy) to four selected theoretical distributions – the best match was obtained for the Log-Normal distribution (WT1 wind turbine).
Figure 12.
Fits of the actual wind speed distribution (Energy) to four selected theoretical distributions – the best match was obtained for the Log-Normal distribution (WT1 wind turbine).
Figure 13.
Fits of the actual wind speed distribution (Wind) to four selected theoretical distributions – the best fit was obtained for the Log-Normal distribution (WT2 wind turbine).
Figure 13.
Fits of the actual wind speed distribution (Wind) to four selected theoretical distributions – the best fit was obtained for the Log-Normal distribution (WT2 wind turbine).
Figure 14.
Fits of the actual wind speed distribution (Energy) to four selected theoretical distributions – the best match was obtained for the Log-Normal distribution (WT2 wind turbine).
Figure 14.
Fits of the actual wind speed distribution (Energy) to four selected theoretical distributions – the best match was obtained for the Log-Normal distribution (WT2 wind turbine).
Figure 15.
Fits of the actual wind speed distribution (Wind) to four selected theoretical distributions – the best fit was obtained for the Log-Normal distribution (WT3 wind turbine).
Figure 15.
Fits of the actual wind speed distribution (Wind) to four selected theoretical distributions – the best fit was obtained for the Log-Normal distribution (WT3 wind turbine).
Figure 16.
Fits of the actual wind speed distribution (Energy) to four selected theoretical distributions – the best match was obtained for the Weibull distribution (WT3 wind turbine).
Figure 16.
Fits of the actual wind speed distribution (Energy) to four selected theoretical distributions – the best match was obtained for the Weibull distribution (WT3 wind turbine).
A recognized random variable distribution used in wind energy to estimate wind energy production is the Weibull distribution (WB) [44,45,46]. It describes wind speed behavior very well, and the wind speed distribution directly affects electricity production from a turbine. This is due to the wind speed characteristic, which cannot be negative; moderate speeds usually prevail. In wind energy, the Weibull distribution is the de facto standard for describing wind speed statistics. Due to its simple calculation of the integral describing turbine power, it is frequently used to determine annual energy production (AEP) and uncertainty analyses. Therefore, it is also widely used by economists. However, when analyzing the obtained results, it should be noted that the case study of the wind farm considered in this paper demonstrated a better fit in most analyses for the Log-Normal (LN) distribution than the Weibull (WB) distribution preferred by the energy industry. The only exception is the electricity production distribution for turbine WT3 (LN p-value = 0.578, WB p-value = 0.869). This situation is different for the wind speed distribution for turbine WT3. There, a better fit of the Weibull distribution was observed than the Log-Normal distribution (WB p-value = 0.824, LN p-value = 0.571). This situation is caused by the lower utilization of the wind potential by WT3, which is particularly noticeable in weeks 12–33. The use of the Weibull distribution was also questioned in the work of Lencastre [47]. In this work, it was shown that the Gaussian distribution allows for predicting wind speed histograms with greater accuracy than the Weibull distribution. It was also shown that other good distributions for modeling wind speed are the Nakagami and Rice distributions, which can be interpreted as special cases of the Weibull distribution for specific values of the shape parameter and the scale parameter. These results are important not only for predicting wind speed values, but also for predicting the value of electricity generated by wind turbines.
4. Conclusions
The considerations and research results presented in this article represent the first phase of work aimed at developing a method for forecasting wind conditions and energy production using wind turbines. This method will be developed using statistical tools, mathematical and numerical models, and artificial intelligence. Ultimately, the developed forecasting method will facilitate the development of a rational wind turbine operation strategy, taking into account the type of turbine, installed capacity, mast height, and location.
The analyses conducted allowed the creation of mathematical regression models that can be used to analyze energy production based on historical data. Comparing actual energy production based on the developed regression models can provide diagnostic information, enabling the assessment of the technical condition of the wind turbine, particularly the blades.
The study also demonstrated the usefulness of the LogNormal distribution for assessing wind conditions and energy production. Therefore, further analysis should be conducted to determine the conditions under which the LogNormal distribution should be used instead of the previously used Weibull distribution.
Author Contributions
Conceptualization, S.B. and K.M..; methodology, S.B. and K.M.; validation, M.G. and S.B.; formal analysis, J.W. and M.G.; investigation, S.B.; resources, S.B. and P.K.; data curation, A.N..; data conversion and analysis, A.N., writing—original draft preparation, S.B. and K.M.; writing—review and editing, S.B. K.M. and P.K.; visualization, A.N. and P.K.; supervision, S.B.; project administration, S.B.; funding acquisition, S.B. and K.M. All authors have read and agreed to the published version of the manuscript.
Funding
This research received no external funding
Data Availability Statement
The data presented in these studies are available on request from the corresponding author. The data are not publicly available due to the extremely large size.
Conflicts of Interest
The authors declare no conflicts of interest.
References
- Polish Wind Energy Association (PWEA); TPA Poland / Baker Tilly TPA; DWF. Wind Energy in Poland: 2024 Report. 2024. Available online: https://www.psew.pl/wp-content/uploads/2024/10/Wind-energy-in-Poland-Report-2024.pdf (accessed on 6 November 2025).
- European Network of Transmission System Operators for Electricity. Available online: https://transparency.entsoe.eu/ (accessed on 6 November 2025).
- Public Net Electricity Generation in Poland. Available online: https://energy-charts.info/ (accessed on 6 November 2025).
- Ministerstwo Klimatu i Środowiska. Krajowy Plan w dziedzinie Energii i Klimatu [National Energy and Climate Plan]. Available online: https://www.gov.pl/web/klimat/krajowy-plan-na-rzecz-energii-i-klimatu (accessed on 10 November 2025).
- Gawlikowska-Fyk, A. From 2025 Coal Will Leave the Polish Energy System in Waves. Forum Energii. 2021. Available online: https://www.forum-energii.eu/en/from-2025-coal-will-leave-the-polish-energy-system-in-waves (accessed on 9 November 2025).
- Viola, L.; Mohammadi, S.; Dotta, D.; Hesamzadeh, M.R.; Baldick, R.; Flynn, D. Ancillary services in power system transition toward a 100% non-fossil future: Market design challenges in the United States and Europe. Electric Power Systems Research 2024, 236, 110885. [Google Scholar] [CrossRef]
- Polskie Sieci Elektroenergetyczne (PSE). System Data [in Polish]. Available online: https://www.pse.pl/dane-systemowe (accessed on 11 November 2025).
- Min, C.-G. Analyzing the Impact of Variability and Uncertainty on Power System Flexibility. Appl. Sci. 2019, 9, 561. [Google Scholar] [CrossRef]
- Bochenek, B.; Jurasz, J.; Jaczewski, A.; Stachura, G.; Sekuła, P.; Strzyżewski, T.; Wdowikowski, M.; Figurski, M. Day-Ahead Wind Power Forecasting in Poland Based on Numerical Weather Prediction. Energies 2021, 14, 2164. [Google Scholar] [CrossRef]
- Forum Energii. October 2025 — On the Wings of Wind, Yet Under Constraints [in Polish; in: “Monthly Bulletin”]. Available online: https://www.forum-energii.eu/miesiecznik, (accessed on 11 November 2025).
- Solar Power Europe. Available online: https://www.solarpowereurope.org/ (accessed on 10 September 2025).
- Schaefer, J.L.; Siluk, J.C.M. An Algorithm-based Approach to Map the Players’ Network for Photovoltaic Energy Businesses. Int. J. Sustain. Energy Plan. Manag. 2021, 30, 43–60. [Google Scholar] [CrossRef]
- Santiago, I.; Moreno-Munoz, A.; Quintero-Jiménez, P.; Garcia-Torres, F.; Gonzalez-Redondo, M.J. Electricity demand during pandemic times: The case of the COVID-19 in Spain. Energy Policy 2021, 148, 111954–111964. [Google Scholar] [CrossRef]
- European Commission. A European Green Deal. Available online: https://ec.europa.eu/info/strategy/priorities-2019-2024/european-green-deal_en (accessed on 10 September 2025).
- Devetakovi’c, M.; Djordjevi’c, D.; Radojevi’c, M.; Krsti’c-Furundži’c, A.; Burduhos, B.-G.; Martinopoulos, G.; Neagoe, M.; Lobaccaro, G. Photovoltaics on Landmark Buildings with Distinctive Geometries. Appl. Sci. 2020, 10, 6696. [Google Scholar] [CrossRef]
- Martinopoulos, G. Are rooftop photovoltaic systems a sustainable solution for Europe? A life cycle impact assessment and cost analysis. Appl. Energy 2020, 257, 114035. [Google Scholar] [CrossRef]
- Mularczyk, A. Analysis of the Energy Mix in Poland and the European Union in Terms of Renewable Energy Prospects. Sci. Pap. Silesian Univ. Technol. Organ. Manag. Ser. 2024, 208, 399–420. [Google Scholar] [CrossRef]
- Borowski, S.; Sołtysiak, A.; Migawa, K.; Neubauer, A. Simple mathematical model to predict the amount of energy produced in wind turbine – preliminary study. MATEC Web Conf. 2021, 332, 01004. [Google Scholar] [CrossRef]
- International Electrotechnical Commission (IEC). IEC 61400-1: Wind Turbines—Part 1: Design Requirements; IEC: Geneva, Switzerland, 2005. [Google Scholar]
- De Laurentis, C.; Windemer, R. When the turbines stop: Unveiling the factors shaping end-of-life decisions of ageing wind infrastructure in Italy. Energy Res. Soc. Sci. 2024, 113, 103536. [Google Scholar] [CrossRef]
- Zhu, D.; Ding, Z.; Huang, X.; Li, X. Probabilistic modeling for long-term fatigue reliability of wind turbines based on Markov model and subset simulation. Int. J. Fatigue 2023, 173, 107685. [Google Scholar] [CrossRef]
- Evans, S.; Dana, S.; Clausen, P.; Wood, D. A Simple Method for Modelling Fatigue Spectra of Small Wind Turbine Blades. Wind Energy 2021, 24, 549–557. [Google Scholar] [CrossRef]
- Wang, J.; Liu, Y.; Zhang, Z. Fatigue Damage and Reliability Assessment of Wind Turbine Structure During Service Utilizing Real-Time Monitoring Data. Buildings 2024, 14, 3453. [Google Scholar] [CrossRef]
- Jiang, L.; Xiang, D.; Tan, Y.F.; Nie, Y.H.; Cao, H.J.; Wei, Y.Z.; Zeng, D.; Shen, Y.H.; Shen, G. Analysis of wind turbine gearbox’s environmental impact considering its reliability. J. Clean. Prod. 2018, 180, 846–857. [Google Scholar] [CrossRef]
- Hill, R.R.; Stinebaugh, J.A.; Briand, D.; Benjamin, A.S.; Linsday, J. Wind Turbine Reliability: A Database and Analysis Approach; Sandia National Laboratories: Albuquerque, NM, USA, 2008; Report No. SAND2008-0983. Available online: https://www.osti.gov/servlets/purl/1028916 (accessed on 30 November 2025).
- Yang, W.; Wang, Y.; Liang, K.; Zhang, Y.; Lin, S.; Zhao, H. Method for Evaluating the Reliability and Competitive Failure of Wind Turbine Gearbox Bearings Considering the Fault Incubation Point. Energies 2023, 16, 5261. [Google Scholar] [CrossRef]
- Jensen, J.P. Evaluating the environmental impacts of recycling wind turbines. Wind Energy 2019, 22, 316–326. [Google Scholar] [CrossRef]
- Woo, S.M.; Whale, J. A Mini-Review of End-of-Life Management of Wind Turbines: Current Practices and Closing the Circular Economy Gap. Waste Manag. Res. 2022, 40, 1730–1744. [Google Scholar] [CrossRef] [PubMed]
- Ziegler, L.; Gonzalez, E.; Rubert, T.; Smolka, U.; Melero, J.J. Lifetime extension of onshore wind turbines: A review covering Germany, Spain, Denmark, and the UK. Renew. Sustain. Energy Rev. 2018, 82, 1261–1271. [Google Scholar] [CrossRef]
- WindEurope. Decommissioning of Onshore Wind Turbines—Industry Guidance Document; WindEurope: Brussels, Belgium, 2020; Available online: https://proceedings.windeurope.org/biplatform/rails/active_storage/blobs/WindEurope-decommissioning-of-onshore-wind-turbines.pdf (accessed on 30 October 2025).
- Rubert, T.; McMillan, D.; Niewczas, P. A Decision Support Tool to Assist with Lifetime Extension of Wind Turbines. Renew. Energy 2018, 120, 423–433. [Google Scholar] [CrossRef]
- Ziegler, L.; Gonzalez, E.; Rubert, T.; Smolka, U.; Melero, J.J. Lifetime extension of onshore wind turbines: A review covering Germany, Spain, Denmark, and the UK. Renew. Sustain. Energy Rev. 2018, 82, 1261–1271. [Google Scholar] [CrossRef]
- Serri, L.; Lembo, E.; Airoldi, D.; Gelli, C.; Beccarello, M. Wind Energy Plants Repowering Potential in Italy: Technical-Economic Assessment. Renew. Energy 2018, 115, 382–390. [Google Scholar] [CrossRef]
- Colmenar-Santos, A.; Campíñez-Romero, S.; Pérez-Molina, C.; Mur-Pérez, F. Repowering: An Actual Possibility for Wind Energy in Spain in a New Scenario without Feed-in-Tariffs. Renew. Sustain. Energy Rev. 2015, 41, 319–337. [Google Scholar] [CrossRef]
- Philpott, A.; Windemer, R. Repower to the People: The Scope for Repowering to Increase the Scale of Community Shareholding in Commercial Onshore Wind Assets in Great Britain. Energy Res. Soc. Sci. 2022, 92, 102763. [Google Scholar] [CrossRef]
- Windemer, R.; Cowell, R. Are the Impacts of Wind Energy Reversible? Critically Reviewing the Research Literature, the Governance Challenges and Presenting an Agenda for Social Science. Energy Res. Soc. Sci. 2021, 79, 102162. [Google Scholar] [CrossRef]
- Mendoza, J.M.F.; Gallego-Schmid, A.; Velenturf, A.P.M.; Jensen, P.D.; Ibarra, D. Circular Economy Business Models and Technology Management Strategies in the Wind Industry: Sustainability Potential, Industrial Challenges and Opportunities. Renew. Sustain. Energy Rev. 2022, 163, 112523. [Google Scholar] [CrossRef]
- Karwowska, M.; Mikołajczak, J.; Borowski, S.; Dolatowski, Z.J.; Marć-Pieńkowska, J.; Budziński, W. Effect of Noise Generated by the Wind Turbine on the Quality of Goose Muscles and Abdominal Fat. Ann. Anim. Sci. 2014, 14, 441–451. [Google Scholar] [CrossRef]
- Mikołajczak, J.; Borowski, S.; Marć-Pieńkowska, J.; Odrowąż-Sypniewska, G.; Bernacki, Z.; Siódmiak, J.; Szterk, P. Preliminary studies on the reaction of growing geese (Anser anser f. domestica) to the proximity of wind turbines. Pol. J. Vet. Sci. 2013, 16, 679–386. [Google Scholar] [CrossRef] [PubMed]
- Karwowska, M.; Mikołajczak, J.; Dolatowski, Z.J.; Borowski, S. The effect of varying distances from the wind turbine on meat quality of growing-finishing pigs. Ann. Anim. Sci. 2015, 15(4), 1043–1054. [Google Scholar] [CrossRef]
- Emeis, S. A Simple Analytical Wind Park Model Considering Atmospheric Stability. Wind Energy 2010, 13, 459–469. [Google Scholar] [CrossRef]
- Li, T.; Liu, Z.; Wang, H.; Bian, W.; Yang, Q. Large Eddy Simulation for the Effects of Ground Roughness and Atmospheric Stratification on the Wake Characteristics of Wind Turbines Mounted on Complex Terrains. Energy Conversion and Management 2022, 268, 115977. [Google Scholar] [CrossRef]
- R Core Team. R: A Language and Environment for Statistical Computing; R Foundation for Statistical Computing: Vienna, Austria, 2025; Available online: https://www.R-project.org/ (accessed on 30 November 2025).
- Carrillo, C.; Obando-Montaño, A.F.; Cidrás, J.; Díaz-Dorado, E. An Approach to Determine the Weibull Parameters for Wind Energy Analysis: The Case of Galicia (Spain). Energies 2014, 7, 2676–2700. [Google Scholar] [CrossRef]
- Hussain, I.; Haider, A.; Ullah, Z.; Russo, M.; Casolino, G.M.; Azeem, B. Comparative Analysis of Eight Numerical Methods Using Weibull Distribution to Estimate Wind Power Density for Coastal Areas in Pakistan. Energies 2023, 16, 1515. [Google Scholar] [CrossRef]
- Bousla, M.; Maatallah, T.; El Alj, A.; et al. Analysis and Comparison of Wind Potential by Estimating Weibull Parameters Using Different Methods: Application to Wind Farm in the Northern of Morocco. Sustainability 2023, 15, 15087. [Google Scholar] [CrossRef]
- Lencastre, P.; Yazidi, A.; Lind, P.G. Modeling Wind-Speed Statistics beyond the Weibull Distribution. Energies 2024, 17, 2621. [Google Scholar] [CrossRef]
Figure 1.
Electricity and derived heat production from renewables and biofuels in Poland [7].
Figure 1.
Electricity and derived heat production from renewables and biofuels in Poland [7].
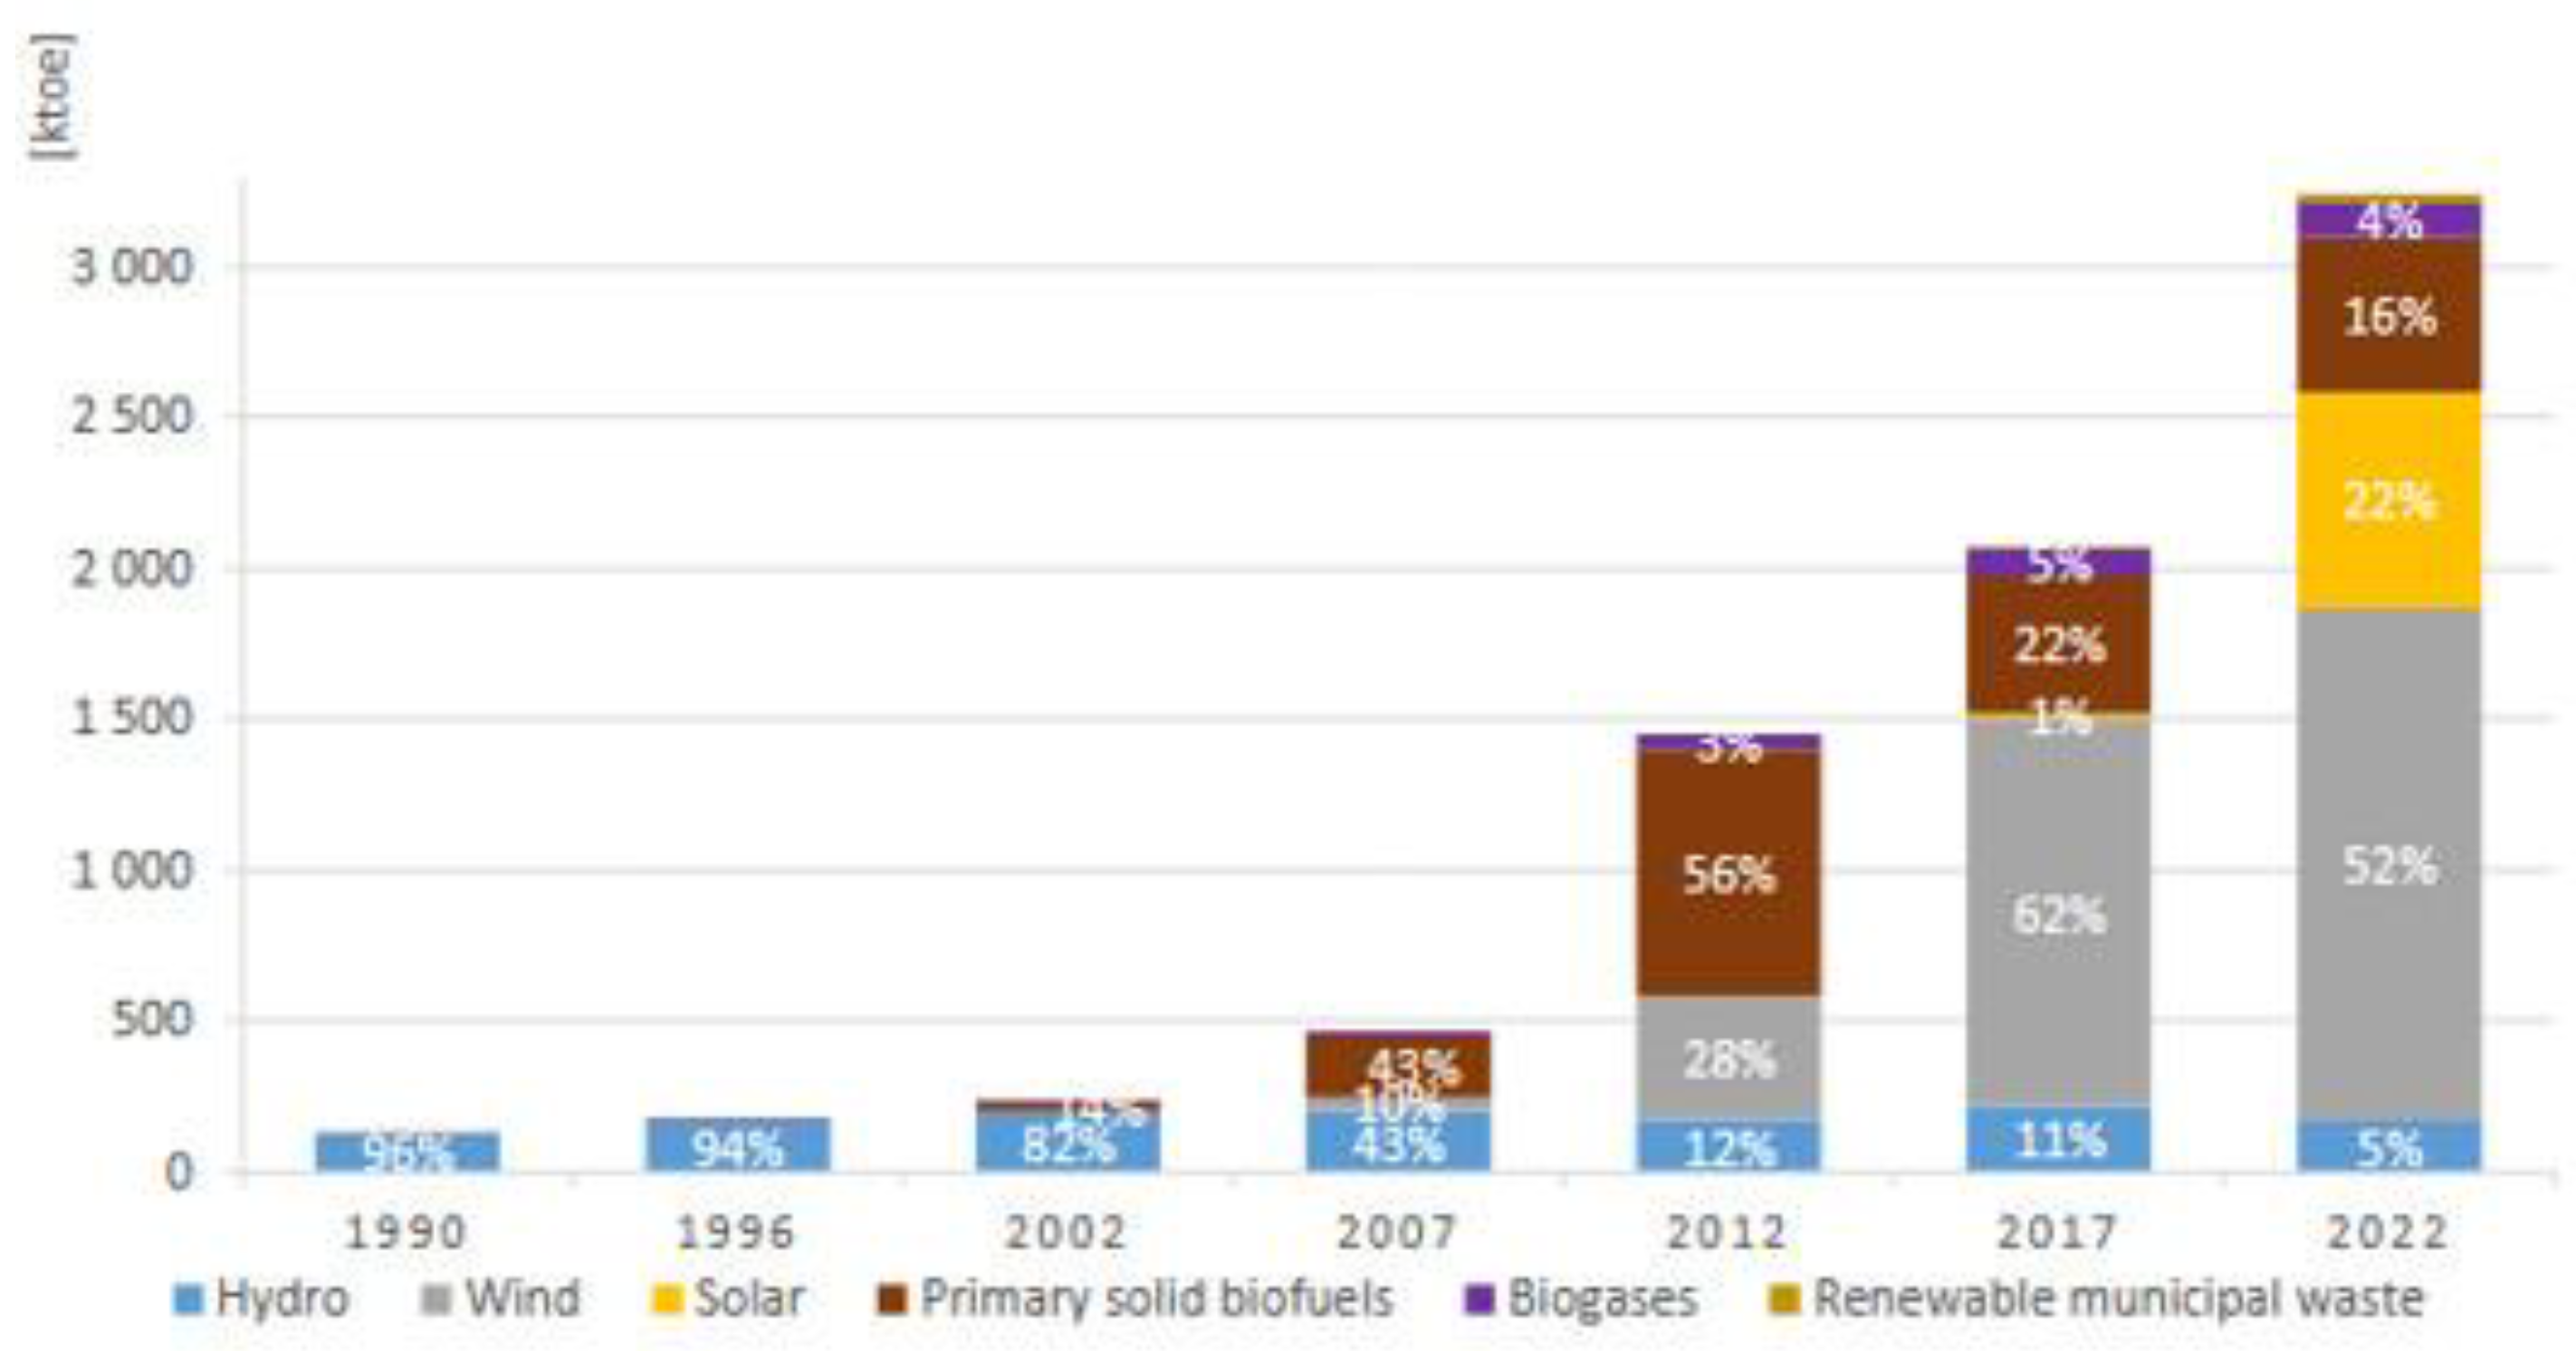
Figure 2.
Energy not fed into the grid from renewable energy plants in 2025 [10].
Figure 2.
Energy not fed into the grid from renewable energy plants in 2025 [10].
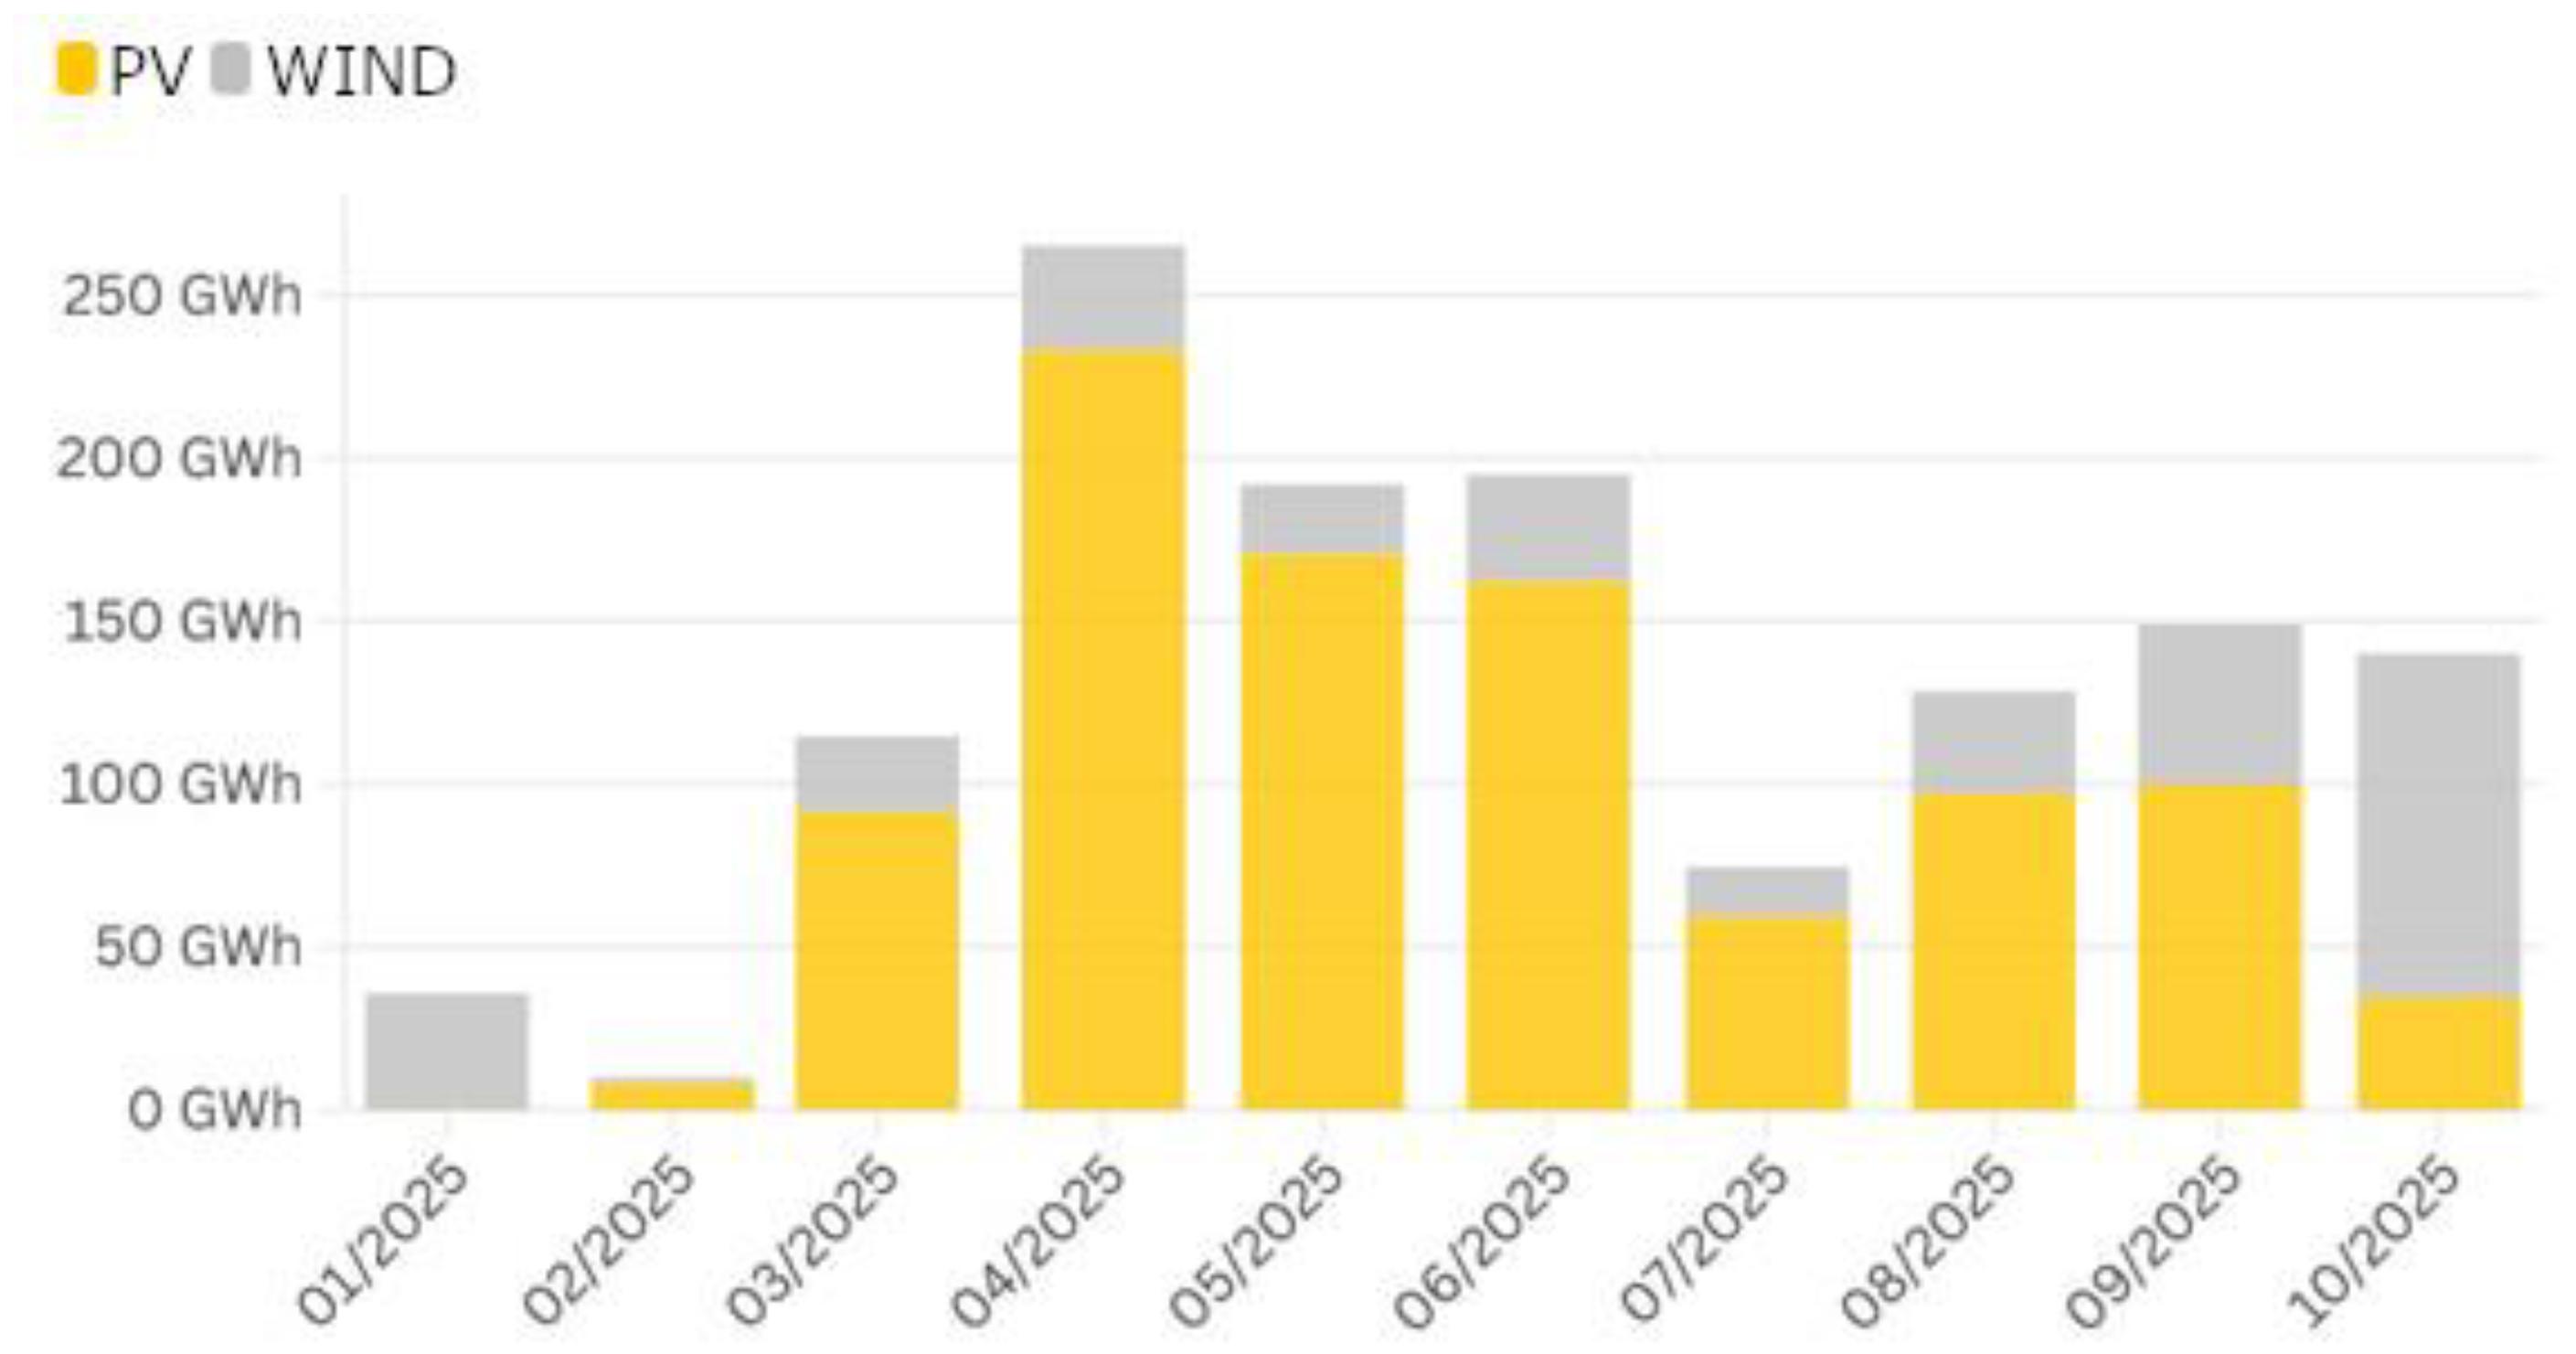
Figure 3.
Total installed capacity of wind farms in Poland [18].
Figure 3.
Total installed capacity of wind farms in Poland [18].
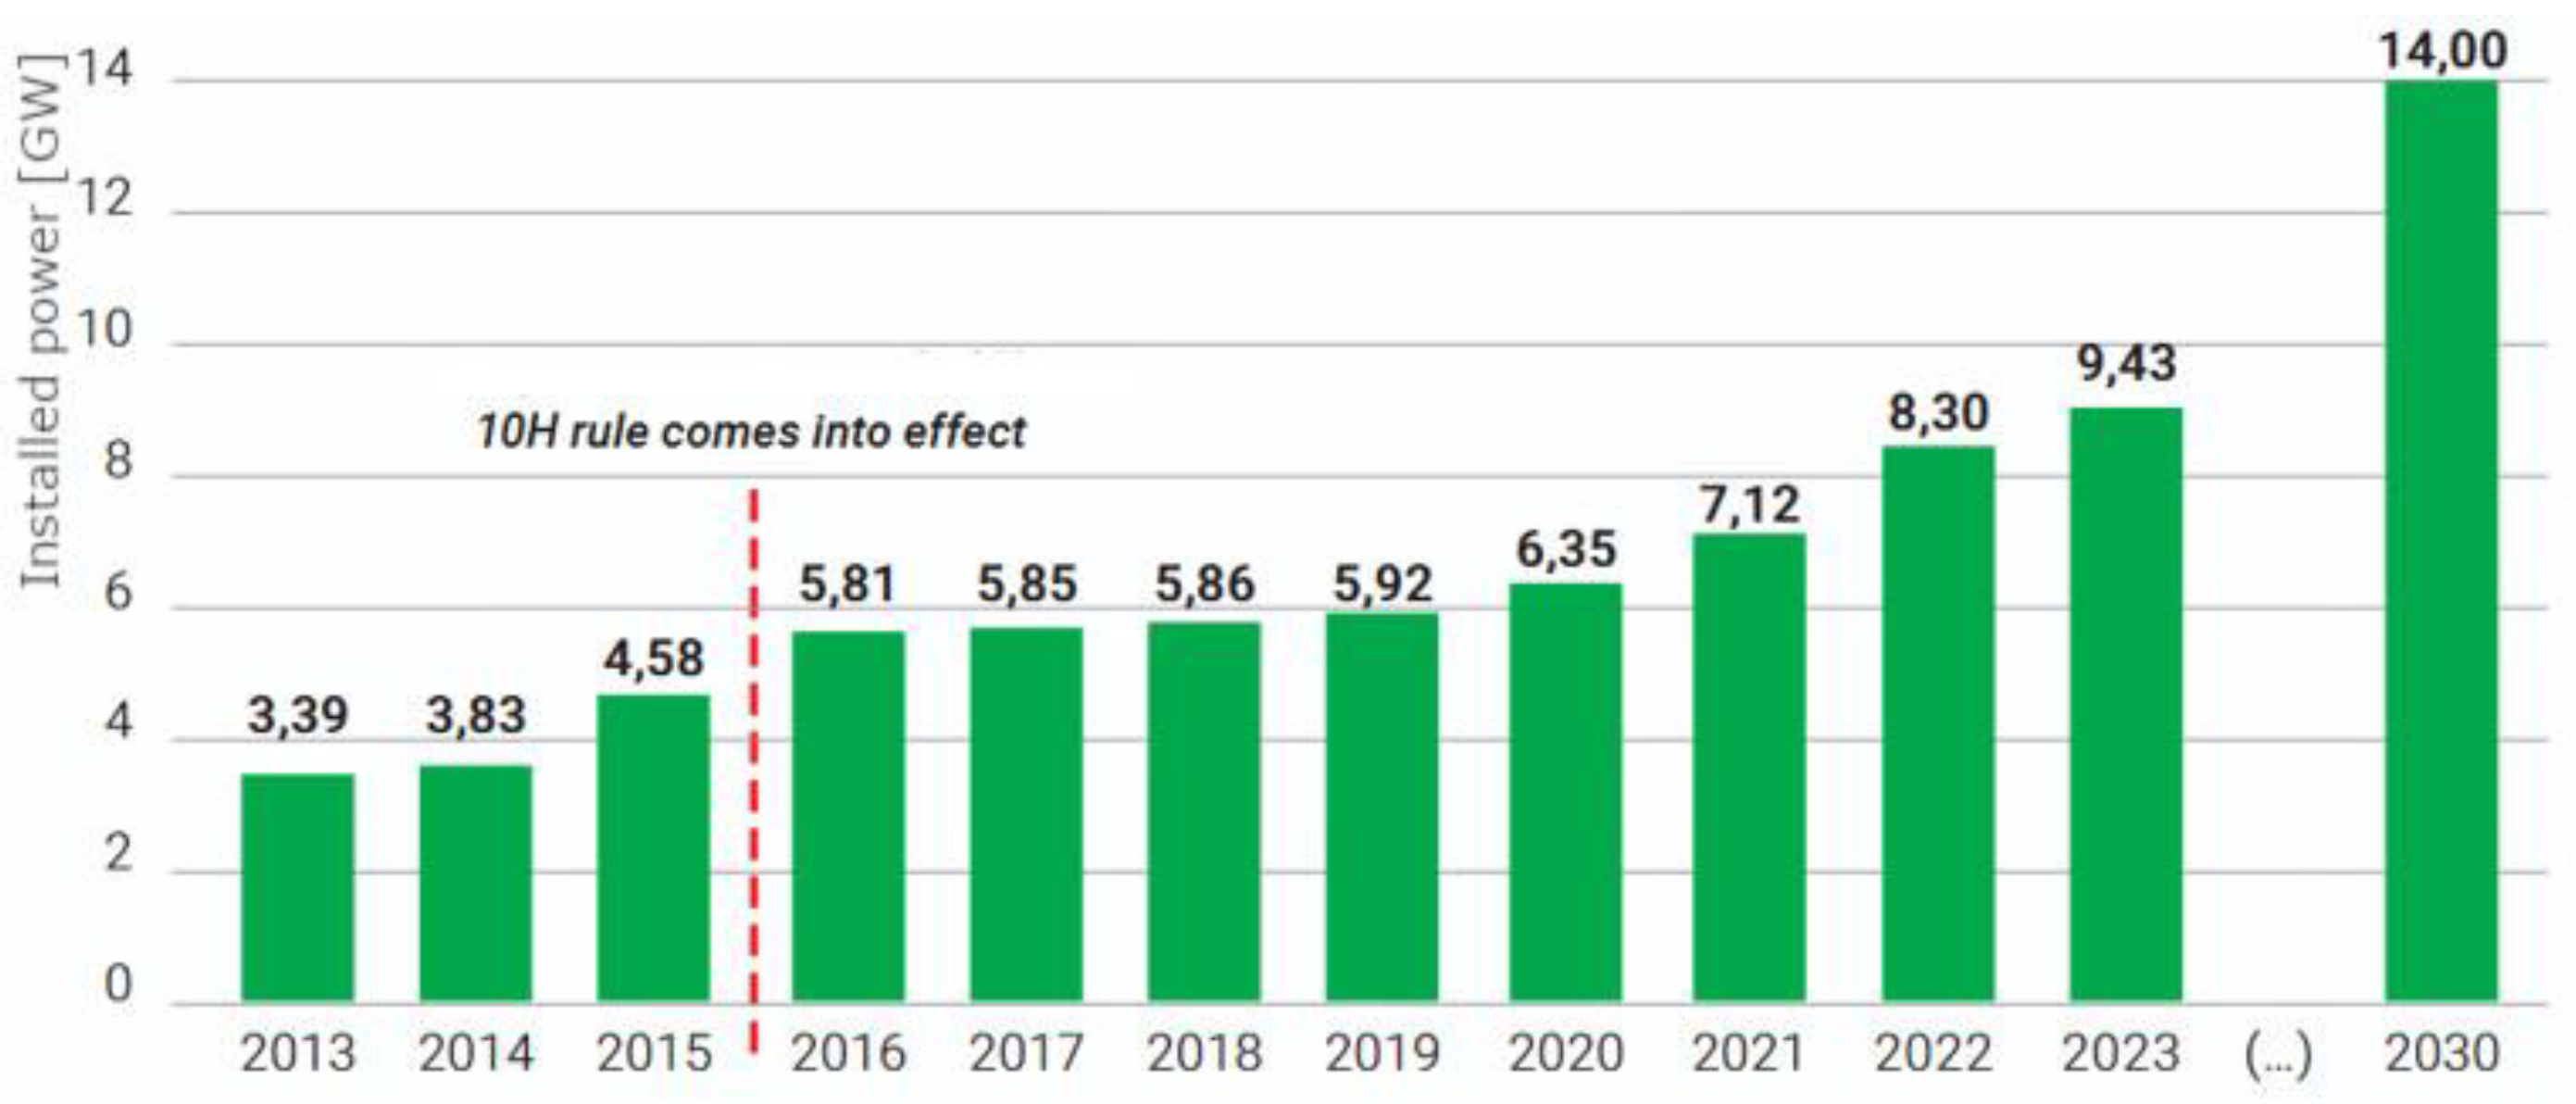
Figure 4.
Impact of the Starorypin wind farm at a distance of 700 m.
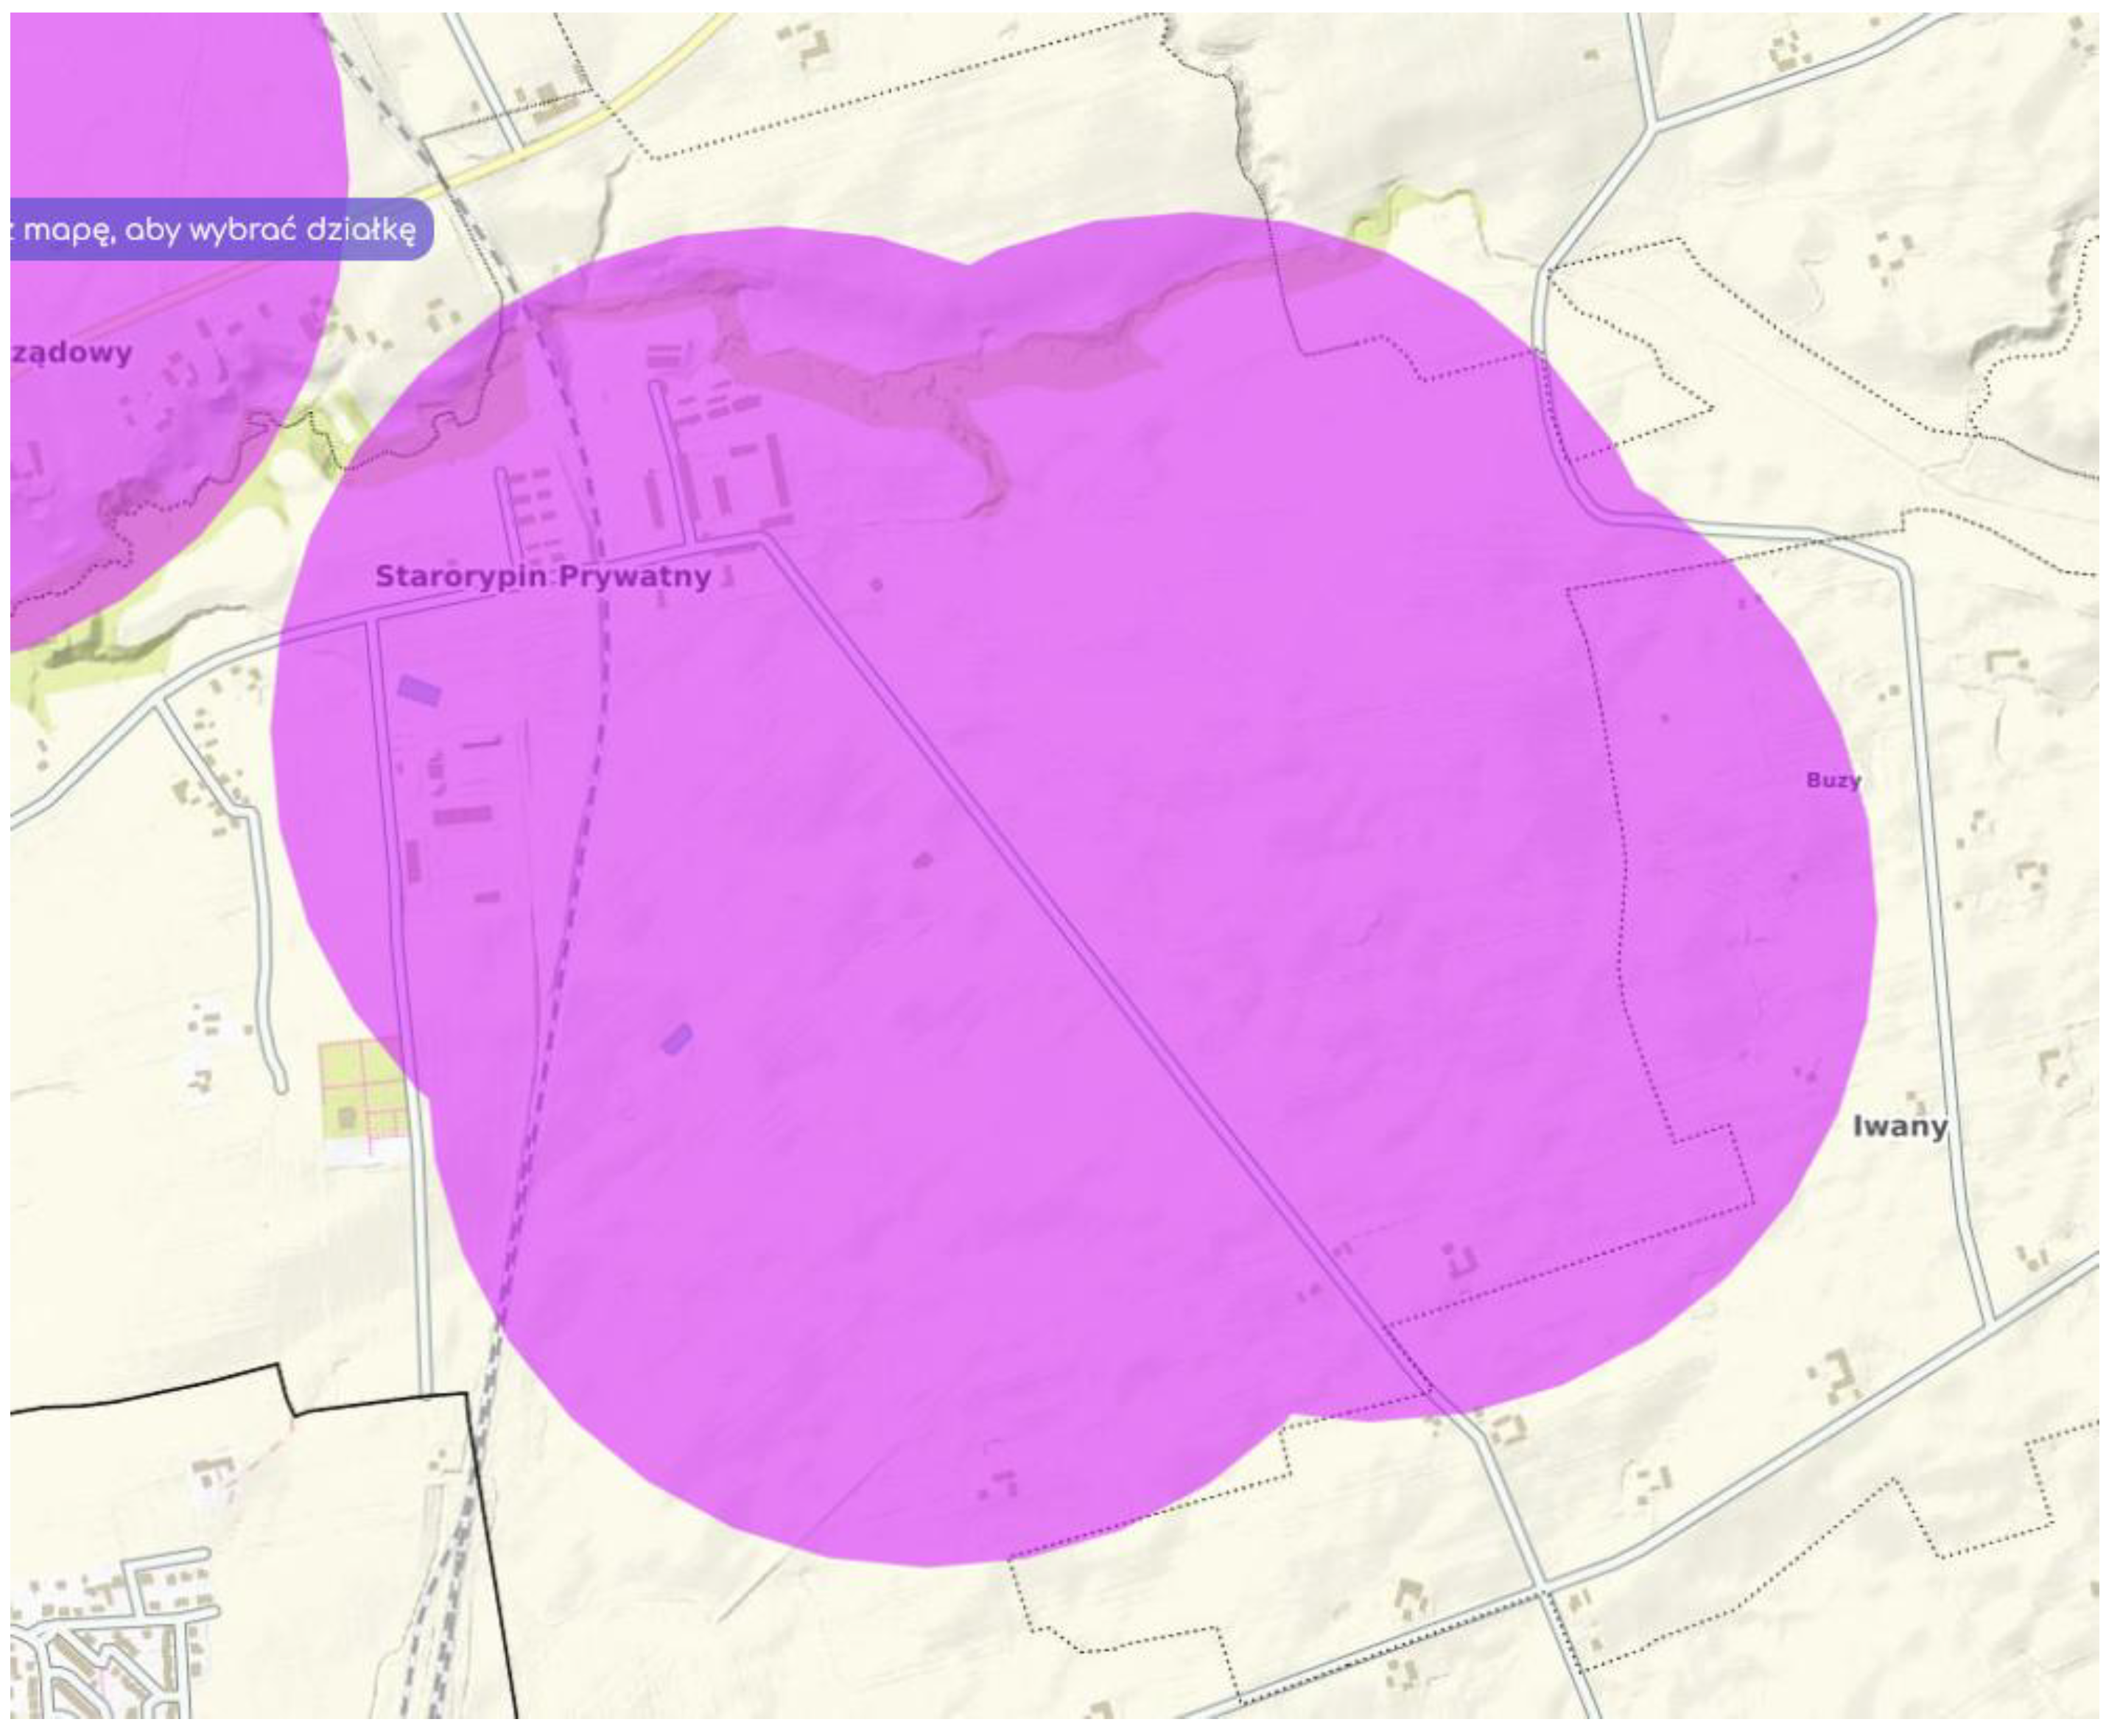

Table 1.
Comparison of some physicochemical properties of the tested fuels.
| Designation | Turbine Type | Tower Height |
|---|---|---|
| WT1 | Vensys 77/1500 | 100 m |
| WT2 | Vensys 77/1500 | 100 m |
| WT3 | Vestas V90-2.0 MW | 105 m |
Table 2.
Statistics of the linear regression model developed for individual weeks of 2024.
| Wind turbine | WT1 | WT2 | WT3 |
|---|---|---|---|
| Linear regresion model | Em=3347.39Vm– 9099.63 | Em=2733.16Vm-5533.92 | Em=5533.09Vm-20157.27 |
| Coefficient | Value of the coefficient | ||
| Correlation R | 0,94054 | 0,785112077 | 0,985528137 |
| R2 | 0,88461 | 0,616400973 | 0,971265709 |
| Adjusted R2 | 0,88235 | 0,608879423 | 0,970702292 |
| Standard error | 1793,16 | 3313,887893 | 1436,826085 |
| Number of observations | 53 | 53 | 53 |
Table 3.
Summary of regression analysis (ANOVA) for wind turbines.
| df | SS | MS | F | Significance F | |
|---|---|---|---|---|---|
| WT1 | Em = 3347.39 Vm – 9099.63 | ||||
| Regression | 1 | 125728 | 1,3E+09 | 391,014204 | 1,4322E-25 |
| Residual | 51 | 163987 | 3215437 | ||
| Total | 52 | 1421268 | |||
| WT2 | Em = 2733.16 Vm – 5533.92 | ||||
| Regression | 1 | 899977432,4 | 899977432,4 | 81,9513 | 3,4277E-12 |
| Residual | 51 | 560074501,2 | 10981852,97 | ||
| Total | 52 | 1460051934 | |||
| WT3 | Em = 5533.09 Vm – 20157.27 | ||||
| Regression | 1 | 3558903030 | 3558903030 | 1723,88284 | 5,512E-41 |
| Residual | 51 | 105287929,1 | 2064469,2 | ||
| Total | 52 | 3664190959 | |||
Table 4.
Results of the statistical analysis of the coefficients of the linear regression function developed for individual weeks of 2024.
Table 4.
Results of the statistical analysis of the coefficients of the linear regression function developed for individual weeks of 2024.
| Coefficient | Value of the coefficient |
Standard error |
t Stat | p- Value | Lower 95% | Upper 95% |
|---|---|---|---|---|---|---|
| WT1 | Em = 3347.39 Vm – 9099.63 | |||||
| a | 3347,387083 | 169,2815664 | 19,7741 | 1,4322E-25 | 3007,54016 | 3687,23401 |
| b | -9099,634354 | 1039,608629 | -8,75294 | 9,8663E-12 | -11186,736 | -7012,5329 |
| WT2 | Em = 2733.16 Vm – 5533.92 | |||||
| a | 2733,16 | 301,92 | 9,05 | 0,00 | 2127,04 | 3339,29 |
| b | -5533,92 | 1821,37 | -3,04 | 0,00 | -9190,47 | -1877,37 |
| WT3 | Em = 5533.09 Vm – 20157.27 | |||||
| a | 5513,09 | 132,78 | 41,52 | 0,00 | 5246,52 | 5779,66 |
| b | -20157,27 | 904,53 | -22,28 | 0,00 | -21973,18 | -18341,35 |
Disclaimer/Publisher’s Note: The statements, opinions and data contained in all publications are solely those of the individual author(s) and contributor(s) and not of MDPI and/or the editor(s). MDPI and/or the editor(s) disclaim responsibility for any injury to people or property resulting from any ideas, methods, instructions or products referred to in the content. |
© 2025 by the authors. Licensee MDPI, Basel, Switzerland. This article is an open access article distributed under the terms and conditions of the Creative Commons Attribution (CC BY) license (http://creativecommons.org/licenses/by/4.0/).
Copyright: This open access article is published under a Creative Commons CC BY 4.0 license, which permit the free download, distribution, and reuse, provided that the author and preprint are cited in any reuse.


