
Submitted:
01 December 2025
Posted:
03 December 2025
You are already at the latest version
Abstract
Speed prediction is fundamental to optimizing energy management strategies. Common evaluation metrics such as RMSE and MAE focus primarily on the numerical deviation between predicted and actual speeds. However, when applied to hybrid vehicle energy management strategy optimization, speed prediction models based on these metrics show a random deviation between energy consumption results and the theoretical optimal, indicating that these metrics are not effective in this application domain. To explore a more effective method for evaluating the practical application of speed prediction curves, this study uses multiple metrics to assess numerous speed prediction curves and analyses the correlation between each metric and the deviation from the optimal energy consumption during energy management strategy optimization. The results show that considering acceleration is more aligned with the needs of energy management strategy optimization than merely evaluating the proximity of speed values. Specifically, the standard deviation of the acceleration time ratio deviation performs better than traditional metrics like RMSE and MAE in distinguishing the effectiveness of speed prediction curves. The smaller the standard deviation of the acceleration time ratio deviation between the predicted and actual speed curves, the closer the energy consumption results of energy management based on the predicted speed curve are to the theoretical optimal.
Keywords:
vehicle speed prediction
; Predictive validity
; energy management
; evaluation indicators
; correlation analysis
1. Introduction
Vehicle speed prediction is the process of estimating or forecasting changes in vehicle speed over a future period by analyzing historical data, traffic flow models, and other relevant factors. Vehicle speed prediction information is the core foundation of vehicle predictive control technology and has broad application prospects in powertrain optimization and vehicle behavior optimization [1].
The development of machine learning and deep learning technologies has promoted the advancement of vehicle speed prediction methods [2]. Based on data-driven and deep learning approaches, various vehicle speed prediction models have been developed [3], which have effectively improved the insufficient accuracy of classical time-series prediction methods in vehicle speed prediction [4]. However, when applying vehicle speed prediction information to the predictive control of vehicles and powertrains, it is found that different application domains have different requirements for the results of vehicle speed prediction. In the optimization of hybrid system energy management strategies, the vehicle speed value represents the current energy demand state of the vehicle, while acceleration characterizes the change in the energy demand state. Both are crucial for hybrid energy management. Therefore, it is not only required that the predicted speed curve has a small overall numerical deviation from the actual speed curve but also that it can accurately predict the changing trend of vehicle speed [5]. However, existing indicators used to evaluate the effect of vehicle speed prediction, such as RMSE and MAE, only assess the distance between the predicted speed values and the actual values [6] and cannot reflect the characteristics of the changing trend of vehicle speed. Figure 1 shows a comparison of the shapes of two predicted speed curves with the same MAE (both 0.184 km/h) relative to the actual speed curve. It is evident that predicted speed curve 2 is closer to the actual speed curve in terms of shape similarity. The reason for this phenomenon is that when calculating MAE, only the numerical difference between the two curves at each moment is considered, completely ignoring the degree of shape similarity between the speed curves. In predictive energy management strategies, the main value of the predicted speed curve is to adjust the selection and distribution of power links based on it to reduce energy consumption [7]. This leads to the problem that the optimal predicted speed curve evaluated based on MAE may result in poor energy consumption performance or even a significant deviation from the theoretical optimal value when applied to the predictive energy management of vehicle powertrains. Similar situations also occur when using RMSE and R² for evaluation. Therefore, evaluation indicators that rely solely on the numerical distance between curves without considering the application background of predictive energy management have similar issues. To address the gap between this application demand and the capability of existing evaluation indicators, it is necessary to conduct an in-depth analysis of whether there is a stable trend consistency between the deviation of energy consumption from the theoretical optimal energy consumption after applying the predicted speed curves developed based on various evaluation indicators to the power distribution of energy management strategies and the values of each evaluation indicator. Furthermore, it is essential to explore more reasonable evaluation indicators that meet the needs of energy consumption optimization, that is, to carry out research on the effectiveness evaluation method of vehicle speed prediction.
2. Introduction to the Research Method for Evaluating the Effectiveness of Predicted Vehicle Speed Curves
2.1. Overall Framework of the Research Method
The work of evaluating the effectiveness of predicted vehicle speed curves includes three steps: 1) obtaining predicted vehicle speed curves from different vehicle speed predictors to form basic data; 2) establishing an objective evaluation method for the application effect of predicted vehicle speed curves; 3) evaluating the effectiveness of the evaluation indicators used in the development of the current predicted speed curves based on the correlation analysis results between the application effect of the predicted speed curves and the evaluation indicators of the predicted curves; 4) exploring more effective evaluation indicators for use in the research of predictive energy management strategies.
The logical framework of the research work is shown in Figure 2, and the specific content of each work step is described as follows.
Obtaining predicted speed curves with different prediction levels is the basis of this study. To construct a relatively fair comparison basis, the development of vehicle speed prediction models was carried out based on a passenger car driving database provided by a cooperative enterprise. This database includes information such as vehicle speed, acceleration, and pedal opening. A variety of constructed vehicle speed predictors were trained using this information, and the introduction of each vehicle speed predictor is provided in Section 2.2.1.
To avoid the impact of differences in the capabilities of energy management strategies themselves on the effect of energy consumption optimization during the process of optimizing powertrain energy distribution, in this study, dynamic programming algorithm and rolling optimization algorithm were used for energy management of the powertrain based on the actual speed curve and the predicted speed curve, respectively. The specific descriptions of these two optimization algorithms are given in Section 2.3.2. These two optimization algorithms can calculate the theoretical optimal energy consumption when energy management is performed using the actual speed curve and the execution energy consumption when energy management is performed using the predicted speed curve, respectively. Then, the relative energy consumption deviation is calculated based on the deviation between the theoretical optimal energy consumption and the execution energy consumption. The relative energy consumption deviation is used to characterize the effectiveness of the predicted speed curve, thereby reducing the impact of the energy management strategy during the research process. The definition of the relative energy consumption deviation is provided in Section 2.3.3.
Correlation analysis was conducted between the values of different evaluation indicators corresponding to the predicted speed curves and the relative energy consumption deviation to evaluate the effectiveness of the currently used evaluation indicators for predicted speed curves. On this basis, further exploration was made into highly effective evaluation indicators for predicted speed curves for use in the research of predictive energy management strategies.
2.2. Preparation of Predicted Vehicle Speed Curves
To obtain predicted vehicle speed curves, data was collected from a certain commuting route for 7 days, with a daily driving distance of 52 ± 1 km. These routes were randomly selected as target speed curves, and corresponding predicted speed curves were obtained through trained LSTM[8], GRU[9], and TCN[10] speed predictors, respectively.
2.2.1. Acquisition of Predicted Vehicle Speed Curves
Since the focus of this study is on obtaining evaluation indicators for predicted speed curves, the above-mentioned speed predictors adopted classical architectures in their development and were trained using a database containing 35,840 seconds of real vehicle data provided by the cooperative enterprise. Using the trained speed predictors and the target speed curves collected from the real vehicles mentioned above, the speed prediction results of different speed predictors were obtained as shown in Figure 3.
To cover all characteristics of the object during motion and enhance applicability, the real speed curves and predicted speed curves were divided into 8 complete kinematic segments according to the complete process of stationary-acceleration-driving-deceleration-parking in the study, as shown in Figure 4.
2.2.2. Analysis of Vehicle Speed Prediction Results
Two commonly used statistical indicators, MAE and RMSE, were selected for analyzing the vehicle speed prediction results [11]. It is generally believed that smaller values of MAE and RMSE indicate better vehicle speed prediction results [12]. The specific calculation formulas for RMSE and MAE are shown in equations (1) and (2).
In the above equations,is the predicted vehicle speed at time i within the prediction period, is the actual vehicle speed at time i within the prediction period, is the average of the actual vehicle speeds within the prediction period, and is the number of vehicle speed data points within the prediction period.
The RMSE and MAE results between the predicted speed and the actual speed in each prediction domain at all times within each segment were averaged, and finally, the distribution results of the average RMSE and MAE of different predicted speed curves for each segment are shown in Figure 5.
From the RMSE and MAE distribution results of all segments presented in Figure 5, it can be observed that the aforementioned vehicle speed predictor exhibits a small prediction deviation in most scenarios. Its error levels are concentrated, and the proportion of extreme deviations is low, which demonstrates that the predictor possesses high basic prediction accuracy.
2.3. Acquisition of Energy Consumption Deviation Data
By applying the obtained predicted speed curves and actual speed curves to the predictive energy management strategy of hybrid systems, the execution energy consumption based on the predicted speed curves and the theoretically achievable optimal energy consumption based on the actual speed curves can be obtained. The degree of deviation between the two, namely the relative energy consumption deviation, is used as the basis for judging the effectiveness of the predicted speed curves in practical applications.
2.3.1. Hybrid Vehicle Simulation Platform and Predictive Energy Management Strategy
The existing, verified and highly accurate PHEV model in the previous research is taken as the object model for the energy management strategy based on MPC, as shown in Figure 6 [13]. The structure of this model is as follows: MPC can generate reference information within a short time domain by establishing a predictive model of the controlled object, and constrain the value ranges of input and output variables within the feasible domain. Eventually, the global optimization problem is transformed into a local optimal problem.
2.3.2. Acquisition of Theoretical Optimal Energy Consumption and Execution Energy Consumption
DP algorithm[14] is a numerical optimization method that finds the global optimal solution through time-reversal operation. The DP algorithm gradually solves the local optimal solution for each stage and stores the intermediate results. Eventually, by gradually accumulating energy consumption and comparing the results of different paths, the global optimal energy consumption plan from the starting point to the destination is found. This process ensures that the energy consumption results obtained through the DP algorithm for the entire process of real vehicle speed offline global energy management are optimal, that is, the optimal energy consumption results that can be theoretically achieved.
When applying the predicted vehicle speed results to perform energy management calculations and execute energy consumption, since global vehicle speed information cannot be obtained, it is necessary to convert the global optimization problem into a local optimal problem and perform local optimal energy management for the system [15]. The specific process is shown in Figure 7.
Among them, k+1— k+p respectively represent the control time domain and the prediction time domain; is the reference trajectory; is the deviation term between the output and the reference trajectory. At each
During the time domain of vehicle speed prediction, solve the control sequence that minimizes the energy consumption function, and apply the first value of this control sequence to the system to obtain the actual output of the system. Then, use this as feedback to correct the deviation of the prediction model and achieve local energy management for the vehicle within the prediction time domain. The prediction and control are repeatedly carried out at each time step to form a rolling optimization process.
Based on the real vehicle speed curve of each segment and using the DP algorithm, perform global energy management for the power system, obtaining the theoretical optimal energy consumption corresponding to each real vehicle speed curve segment; using the rolling optimization method, perform local optimal energy management for the power system based on the predicted vehicle speed curve, obtaining the execution energy consumption corresponding to each predicted vehicle speed curve segment. Finally, the energy consumption results for each segment are as shown in Table 1.
2.3.3. Relative Energy Consumption Deviation
In the real-time energy management of the powertrain using predicted vehicle speeds, since global speed information cannot be obtained, the execution energy consumption of local optimal energy management of the powertrain based on predicted speeds cannot reach the theoretically optimal energy consumption and will be greater than the theoretical optimal energy consumption. As shown in Table 1, the execution energy consumption of the predictors for segments 1 and 2 even exceeds 200% of the theoretical optimal energy consumption. Based on the characteristic that the execution energy consumption is higher than the theoretical optimal energy consumption, when objectively evaluating the effectiveness of the vehicle speed prediction results, the theoretical optimal energy consumption can be selected as the energy consumption benchmark. When energy management is performed based on predicted speeds, the closer the execution energy consumption is to the theoretical optimal energy consumption, the better the execution energy consumption result, and it also indicates that the application of the vehicle speed prediction result to the energy management of the powertrain is more effective. To quantify the effectiveness of vehicle speed prediction, the indicator of relative energy consumption deviation was selected. The relative energy consumption deviation is the deviation between the execution energy consumption and the theoretical optimal energy consumption, and its specific calculation method is shown in equation (3).
In the above equation, is the relative energy consumption deviation between the theoretical optimal energy consumption and the execution energy consumption, is the theoretical optimal energy consumption corresponding to the actual speed in each prediction period, and is the execution energy consumption corresponding to the predicted speed in each prediction period. According to the definition of relative energy consumption deviation in equation (3), the closer is to 0, the closer the execution energy consumption is to the theoretical optimal energy consumption, and the higher the effectiveness of applying the vehicle speed prediction result to the energy management of the powertrain.
The relative energy consumption deviation results for each segment are shown in Table 2. The closer the relative energy consumption deviation result is to 0, the better the effectiveness of the vehicle speed prediction method in that segment.
3. Analysis of Effectiveness Evaluation of Vehicle Speed Prediction Results
3.1. Correlation Analysis of Vehicle Speed Prediction Result Evaluation Indicators
After obtaining the relative energy consumption deviation results, correlation analysis was conducted between the evaluation indicators and the relative energy consumption deviation. By comparing the correlation between the evaluation indicators and the relative energy consumption deviation, it was determined which indicator has a stronger correlation with the relative energy consumption deviation and is more suitable as an evaluation indicator for the effectiveness of vehicle speed prediction.
3.1.1. Pearson Correlation Coefficient
To determine the strength of the correlation between the evaluation indicators and the relative energy consumption deviation, the Pearson correlation coefficient [16] was selected as the basis for judging the strength of the correlation. The Pearson correlation coefficient is a statistical measure used to quantify the linear correlation between two variables, and its specific calculation method is shown in equation (4).
Where, represents the Pearson coefficient, and its value ranges from -1 to 1. The sign of indicates whether the two variables are positively or negatively correlated, and the magnitude of r represents the strength of the correlation. The closer the absolute value is to 1, the stronger the correlation between the two variables; the closer to 0, the weaker the correlation. X and Y are the values of the two variables, respectively, and , are the means of X and Y, respectively.
Based on the RMSE, MAE, and relative energy consumption deviation results obtained in Sections 1.2.2 and 1.3.3, correlation analysis was performed using the Pearson correlation coefficient, and the distribution of relative energy consumption deviation with RMSE and MAE, as well as the correlation results, are shown in Figure 8.
It can be seen from Figure 8 that the relationship between the traditional statistical indicators RMSE, MAE, and the relative energy consumption deviation shows a relatively scattered distribution, with Pearson correlation coefficients of 0.18 and 0.16, respectively. This indicates that the correlation between these indicators and the relative energy consumption deviation is weak, so the RMSE and MAE indicators cannot effectively reflect the application effect of the predicted speed curves, and their effectiveness in evaluating the effectiveness of the predicted speed curves in the application scenario of energy management strategies is poor.
3.1.2. Pearson Correlation Coefficient
To further explore indicators that can effectively evaluate the vehicle speed prediction results, the correlation between similarity indicators and vehicle speed characteristic indicators and the relative energy consumption deviation was further analyzed.
Similarity indicators refer to metrics used to measure the degree of similarity between two or more datasets when comparing them. In this study, three commonly used distance indicators, namely Euclidean distance, Manhattan distance, and Chebyshev distance, were selected for vehicle speed similarity indicators. Smaller values of these three distance indicators indicate that the predicted curve is more similar to the actual curve. The specific calculation formulas for Euclidean distance, Manhattan distance, and Chebyshev distance are shown in equations (5) to (7).
In the above equations,, and are Euclidean distance, Manhattan distance, and Chebyshev distance, respectively. is the predicted vehicle speed at time within the prediction period, is the actual vehicle speed at time within the prediction period, and is the number of vehicle speed data points within the prediction period.
The results of Euclidean distance, Manhattan distance, and Chebyshev distance between the predicted speed and the actual speed in each prediction domain at all times within each divided segment were averaged, and correlation analysis was performed between the average indicator results and the relative energy consumption. Finally, the normalized distribution of the relative energy consumption deviation and distance indicators for each segment and the correlation results between them are shown in Figure 9.
For vehicle speed characteristic indicators, average speed, maximum speed, acceleration time proportion, and deceleration time proportion were selected for correlation analysis with the relative energy consumption deviation. Among them, average speed and maximum speed can reflect to a certain extent whether the vehicle is driving at a low or high speed on the road over a period of time; while acceleration time proportion and deceleration time reflect whether the vehicle is in an accelerating, decelerating, or idling state overall over a period of time. To eliminate the impact of data magnitude and more intuitively measure the relative impact of vehicle speed characteristic deviations, after calculating the above indicators for predicted and actual speeds, the relative deviation between them was further calculated, and the specific calculation method is shown in equation (8).
In the above equation, is the relative deviation between the predicted speed indicator and the actual speed indicator in the prediction period, is the actual speed indicator in each prediction period, and is the predicted speed indicator in each prediction period.
The average of the relative deviations of the vehicle speed characteristic indicators between the predicted speed and the actual speed at all times within each segment was calculated, and correlation analysis was performed between the average indicator results and the relative energy consumption. Finally, the normalized distribution of the relative energy consumption deviation and speed characteristic indicators for each segment and the correlation results between them are shown in Figure 10.
By comparing the correlation results between each evaluation indicator and the relative energy consumption deviation in Figure 8 to Figure 10, it was found that among the vehicle speed performance indicators, maximum speed, acceleration time proportion, and deceleration time proportion have higher correlations with the relative energy consumption deviation. The correlation between acceleration time proportion and relative energy consumption deviation is 0.34, indicating a weak correlation between them. Further, the standard deviation of the deviation in acceleration time proportion between the predicted speed and the actual speed at all times within each segment was calculated, and correlation analysis was performed between the results and the relative energy consumption deviation. The distribution of the results and the correlation results are shown in Figure 11.
As can be seen from Figure 11, the correlation coefficient between the deviation of acceleration time proportion and relative energy consumption is only 0.34, while the correlation coefficient between the standard deviation of the deviation of acceleration time proportion and the deviation of relative energy consumption reaches 0.51. Moreover, its distribution also has a better trend. Therefore, the standard deviation of the deviation of acceleration time proportion is more suitable for judging the effect of reducing energy consumption when predicting the vehicle speed of the application, that is, it is more suitable for evaluating the effectiveness of vehicle speed prediction.
3.2. Correlation Analysis of Vehicle Speed Prediction Result Evaluation Indicators
3.2.1. Trend Consistency Verification
Since the correlation coefficient between the standard deviation of the deviation in acceleration time proportion and the relative energy consumption deviation is 0.51, indicating only a moderate correlation between them, to further verify that the standard deviation of the deviation in acceleration time proportion can evaluate the effectiveness of vehicle speed prediction to a certain extent, data on the standard deviation of the deviation in acceleration time proportion, RMSE, MAE, and relative energy consumption deviation were randomly selected, as shown in Figure 12.
It can be seen from the above figure that in the randomly selected data, as the standard deviation of the deviation in acceleration time proportion decreases, the relative energy consumption deviation approaches 0. In contrast, there is no monotonic relationship between RMSE, MAE, and relative energy consumption deviation. Therefore, the standard deviation of the deviation in acceleration time proportion can better evaluate the effectiveness of vehicle speed prediction than RMSE and MAE. Combined with the characteristic that the closer the relative energy consumption deviation is to 0, the better the effectiveness of vehicle speed prediction, the smaller the standard deviation of the deviation in acceleration time proportion, the more effective the vehicle speed prediction result.
Combined with the characteristics of the standard deviation of the deviation in acceleration time proportion, it can be considered that when there is a deviation in the acceleration time proportion between the predicted speed and the actual speed, the more stable this deviation is, i.e., the smaller the fluctuation of the deviation in the acceleration state between the predicted speed curve and the actual speed curve, and the more similar the overall trend between the two curves, the lower the final energy consumption of energy management based on it, and the more effective the vehicle speed prediction result.
3.2.2. Energy Consumption Result Verification
To further verify the effectiveness of the standard deviation of the deviation in acceleration time proportion as an indicator for evaluating vehicle speed prediction results, this indicator was incorporated into the loss function of the vehicle speed predictor to construct an improved vehicle speed predictor. The improved predictor reduces the standard deviation of the deviation in acceleration time proportion between the predicted speed and the actual speed through the gradient backpropagation process of the loss function. The new execution energy consumption was obtained by combining the predicted speed of the improved predictor with the rolling optimization method. By comparing the execution energy consumption results of the original vehicle speed predictor and the improved vehicle speed predictor, the improvement effect of the standard deviation of the deviation in acceleration time proportion on the effectiveness of the vehicle speed predictor was judged. The execution energy consumption results of the GRU vehicle speed predictor and the improved GRU vehicle speed predictor are shown in Table 3.
It can be seen from Table 3 that the predicted speed results of the improved GRU vehicle speed predictor, which incorporates the standard deviation of the deviation in acceleration time proportion, achieve energy reduction in segments 2 to 6. The maximum energy saving in segment 2 is 13.75g, with an energy-saving rate of 17.45% compared to the GRU vehicle speed predictor, and the increase in execution energy consumption of the improved GRU compared to the GRU execution energy consumption relative to the theoretical optimal energy consumption is 43.18%. However, in segments 1, 7, and 8, the predicted speed results of the improved GRU vehicle speed predictor did not reduce the final energy consumption but increased it instead. Further analysis was conducted in combination with the mileage characteristics of each segment, and the mileage characteristics of each segment are shown in Figure 13.
It can be seen from Figure 13 that the driving mileage of segments 2 to 6 is more than 1.5 km, while the driving mileage of segments 1, 7, and 8 is less than 0.85 km. For short-distance segments such as segments 1, 7, and 8, the instantaneous fluctuation of vehicle speed directly affects the final energy consumption result, and the standard deviation of the deviation in acceleration time proportion may not fully consider the energy consumption of these instantaneous fluctuations, ultimately leading to higher execution energy consumption of the improved GRU. In contrast, in other segments with longer mileage, the application of the improved GRU vehicle speed predictor incorporating the standard deviation of the deviation in acceleration time proportion can achieve energy reduction. This indicates that the standard deviation of the deviation in acceleration time proportion can not only effectively evaluate the application results of predicted speed curves but also improve the performance of predictors for longer mileage vehicle speed prediction, thus being a more effective evaluation indicator.
The acceleration time proportion, as an evaluation indicator, shows obvious advantages over traditional indicators, providing support for further research on the effectiveness of evaluation indicators. However, it is evident that the acceleration time proportion still has shortcomings as an evaluation indicator. Therefore, the development of evaluation indicators with stronger adaptability and effectiveness requires extensive and continuous exploration.
4. Results
In this study, by building vehicle speed predictors and powertrain energy management strategies, based on multiple known complete speed curves, vehicle speed prediction and powertrain energy management were performed respectively to obtain predicted speed curves and relative energy consumption deviation results. Then, statistical indicators, similarity indicators, and characteristic indicators corresponding to the vehicle speed prediction results were calculated, and correlation analysis was conducted between these indicators and the relative energy consumption deviation results, leading to the following conclusions:
- By comparing the deviation between the execution energy consumption of the predicted speed curve and the theoretical optimal energy consumption, it was found that the traditional statistical indicators RMSE and MAE have only 0.18 and 0.16 correlations with the relative energy consumption deviation results, showing poor effectiveness. Moreover, vehicle speed characteristic indicators such as acceleration time proportion and deceleration time proportion have higher correlations with the relative energy consumption deviation than these two indicators. Among them, the correlation coefficient between the standard deviation of the deviation in acceleration time proportion and the relative energy consumption deviation is 0.51, indicating a moderate positive correlation between them.;
- By comparing and verifying the trend relationship between the standard deviation of the deviation in acceleration time proportion, RMSE, MAE, and the relative energy consumption deviation, it was found that the standard deviation of the deviation in acceleration time proportion has a consistent trend with the relative energy consumption deviation, while RMSE and MAE have no relevant trend with the relative energy consumption deviation, further indicating that the standard deviation of the deviation in acceleration time proportion has better effectiveness in evaluating the application effect of predicted speed curves;
- By applying the standard deviation of the deviation in acceleration time proportion to the construction of vehicle speed predictors, it was found that the execution energy consumption of the speed prediction curves provided by the improved predictor shows a significant improvement trend in long-distance driving, further indicating that this indicator has stronger effectiveness.
Author Contributions
Conceptualization, C.S. and T.C.; methodology, C.S. and T.C.; validation, C.S. and T.C.; formal analysis, C.S. and T.C.; investigation, C.S. and T.C.; resources, C.S. and T.C.; data curation, D.C, C.S. and T.C; writing—original draft preparation, C.S. and G.C.; writing—review and editing, C.S., G.C. and M.Z.; visualization, C.S.; supervision, C.S., G.C. and M.Z.; project administration, T.C.; funding acquisition, T.C. All authors have read and agreed to the published version of the manuscript.
Funding
This study is supported by t National Key Research and Development Program Intergovernmental Key Project For International Science and Technology Innovation Cooperation(2024YFE0107700),Guangxi Science and Technology Major Project (2023AA11008).
Data Availability Statement
The raw data supporting the conclusions of this article will be made available by the authors on request.
Conflicts of Interest
The authors declare no conflicts of interest.
Abbreviations
The following abbreviations are used in this manuscript:
| RMSE | Root mean square error |
| MAE | Root mean square error |
| R² | R-square |
| LSTM | Linear dichroism |
| GRU | Gated recurrent unit |
| TCN | Temporal convolutional network |
| DP | Dynamic programming |
References
- Hou, J.; Yao, D.; Wu, F.; Shen, J.; Chao, X. Online Vehicle Velocity Prediction Using an Adaptive Radial Basis Function Neural Network. IEEE Transactions on Vehicular Technology 2021, vol. 70, 3113–3122. [Google Scholar] [CrossRef]
- Zhang Huiyang. Research and Implementation of Road Speed Prediction Algorithm based on Deep Learning [D]. Beijing University of Posts and Telecommunications, 2020.
- Huang, W H; Song, G J; Hong, H K. Deep architecture for traffic flow prediction:deep belief networks with multitask learning[J]. IEEE Transactions on Intelligent Transportation Systems 2014, 15(5), 2191–2201. [Google Scholar] [CrossRef]
- Lin, C. -C.; Wang, M. -S. "Vehicle speeding early warning model using frame feature detection and HMM," 2011 IEEE 15th International Symposium on Consumer Electronics (ISCE), Singapore, 2011, pp. 241-244. Singapore, 2011, 241–244.
- Kadechkar and X. Llauradó, "AI-Enhanced Velocity Prediction for Efficient EV Energy Management with Hybrid Storage," 2024 12th International Conference on Smart Grid (icSmartGrid), Setubal, Portugal, 2024, pp. 659-665. 659–665.
- Karunasingha, Dulakshi Santhusitha Kumari. Root mean square error or mean absolute error? Use their ratio as well. Information Sciences 2022, 585, Pages 609–629. [Google Scholar] [CrossRef]
- Sun, C.; Hu, X.; Moura, S.J. Velocity Predictors for Predictive Energy Management in Hybrid Electric Vehicles. IEEE Trans. Control Syst. Technol. 2015, 23, 1197–1204. [Google Scholar] [CrossRef]
- Hochreiter, S; Schmidhuber, J. Long short-term memory[J]. Neural computation 1997, 9(8), 1735–1780. [Google Scholar] [CrossRef] [PubMed]
- Cho, K; Van Merriënboer, B; Gulcehre, C; et al. Learning phrase representations using RNN encoder-decoder for statistical machine translation[J]. arXiv 2014, arXiv:1406.1078. [Google Scholar]
- Hu, Z.; Sun, R.; Shao, F.; Sui, Y. An Efficient Short-Term Traffic Speed Prediction Model Based on Improved TCN and GCN[J]. Sensors 2021, 21, 6735. [Google Scholar] [CrossRef] [PubMed]
- Kim, D.; Khalil, A.; Nam, H.; Kwon, J. OPEMI: Online Performance Evaluation Metrics Index for Deep Learning-Based Autonomous Vehicles[J]. IEEE Access 2023, vol. 11, 16951–16963. [Google Scholar] [CrossRef]
- Chai, Tianfeng; Draxler, Roland R. Root mean square error (RMSE) or mean absolute error (MAE)? – Arguments against avoiding RMSE in the literature. Geoscientific Model Development 2014, 7, 1247–1250. [Google Scholar] [CrossRef]
- Jin Yuanyang, Chen Tao, Chen Daxin, et al. A Predictive PHEV Energy Management Strategy Based on GRU and Enhanced Dynamic Programming[C]. 2022 6th CAA International Conference on Vehicular Control and Intelligence (CVCI). Nanjing: IEEE, 2022: 1-6.
- Bertsekas D. Dynamic programming and optimal control: Volume I[M]. Athena scientific, 2012. 2012.
- Richalet, J; Rault, A; Testud, J L; et al. Model predictive heuristic control[J]. Automatica (journal of IFAC) 1978, 14(5), 413–428. [Google Scholar] [CrossRef]
- SCHOBER, P; BOER, C; SCHWARTE, L A. Correlation coefficients appropriate use and interpretation[J]. Anesthesia and Analgesia 2018, 126(5), 1 763–1 768. [Google Scholar] [CrossRef] [PubMed]
Figure 1.
10s' speed segment on a data set.
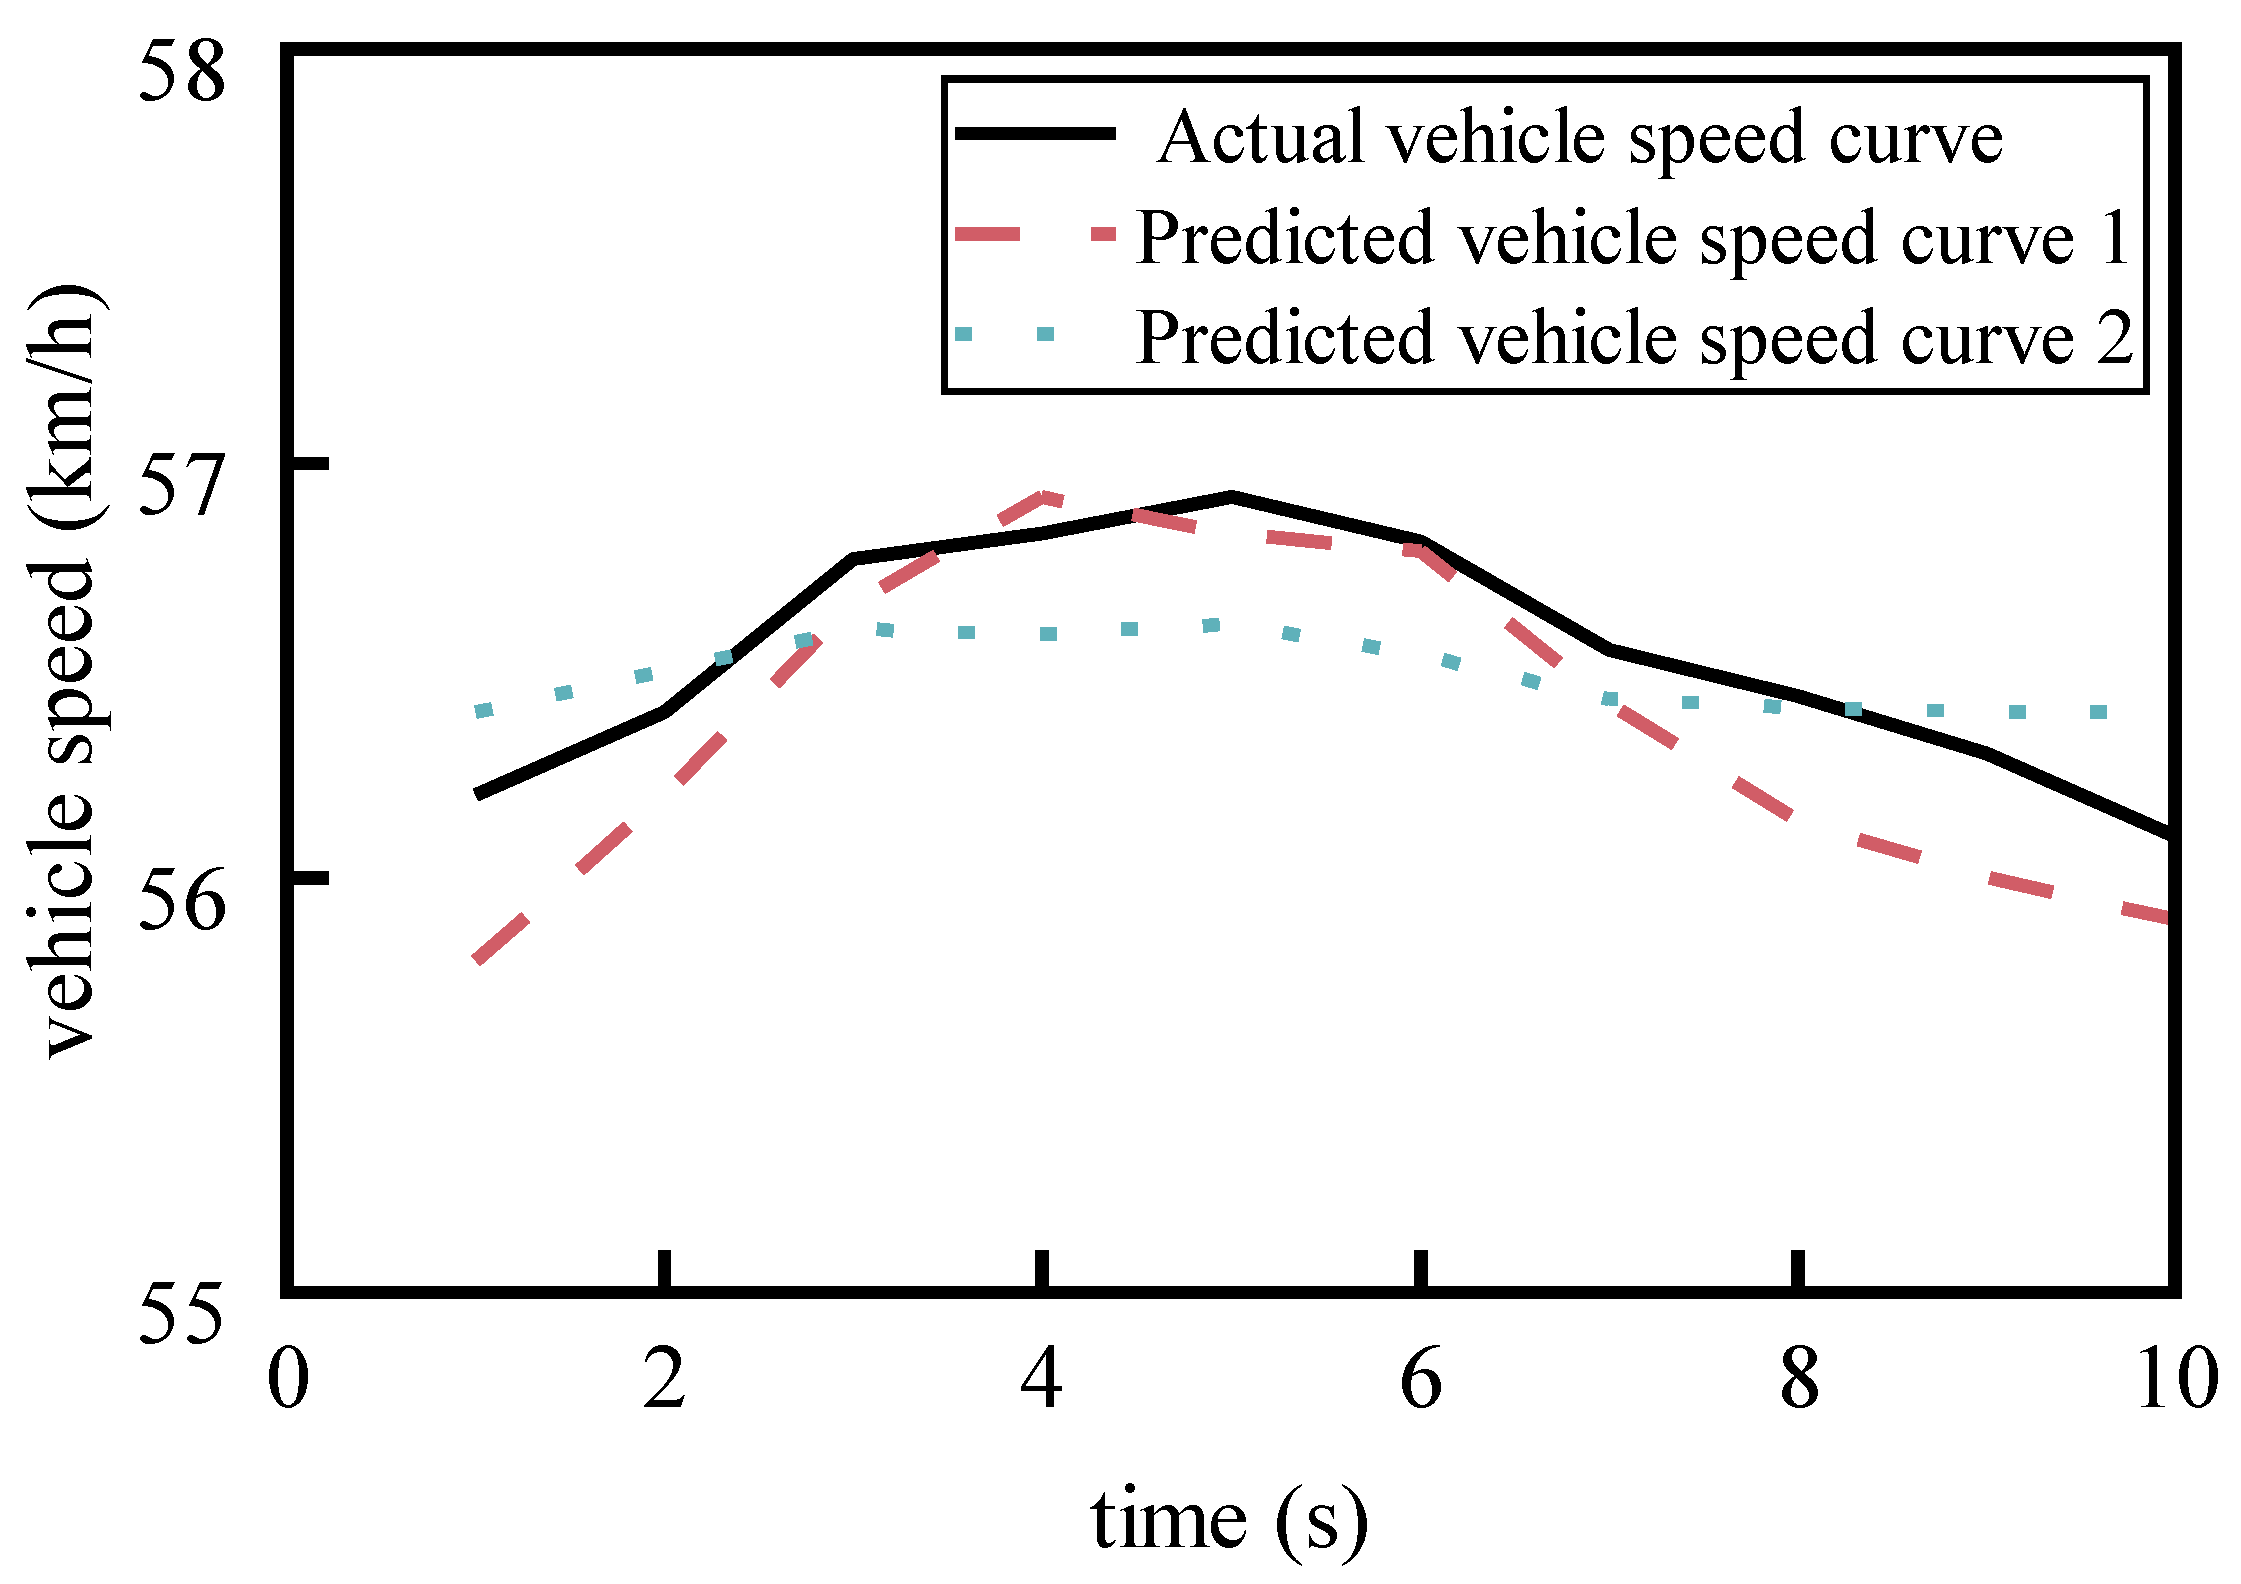
Figure 2.
Research content framework diagram.
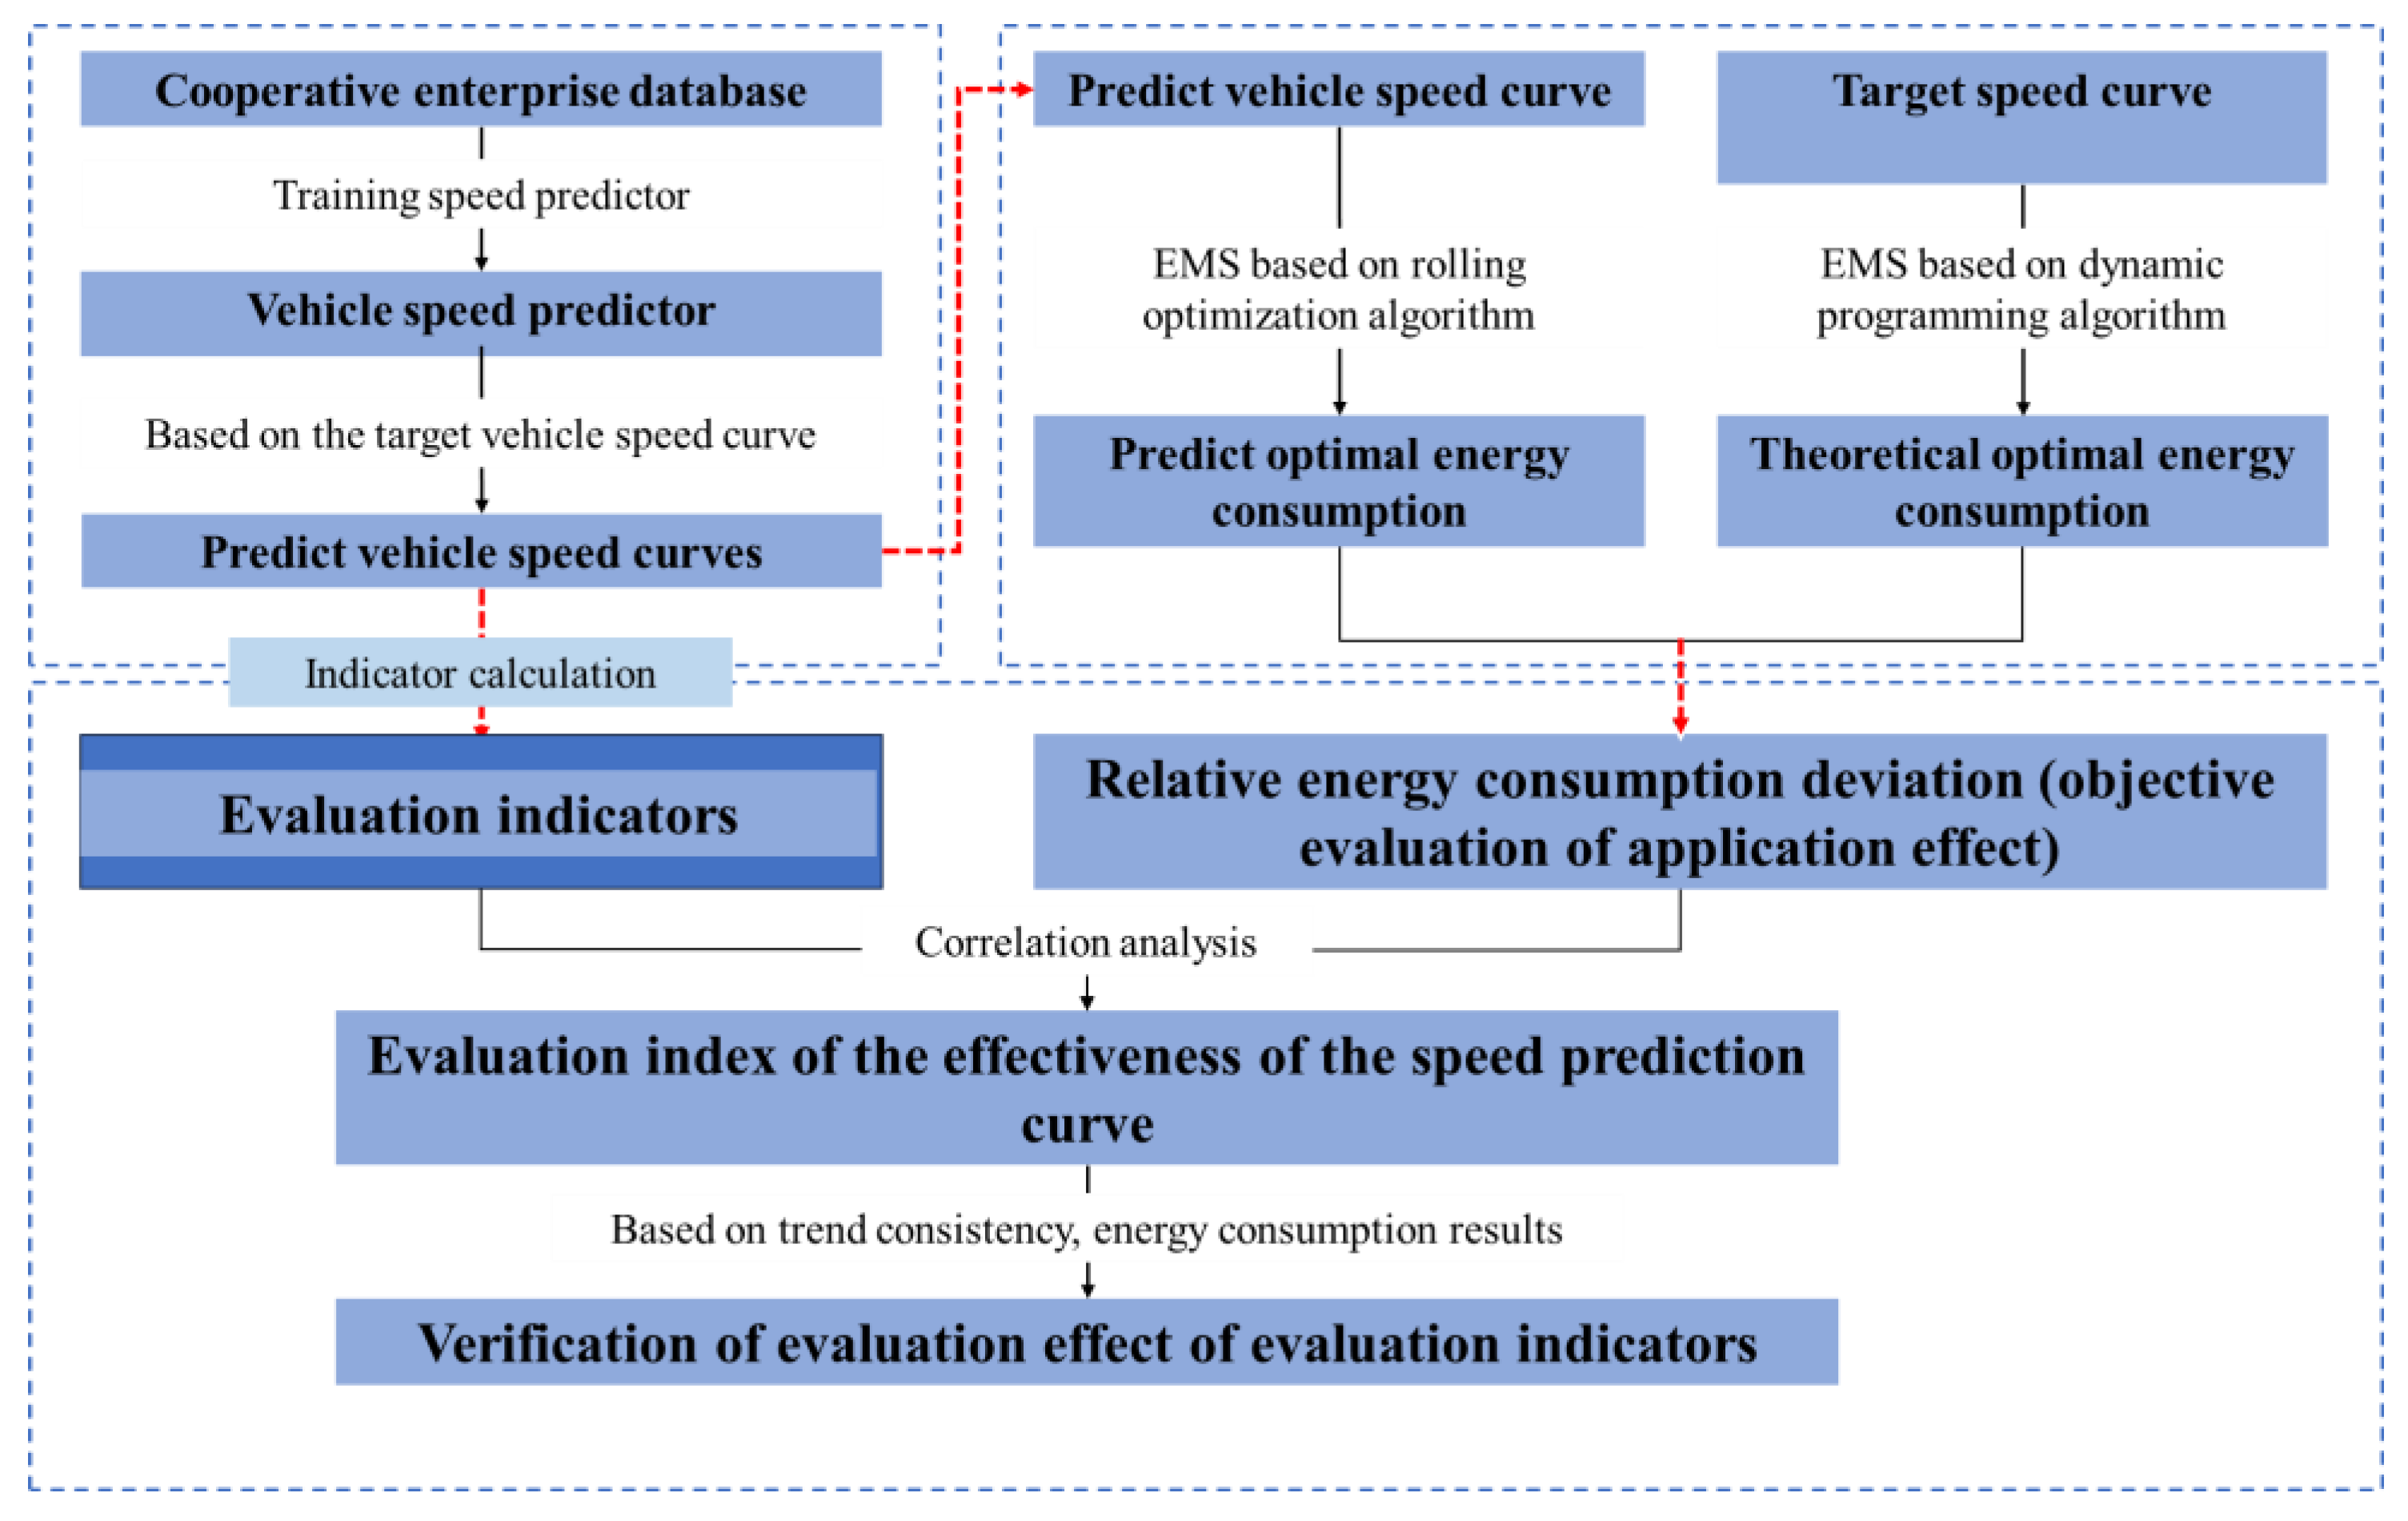
Figure 3.
Speed prediction result.
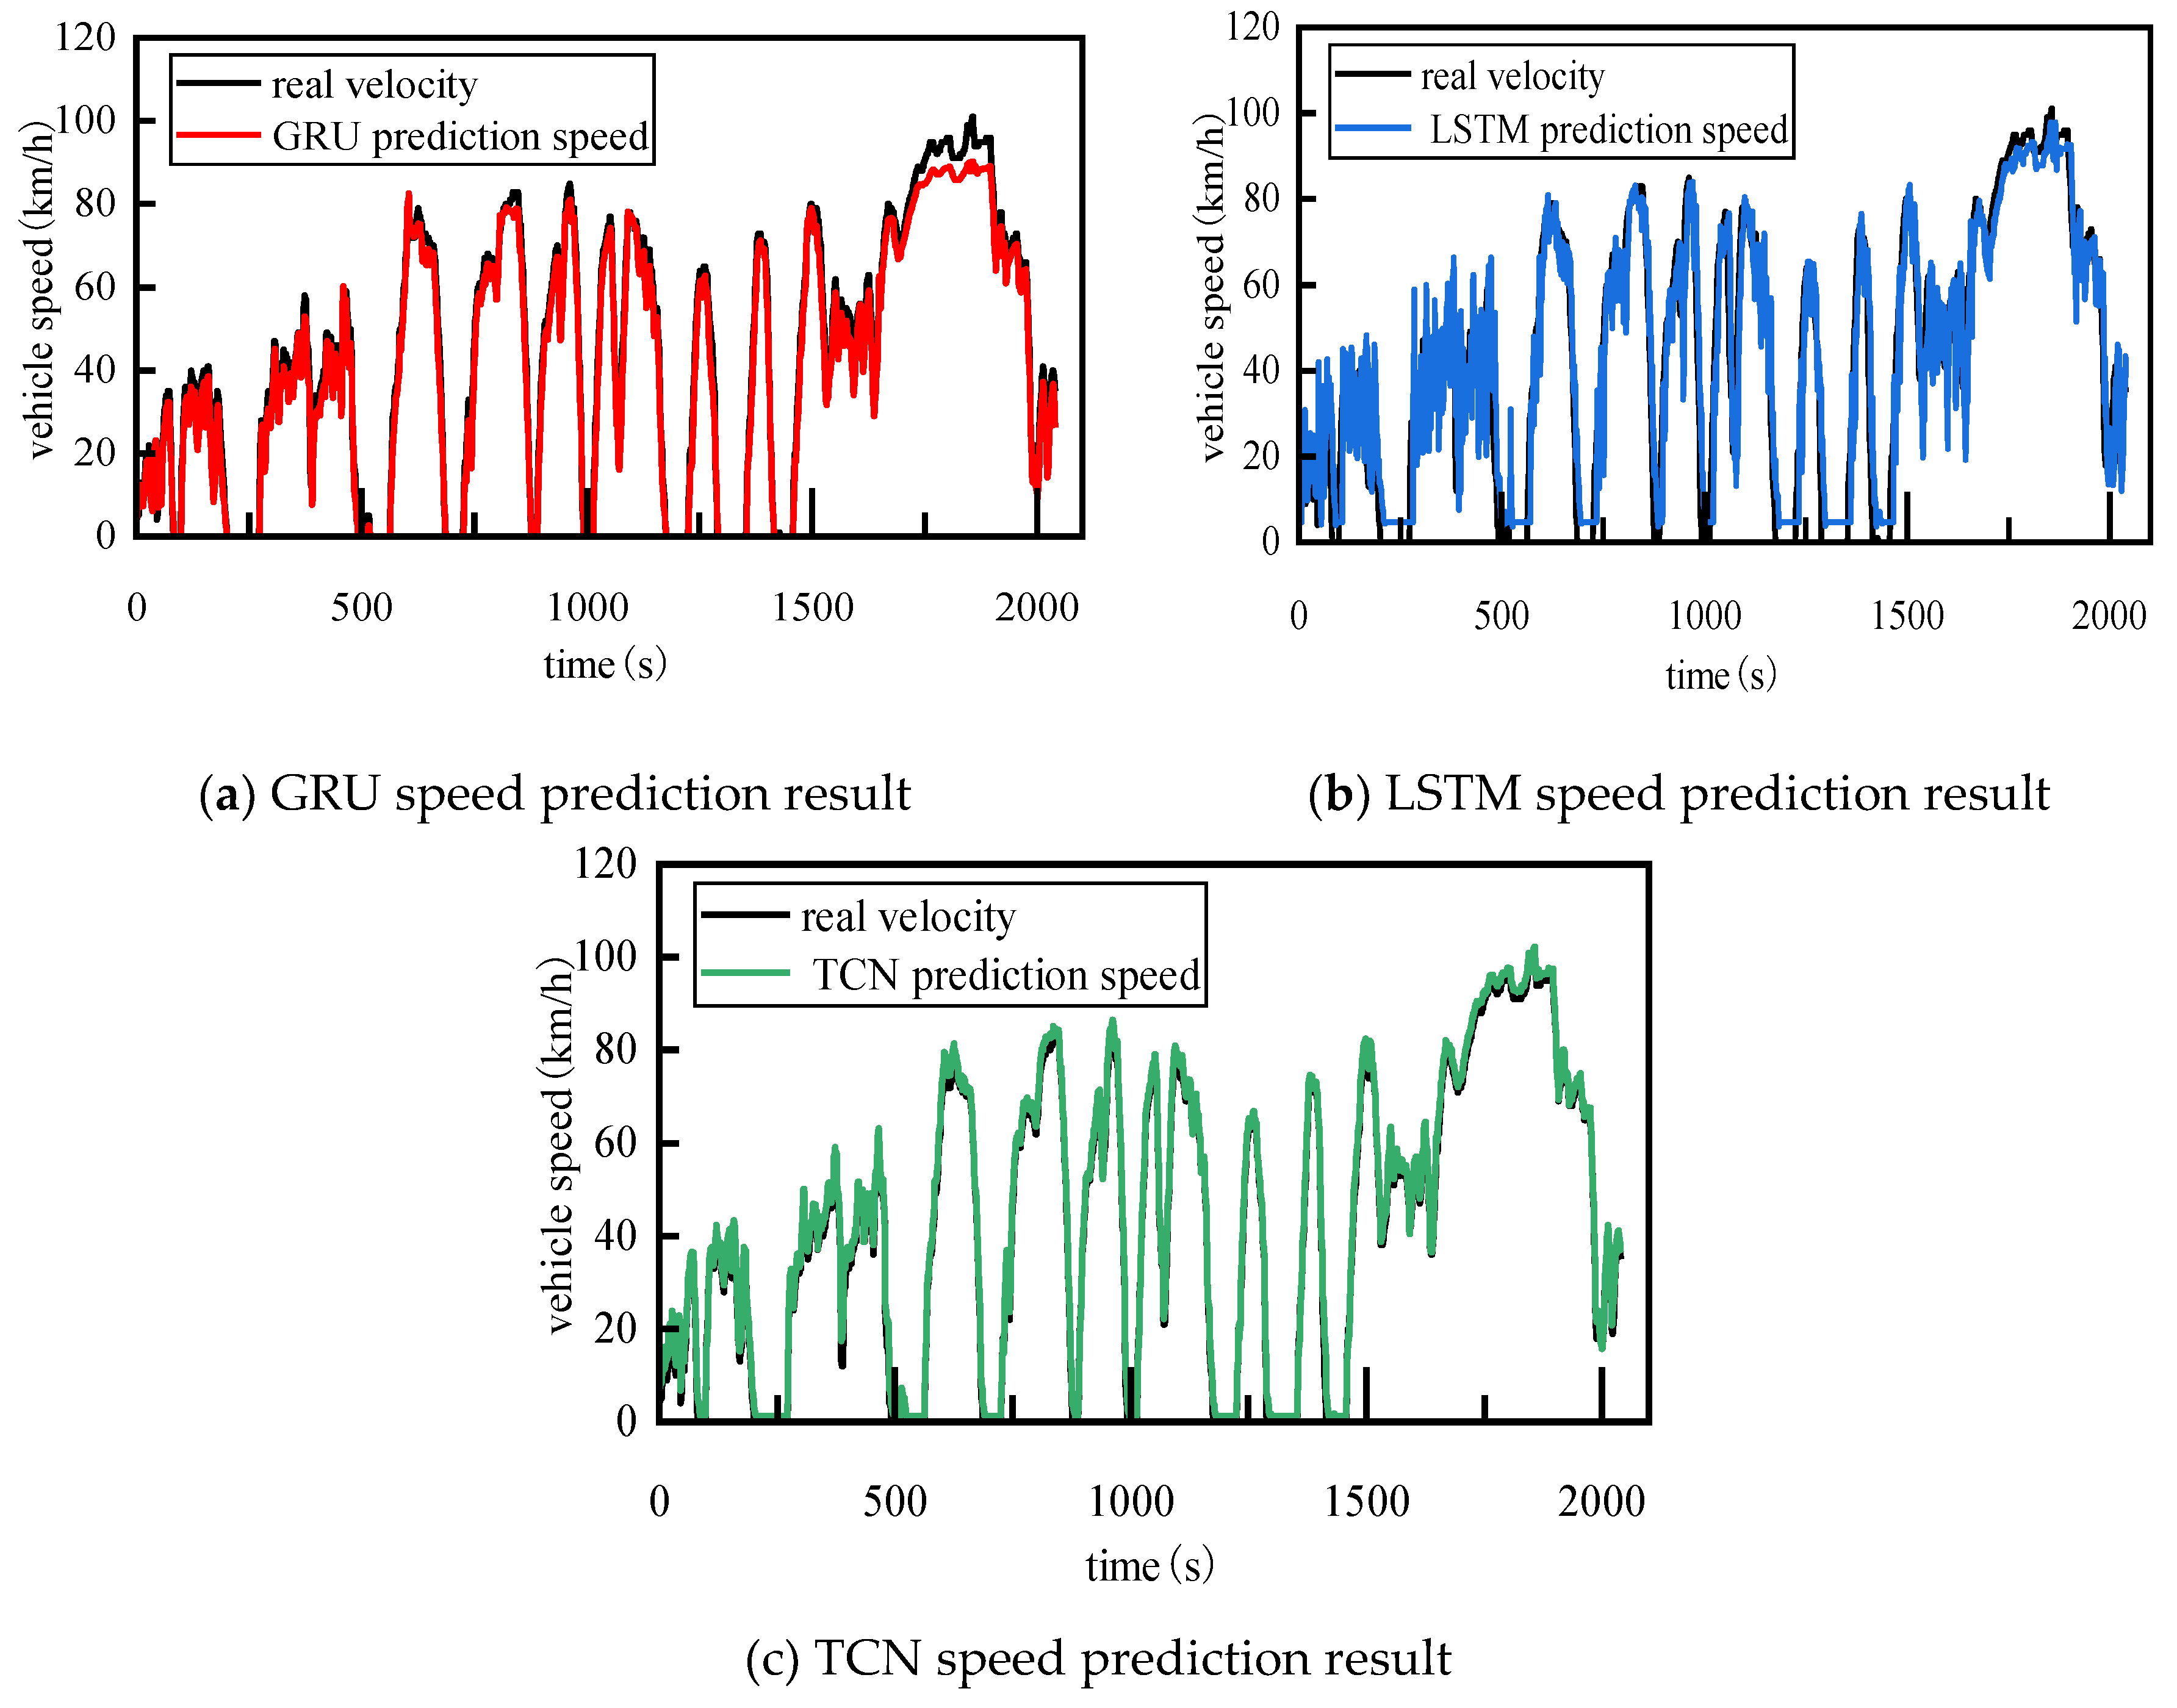
Figure 4.
The segmentation results of vehicle speed segments covering all features of the motion process.
Figure 4.
The segmentation results of vehicle speed segments covering all features of the motion process.
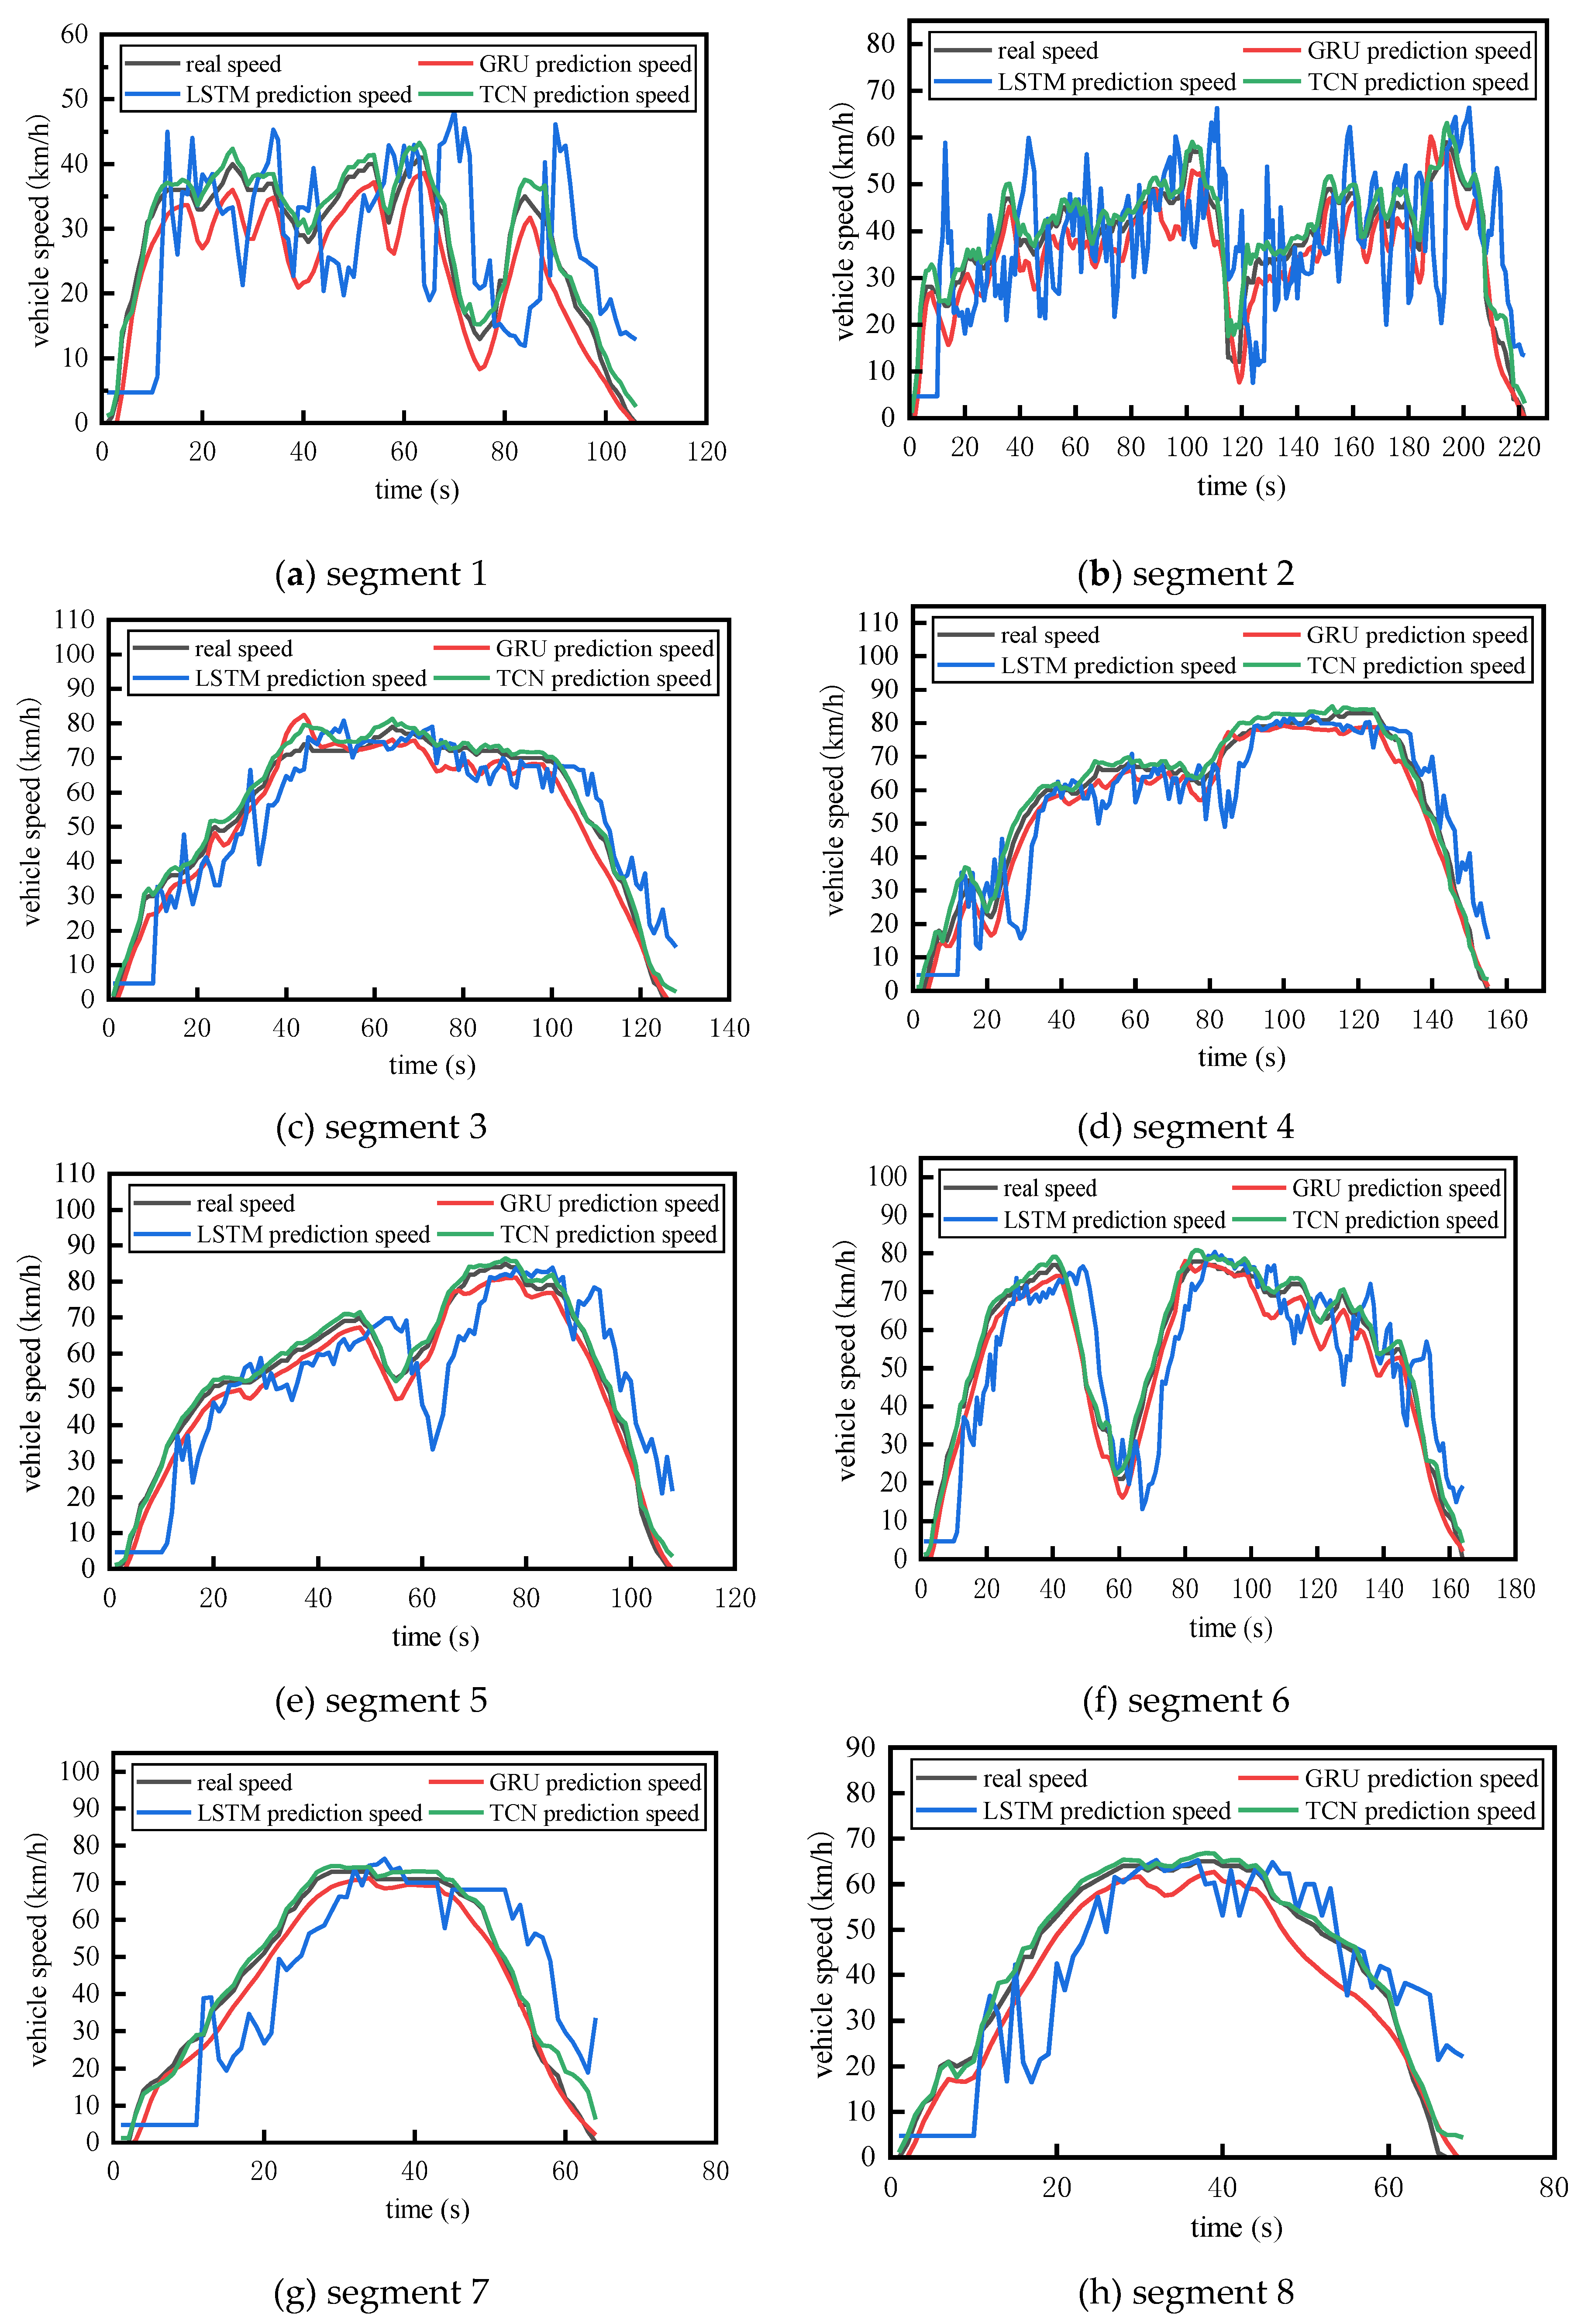
Figure 5.
Distribution results of RMSE and MAE for all segments.

Figure 6.
PHEV model based on GT-SUITE.
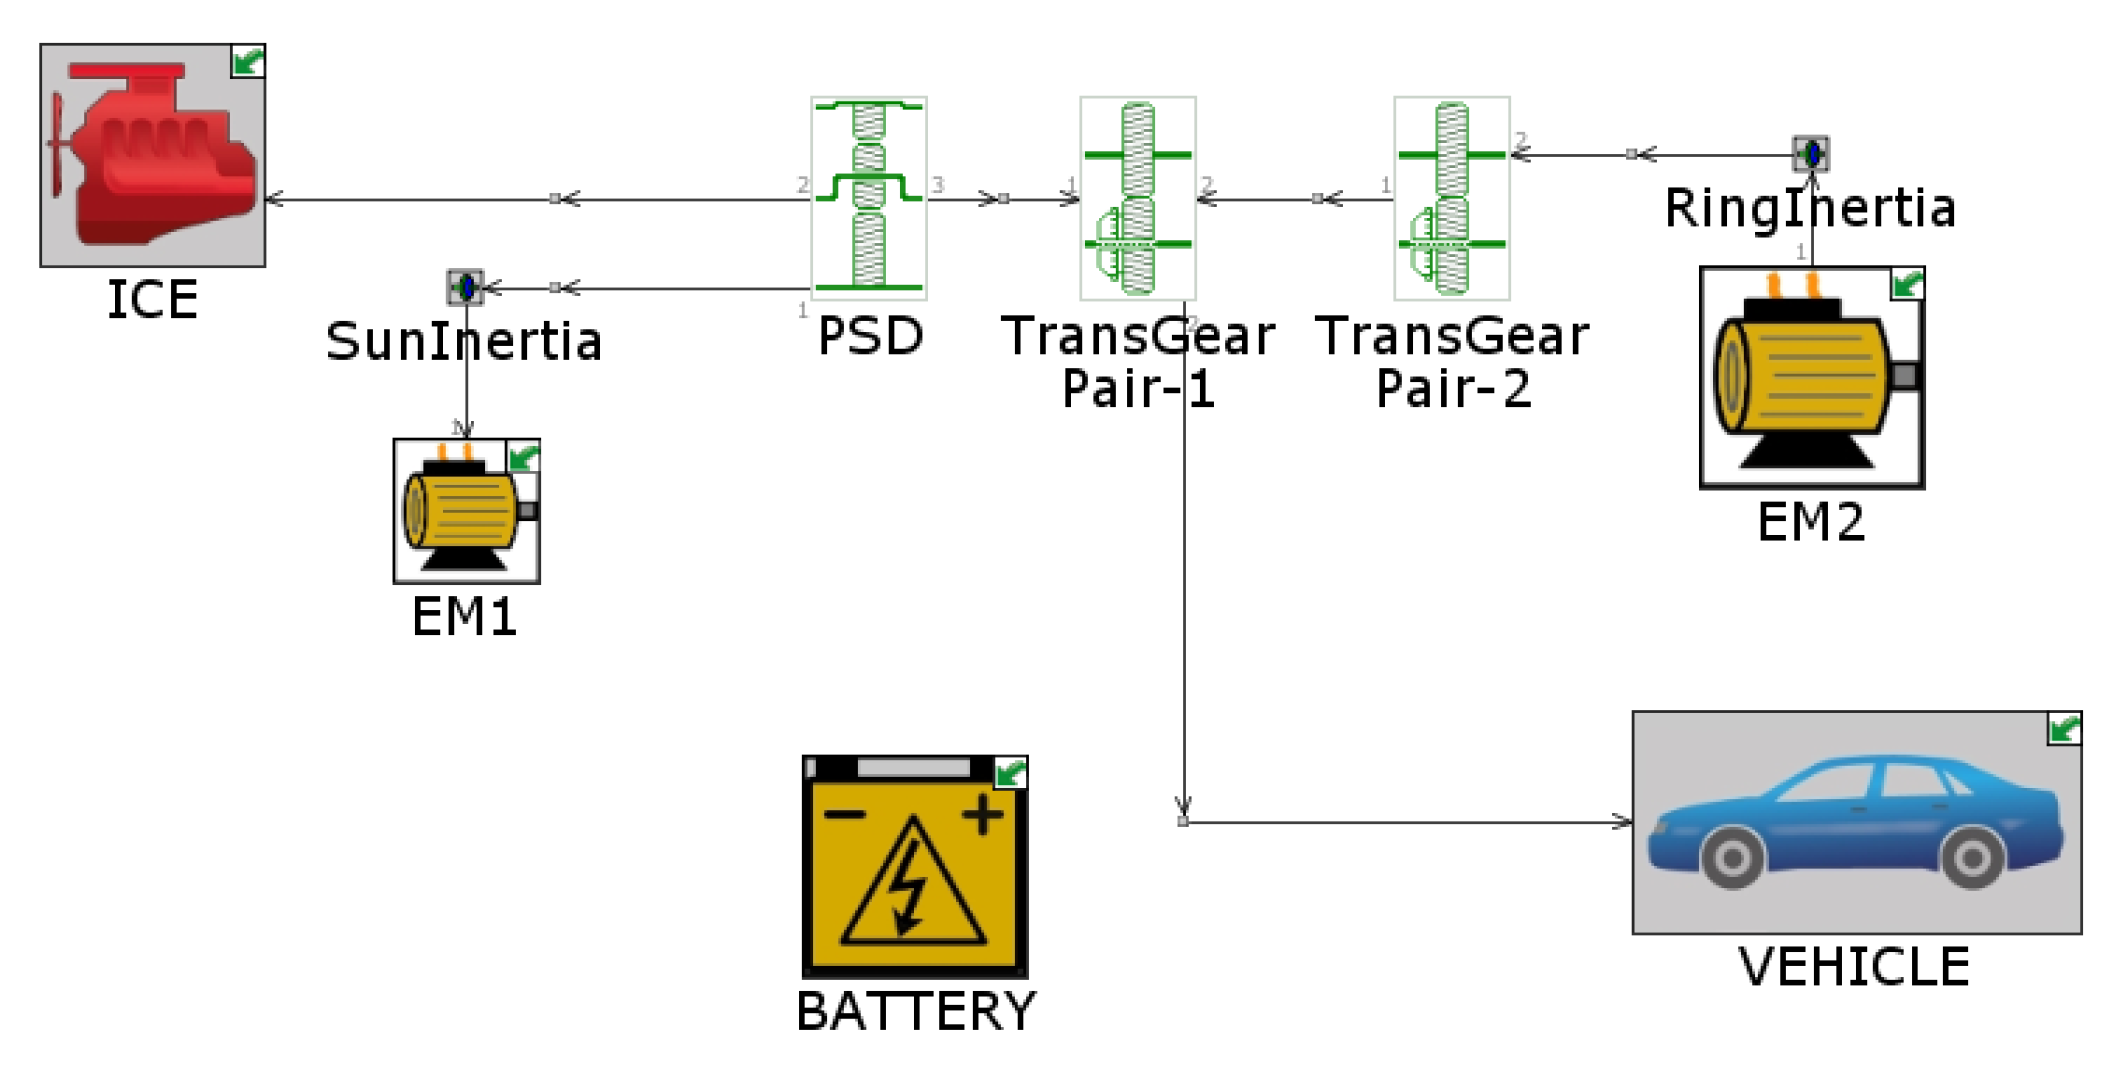
Figure 7.
Rolling Optimization Process.
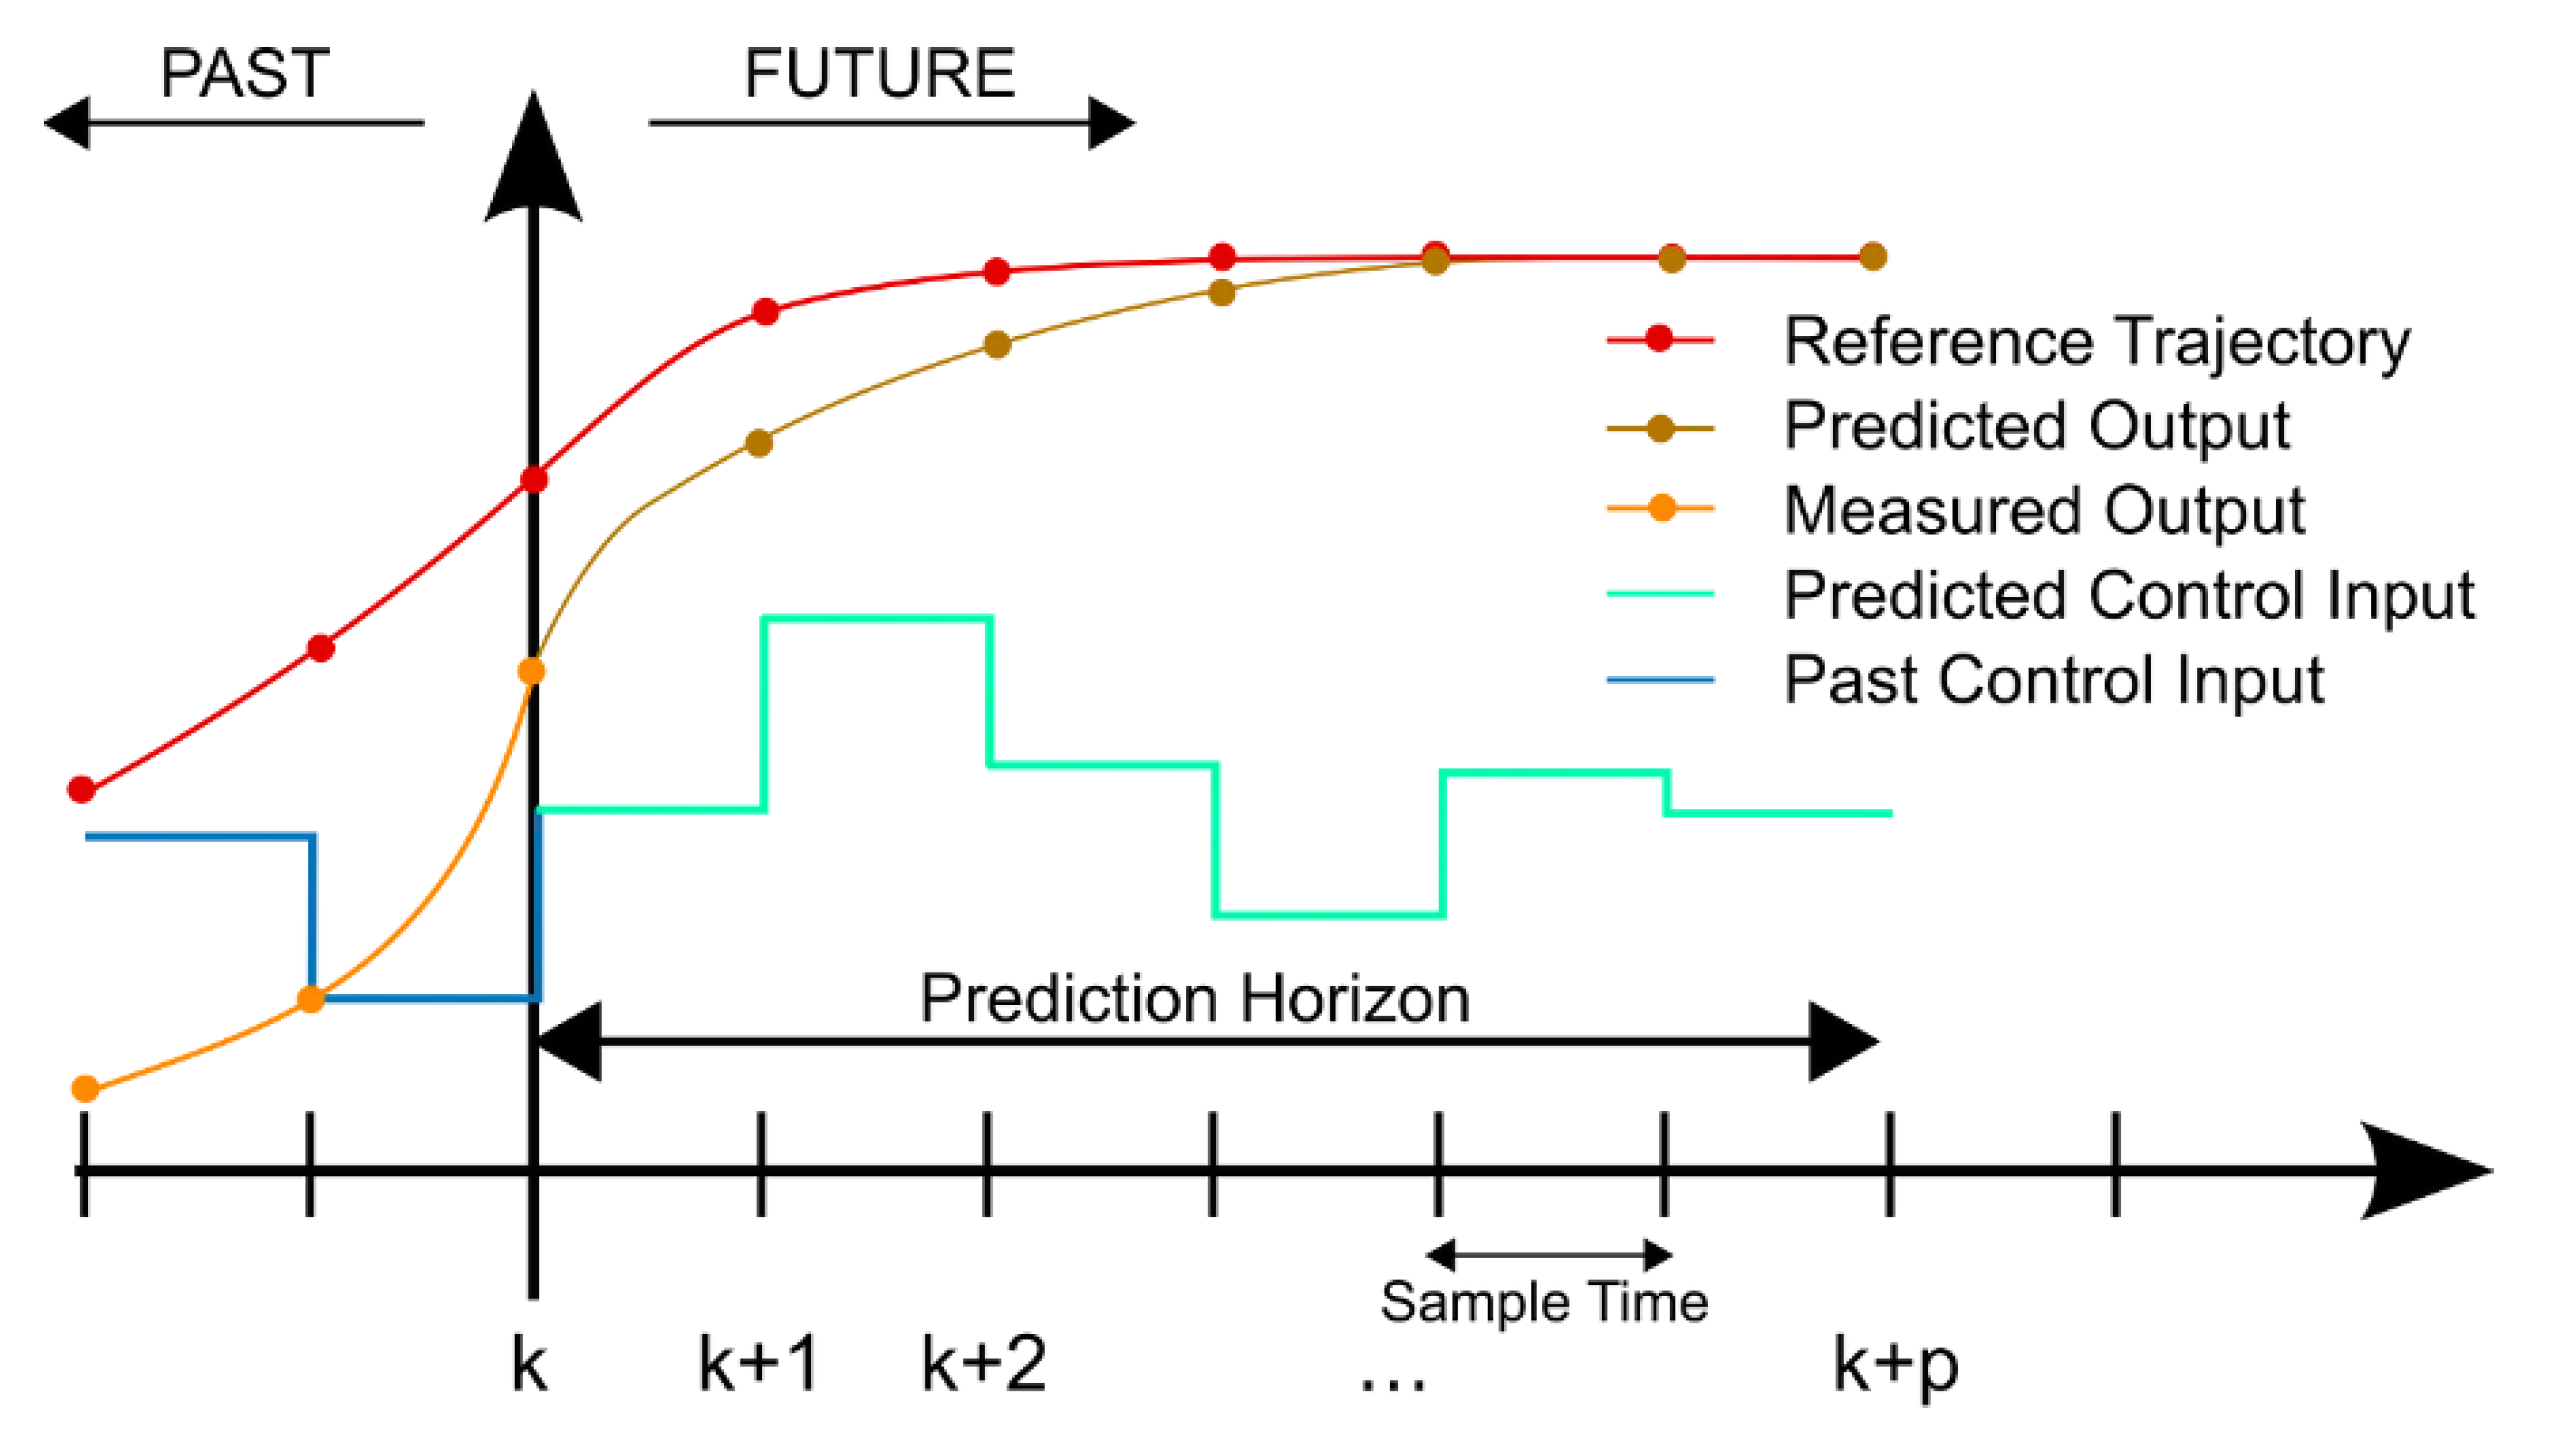
Figure 8.
RMSE and MAE distributions and their correlation with relative energy consumption.
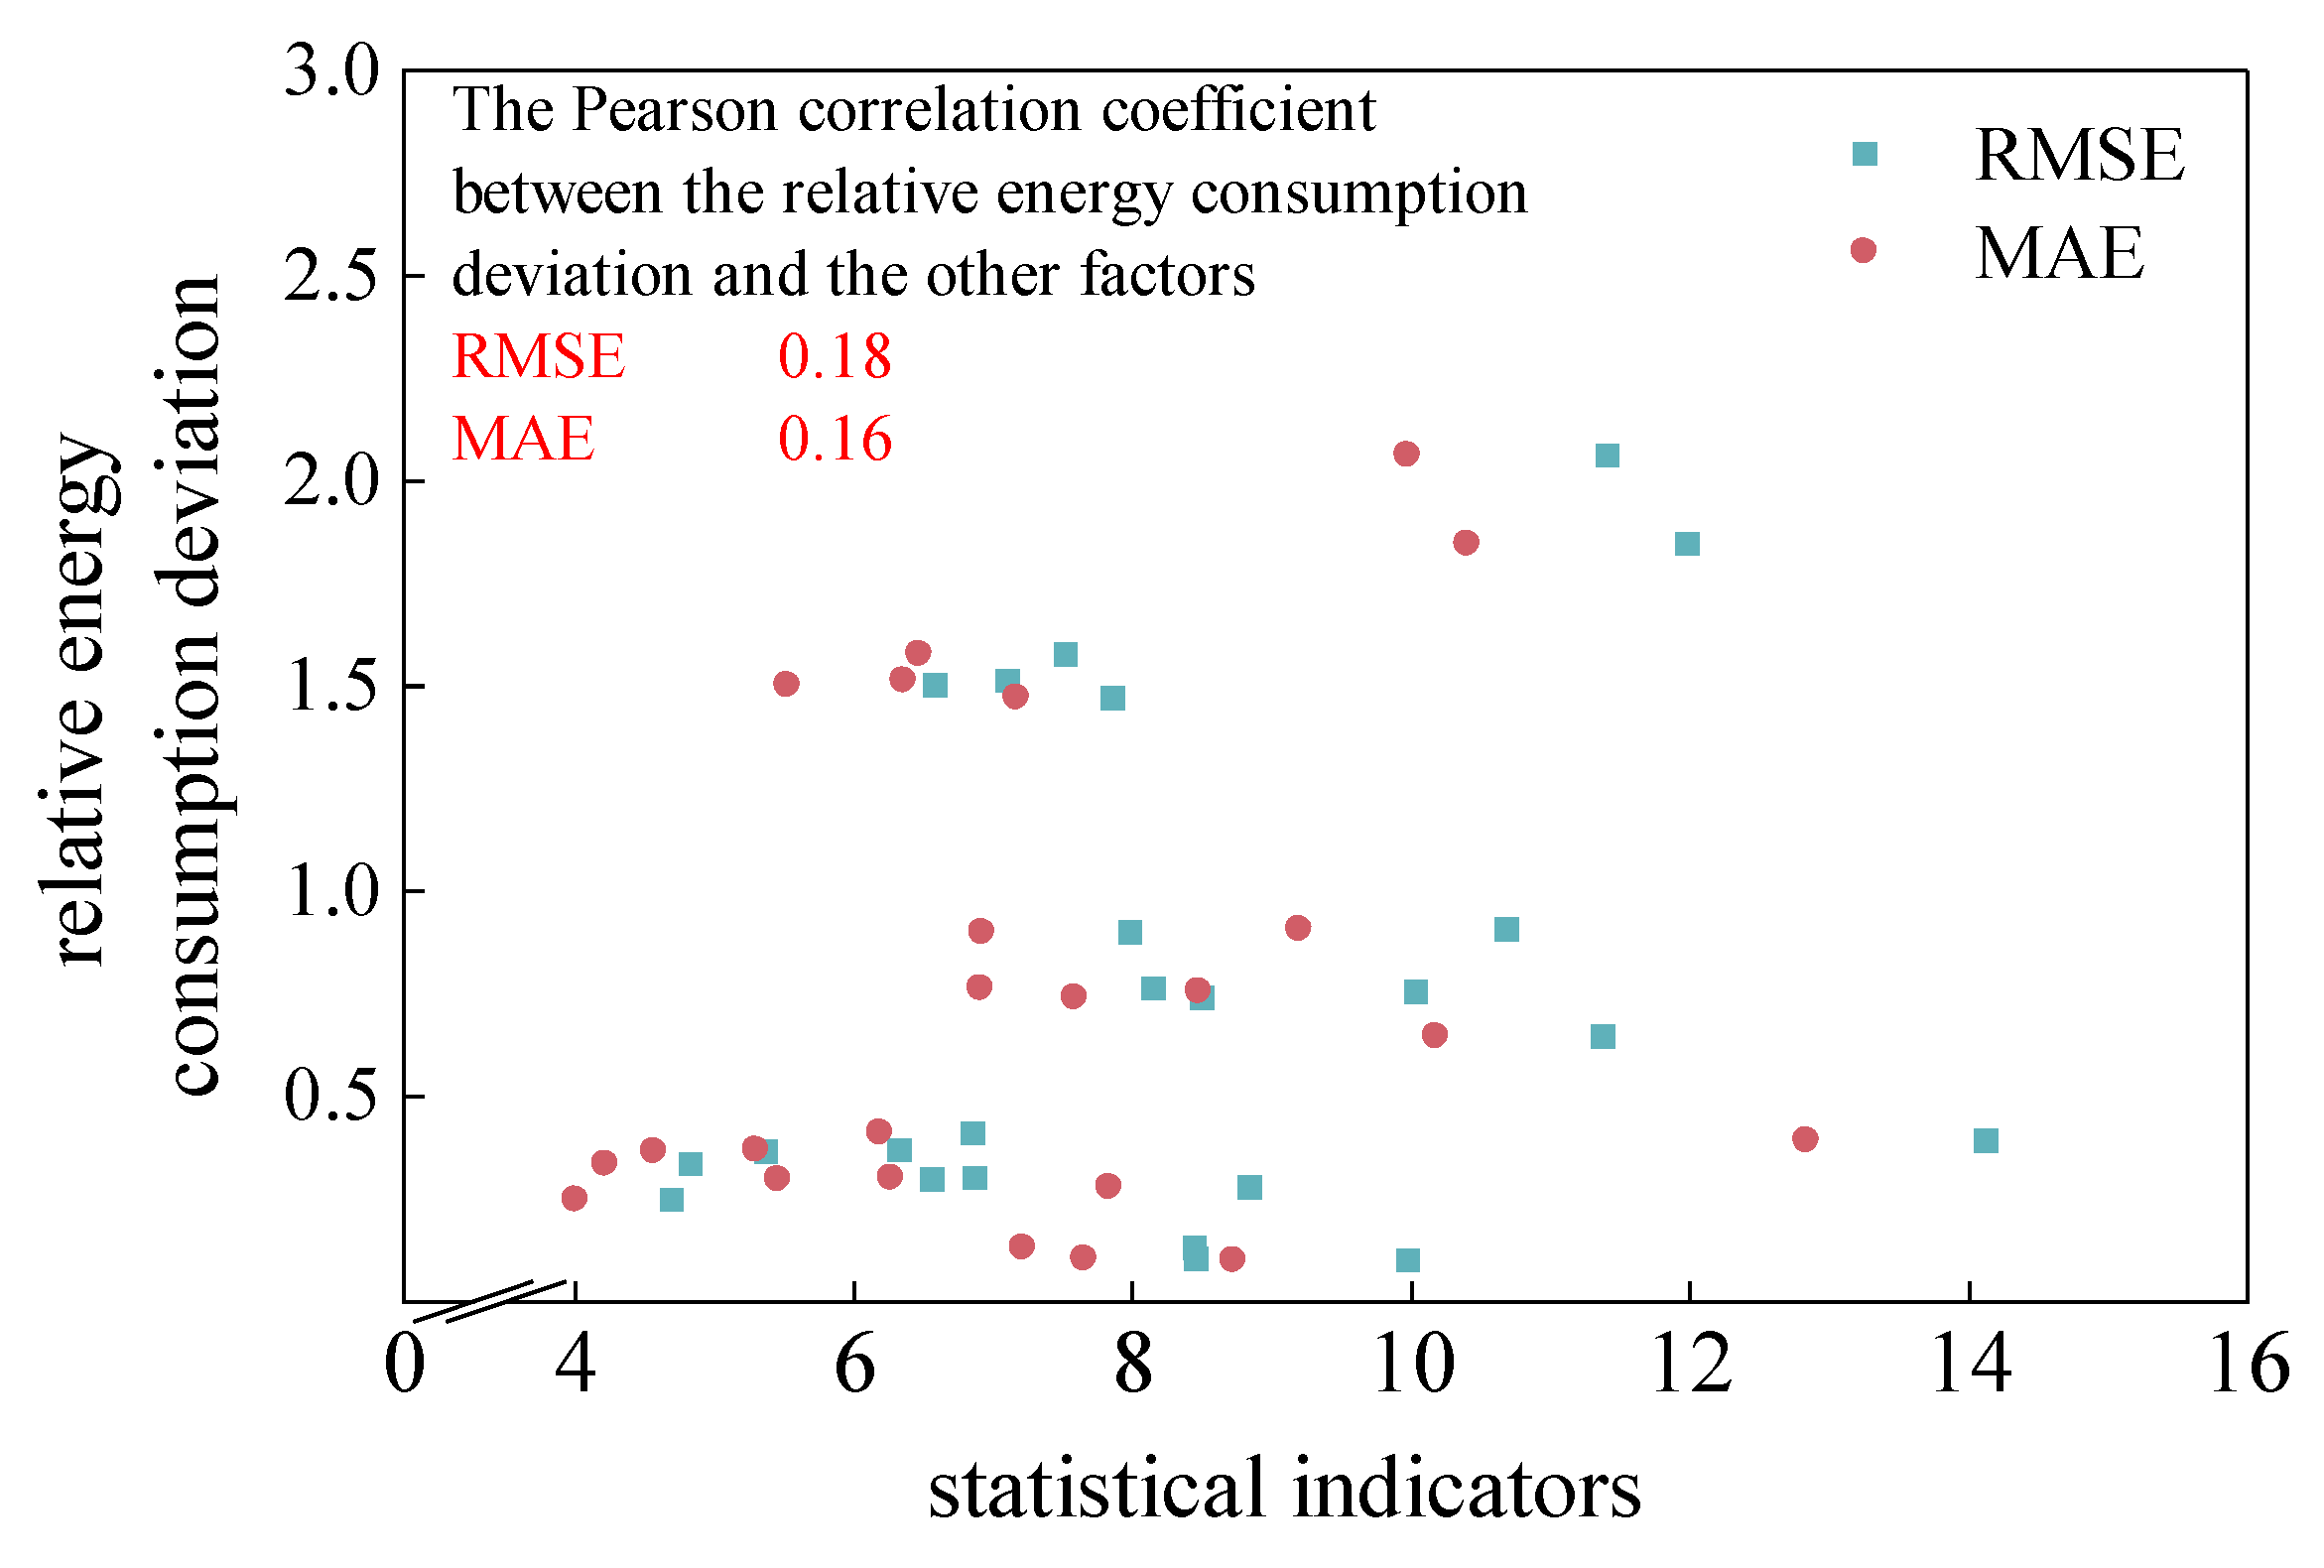
Figure 9.
Distance index distribution and its linear fitting results with relative energy consumption.
Figure 9.
Distance index distribution and its linear fitting results with relative energy consumption.
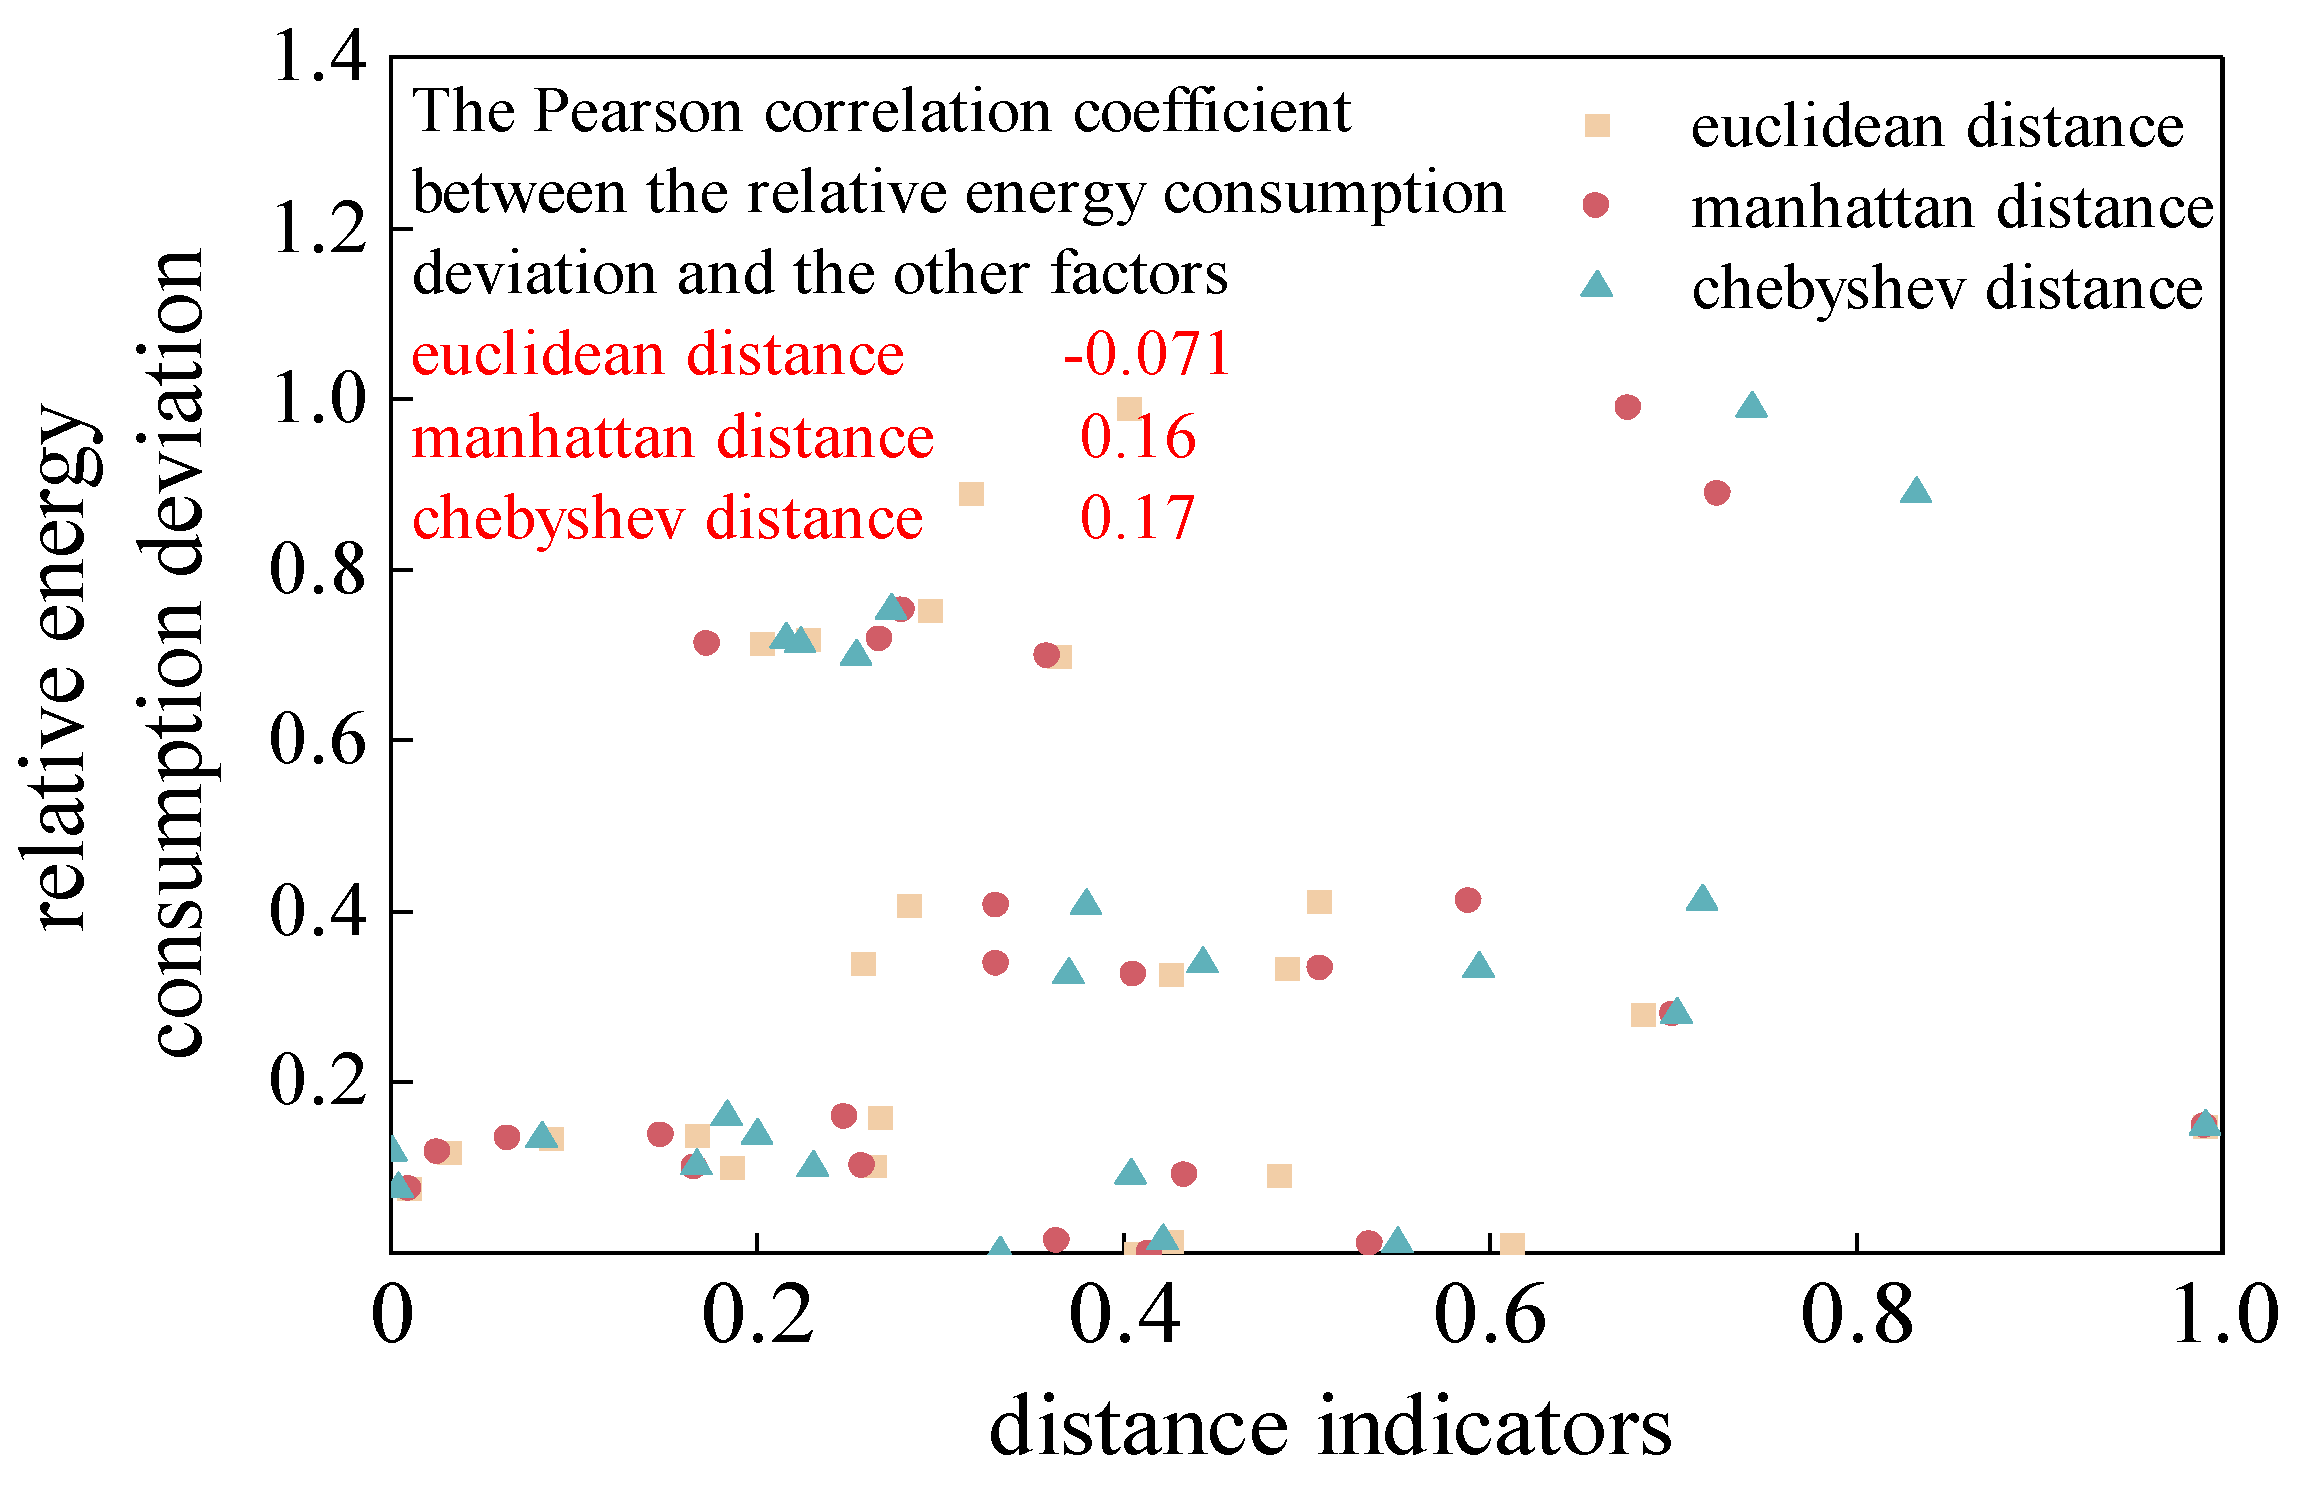
Figure 10.
Vehicle speed characteristic indicators index distribution and its linear fitting results with relative energy consumption.
Figure 10.
Vehicle speed characteristic indicators index distribution and its linear fitting results with relative energy consumption.
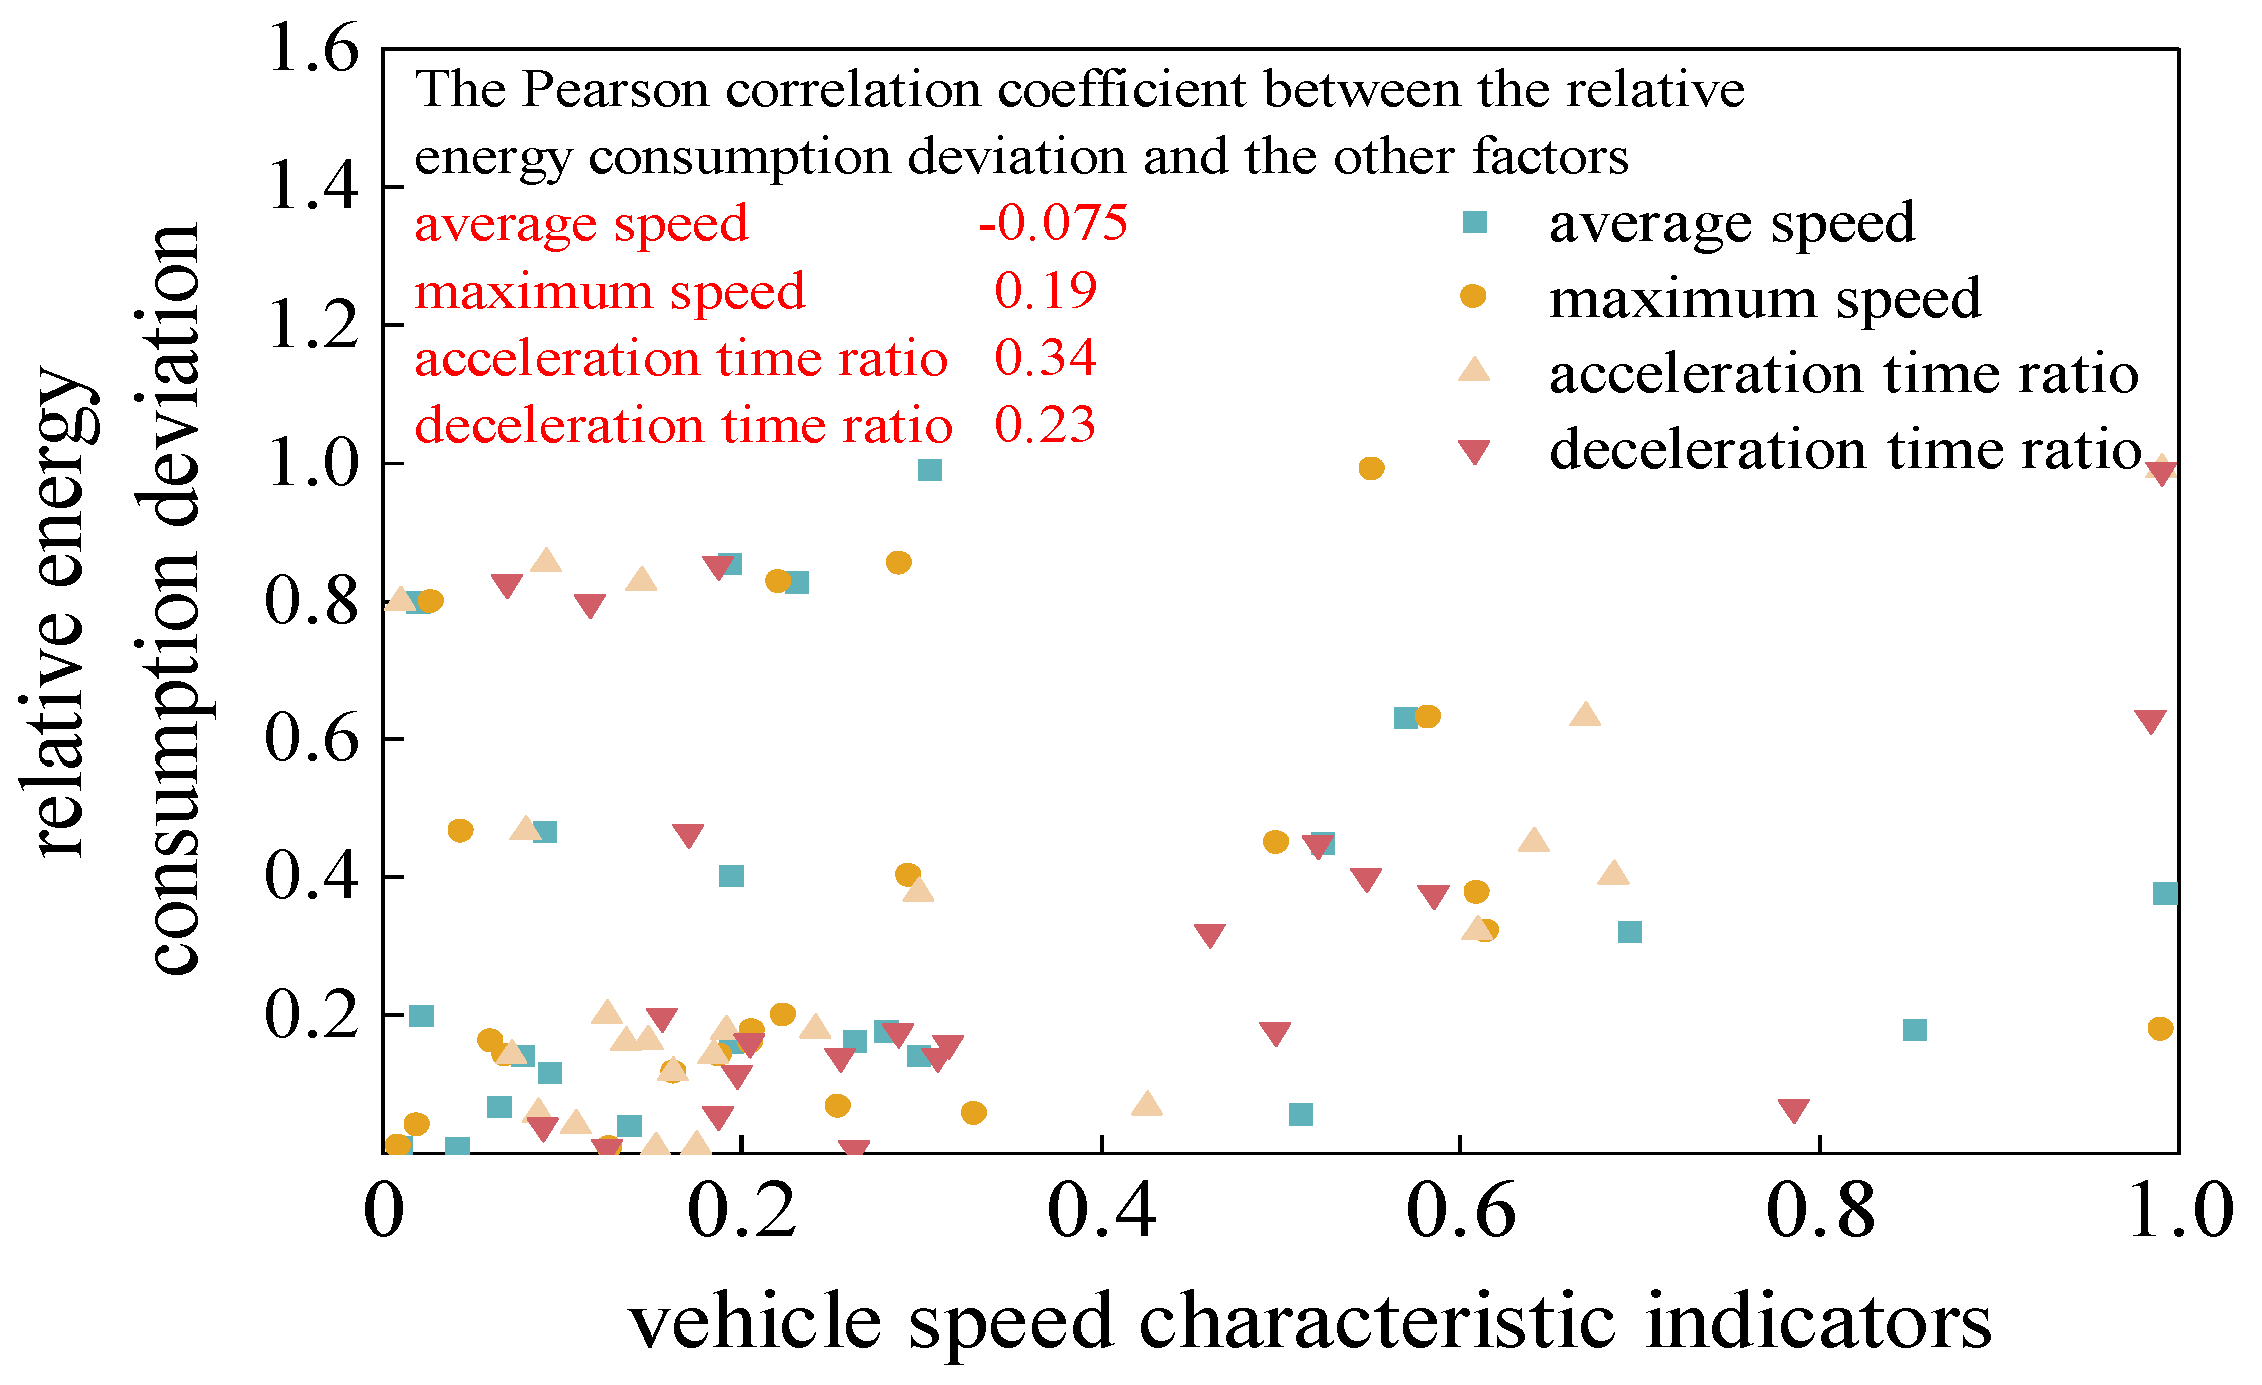
Figure 11.
The results of acceleration time proportion error and its standard deviation distribution and correlation with relative energy consumption deviation.
Figure 11.
The results of acceleration time proportion error and its standard deviation distribution and correlation with relative energy consumption deviation.
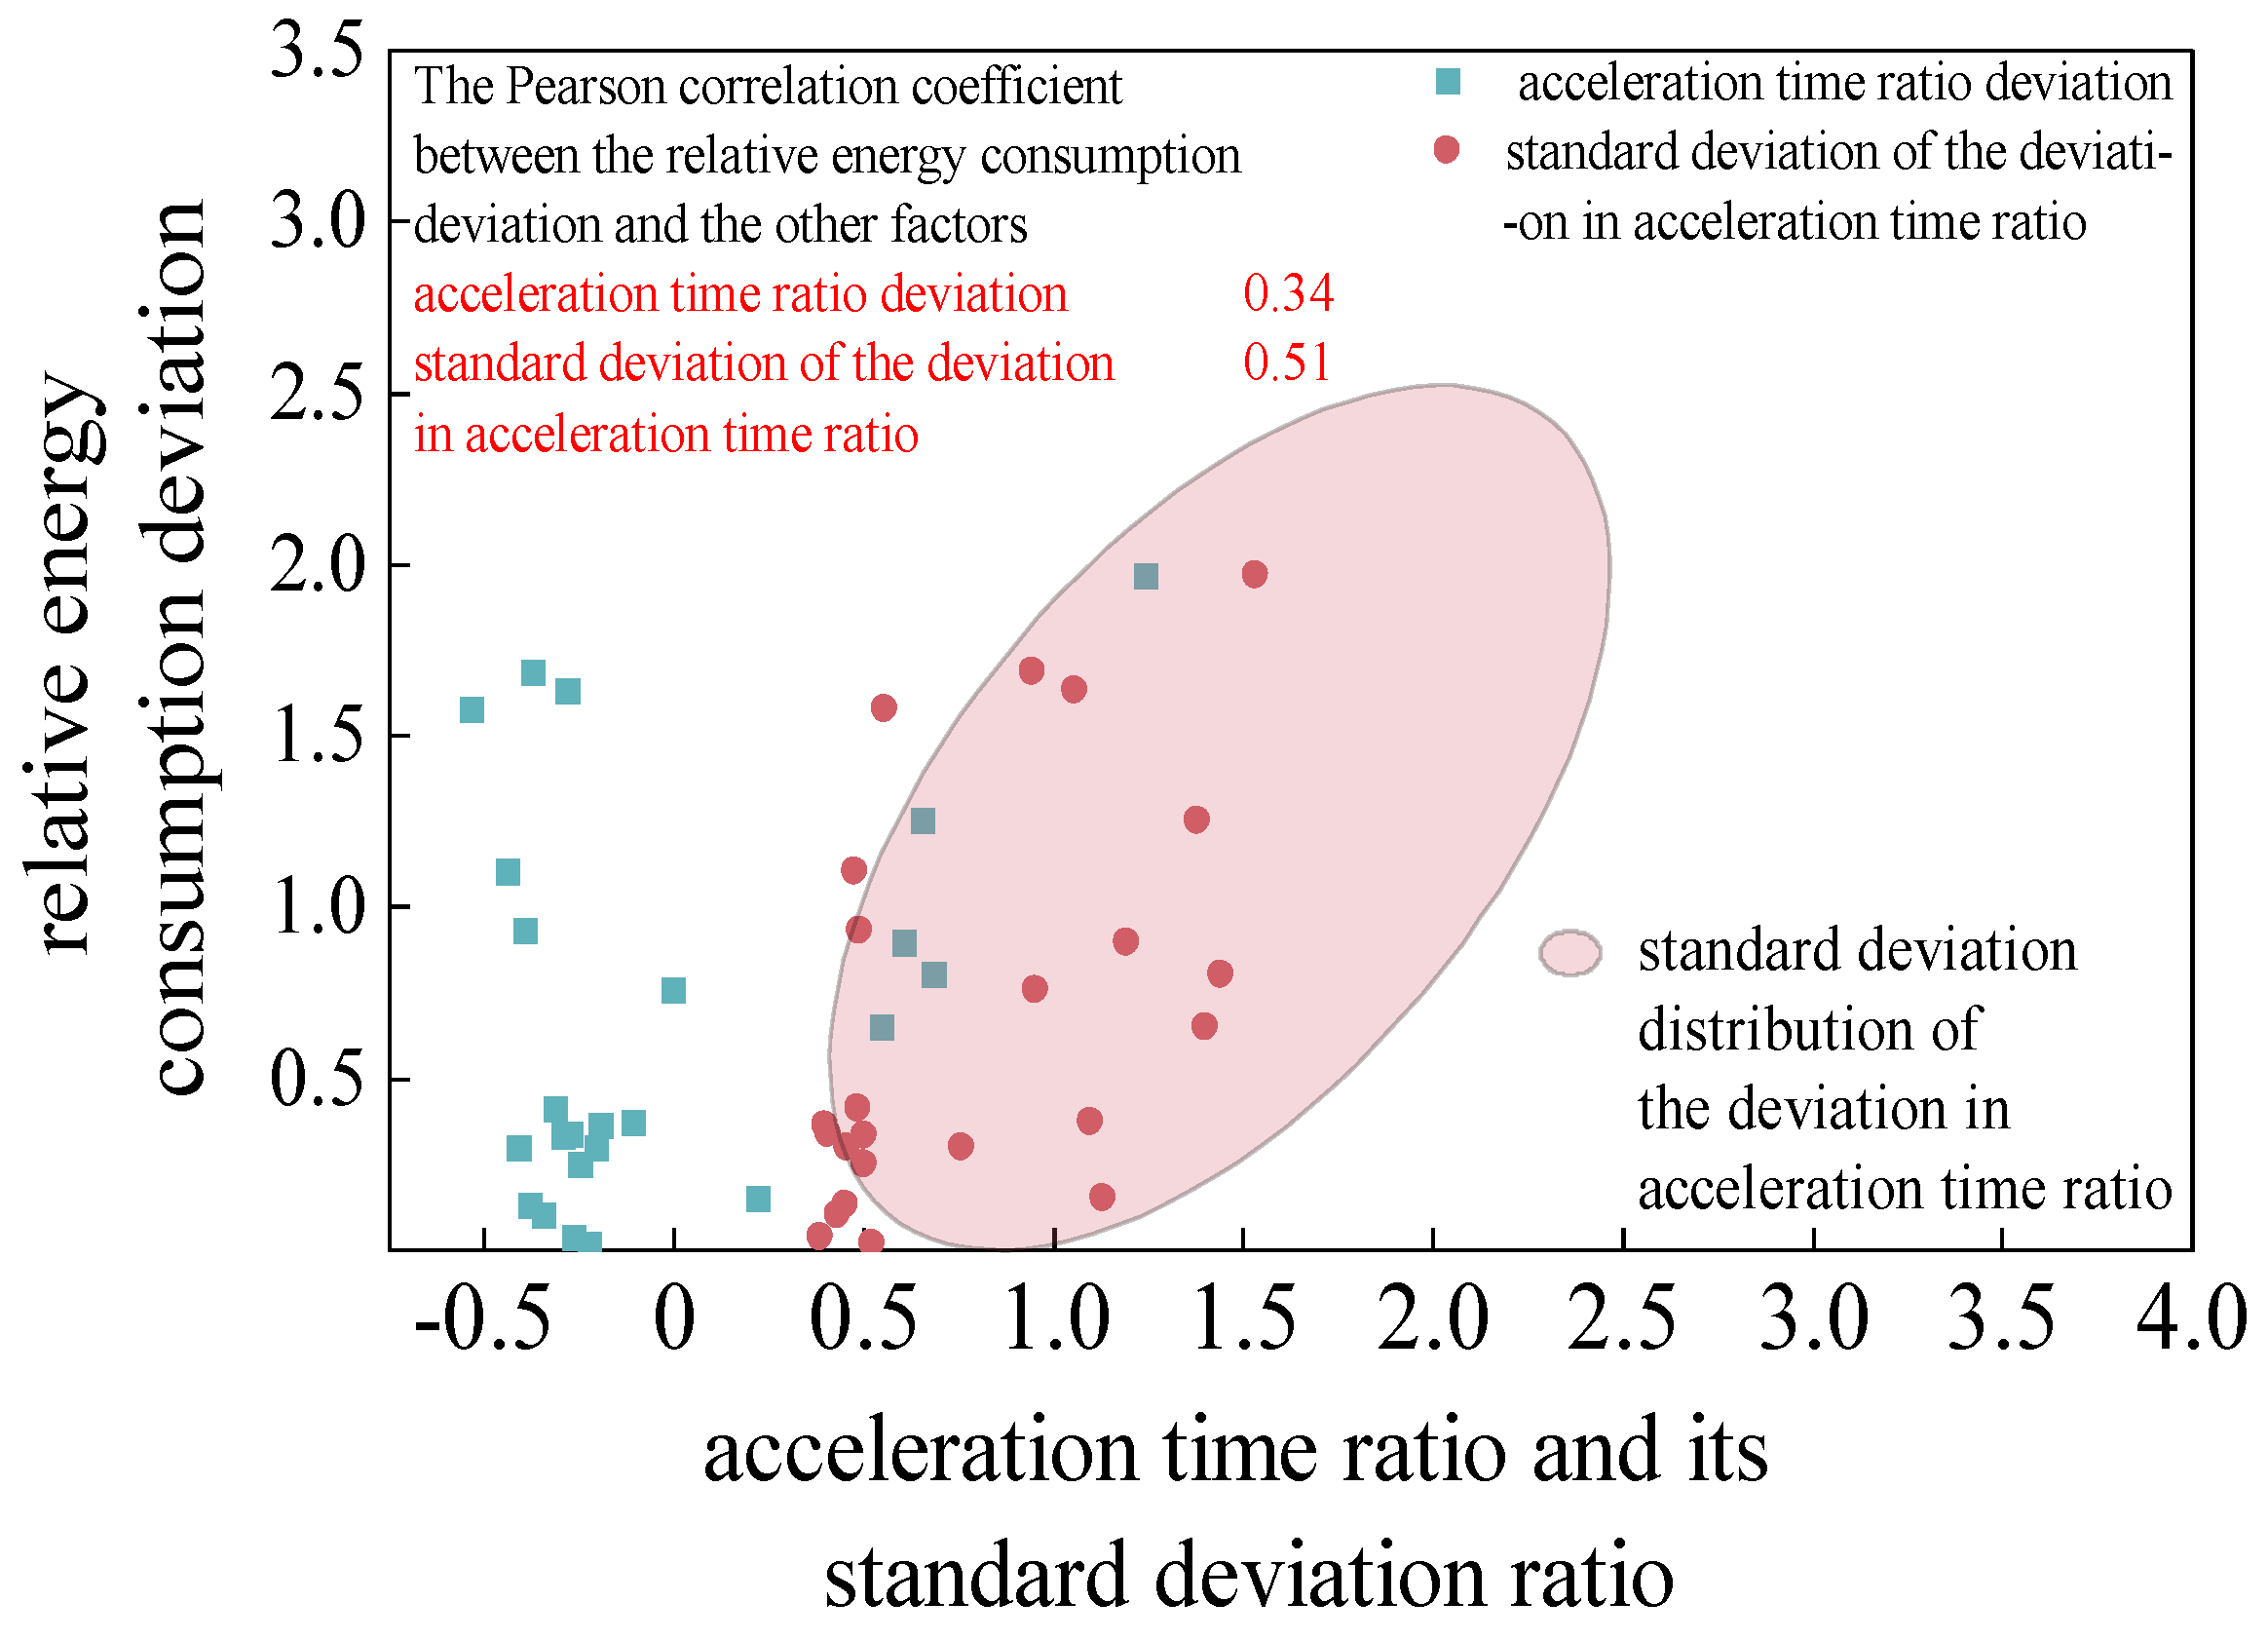
Figure 12.
Comparison of standard deviation, RMSE, MAE and relative energy consumption deviation trend of acceleration time proportion deviation map.
Figure 12.
Comparison of standard deviation, RMSE, MAE and relative energy consumption deviation trend of acceleration time proportion deviation map.
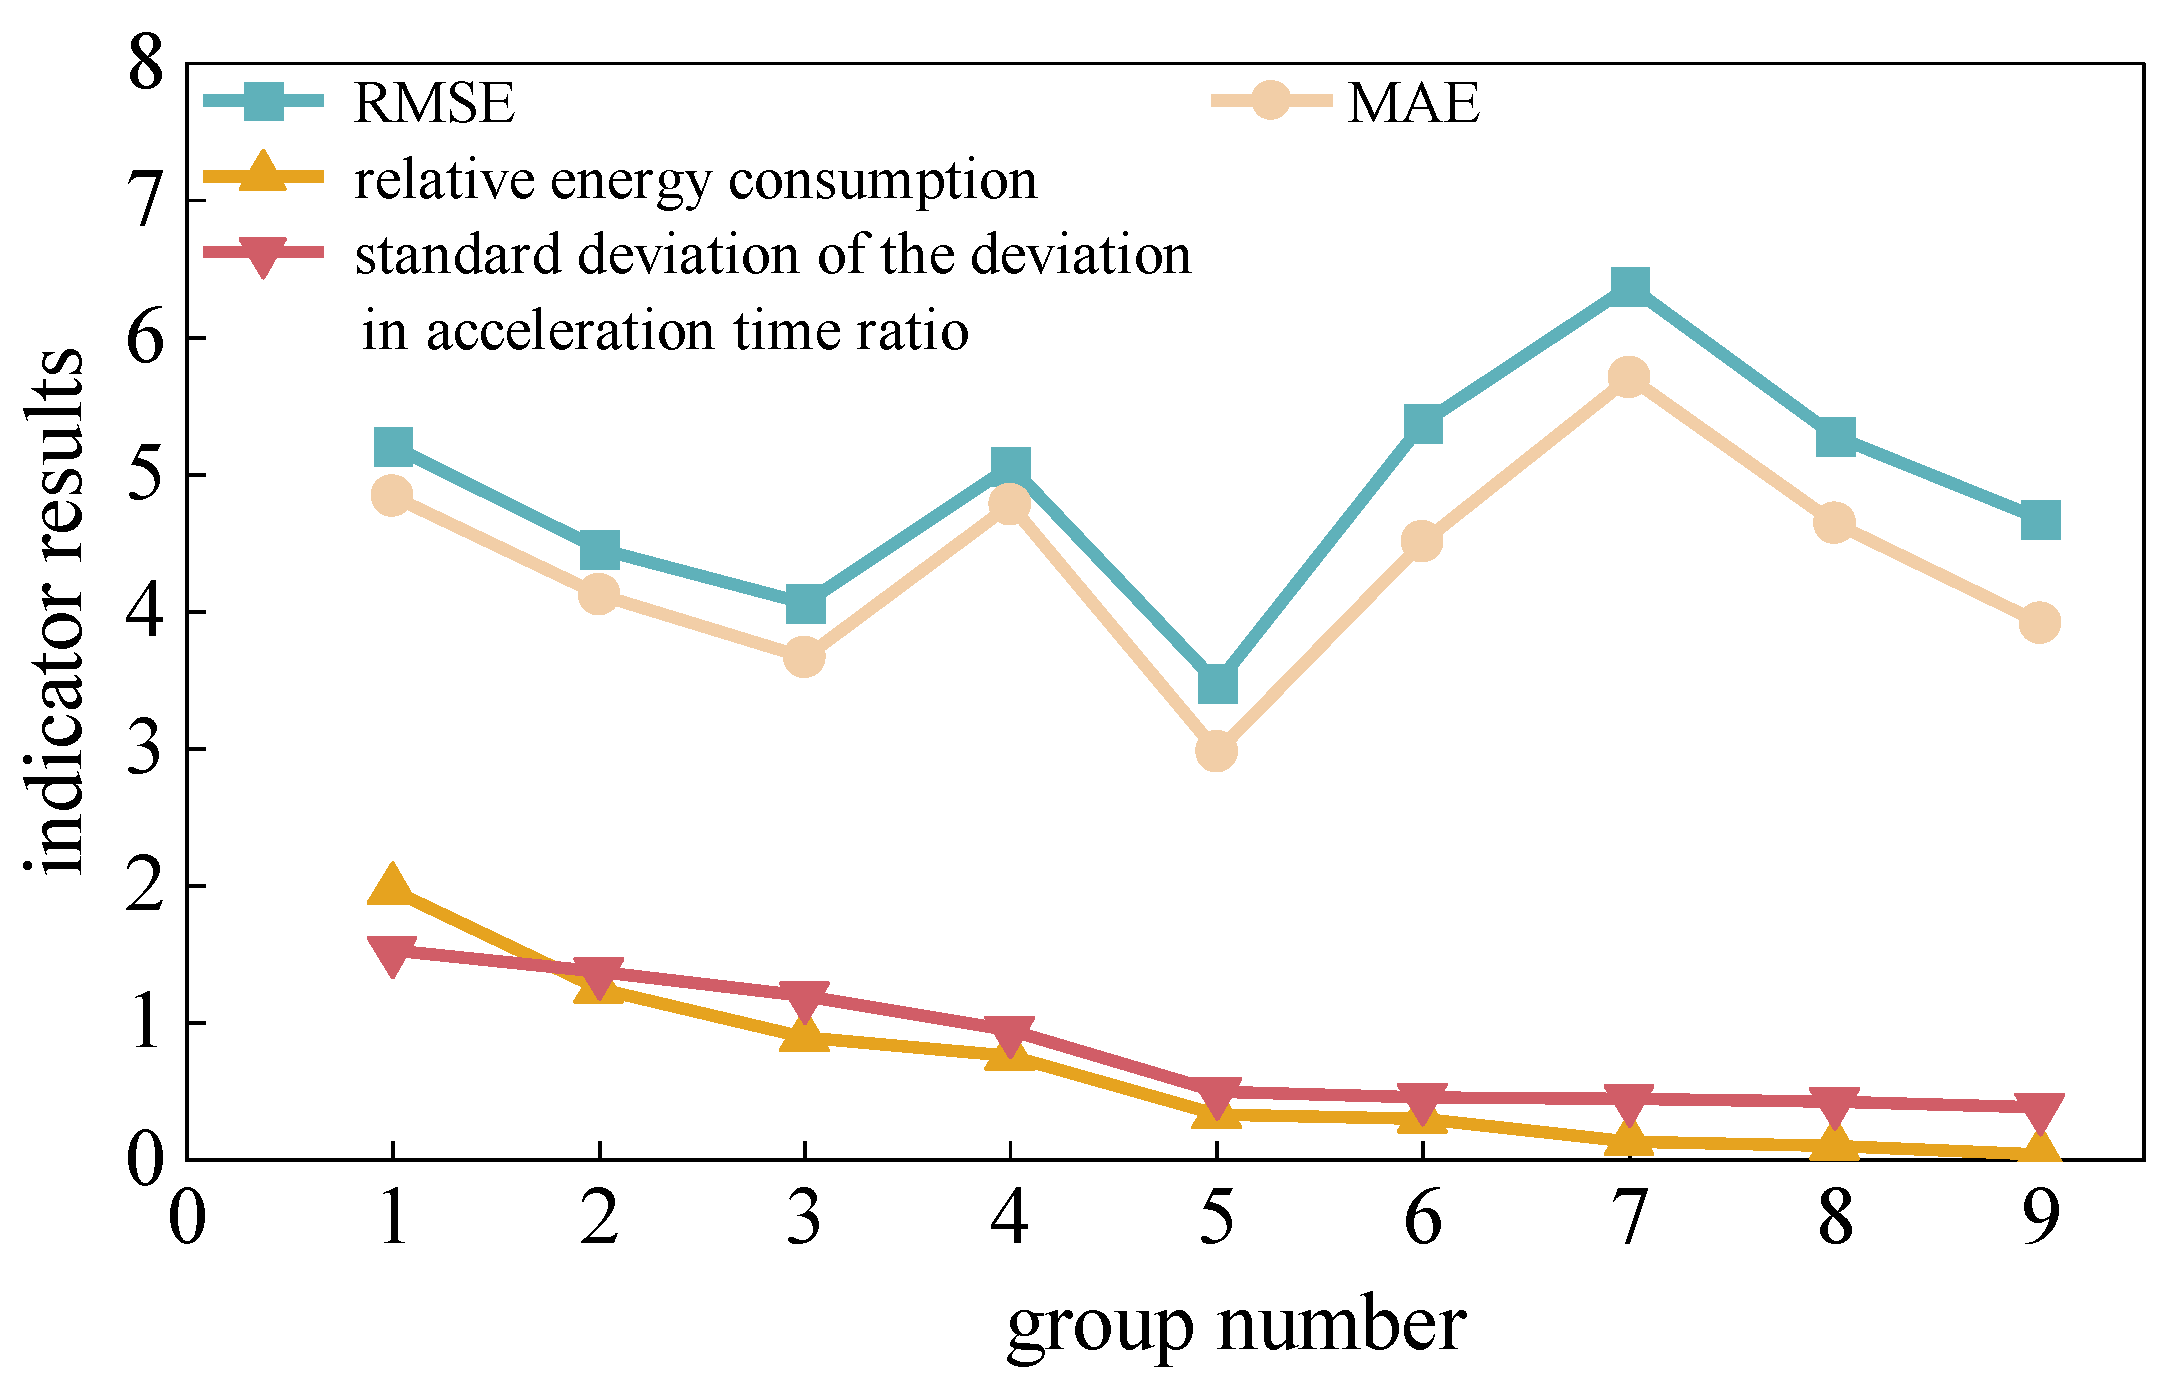
Figure 13.
Segment mileage characteristics statistical map.
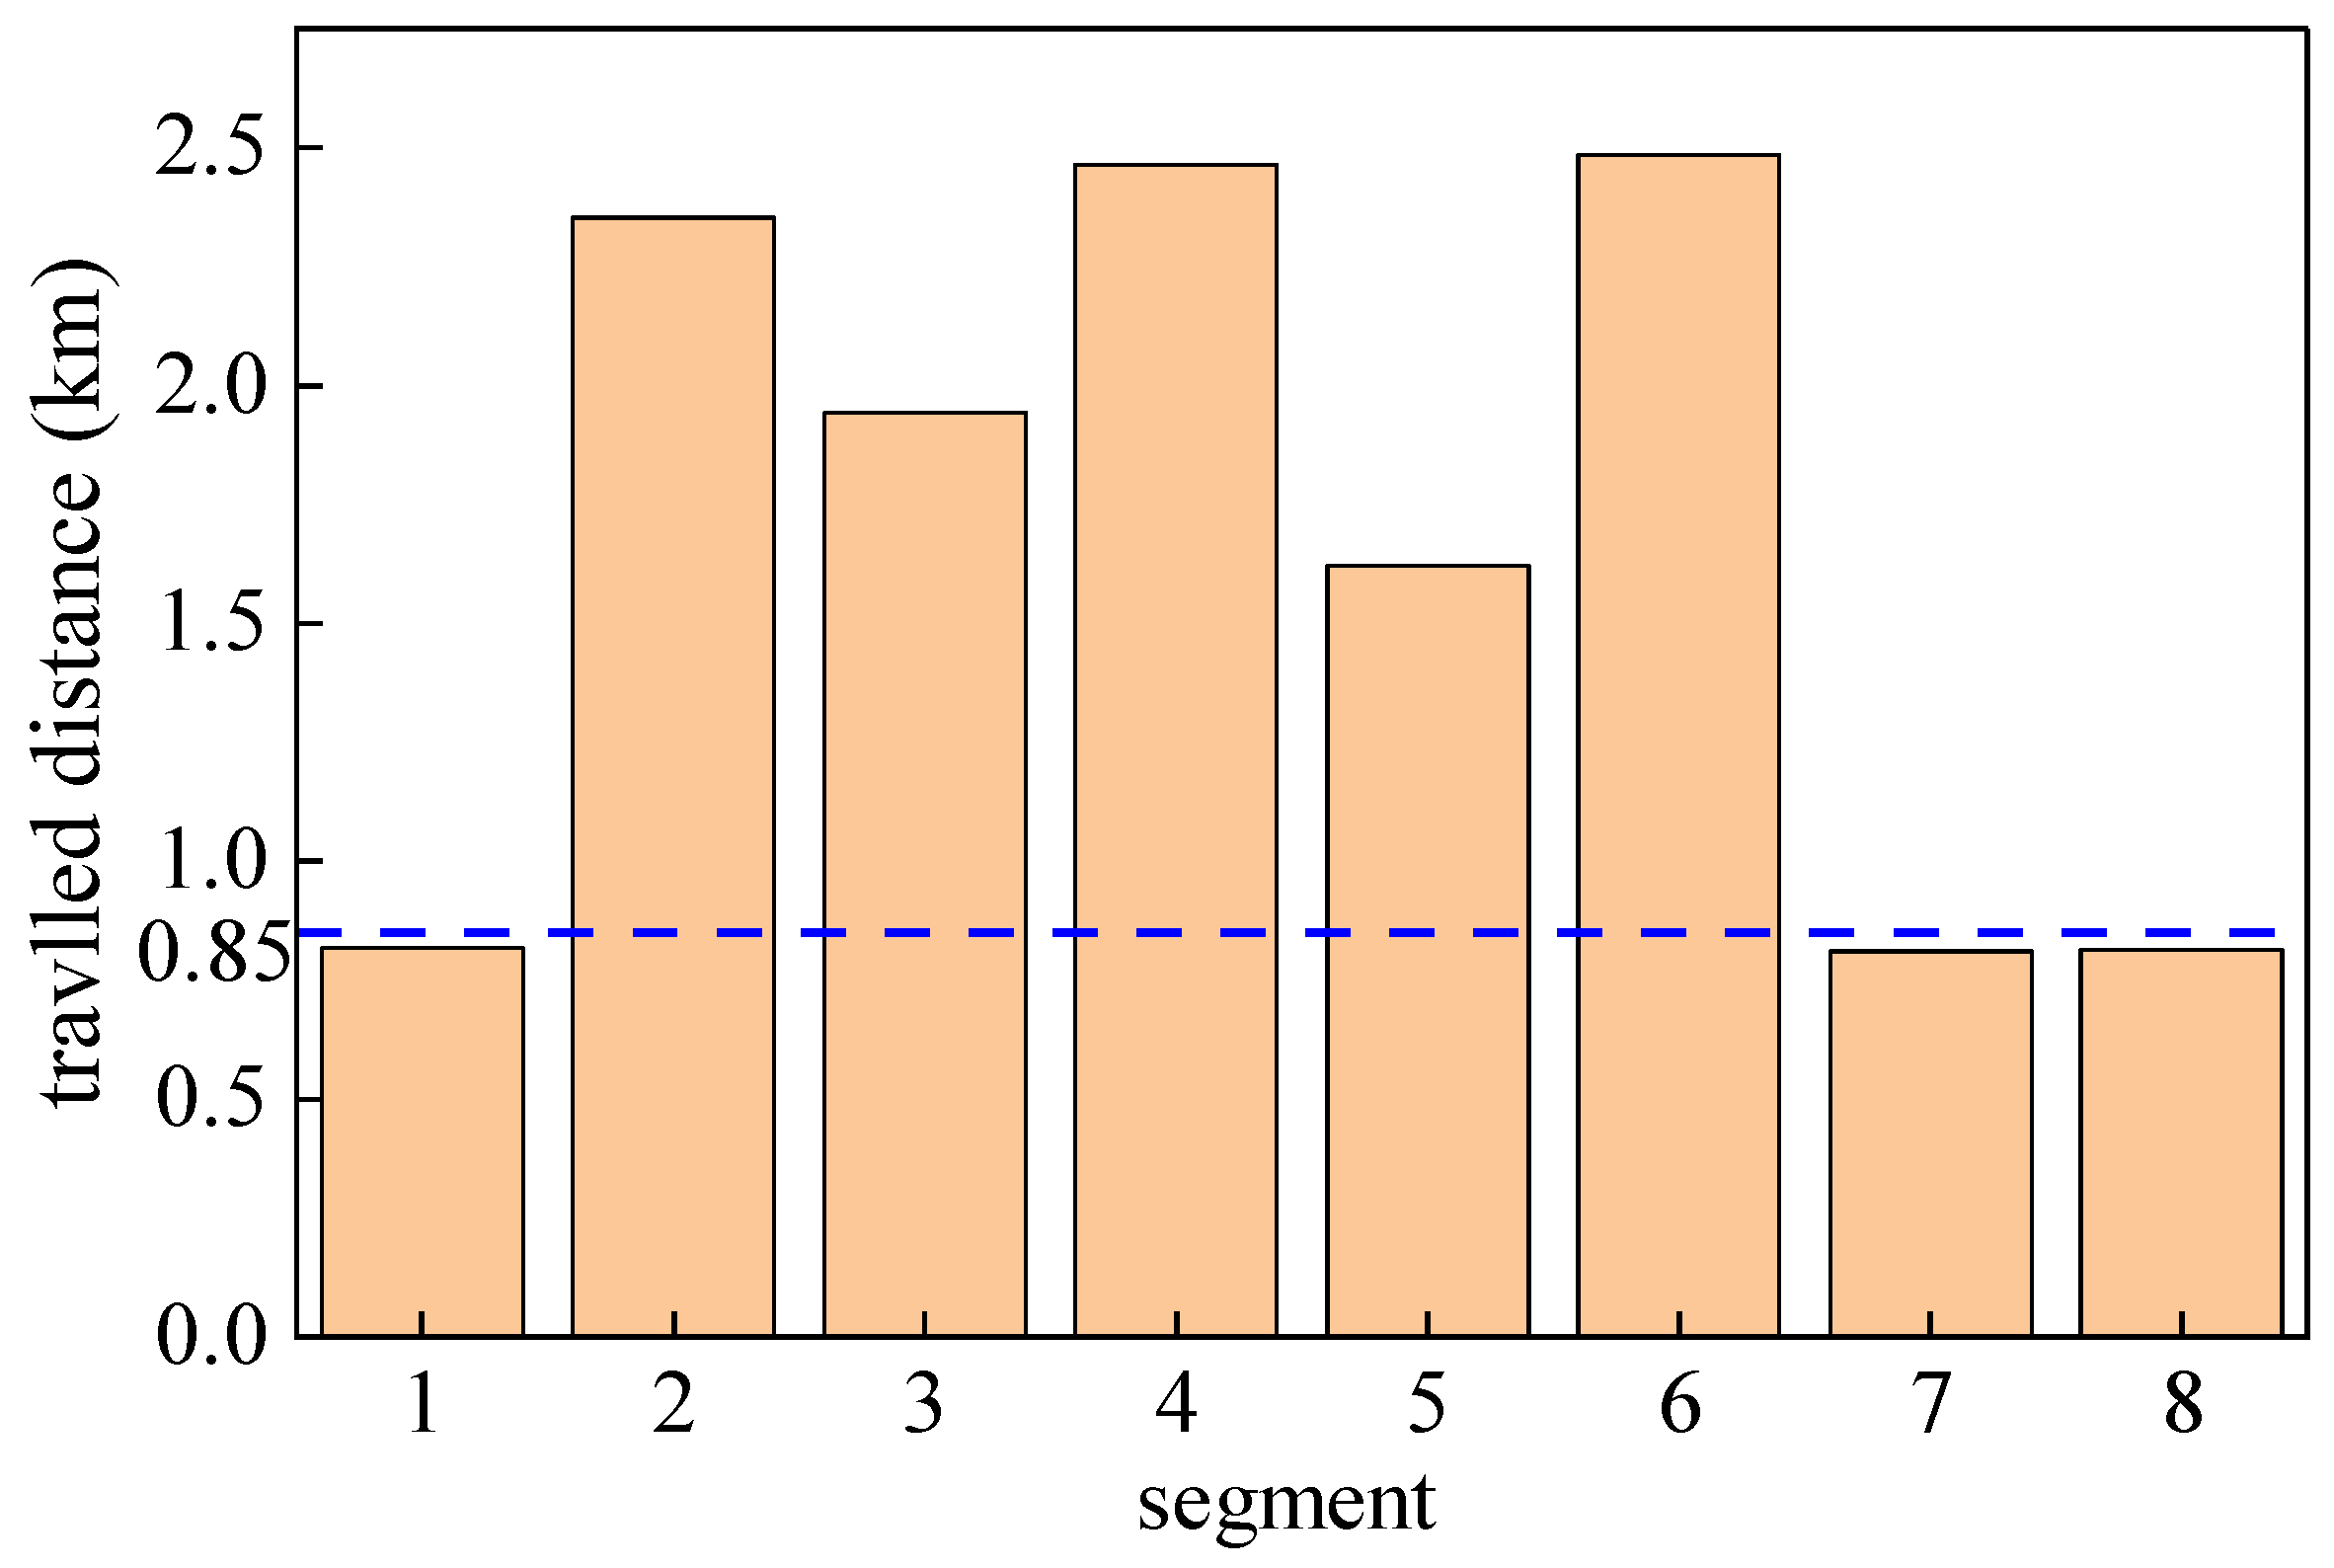

Table 1.
This is a table. Tables should be placed in the main text near to the first time they are cited.
Table 1.
This is a table. Tables should be placed in the main text near to the first time they are cited.
| Theoretical optimal energy consumption | The execution energy consumption of the GRU predictor |
The execution energy consumption of the LSTM predictor | The execution energy consumption of the TCN predictor |
|||||
| (g) | (L/100km) | (g) | (L/100km) | (g) | (L/100km) | (g) | (L/100km) | |
| segment 1 | 10.41 | 1.70 | 26.16 | 4.28 | 28.80 | 4.71 | 34.46 | 5.63 |
| segment 2 | 31.84 | 1.80 | 78.80 | 4.46 | 90.64 | 5.14 | 82.13 | 4.65 |
| segment 3 | 34.67 | 2.38 | 45.17 | 3.10 | 65.91 | 4.53 | 46.31 | 3.18 |
| segment 4 | 51.19 | 2.77 | 72.38 | 3.92 | 92.45 | 5.00 | 64.08 | 3.47 |
| segment 5 | 37.79 | 3.11 | 48.41 | 3.98 | 62.34 | 5.13 | 49.14 | 4.04 |
| segment 6 | 42.75 | 2.30 | 74.50 | 4.00 | 49.37 | 2.65 | 44.40 | 2.38 |
| segment 7 | 17.21 | 2.84 | 19.01 | 3.13 | 30.26 | 4.99 | 23.51 | 3.87 |
| segment 8 | 26.05 | 4.27 | 28.73 | 4.71 | 35.78 | 5.86 | 29.53 | 4.84 |
Table 2.
Table 2. The relative energy consumption of the predicted speed and the real speed for each segment.
Table 2.
Table 2. The relative energy consumption of the predicted speed and the real speed for each segment.
| Energy consumption deviation of GRU predictor | Energy consumption deviation of LSTM predictor | Energy consumption deviation of TCN predictor | |
| segment 1 | 1.51 | 2.06 | 1.50 |
| segment 2 | 1.47 | 1.85 | 1.58 |
| segment 3 | 0.30 | 0.90 | 0.34 |
| segment 4 | 0.41 | 0.81 | 0.25 |
| segment 5 | 0.28 | 0.65 | 0.30 |
| segment 6 | 0.74 | 0.15 | 0.04 |
| segment 7 | 0.10 | 0.76 | 0.37 |
| segment 8 | 0.10 | 0.37 | 0.13 |
Table 3.
Table 3. Execution energy consumption results of the GRU speed predictor and the improved version of the GRU speed predictor.
Table 3.
Table 3. Execution energy consumption results of the GRU speed predictor and the improved version of the GRU speed predictor.
| Energy consumption of the GRU predictor (g) | Improved version of GRU predictor's energy consumption for execution (g) | Energy conservation in operation and execution (g) | |
| segment 1 | 26.16 | 33.36 | -7.20 |
| segment 2 | 78.80 | 65.05 | 13.75 |
| segment 3 | 45.17 | 39.05 | 6.12 |
| segment 4 | 72.38 | 62.18 | 10.21 |
| segment 5 | 48.41 | 44.98 | 3.43 |
| segment 6 | 74.50 | 64.32 | 10.18 |
| segment 7 | 19.01 | 21.92 | -2.92 |
| segment 8 | 28.73 | 29.90 | -1.17 |
Disclaimer/Publisher’s Note: The statements, opinions and data contained in all publications are solely those of the individual author(s) and contributor(s) and not of MDPI and/or the editor(s). MDPI and/or the editor(s) disclaim responsibility for any injury to people or property resulting from any ideas, methods, instructions or products referred to in the content. |
© 2025 by the authors. Licensee MDPI, Basel, Switzerland. This article is an open access article distributed under the terms and conditions of the Creative Commons Attribution (CC BY) license (http://creativecommons.org/licenses/by/4.0/).
Copyright: This open access article is published under a Creative Commons CC BY 4.0 license, which permit the free download, distribution, and reuse, provided that the author and preprint are cited in any reuse.


