1. Introduction
Yamen architecture, as an essential type of official architecture in ancient China, reflects distinctive institutional culture and social order. These structures, shaped by hierarchical systems and ritual norms, feature expansive, majestic main halls that represent governmental authority and spatial order, thereby possessing considerable cultural heritage significance [
1]. Nevertheless, historical shifts and societal upheavals have resulted in a limited number of surviving examples, underscoring the necessity for systematic investigation and research [
2].
The Suzhou Provincial Judicial Commissioner's Office (Suzhou Ancha Shishu) represents a significant surviving example of official architecture in Suzhou. Its origin can be traced back to the Water Conservancy Branch Office established in the early Ming dynasty, which was reorganized into the Prefectural Surveillance Branch in the 14th year of the Hongzhi reign (1501). It was subsequently designated as the Military Defense Circuit Office, specializing in military affairs. During the Yongzheng period, the Military Defense Office was relocated to Taicang, while the Prefectural Surveillance Office was transferred from Jiangning to Suzhou and reestablished as the Prefectural Judicial Surveillance Office, thereby consolidating the typical spatial configuration of Ming–Qing official yamen. The complex follows the layout pattern of “front court and rear residence,” adhering to the architectural principle of yamen design, characterized by axial symmetry. Three building routes are preserved today. The central route consists of a three-bay main gate, a screen wall, and three contiguous courtyards. The initial two houses (Gongzidian) were built in the conventional official architectural style, featuring front and rear halls, each five bays wide, connected by a walkway with a roll-shaped shed canopy, which initially served as office rooms. The last courtyard contains a two-story hall linked to the preceding structures by corridors. On the eastern first route, two halls and one two-story edifice persist, whilst the eastern second route showcases a garden (Beiyuan) in front of its two-story hall. A narrow passageway (Beinong) links the central and eastern routes [
3].
The Suzhou Provincial Judicial Commissioner's Office, a significant official yamen from the Ming and Qing dynasties to the Republican period, served as both a regional judicial and administrative center and the headquarters of a provincial supervisory authority, embodying substantial historical and cultural importance. Nonetheless, despite its architectural continuity with the present, the thermal and hygrothermal performance of its large-scale spaces no longer meets contemporary requirements for indoor comfort. This project aims to enhance the thermal and hygrothermal conditions of Beihua Hall and the Rear Hall, two significant high and large areas within the complex, without affecting the building's historical integrity. The research actively engages with and applies the comprehensive theoretical and methodological framework proposed in the Washington Charter and the Burra Charter, which spans from value assessment and planning management to technical implementation.
Qi et al. [
4] proposed improving the thermal comfort of traditional dwellings in Ulanqab during winter by enhancing insulation performance and adopting appropriate window-to-wall ratios. Similarly, Bi [
5] suggested passive strategies such as optimizing spatial layouts and improving the thermal performance of the building envelope to enhance the indoor thermal environment of brick–timber dwellings in the mountainous areas of southern Henan.At the same time, these studies demonstrate specific improvements in the indoor environment of historic buildings, the principle of “restoring as before” in heritage conservation constrains the application of advanced building technologies. Consequently, passive strategies alone are insufficient to achieve complete thermal comfort, and active measures, such as HVAC systems, remain essential for improving indoor environmental quality.
It is noteworthy that in high and large historic buildings, such as yamen complexes, the operation of air-conditioning systems in winter often leads to issues, including vertical temperature stratification and difficulty heating the lower occupied zone. Previous studies have demonstrated that appropriate supply air strategies can significantly improve the distribution of warm and cool air in such spaces. Du [
6], for example, investigated the HVAC system of the Auditorium of Southeast University, a heritage building from the Republic of China period, and found that altering supply-air configurations could mitigate uneven temperature distribution, thermal stratification on upper levels, and insufficient return-air efficiency. Similarly, Zheng et al. [
7] proposed optimizing supply air temperature, adopting floor radiant heating, and reasonably configuring supply and return air outlets to improve airflow organization in a tall hall in a cold region. Such studies provide valuable technical references for optimizing HVAC operation in high and large historic buildings, particularly under the conservation principle of “restoration as before.”
Due to limitations in on-site measurements, current research on the thermal environment of historic buildings primarily relies on numerical simulations, with different software offering distinct advantages for calculating building thermal loads, analyzing airflow, and evaluating thermal comfort. To enhance the accuracy of simulation results, some studies have adopted coupled simulation approaches, enabling more refined modeling of indoor thermal environments. For instance, Chen et al. [
8] developed a coupled simulation model integrating Modelica, EnergyPlus, and Fast Fluid Dynamics (FFD). They applied a dynamic simulation strategy to assess thermal comfort in an ample office space in Wuhan and subsequently proposed improvements to the HVAC system design to enhance indoor comfort. Similarly, Li et al. [
9] employed an EnergyPlus–CFD coupling strategy to simulate a large gymnasium in a hot-summer–cold-winter region, using EnergyPlus surface temperature data as boundary conditions for the CFD calculations. In contrast, the convective heat transfer coefficients and indoor air temperature fields derived from CFD were fed back into EnergyPlus for energy consumption analysis, thereby improving the accuracy of energy performance simulations.
Building on this, the present study proposes a coupled simulation approach that integrates DesignBuilder and Fluent. DesignBuilder offers the advantages of intuitive modeling and efficient thermal load calculations. At the same time, Fluent facilitates accurate airflow simulation, together providing a more accurate representation of the impact of different air supply strategies on airflow organization and indoor thermal conditions in high and large spaces. Taking the Suzhou Provincial Judicial Commissioner's Office as the primary case study, this research applies a multi-software-coupled simulation to examine the effects of various supply air scenarios on temperature and velocity fields, and on thermal comfort. The aim is to explore the indoor thermal environment of historic high and large spaces during winter HVAC operation and to propose effective optimization strategies for air-supply design in such heritage buildings.
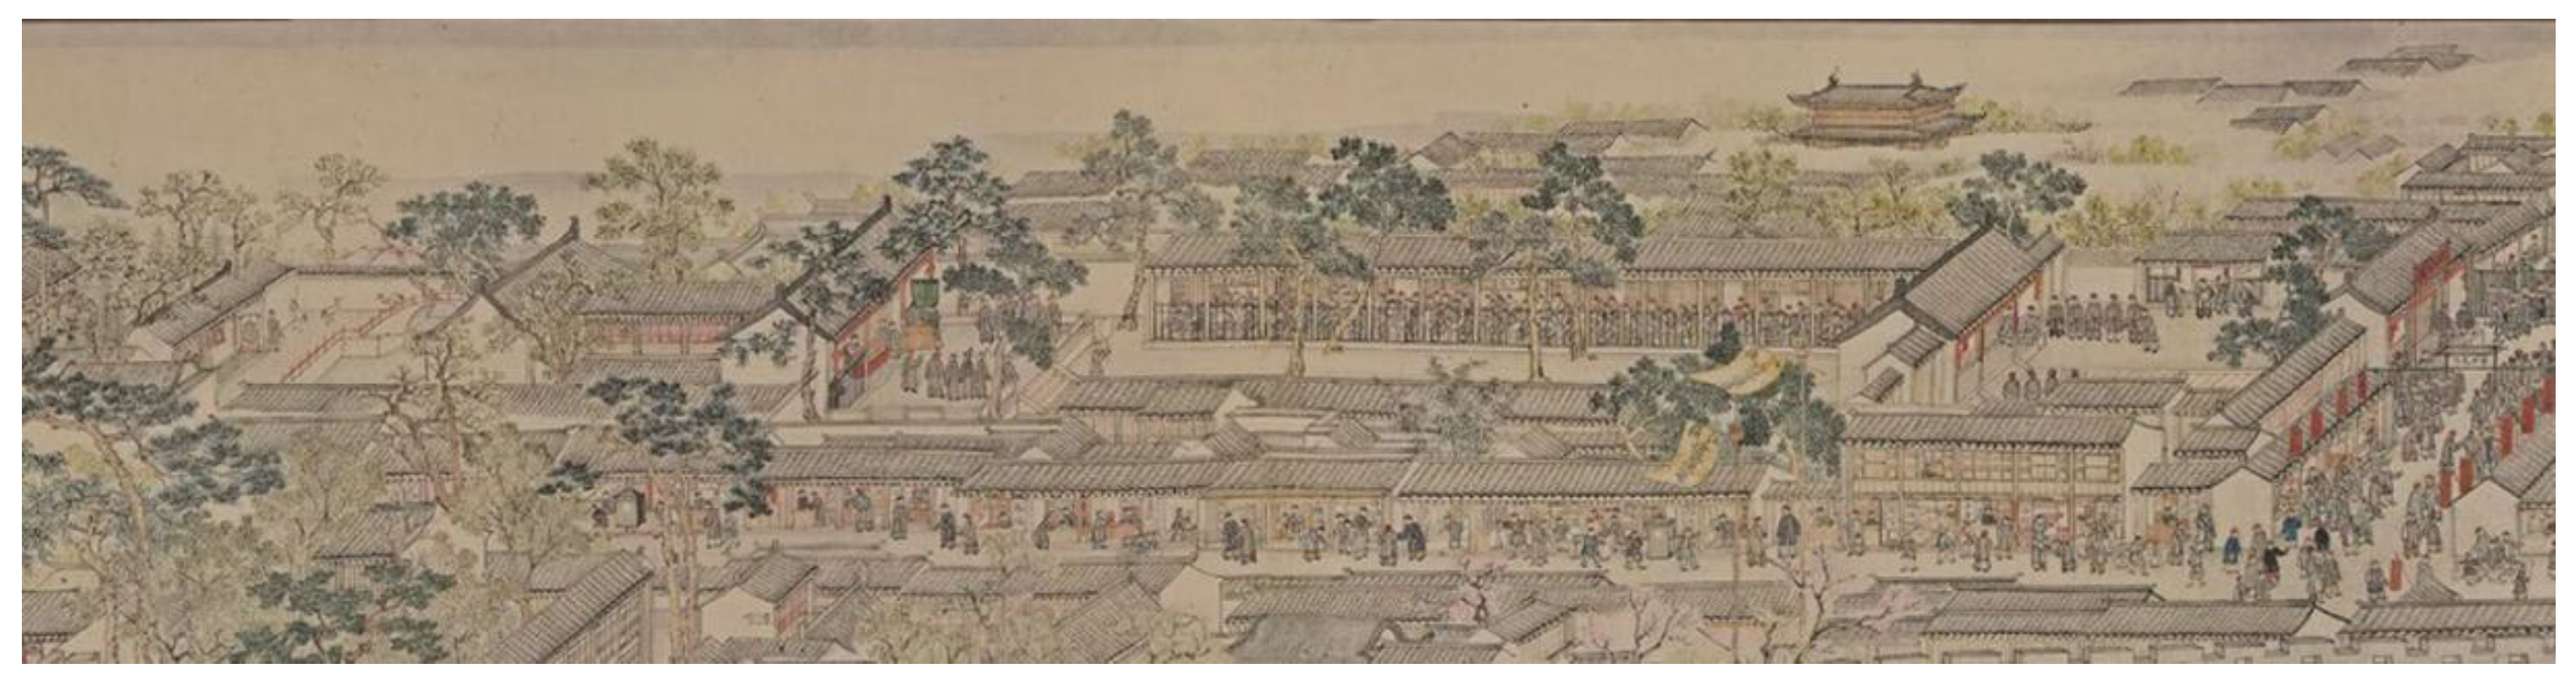
Figure 1.
The scene of the office of the Suzhou Provincial Judicial Commissioner's Office as depicted in the "Prosperous Picture of Gusu" in 1759.
Figure 1.
The scene of the office of the Suzhou Provincial Judicial Commissioner's Office as depicted in the "Prosperous Picture of Gusu" in 1759.
Figure 2.
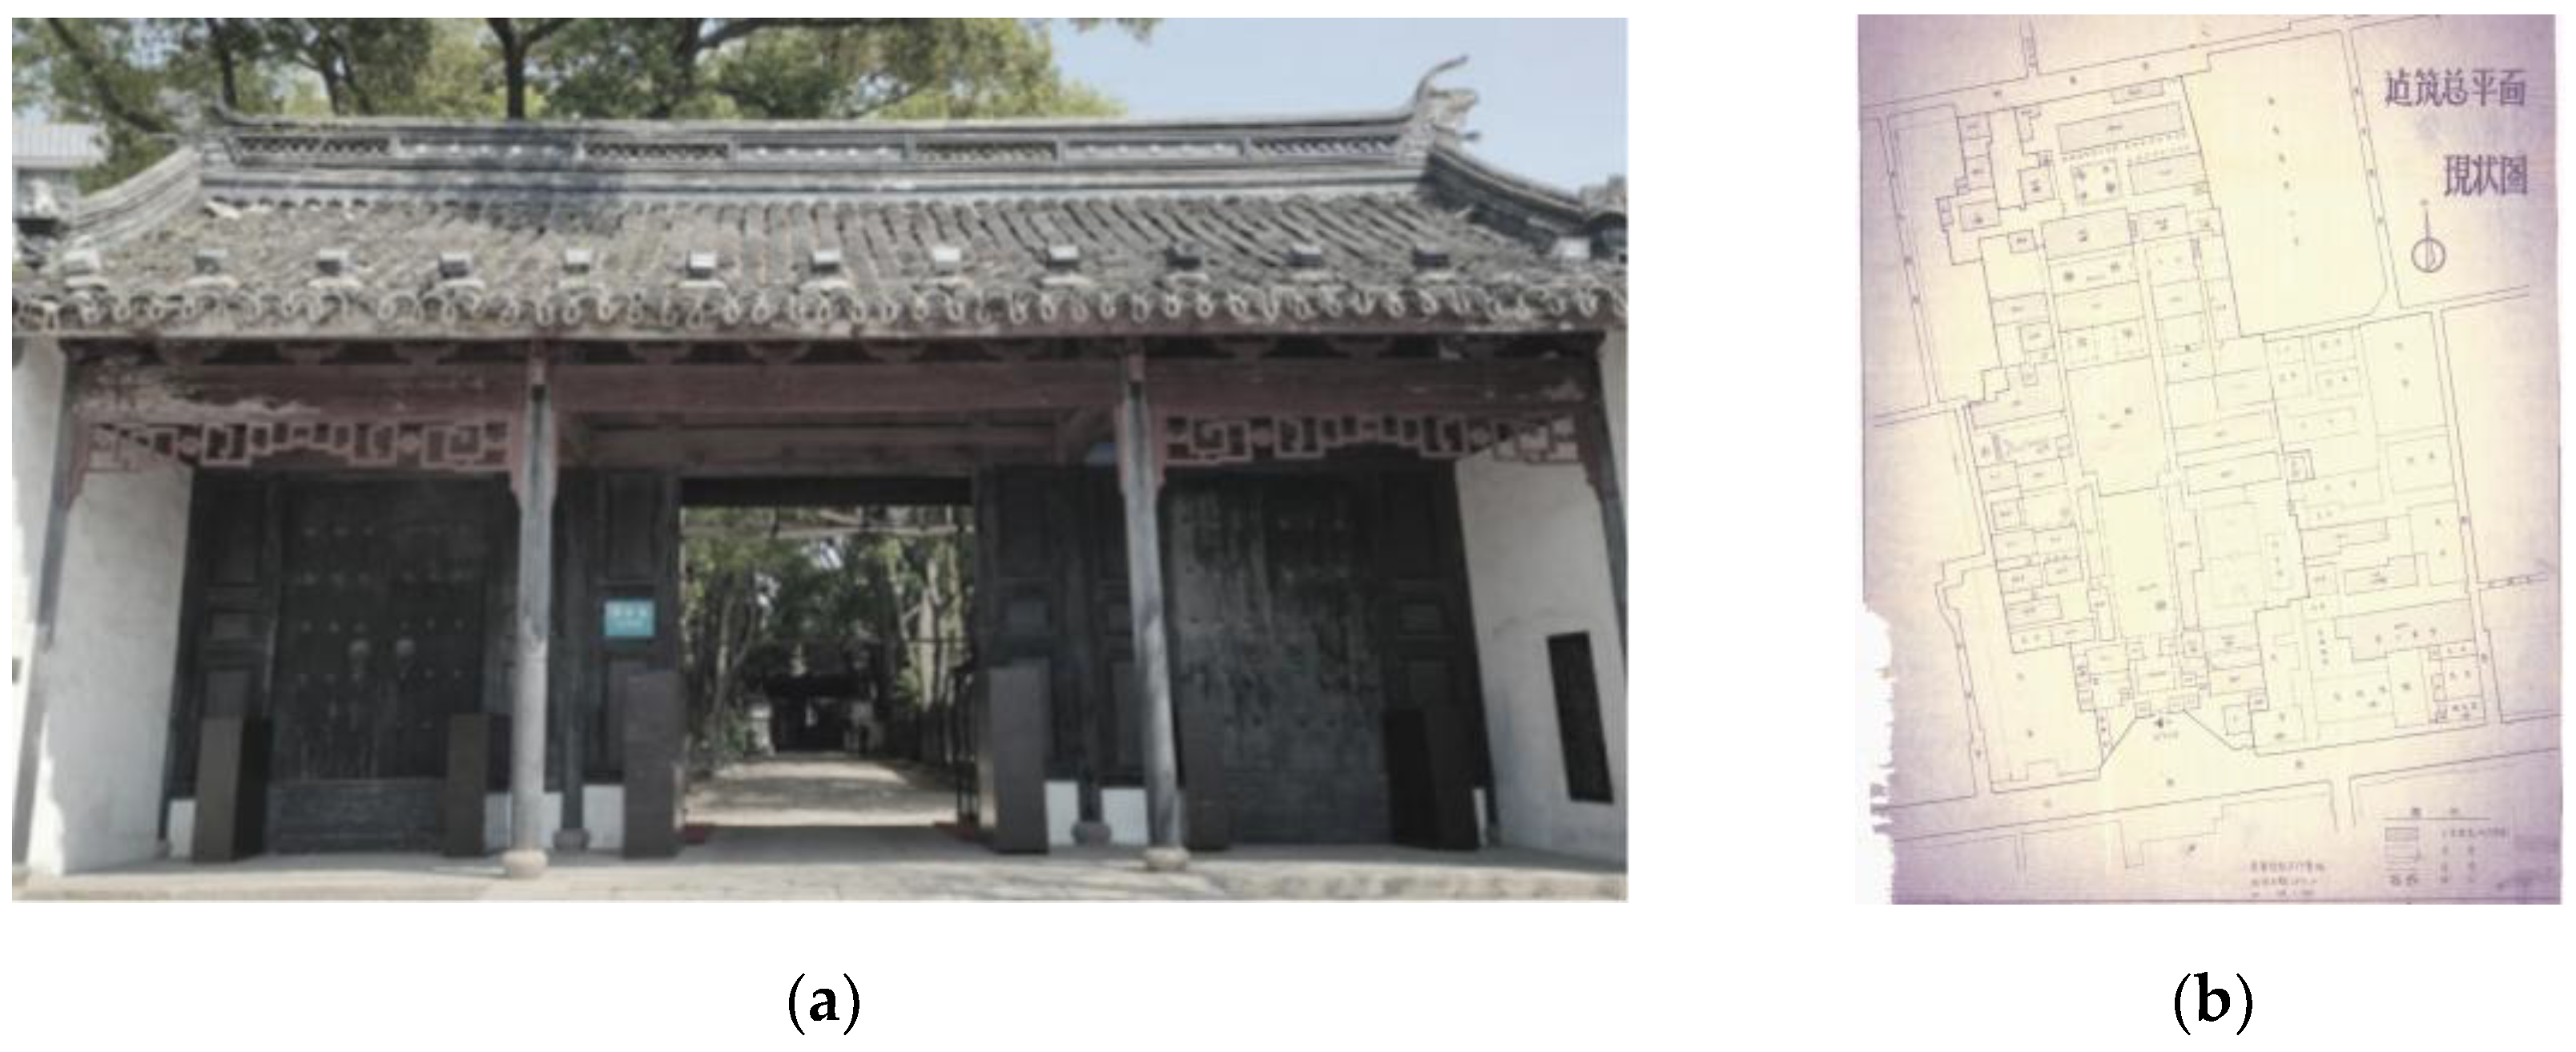
(a) The former site of the Suzhou Provincial Judicial Commissioner's Office, the ceremonial gate; (b) Surveying and mapping map of the Suzhou Provincial Judicial Commissioner's Office in 1979.
Figure 2.
(a) The former site of the Suzhou Provincial Judicial Commissioner's Office, the ceremonial gate; (b) Surveying and mapping map of the Suzhou Provincial Judicial Commissioner's Office in 1979.
2. Materials and Methods
2.1. Research Methods
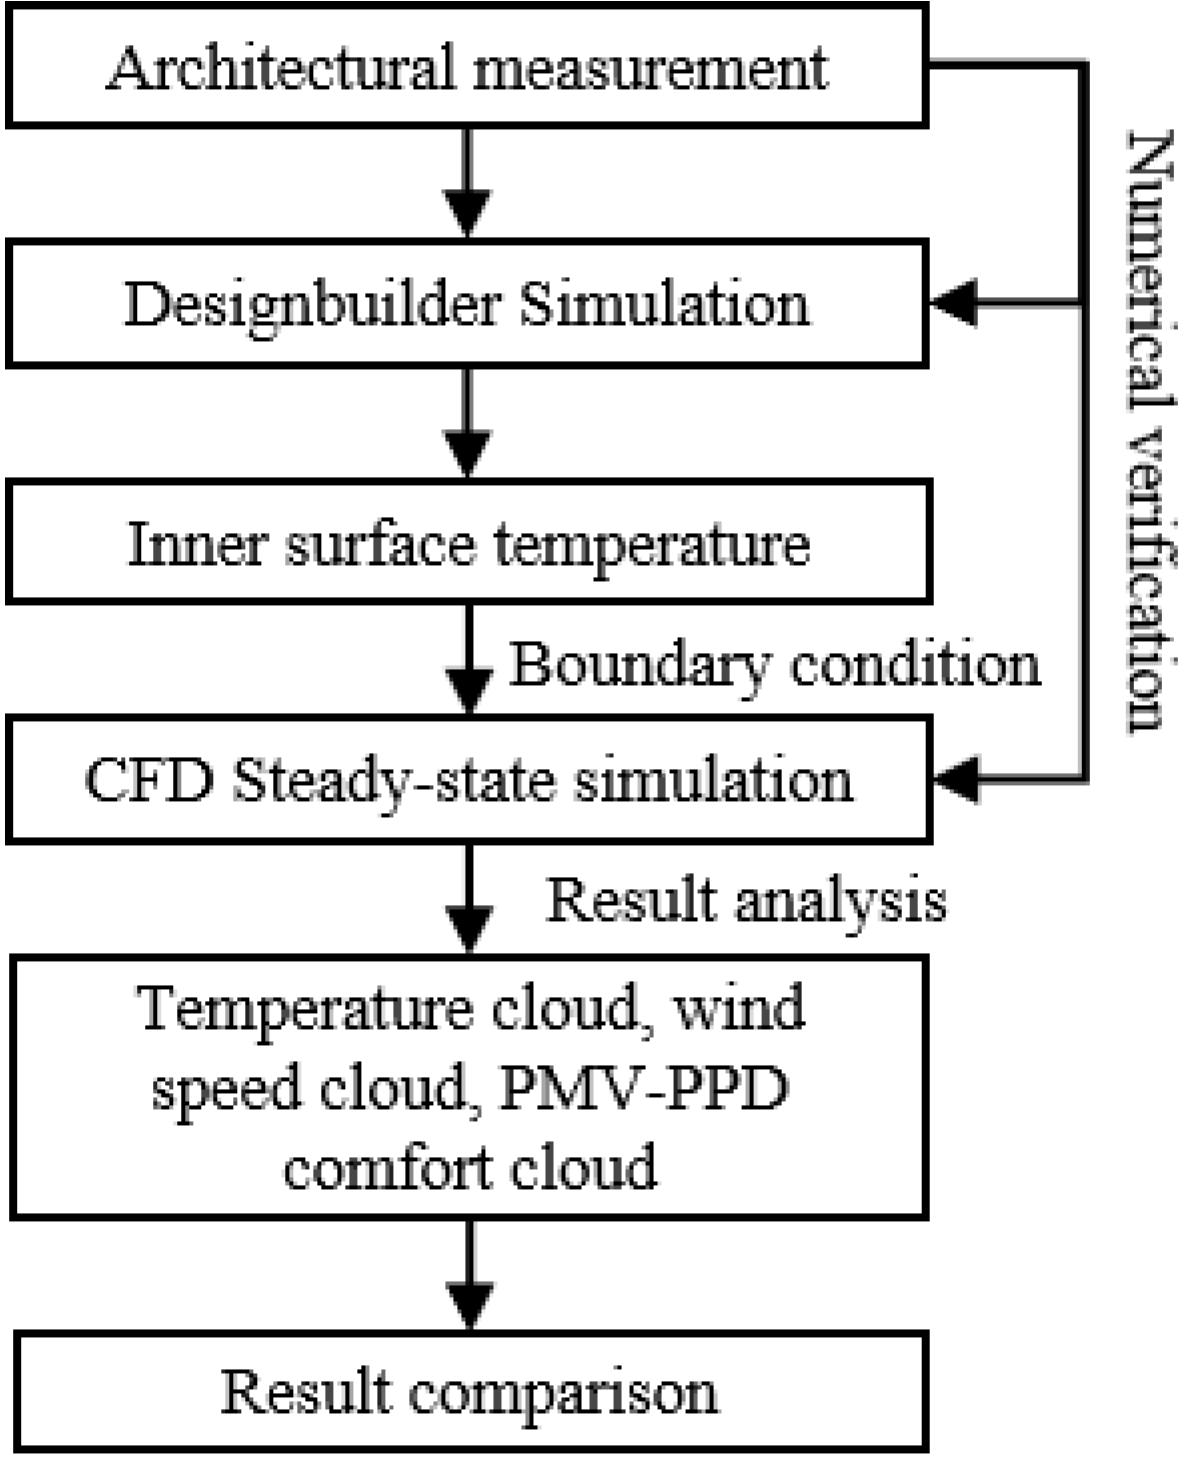
This work employs a linked simulation methodology, combining field-measurement data with DesignBuilder and Fluent to conduct an accurate assessment of thermal comfort in high and large historic spaces during air-conditioning operation. The overall simulation workflow is illustrated in
Figure 3. Within this framework, DesignBuilder is initially employed to compute parameters such as the interior surface temperatures of the building envelope, which are subsequently imported into Fluent as boundary conditions for CFD simulations. Various scenarios integrating distinct supply air angles, velocities, and outlet locations are then evaluated, facilitating a more intuitive and accurate analysis of temperature fields, velocity distributions, and thermal comfort metrics (PMV–PPD) under different air supply conditions. This approach establishes a complete workflow for simulating the thermal environment in large historic spaces.
2.2. Field Measurement of the Building
2.2.1. Measured Building
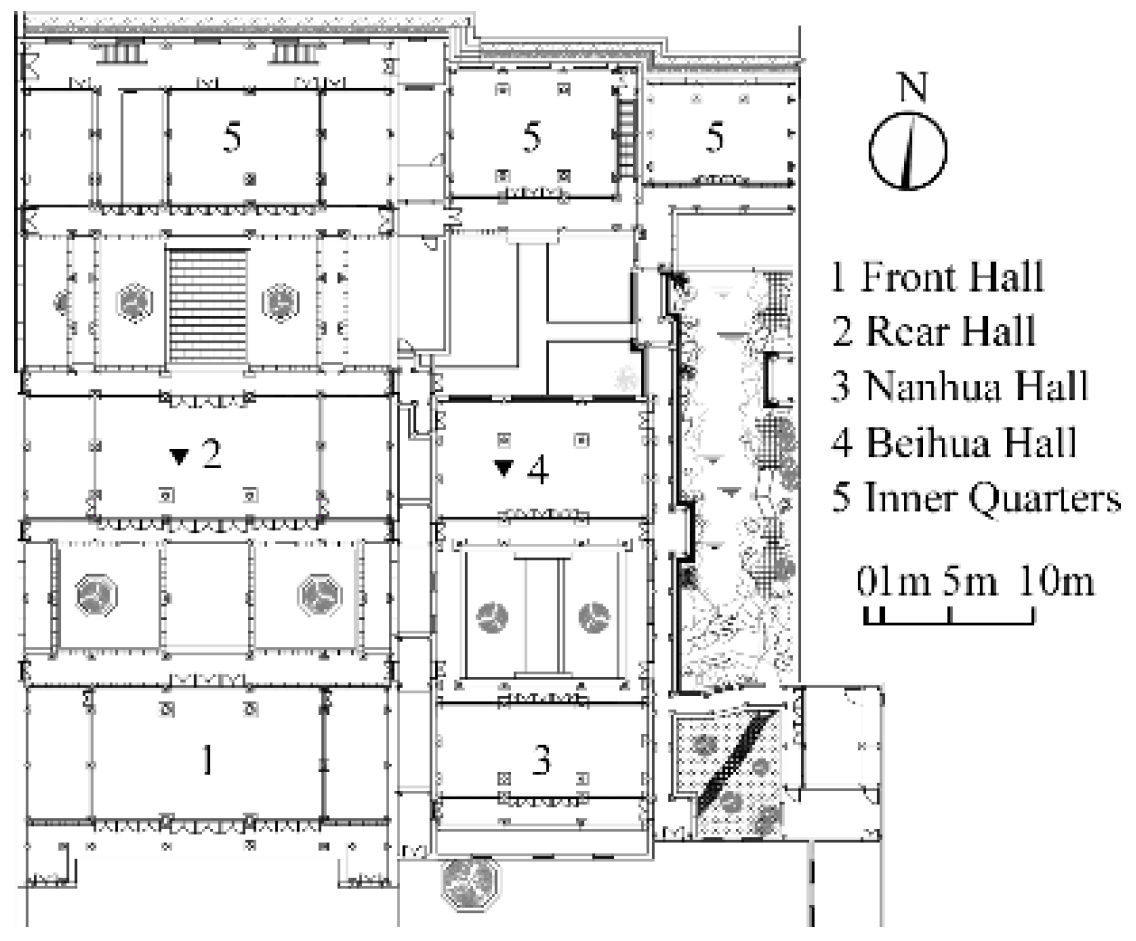
The Beihua Hall of the Suzhou Provincial Judicial Commissioner's Office was selected as the measurement site to collect reference field data on the thermal environment in high and large buildings (
Figure 4). A CFD model was developed using measured data from Beihua Hall for calibration and parameter validation. After validating the simulation methods, a CFD model of the Rear Hall was developed to examine several operational situations. This method guarantees the verifiability and technical soundness of the simulations.
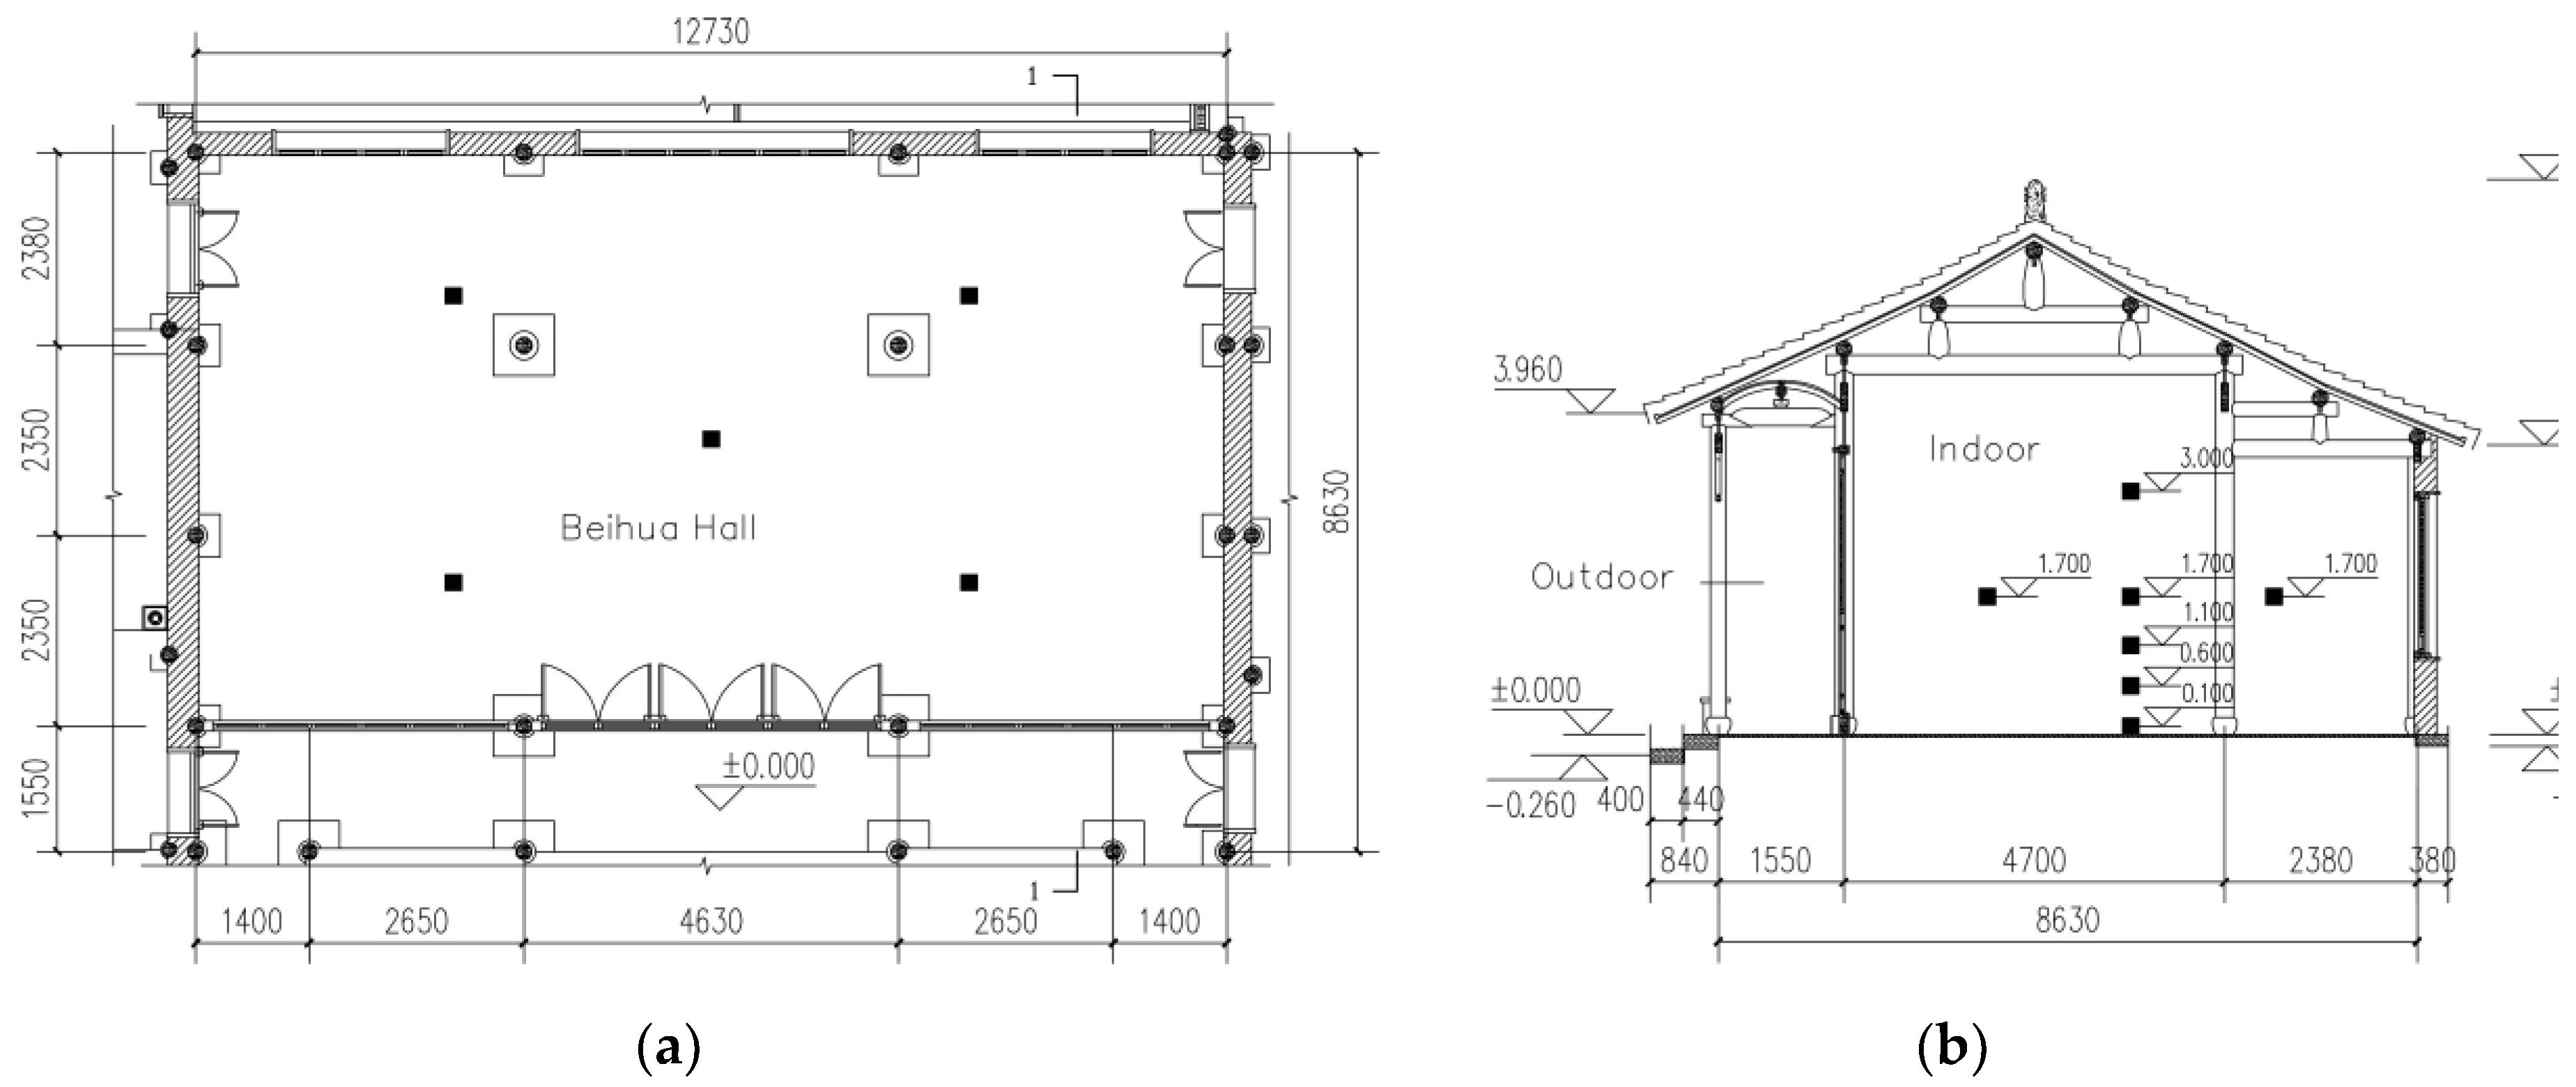
Beihua Hall features a brick–timber structure with a Chinese-style hard-gable roof and faces south. The interior has a clear height of approximately 6.2 m, a width of about 12.7 m, and a depth of roughly 7 m. Wooden lattice doors and windows are located on the north and south sides, while brick walls delineate the eastern and western boundaries. The building envelope exhibits poor airtightness and thermal insulation, and the interior features a floor-standing air-conditioning system.
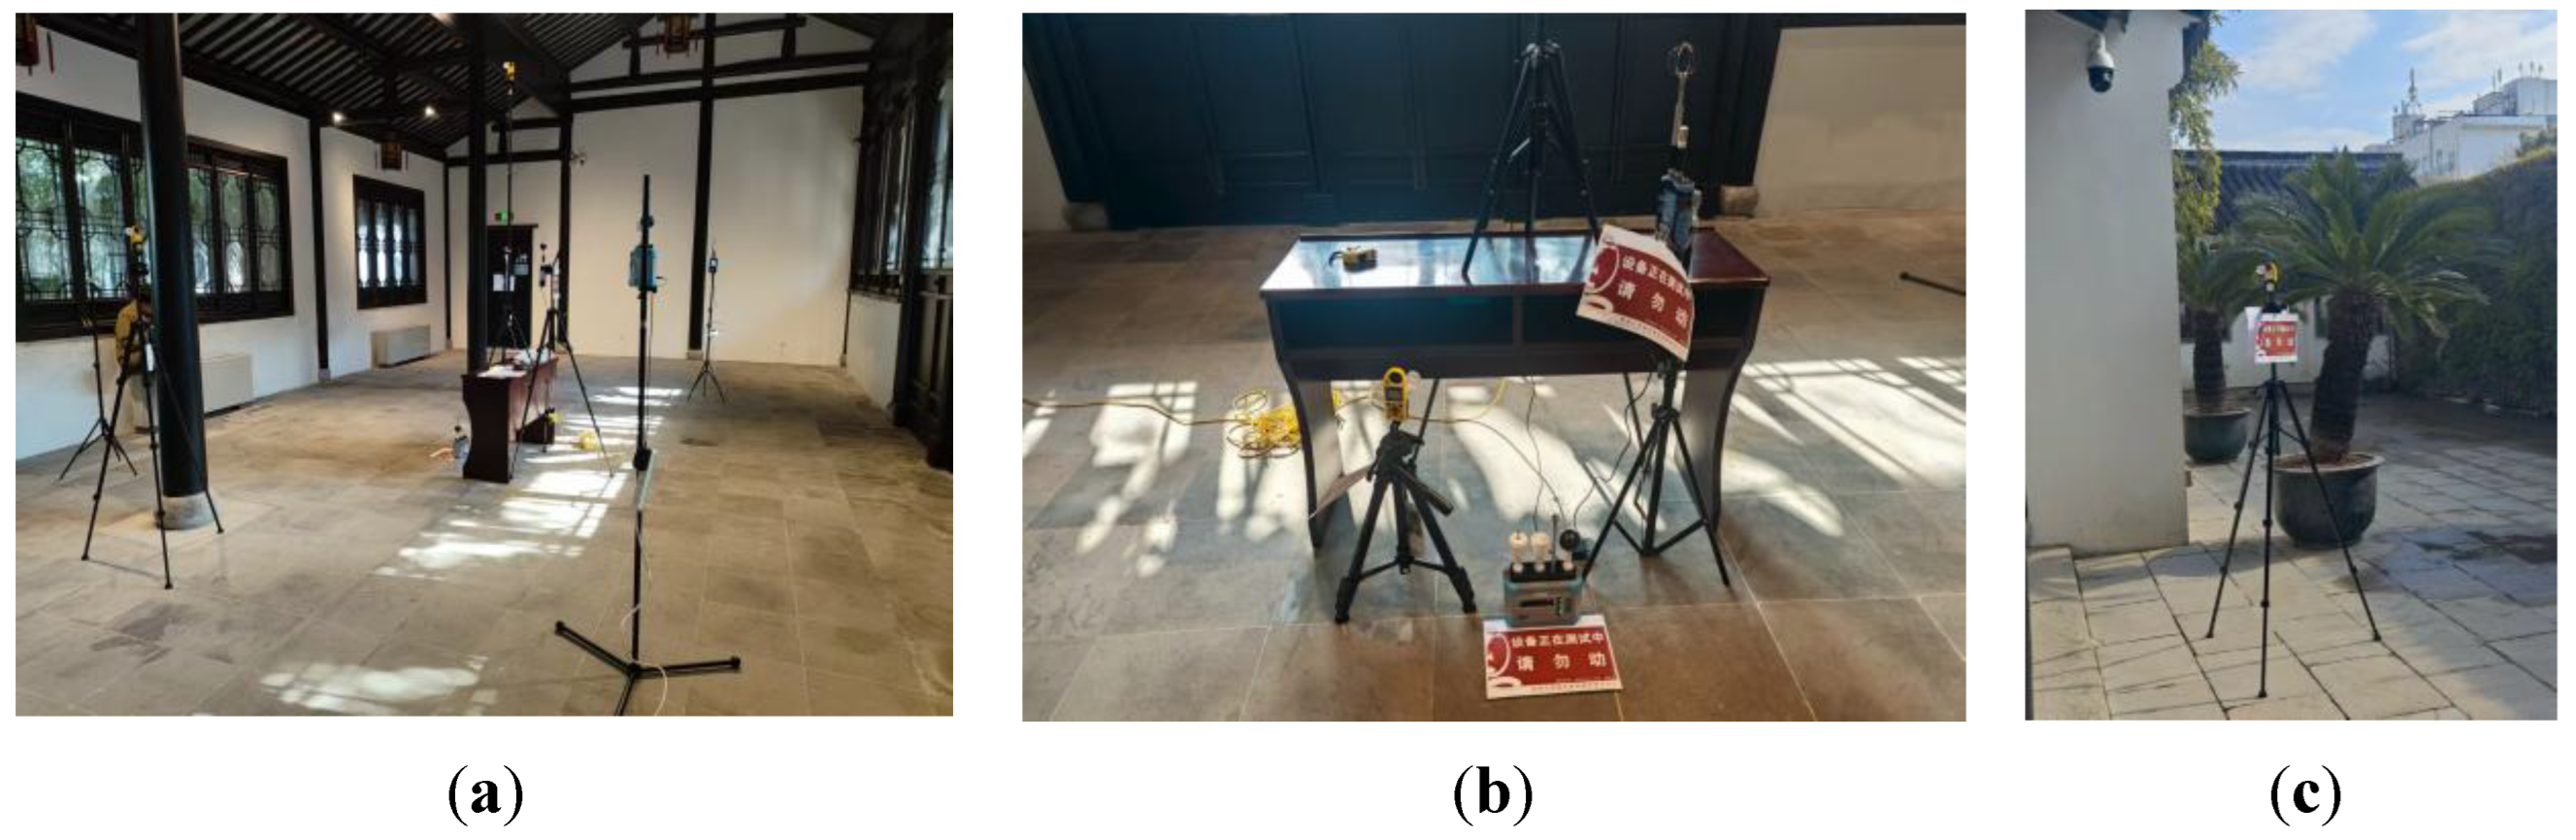
2.2.2. Measurement Methods
Field measurements were performed on standard winter heating days (2–4 January 2024). All indoor air-conditioning units were set to 32°C, and doors and windows were closed to simulate typical usage conditions. Indoor measurement points were organized in accordance with the Standard for Testing Methods of Building Thermal Environment (JGJ/T 347—2014) [
10], featuring five equally spaced points along the two diagonal lines of the testing area. The central measurement point was monitored at five heights (0.1 m, 0.6 m, 1.1 m, 1.7 m, and 3 m), whereas the other points were measured at a height of 1.7 m (
Figure 5). A weather station was installed in an open outdoor location to capture real-time environmental data (
Figure 6). All equipment documented readings at 5-minute intervals for a continuous 48-hour duration to guarantee data stability.
2.2.3. Measurement Results
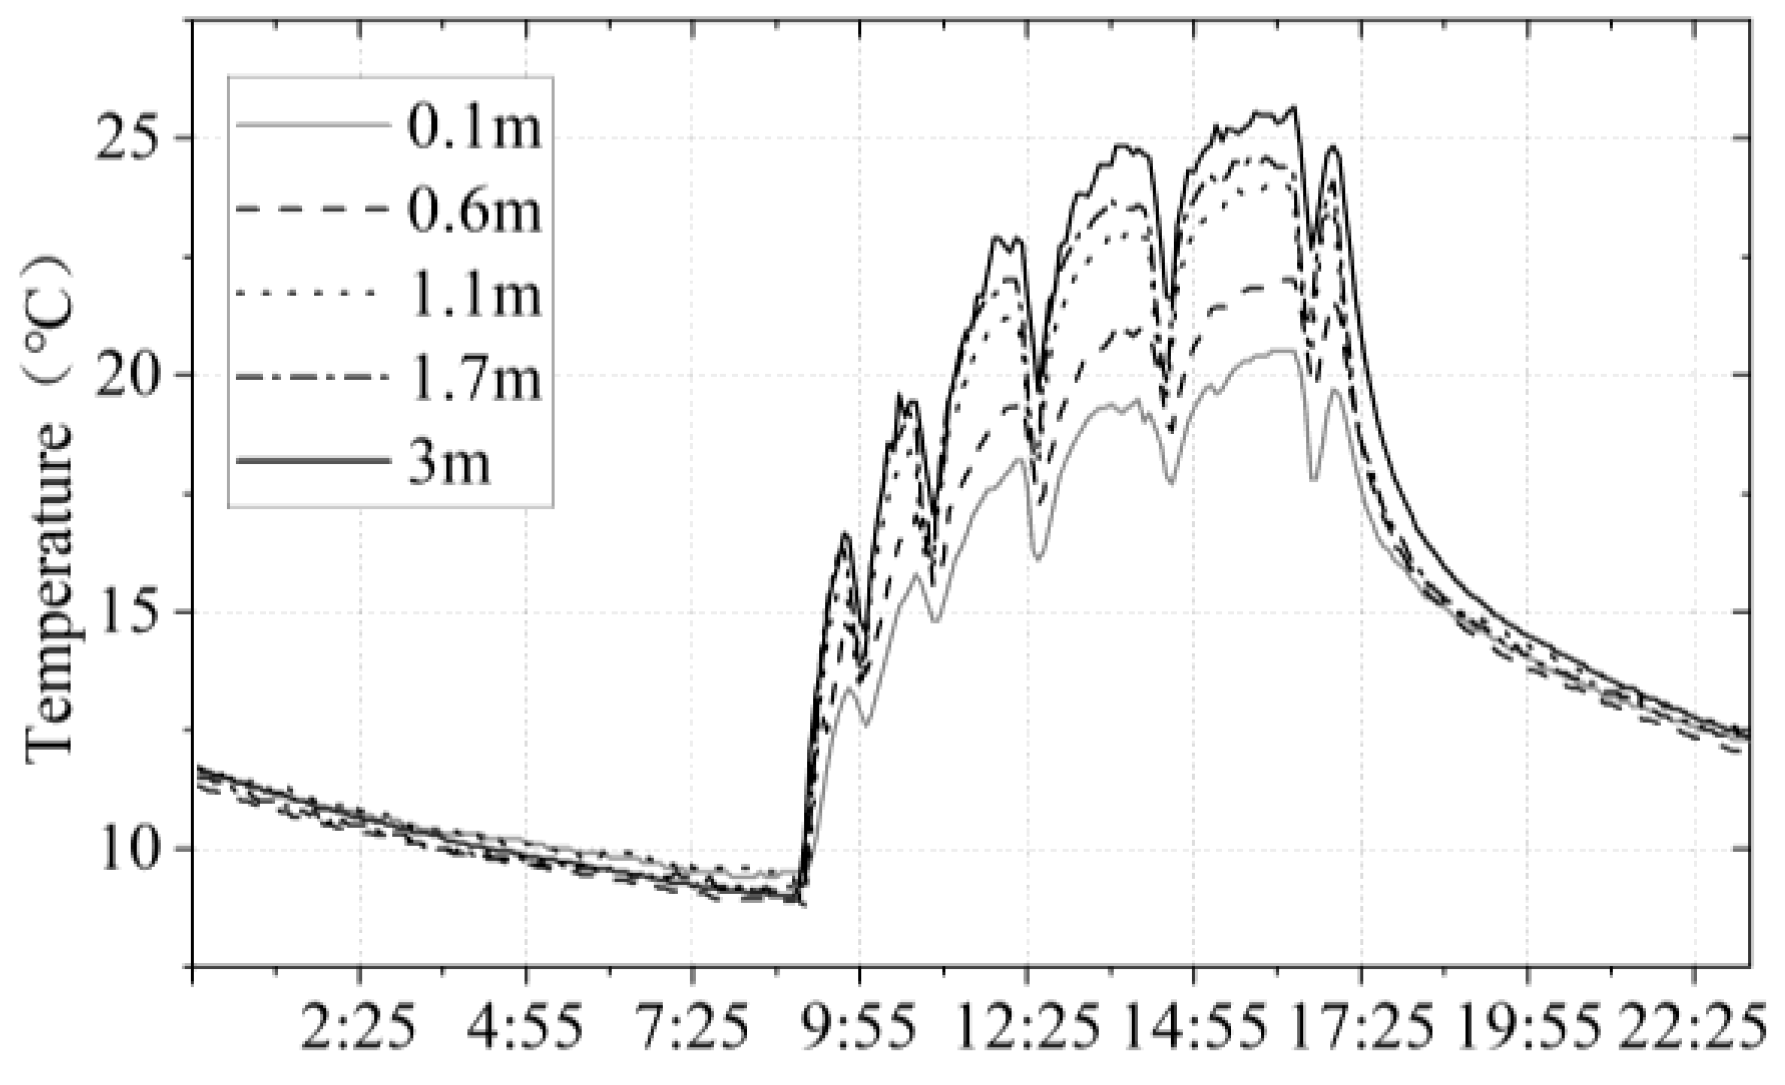
The measurement data from January 3, which indicate relatively stable operational conditions, were chosen for the study. The results indicate temperature fluctuations at the central measurement point at five heights (0.1 m, 0.6 m, 1.1 m, 1.7 m, and 3 m) (
Figure 7). Analysis of
Figure 7 reveals that temperature variations increase with height: higher measurement points exhibit larger fluctuations, faster heating rates, and higher overall temperatures. This phenomenon is attributed to buoyancy-driven airflow driven by density differences between warm and cool air [
11]. The temperature differential between the 0.1 m and 3 m stations reached 4.73 °C at 16:30, when indoor temperatures had equilibrated, indicating pronounced vertical temperature stratification in Beihua Hall under heating conditions.
These field measurements confirm the objective existence of vertical thermal stratification in high and large historic buildings [
12] and furnish essential boundary condition parameters and model validation data for future numerical simulations [
13].
2.3. Simulation Validation
2.3.1. Thermal Environment Simulation Validation
A thermal model of the target building was created in DesignBuilder, with the building envelope's physical characteristics defined from on-site measurements and historical records. Relevant thermal performance parameters are summarized in
Table 1. Outdoor weather conditions were represented using typical meteorological year data for Suzhou, and simulations were conducted for a typical winter day. The occupant activity was set to light activity (MET = 1.2) with a clothing insulation of clo = 1.0. The HVAC system was calibrated to reflect actual operating conditions. Considering the poor airtightness of doors and windows in historic buildings, an infiltration rate of 5 ach was applied [
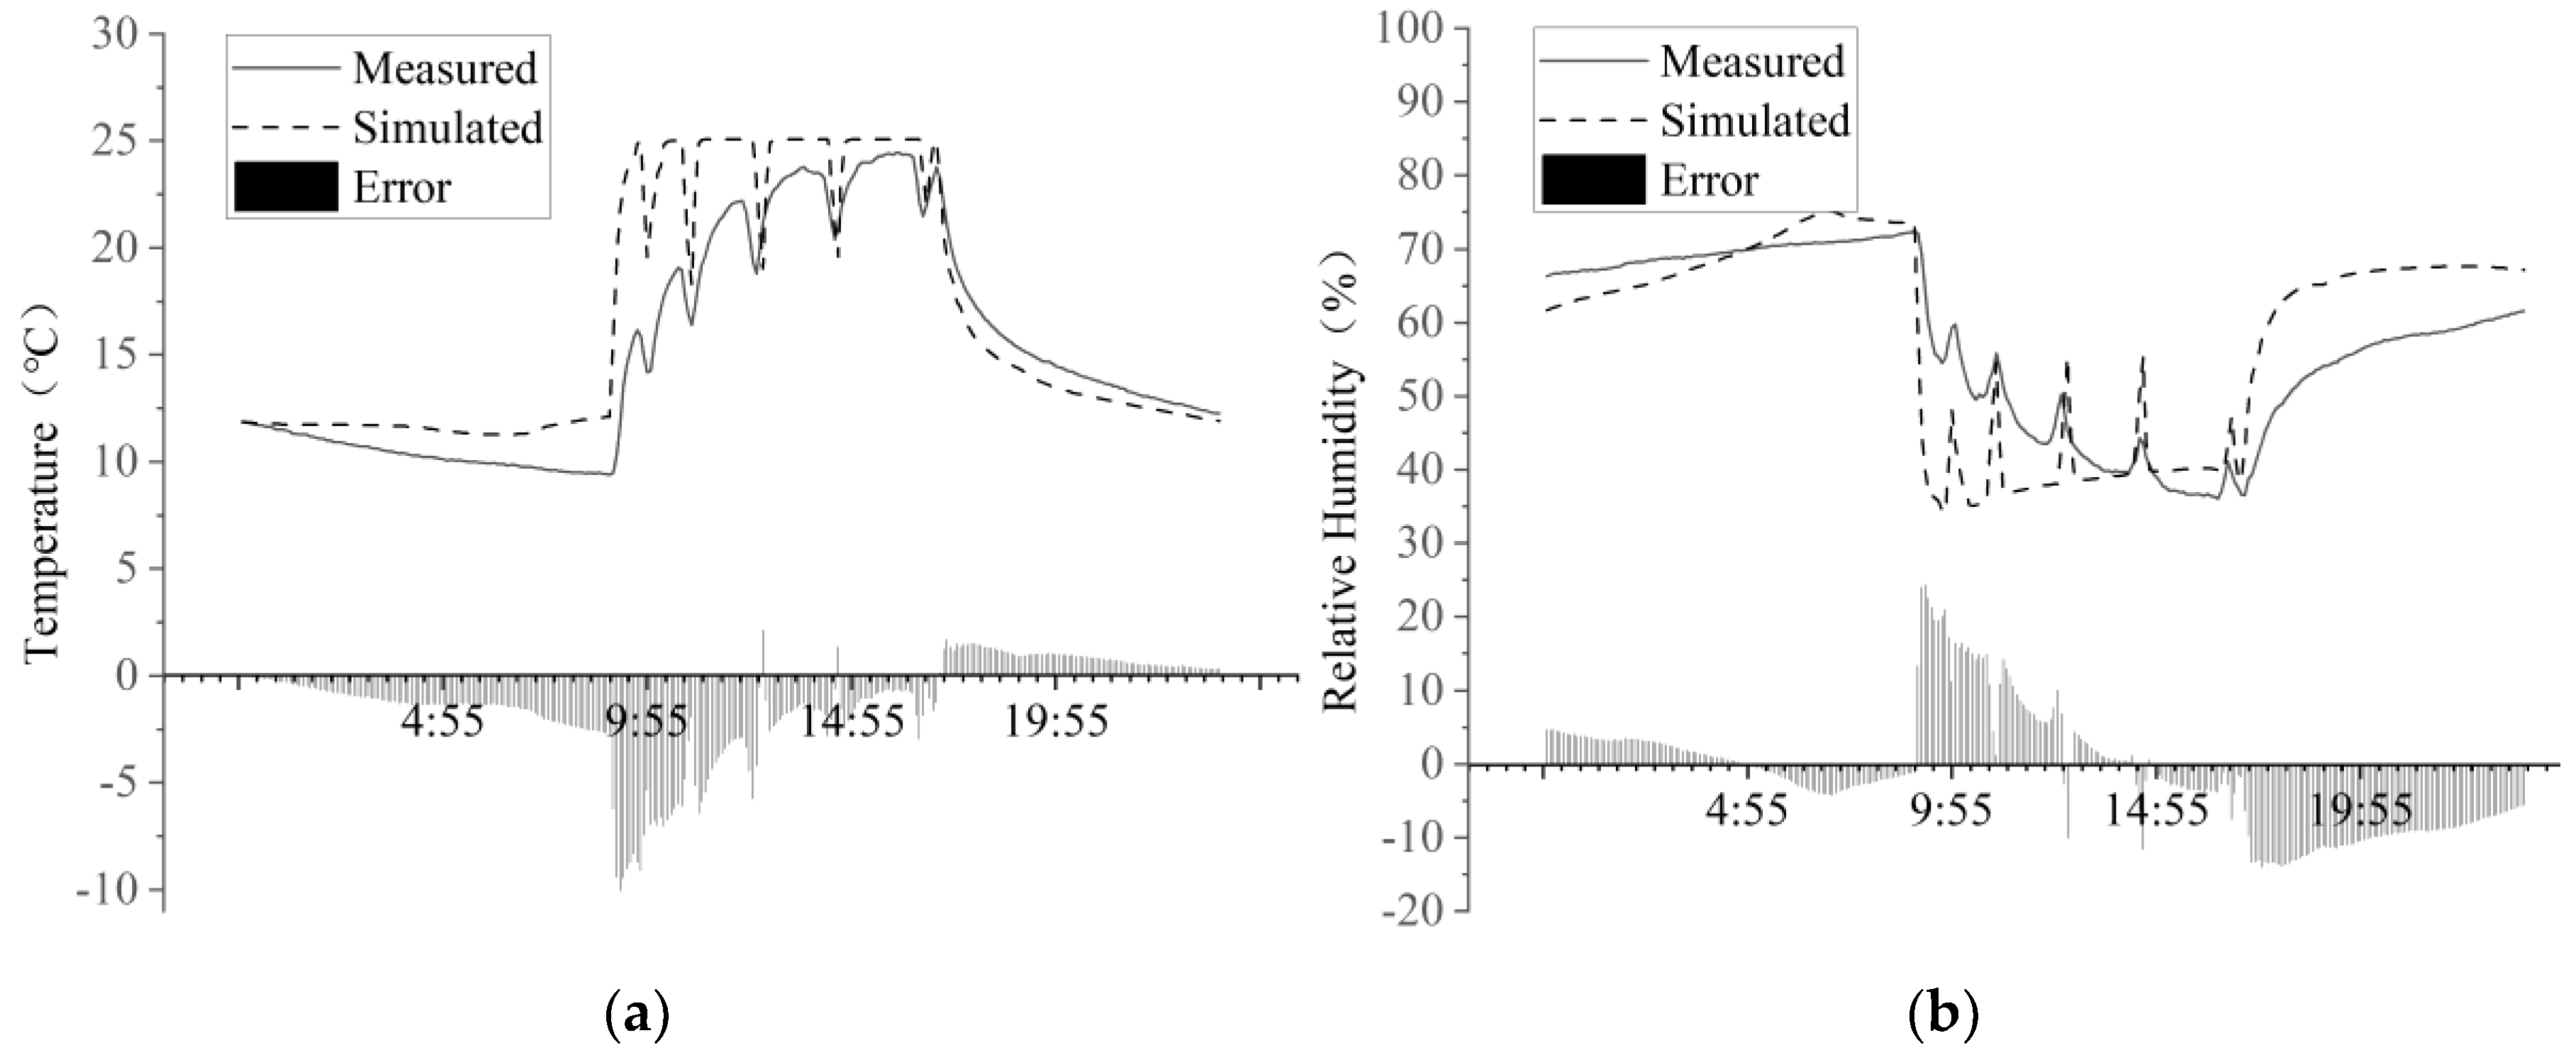
14]. The simulation produced full-day temperature and humidity profiles (
Figure 8), providing essential data for defining boundary conditions and validating results in subsequent CFD simulations.
To evaluate the accuracy of the DesignBuilder simulation results, indoor temperature and humidity measurements from 00:00 to 24:00 on 3 January were compared with the simulated values. The assessment of deviations was performed using the mean bias error (MBE) and the coefficient of variation (CV) [
15], calculated using the following formulas:
Here, and represent the measured and simulated values at the i-th time step, respectively, and n signifies the total number of samples.
The results indicate that the MBE and CV for indoor temperature are −6.25 % and 19.22 %, respectively, while those for relative humidity are −5.05 % and 16.63 %. The error mainly resulted from the cold and humid environment at the site, which caused the air conditioner to frequently shut down for defrosting, thereby causing errors in the data points. Even so, the errors fall within an acceptable range, demonstrating that the simulation model effectively captures the temporal variations in the indoor thermal and hygrothermal environment.
2.3.2. CFD Model Construction
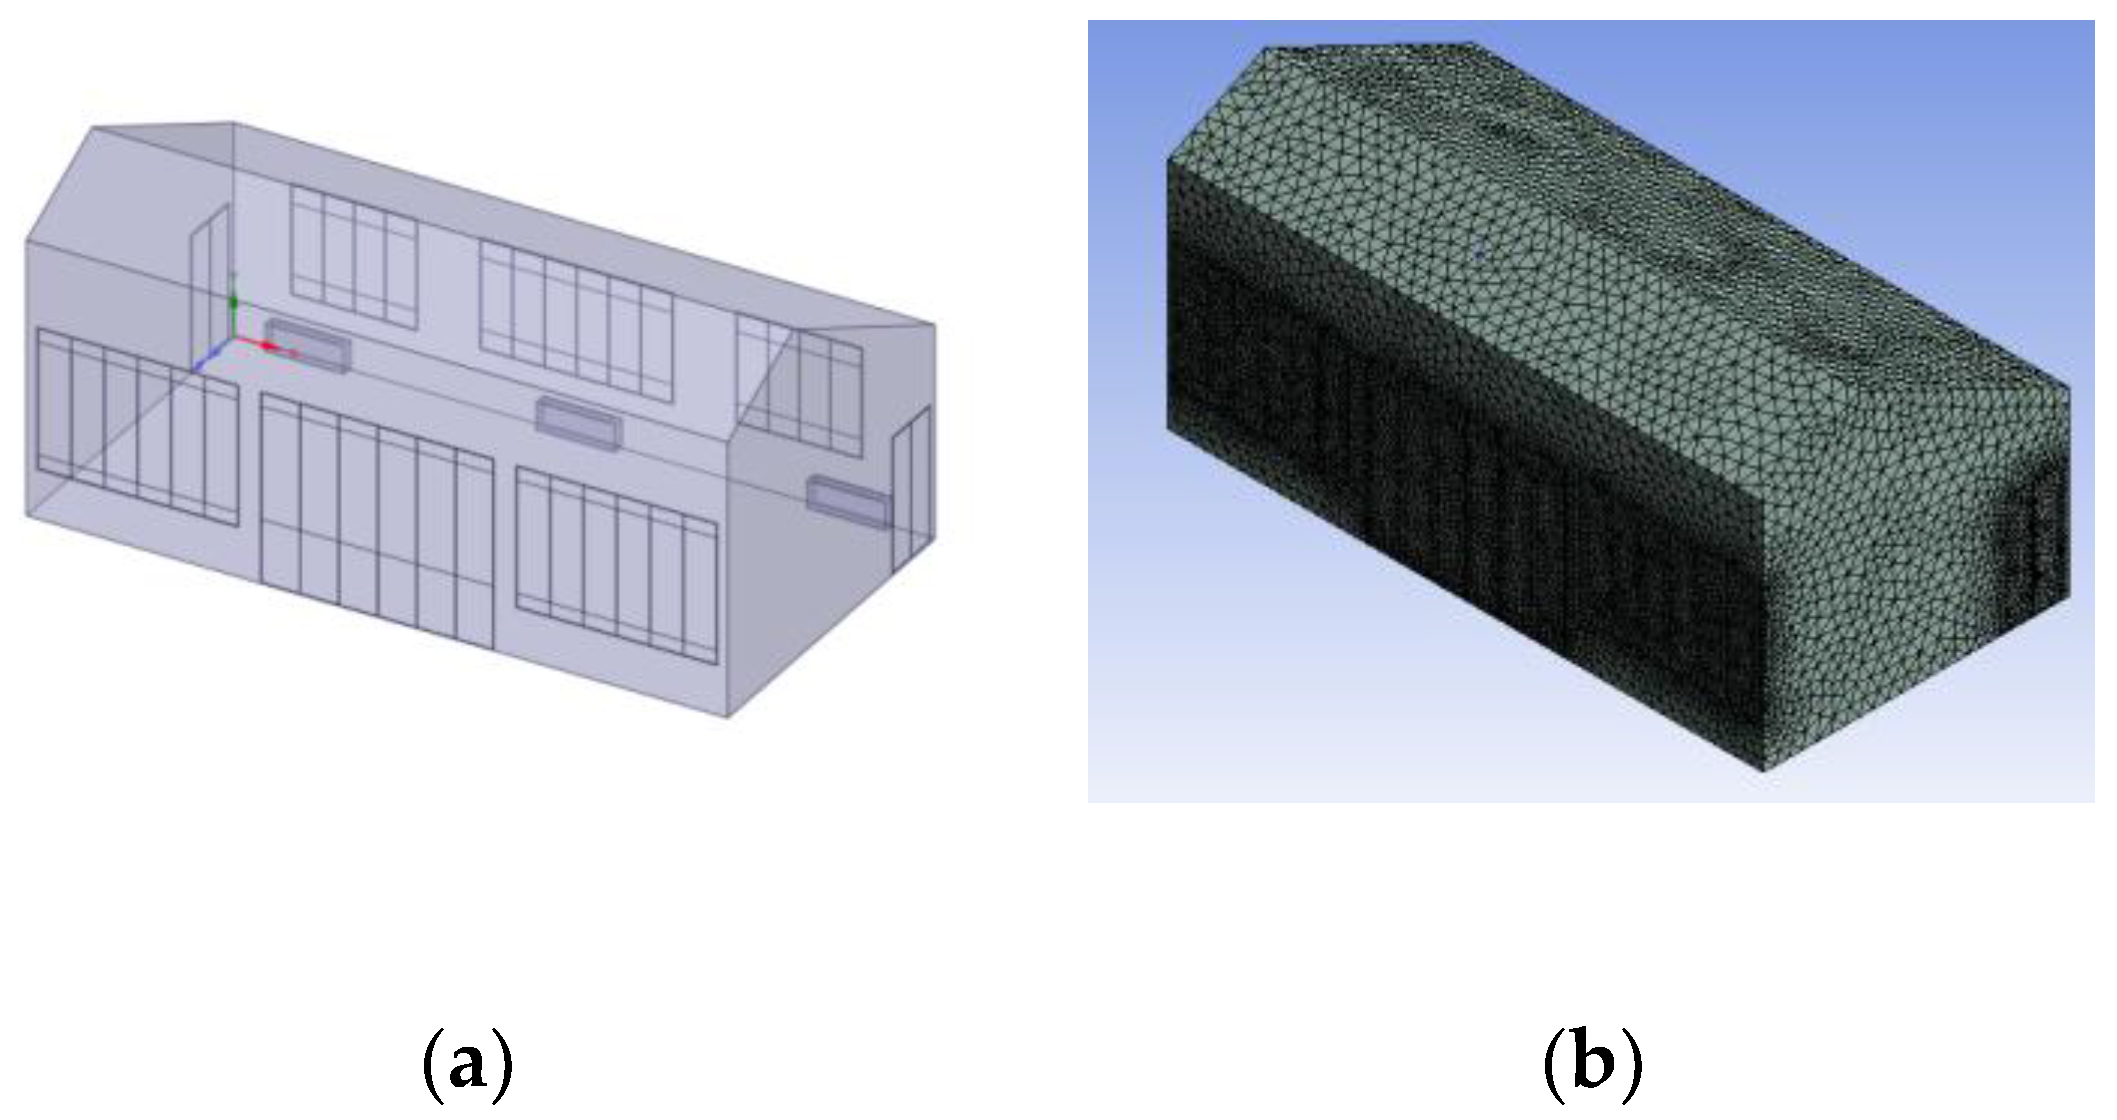
Based on the DesignBuilder simulation results, steady-state simulations in Fluent were conducted to investigate the effects of different winter HVAC air-supply strategies on indoor airflow patterns, vertical temperature stratification, and thermal comfort. To balance computational efficiency and simulation accuracy, the Beihua Hall was moderately simplified while preserving its overall geometric form. Gaps were retained at door and window joints to simulate cold air infiltration through the building envelope. The air-conditioning system comprises three floor-mounted indoor units arranged along the north wall. Each unit has a supply air outlet located at the top, 0.6 m above the floor, with dimensions of 120 mm × 900 mm. The return air inlet is positioned at the bottom of each unit and has the exact dimensions. The simplified geometric model of Beihua Hall is shown in
Figure 9. Subsequently, the model was meshed using unstructured tetrahedral elements, with five boundary-layer prism layers and a growth rate of 1.2 to meet the wall-function criteria of the turbulence model. The final mesh consisted of approximately 200,000 cells.
This study employed steady-state CFD simulations using the Reynolds-Averaged Navier-Stokes (RANS) equations, with the energy equation enabled and gravity set to 9.81 m/s² to model indoor natural convection. To enhance numerical convergence, the Boussinesq approximation was adopted, accounting for temperature-dependent density only in the buoyancy term. The SST k-ω turbulence model was selected, combining the near-wall accuracy of the standard k-ω model with the robustness of the k-ε model in the outer flow region, thereby providing a more accurate simulation of complex boundary layer development. Previous studies have indicated that, compared with three commonly used k-ε models, the SST k-ω model achieves higher accuracy in predicting vertical temperature stratification in high and large indoor spaces [
16]. For wall treatment, the standard wall function method was adopted to enhance computational efficiency and stability.
The air supply inlets were defined as velocity inlets, with a supply velocity of 2.5 m/s and a total airflow rate of 2,916 m³/h. Taking into account heat loss during the indoor unit's actual operation, the air will experience some temperature attenuation before reaching the indoor space. In the simulation, the supply air temperature is set at 30℃, which is slightly lower than the actual set value. This is done to ignore the air conditioner's actual shutdown and defrost times during operation and better approximate its operating conditions. Return air outlets were defined as pressure outlets to simulate natural indoor air recirculation. To account for cold air infiltration through doors and windows, gaps were represented as velocity inlets. The infiltration airflow rate was calculated based on an average air change rate of 5 ach and the building’s total adequate volume to determine the infiltration volume, which, combined with the gap area, yielded an average infiltration velocity of 0.25 m/s. The temperature of the infiltrating air was set to 10.56 °C based on measurements from the outdoor weather station.
Since steady-state simulations were performed, the interior surface temperatures of the building envelope at 16:30 on 3 January, when the measured data had stabilized, were selected as wall boundary conditions (
Table 2). The wall material properties were kept consistent with those defined in DesignBuilder. The resulting simulation outputs are presented in
Figure 10.
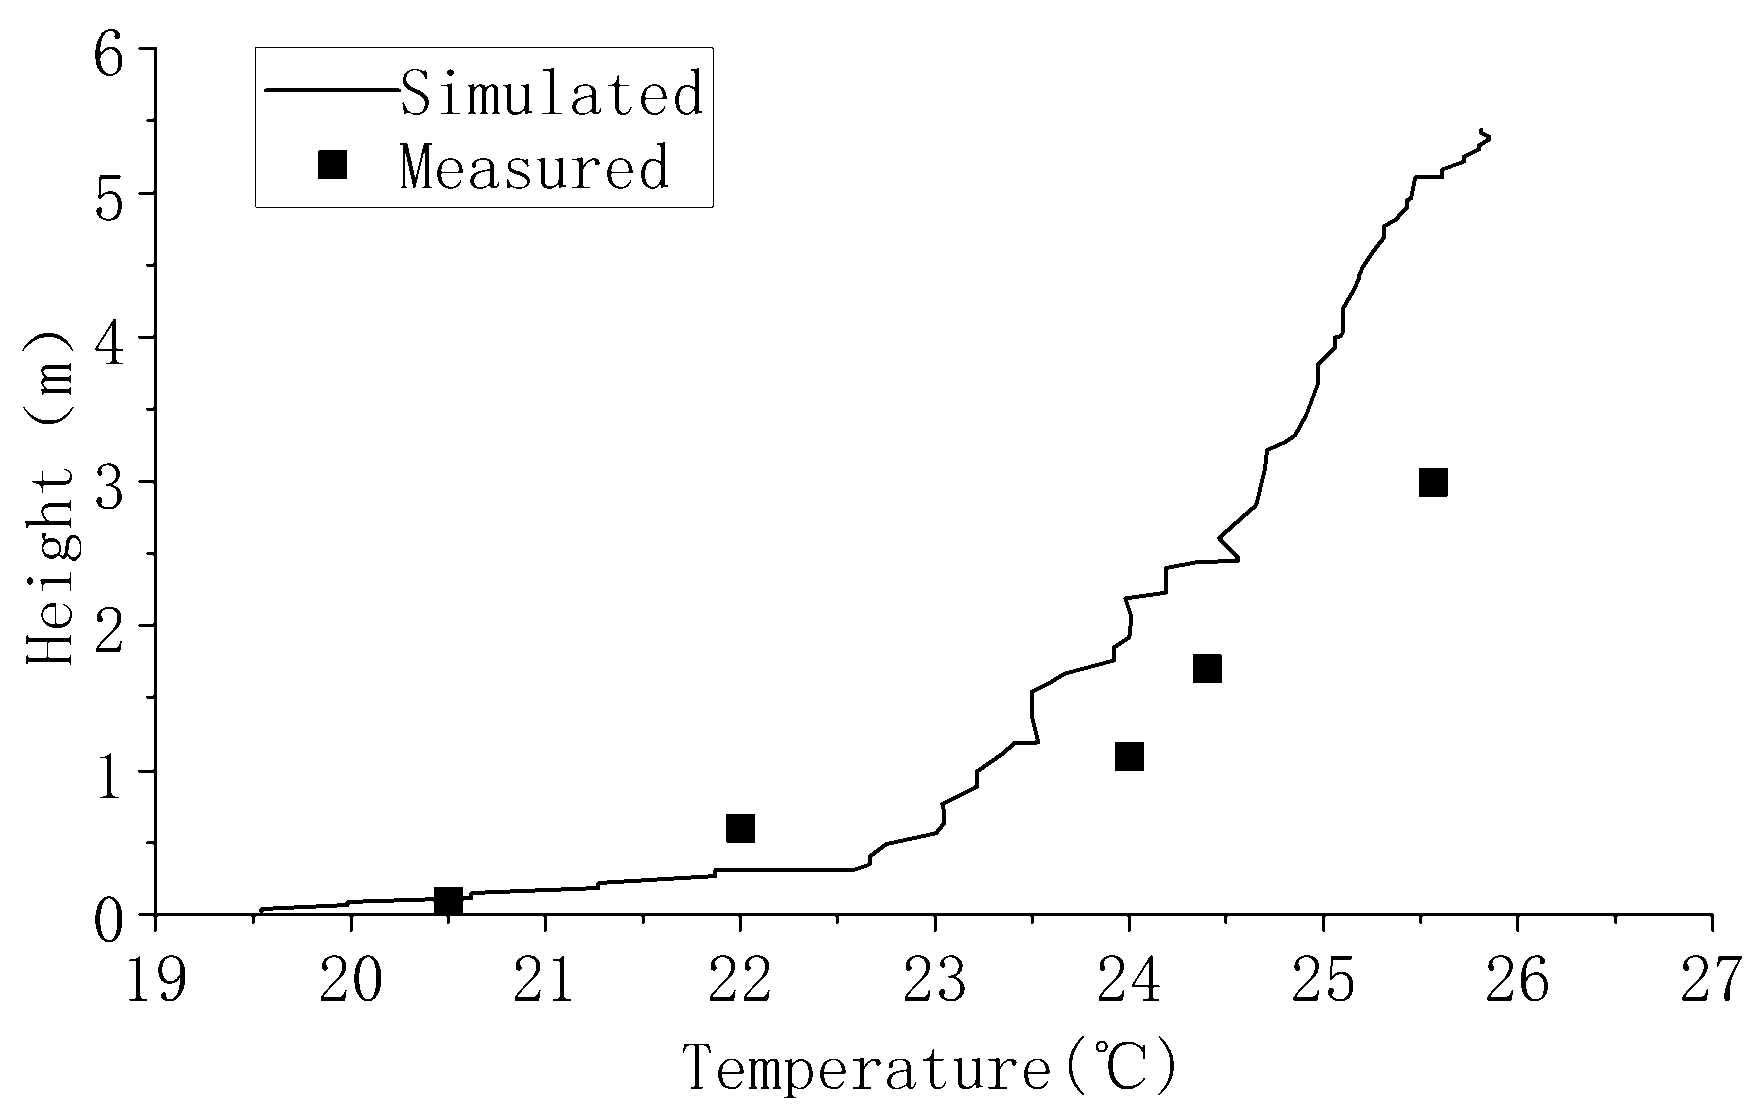
2.3.3. CFD Simulation Validation
To validate the simulation results, five measurement heights corresponding to the field measurements were selected, and the simulated temperatures were compared with the measured data using relative error, root mean square error (RMSE), and normalized root mean square error (cvRMSE) [
17]. The calculation formulas are as follows:
In this context, n signifies the quantity of measurement points, while and denote the measured and simulated values at the i-th height, respectively.
The results indicate that the relative errors at all measurement points were within ±5%, showing substantial agreement between simulated and measured values across all heights. The RMSE was 0.75℃, and the cvRMSE was 3.22 %, meeting the calibration criteria for hourly data specified in the ASHRAE [
18] and IPMVP [
19] guidelines. These findings demonstrate that the absolute deviations in the simulated temperatures are minor, confirming the model's validity.
Table 3.
The actual measurement simulation calibration table of the Beihua Hall.
Table 3.
The actual measurement simulation calibration table of the Beihua Hall.
| Height |
0.1m |
0.6m |
1.1m |
1.7m |
3m |
RMSE |
cvRMSE |
| Measured |
20.50 |
22.00 |
24.00 |
24.40 |
25.56 |
0.75℃ |
3.22% |
| Simulated |
20.62 |
23.05 |
23.35 |
23.67 |
24.70 |
| Error value |
-0.58% |
-4.57% |
2.77% |
3.07% |
3.49% |
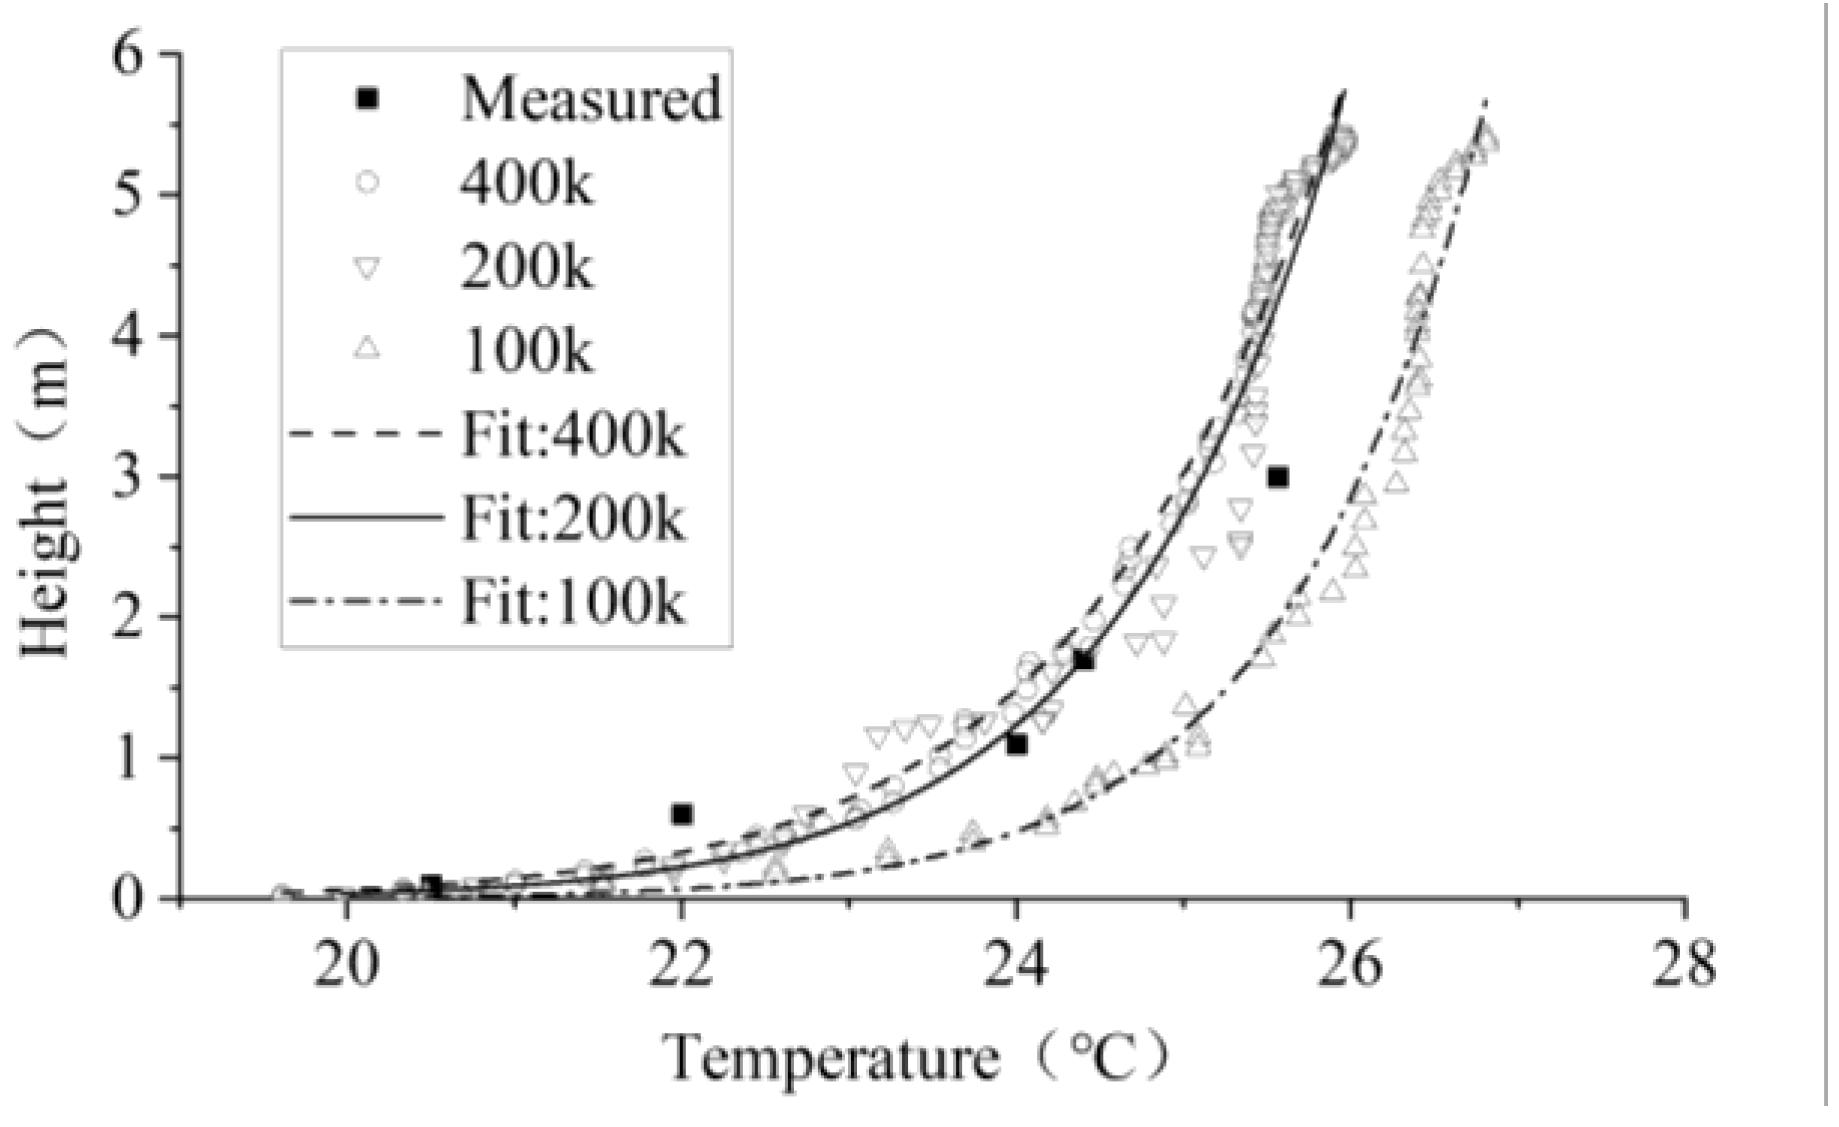
2.3.4. Grid Independence Verification
To verify the grid independence of the simulation results, three mesh configurations with 100,000, 200,000, and 400,000 cells were tested, as shown in
Figure 11. The temperature gradient profiles along the central vertical line were compared for the three meshes.
Table 4 presents the average errors between simulated and measured temperatures for the 5.48%, 0.2%, and 0.53% mesh configurations. The differences between adjacent mesh configurations were within 5–10 %, indicating that the influence of mesh resolution on the results is acceptable and confirming the simulation's grid independence.
2.3.5. Simulation Validation Results
Comprehensive validation results confirm that the constructed model achieves strong consistency between simulated and measured data, while the mesh independence test verifies the adequacy of the grid. These results collectively demonstrate the feasibility and reliability of the proposed coupled simulation method, laying a robust foundation for future investigations into airflow organization and thermal environment simulations in high and large spaces of historic yamen buildings.
2.4. Thermal Comfort Simulation of Typical Spaces in the Yamen Building
2.4.1. Development of the Baseline Model
The Rear Hall of the Suzhou Provincial Judicial Commissioner's Office is the core functional space of the yamen building. It features a brick–timber structure with a Chinese-style hard-gable roof and faces south. The hall consists of three bays, with the central bay designated as the simulation target. The interior features a clear height of approximately 8.2 m, a width of about 13.5 m, a depth of roughly 7.4 m, and a length-to-width ratio of approximately 1.8, representing a typical high and large space in historic buildings. Wooden lattice doors and windows are located on the northern and southern facades, while the east and west walls are brick and uninsulated. The overall airtightness and thermal insulation of the building envelope are poor, and the interior is equipped with floor-standing air-conditioning units. A simplified geometric model of the Rear Hall was constructed based on its actual layout (
Figure 12), with four indoor units arranged along the north wall according to the on-site configuration. The thermal boundary conditions for the walls were established based on the DesignBuilder simulation results (
Table 5). At the same time, all other model settings were kept consistent with those of Beihua Hall to ensure the simulation results were feasible.
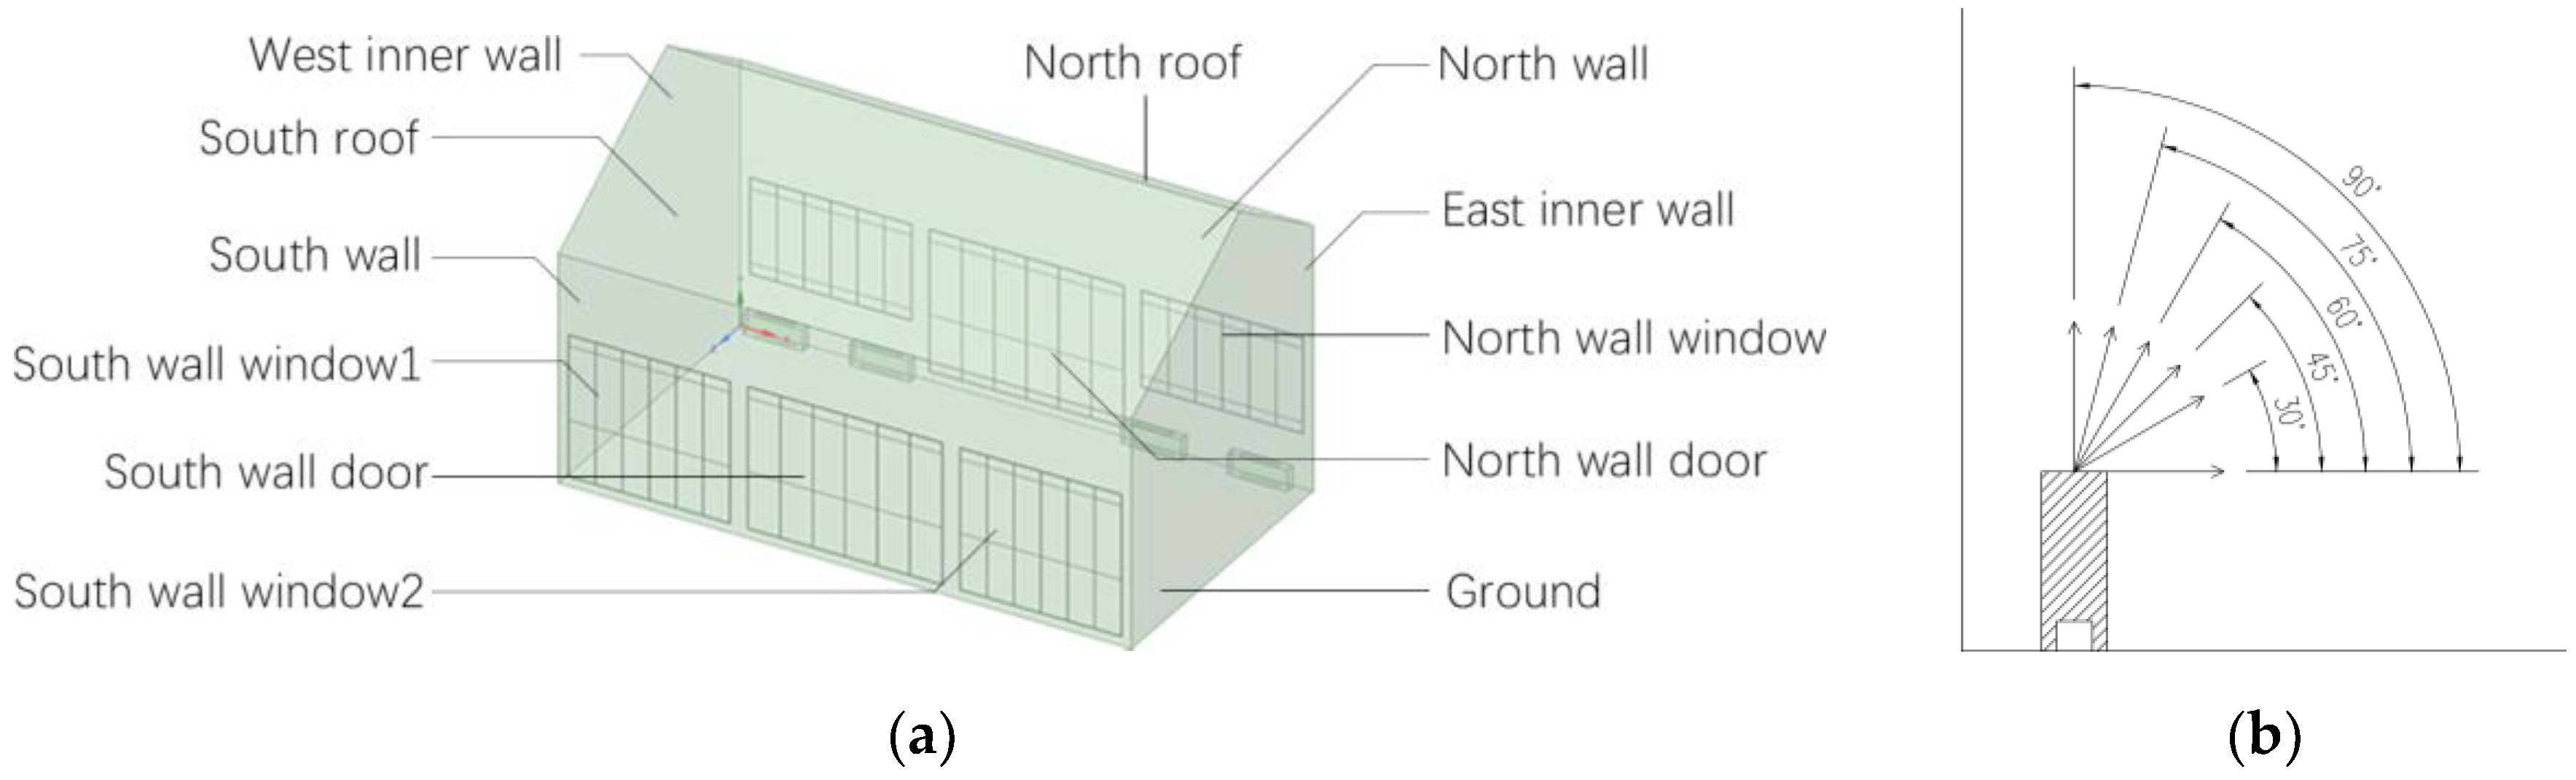
2.4.2. Simulation Scenarios Setup
To investigate the effects of different air supply parameters and configurations on thermal comfort in high and large buildings, this study used a simulation model of the Rear Hall of the Suzhou Provincial Judicial Commissioner's Office to examine indoor comfort at seven supply air angles (
Figure 12) and six supply air velocities (
Table 6). Since variations in supply velocity affect the total heat delivered to the indoor space, the size of the supply outlet was adjusted to maintain a consistent heat load (
Table 6). In addition, the positioning of the air-conditioning units was altered for comparative simulation, and four different supply air temperatures were tested to further optimize the air distribution strategy.
2.4.3. Evaluation Criteria
Using the simulated data from the central line of the central vertical plane of the baseline model and the central line of the supply air outlet plane as examples, this study analyzed temperature differences and airflow velocities under different supply air angles and velocities to more intuitively and accurately characterize the distribution of indoor temperature and velocity fields under varying supply conditions. In accordance with relevant thermal comfort standards, a vertical temperature difference of no more than 4 °C within the height range of 0.1 m to 1.7 m for a standing occupant [
20], and air velocities in the occupied zone controlled within 0.15–0.25 m/s [
21] to avoid draft discomfort, were used as criteria to assess thermal comfort under different operating conditions.
Building on this, the study further employed the PMV (Predicted Mean Vote) and PPD (Predicted Percentage of Dissatisfied) indices to evaluate the overall indoor thermal environment comprehensively. PMV and PPD are internationally recognized indicators of thermal comfort. PMV incorporates air temperature, humidity, air velocity, mean radiant temperature, metabolic rate, and clothing insulation to forecast human thermal feeling in a specific setting. In contrast, PPD assesses the percentage of occupants expected to be displeased with that environment. According to ISO 7730 [
21], an indoor environment can be considered thermally comfortable when −0.5 ≤ PMV ≤ 0.5 and PPD ≤ 10 %. Using this criterion, PMV and PPD values were calculated for each operating condition based on Fluent simulation results, and the percentage of space meeting the thermal comfort standard was quantified. To ensure the accuracy of the assessment, the analysis focused on the occupied zone, particularly within 1.5 m of floor level, corresponding to the breathing zone, thereby providing a realistic evaluation of how supply air parameters affect occupant comfort.
3. Results
3.1. Comparison of PMV–PPD Comfort Zone Percentages
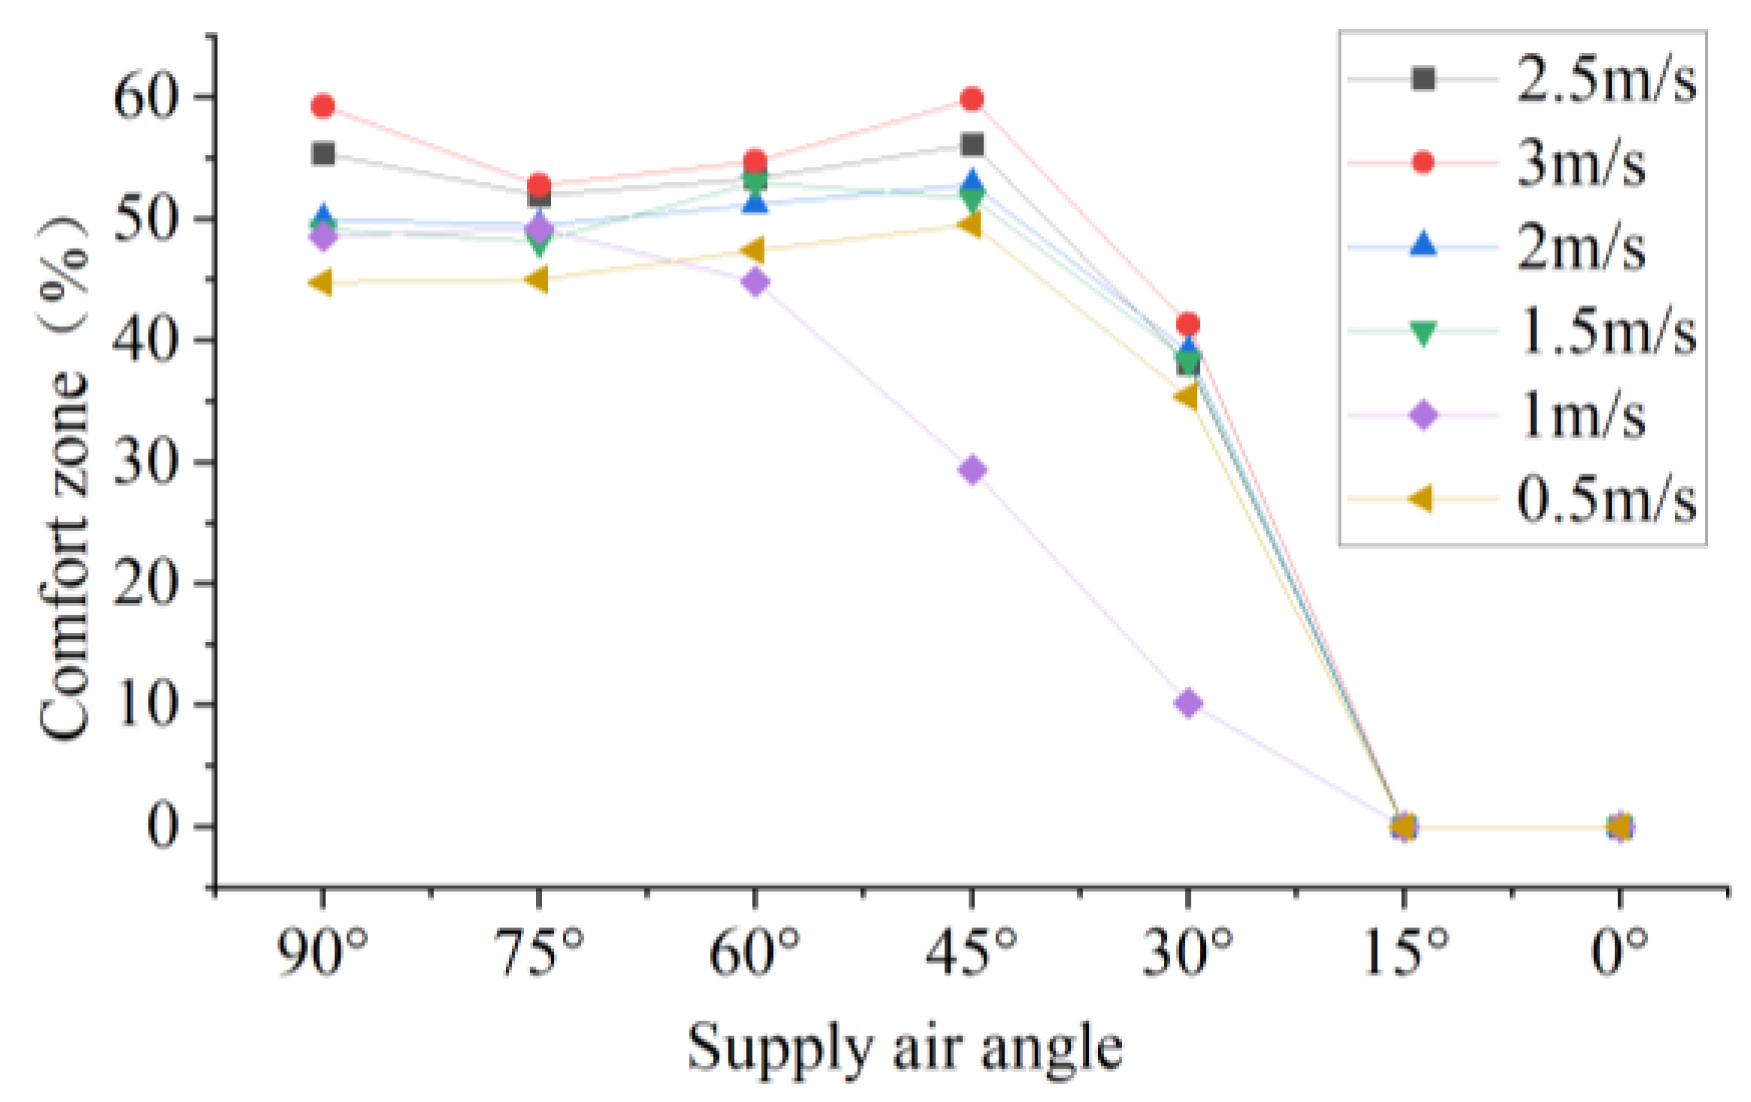
3.1.1. Supply Air Angle and Velocity
Figure 13 illustrates the variation in the percentage of thermally comfortable space under different supply air angles and velocities. The analysis indicates that supply air velocity significantly affects thermal comfort within the occupied zone, with higher velocities corresponding to a larger proportion of comfortable space. In contrast, the supply air angle has a relatively minor influence, with 45° and 90° angles exhibiting higher comfort ratios across most velocities. Low-angle supply in high and large spaces suffers from insufficient convective mixing; when the supply angle is reduced to 30° or below, thermal comfort declines markedly, and subsequent 15° and 0° cases are not discussed. When the supply angle cannot be freely adjusted, setting it to 60° or 75° can mitigate fluctuations in comfort caused by variations in air velocity.
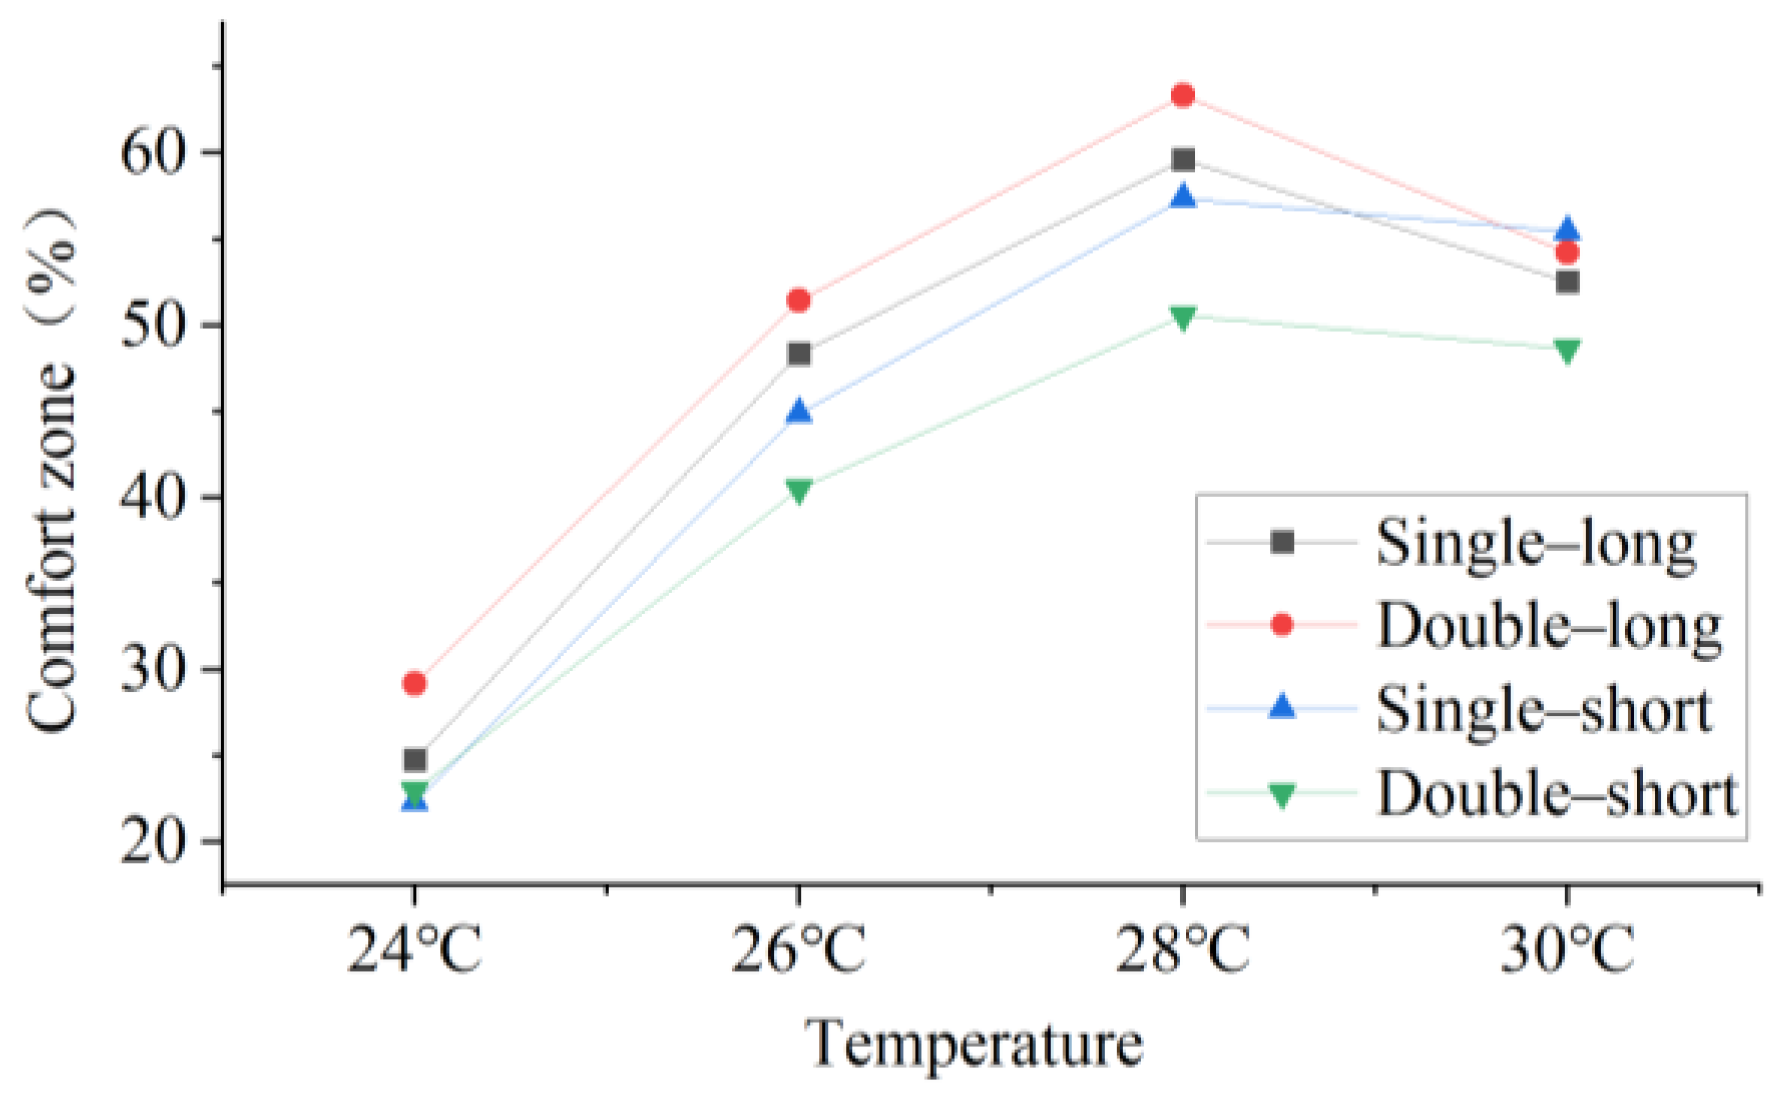
3.1.2. Supply Air Location and Temperature
Utilizing a supply air velocity of 2.5 m/s at an angle of 90°, the positioning of the air-conditioning units was modified, and four distinct supply air temperatures (24°C, 26°C, 28°C, and 30°C) were evaluated to investigate the optimization of the air distribution strategy. As shown in
Figure 14, indoor thermal comfort varies slightly with different outlet layouts, with dual-side supply along the long sides yielding slightly higher comfort than other configurations. However, the overall effect is relatively limited. It was also observed that, regardless of the supply configuration, setting the supply air temperature to 28 °C resulted in the highest proportion of comfortable space, indicating a relatively optimal indoor thermal environment.
3.2. Effect of Supply Air Angle on the Distribution of Indoor Comfort Zones
3.2.1. Vertical Temperature Difference and Draft Sensation
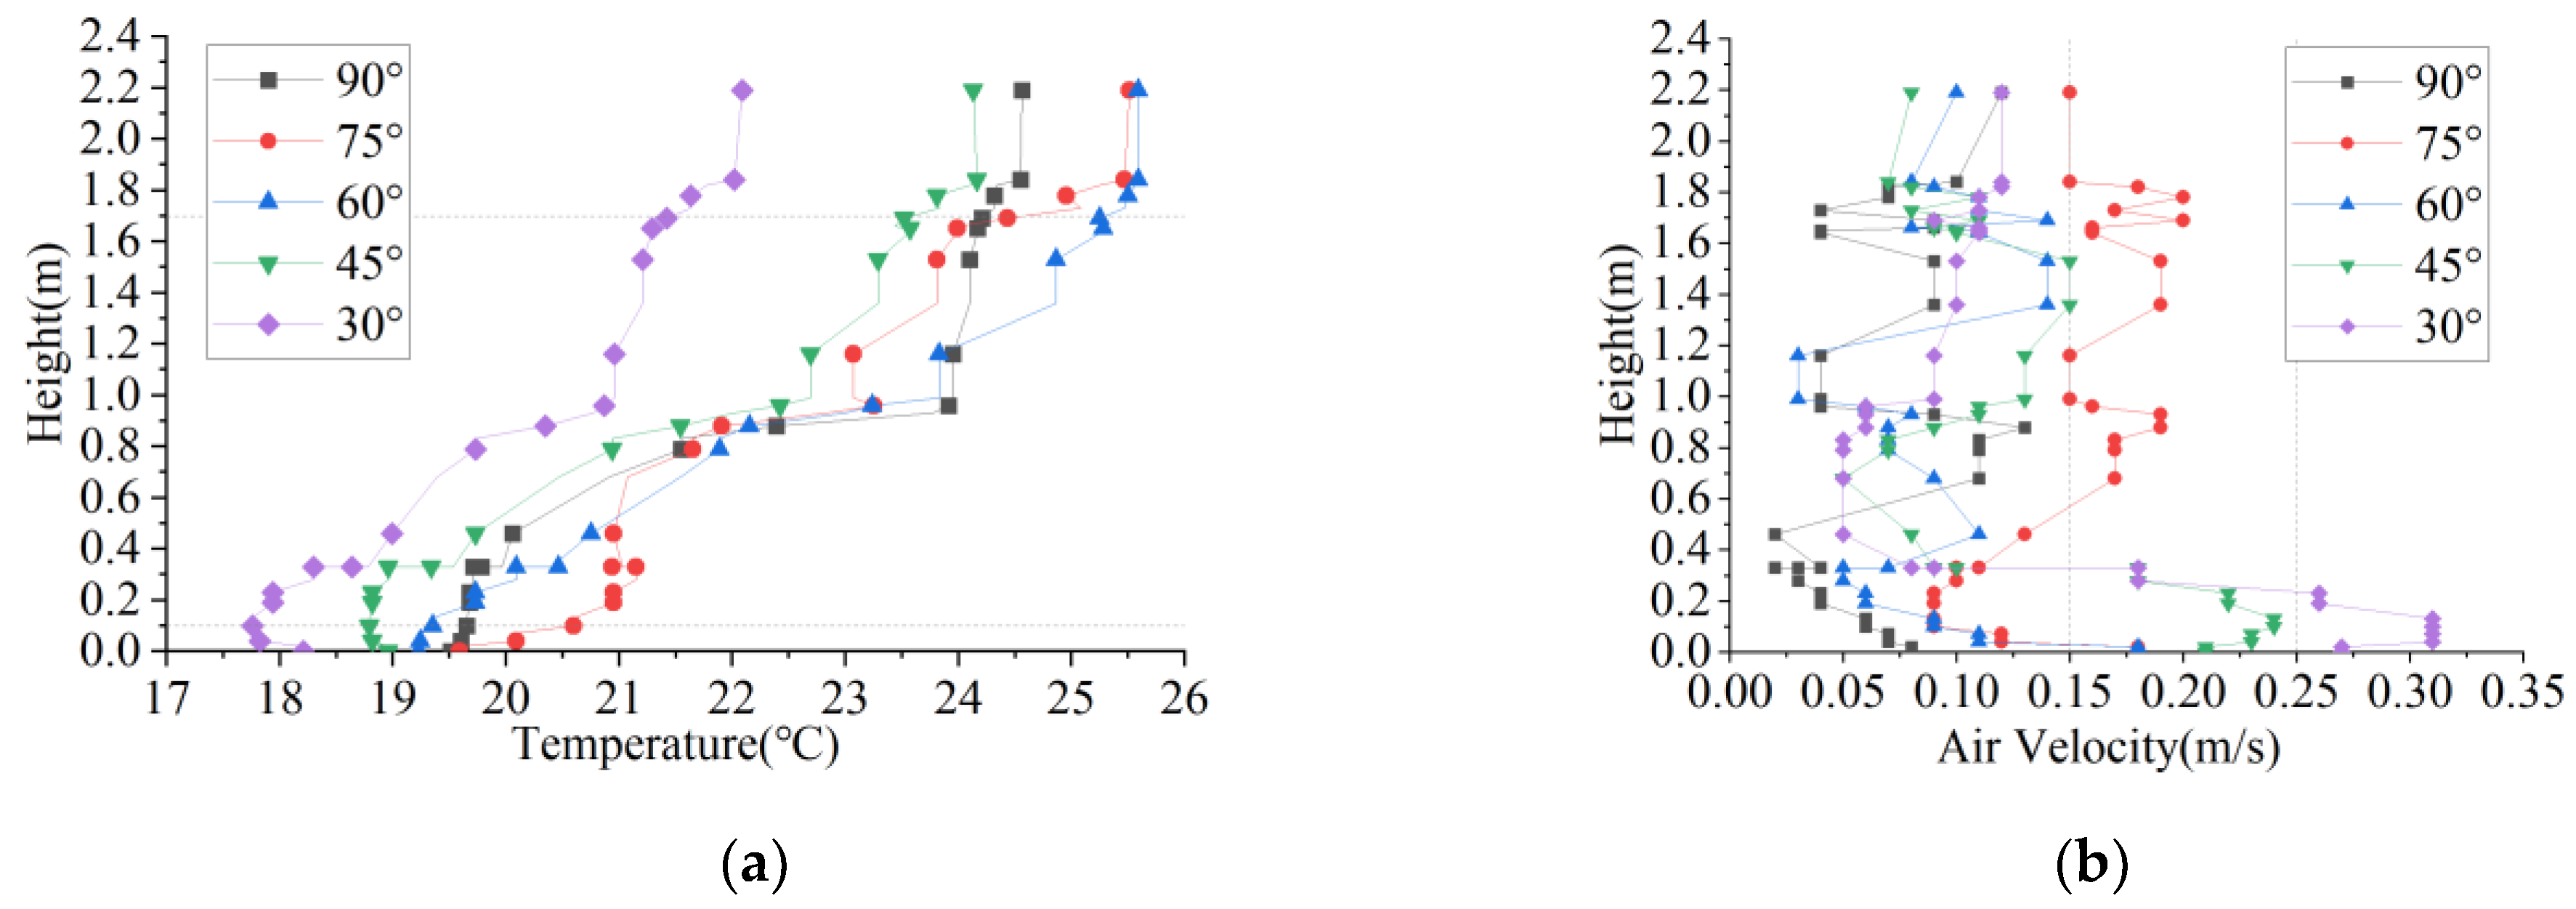
Utilizing the 30°C , 2.5 m/s supply air condition as the baseline, the supply air angle was adjusted to analyze the distribution of indoor temperature and velocity fields, as illustrated in
Figure 15 and
Figure 16. Regarding vertical temperature differences, the 30° supply condition exhibited the smallest overall ΔT, with values along both the central vertical plane and the plane perpendicular to the supply outlet remaining below the 4 °C limit specified by relevant standards (
Table 7). This indicates that low-angle supply can help mitigate vertical temperature stratification in the indoor space.
However, concerning airflow velocity, the near-floor region under the 30° supply condition exceeded the standard limits, and this trend became more pronounced as the supply angle decreased. This indicates that while low-angle supply can improve temperature uniformity, it may also produce direct draft effects, potentially causing localized discomfort.
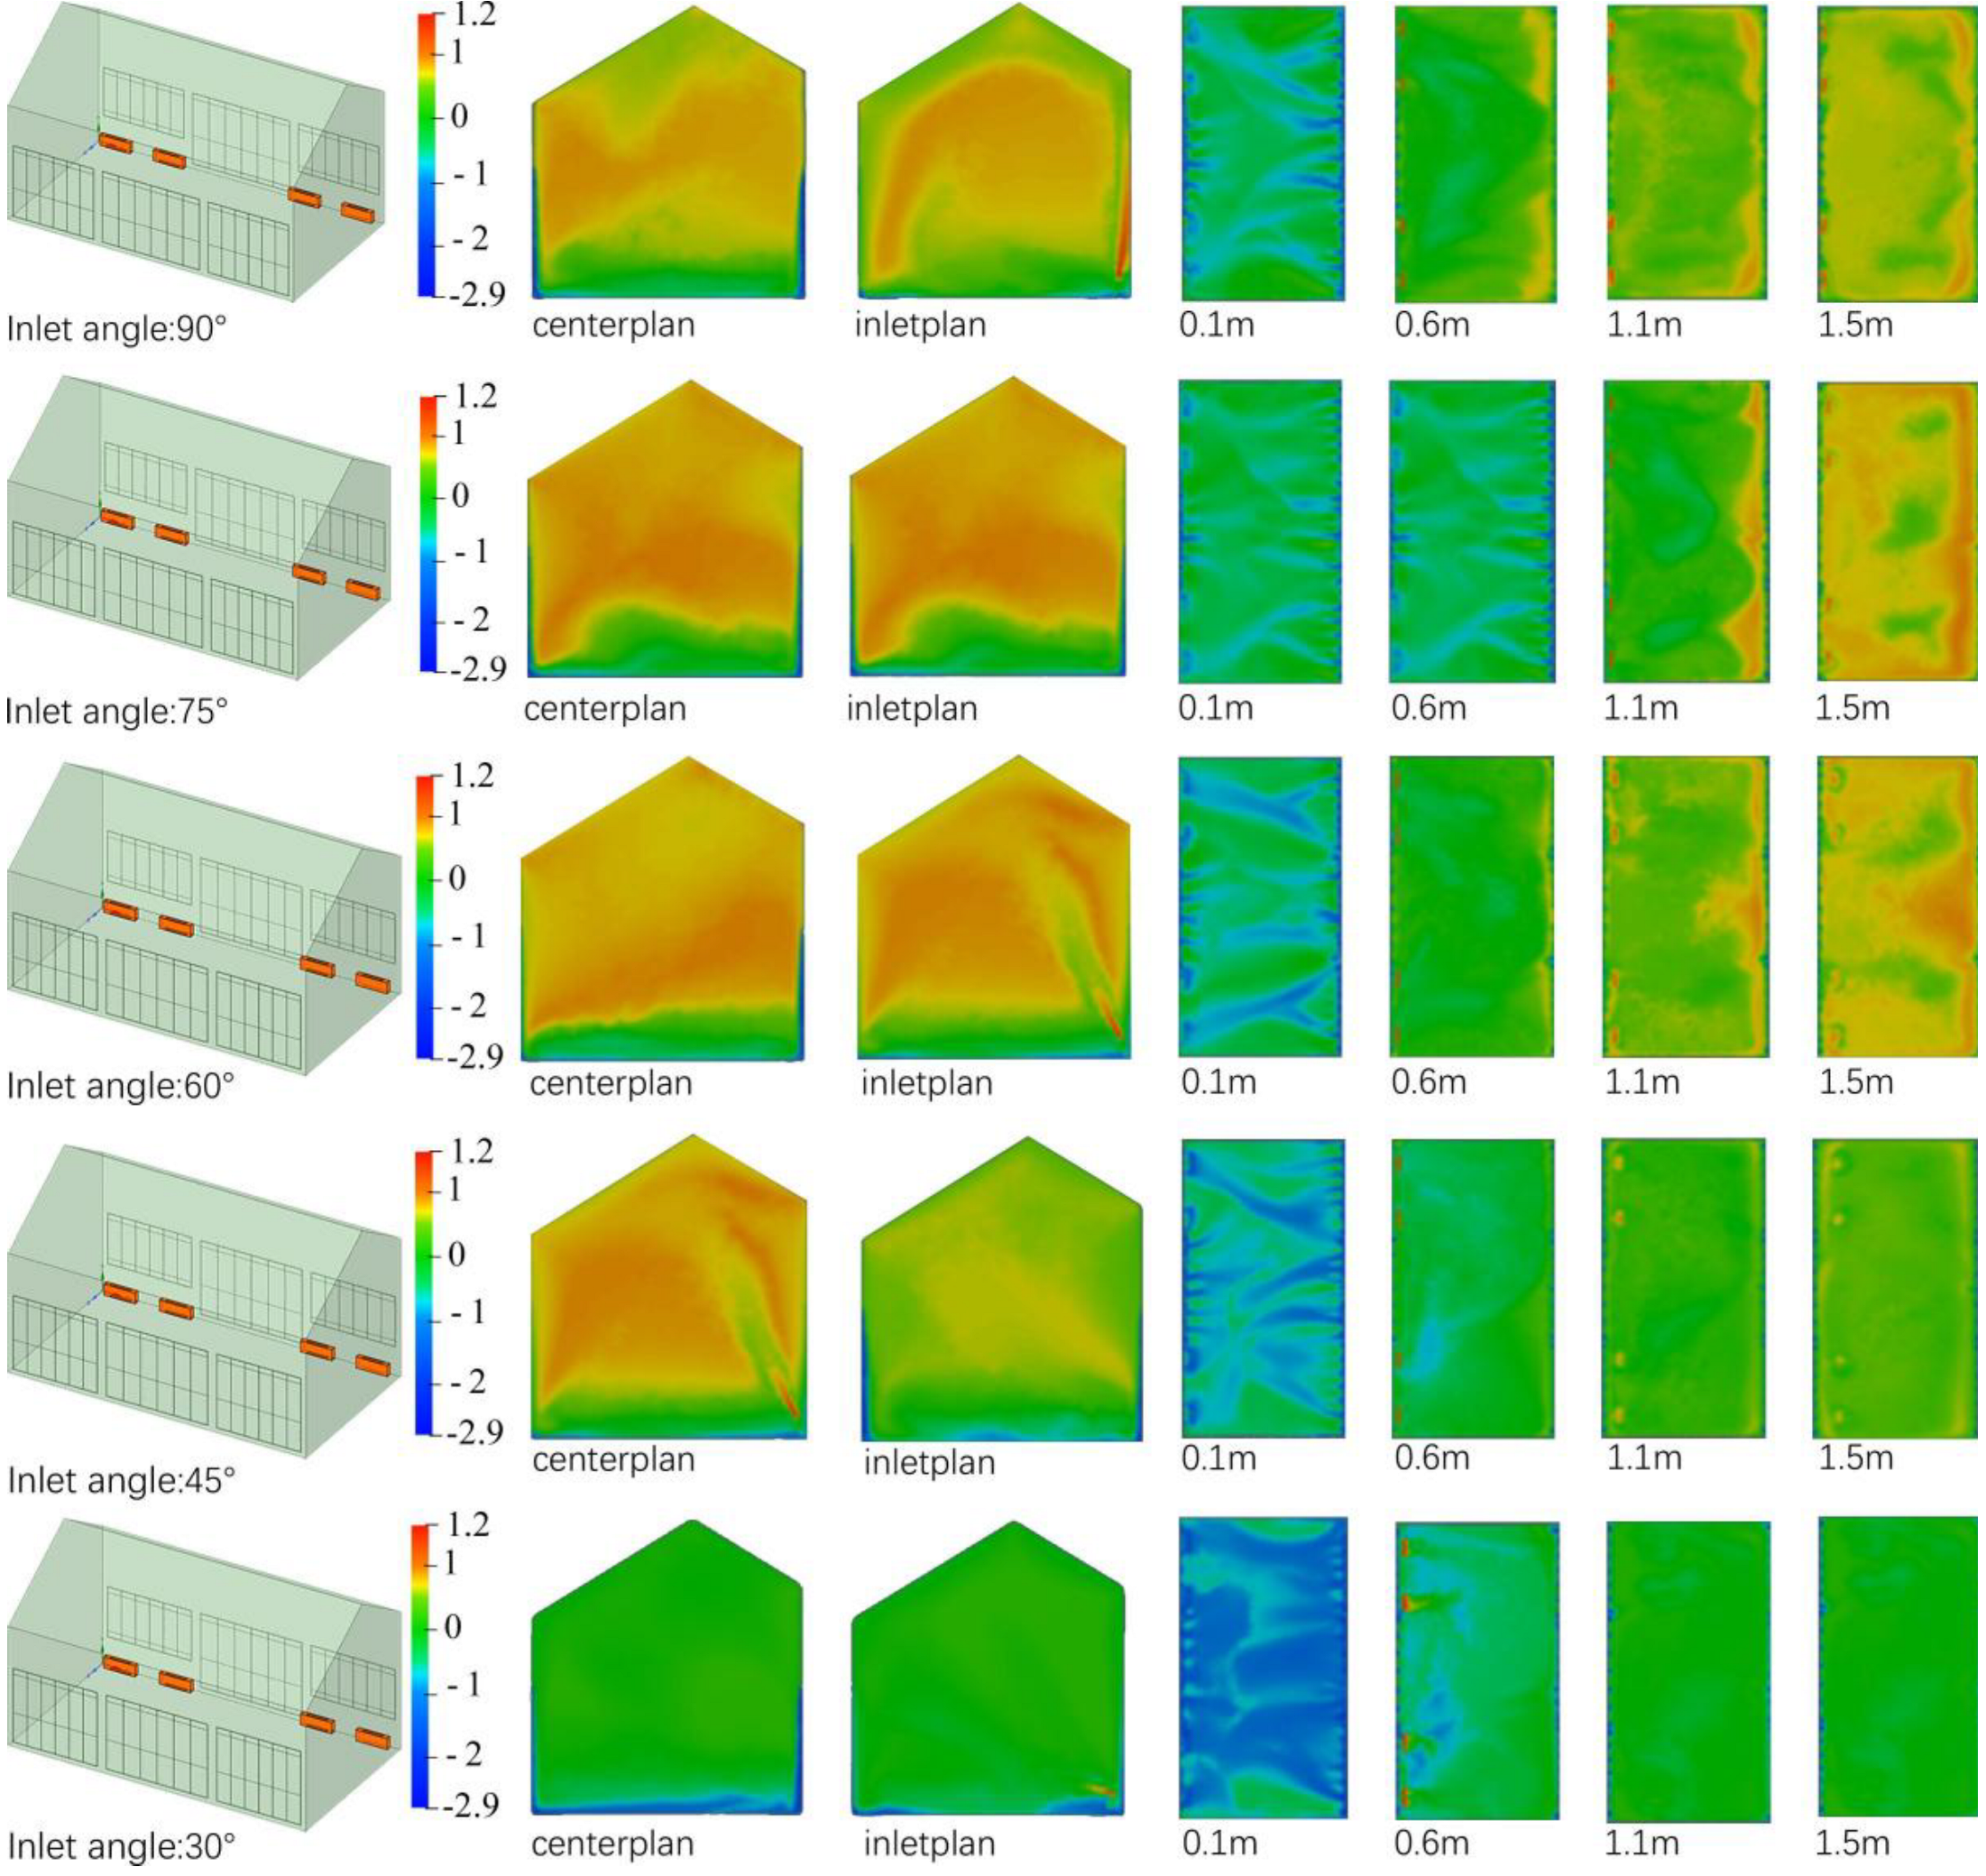
3.2.2. Thermal Comfort Contour Maps
Using the 30℃, 2.5 m/s supply air condition as the baseline, the impact of altering the supply air angle on the distribution of indoor thermal comfort was analyzed. The contour plots (
Figure 16) show that reducing the supply angle decreased indoor temperature and improved temperature uniformity. Although low-angle supply, such as 30°, improved temperature uniformity, it induced localized overcooling near the floor (0.1 m), leading to diminished overall comfort within the occupied zone, corroborating the findings of the previous section. Conversely, a 75° supply produced a more favorable temperature distribution within the occupied zone (1.1-1.5 m in height), reducing chilly patches, although sporadic localized overheating was observed at 1.5 m. A 90° supply provided a relatively balanced comfort zone within the occupied area, without significant overcooling or overheating, but notable heat accumulation near the ceiling indicated potential energy waste.
3.3. Effect of Supply Air Velocity on the Distribution of Indoor Comfort Zones
3.3.1. Vertical Temperature Difference and Draft Sensation
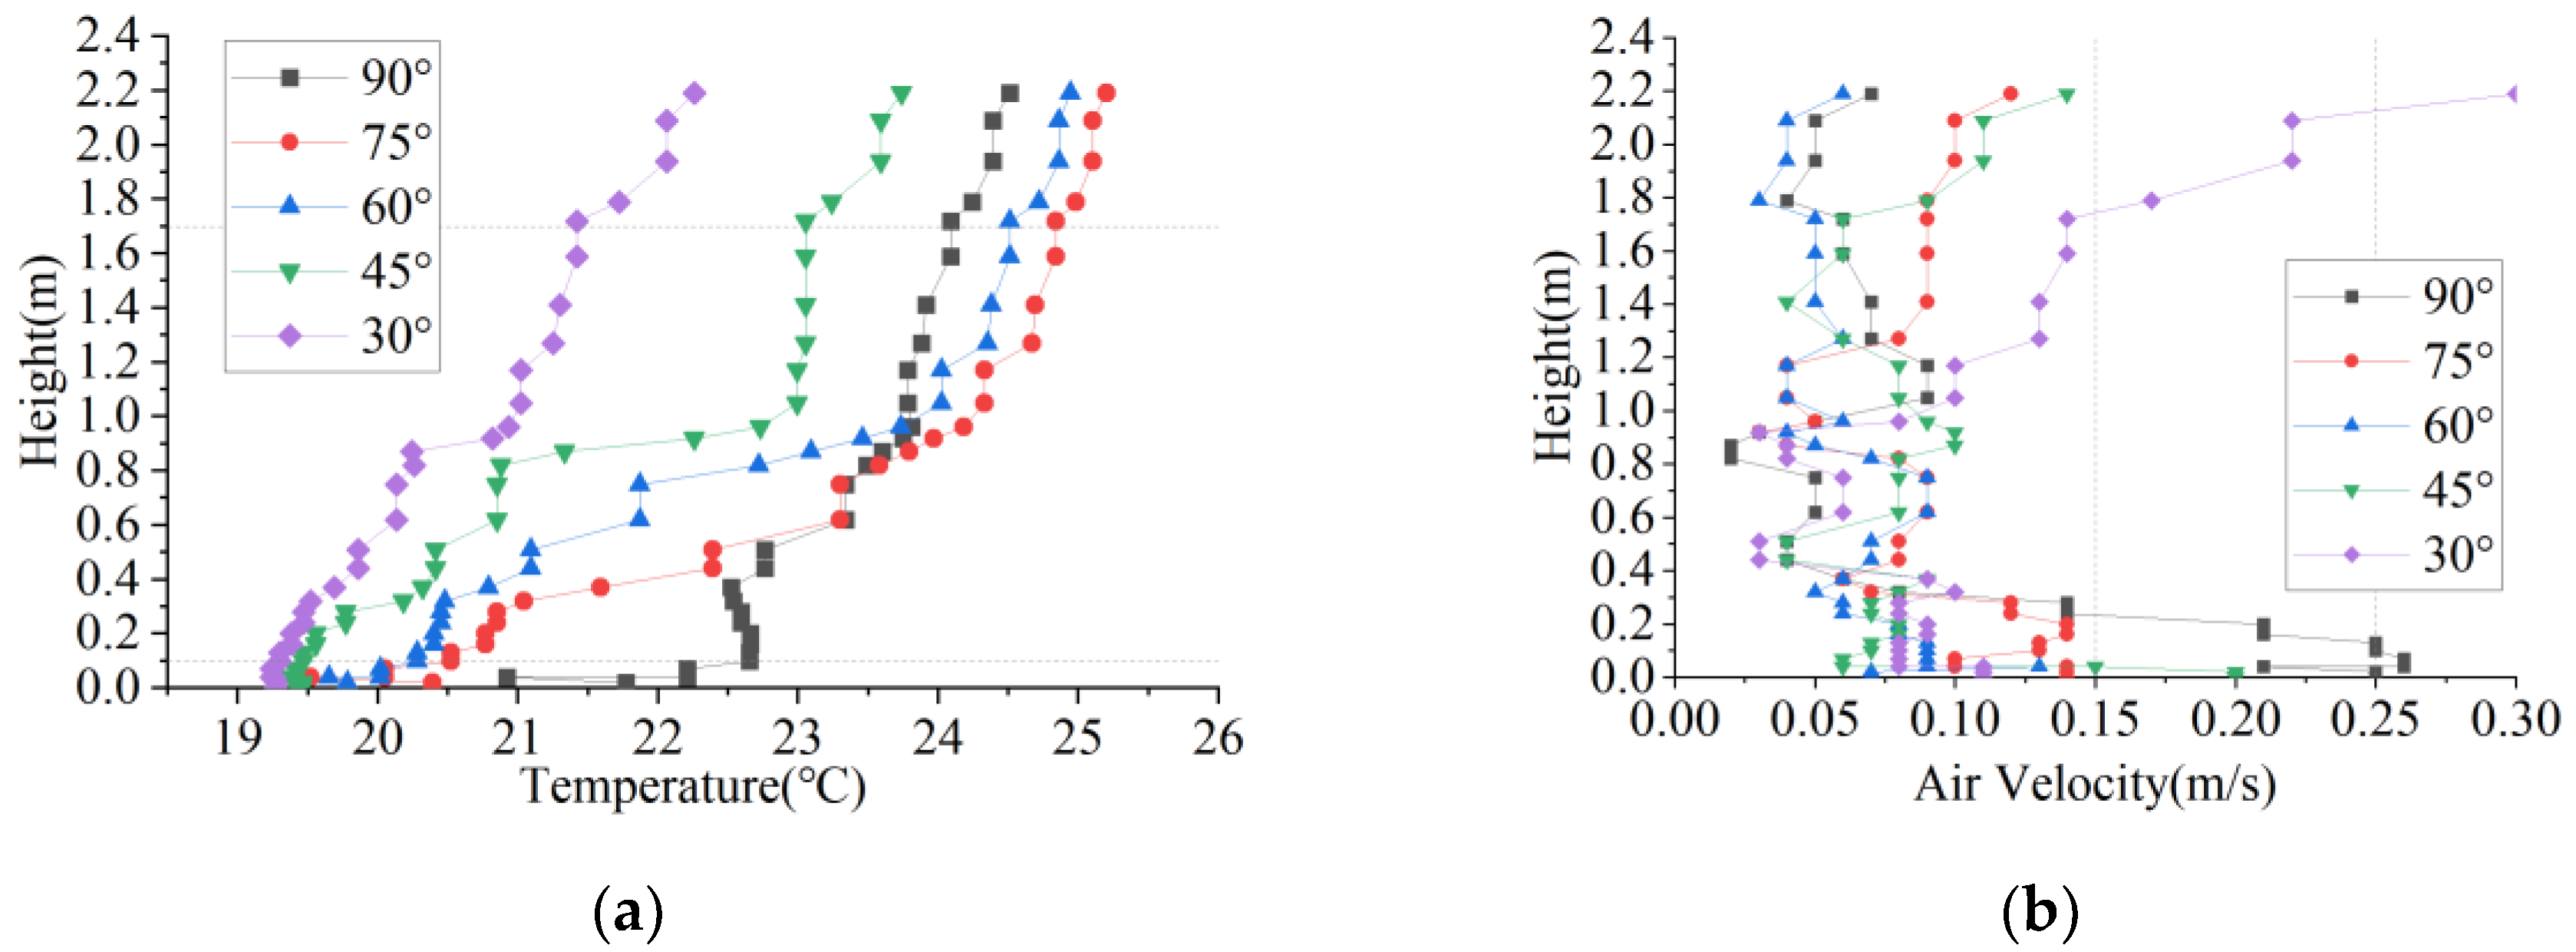
Using the 30 °C, 90° supply air condition as the baseline, the effect of varying supply air velocity on the indoor temperature and velocity fields was investigated. The results are shown in
Figure 17 and
Figure 18. Regarding vertical temperature differences, when the supply velocity was maintained between 2 and 3 m/s, the vertical ΔT remained within 4 °C (
Table 8), indicating that higher air velocities can significantly enhance indoor air circulation and heat exchange efficiency, thereby improving temperature uniformity and mitigating vertical temperature stratification.
Regarding airflow velocity, the 3 m/s, 2.5 m/s, and 0.5 m/s cases all exceeded the standard limits in the near-floor region. High supply velocities can enhance air circulation but may also create direct drafts toward the lower limbs of occupants, causing discomfort. Conversely, low velocities may lead to insufficient indoor airflow organization, allowing cold air to accumulate near the floor and locally increase airspeed. Overall, a moderate supply velocity, such as 2 m/s, is more favorable for maintaining temperature uniformity while minimizing the risk of direct drafts at foot level.
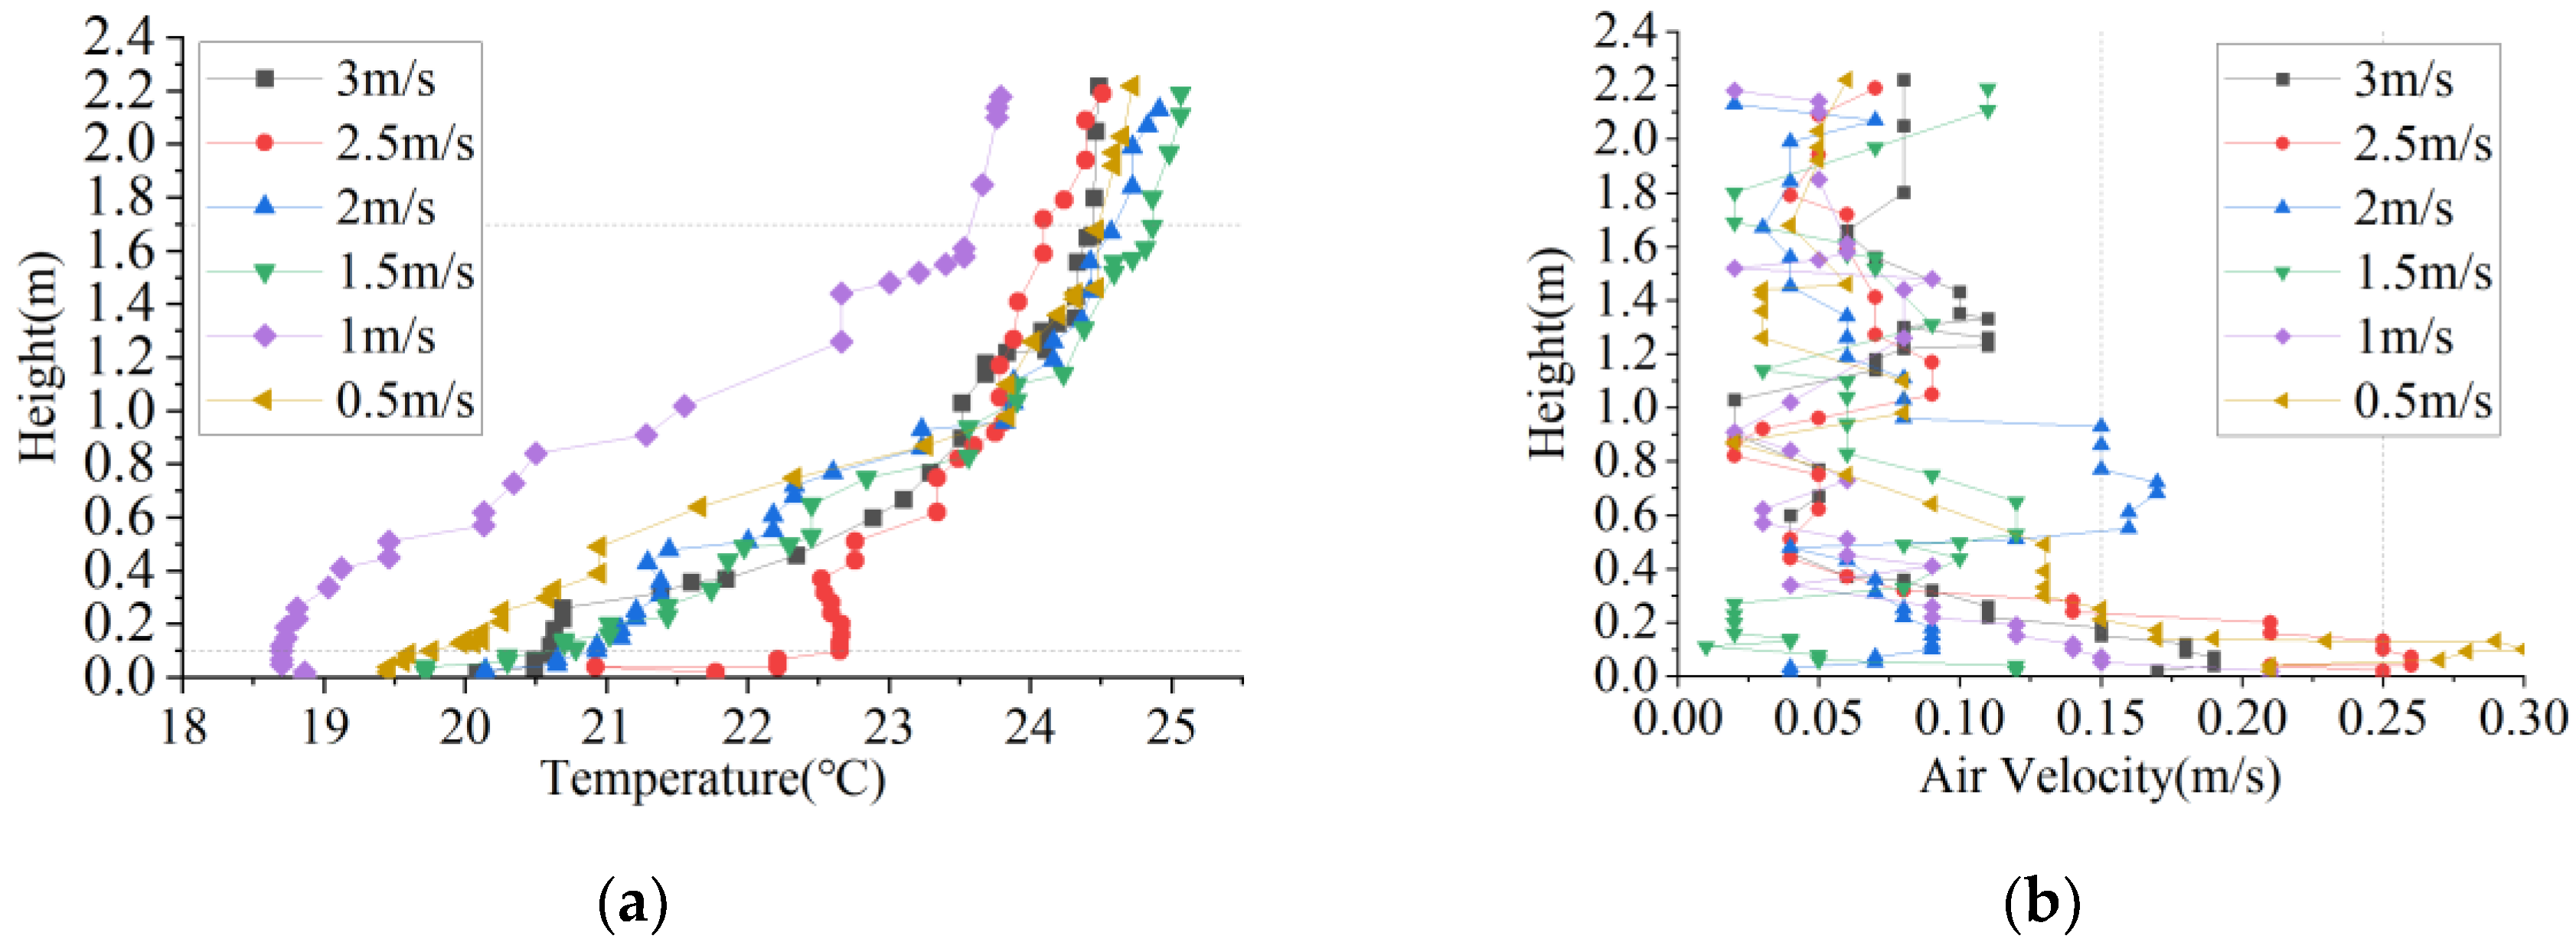
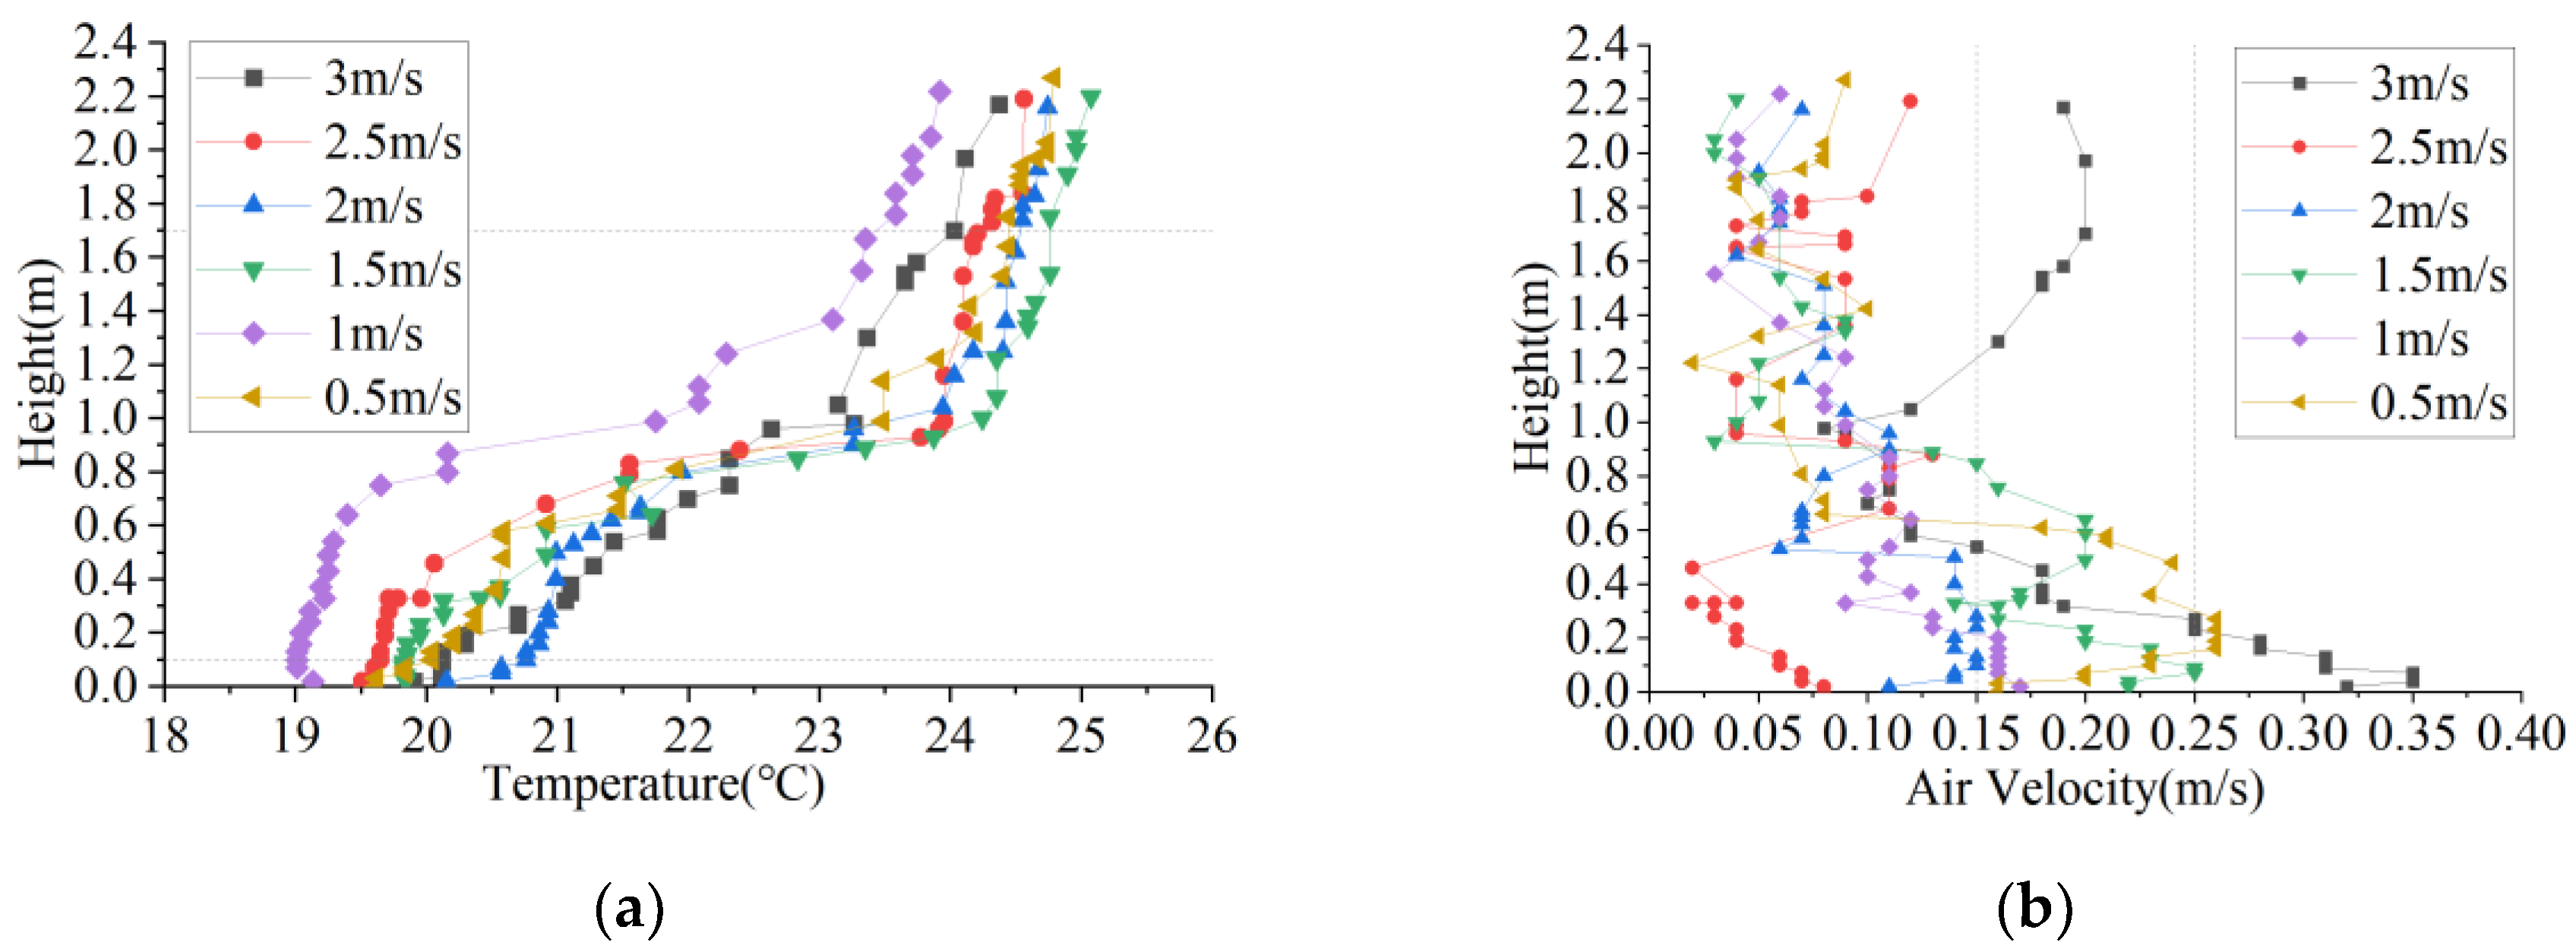
Figure 19.
Effect of Supply Air Velocity on the Vertical Centerline of the Supply Air Outlet Section: (a) Temperature variation with height; (b) Air velocity variation with height .
Figure 19.
Effect of Supply Air Velocity on the Vertical Centerline of the Supply Air Outlet Section: (a) Temperature variation with height; (b) Air velocity variation with height .
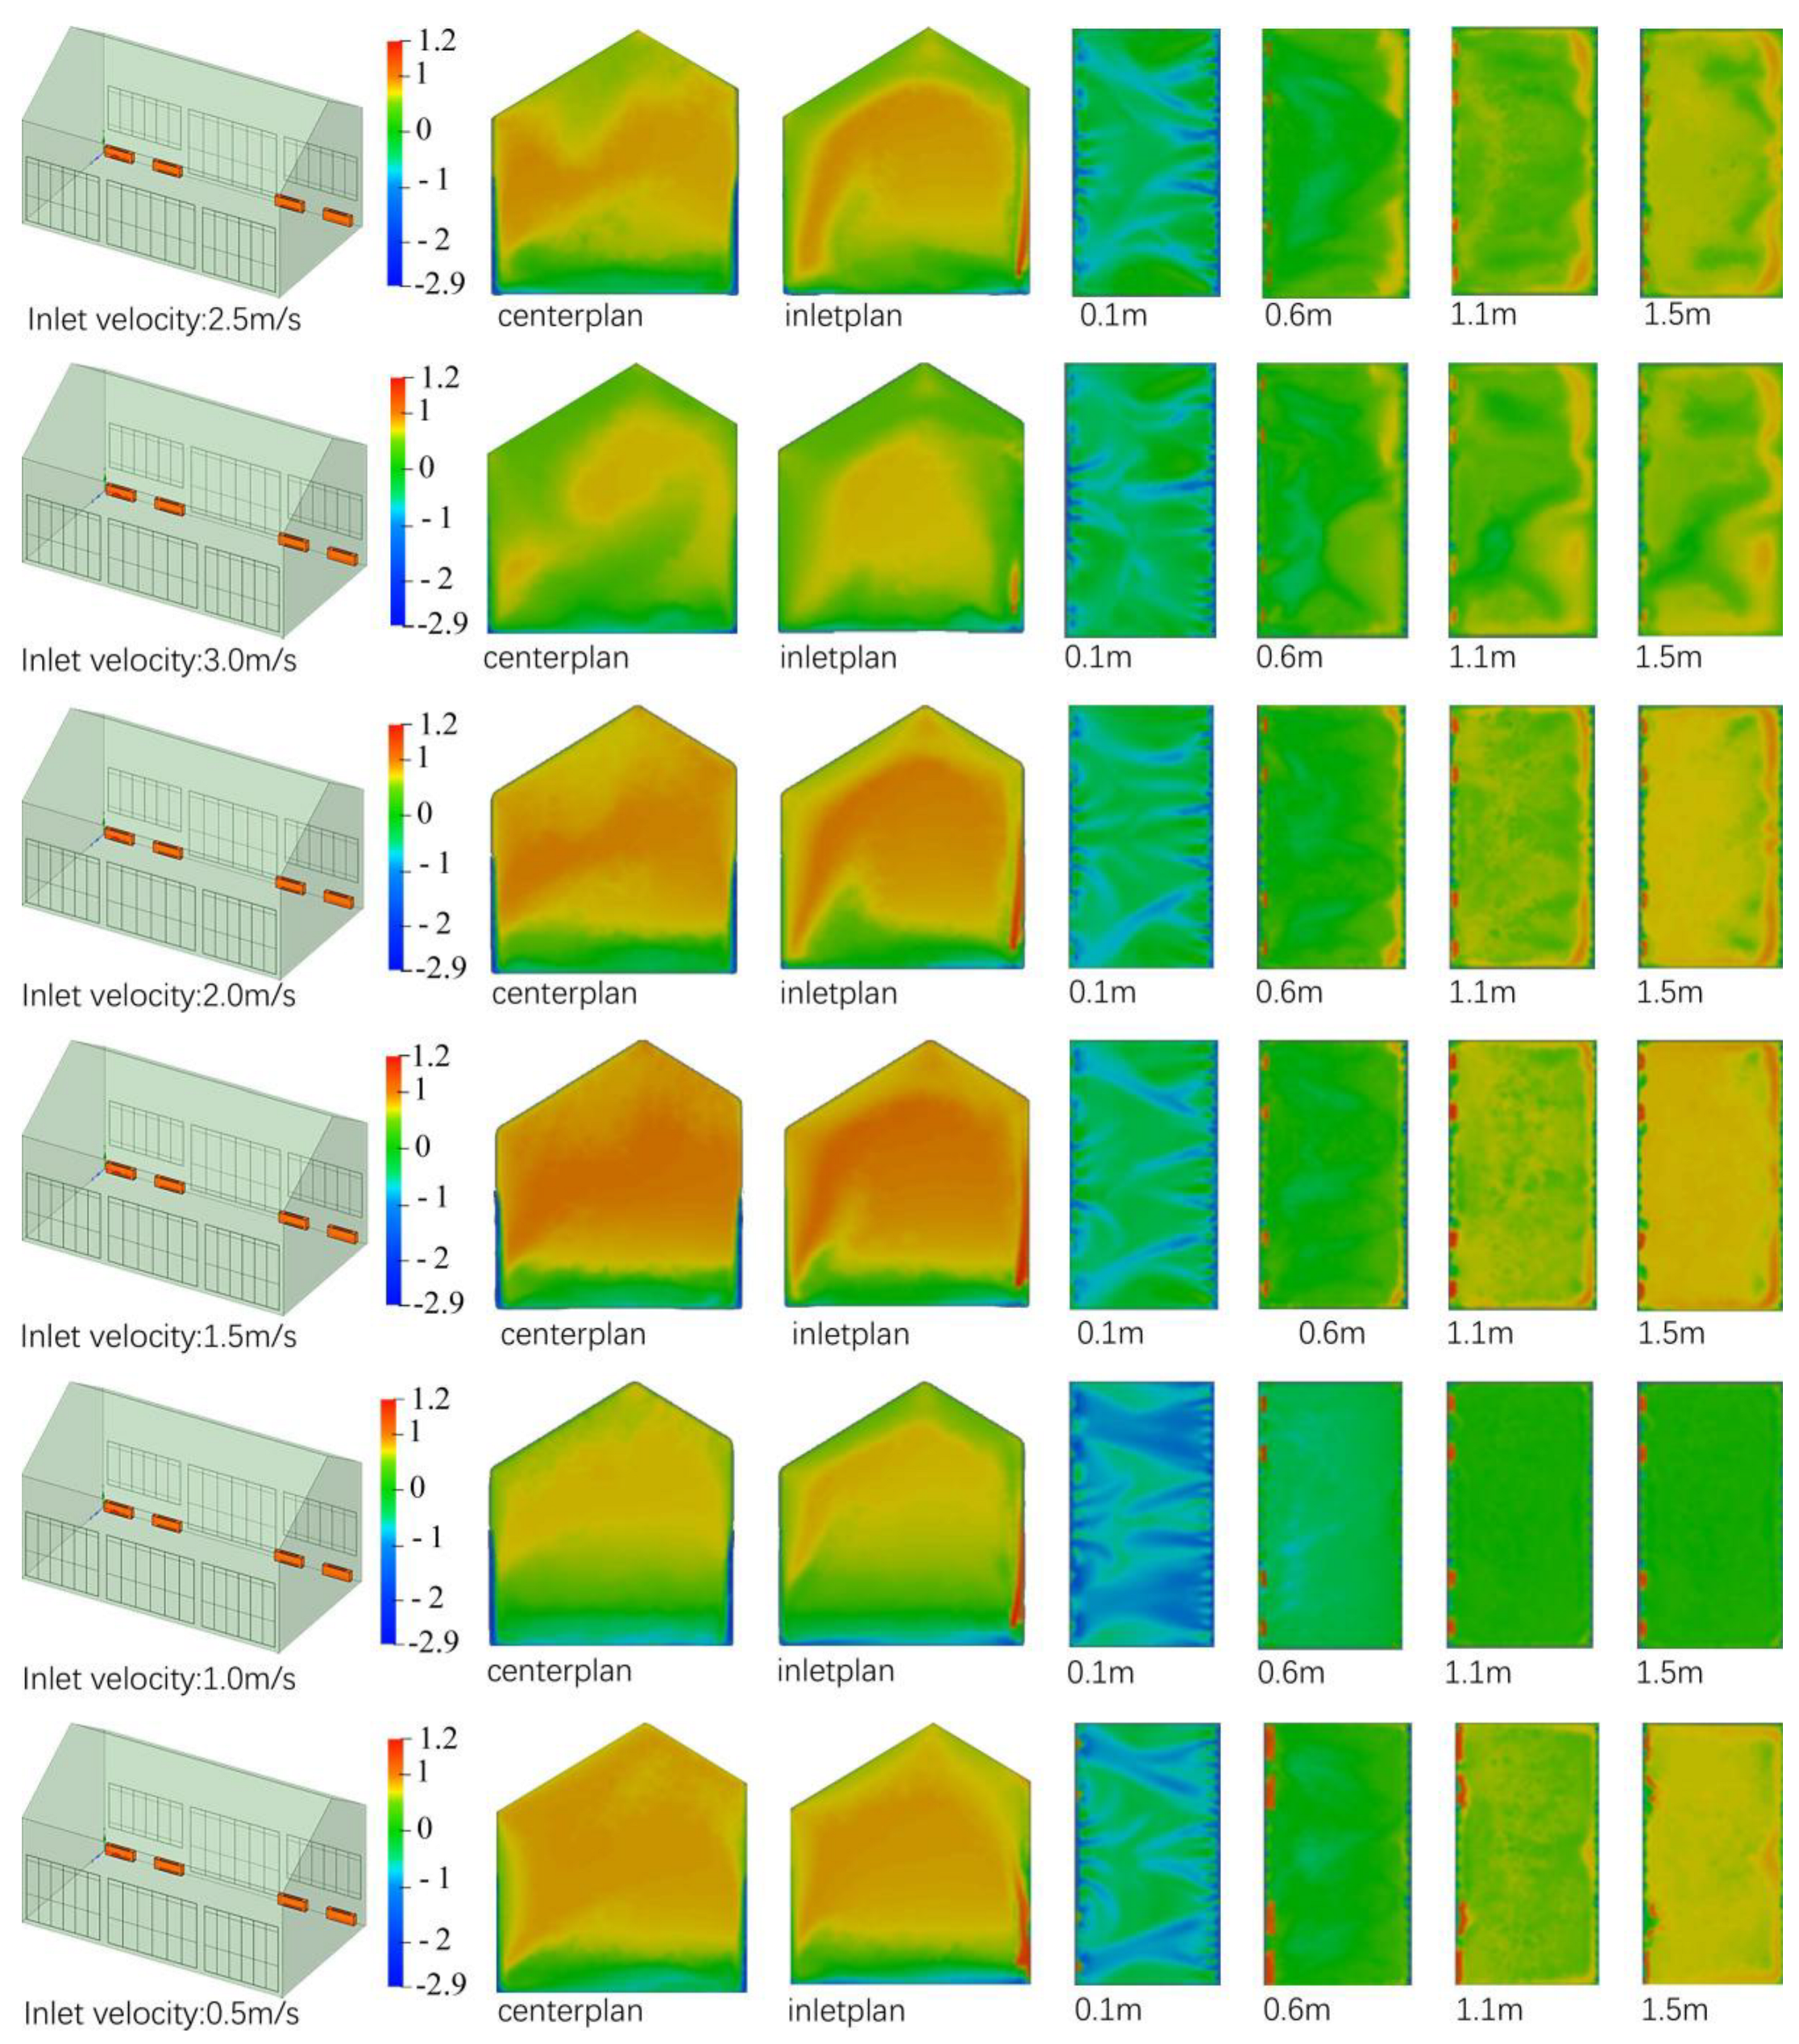
3.3.2. Thermal Comfort Contour Maps
Using the 30 °C, 90° supply air condition as the baseline, the effect of varying supply air velocity on indoor thermal comfort distribution was analyzed. The contour plots (
Figure 18) illustrate that decreasing the supply velocity from 3.0 m/s to 1.5 m/s significantly expanded the thermally uncomfortable areas within the occupied zone (1.1-1.5 m). As discussed in the previous section, higher supply velocities provide sufficient airflow momentum to establish more complete circulation paths, effectively transporting warm air from the upper regions and mitigating heat accumulation near the ceiling. In contrast, at lower velocities (below 1.5 m/s), the airflow coverage is limited, allowing warm air to stagnate near the top, resulting in elevated PMV values and thermal discomfort in the upper space. Furthermore, excessively low velocities (below 1.0 m/s) reduce overall thermal sensation, as insufficient supply momentum allows cold air to remain near the floor, creating noticeable cold discomfort zones at 0.1-0.6 m. These results indicate that, when using a floor-mounted upward supply, moderately increasing the supply velocity can optimize the vertical thermal environment in high and large spaces and enhance thermal comfort within the occupied zone.
Figure 20.
Cloud maps of comfort levels at different air supply velocities.
Figure 20.
Cloud maps of comfort levels at different air supply velocities.
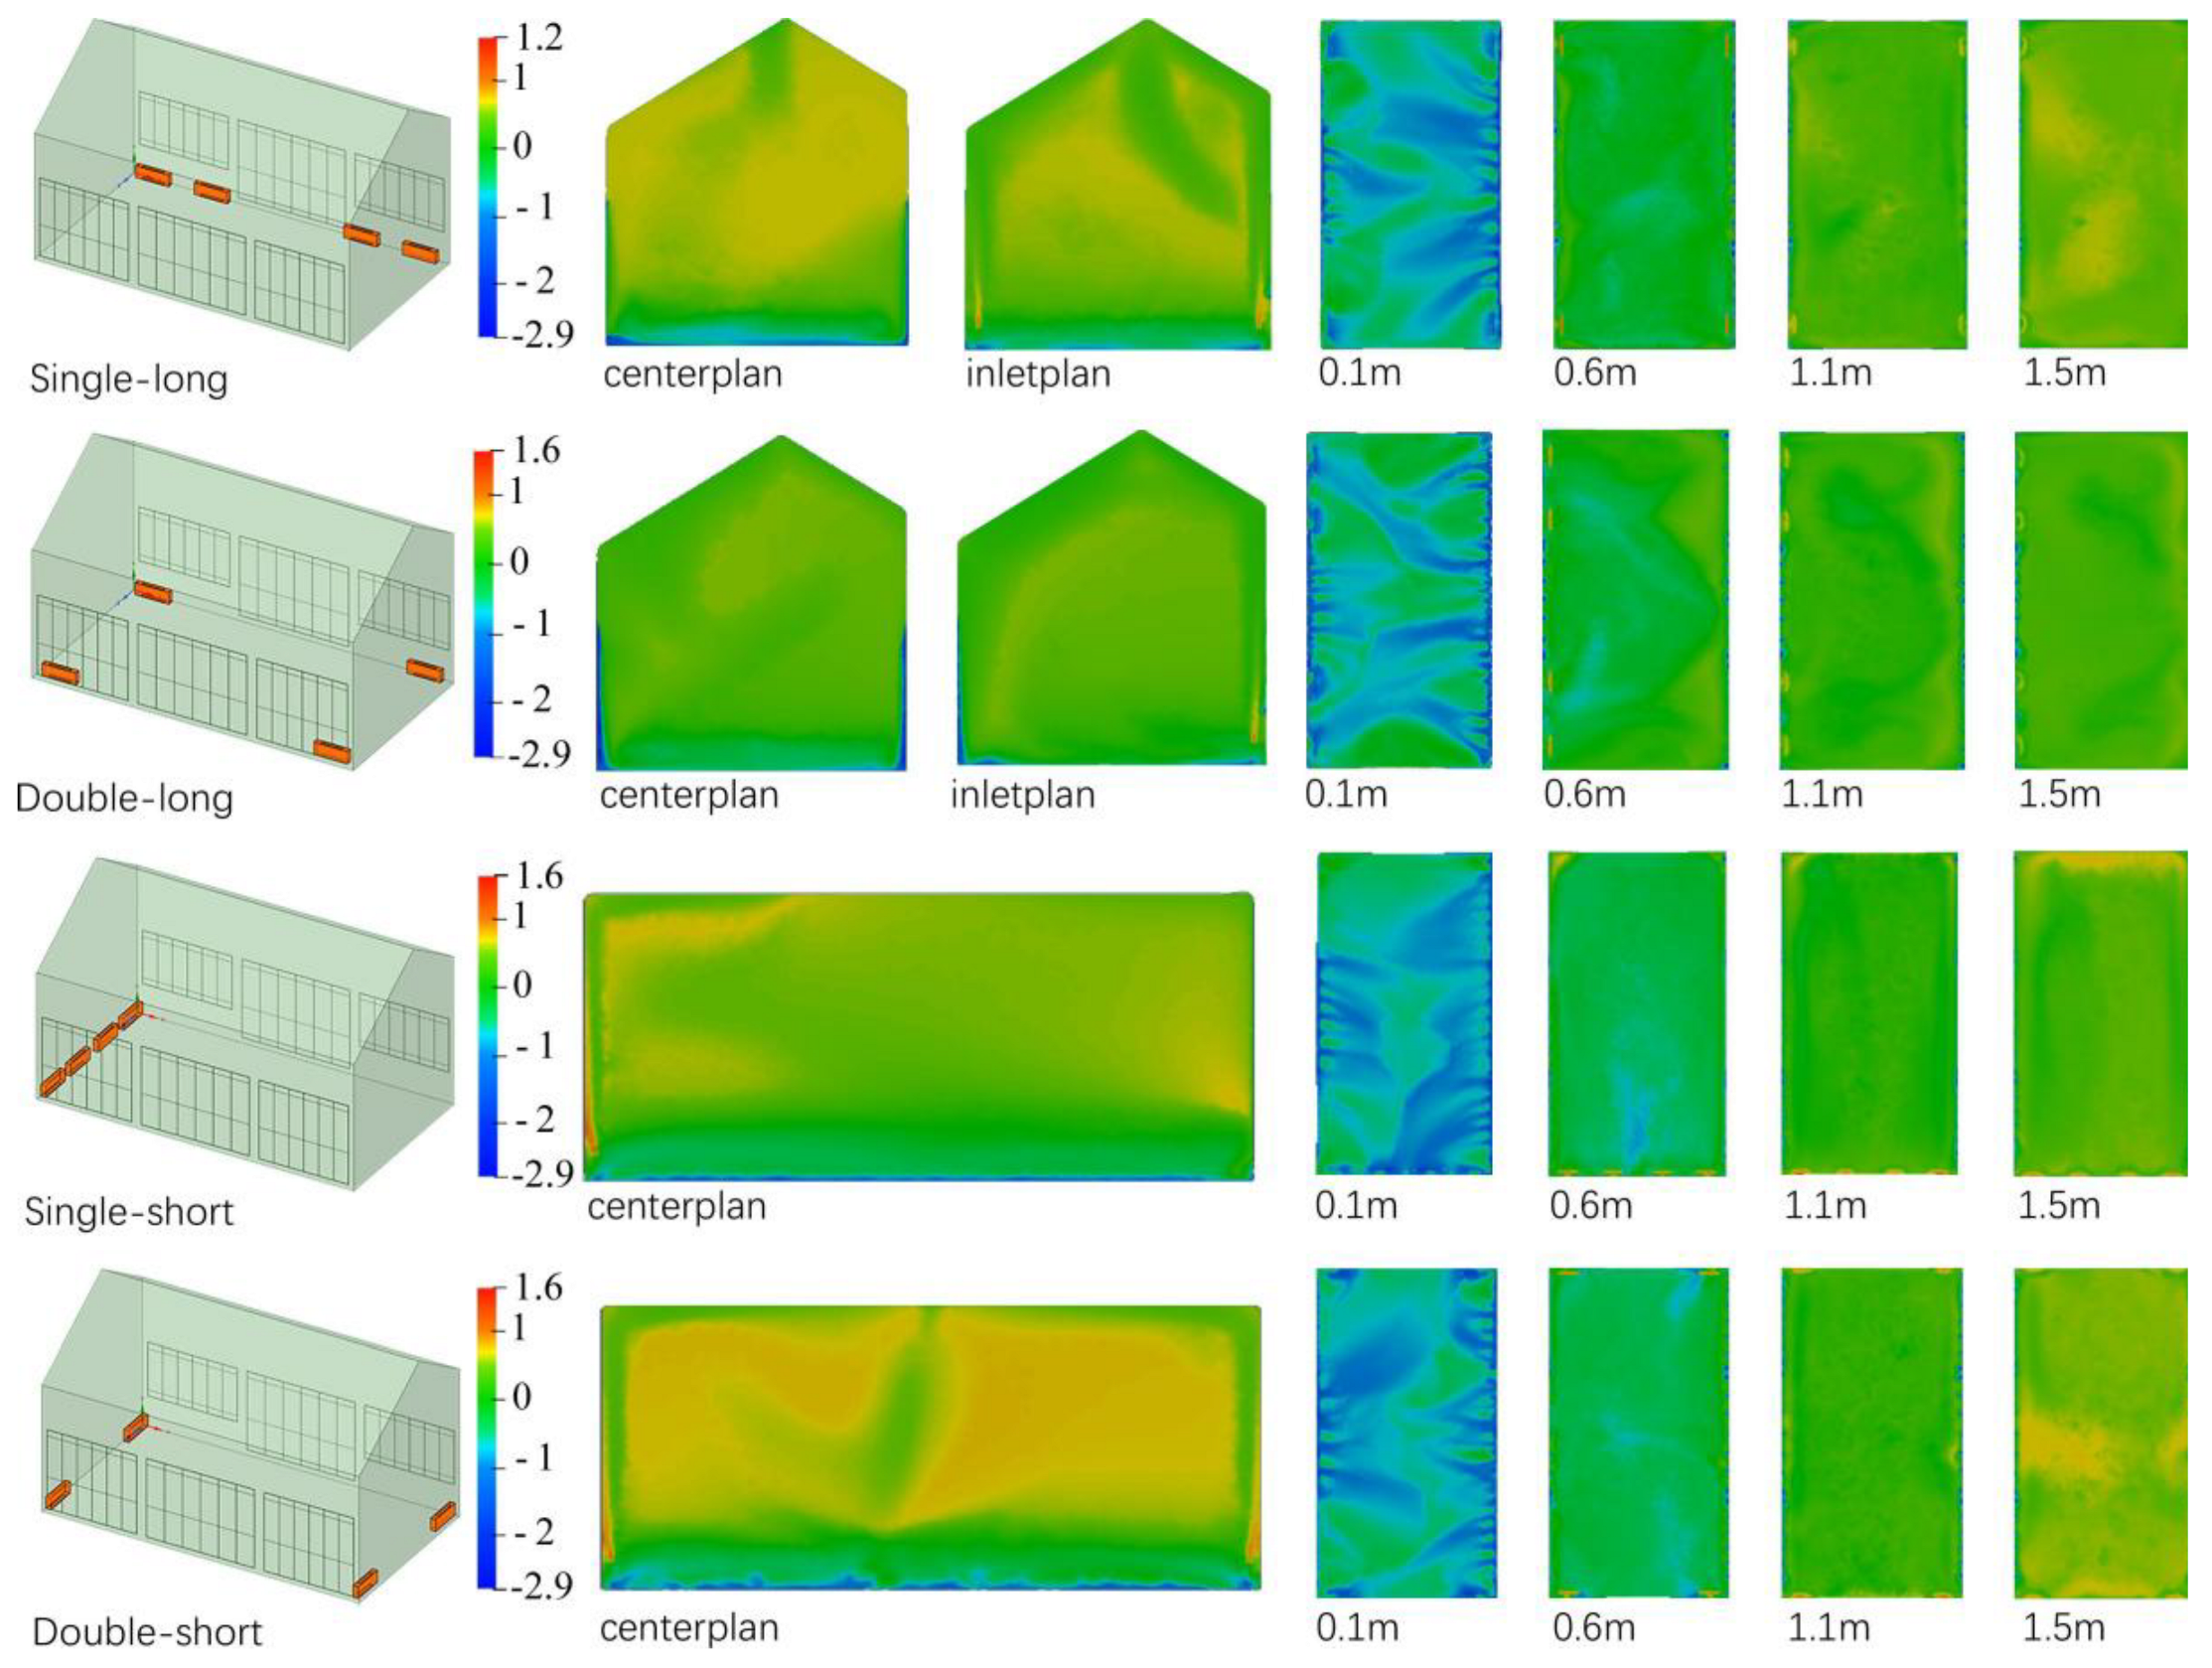
3.4. Effect of Supply Air Location on the Distribution of Indoor Comfort Zones
Using a supply air temperature of 28 °C as the baseline, the effect of different air-conditioning unit placements on indoor thermal comfort distribution was further investigated (Figure 19). When the units were arranged along the longer sides, a dual-side supply configuration outperformed a single-side arrangement in terms of PMV–PPD indices and in mitigating thermal stratification. In contrast, when the units were positioned along the shorter sides, a single-sided supply arrangement proved more beneficial than a dual-sided structure. It should be noted that this conclusion is based on simulations of the Rear Hall of the Suzhou Provincial Judicial Commissioner's Office, which has a length-to-width ratio of approximately 1.8; thus, the findings are only applicable to spaces with similar proportions.
Figure 21.
Cloud maps of comfort levels at different air supply positions.
Figure 21.
Cloud maps of comfort levels at different air supply positions.
4. Discussion
This study used the Rear Hall of the Suzhou Provincial Judicial Commissioner's Office as a case study to systematically evaluate the effects of different supply air velocities, supply angles, and supply layouts on the thermal comfort in high and large spaces of historical buildings. The primary conclusions are summarized as follows:
1)PMV–PPD Comfort Percentage: Supply air velocity has a significant impact on thermal comfort within the occupied zone, with higher velocities generally improving overall comfort. Variations in supply air angle have a comparatively minor effect on comfort percentage. Among the angles studied, 45° and 90° provided relatively better comfort across most velocities, whereas angles of 30° or lower resulted in a marked decrease in comfort. When the supply angle cannot be adjusted, selecting 60° or 75° can help stabilize comfort and mitigate the influence of velocity variations.
2)Effects of Different Supply Air Angles: Low-angle supply (e.g., 30°) improves temperature uniformity but may cause localized overcooling and direct draft issues, necessitating a balance between reducing vertical temperature stratification and maintaining comfort. High-angle supply (e.g., 90°) provides better overall comfort, but heat accumulation near the ceiling is more pronounced. A 75° supply angle achieves the most balanced performance between comfort and temperature distribution. Future strategies could consider low-temperature, low-velocity side supply combined with radiant floor heating to reduce heat loss and optimize thermal uniformity.
3)Effects of Different Supply Air Velocities: High velocities (e.g., 3.0 m/s) enhance airflow circulation, reduce heat accumulation near the ceiling, improve temperature uniformity, and elevate comfort in the occupied zone, but they may cause direct draft discomfort. Conversely, low velocities (below 1.5 m/s) lack sufficient airflow momentum, leading to simultaneous overheating in upper regions and excessive cooling near the floor. Overall, a supply velocity of approximately 2 m/s provides a balanced solution, improving vertical temperature distribution in high and large spaces while enhancing overall thermal comfort.
4)Effects of Different Supply Air Layouts: The impact of supply air layout on thermal comfort is relatively limited. When the supply air temperature is set to 28 °C, all layout configurations achieve optimal comfort. For indoor units positioned along the long side of the space, a dual-side supply is preferable, whereas for units along the short side, a single-side supply performs better. However, these findings are specific to spaces with a length-to-width ratio of 1.8.
This study employed simulation models of the North Flower Hall and the Rear Hall of the Suzhou Provincial Judicial Commissioner's Office to systematically investigate the effects of supply air parameters and layout configurations on thermal comfort in high and large spaces. The findings provide a reference for the design and optimization of HVAC systems in similar historic buildings and offer guidance for improving indoor thermal comfort. Nonetheless, certain limitations remain in this research.
First, this study focused solely on the simulation analysis under winter heating conditions, without addressing the airflow organization and thermal performance during summer cooling. As a result, it does not fully capture the year-round thermal comfort characteristics of historic buildings. Second, the analysis was based on steady-state simulations, lacking transient analyses; thus, the time required for the indoor space to reach thermal comfort and the dynamic response characteristics were not evaluated. Furthermore, the simulations focused solely on temperature, airflow velocity, and PMV–PPD indices, without incorporating auxiliary evaluation metrics such as CO₂ concentration or air age, resulting in a limited set of assessment criteria. Finally, the layout of the indoor units was constrained by the specific length-to-width ratio of the Rear Hall, which limited the generalizability of the conclusions.
Nevertheless, this study provides valuable insights into the thermal comfort of large historical building spaces.On the one hand, it elucidates the mechanisms by which air supply velocity, air supply angle, and diffuser layout influence thermal comfort distribution, providing quantitative support for optimizing heating strategies. On the other hand, the simulations highlight the common dual issue in historical high and large spaces under conventional air supply modes—namely, “heat accumulation at the top and overcooling at the bottom”—and demonstrate the potential of composite strategies, such as low-temperature, low-velocity side air supply combined with radiant floor heating, to enhance both thermal uniformity and occupant comfort. Future research should integrate both summer and transient simulation analyses and adopt multiple thermal environment evaluation indicators to enhance the applicability and accuracy of the simulation results. On this basis, further investigations should be carried out on combined control strategies—such as low-temperature, low-velocity side air supply coupled with radiant floor heating—to optimize the indoor thermal environment of high and large buildings.
Author Contributions
Conceptualization, Jie Wu ; methodology, Jie Wu and Yi Deng; software, Yiyu Chen; validation, Jie Wu; formal analysis, Yiyu Chen; investigation, Jie Wu; Yiyu Chen; Yi Deng; resources, Jie Wu; data curation, Jie Wu and Yiyu Chen; writing—original draft preparation, Yiyu Chen; writing—review and editing, Jie Wu; visualization, Yiyu Chen; supervision, Jie Wu; project administration, Yi Deng and Yiyu Chen ; funding acquisition, Jie Wu and Yi Deng. All authors have read and agreed to the published version of the manuscript.
Funding
This research received no external funding.
Data Availability Statement
The original contributions presented in this study are included in the article. Further inquiries can be directed to the corresponding author(s).
Acknowledgments
This work was supported by Suzhou Social Sciences Foundation Project, SZX2025LX005.; Jiangsu Construction System Science and Technology Project, 2023ZD029 and The Youth Cross-Disciplinary Research Team of Humanities and Social Sciences of Soochow University, 5033720523. The on-site research and testing assistance was also supported by Suzhou Historic City Group and Suzhou Mingcheng Renewal and Development Co., LTD.
Conflicts of Interest
The authors declare no conflicts of interest.
Abbreviations
The following abbreviations are used in this manuscript:
| PMV |
Predicted Mean Vote |
| PPD |
Predicted Percentage of Dissatisfied |
| CFD |
Computational Fluid Dynamics |
| HVAC |
Heating, Ventilation and Air Conditioning |
References
- Liu, D.; Xu, Z. Discussion on the Spatial Layout and Value of Yamen Buildings from the Perspective of Traditional Construction: A Case Study of the Yamen in Neixiang County, Henan. Art Education 2023, 237, 237–240. [Google Scholar]
- Li, X. General Commander's Office during the Ming and Qing Dynasties under Hierarchy. Anhui Architecture 2012, 19(12), 38. [Google Scholar] [CrossRef]
- Jiangsu Provincial Database of Immovable Cultural Relics. Available online: https://www.jslib.org.cn/trsnjapp/zjzy/bkydsjk.html (accessed on 23 September 2025).
- Qi, Z.; Xiao, X.; Gao, X. A Comparative Study on Indoor Thermal Environment of Traditional Dwellings in Multi-cultural Interleaving Area: A case study of Ulanqab Area. Buildings Energy 2024, 52, 85–93, 106. [Google Scholar]
- Bi, X.; Li, C.; Chen, W.; Cao, D.; Ma, Y. Study on Thermal Environment Analysis and Passive Optimization Strategy of Traditional Brick and Wood Dwellings in Mountainous Area of Southern Henan Province. Building Science 2022, 38, 23–30. [Google Scholar] [CrossRef]
- Du, X. Research on the Improvement of Thermal and Humidity Environment for the Conservation and Reuse of Cultural Relics on University Campus in Nanjing — Taking the Auditorium of Southeast University as an Example. Master's Thesis, Southeast University, Nanjing, China, 2020. [Google Scholar]
- Zheng, X.; Tang, S.; Wang, Z. Simulation of Indoor Airflow Organisation in Tall Building Space. Journal of Green Building 2024, 136–142, 158. [Google Scholar]
- Chen, H.; Wu, Y.; Wang, Y.; Zhang, S.; Lei, X. Simulation on Indoor Thermal Comfort of High and Large Space Buildings Based on Modelica and CFD. Building Energy 2025, 53, 76–84, 110. [Google Scholar]
- Li, Z.; Lu, J.; Li, Y.; Cao, S.; Li, Z. Analysis of Large Space Building Energy Consumption Based on EnergyPlus and CFD Coupling Strategy. Building Energy 2019, 47, 76–81. [Google Scholar]
-
JGJ/T 347—2014; Standard of test methods for thermal environment of building. Ministry of Housing and Urban-Rural Development of the People's Republic of China: Beijing, China, 2014.
- Awbi, H.B. Ventilation of Buildings; 2nd ed.; Routledge: London, 2004; ISBN 978-0-203-63447-9.
- Wang, X.; Yang, Y.; Xu, Y.; Wang, F.; Zhang, Q.; Huang, C.; Shi, C. Prediction of Vertical Thermal Stratification of Large Space Buildings Based on Block-Gebhart Model: Case Studies of Three Typical Hybrid Ventilation Scenarios. J. Build. Eng. 2021, 41, 102452. [Google Scholar] [CrossRef]
- Kang, Y.; Yuk, H.; Jo, H.H.; Kim, S. Indoor Thermal Environment Assessment of a Historic Building for a Thermal and Energy Retrofit Scenario Using a CFD Model. Case Stud. Therm. Eng. 2024, 63, 105330. [Google Scholar] [CrossRef]
- ASHRAE. ASHRAE Handbook—Fundamentals, SI Edition; American Society of Heating, Refrigerating and Air-Conditioning Engineers, Inc.: Atlanta, GA, USA, 2021. [Google Scholar]
- Royapoor, M.; Roskilly, T. Building Model Calibration Using Energy and Environmental Data. Energy and Buildings 2015, 94, 109–120. [Google Scholar] [CrossRef]
- Gilani, S.; Montazeri, H.; Blocken, B. CFD Simulation of Stratified Indoor Environment in Displacement Ventilation: Validation and Sensitivity Analysis. Building and Environment 2016, 95, 299–313. [Google Scholar] [CrossRef]
- Palaić, D.; Štajduhar, I.; Ljubic, S.; Wolf, I. Development, Calibration, and Validation of a Simulation Model for Indoor Temperature Prediction and HVAC System Fault Detection. Buildings 2023, 13, 1388. [Google Scholar] [CrossRef]
- ASHRAE. ASHRAE Guideline 14-2023: Measurement of Energy, Demand, and Water Savings. American Society of Heating, Refrigerating and Air-Conditioning Engineers, Inc.: Atlanta, GA, USA, 2023.
- International Performance Measurement and Verification Protocol: Concepts and Options for Determining Energy and Water Savings; Volume I: Revised March 2002.
- ASHRAE. ANSI/ASHRAE Standard 55-2023: Thermal Environmental Conditions for Human Occupancy; American Society of Heating, Refrigerating and Air-Conditioning Engineers, Inc.: Atlanta, GA, USA, 2023. [Google Scholar]
- ISO. ISO 7730:2005 — Ergonomics of the Thermal Environment: Analytical Determination and Interpretation of Thermal Comfort Using Calculation of the PMV and PPD Indices and Local Thermal Comfort Criteria. International Organization for Standardization: Geneva, Switzerland, 2005.
Figure 3.
Research flowchart.
Figure 3.
Research flowchart.
Figure 4.
The general layout plan of the Suzhou Provincial Judicial Commissioner's Office.
Figure 4.
The general layout plan of the Suzhou Provincial Judicial Commissioner's Office.
Figure 5.
The schematic representation of the measurement locations in Beihua Hall: (
a) Plan of the Beihua Hall; (
b)
Section 1-1 of the Beihua Hall.
Figure 5.
The schematic representation of the measurement locations in Beihua Hall: (
a) Plan of the Beihua Hall; (
b)
Section 1-1 of the Beihua Hall.
Figure 6.
Measured layout diagram: (a) Real test photos of the Beihua Hall; (b) Layout map of central measurement points; (c) Outdoor weather station.
Figure 6.
Measured layout diagram: (a) Real test photos of the Beihua Hall; (b) Layout map of central measurement points; (c) Outdoor weather station.
Figure 7.
The chart depicting temperature fluctuations recorded on January 3rd.
Figure 7.
The chart depicting temperature fluctuations recorded on January 3rd.
Figure 8.
Calibration diagram for temperature and humidity of Beihua Hall: (a) Temperature Comparison; (b) Relative Humidity Comparison.
Figure 8.
Calibration diagram for temperature and humidity of Beihua Hall: (a) Temperature Comparison; (b) Relative Humidity Comparison.
Figure 9.
CFD Model construction for the Beihua Hall: (a) Geometric model; (b) Grid division .
Figure 9.
CFD Model construction for the Beihua Hall: (a) Geometric model; (b) Grid division .
Figure 10.
The actual measurement simulation calibration diagram of the Beihua Hall.
Figure 10.
The actual measurement simulation calibration diagram of the Beihua Hall.
Figure 11.
Grid independence verification: Comparison of measured and simulated temperatures.
Figure 11.
Grid independence verification: Comparison of measured and simulated temperatures.
Figure 12.
CFD Model construction for the Rear Hall: (a) Geometric model; (b) Schematic representation of air supply angle .
Figure 12.
CFD Model construction for the Rear Hall: (a) Geometric model; (b) Schematic representation of air supply angle .
Figure 13.
The percentage of the comfort zone at different angles and speeds .
Figure 13.
The percentage of the comfort zone at different angles and speeds .
Figure 14.
The percentage of comfortable zones at different air supply positions .
Figure 14.
The percentage of comfortable zones at different air supply positions .
Figure 15.
Effect of Supply Air Angle on the Vertical Centerline of the Central Section: (a) Temperature variation with height; (b) Air velocity variation with height .
Figure 15.
Effect of Supply Air Angle on the Vertical Centerline of the Central Section: (a) Temperature variation with height; (b) Air velocity variation with height .
Figure 16.
Effect of Supply Air Angle on the Vertical Centerline of the Supply Air Outlet Section: (a) Temperature variation with height; (b) Air velocity variation with height .
Figure 16.
Effect of Supply Air Angle on the Vertical Centerline of the Supply Air Outlet Section: (a) Temperature variation with height; (b) Air velocity variation with height .
Figure 17.
Cloud maps of comfort levels at different air supply angles.
Figure 17.
Cloud maps of comfort levels at different air supply angles.
Figure 18.
Effect of Supply Air Velocity on the Vertical Centerline of the Central Section: (a) Temperature variation with height; (b) Air velocity variation with height .
Figure 18.
Effect of Supply Air Velocity on the Vertical Centerline of the Central Section: (a) Temperature variation with height; (b) Air velocity variation with height .
Table 1.
Thermal performance of the building envelope of Beihua Hall.
Table 1.
Thermal performance of the building envelope of Beihua Hall.
| Building envelope |
North and south walls |
East and west walls |
Glass |
Wooden door |
Roof |
| Thickness (mm) |
280 |
390 |
40 |
390 |
300 |
Material
composition |
Brick wall plastering |
single-layer glass |
wood
blue tiles |
wood |
concrete bricks |
| U value (W/m2*K) |
3.13 |
1.58 |
5.7 |
2.82 |
1.02 |
Table 2.
Wall Boundary Conditions for the Beihua Hall.
Table 2.
Wall Boundary Conditions for the Beihua Hall.
| Boundary |
East Wall |
West Wall |
South Wall |
North Wall |
South Roof |
North Roof |
| Temperature (℃) |
16.81 |
16.83 |
16.86 |
16.63 |
18.54 |
18.21 |
| Boundary |
Ground |
North wall window |
South wall door |
South wallwindow
|
East wall door |
West wall door |
| Temperature (℃) |
18.99 |
18.78 |
17.35 |
18.71 |
17.15 |
17.07 |
Table 4.
Verification of grid independence: Comparison of measured simulation error values.
Table 4.
Verification of grid independence: Comparison of measured simulation error values.
| Grids |
0.1m |
0.6m |
1.1m |
1.7m |
3m |
Average error |
| 100K |
5.04% |
10.66% |
4.55% |
4.36% |
2.76% |
5.48% |
| 200K |
1.30% |
3.38% |
3.99% |
0.79% |
0.88% |
0.2% |
| 400K |
2.46% |
4.88% |
1.29% |
1.29% |
2.08% |
0.53% |
Table 5.
Table of Boundary Conditions for the Rear Hall.
Table 5.
Table of Boundary Conditions for the Rear Hall.
| Boundary |
East Wall |
West Wall |
South Wall |
North Wall |
South Roof |
North Roof |
| Temperature (℃) |
18.32 |
18.28 |
16.83 |
16.58 |
19.71 |
19.46 |
| Boundary |
Ground |
South wall door |
South wallwindow1
|
South wallwindow2
|
North wall door |
North wall window |
| Temperature (℃) |
19.44 |
17.74 |
19.77 |
20.65 |
17.36 |
18.88 |
Table 6.
The area of the supply air outlet at different supply air velocities.
Table 6.
The area of the supply air outlet at different supply air velocities.
| Project |
Supply air velocity
(m/s) |
Supply area
(mm2) |
Length and width
(mm) |
| V1 |
3.0 |
90000 |
100*900 |
| V2 |
2.5 |
108000 |
120*900 |
| V3 |
1.5 |
180000 |
200*900 |
| V4 |
1.5 |
180000 |
200*900 |
| V5 |
1.0 |
270000 |
200*1350 |
| V6 |
0.5 |
540000 |
300*1800 |
Table 7.
The area of the supply air outlet at different supply air angles.
Table 7.
The area of the supply air outlet at different supply air angles.
| Section |
90°[℃] |
75°[℃] |
60°[℃] |
45°[℃] |
30°[℃] |
| Center |
4.56 |
3.83 |
5.90 |
4.73 |
3.66 |
| Supply |
1.45 |
4.33 |
4.23 |
2.12 |
3.58 |
Table 8.
The area of the supply air outlet at different supply air velocities.
Table 8.
The area of the supply air outlet at different supply air velocities.
| Section |
3m/s[℃] |
2.5m/s[℃] |
2m/s[℃] |
1.5m/s[℃] |
1m/s[℃] |
0.5m/s[℃] |
| Center |
3.92 |
4.56 |
3.79 |
4.93 |
4.33 |
4.40 |
| Supply |
3.84 |
1.45 |
3.24 |
3.89 |
4.83 |
4.72 |
|
Disclaimer/Publisher’s Note: The statements, opinions and data contained in all publications are solely those of the individual author(s) and contributor(s) and not of MDPI and/or the editor(s). MDPI and/or the editor(s) disclaim responsibility for any injury to people or property resulting from any ideas, methods, instructions or products referred to in the content. |
© 2025 by the authors. Licensee MDPI, Basel, Switzerland. This article is an open access article distributed under the terms and conditions of the Creative Commons Attribution (CC BY) license (http://creativecommons.org/licenses/by/4.0/).