
Submitted:
19 November 2025
Posted:
20 November 2025
You are already at the latest version
Abstract
Low-energy impacts have been demonstrated to cause damage and failure in aircraft structures, thereby affecting the structural load-bearing performance and creating safety hazards. In this study, an innovative damage-monitoring method based on a fiber Bragg grating (FBG) is proposed for honeycomb sandwich composites. The proposed method is applicable to honeycomb sandwich composites and integrates a light gradient boosting machine (LightGBM)-optimized impact localization method with feature-parallel and data-parallel processing in the machine-learning architecture. An impact localization algorithm is applied to honeycomb sandwich composites using an array of multiplexed FBG sensors. The proposed algorithm exhibited substantial localization accuracy. The LightGBM method was employed to identify the optimal branching points for impact localization in real time, addressing the low-accuracy challenge in localizing low-energy impacts on the board structure when the fiber grating sensing system operates at a high sampling frequency.
Keywords:
honeycomb sandwich composites
; low-energy impact localization
; fiber Bragg grating sensor
; layout optimization
; machine learning
1. Introduction
Carbon-fiber honeycomb sandwich composites combine lightweight design with high load-bearing capacity, vibration damping, and superior energy absorption, making them indispensable in modern aerospace structures. They are often used in aerospace applications, such as aircraft fuselage and wing structures. Under the influence of impact, such structures are prone to damage, such as core collapse and surface tearing, affecting structural performance and reliability. Low-energy impacts often cause internal damage that cannot be visually detected, posing significant challenges for structural health monitoring of these composites [1,2,3]. Damage resulting from low-energy impacts is not discernible through visualization methods, because damage manifestations such as matrix cracks and delamination primarily occur within the laminate. Most composites are brittle and absorb energy primarily through elastic deformation and damage mechanisms rather than plastic deformation. In a composite system, most impacts on the composite plate occur in the normal direction, and its resistance to impact damage is minimal because of the absence of a thickness-reinforced phase. Impact loads induce interlayer shear and tensile stresses that can lead to interlayer cracking. To address this challenge, a sensor network must be installed within the structure to measure the response signal upon impact. Through signal analysis, health monitoring technologies that can effectively localize impact damage and improve real-time damage detection in advanced composite structures can be developed.
Effective signal processing is fundamental to accurate impact localization, as it governs how structural-response data are translated into reliable damage-detection results. Researchers have investigated various localization algorithms, including Lamb waves [4], frequency-response functions [5], triangulation techniques [6], and artificial-intelligence algorithms [7]. Impact-response signal processing can be categorized based on the diverse research objects and methodologies employed, as follows:
The first category is based on time-difference localization techniques. The time-difference localization technique determines impact location based on the relationships among distance, angle, and wave propagation time. This is often accomplished using advanced signal-processing methods that extract the time-domain information of impact signals from various sensor locations. Ciampa and Meo [8] studied field impact detection, which can identify the location of acoustic emissions detected by the monitoring system in real time, and proposed an algorithm based on the surface combined with piezoelectric sensors to measure the difference in the stress wave in time‒frequency analysis. Based on time–frequency analysis, the amplitude of the continuous wavelet transform was used to determine the arrival time of the wave packet, solving a set of nonlinear equations using a local Newton iterative method based on an unconstrained optimization technique to derive the shock position coordinates and wave velocity. Ren et al. [9] extended the spatial filter algorithm for impact monitoring in composite structures by utilizing two-dimensional linear piezoelectric sensor arrays for signal acquisition. They proposed a spatial filtering-based structural impact monitoring system that does not require wave-velocity estimation. This study proposes a spatial filter-based method for localizing structural impacts without the wave velocity.
The second category includes frequency-domain-based localization methods. Hiche et al. [10] proposed a novel localization method that involves measuring the maximum strain spectrum through fiber Bragg grating (FBG) sensors. FBG sensors are utilized to collect the strain signals and identify the maximum strain value corresponding to the impact location. This method requires only a limited structural analysis and a small number of sensors, and its feasibility was substantiated through simulation and experimental verification. The approach was validated through simulation and experimental results.
The third category includes system modeling approaches. This approach entails a comparison between the measured and simulated signal features, where damage localization is determined by the minimum discrepancy between the measured and simulated structural signal features. Rezayat et al. [11] obtained data from FBG sensors and developed a variable-selective least-squares algorithm that utilizes structural patterns and data. This algorithm was experimentally validated and demonstrated three times the accuracy of the classical pseudo-inverse algorithm. Hafizi, Epaarachchi, and Lau [12] proposed a localization method for obtaining experimental data from FBG sensors using infrared sensing techniques. The group velocity was determined from the dispersion curves, and the difference between the crest times of the two sensors was defined as the time-delay difference. Then, localization was determined using a system of linear equations.
The fourth category includes machine learning-based and fitting techniques. This method requires establishing data input‒output relationships for complex structures to achieve impact localization. Jang and Kim [13] proposed a low-energy impact localization method for a reinforced composite plate using reference data, trained the model using extensive reference data, and experimentally validated the proposed method. Shrestha et al. [14] proposed a low-energy impact localization method for a reinforced composite plate using a one-dimensional array of FBG sensors and a reference database. The proposed method was validated on a Jabiru UL-D wing, and the maximum error was found to be less than 35 mm, confirming the feasibility of this method. In a subsequent study, Shrestha et al. [15] proposed a method for localizing low-energy impacts based on anomalous error values. In this study, strain signals were acquired using FBG sensors, and validation was conducted on a carbon fiber-reinforced plastic (CFRP) prototype. The localization error was 10.7 mm. Sai et al. [16] proposed an FBG impact localization system based on quasi-Newton and particle swarm optimization algorithms. The FBG sensing network consists of eight fiber gratings, which are used for impact signal detection, with the time difference extracted using the Shannon wavelet transform. The impact localization system relied on nonlinear equations derived from the time difference and coordinates of the FBGs. These algorithms were employed to solve a set of nonlinear equations, yielding the coordinates of the impact source.
A complex nonlinear relationship exists between the impact response signal and low-velocity impact location, making it challenging to develop a mathematical model using traditional methods. Machine learning is a data-driven approach that constructs statistical models using training data, thereby characterizing nonlinear, high-dimensional, and high-complexity relationships among the data. Consequently, it has been extensively employed to identify low-velocity impact areas and localize low-velocity impacts on plate structures. Datta et al. [17] extracted impact features, including peaks, means, standard deviations, and energy indices, from impact response signals. These features were extracted using a least-squares support vector regression (SVR) model, which was used to identify the locations of low-velocity impacts on CFRP structures. To locate the low-energy effect on the laminate, Lu et al. [18] extracted the band energy corresponding to the sixth node as the impact feature and optimized the hyperparameters of the SVR model. This was achieved through wavelet packet decomposition of the impact response signal. Sai et al. [19] developed an impact localization model based on an extreme learning machine utilizing the band energies corresponding to the first and second nodes. Furthermore, Lu et al. [20] used the wavelet method to eliminate noise in an impact response signal, thereby enhancing the precision of extracting the time difference of arrival (TDOA). They then incorporated TDOA as an input feature into a least-squares support vector machine to detect the location of low-velocity impacts on CFRP laminates. Yu et al. [21] extracted the short-time energy feature and combined it with an optimized support vector machine (SVM) model to achieve accurate low-velocity impact localization for CFRP laminates. Zheng [22] introduced a method for impact localization on honeycomb sandwich panels using a projective dictionary pair-learning classifier, showcasing advancements in impact detection technology. A comprehensive review of the extant literature indicates increased research efforts on the impact resistance of honeycomb sandwich composites and the optimization of their design for low-energy impact scenarios. Further research is required to explore diverse materials and structural configurations to enhance the impact resistance of these panels.
Although numerous machine-learning approaches have been developed for impact localization, most still suffer from limited accuracy, overfitting on small datasets, and inadequate feature representations for low-energy impacts in complex honeycomb structures. These drawbacks include the difficulty in obtaining stable input datasets, susceptibility to underfitting and overfitting, the need to collect a large number of training samples for the regression model, and the selection of appropriate hyperparameters to enhance its regression capability. Moreover, current impact localization methods based on machine learning primarily focus on extracting individual features, such as time-, frequency-, and time–frequency-domain features, as inputs to the regression model. This approach disregards the significance of multi-domain features in enhancing the efficacy of impact localization methods. To overcome these limitations, this study introduces a LightGBM-based impact localization framework specifically tailored to the anisotropic mechanical behavior and signal characteristics of carbon-fiber honeycomb structures. The proposed algorithm integrates gradient-based unilateral sampling with mutually exclusive feature binding. It utilizes time-domain signals with reduced sample data for impact localization, thereby reducing the required number of samples. Additionally, it employs FBG sensors for impact localization with reduced interference from electromagnetic signals. This improves model efficiency while reducing the number of feature dimensions, thereby preventing overfitting. The proposed method enables fast and accurate impact localization in honeycomb sandwich structures.
Building upon this motivation, the present study integrates FBG sensing with LightGBM learning to enhance low-energy-impact localization accuracy for honeycomb composites through combined experimental and computational validation. It methodically integrates signal-processing technology, feature-extraction methods, and machine-learning methods to develop a low-energy impact localization method for composite honeycomb boards. It addresses the challenge of low accuracy in the low-energy impact localization in board structures when utilizing a high-frequency sampling fiber grating sensing system. First, a low-energy impact experimental system for honeycomb sandwich composites was constructed, and a method based on empirical modal decomposition was explored to eliminate trend components from the impact response signal. The time-domain, frequency-domain, and time‒frequency-domain features were extracted and integrated. The wavelet-packet characteristics of the impact response signal were analyzed using the wavelet-packet decomposition method. A novel impact feature extraction method was developed, and the impact region was identified based on a set of wavelet packet features. The impact features and regions were established. The identification method models the relationship between impact features and the distance from the low-energy impact to the FBG sensor. Additionally, a low-energy impact localization method for honeycomb sandwich composites based on a LightGBM-based model is proposed. Furthermore, the performance of the impact localization method was evaluated, as illustrated in Figure 1. The remainder of this paper is organized as follows: Section 2 presents the experimental setup, Section 3 details the proposed algorithm, Section 4 discusses results and validation, and Section 5 presents conclusions.
2. Experiments
This study used a carbon-fiber aluminum honeycomb sandwich panel with assembly holes measuring 300 mm × 300 mm × 15 mm. The upper and lower surfaces of the sandwich panel consisted of 1-mm-thick T700/AG80 carbon fiber cladding, and the core layer was a hexagonal aluminum honeycomb with a wall thickness of 0.3 mm. A schematic of the test piece is shown in Figure 2. The tested area, excluding the edge cladding and assembly holes, was 255 mm × 255 mm. The measurement area was divided into square grids with a side length of 15 mm, resulting in 256 grid intersections. Impacts were applied at grid intersections. According to the working conditions of the actual composite honeycomb panel, the panel was secured using its assembly holes to simulate the loading of structural components during the operation of an actual aircraft.
Six FBG sensors were affixed to the back of the specimen with the geometric center as the origin and the horizontal and vertical centerlines as the X and Y axes, respectively. The six sensors were affixed with the numbering shown in Table 1; the specific arrangement is shown in Figure 3. FBG5 and FBG6 were both positioned at (0, 0) to capture symmetric reference strains at the geometric center, enabling calibration and correction of signal drift near the assembly hole.
Figure 4 illustrates a localization device comprising an impact signal-generating system, including an impact pendulum and hammerhead, used to apply impacts to the test specimen, with adjustable pendulum length and hammerhead weight and size. The test specimen measured 300 mm × 300 mm × 15 mm, the pendulum length was 400 mm, the hammerhead diameter was 15 mm, and the combined pendulum weight was 55 g.
The test site plan is shown in Figure 5, where the impact position adjustment device, including the height position adjustment slide, lateral position adjustment optical axis, and height limit device, was used to adjust the impact position of the impact hammer head up and down, and left and right, to ensure the accuracy of the impact position. The impact energy adjustment device, specifically the pendulum height angle limit device, used the pendulum height angle to control the impact energy.
3. Localization Algorithm
3.1. Experimental Setup and Signal Acquisition
When using fiber-optic grating sensors for the impact localization of the structure to be tested, a plurality of fiber grating sensors is uniformly arranged on the structure to be tested, forming a sensor network. Recently, deep learning-based approaches, such as CNNs, have been explored for intelligent damage detection [23]; however, they often require extensive datasets and incur high computational cost. To address this, gradient-boosting techniques such as LightGBM offer lightweight and efficient alternatives, particularly in small-sample scenarios. Furthermore, time–frequency-domain features extracted via wavelet packet decomposition [24] and optimized sensor layouts [25] have been proven effective in enhancing localization performance, which motivates the sensor design and feature engineering strategies used in this study. Before acquiring FBG sensor data for impact localization, it is necessary to establish a dataset. During the acquisition of each impact dataset, the impact test grid resolution was 1 mm, and three identical impacts were performed at 256 grid intersections to record the center-wavelength changes of the six FBG sensors.
A substantial body of research has demonstrated that optimal sensor placement enhances positioning accuracy and robustness. Research by Sai et al. [16] further indicates that increasing the number of sensors improves the robustness of low-energy impact positioning systems. Yue and Sharif Khodaei [26] examined the impact of different measurement strategies on recognition accuracy, and their results supported the necessity of multidirectional sensor deployment. As a result of the induced propagation wave, the center wavelength of the fiber grating is shifted, the strain signals corresponding to the impacts collected by a plurality of fiber grating sensors on the structure to be tested are obtained, and the time-domain signals of each fiber grating sensor are obtained for each FBG sensor for the 5 s of the pendulum fall. Figure 6 shows the time-domain impact response signals obtained from the six FBG sensors when the point near the honeycomb plate mounting hole (–75 mm, 75 mm) is hit, recording the time-domain signals from 10 ms before impact arrival to 50 ms after. The wavelength‒strain transformation relationship is 1 µε=1.07 pm at room temperature. The strains measured by FBG5 and FBG6 at the panel center were smaller (≤50 µε), consistent with the expected stress-wave attenuation pattern, validating the central calibration sensors. In comparison, FBG1, FBG2, FBG3, and FBG4 in the periphery exhibited larger strains, and the recorded signal waveforms and envelopes were clear.
Each experimental dataset contained 768 samples. In addition to maximum and minimum strain values, supplementary time–frequency features such as wavelet packet energy and short-time energy were extracted to capture shock wave propagation characteristics and enhance feature diversity. Figure 7 provides a visual representation of several signal wavelet packet energy decomposition features.
To eliminate directional blind spots and enhance impact localization accuracy, this study symmetrically arranged two additional sensors (FBG5 and FBG6) at the plate center, with their optical fibers oriented perpendicular to each other (at 90°). Given the sensitivity of FBG sensors to axial strain, single-direction placement may result in the creation of sensing blind spots when confronted with shock waves propagating from different directions. Orthogonal placement has been demonstrated to significantly enhance multidirectional strain capture capability, thereby increasing sensitivity and coverage for changes in impact direction. According to the extant literature, orthogonal configurations have been demonstrated to markedly curtail directional errors and enhance signal feature integrity in composite materials and anisotropic structures. The configuration of the sensors is illustrated in Figure 8.
Previous low-energy impact localization algorithms for composite plates have two significant limitations. First, they require a substantial amount of training data, which can be computationally intensive due to the optimization of the model parameters and the selection of multi-domain features. To address these challenges, this section presents a novel low-energy impact experimental system for composite plates. The system utilizes the wavelet packet decomposition method to analyze the relationship between the wavelet packet characteristics of the impact response signal and the location of low-energy impacts. Additionally, it defines a novel method for extracting impact features. Research has been conducted on impact-region identification methods based on the wavelet packet feature set and impact localization methods based on the stochastic fractal search algorithm. A method that integrates wavelet packet recognition and impact localization was proposed to identify impact regions and determine impact locations. The impact localization method involves a two-step localization process for low-energy impacts on composite plates based on wavelet packet features.
3.2. Algorithm Implementation—LightGBM
LightGBM is a gradient boosting framework proposed by Ke et al. [27] for computing classification, regression, and other problems. Because of its one-sided sampling based on the gradient and fusion binding of mutually exclusive features, LightGBM significantly reduces runtime and memory usage compared to models such as categorical boosting (CatBoost), X (Extreme) Gradient Boosting (XGBoost), and the gradient boosting decision tree (GBDT). LightGBM enhances computational efficiency through gradient-based one-sided sampling and feature exclusivity binding, which significantly reduce memory usage and training time while maintaining prediction accuracy. To reduce the number of features while keeping all the information, the LightGBM model adopts the principle of feature mutual exclusion binding, which implies that the high-dimensional data is represented sparsely and enables the fusion of mutually exclusive features. The decision-tree splitting strategy in this model is a histogram algorithm that differs from other classification and regression algorithms in that the grow-by-leaf strategy in LightGBM has a depth restriction, calculates the splitting gain of all leaves, and splits the leaf with the most significant increase, allowing efficient operation while mitigating overfitting. Figure 9 shows the LightGBM model structure and experimental workflow.
Yue [26] compared the accuracy of least-squares support vector machines (LSSVMs) and artificial neural networks (ANNs) for impact detection in aeronautical applications, demonstrating that LSSVMs outperform ANNs when training data is limited. Compared to the traditional machine-learning composite honeycomb panel impact localization system, network intrusion impact localization based on deep learning exhibits a significant improvement in accuracy. Multilayer perceptrons (MLPs) [28], convolutional neural networks (CNNs) [29], recurrent neural networks (RNNs) [30], long short-term memory (LSTM) [31], and other related algorithms have been applied to intrusion detection systems. Lim et al. [32] developed and compared four Random Forest (RF) models with different structures using a high-dimensional dataset generated by a finite-element program. The proposed RF-based method can accurately predict and quantify the delamination location and severity of composite panels and classify delamination interfaces with an accuracy of up to 90%. These algorithms have improved the accuracy of intrusion detection systems; however, deep-learning algorithms require significant computational resources and extended training times.
In this section, a regression model is constructed using LightGBM implemented in Python, with the strain maxima and minima of the six FBG sensors as inputs to the model and the output target variable y as the coordinates where the impact point is located. To ensure statistical robustness, a 10-fold cross-validation scheme was adopted, and both the mean RMSE and 95% confidence intervals were examined to assess model generalization.
3.3. Impact Localization Model Updating
The impact test was designed to simulate real-world structural installation conditions within the assembly hole. As a result, stress-wave conduction becomes irregular, leading to higher strain values in the region adjacent to the assembly hole than in other areas. Strain gauge FBG sensors were incorporated into the fittings to mitigate positioning errors caused by the assembly hole. After recalibrating the central sensors (FBG5 and FBG6) and optimizing peripheral sensor layout, the localization accuracy was improved by 35%–50%, confirming the effectiveness of the geometry-aware placement strategy (by comparison in Figure 10).
4. Validation of Localization Results
Figure 11 shows the nonbaseline locations designated for validation purposes. The total number of validation points was 60, and the proposed algorithm was used for impact localization. The localization results are also shown in Figure 11. Compared to the grid size of 15 mm, the proposed LightGBM model achieved a maximum localization error of 4.24 mm and an average error of 1.40 mm, demonstrating a substantial improvement in spatial accuracy over conventional regression models. Despite the variation in the number of pre-measured signals, The findings not only demonstrate improved localization accuracy but also confirm that the proposed LightGBM-based approach effectively balances model complexity and generalization, offering a practical framework for structural health monitoring. These results validate the proposed algorithm, highlighting its ability to achieve high localization precision and computational efficiency in low-energy impact scenarios.
LightGBM offers several advantages over traditional GBM, including its histogram-based decision-tree algorithm, leafwise growth strategy, difference calculation technique, and support for distributed training. These enhancements improved efficiency, reduced memory consumption, and accelerated training when handling large-scale datasets. Additionally, it maintains high performance and accuracy while preserving efficiency and flexibility. The optimal parameters of LightGBM obtained after grid search optimization are listed in Table 2.
This section analyzes the performance of the LightGBM model in localizing low-velocity impacts in composite plates. To this end, a comparative analysis was conducted between the LightGBM model and three regression models: CatBoost, XGBoost, and GBDT. To ensure a fair comparison, the optimal subset of features obtained from the LightGBM model served as the input for all regression models. The number of multi-domain features corresponding to the horizontal coordinates of the shock was 255, whereas the number of multi-domain features corresponding to the vertical coordinates of the shock was 256. Each test was conducted independently 15 times.
Table 3 presents the mean absolute error (MAE) and root-mean-square error (RMSE) of the predicted coordinates of the 15 random shocks obtained from each model. Figure 10 presents the localization error of each random shock obtained from the LightGBM model and the three contrasting regression models.
As shown in Table 3, the LightGBM model achieved the smallest RMSE (10.2 mm) and MAE (5.8 mm) among all the tested models, outperforming XGBoost, CatBoost, and GBDT with statistical significance (p < 0.05).The experimental findings demonstrated that the mean localization error when the LightGBM algorithm was employed was 5.8 mm, addressing the challenge of impact signal localization in composite honeycomb sandwich panels.
As indicated by Table 3 and Figure 12, the LightGBM algorithm outperformed baseline boosting models by reducing both the MAE and RMSE, demonstrating stronger generalization capability due to its leafwise growth and histogram-based split strategy. For the 15 random shocks, the localization error, maximum localization error, minimum localization error, and average localization error of each random shock obtained from the LightGBM model were considerably smaller than those obtained from the CatBoost, XGBoost, and GBDT models.
In summary, when the same subset of optimal features is used as input to the regression model, the LightGBM model provides higher localization accuracy for random shocks in the monitoring area of honeycomb sandwich composites compared to the three other regression models. In Figure 13, the LightGBM predictions closely align with measured impact coordinates, confirming the model’s stability and robustness under varying impact locations.
5. Conclusions
In this study, a low-energy impact testing platform for carbon-fiber aluminum honeycomb sandwich panels was established to accurately localize impact positions and enhance deformation monitoring through an integrated LightGBM–FBG approach. The impact time-domain strain signals were analyzed, and results indicated that the maximum strain recorded by FBG sensors accurately reflected the impact position on honeycomb sandwich panels. The proposed LightGBM-based model demonstrated superior localization accuracy to conventional boosting methods while significantly reducing the training time and computational load, using optimized model parameters to determine impact positions.
Although this study focused on square sandwich panels, the method can potentially be extended to non-square or irregular structures through sensor reconfiguration and geometry-adaptive training, which will be validated in future work. By adjusting the sensor configuration and partitioning the monitoring area, the process can be adapted to localize irregular composite structures. Although a geometric modeling approach requires extensive training data, the recognition-based approach offers enhanced versatility. The proposed approach overcomes the limitations of traditional TDOA techniques by learning nonlinear signal-to-distance relationships via LightGBM, thus achieving higher localization precision without explicit wave-speed estimation and resolving the interference between the signal amplitude and mounting distance due to the assembly problem. Experimental validation confirmed that the method effectively localizes impacts on honeycomb composites under multi-point constraints, indicating its engineering applicability for aerospace structure monitoring and maintenance. In future work, the proposed framework can support predictive maintenance strategies by automatically triggering localized inspection only when impact events exceed critical thresholds, thus optimizing NDT efficiency and reducing operational costs.
Supplementary Materials
Nine.
Author Contributions
Conceptualization, Z.H. and J.L.; data curation, Z.H. and S.C.; formal analysis, Z.H., J.L. and S.C.; methodology, Z.H. and J.L.; software, Z.H.; validation, Z.H. and S.C.; writing–original draft, Z.H.; project administration, J.L. and H.Z.; supervision, J.L., Q.W. and H.Z.; writing–review & editing, J.L.; funding acquisition, J.L.; investigation, Y.S.; resources, Q.W.
Funding
This research was funded in part by the Key Program of the National Natural Science Foundation of China [Grant number: 2024YFF0508400]; Project Funded by the 173 Basic Strengthening Program [Grant number: 2020-JCJQ-ZD-125-00]; the National Natural Science Foundation of China Joint Fund Key Project under project name “Research on Key Technologies for Target-Oriented Intelligent Maintenance in Aviation Engine Workshops” [grant number U2133202]; and Special Funds of 2023 Jiangsu Provincial Science and Technology Plan (First Batch of Innovation Capacity Building Plan). The funders had no role in the study design; collection, analysis, or interpretation of data; writing of the report; or decision to submit the article for publication.
Data Availability Statement
Data will be made available upon reasonable request.
Acknowledgments
We would like to thank Editage (www.editage.cn) for English language editing.
Conflicts of Interest
The authors declare no conflicts of interest. The funders had no role in the design of the study; in the collection, analyses, or interpretation of data; in the writing of the manuscript; or in the decision to publish the results.
Abbreviations
The following abbreviations are used in this manuscript:
| FBG | fiber Bragg grating |
| LightGBM | light gradient boosting machine |
| CFRP | carbon fiber-reinforced plastic |
| SVR | support vector regression |
| TDOA | time difference of arrival |
| SVM | support vector machine |
| CatBoost | categorical boosting |
| XGBoost | X (Extreme) Gradient Boosting |
| GBDT | gradient boosting decision tree |
| LSSVMs | least-squares support vector machines |
| ANNs | artificial neural networks |
| MLPs | multilayer perceptrons |
| CNNs | convolutional neural networks |
| RNNs | recurrent neural networks |
| LSTM | long short-term memory |
| MAE | mean absolute error |
| RMSE | root-mean-square error |
References
- Gorgin, R.; Wang, Z.; Wu, Z.; Yang, Y. Probability based impact localization in plate structures using an error index. Mech. Syst. Signal Process. 2021, 157, 107724. [Google Scholar] [CrossRef]
- Seno, A.H.; Sharif Khodaei, Z.S.; Aliabadi, M.H.F. Passive sensing method for impact localisation in composite plates under simulated environmental and operational conditions. Mech. Syst. Signal Process. 2019, 129, 20–36. [Google Scholar] [CrossRef]
- Aly, K.; Bradford, P.D. Real-time impact damage sensing and localization in composites through embedded aligned carbon nanotube sheets. Compos. B Eng. 2019, 162, 522–531. [Google Scholar] [CrossRef]
- Wang, W.; Zhang, H.; Lynch, J.P.; Cesnik, C.E.S.; Li, H. Experimental and numerical validation of guided wave phased arrays integrated within standard data acquisition systems for structural health monitoring. Struct. Control Health Monit. 2018, 25, e2171. [Google Scholar] [CrossRef]
- Su, Z.; Ye, L.; Lu, Y. Guided Lamb waves for identification of damage in composite structures: A review. J. Sound Vib. 2006, 295, 753–780. [Google Scholar] [CrossRef]
- Salehian, A. Identifying the Location of a Sudden Damage in Composite Laminates Using Wavelet Approach; Worcester Polytechnic Institute, 2003. [Google Scholar]
- El-Bakari, A.; Khamlichi, A.; Jacquelin, E.; Dkiouak, R. Assessing impact force localization by using a particle swarm optimization algorithm. J. Sound Vib. 2014, 333, 1554–1561. [Google Scholar] [CrossRef]
- Ciampa, F.; Meo, M. Acoustic emission source localization and velocity determination of the fundamental mode A 0 using wavelet analysis and a Newton-based optimization technique. Smart Mater. Struct. 2010, 19, 045027. [Google Scholar] [CrossRef]
- Ren, Y.; Qiu, L.; Yuan, S.; Su, Z. A diagnostic imaging approach for online characterization of multi-impact in aircraft composite structures based on a scanning spatial-wavenumber filter of guided wave. Mech. Syst. Signal Process. 2017, 90, 44–63. [Google Scholar] [CrossRef]
- Hiche, C.; Coelho, C.K.; Chattopadhyay, A. A strain amplitude-based algorithm for impact localization on composite laminates. J. Intell. Mater. Syst. Struct. 2011, 22, 2061–2067. [Google Scholar] [CrossRef]
- Rezayat, A.; De Pauw, B.; Lamberti, A.; El-Kafafy, M.; Nassiri, V.; Ertveldt, J.; Arroud, G.; Vanlanduit, S.; Guillaume, P. Reconstruction of impacts on a composite plate using fiber Bragg gratings (FBG) and inverse methods. Compos. Struct. 2016, 149, 1–10. [Google Scholar] [CrossRef]
- Hafizi, Z.M.; Epaarachchi, J.; Lau, K.T. Impact location determination on thin laminated composite plates using an NIR-FBG sensor system. Measurement 2015, 61, 51–57. [Google Scholar] [CrossRef]
- Jang, B.W.; Kim, C.G. Impact localization on a composite stiffened panel using reference signals with efficient training process. Compos. B Eng. 2016, 94, 271–285. [Google Scholar] [CrossRef]
- Shrestha, P.; Kim, J.H.; Park, Y.; Kim, C.G. Impact localization on composite wing using 1D array FBG sensor and RMS/correlation based reference database algorithm. Compos. Struct. 2015, 125, 159–169. [Google Scholar] [CrossRef]
- Shrestha, P.; Kim, J.H.; Park, Y.; Kim, C.G. Impact localization on composite structure using FBG sensors and novel impact localization technique based on error outliers. Compos. Struct. 2016, 142, 263–271. [Google Scholar] [CrossRef]
- Sai, Y.; Jiang, M.; Sui, Q.; Lu, S.; Jia, L. Composite plate low energy impact localization system based on FBG sensing network and hybrid algorithm. Opt. Fiber Technol. 2015, 24, 84–88. [Google Scholar] [CrossRef]
- Datta, A.; Augustin, M.J.; Gupta, N.; Viswamurthy, S.R.; Gaddikeri, K.M.; Sundaram, R. Impact localization and severity estimation on composite structure using fiber Bragg grating sensors by least square support vector regression. IEEE Sens. J. 2019, 19, 4463–4470. [Google Scholar] [CrossRef]
- Lu, J.; Wang, B.; Liang, D. Wavelet packet energy characterization of low velocity impacts and load localization by optical fiber Bragg grating sensor technique. Appl. Opt. 2013, 52, 2346–2352. [Google Scholar] [CrossRef]
- Sai, Y.; Zhao, X.; Wang, L.; Hou, D. Impact localization of CFRP structure based on FBG sensor network. Photon. Sens. 2020, 10, 88–96. [Google Scholar] [CrossRef]
- Lu, S.; Jiang, M.; Sui, Q.; Sai, Y.; Jia, L. Low velocity impact localization system of CFRP using fiber Bragg grating sensors. Opt. Fiber Technol. 2015, 21, 13–19. [Google Scholar] [CrossRef]
- Yu, J.; Zeng, J.; Zhang, J.; Zhang, X.; Li, T. Short-time energy characterization of low velocity impact localization method on CFRP using FBG sensors Asia and the Pacific Optical Sensors Conference, OSA Technical Digest, online (Optica Publishing Group), 2016, Paper Tu4A.7. [CrossRef]
- Zheng, Z.; Lu, J.; Liang, D. Low-velocity impact localization on a honeycomb sandwich panel using a balanced projective dictionary pair learning classifier. Sensors (Basel, Switzerland) 2021, 21, 2602. [Google Scholar] [CrossRef]
- Ma, T.; Wang, S.; Xia, Y.; Zhu, X.; Evans, J.; Sun, Y.; He, S. CNN-based classification of fNIRS signals in motor imagery BCI system. J. Neural Eng. 2021, 18, 056019. [Google Scholar] [CrossRef]
- Kuang, Y.; Yang, Z.; Zhu, M. Design and characterisation of a piezoelectric knee-joint energy harvester with frequency up-conversion through magnetic plucking. Smart Mater. Struct. 2016, 25, 085029. [Google Scholar] [CrossRef]
- Soh, C.K.; Tseng, K.K.H.; Bhalla, S.; Gupta, A. Performance of smart piezoceramic patches in health monitoring of a RC bridge. Smart Mater. Struct. 2000, 9, 533–542. [Google Scholar] [CrossRef]
- Yue, N.; Sharif Khodaei, Z.S. Assessment of impact detection techniques for aeronautical application: ANN vs. LSSVM. J. Multiscale Modell. 2016, 7, 1640005. [Google Scholar] [CrossRef]
- Ke, G.; Meng, Q.; Finley, T.; Wang, T.; Chen, W.; Ma, W.; Ye, Q.; Liu, T.-Y. LightGBM: A highly efficient gradient boosting decision tree. Proceedings of the 31st Conference on Neural Information Processing Systems (NIPS 2017), Long Beach p, 2017; pp. 3149–3157. [CrossRef]
- Esmaily, J.; Moradinezhad, R.; Ghasemi, J. Intrusion detection system based on Multi-Layer Perceptron Neural Networks and Decision Tree 7th Conference on Information and Knowledge Technology (IKT), Urmia, Iran, 2015, 2015; pp. 1–5. [CrossRef]
- Wang, Q.; Zhao, W.; Wei, X.; Ren, J.; Gao, Y.; Zhang, B. Intrusion detection algorithm based on convolutional neural network and light gradient boosting machine. Int. J. Softw. Eng. Knowl. Eng. 2022, 32, 1229–1245. [Google Scholar] [CrossRef]
- Yin, C.; Zhu, Y.; Fei, J.; He, X. A deep learning approach for intrusion detection using recurrent neural networks. IEEE Access 2017, 5, 21954–21961. [Google Scholar] [CrossRef]
- Staudemeyer, R.C.; Omlin, C.W.P. Evaluating performance of long short-term memory recurrent neural networks on intrusion detection data. In Proceedings of the South African Institute of Computer Scientists and Information Technologists Conference (SAICSIT ’13); Association for Computing Machinery: New York, NY, 2013; pp. 218–224. [Google Scholar] [CrossRef]
- Lim, D.K.; Mustapha, K.B.; Pagwiwoko, C.P. Delamination detection in composite plates using random forests. Compos. Struct. 2021, 278, 114676. [Google Scholar] [CrossRef]
Figure 1.
Flowchart of the low-energy impact localization method using the machine-learning model with multi-domain features for a honeycomb sandwich composite panel.
Figure 1.
Flowchart of the low-energy impact localization method using the machine-learning model with multi-domain features for a honeycomb sandwich composite panel.
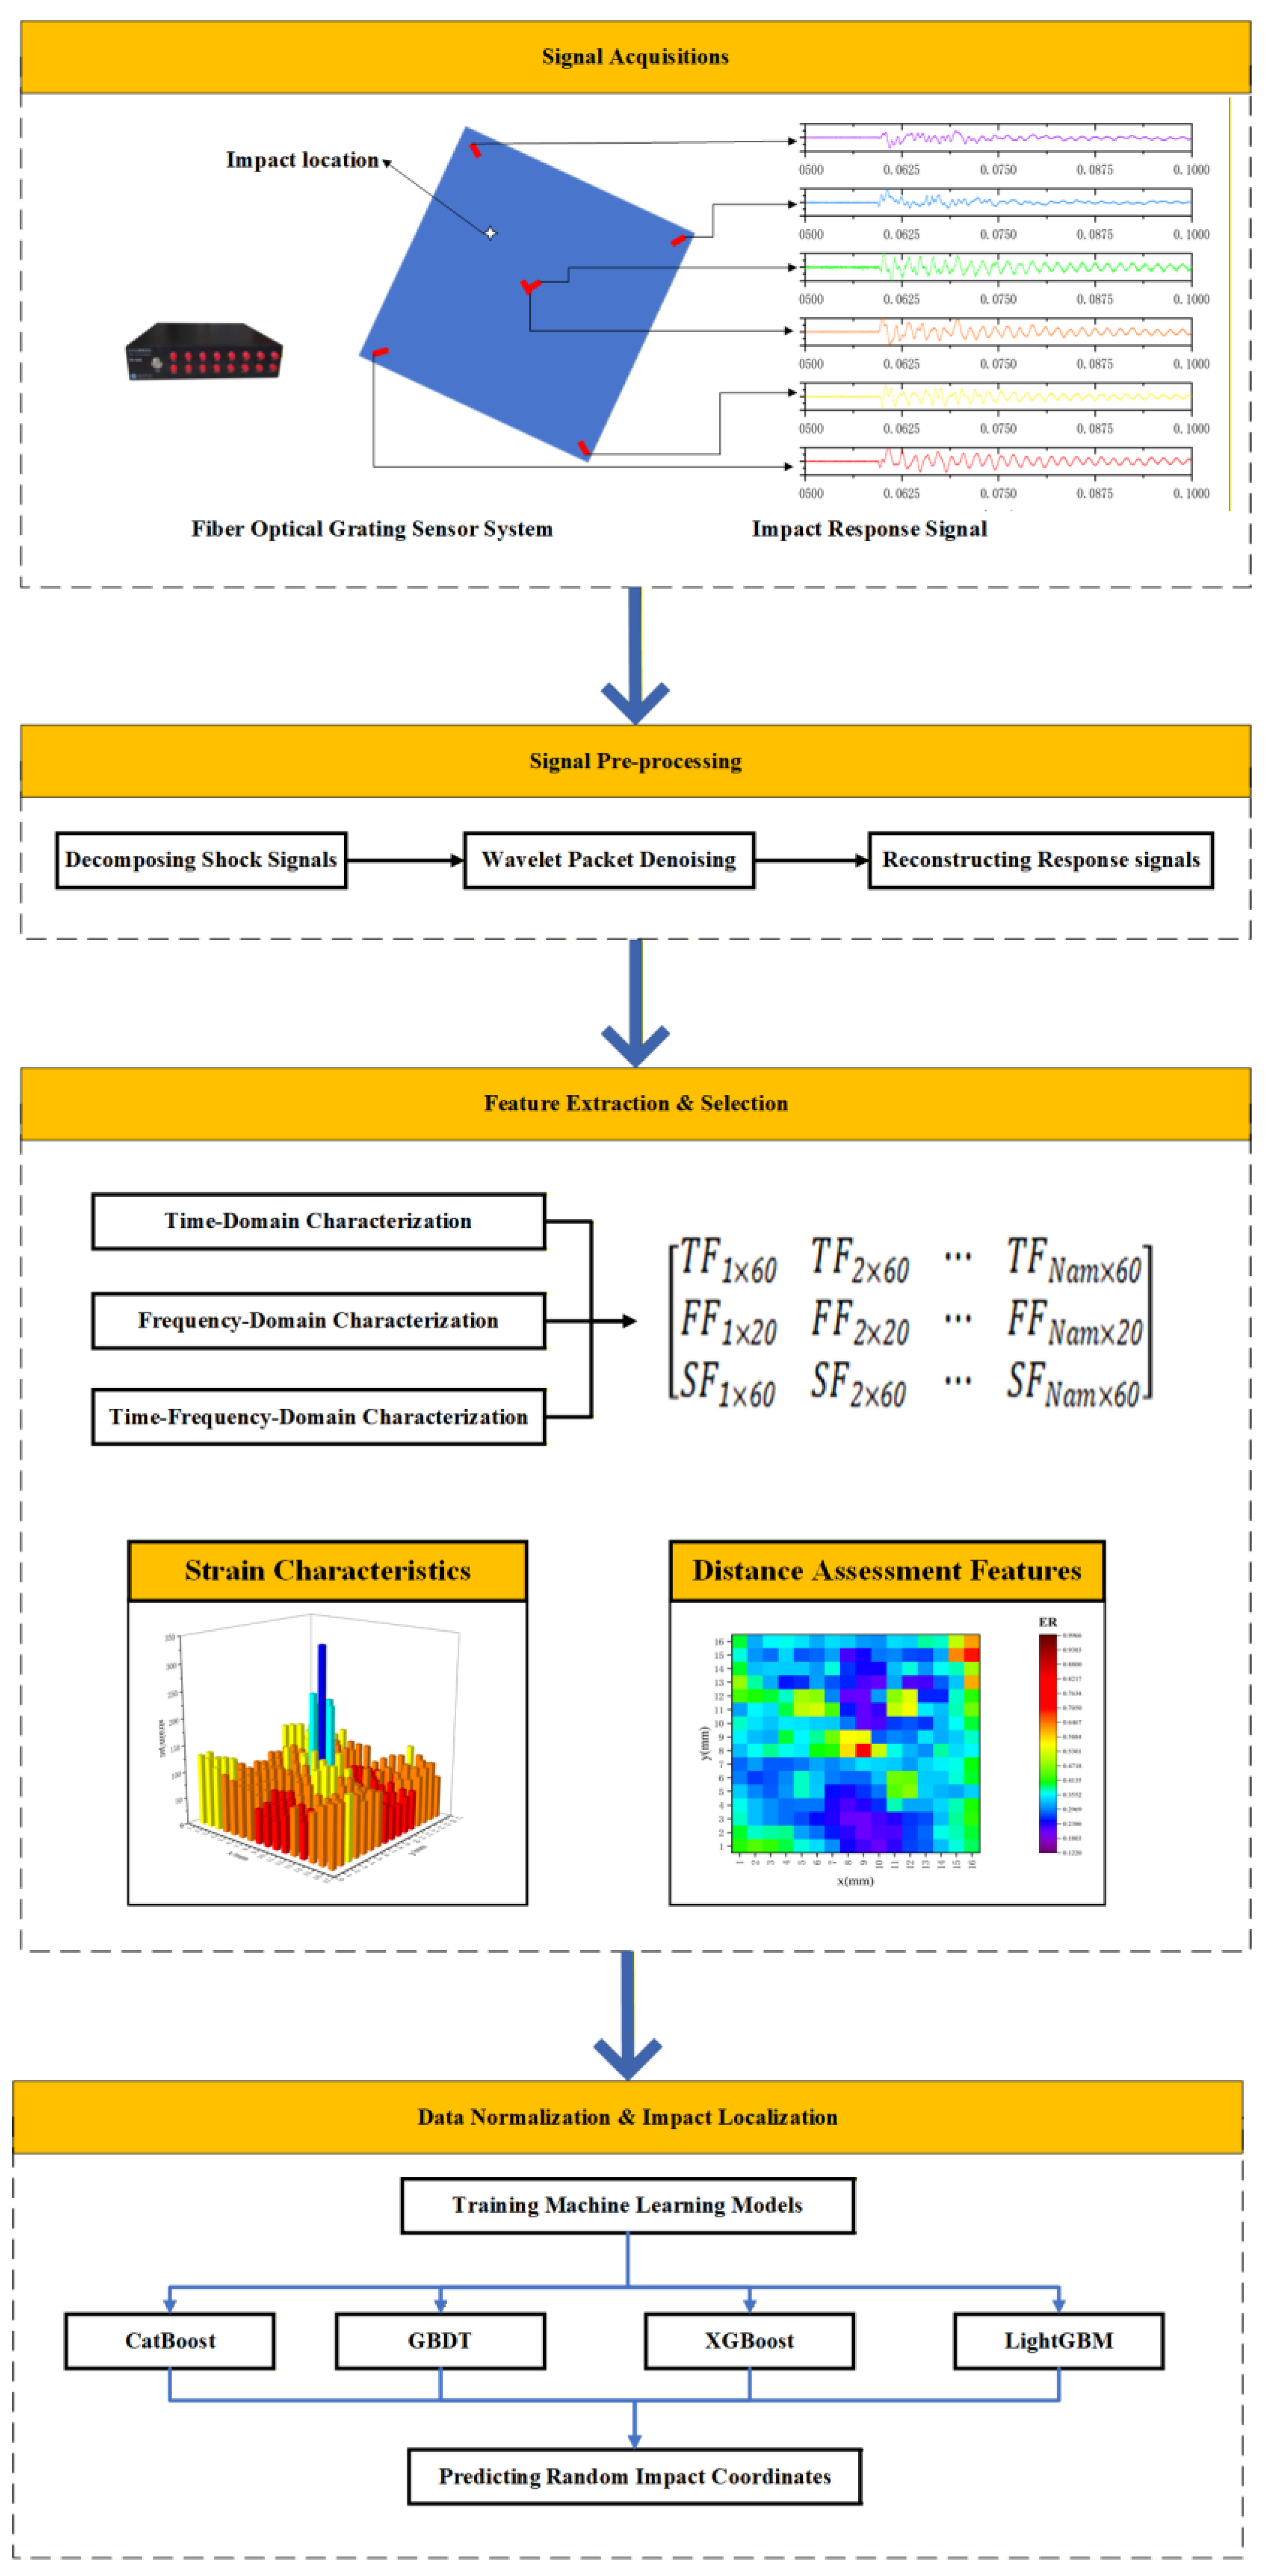
Figure 2.
Schematic of the test piece.
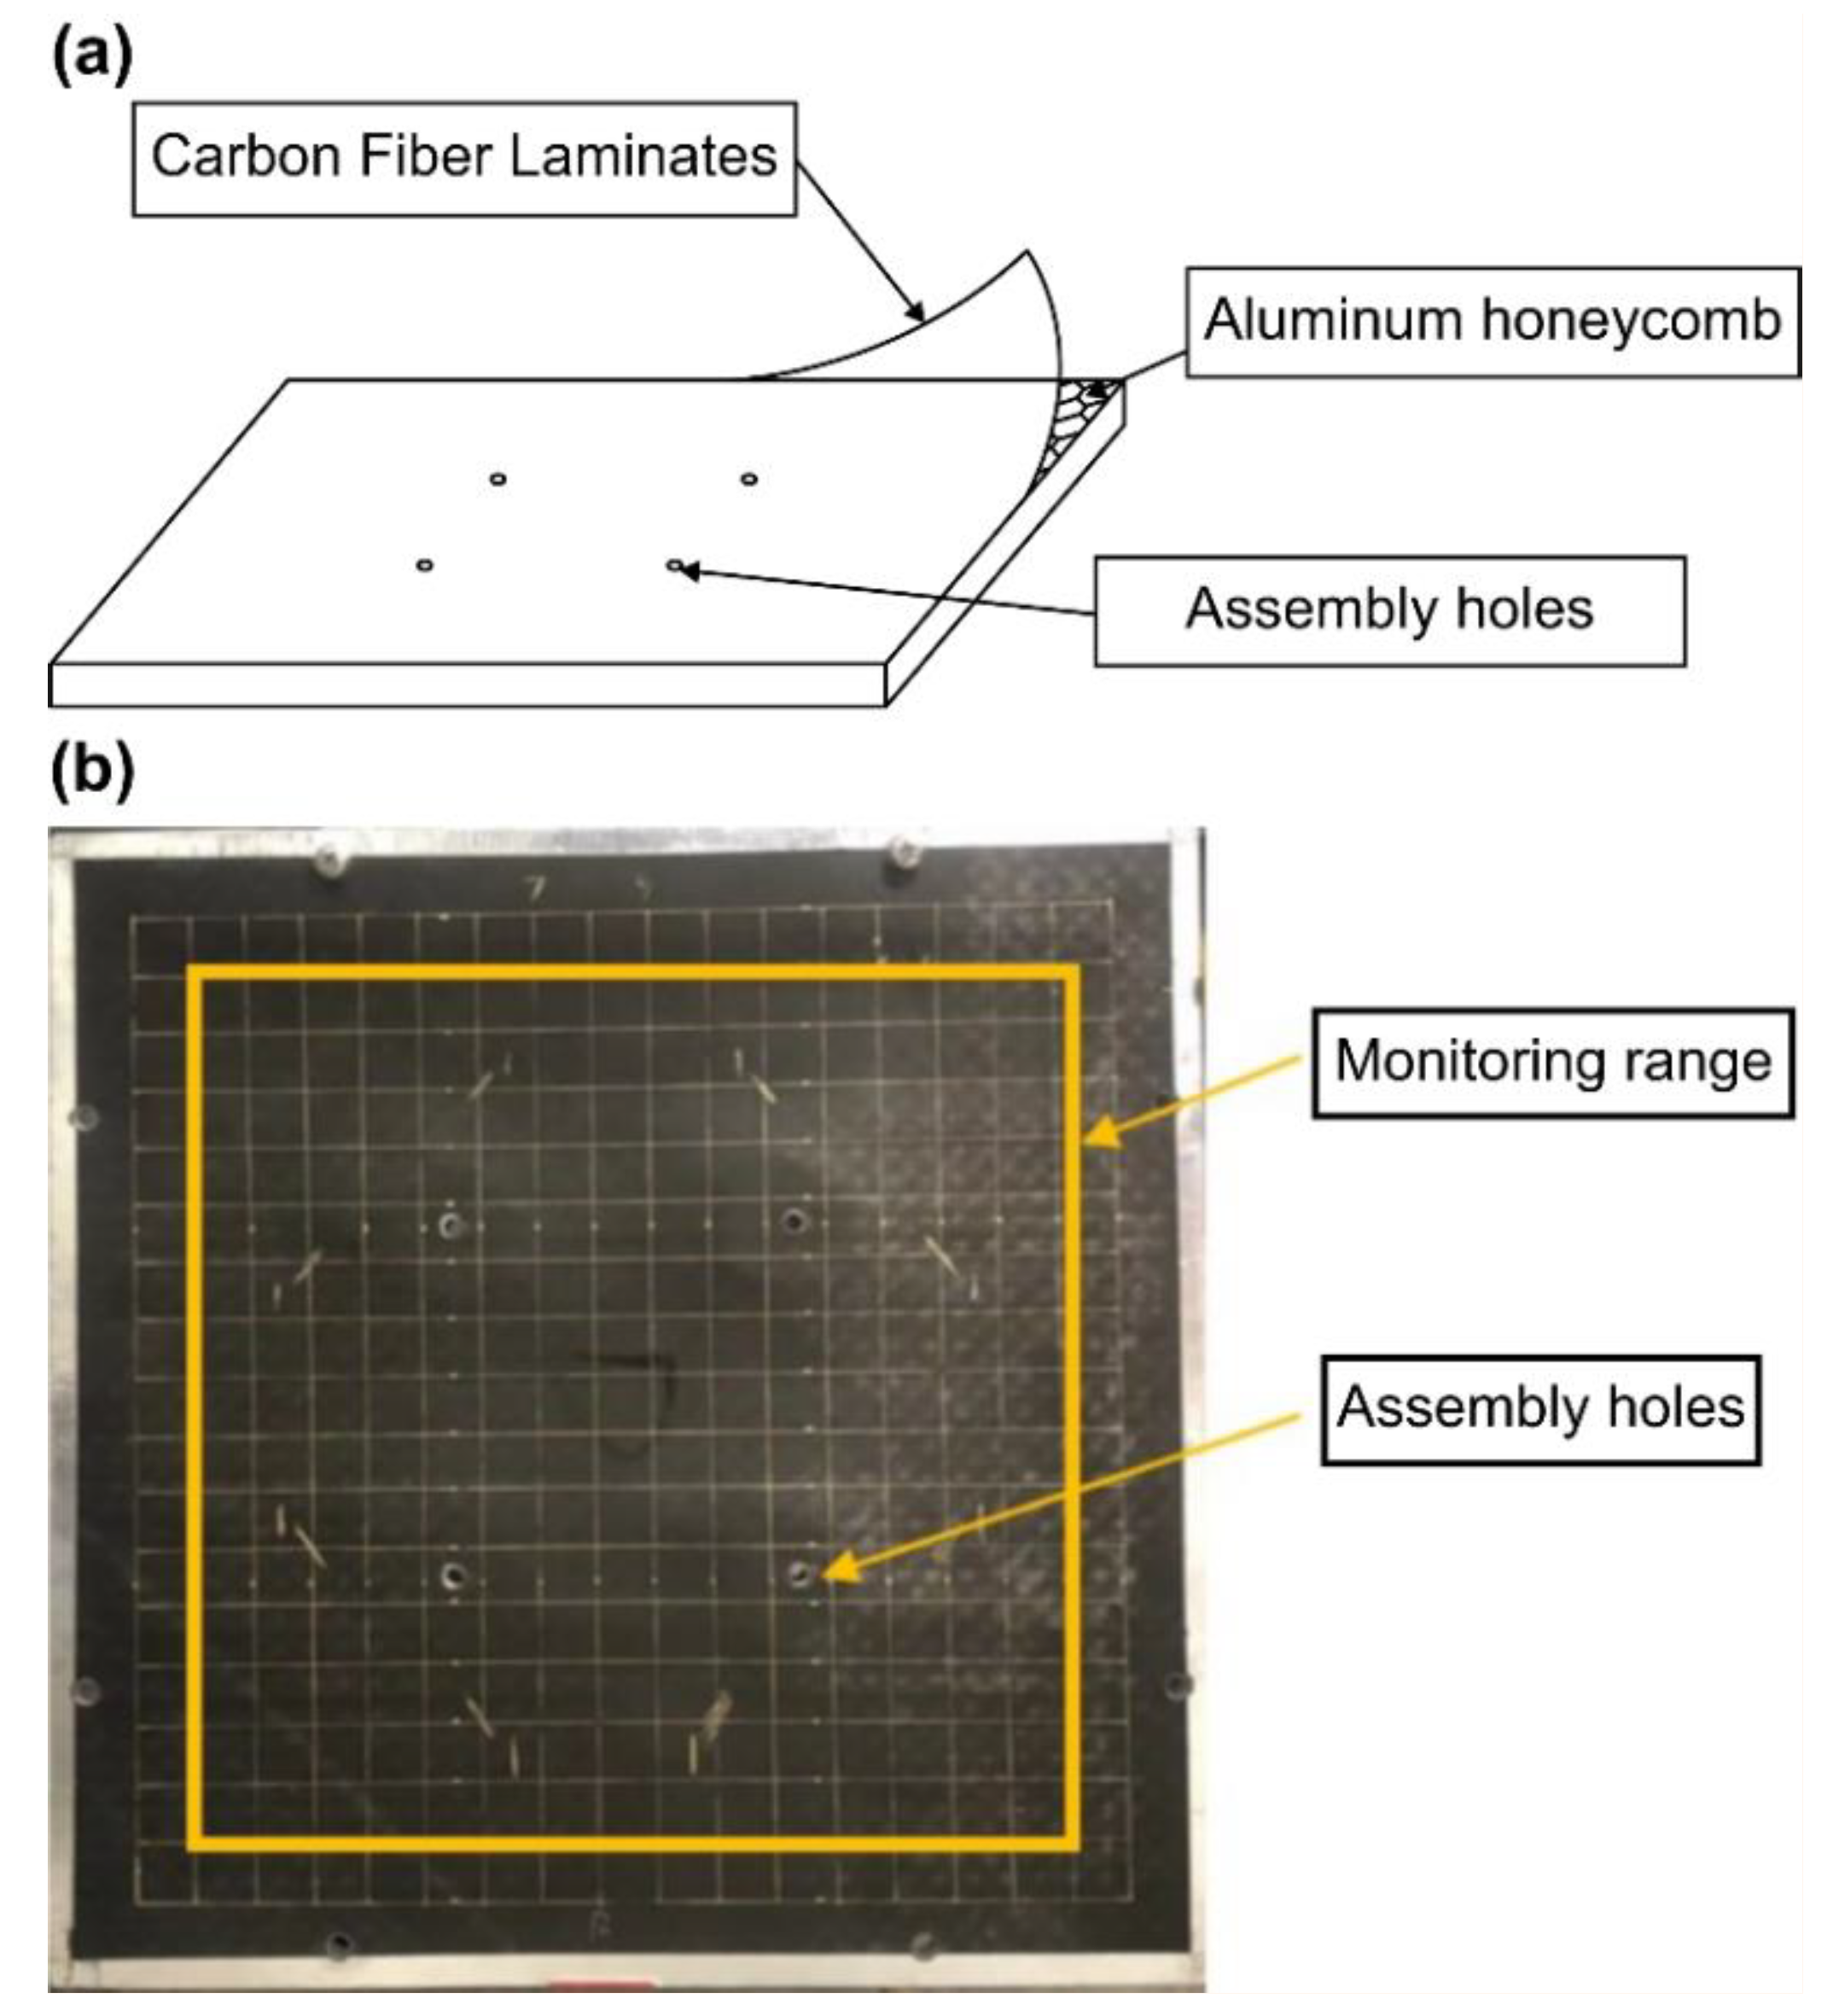
Figure 3.
Sensor layout.
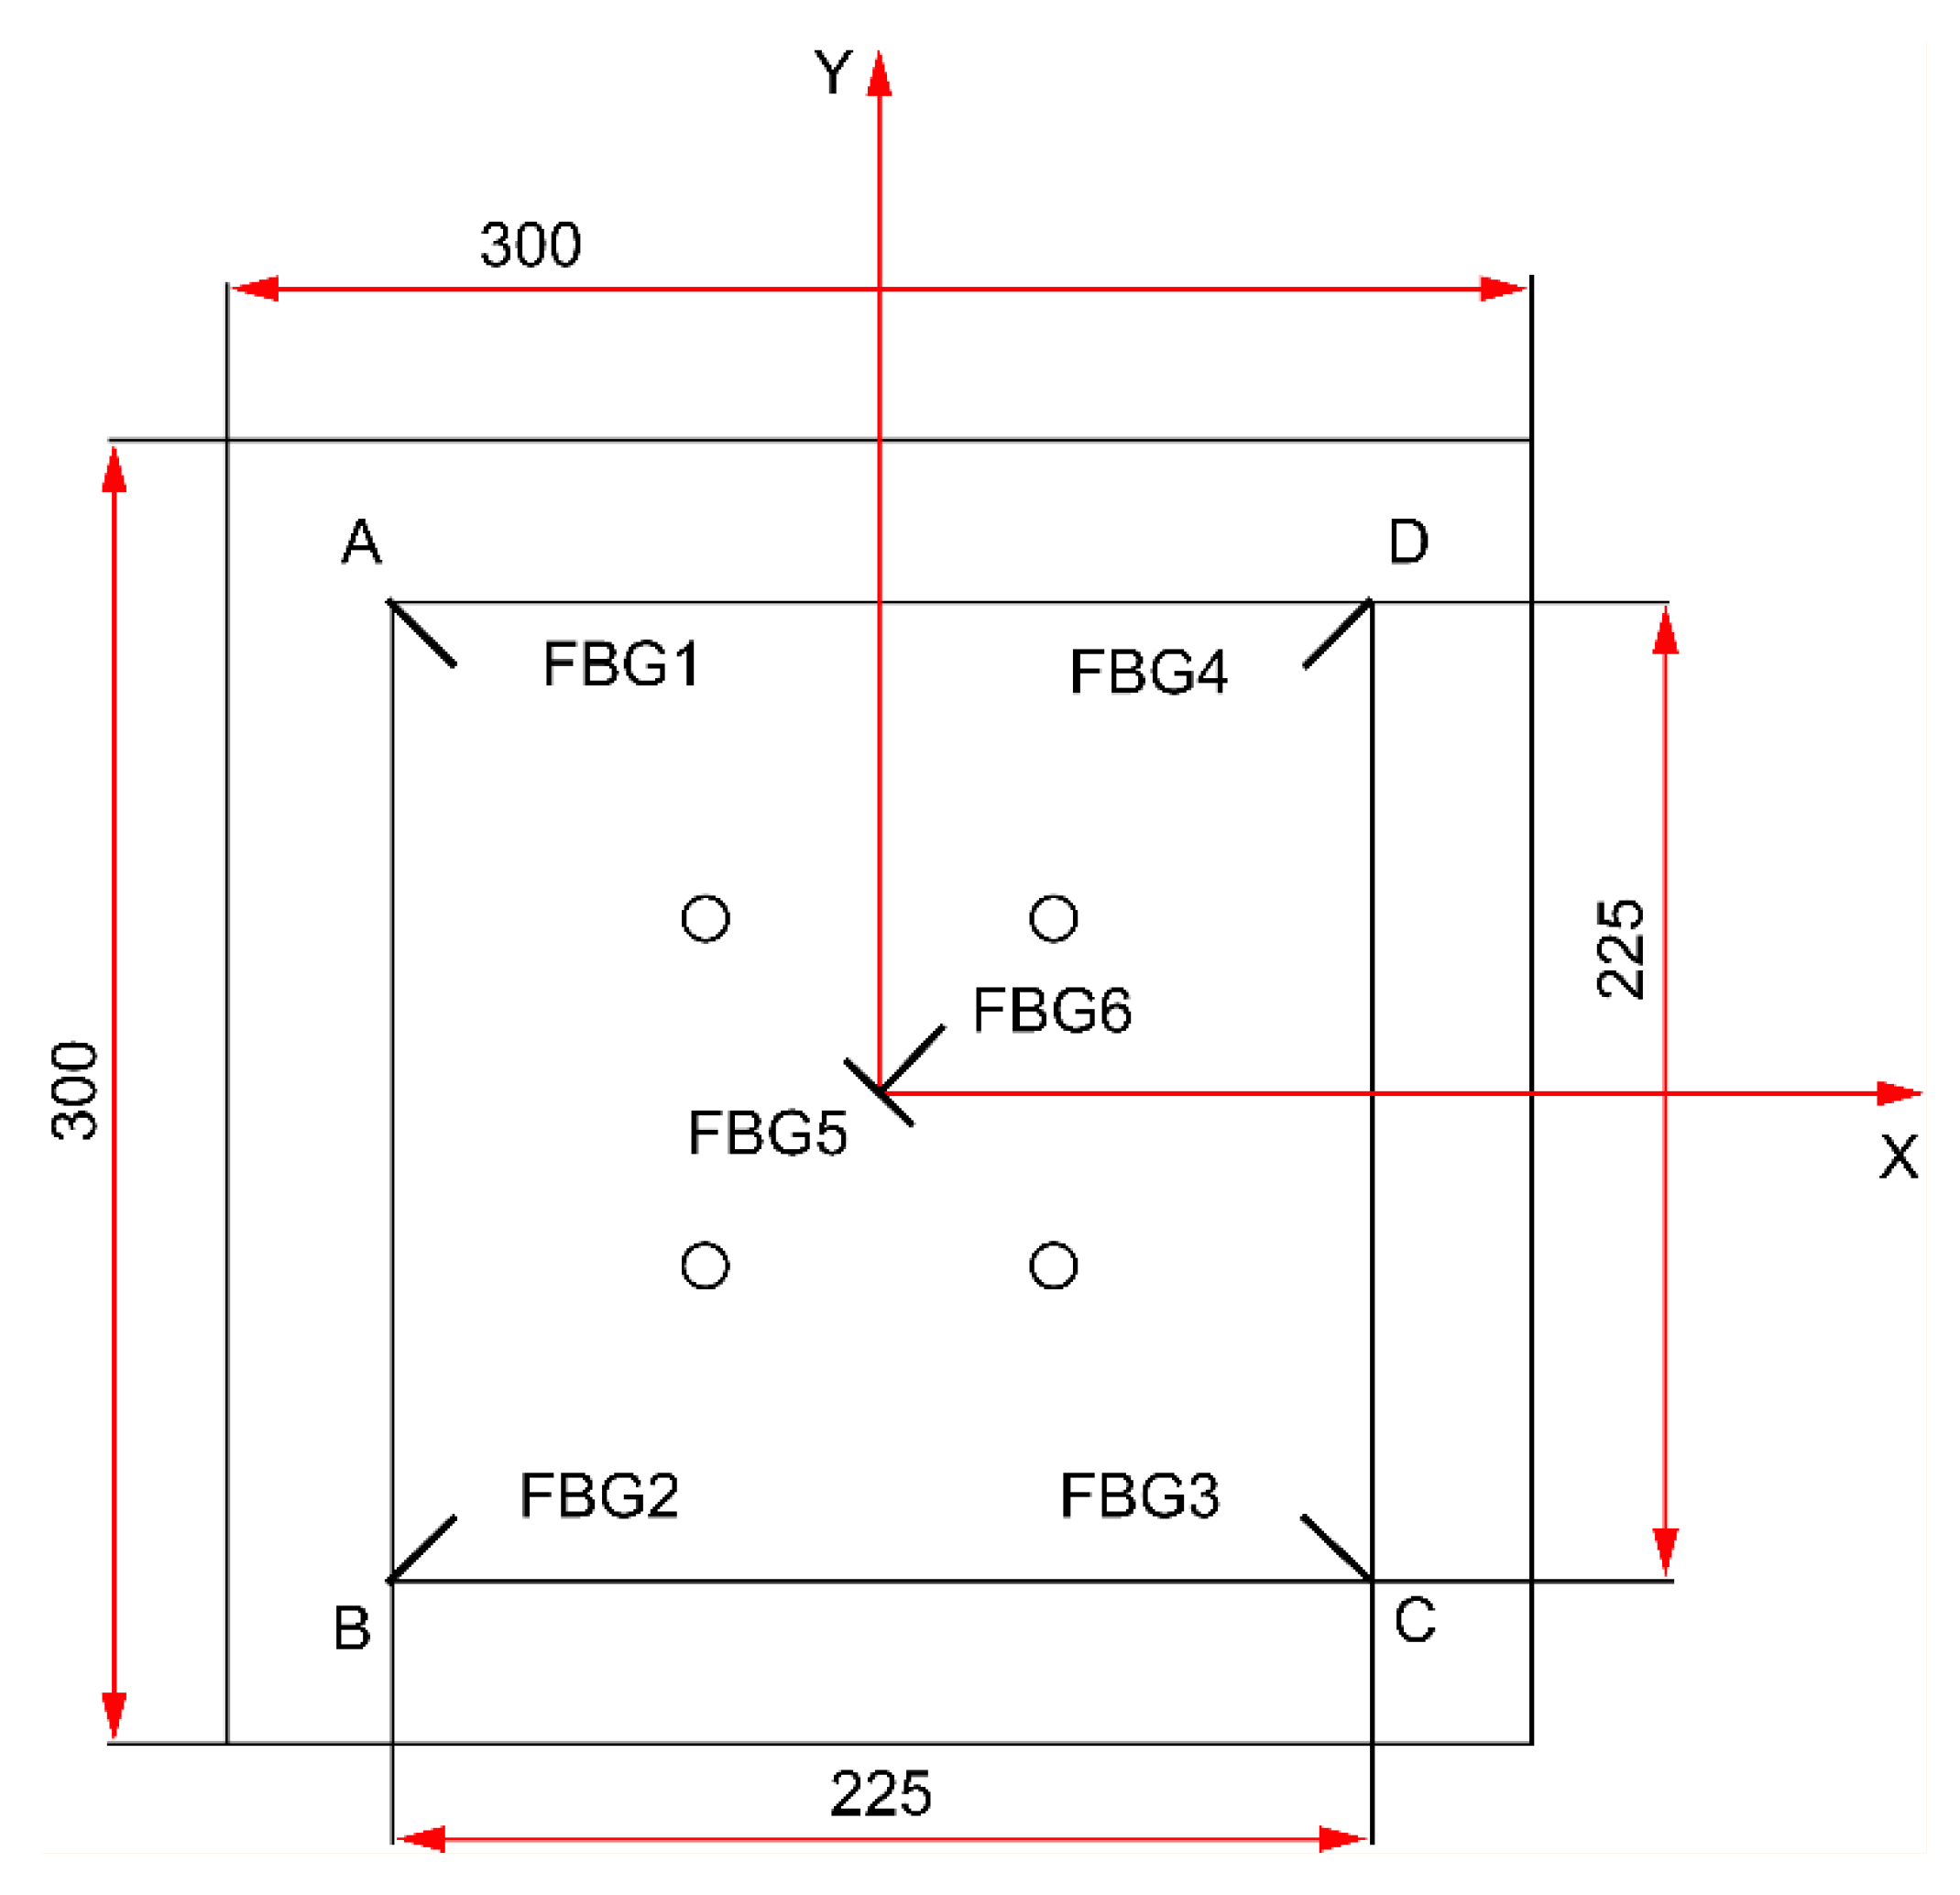
Figure 4.
Schematic of the impact loading device.
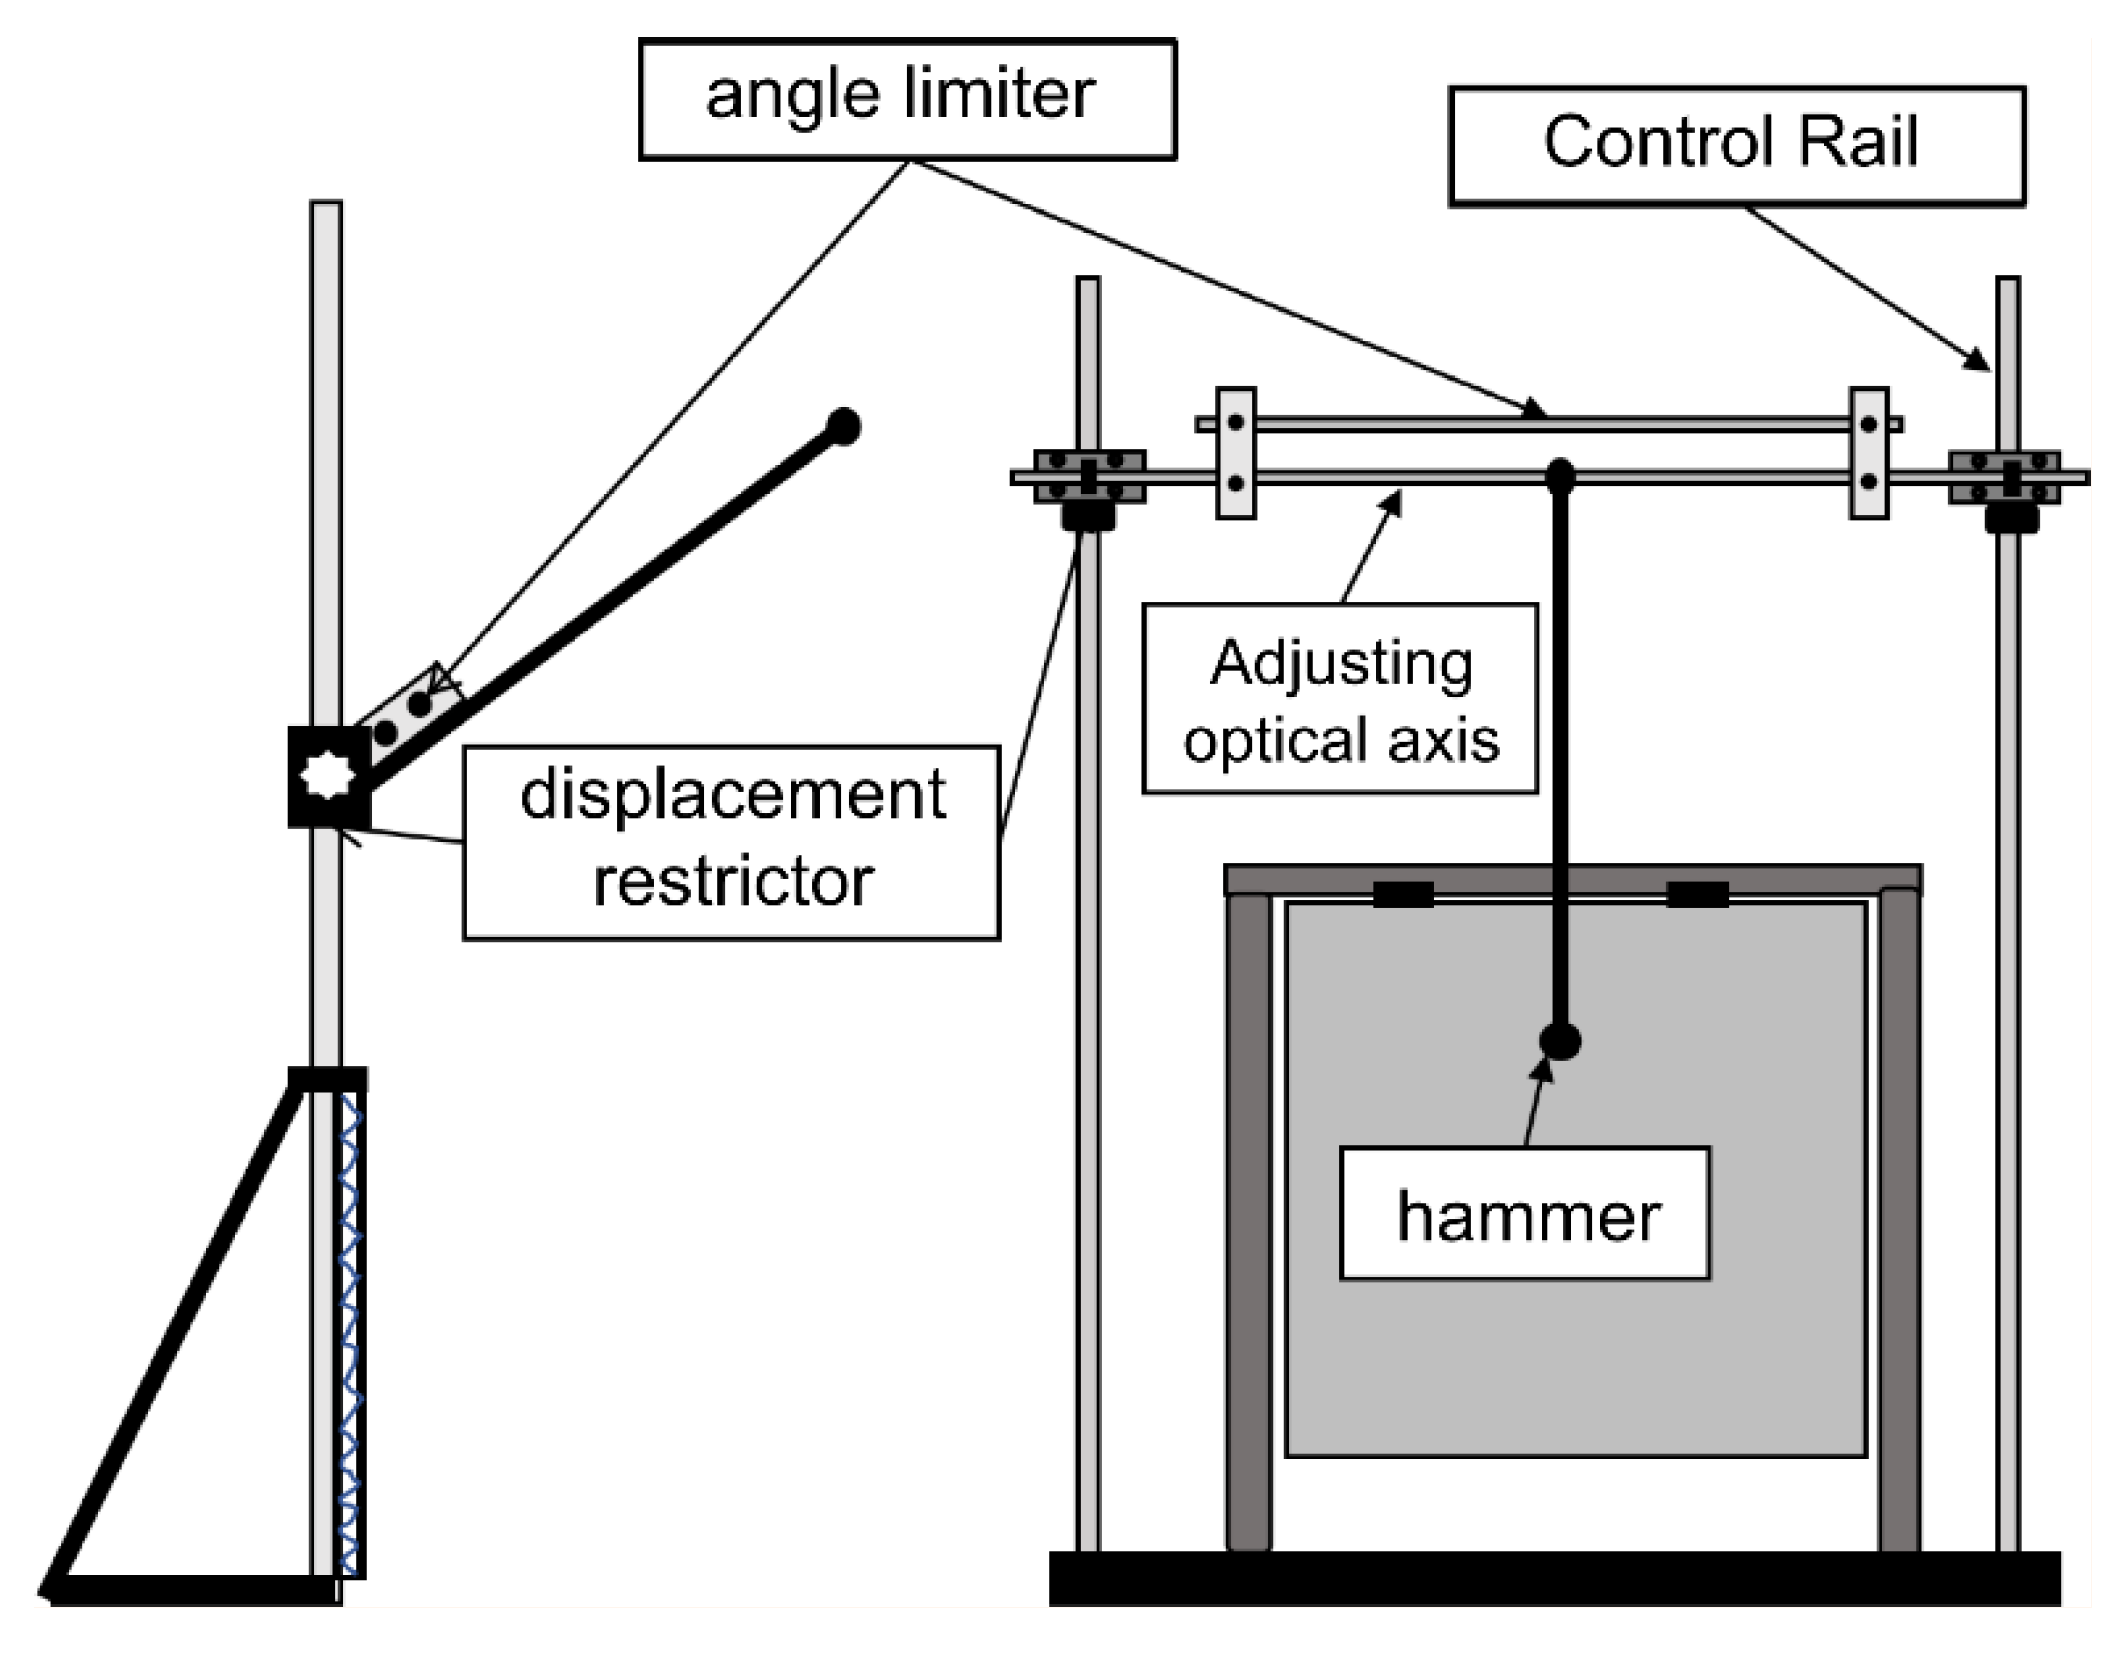
Figure 5.
Experimental setup for the impact loading device.
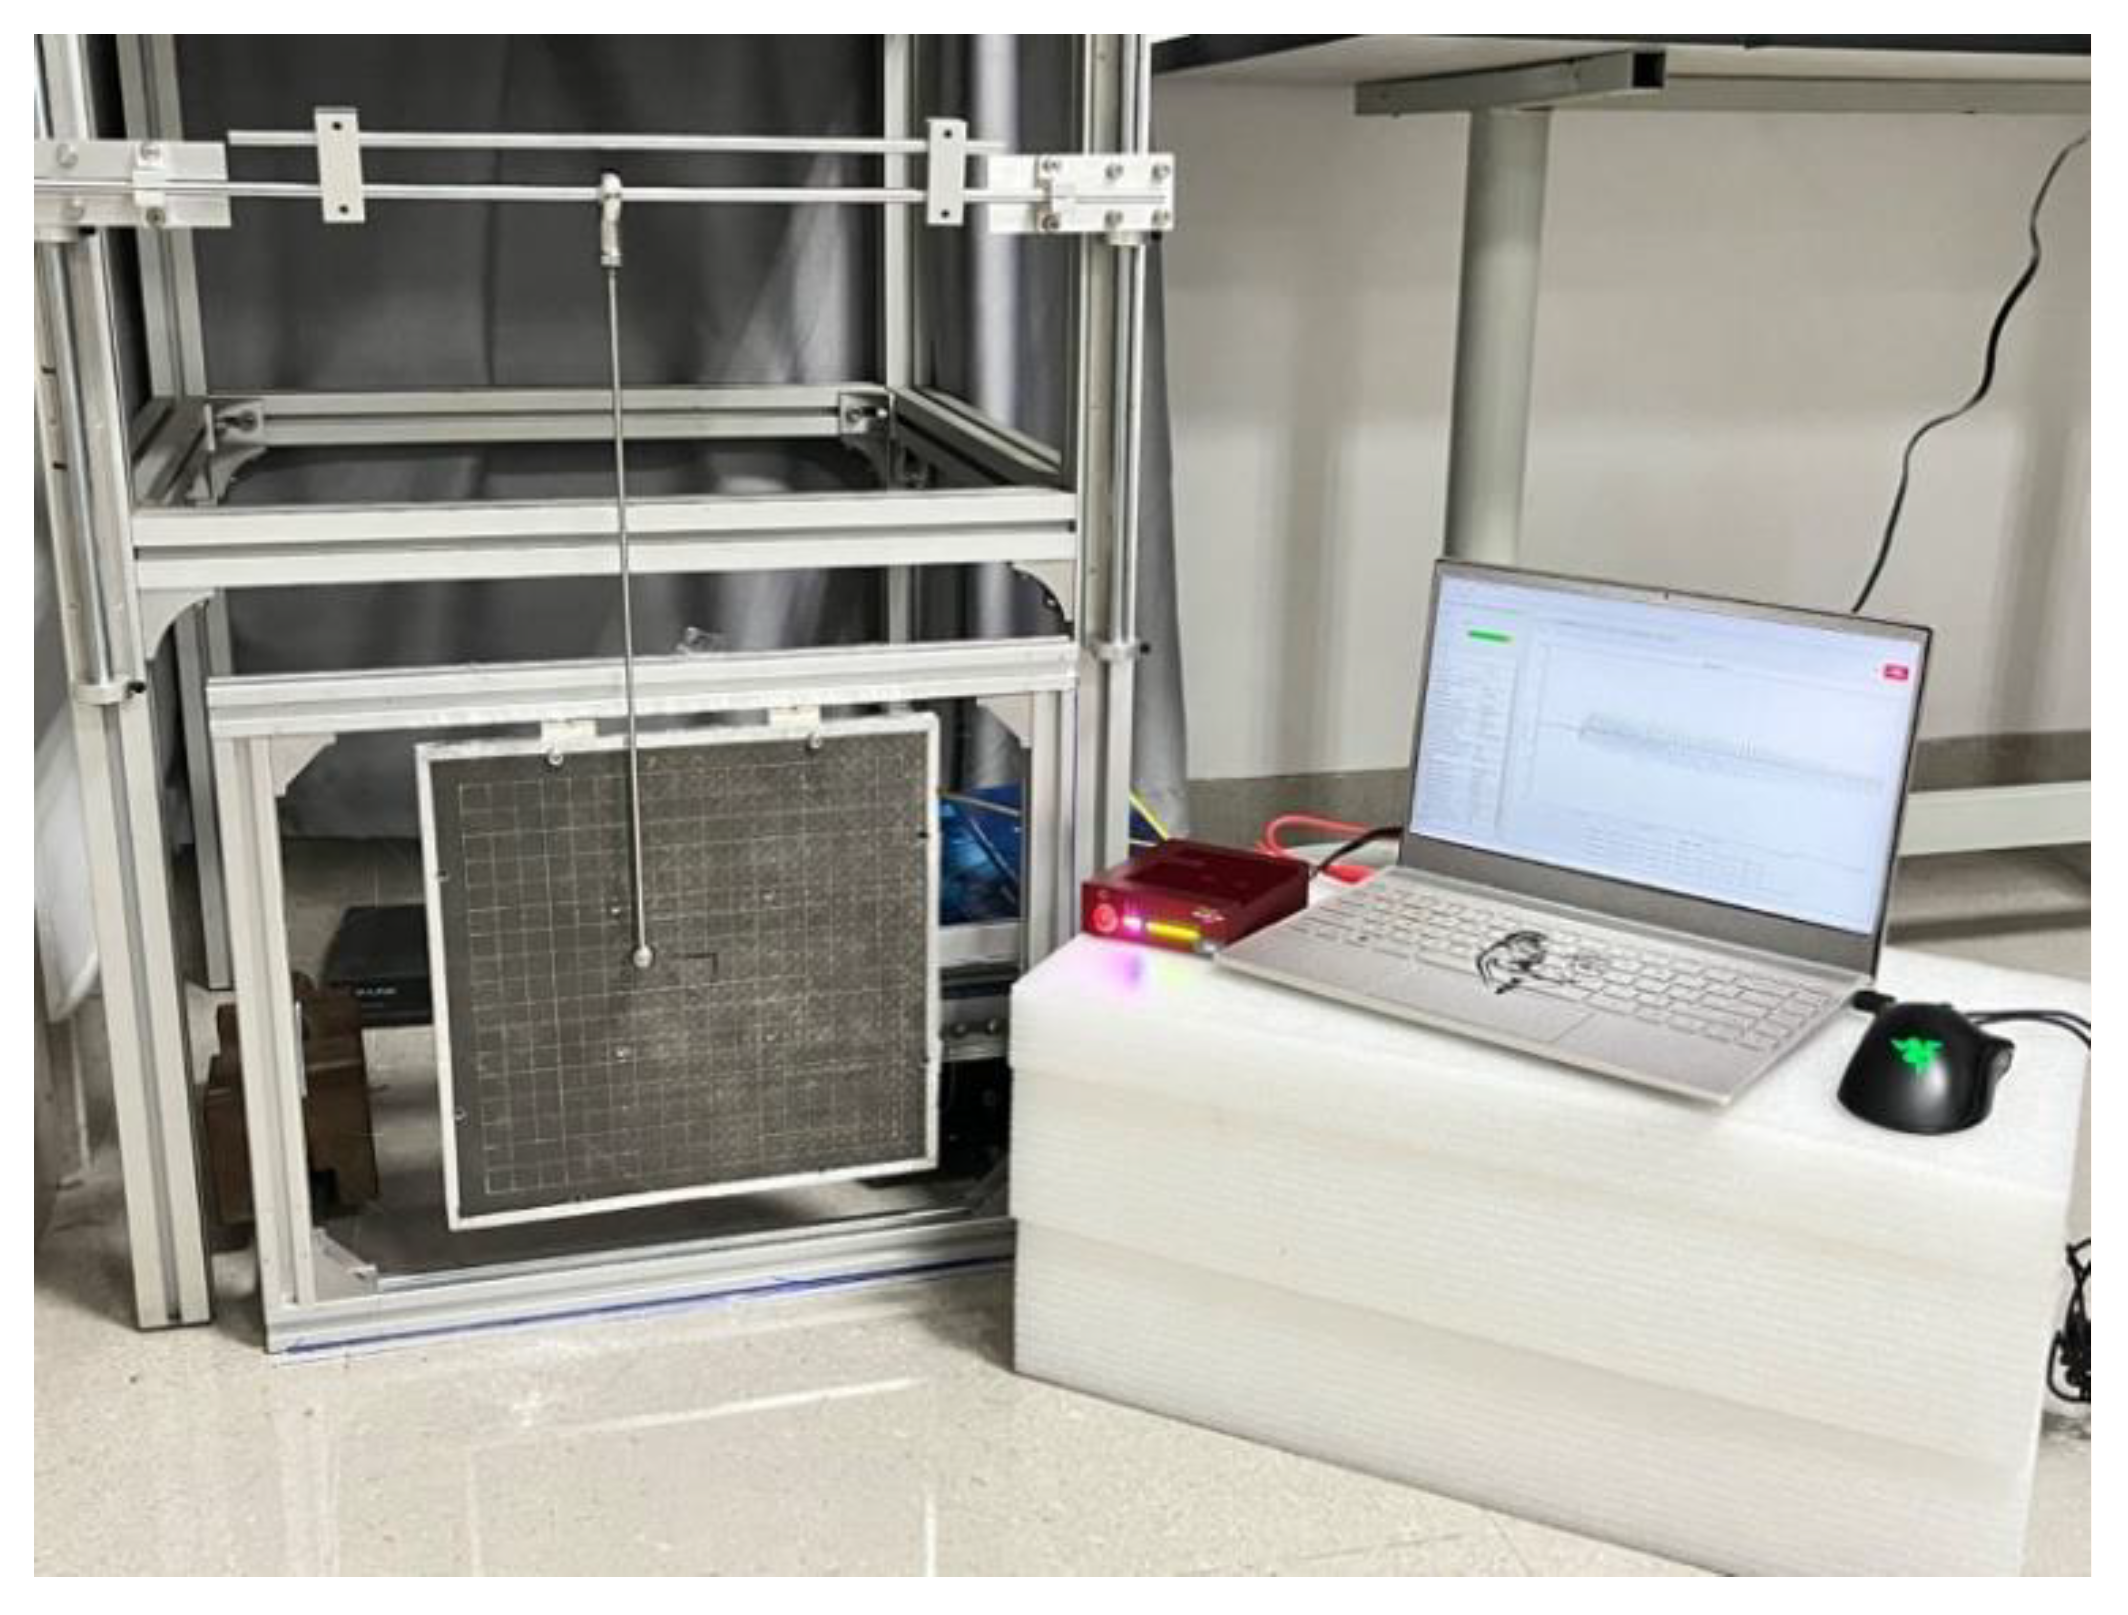
Figure 6.
Measured impact signals from a commercial high-speed FBG interrogator.
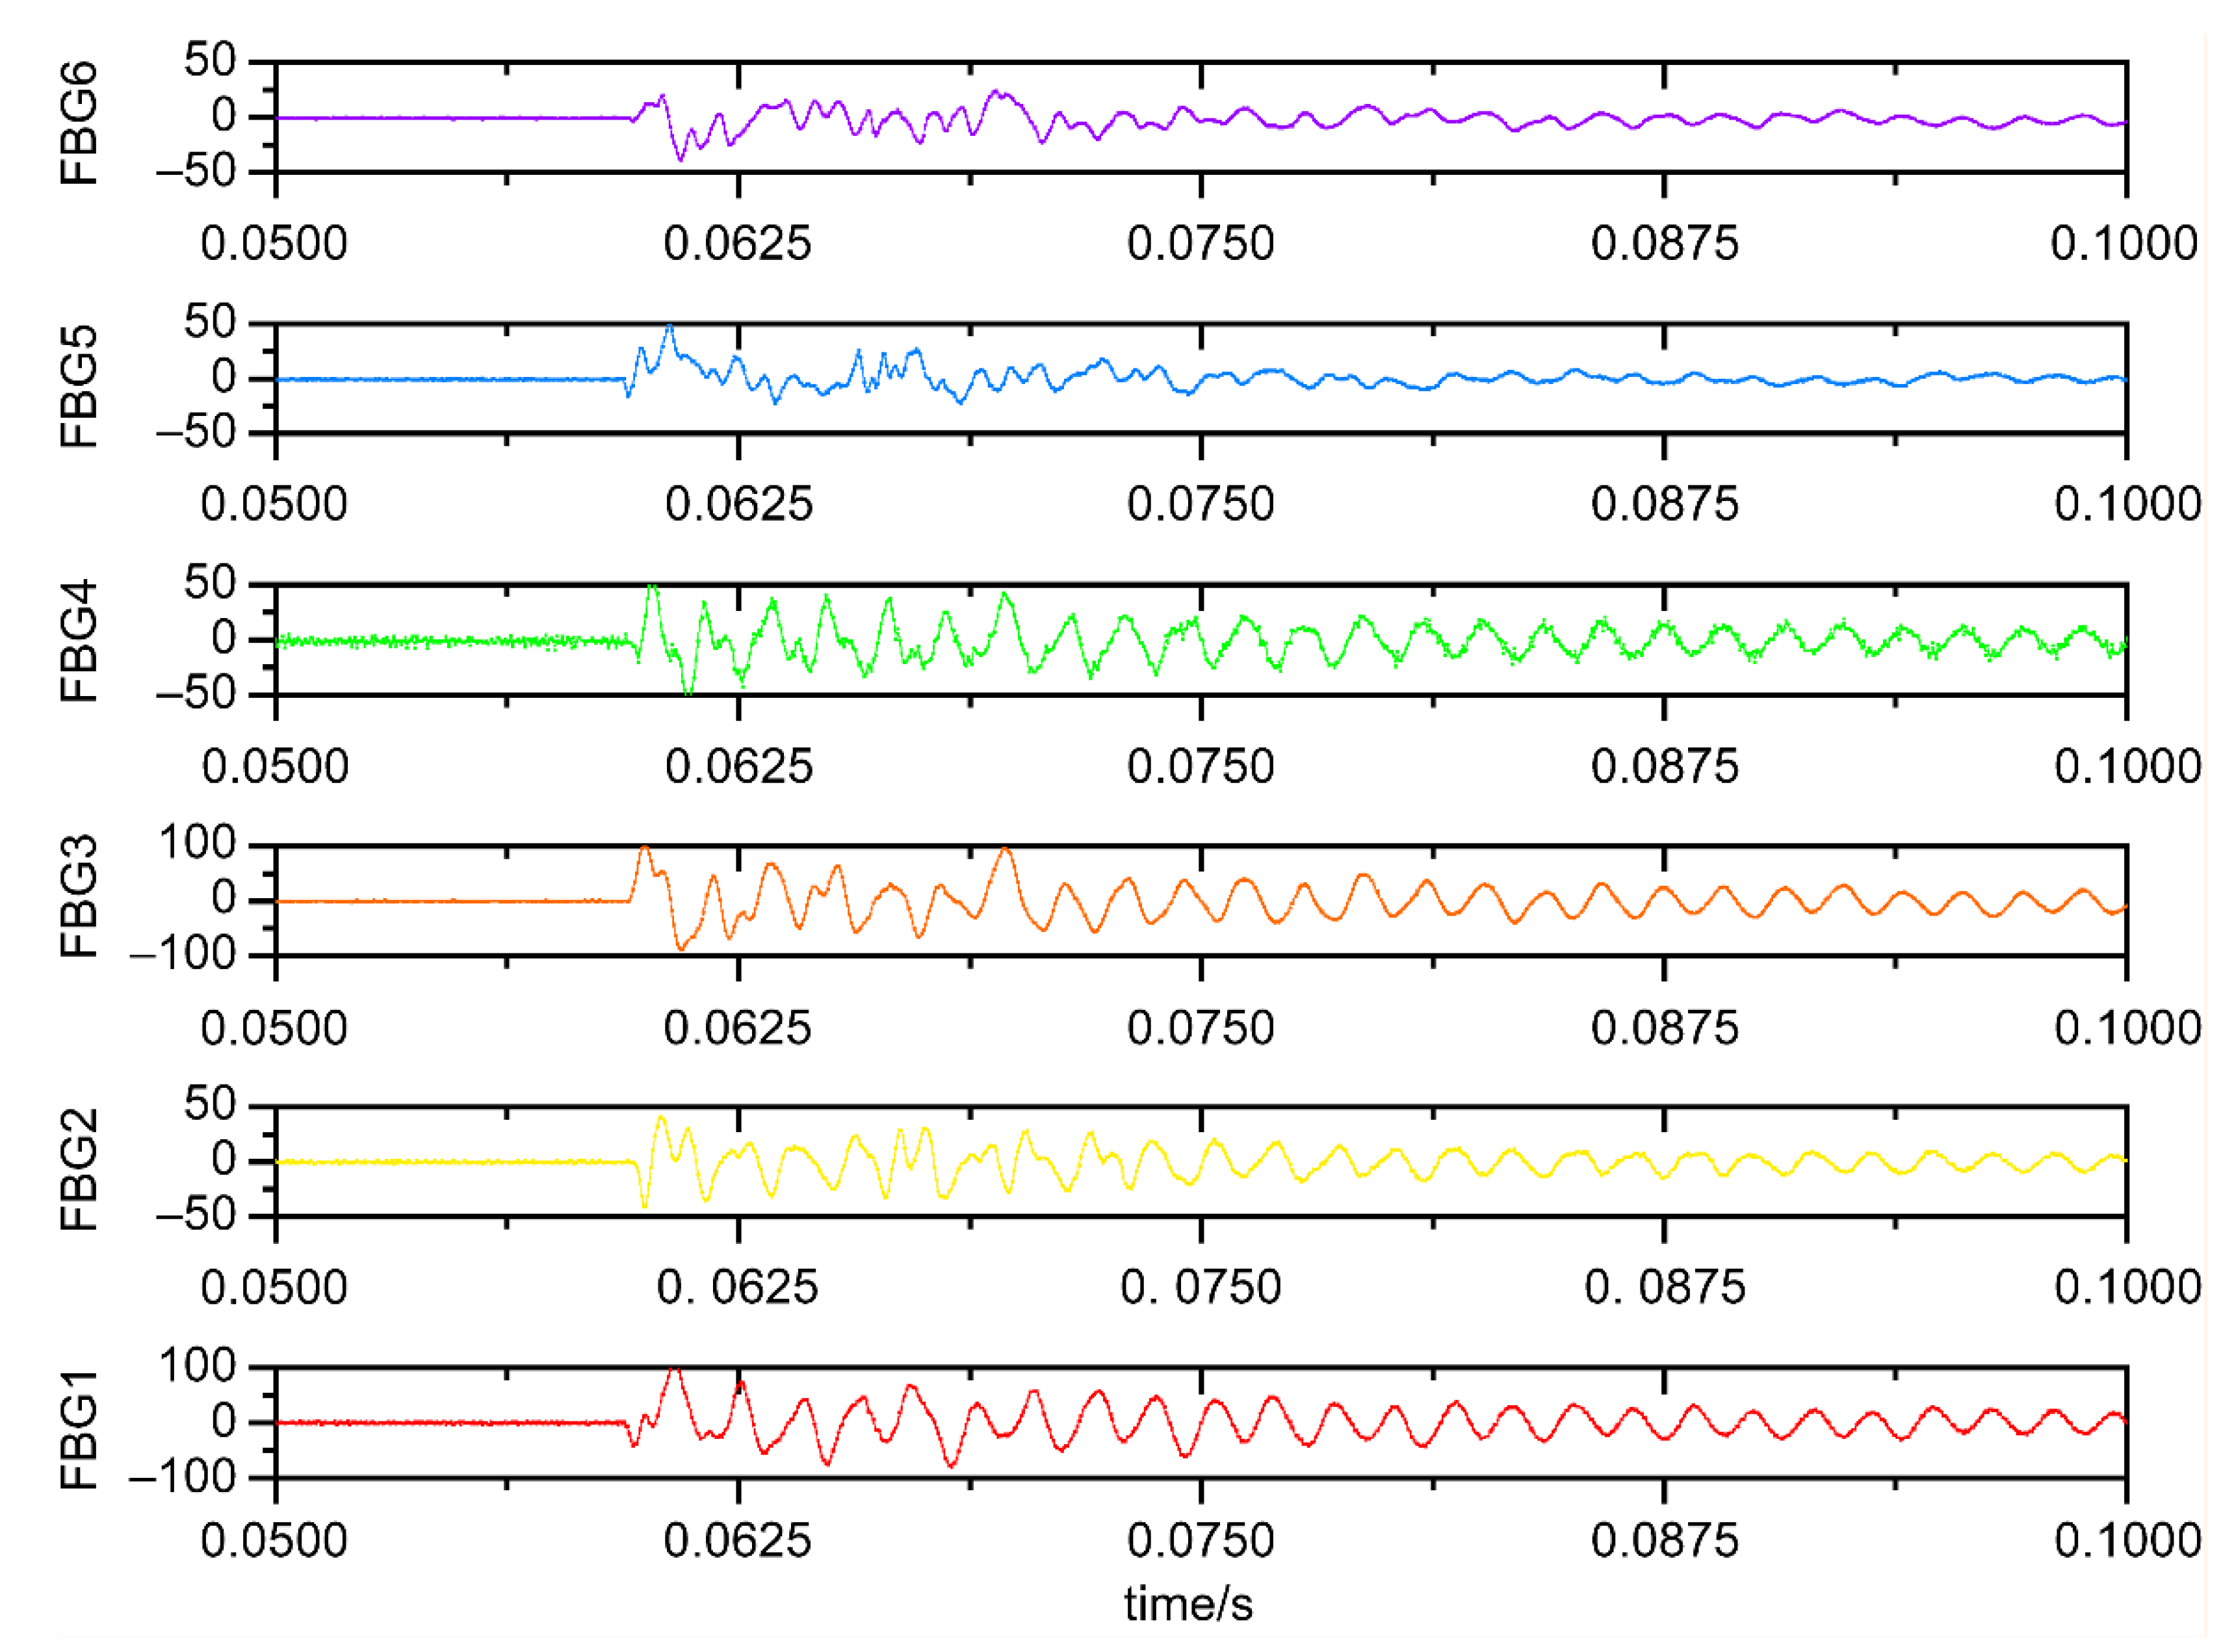
Figure 7.
Wavelet packet energy decomposition feature.
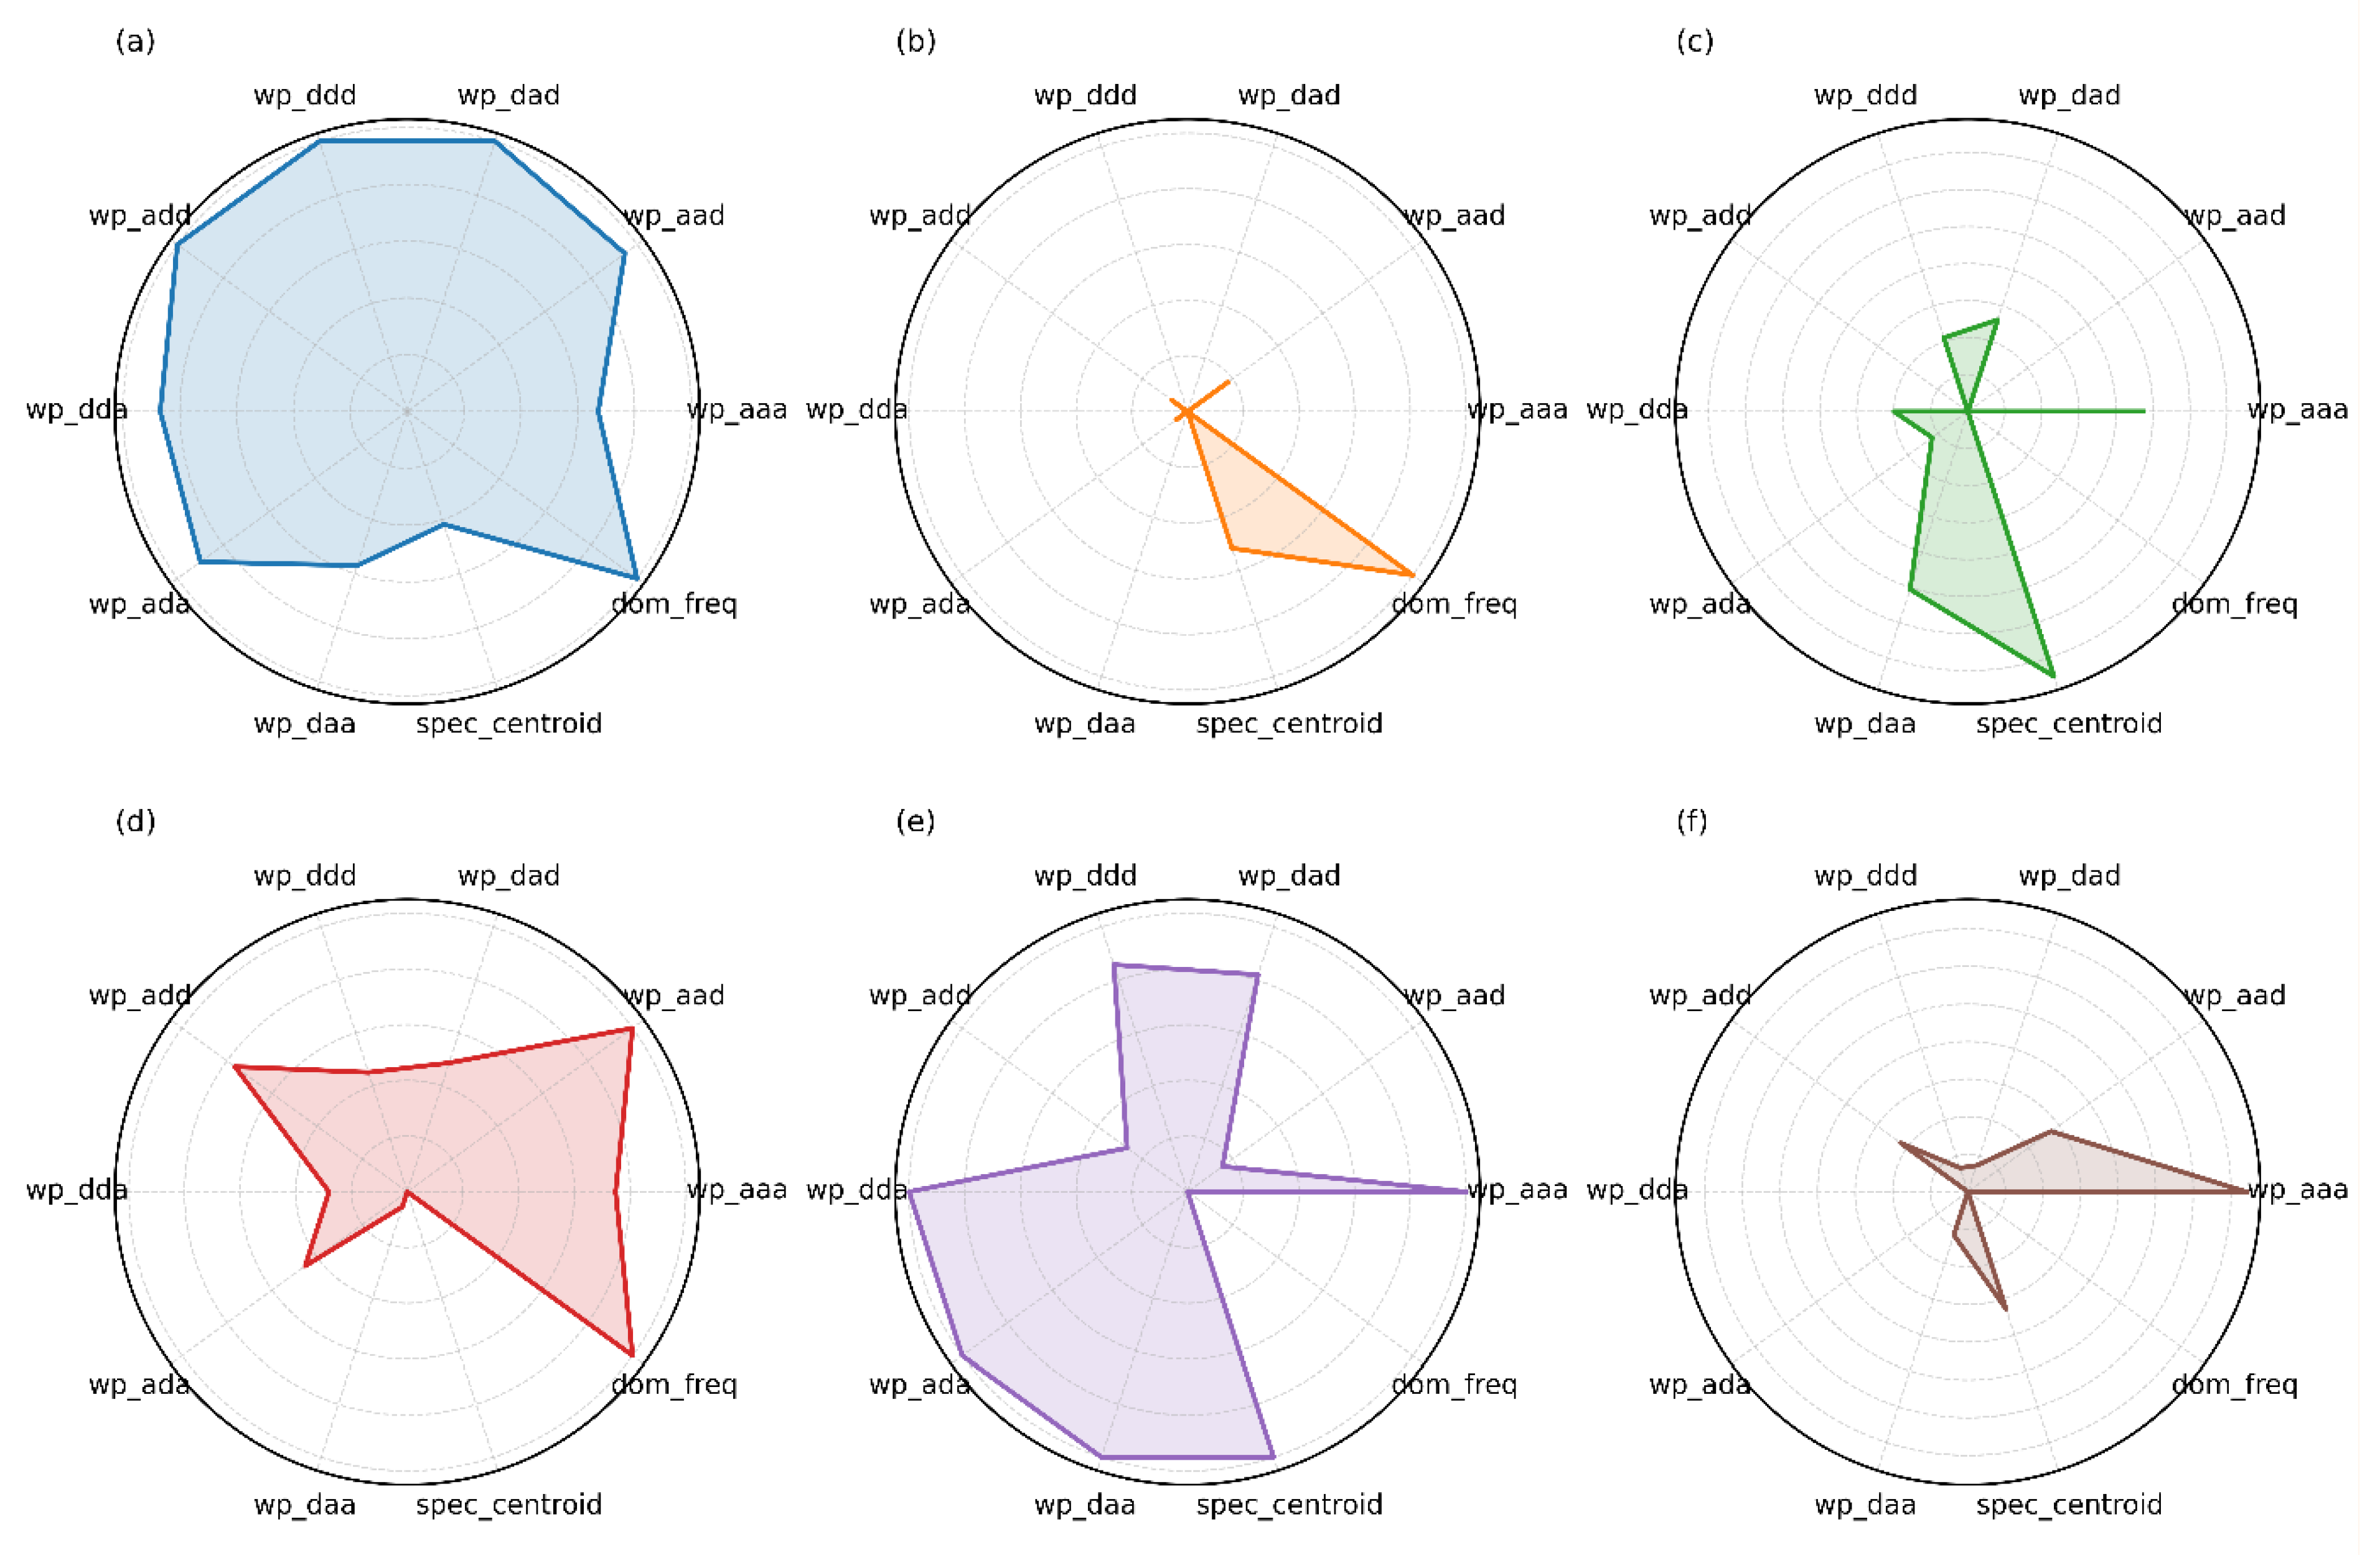
Figure 8.
Schematic of composite honeycomb panel low-energy impact signal feature processing.
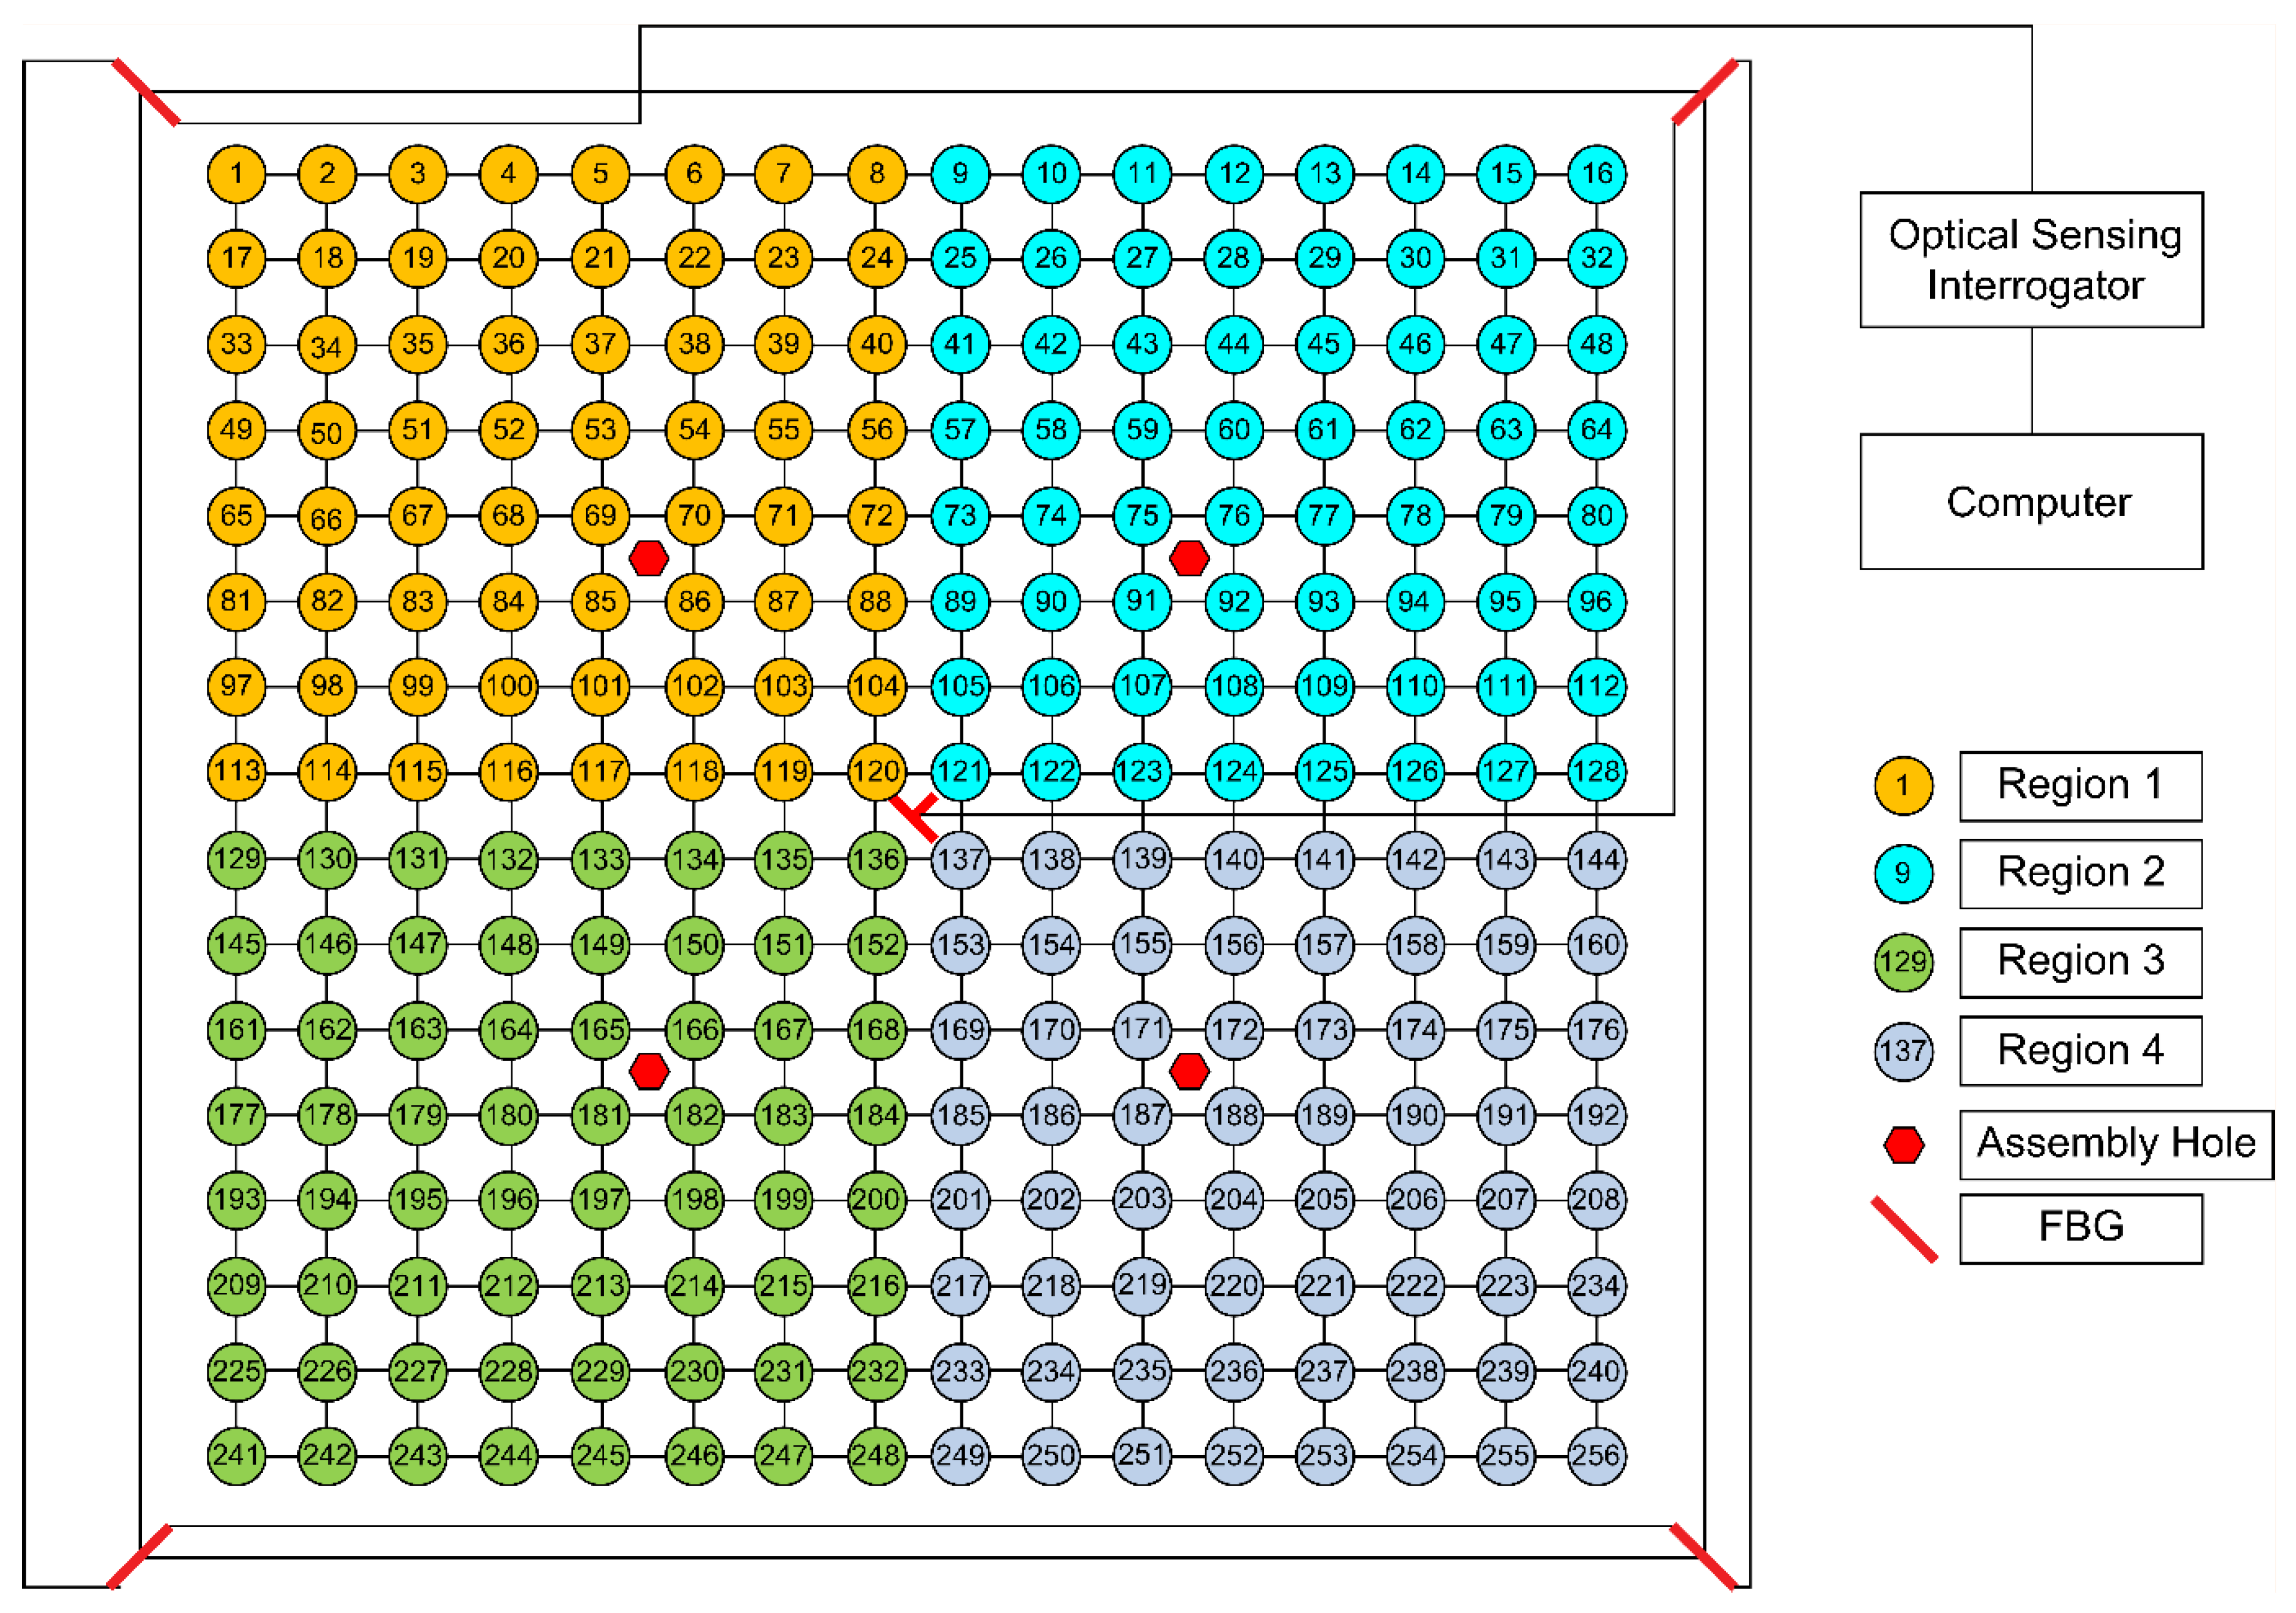
Figure 9.
LightGBM model structure and experimental flowchart.
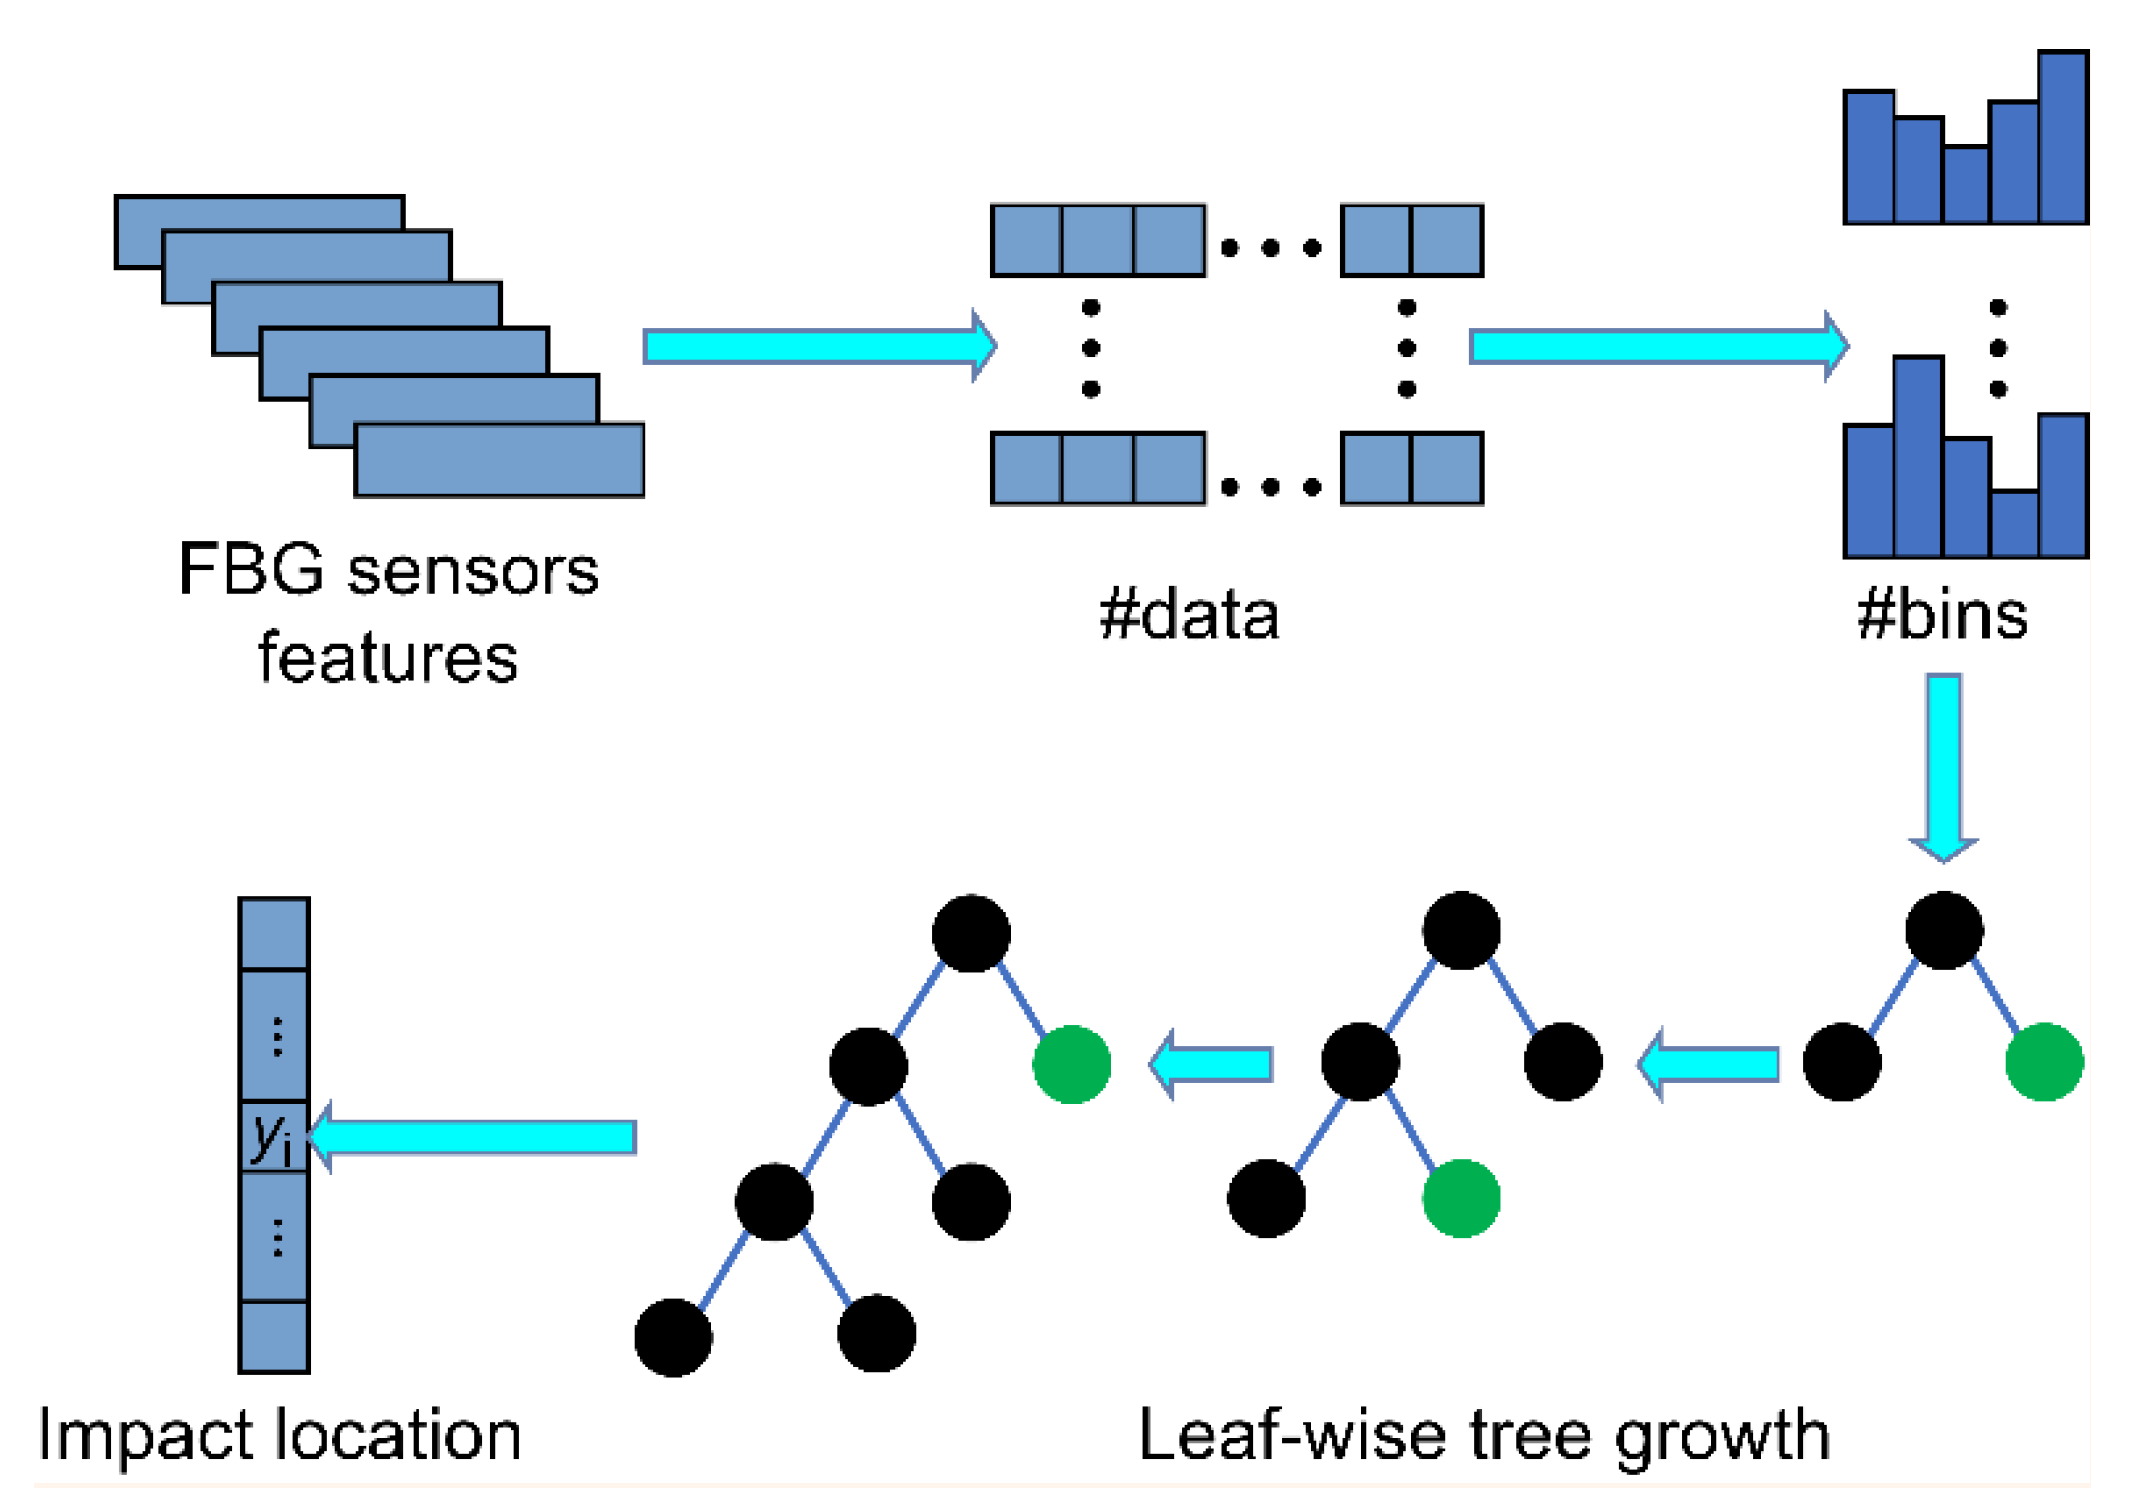
Figure 10.
Comparison of the accuracy of machine-learning model sensor layout optimization.
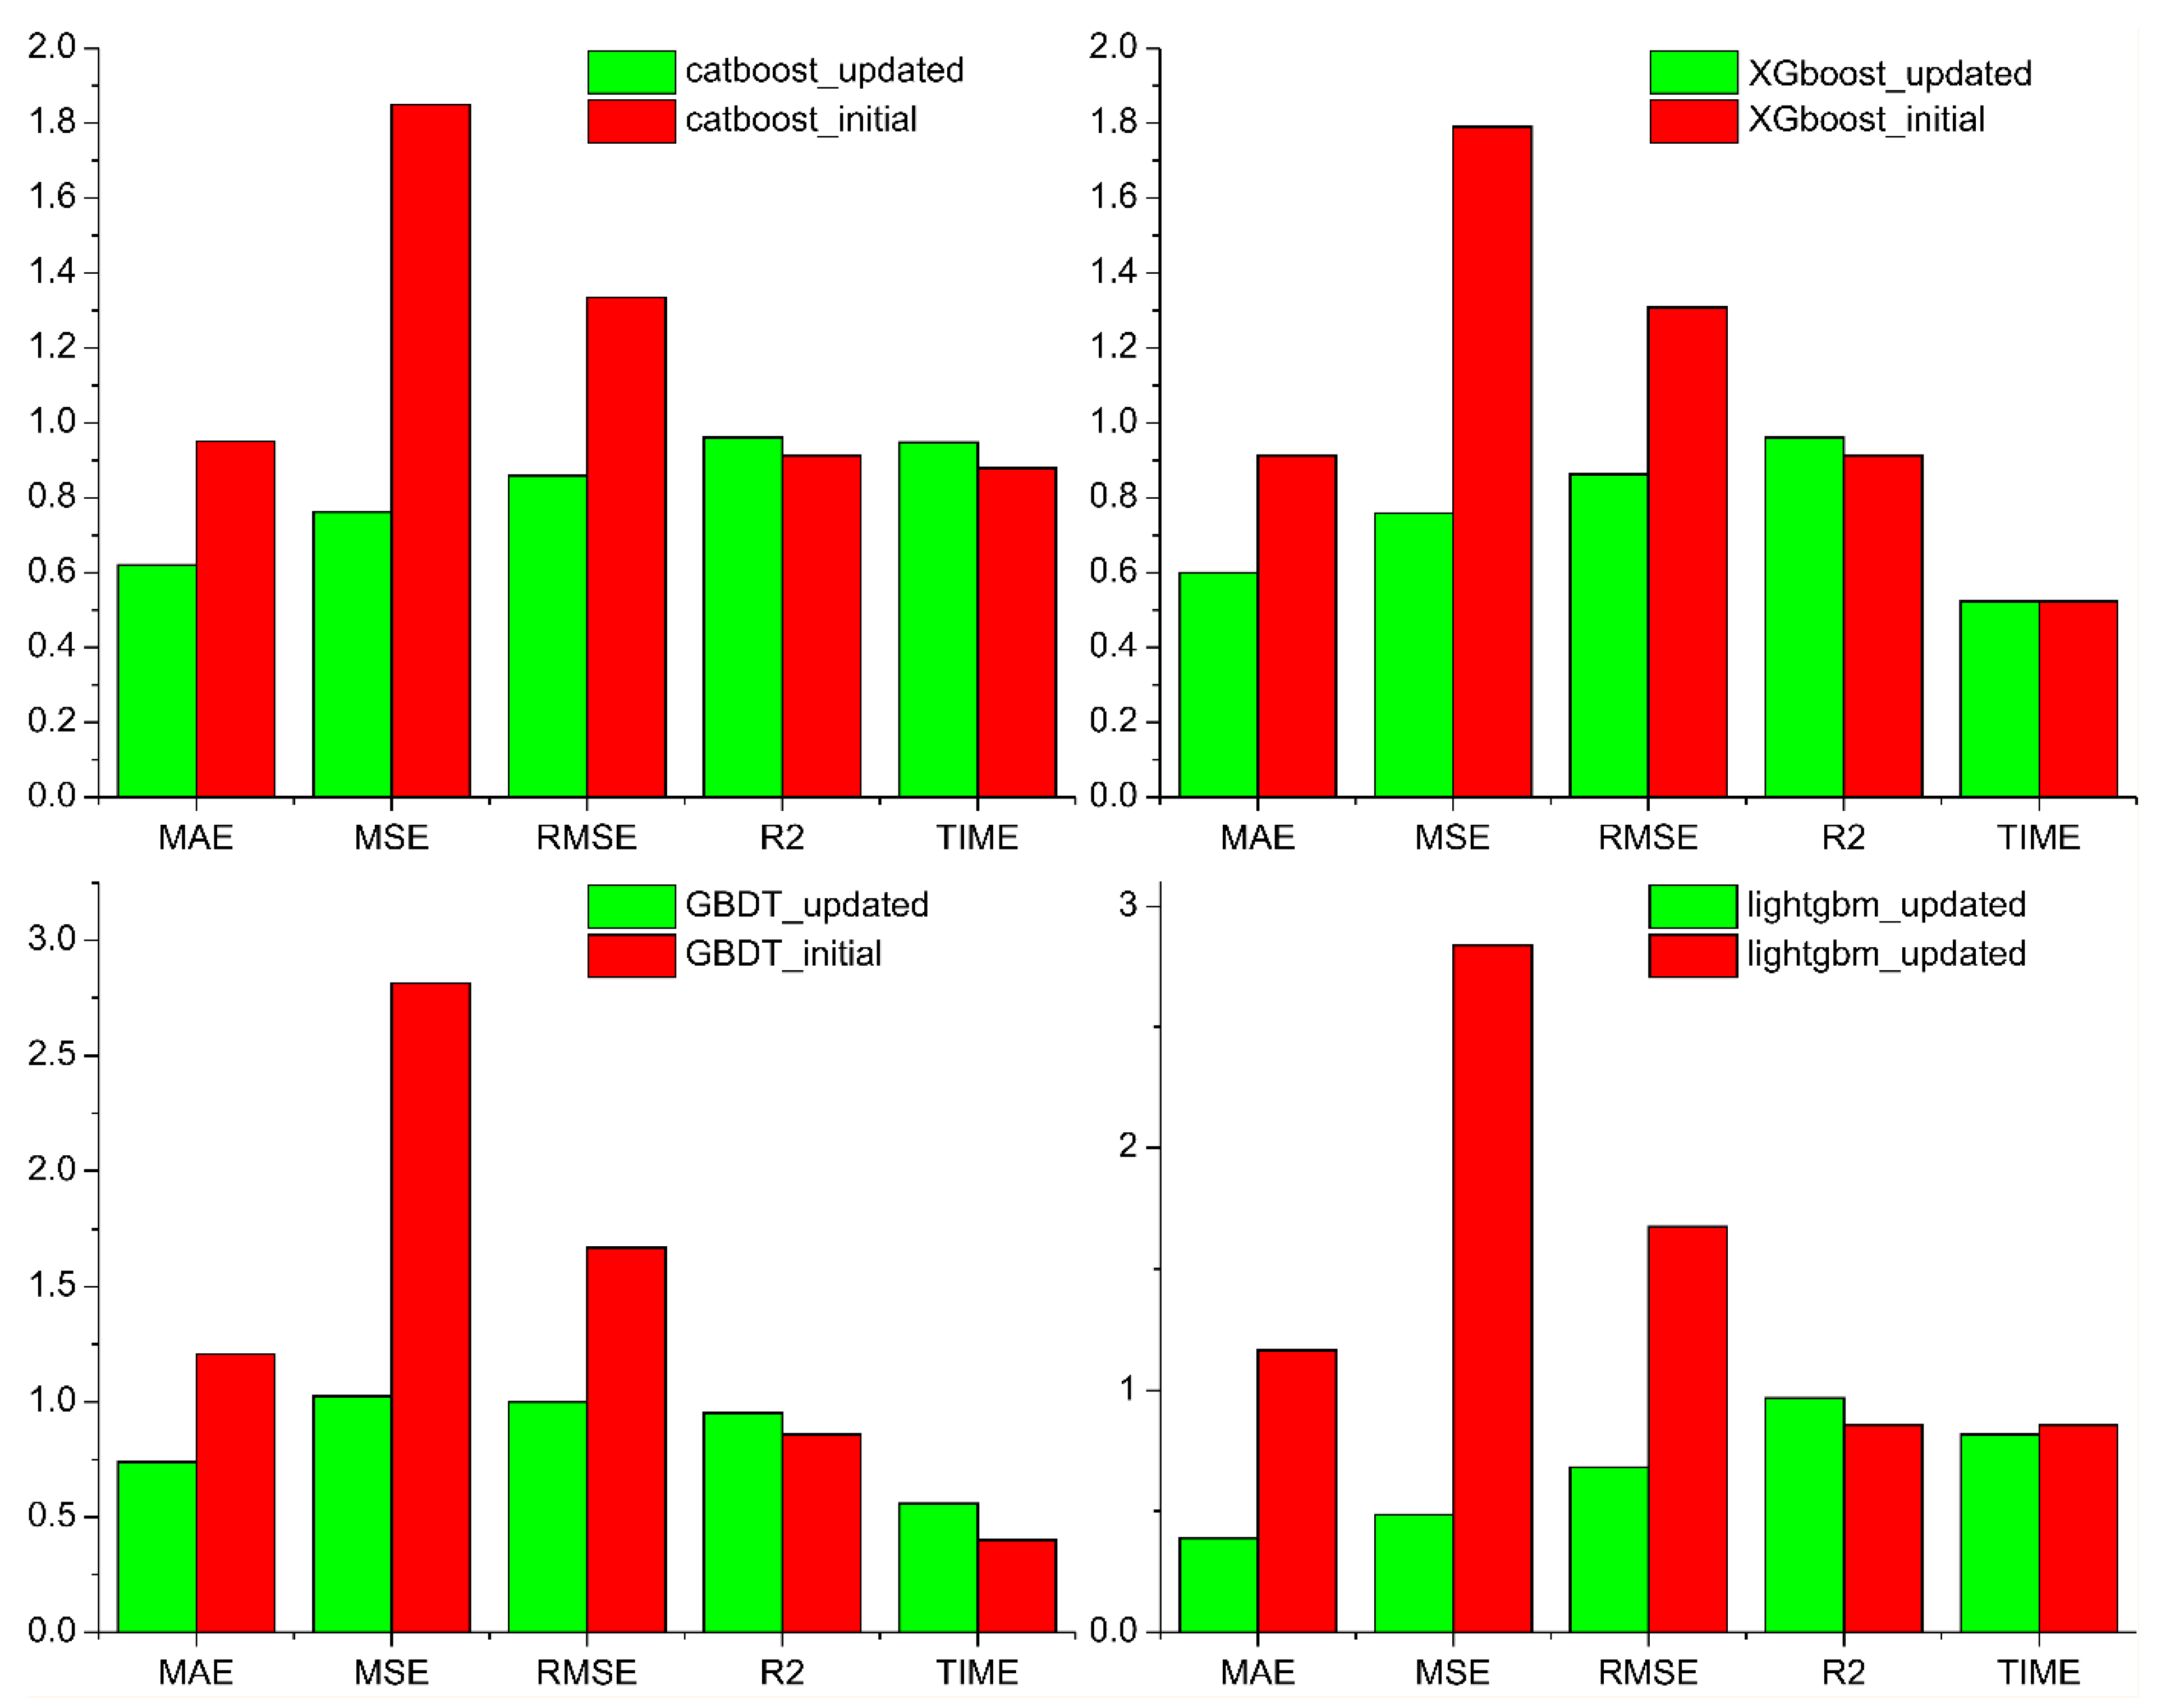
Figure 11.
Comparison of the predicted and actual locations.
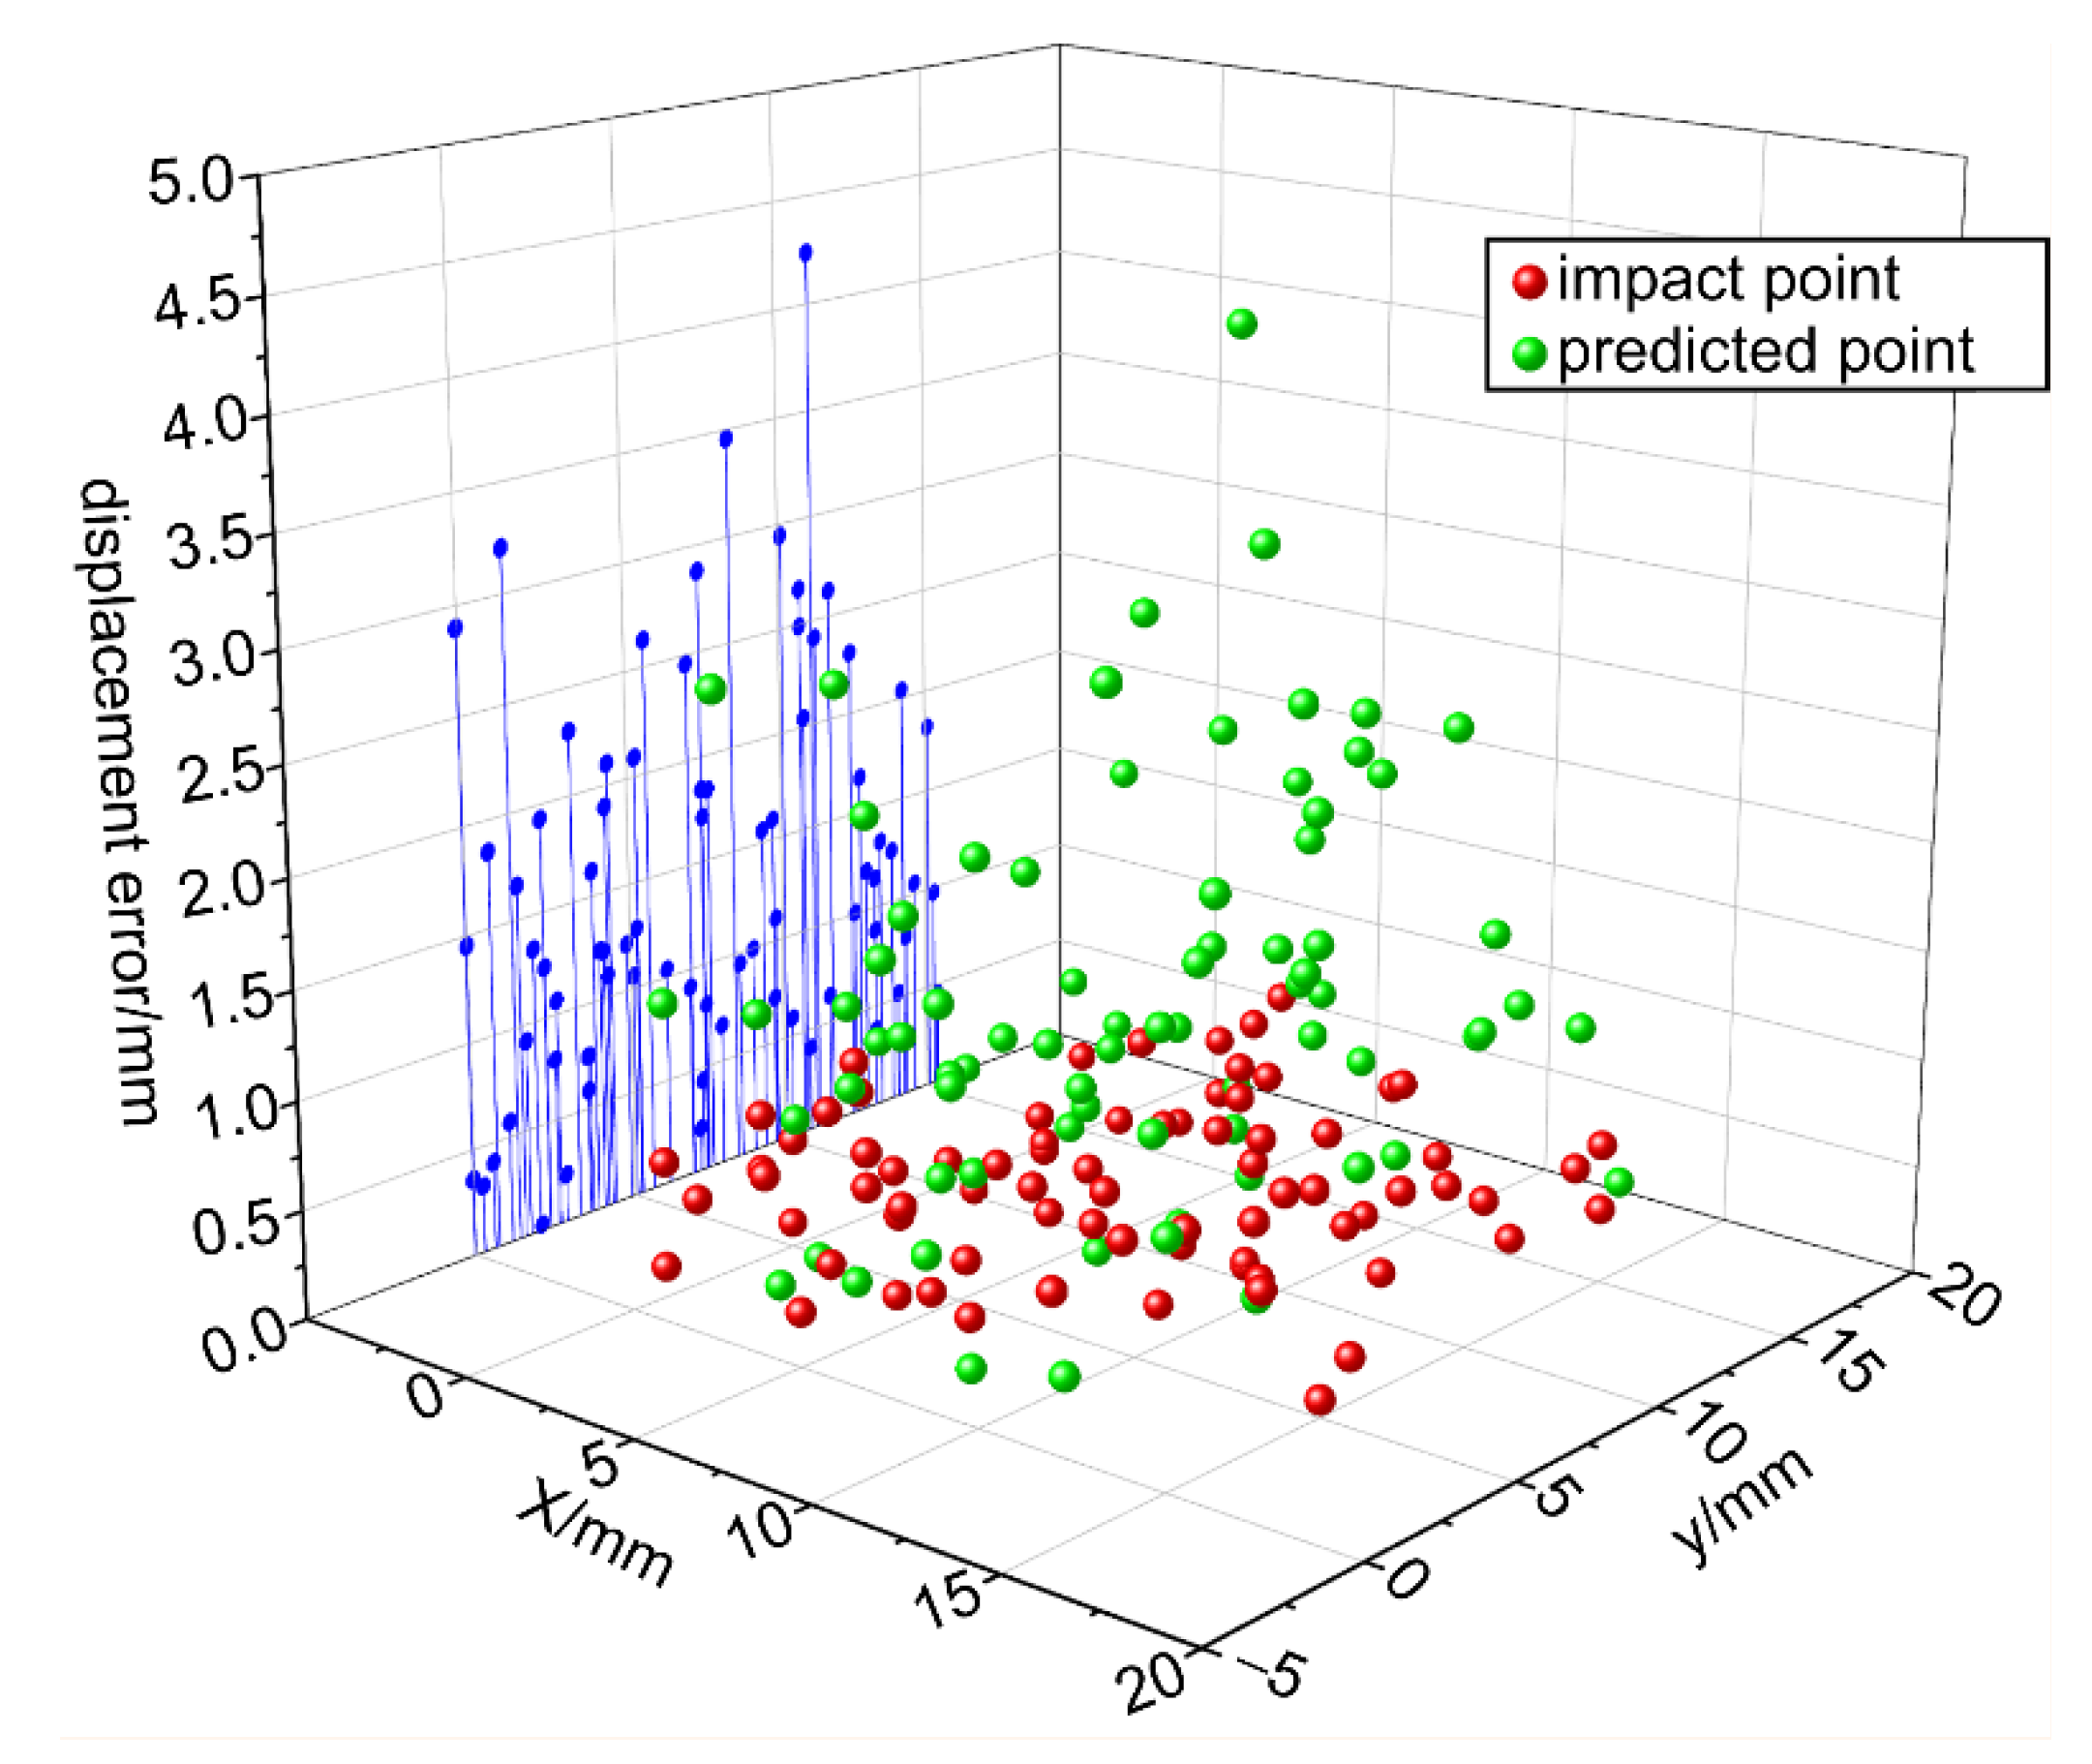
Figure 12.
Localization-error analysis of the four regression models.
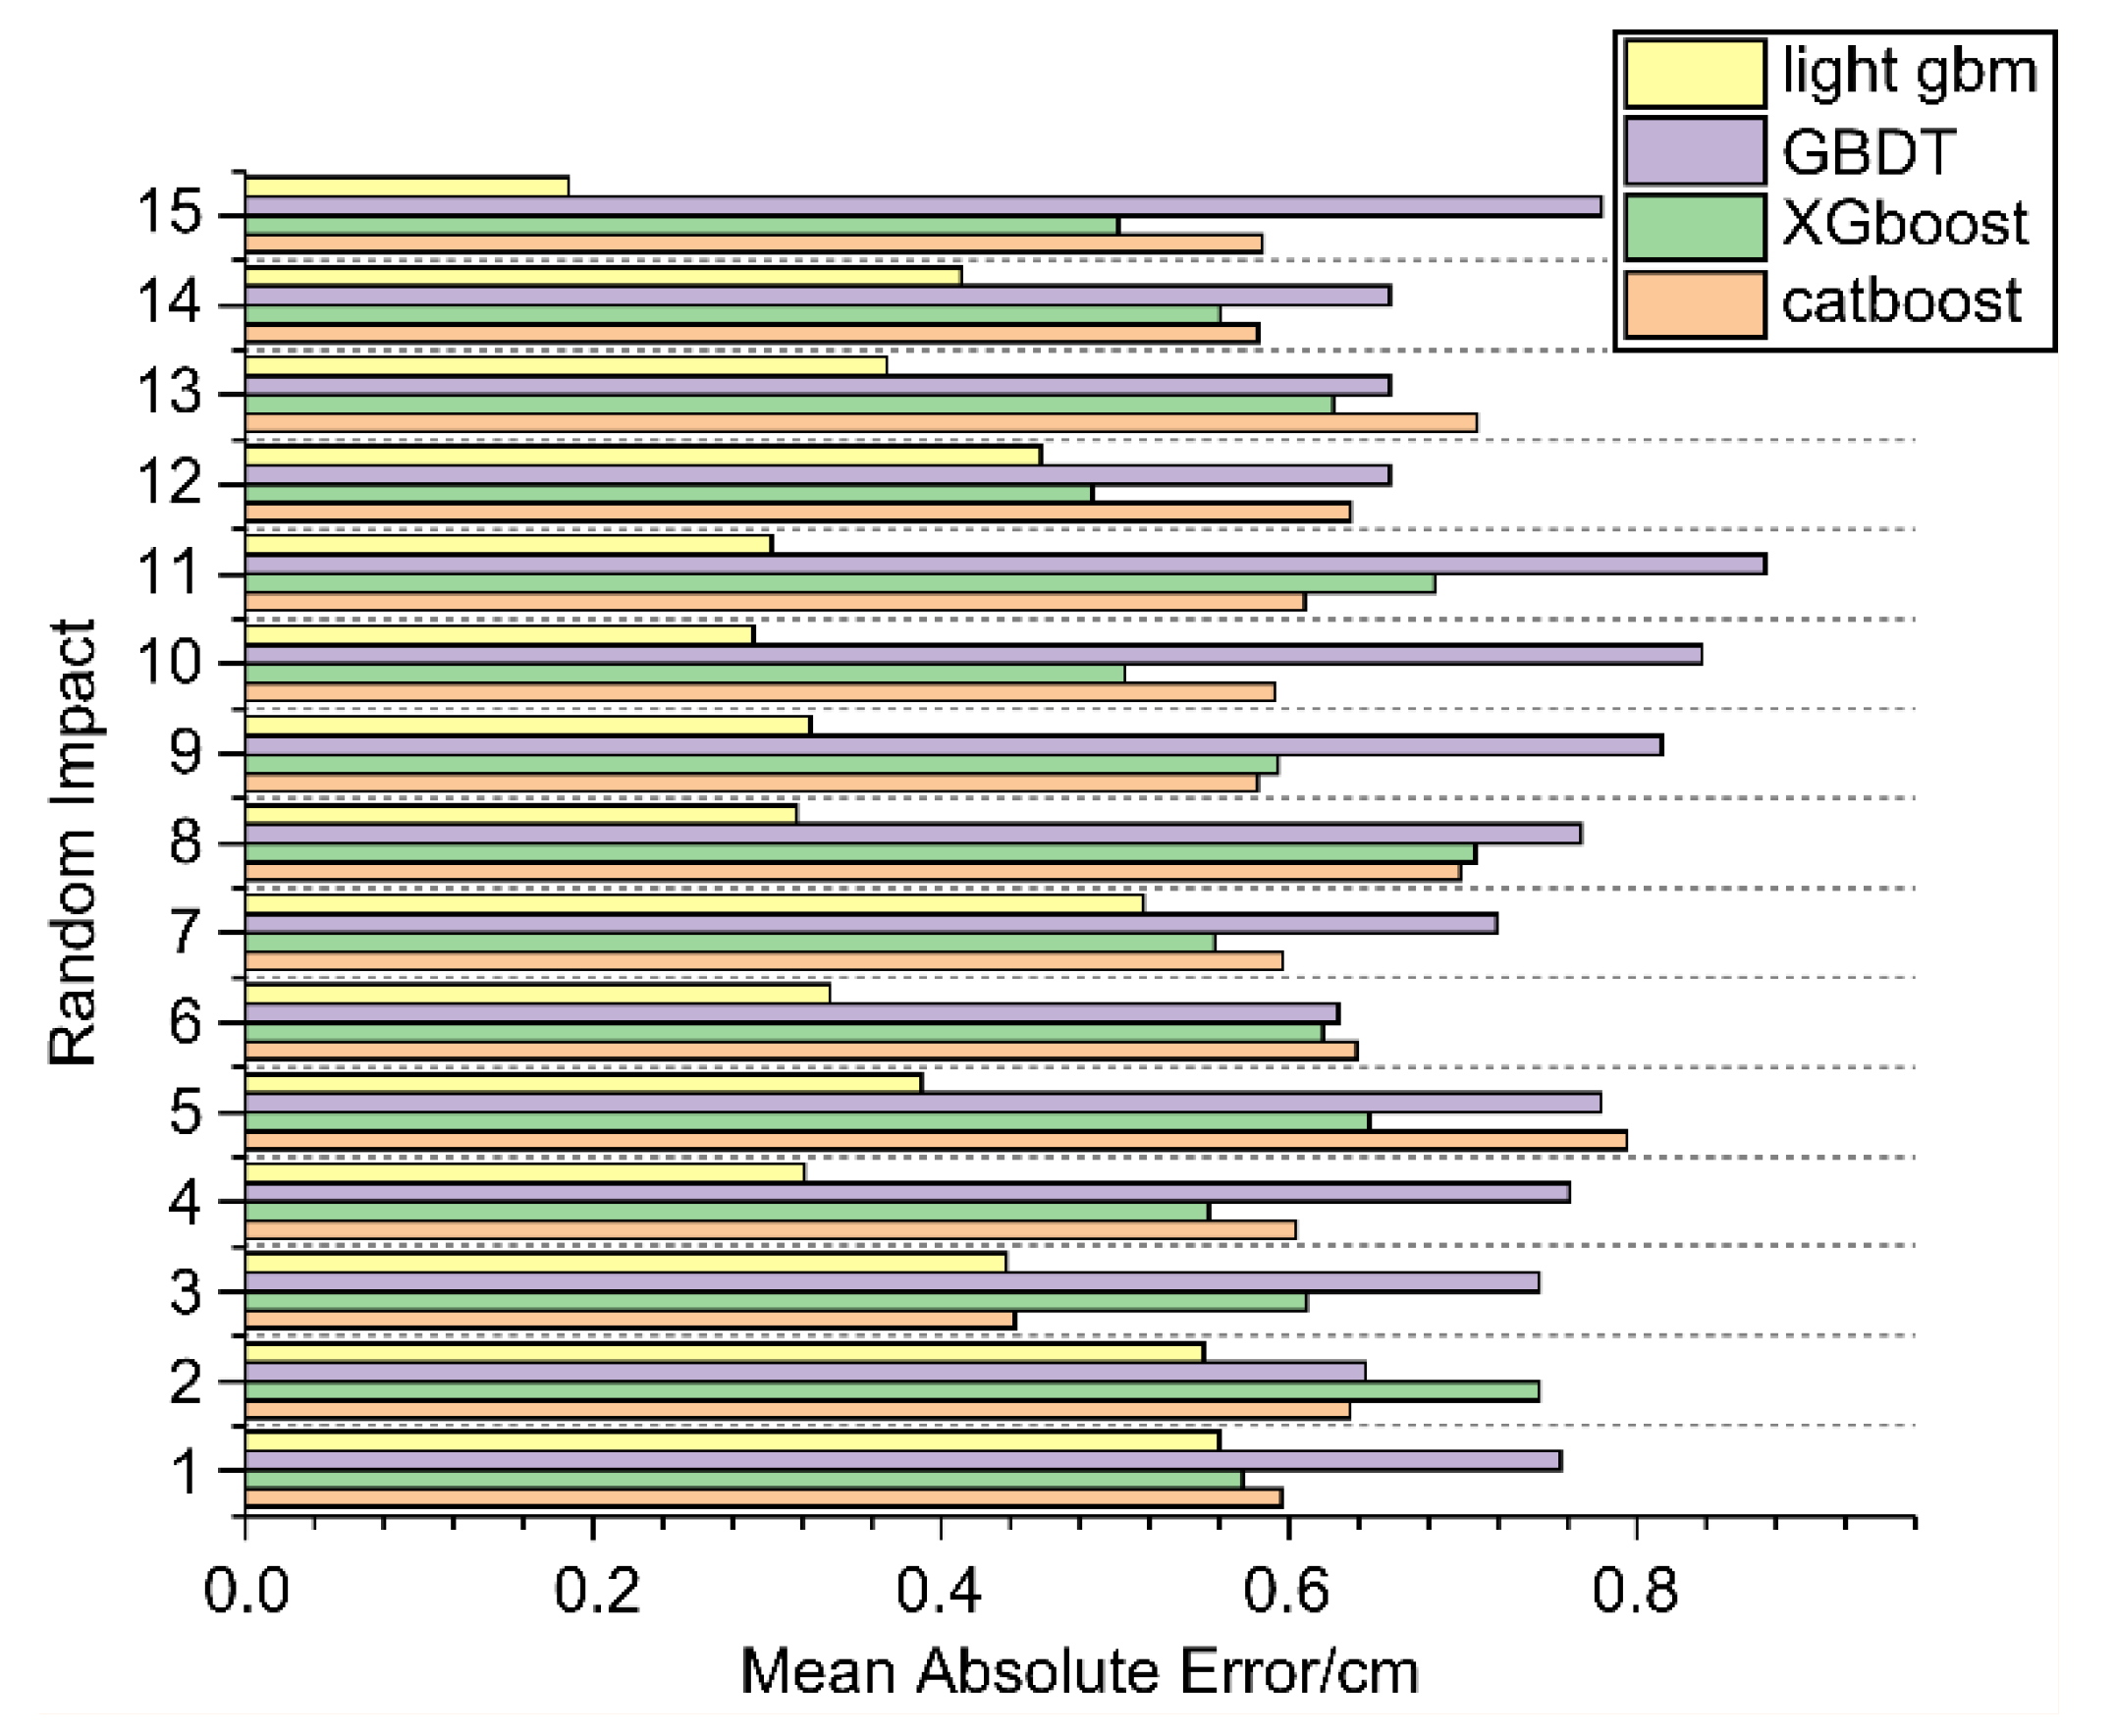
Figure 13.
Low-velocity impact localization results of the honeycomb sandwich composites based on LightBGM modeling.
Figure 13.
Low-velocity impact localization results of the honeycomb sandwich composites based on LightBGM modeling.
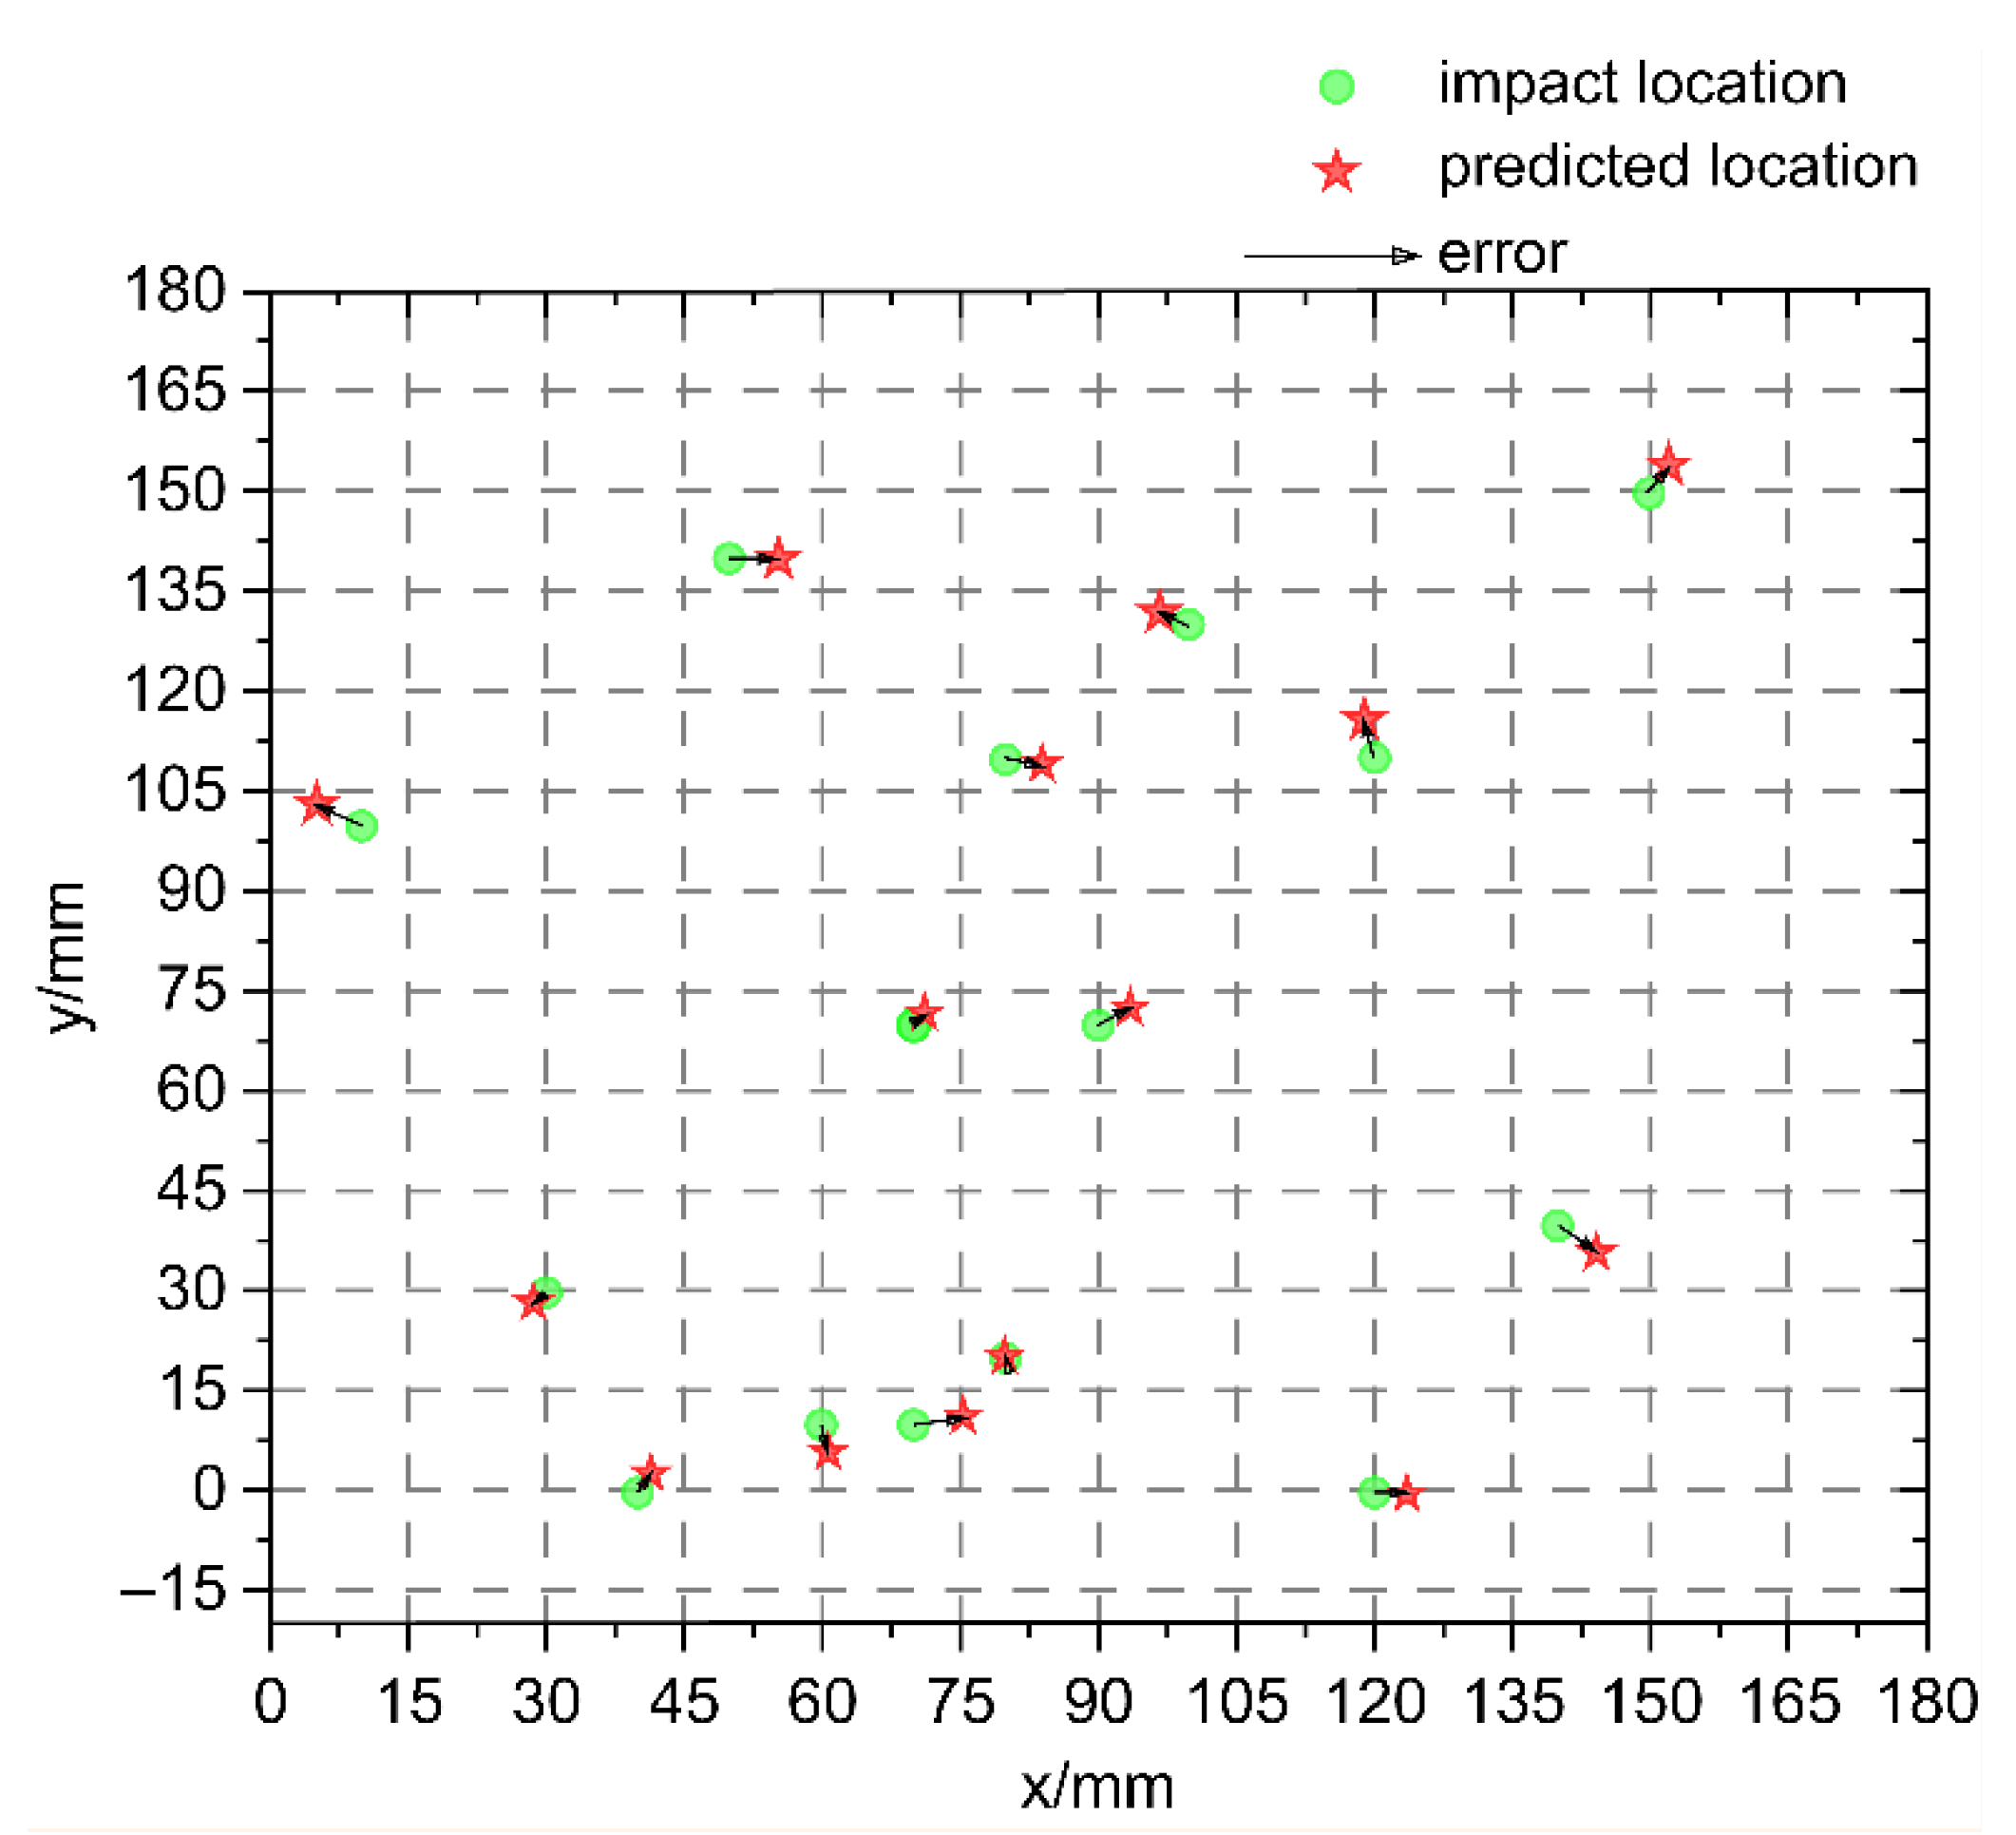

Table 1.
FBG sensor center wavelength and position.
| FBG | Center wavelength λ/mm |
Localization /mm |
|---|---|---|
| FBG1 | 1555 | (–112.5, 112.5) |
| FBG2 | 1550 | (–112.5, –112.5) |
| FBG3 | 1535 | (112.5, –112.5) |
| FBG4 | 1560 | (112.5, 112.5) |
| FBG5 | 1530 | (0, 0) |
| FBG6 | 1545 | (0, 0) |
Table 2.
LightGBM optimal parameters.
| Parameters | Optimal value |
|---|---|
| max_depth | 5 |
| num_leaves | 31 |
| learning_rate | 0.05 |
| reg_alpha | 0.01 |
| reg_lambda | 0.1 |
| min_child_weight | 2 |
| colsample_bytree | 0.9 |
| subsample | 0.9 |
Table 3.
Algorithm model accuracy comparison.
| ML model | MAE/mm | RMSE/mm |
|---|---|---|
| LightGBM | 5.8 | 10.2 |
| XGBoost | 10.4 | 13.2 |
| CatBoost | 9.3 | 19.2 |
| GBDT | 11.1 | 11.4 |
Disclaimer/Publisher’s Note: The statements, opinions and data contained in all publications are solely those of the individual author(s) and contributor(s) and not of MDPI and/or the editor(s). MDPI and/or the editor(s) disclaim responsibility for any injury to people or property resulting from any ideas, methods, instructions or products referred to in the content. |
© 2025 by the authors. Licensee MDPI, Basel, Switzerland. This article is an open access article distributed under the terms and conditions of the Creative Commons Attribution (CC BY) license (http://creativecommons.org/licenses/by/4.0/).
Copyright: This open access article is published under a Creative Commons CC BY 4.0 license, which permit the free download, distribution, and reuse, provided that the author and preprint are cited in any reuse.


