
Submitted:
07 November 2025
Posted:
12 November 2025
You are already at the latest version
Abstract
Achieving effective tissue integration depends mainly on the biological performance of polymeric implants. Poly-ether-ether-ketone (PEEK) is widely used as an implant material; however, its inert nature results in limited biological interactions. Various surface modification techniques have been investigated to enhance its bioactivity and overall biological performance. In this study, the PEEK surface was activated using low-pressure oxygen plasma and functionalized with phosphate and calcium ions. Comprehensive surface characterization by contact angle, scanning electron microscopy (SEM), X-ray photoelectron spectroscopy (XPS), and Fourier Transform Infrared (FT-IR) confirmed the effect of plasma and the ionic surface incorporation. The biological response was evaluated through cell viability, adhesion, and proliferation in NIH/3T3 fibroblasts and HOS osteoblasts, and the results indicated the efficacy of the surface modifications. Therefore, the proposed treatments provide an efficient strategy to improve the biological performance of PEEK-based implants.

Keywords:
PEEK
; surface modification
; bioactivity
; plasma treatment
; ion functionalization
Introduction
The manufacturing of personalized implants has been made possible by 3D printing [1,2]. This printing is an excellent achievement in medical areas such as orthopedics, maxillofacial, cranial, and spine, where implants can vary between patients due to bone defects and differences in physical complexion. This type of impression aligns with appropriate materials that meet mechanical, chemical, and biological requirements. Polyether ether ketone (PEEK) is a semi-crystalline and thermoplastic polymer widely used in trauma and spinal fixation [4] and is considered a metal replacement material for its mechanical properties, biocompatibility, and radiolucency [4,5], making it appropriate for bone implantation and imaging processing [5,6]. The tensile strength of PEEK ranges from 90 to 100 MPa [3,7], and the elastic modulus of around 3.6 GPa [3,5], indicating its stiffness is more like bone compared to metals [4,8]. In addition, PEEK exhibits wear and abrasion resistance, high-temperature performance, dimensional stability [3], and creep resistance [4,9]. Also, this material is chemically stable, low or non-toxic, non-inflammatory [3], and shows no mutagenic or carcinogenic effects [9]. However, like many biomaterials, PEEK has low surface energy (hydrophobic nature) and is considered bioinert [9,10]. In fact, evidence from proteomic studies has suggested that PEEK may alter certain types of proteins, which have been related to low cell proliferation on its surface [11].
Current research is focused on the bioactivity of biomaterials due to the significance of surface properties in influencing cell behavior [12,13]. These surfaces are arising as promising candidates for suitable implant materials because they mimic the natural extracellular matrix (ECM) properties, creating an environment that promotes a favorable cell response [14]. Modifying the biomaterial surfaces by enhancing hydrophilicity, surface energy, and chemistry can improve their adhesive properties [14,15,16] and bioactivate their surfaces for better implant tissue interaction. In addition, bioactivity may reduce the healing period [17].
Previous work from our group demonstrated that coating zirconia surfaces with laminin-5 protein significantly improved cellular response [18]. Moreover, because ECM proteins interact with cells mainly through the RGD peptide sequence (Arg–Gly–Asp) [14], we have also verified that direct immobilization of RGD on polydopamine-coated PEEK enhanced cell attachment while avoiding protein instability [19].
Similarly, calcium phosphate treatments have demonstrated an effective cellular response, facilitating the osteoblastic differentiation into mature osteoblasts (OBs) able to synthesize bone matrix and contribute to bone mineralization [20,21]. For instance, biomaterials coated with calcium phosphate (CaP) have shown favorable osseointegration [22,23]. However, some earlier reports have stated that such a coating has disadvantages, although it increases osteoconductivity. Due to a lack of strong physical attachment to the material, the coating may detach, and the release of particle debris that compromise the stability of the implant [17,24].
In the present work, PEEK surfaces were activated by low-pressure oxygen plasma and subsequently functionalized with phosphate and calcium ions to promote bioactivity. Plasma treatment increases surface energy and introduces oxygenated functional groups that enable further ion modifications [25,26]. To evaluate the modified material, in vitro experiments were conducted using the cell lines NIH/3T3 mouse fibroblast and HOS human osteoblast cell lines to determine cell viability, adhesion, spreading, and proliferation on PEEK surfaces. The results demonstrated the feasibility of these surface modifications to enhance the bioactivity of PEEK and, consequently, the cellular response.
2. Materials and Methods
2.1. Materials
Commercial-grade PEEK was obtained from Cera Direct (China). Calcium hydroxide and sodium dihydrogen phosphate monohydrate were purchased from Sigma-Aldrich (USA). Cell culture reagents, including DMEM-F12, Trypsin-EDTA, and Fetal Bovine Serum (FBS), were supplied by Gibco (USA). For cell staining, Hoechst 33342 and Phalloidin CF568 were purchased from Abcam and Biotium (USA), respectively.
2.2. Sample Fabrication and Surface Modification
2.2.1. Fabrication and Polishing
PEEK disc-shaped samples were digitally designed using the SolidWorks© program and machined in a Roland DWX-51D (Japan). Each disc was 3 mm thick, with diameters of 18 mm (contact angle), 5.8 mm (cell viability), and 10 mm (other analysis). Samples were sequentially polished using a GPX 200 Leco brand micro-rotator with 600- and 1200-grit alumina papers for 20 s each. Samples were cleaned by ultrasonic agitation in ethanol (30 min) and DI water (5 min). The resulting polished specimens were referred to as control samples.
2.2.2. Surface Activation
The polished samples were treated with oxygen plasma using a low-pressure Diener Plasma Technology system (Germany). During treatment, the gas flow was kept at 5 sccm, with a chamber pressure of about 0.5 mbar, a power supply of 50 W, and a frequency of 40 kHz. The vacuum pump operated at 1.5 m³/h. After 5 minutes of plasma exposure, the samples were rinsed with deionized water to stabilize them [27]. Plasma treatment enhances hydrophilicity and generates oxygenated functional groups [16,28] that serve as anchoring sites for subsequent ionic functionalization [26]. These samples were labeled PL-S.
2.2.3. Surface Functionalization
In the functionalization process, some samples were treated with calcium, and others were exposed to both phosphate and calcium ions. For calcium incorporation, plasma-treated samples (PL-S) were immersed in an aqueous solution of 30mM Ca(OH)₂ under continuous stirring at 40°C for 1 h (Ca-S samples). For the samples functionalized with phosphate and calcium ions, PL-S samples were first immersed in an aqueous solution of 50 mM NaH2PO4·H2O at 80°C for 2 hours. Then, 30mM Ca(OH)₂ was added to the solution, and the reaction continued for one more hour under magnetic stirring. After each functionalization, the samples were rinsed and then dried (PCa-S samples).
2.3. Surface Evaluation
2.3.1. Hydrophilicity
Static water contact angles were determined using a First Ten Angstroms 200 instrument (FTA-200 USA) by depositing a 2 µL DI water droplet on different surface points. Measurements were taken 20 min after each surface modification; values represent the mean ± SD (1.72° to 6.29°).
2.3.2. Crystallinity
Fourier-transform infrared spectroscopy (FTIR) (Perkin Elmer Spectrum GX) was used to evaluate the crystallinity of plasma-treated samples (PL-S) compared with the control sample in the 1500–1200 cm⁻¹ region. Crystallinity was evaluated based on the absorption bands at wave numbers 1305 and 1280 cm-1, as these peaks are reported for crystallinity, and the ratio of 1305/1280 cm-1 represents the crystallinity index (CI) [8]. The percentage of surface crystallinity was calculated following the ASTM Standard F277-09, Crystallinity [%] = (CI − 0.728)/1.549∗ 100 [8].
2.3.3. Topography
The topographical analysis was performed using a JEOL7401 JSM brand scanning electron microscope (SEM). The parameters were set at 10 kX for magnification, 2 kV for the acceleration voltage, and 8 mm for the working distance. The field emission electron gun utilized a tungsten tip emitter operating under ultra-high vacuum conditions.
2.3.4. Chemical Composition
The surface chemical composition analysis was carried out by the XPS technique using a Thermo Scientific Escalab 250xi system with a monochromatic Al Kα source (hν = 1486.86 eV). The samples were studied 48 hours after each treatment using a 10 eV electron gun voltage, a 650 µm spot size, and a 1 eV energy step.
2.4. Cell Culture Assays
Cell culture procedures previously established and validated in our laboratory [19] were used for all experiments. Cells were maintained in DMEM-F12 supplemented with 5% FBS and 1% streptomycin at 37 °C, 5% CO₂, in a humidified incubator. Trypsin-EDTA was used for cell detachment during subculturing, which was performed every three days.
2.4.1. Cell Viability
For the MTT assay [29], samples were placed in 96-well plates, and fibroblasts and osteoblasts were seeded at a density of 2 × 10⁴ cells using 200 µL of DMEM-F12 supplemented with 5% FBS. The plates were incubated at 37 °C in a humidified atmosphere containing 5% CO₂ for 24 h. Thereafter, the media were replaced with DMEM containing 0.5 mg/mL MTT and incubated for another 4 h period. The medium in each well was discarded and rinsed. The formazan crystals produced during the MTT reaction were dissolved with dimethyl sulfoxide, and the absorbance was read at 570 nm (Varioskan Lux, Thermo Fisher USA). Results were expressed as optical density (OD) relative to control wells. Three independent experiments were performed (n = 3).
2.4.2. Cell Proliferation
Samples were placed in 24-well plates, and fibroblast and osteoblast cells were seeded at a density of 2 × 10⁴ cells for 24 and 96 h, under the same incubation conditions described previously. Cells were fixed with 3.75% paraformaldehyde (15 min, 4°C), permeabilized with 0.2% Triton X-100 (10 min, 25°C), blocked with bovine milk (1 h, 25°C), and cell nuclei stained with Hoechst (30 min, 37 °C). Samples were rinsed with PBS between steps, imaged using a confocal microscope (Zeiss LSM-700, Germany), and counted using ImageJ software. At least 20 images per sample were taken for each sample group (n = 2).
2.4.3. Cell Adhesion and Spreading
Samples were placed in 24-well plates, and fibroblast and osteoblast cells were seeded at a density of 2 × 10⁴ cells for 24 h, under the same incubation conditions described previously. After fixation, permeabilization, and blocking, actin filaments were stained with Phalloidin CF568 (20 min, 25 °C), and nuclei with Hoechst 33342 (30 min, 37 °C). Samples were rinsed with PBS between steps. Fluorescent images were obtained at 40× magnification using a confocal microscope (Zeiss LSM-700).
2.5. Statistical Evaluation
Data are expressed as mean ± standard deviation (SD). Statistical analysis was conducted with GraphPad Prism v9 using one-way ANOVA. A statistically significant value was considered for p < 0.05.
3. Results
As previously mentioned, three different surface treatments were applied to PEEK samples, along with one untreated sample used as a control. These samples underwent a series of analyses and experiments, and the results were compared to assess the effects of each surface treatment. Table 1 summarizes the sample types and their corresponding labels to facilitate understanding of the results presented.
3.1. Hydrophilicity
The contact angle results for all PEEK sample surfaces are presented in Figure 1.
The control sample is the less hydrophilic surface with an angle of 86.49°±1.73. After oxygen plasma treatment, the PL-S sample showed a high decrease in the contact angle value, 25.98°±1.35. The functionalization with calcium ions, Ca-S sample, showed an angle of 58.42°±6.29, and the functionalization with phosphate and calcium ions, PCa-S sample, had a value of 43.03°±6.00. The functionalized surfaces had a higher standard deviation, indicating that the surface energy varies across different parts of the surfaces, probably due to the heterogeneity of ion distribution.
3.2. Crystallinity
3.3. Topography
Topographical changes were observed through SEM micrographs among the treated samples (Figure 3). The control surface (Figure 3a) showed a smooth morphology with few irregularities. In contrast, the plasma-treated sample (PL-S, Figure 3b) exhibited mild surface etching in localized areas. Functionalization with calcium ions (Ca-S, Figure 3c) produced scattered surface features. In the same way, the phosphate–calcium functionalized sample (PCa-S, Figure 3d) displayed a similar topographic pattern, with granular artifacts distributed over the entire surface.
3.4. Chemical Composition
XPS analysis confirmed notable differences in elemental composition among the PEEK surfaces. Table 2 summarizes the percentage composition of each sample, and Figure 4 displays their survey spectrum and deconvoluted peaks.
The percentage of chemical composition between the control and PL-S samples varies in the amount of oxygen detected over the material surface. After plasma treatment, the PL-S sample showed 26.73±3.62% oxygen compared with 20.54±0.11% from the Control, indicating a higher surface oxygen concentration (Table 2). The increased amount of oxygen is due to the formation of oxygenated funciontal groups on the polymer surface. After ionic treatment, calcium was detected in the Ca-S sample (2.38 ± 1.12 % Ca). For the PCa-S sample, both phosphorus and calcium were identified, with an increased calcium concentration (8.20 ± 1.07 %) compared with Ca-S (Table 2). This suggests that phosphate incorporation promotes additional calcium binding.
For the XPS survey spectrum, Figure 4(a) displays the characteristic peaks of every surface. The Control and plasma-treated PEEK samples (PL-S) exhibited C1s around 289 eV and O1s around 537 eV peaks. In contrast, calcium-functionalized surfaces (Ca-S) presented an additional Ca2p peak around 346 eV, and the phosphate-calcium modified samples (PCa-S) exhibited both P2p around 133 eV and Ca2p around 346 eV signals.
The peak representation, Figure 4(b-d), was processed using OriginPro, and the binding energies were identified according to the NIST XPS spectroscopy database. For the Ca-S sample, the Ca2p signal was deconvoluted into two peaks. Ca-O was detected at 347.4 and 351.05 eV. For the PCa-S sample, the P2p signal was detected at 133.30 eV, corresponding to CaHPO4, while Ca2p deconvolution resulted in a signal around 347.25 eV for CaHPO4 and Ca-O formation at 347.25 and 350.8 eV.
3.5. Cell Culture Assays
3.5.1. Cell Viability
The optical density (OD) values obtained from the MTT assay after 24 hours are shown in Figure 5 for fibroblast and osteoblast cells.
All treated samples exhibited a statistically significant cell viability compared with the control, indicating an improvement in the metabolic activity in response to surface modification. Fibroblasts exhibited a gradual increase in viability across the treatments (Figure 5a), while osteoblasts showed similarly high levels among all plasma-treated and functionalized samples (Figure 5b).
3.5.2. Cell Proliferation
Cell proliferation is shown in Figure 6 for all surface conditions relative to the control.
Both cell lines showed proliferation after 24 h, with a more pronounced increase at 96 h for the plasma-treated and ion-functionalized samples. Fibroblasts exhibited the highest proliferation on the phosphate and calcium ion functionalized surfaces (PCa-S) after 24 h, while at 96 h, proliferation values were comparable among plasma-treated and functionalized samples. Osteoblasts had a clear preference for ion-functionalized surfaces, particularly for PCa-S, at both 24 and 96 h, and the low standard deviation values indicated consistent cellular behavior across replicates. These results confirm the positive influence of surface modification on sustained cell proliferation.
3.5.3. Cell Adhesion and Spreading
Representative fluorescence images of fibroblast and osteoblast cells after 24 h are shown in Figure 7.
Cell adhesion was observed on all surfaces, including the control sample, for both cell types. However, plasma-treated (PL-S) and functionalized (Ca-S and PCa-S) samples exhibited more extended and well-spread morphologies.
4. Discussion
The lower contact angle value observed for the PL-S sample confirms the successful incorporation of oxygenated functional groups onto the PEEK surface during plasma exposure, as reported previously [16,26,28]. Meanwhile, the larger deviations in the ion-functionalized samples are probably due to variations in surface energy arising from heterogeneous ion distribution. Overall, the increase in hydrophilicity following plasma and ionic modification indicates surface activation, which is expected to promote enhanced cellular response. The FT-IR results indicated a crystallinity index value of around 1.00 for the Control and PL-S sample, respectively, with a percentage of Crystallinity of 17.88% and 18.03%. It can be assumed that the oxygen plasma applied was a surface treatment that did not affect the bulk properties of the material [8]. In the SEM analysis, the mild etching observed in some areas of the PL-S sample (Figure 3b) compared with the Control (Figure 3a) revealed the effect of oxygen plasma on the surface of the polymeric material after 5 minutes of exposure. In addition, the functionalization also generated morphological changes. Both Ca-S and PCa-S samples exhibited scattered surface features (Figure 3c, 3d), suggesting that phosphate and calcium ions interacted with the oxygenated surface groups formed during plasma treatment. This was corroborated not only with the contact angle results but with XPS. The amount of oxygen detected after plasma treatment (Table 2, Figure 4a) confirmed the formation of oxygenated functional groups on the polymer surface. Reactive plasma species presumably introduced hydroxyl (–OH), epoxy (–O–), carbonyl (C=O), and carboxyl (–COOH) functionalities. This characteristic has been reported previously for other authors [25,26]. In addition, the presence of calcium on the Ca-S surface and both calcium and phosphorus on the PCa-S surface indicates successful ionic functionalization. Notably, the amount of calcium detected in the PCa-S sample (Table 2) may indicate that phosphate incorporation promotes additional calcium binding through ionic interactions. In the peak representation (Figure 4b-c), the detection of Ca–O and CaHPO₄ may provide insight into how the calcium and phosphate ions interact with oxygen-rich sites on the polymer surface. The changes observed in the surface characterization affected the cellular response. Cell viability was observed in all samples (Figure 5) after 24 h, with higher levels in those treated with plasma and ion functionalization, suggesting that improved hydrophilicity and ionic chemistry favored early cellular attachment and metabolic activity. When comparing the fibroblast viability and proliferation assays at 24 h for the plasma-treated samples, the results are inconclusive. At that time, the specific effects of the plasma treatment may have stimulated cell metabolism without inducing division, resulting in metabolically active but non-dividing cells. Nevertheless, Fibroblast proliferation values were comparable across all plasma-treated and ion-functionalized surfaces at 96 h, implying that fibroblast growth was well supported regardless of the modification applied. Conversely, osteoblasts showed a more consistent response on the phosphate–calcium surfaces, which may suggest that this modification provides a more stable and favorable microenvironment for osteogenic activity [17,18,19,20,21,22,23]. Finally, enhanced adhesion and spreading observed on the modified samples compared with Control could reflect an improved cytoskeletal organization and focal contact formation, leading to a more effective anchorage of both fibroblast and osteoblast cells. These results demonstrate that hydrophilicity and bioactive ionic species together enhance biocompatibility and cellular interactions at the material interface.
5. Conclusions
This study evaluated the effect of plasma activation and ionic functionalization on PEEK surfaces to improve their biological performance. The effect of such surface modifications was confirmed using several characterization techniques. The contact angle verified changes in hydrophilicity. FT-IR confirmed the unchanged crystallinity of the plasma-treated surfaces. The XPS showed an increase in oxygen in the samples exposed to plasma, along with the detection of phosphate and calcium ions in the functionalized samples. In addition, changes in the topography of each sample related to the different surface treatments were observed using SEM. These surface modifications showed a more favorable cellular response compared with the Control. The fibroblast cells showed a progressive increase in viability and proliferation with each subsequent treatment, and at 96 h, they exhibited a similar proliferation pattern. Osteoblast cells showed very close viability in all plasma-treated and functionalized samples and a remarkable preference for proliferation in the surface functionalized with both ions. This indicates that plasma activation supports fibroblast growth, but the phosphate–calcium functionalization promotes a more consistent osteogenic response. Regarding cell adhesion, both cell lines showed a more extended morphology in all samples compared with the Control. For this sample, mechanically polished, cell viability and proliferation were observed. However, the cellular response was slower, which could be a disadvantage in the healing process and tissue regeneration. In conclusion, this study demonstrates that modifying the surfaces of inert PEEK favors cellular responses regarding viability, proliferation, adhesion, and spreading. The functionalization with phosphate and calcium ions will be a viable treatment in terms of cost and simplicity.
Author Contributions
Conceptualization, LVTL, JSCC; Methodology, LVTL, ALV; Software: LTL, SYRL. Validation, LVTL, JSCC, SYRL. Formal Analysis, LVTL, JSCC, CAMP; Investigation, LVTL; Resources, JSCC, ALV, SYRL, CAMP; Data Curation, LVTL, ALV; Writing—Original Draft Preparation, LVTL; Writing—Review and Editing, LVTL, JSCC; Visualization, LVTL; Supervision, JSCC, CAMP; Project Administration, JSCC, ALV; Funding Acquisition, JSCC, SYRL, CAMP. All authors have read and agreed to the published version of the manuscript.
Funding
This research received no external funding.
Institutional Review Board Statement
Not applicable.
Informed Consent Statement
Not applicable.
Acknowledgments
The authors thank the Bioscience Department at UTEP and CIMAV for granting access to their facilities. They especially thank Dr. Armando Varela, Luis Silva, Dr. Cesar Leyva, and Luis a la Torre for their invaluable support with the characterization techniques.
Conflicts of Interest
The authors declare no conflicts of interest.
Abbreviations
The following abbreviations are used in this manuscript:
| PEEK | Poly ether ether ketone |
| SEM | Scanning Electron Microscopy |
| XPS | X-ray Photoelectron Spectroscopy |
| FT-IR | Fourier Transform Infrared |
| MTT | 3-(4,5-Dimethylthiazol-2-yl)-2,5-Diphenyltetrazolium Bromide |
| DMEM-F12 | Dulbecco’s Modified Eagle Medium/Nutrient Mixture F-12 |
References
- A. Haleem, M. Javaid, A. Vaish, R. Vaishya, Three-dimensional-printed polyether ether ketone implants for orthopedics, Indian J Orthop 53 (2019) 377–379. [CrossRef]
- P. Honigmann, N. Sharma, B. Okolo, U. Popp, B. Msallem, F.M. Thieringer, Patient-specific surgical implants made of 3D printed PEEK: Material, technology, and scope of surgical application, Biomed Res Int 2018 (2018). [CrossRef]
- A. Haleem, M. Javaid, Polyether ether ketone (PEEK) and its 3D printed implants applications in medical field: An overview, Clin Epidemiol Glob Health 7 (2019) 571–577. [CrossRef]
- H. Ma, A. Suonan, J. Zhou, Q. Yuan, L. Liu, X. Zhao, X. Lou, C. Yang, D. Li, Y. gang Zhang, PEEK (Polyether-ether-ketone) and its composite materials in orthopedic implantation, Arabian Journal of Chemistry 14 (2021). [CrossRef]
- M. Mbogori, A. Vaish, R. Vaishya, A. Haleem, M. Javaid, Poly-Ether-Ether-Ketone (PEEK) in orthopaedic practice- A current concept review, Journal of Orthopaedic Reports 1 (2022) 3–7. [CrossRef]
- S. Hussain, L. Rutledge, J.G. Acheson, A.R. Boyd, B.J. Meenan, The surface characterisation of polyetheretherketone (Peek) modified via the direct sputter deposition of calcium phosphate thin films, Coatings 10 (2020) 1–26. [CrossRef]
- P. Rendas, L. Figueiredo, M. Geraldo, C. Vidal, B.A. Soares, Improvement of tensile and flexural properties of 3D printed PEEK through the increase of interfacial adhesion, J Manuf Process 93 (2023) 260–274. [CrossRef]
- Q. Fu, M. Gabriel, F. Schmidt, W.D. Müller, A.D. Schwitalla, The impact of different low-pressure plasma types on the physical, chemical and biological surface properties of PEEK, Dental Materials 37 (2021) e15–e22. [CrossRef]
- S. Moharil, A. Reche, K. Durge, Polyetheretherketone (PEEK) as a Biomaterial: An Overview, Cureus (2023). [CrossRef]
- S. Najeeb, M.S. Zafar, Z. Khurshid, F. Siddiqui, Applications of polyetheretherketone (PEEK) in oral implantology and prosthodontics, J Prosthodont Res 60 (2016) 12–19. [CrossRef]
- M. Zhao, M. An, Q. Wang, X. Liu, W. Lai, X. Zhao, S. Wei, J. Ji, Quantitative proteomic analysis of human osteoblast-like MG-63 cells in response to bioinert implant material titanium and polyetheretherketone, J Proteomics 75 (2012) 3560–3573. [CrossRef]
- M. He, Y. Huang, H. Xu, G. Feng, L. Liu, Y. Li, D. Sun, L. Zhang, Modification of polyetheretherketone implants: From enhancing bone integration to enabling multi-modal therapeutics, Acta Biomater 129 (2021) 18–32. [CrossRef]
- F.S.F. Dos Santos, M. Vieira, H.N. da Silva, H. Tomás, M.V.L. Fook, Surface bioactivation of polyether ether ketone (Peek) by sulfuric acid and piranha solution: Influence of the modification route in capacity for inducing cell growth, Biomolecules 11 (2021). [CrossRef]
- S. Cai, C. Wu, W. Yang, W. Liang, H. Yu, L. Liu, Recent advance in surface modification for regulating cell adhesion and behaviors, (2020). [CrossRef]
- A. Obilor, W. Sainsbury, M. Pacella, A. Wilson, V. V. Silberschmidt, Laser Processing of Polymers for Surface Energy Control of Biomedical Implants, in: Procedia CIRP, Elsevier B.V., 2022: pp. 558–563. [CrossRef]
- G. Nageswaran, L. Jothi, S. Jagannathan, Plasma Assisted Polymer Modifications, in: Non-Thermal Plasma Technology for Polymeric Materials: Applications in Composites, Nanostructured Materials, and Biomedical Fields, Elsevier, 2018: pp. 95–127. [CrossRef]
- Sunarso, R. Toita, K. Tsuru, K. Ishikawa, Immobilization of calcium and phosphate ions improves the osteoconductivity of titanium implants, Materials Science and Engineering C 68 (2016) 291–298. [CrossRef]
- L. V. Tapia-Lopez, H.E. Esparza-Ponce, A. Luna-Velasco, P.E. Garcia-Casillas, H. Castro-Carmona, J.S. Castro, Bioactivation of zirconia surface with laminin protein coating via plasma etching and chemical modification, Surf Coat Technol 402 (2020). [CrossRef]
- L. V. Tapia-Lopez, M.A. Luna-Velasco, E.K. Beaven, A.S. Conejo-Dávila, M. Nurunnabi, J.S. Castro, RGD Peptide-Functionalized Polyether Ether Ketone Surface Improves Biocompatibility and Cell Response, ACS Biomater Sci Eng 9 (2023) 5270–5278. [CrossRef]
- J. Jeong, J.H. Kim, J.H. Shim, N.S. Hwang, C.Y. Heo, Bioactive calcium phosphate materials and applications in bone regeneration, Biomater Res 23 (2019). [CrossRef]
- R. Shi, J. Zhang, W. Li, Y. Zhang, Z. Ma, C. Wu, An effective surface modification strategy to boost PEEK osteogenesis using porous CaP generated in well-tuned collagen matrix, Appl Surf Sci 555 (2021). [CrossRef]
- R. Narayanan, S.K. Seshadri, T.Y. Kwon, K.H. Kim, Calcium phosphate-based coatings on titanium and its alloys, J Biomed Mater Res B Appl Biomater 85 (2008) 279–299. [CrossRef]
- H. Mahjoubi, E. Buck, P. Manimunda, R. Farivar, R. Chromik, M. Murshed, M. Cerruti, Surface phosphonation enhances hydroxyapatite coating adhesion on polyetheretherketone and its osseointegration potential, Acta Biomater 47 (2017) 149–158. [CrossRef]
- Sunarso, A. Tsuchiya, R. Toita, K. Tsuru, K. Ishikawa, Enhanced osseointegration capability of poly(Ether ether ketone) via combined phosphate and calcium surface-functionalization, Int J Mol Sci 21 (2020). [CrossRef]
- R. Teng, Y. Meng, X. Zhao, J. Liu, R. Ding, Y. Cheng, Y. Zhang, Y. Zhang, D. Pei, A. Li, Combination of Polydopamine Coating and Plasma Pretreatment to Improve Bond Ability Between PEEK and Primary Teeth, Front Bioeng Biotechnol 8 (2021). [CrossRef]
- T. Jacobs, R. Morent, N. De Geyter, P. Dubruel, C. Leys, Plasma surface modification of biomedical polymers: Influence on cell-material interaction, Plasma Chemistry and Plasma Processing 32 (2012) 1039–1073. [CrossRef]
- A.H.C. Poulsson, R.G. Richards, Surface Modification Techniques of Polyetheretherketone, Including Plasma Surface Treatment, in: PEEK Biomaterials Handbook, Elsevier, 2011: pp. 145–161. [CrossRef]
- P. Chytrosz-Wrobel, M. Golda-Cepa, E. Stodolak-Zych, J. Rysz, A. Kotarba, Effect of oxygen plasma-treatment on surface functional groups, wettability, and nanotopography features of medically relevant polymers with various crystallinities, Applied Surface Science Advances 18 (2023). [CrossRef]
- M.F. Azooz, M.A. Zaghloul, M.M. Sayed, H.M. Soliman, N.M. Mounir, N. Kamal, W.H. El-Dabae, S.E. Ali, Efficiency of MTT and Trypan Blue Assays for Detection of Viability and Recovery of Different Frozen Cell Lines, Egyptian Journal of Veterinary Science (Egypt) 55 (2024) 1649–1657. [CrossRef]
Figure 1.
Water contact angle measurements on sample surfaces and their corresponding droplets. Values represent the mean ± standard error (n = 3). **** indicates p < 0.0001 vs. Control.
Figure 1.
Water contact angle measurements on sample surfaces and their corresponding droplets. Values represent the mean ± standard error (n = 3). **** indicates p < 0.0001 vs. Control.
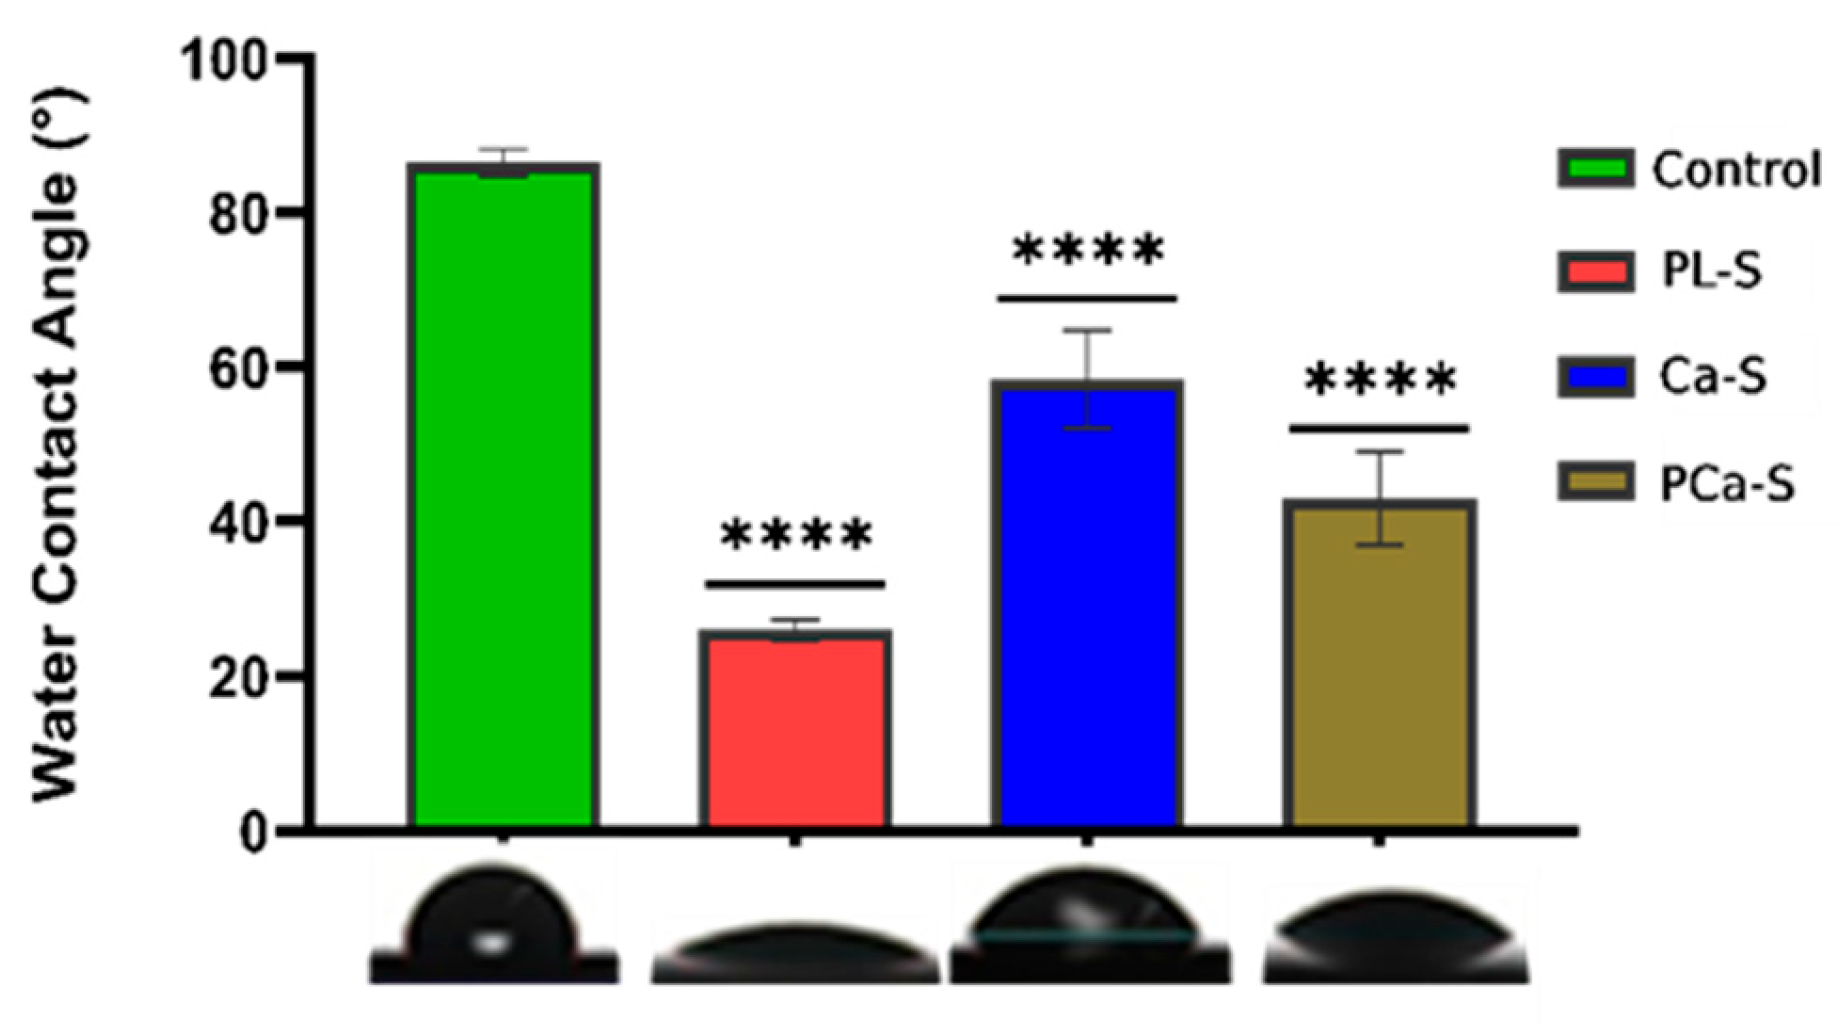
Figure 2.
FT-IR spectrum for the Control and PL-S samples. Crystallinity [%] = (CI − 0.728)/1.549∗ 100. [8].
Figure 2.
FT-IR spectrum for the Control and PL-S samples. Crystallinity [%] = (CI − 0.728)/1.549∗ 100. [8].
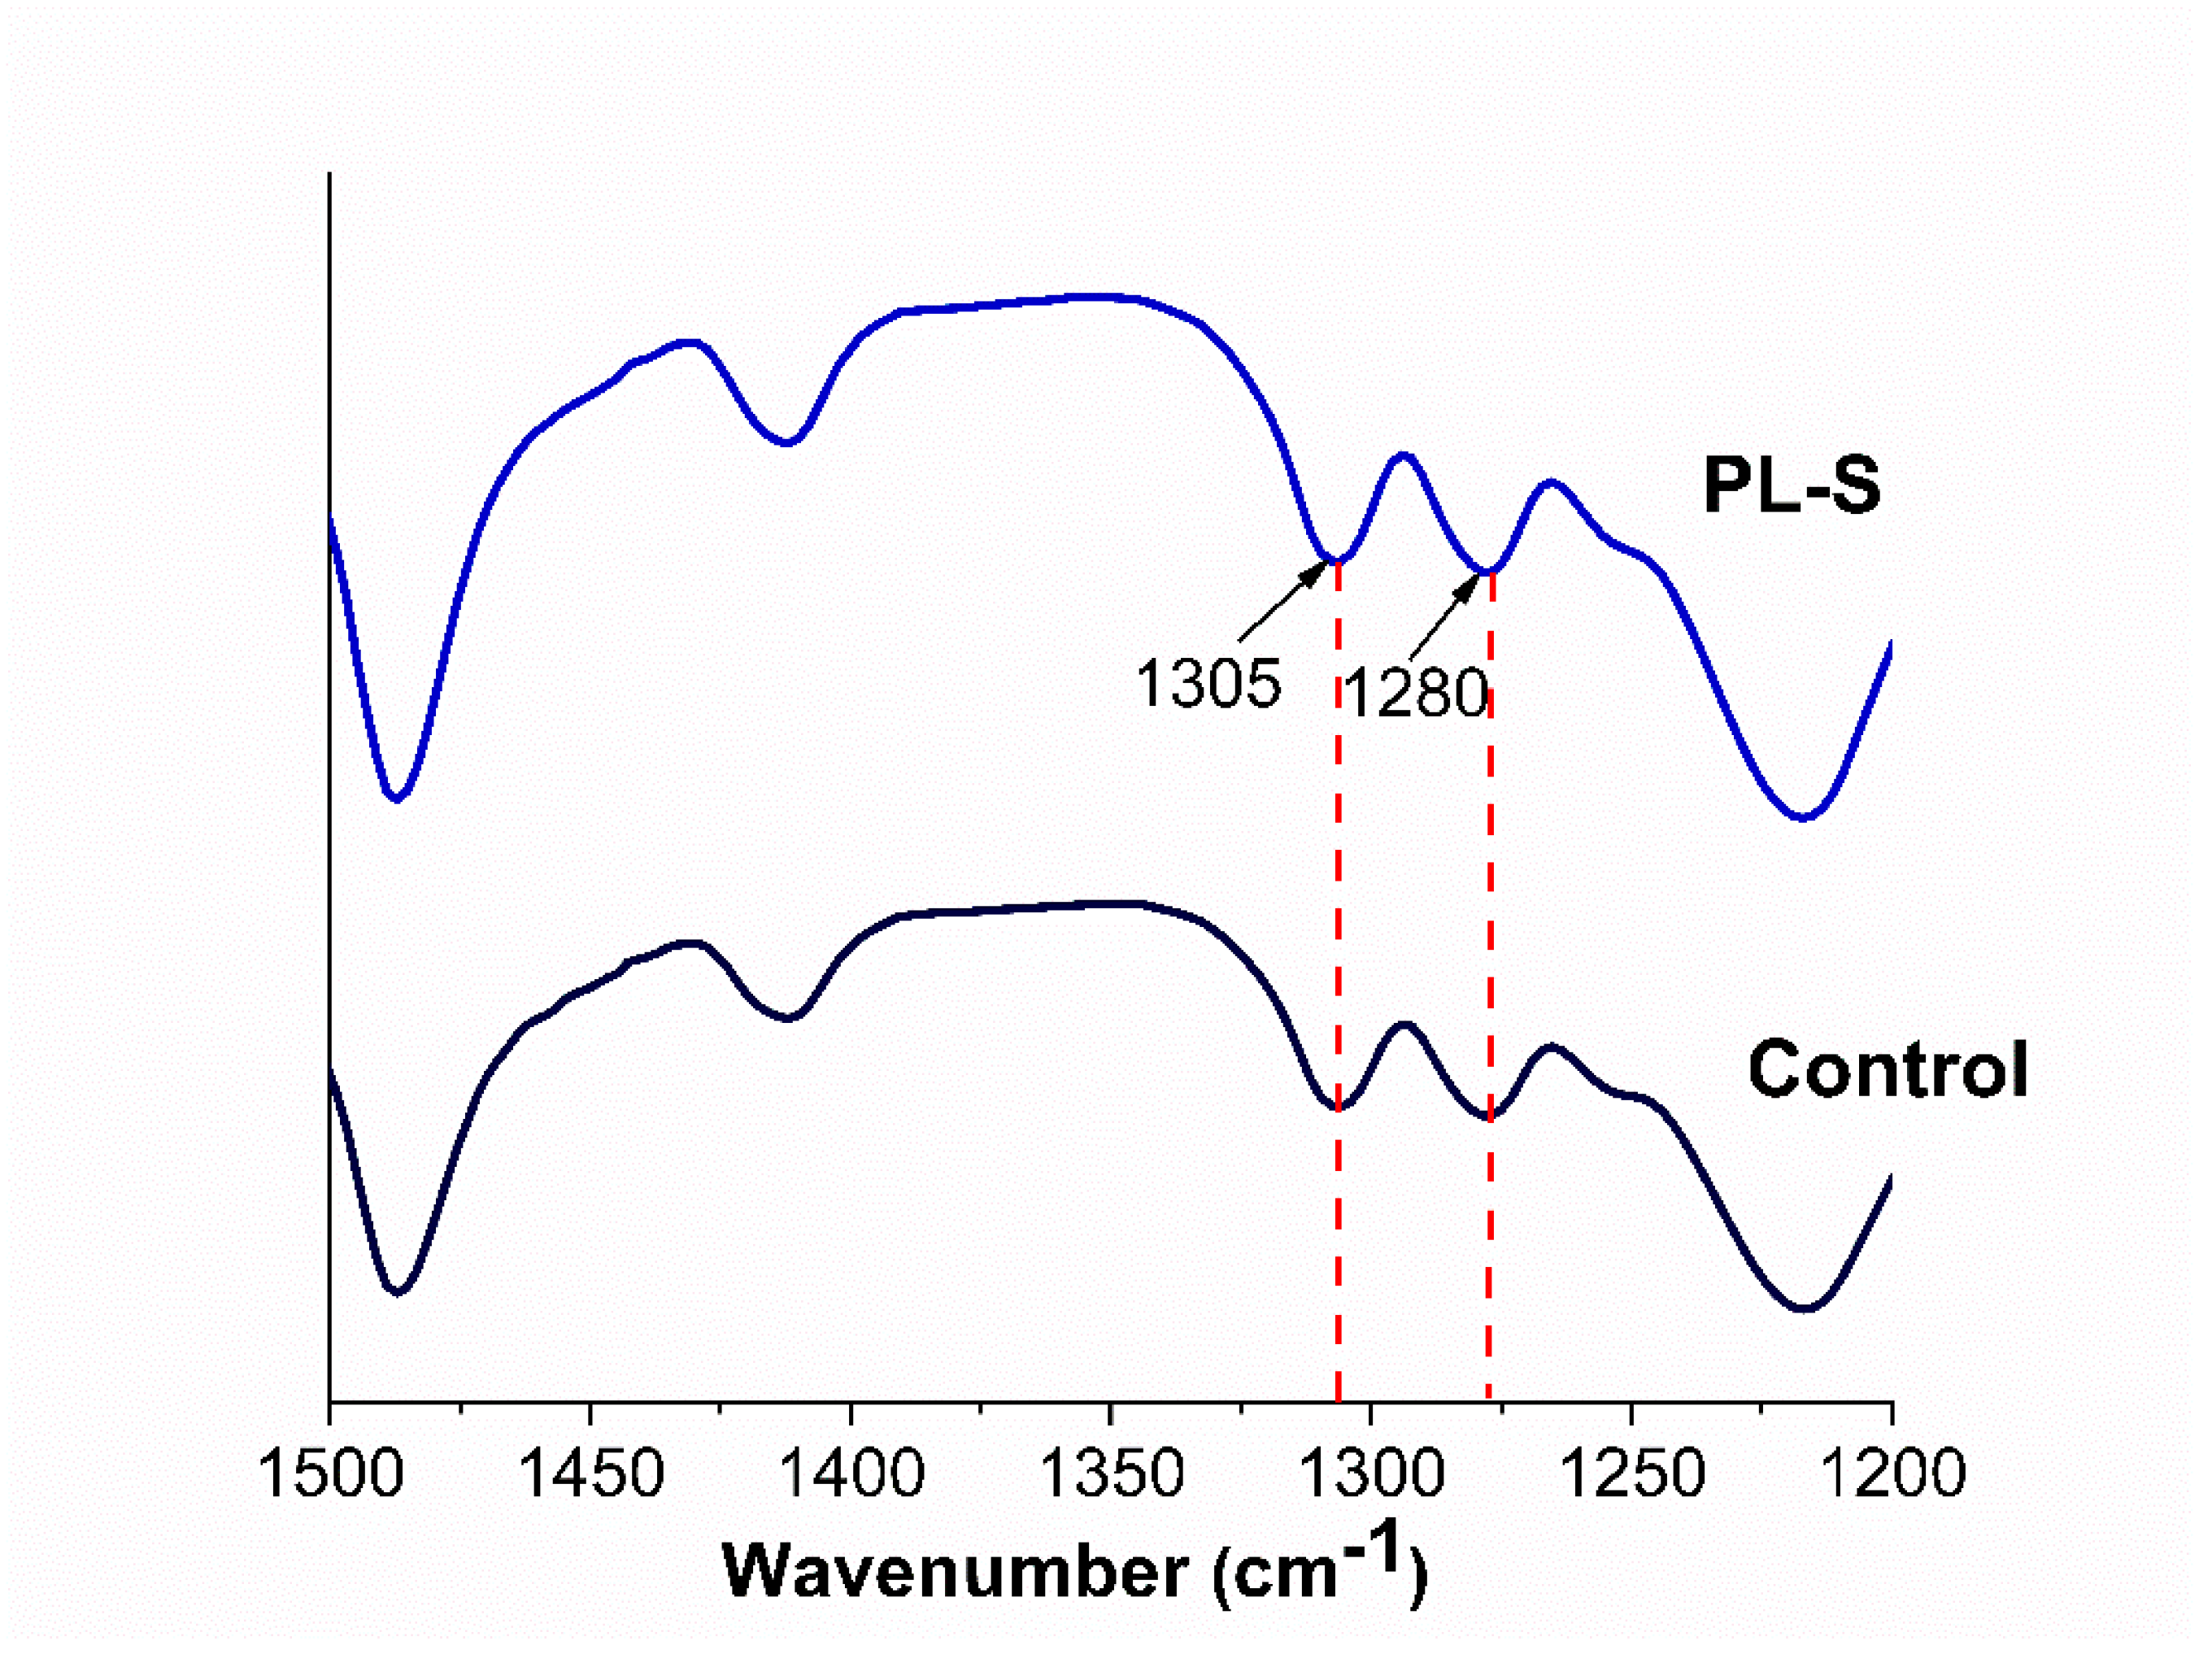
Figure 3.
SEM images indicating the surface PEEK topography for (a) Control, (b) PL-S, (c) Ca-S, and (d) PCa-S samples. Scale bar 1µm.
Figure 3.
SEM images indicating the surface PEEK topography for (a) Control, (b) PL-S, (c) Ca-S, and (d) PCa-S samples. Scale bar 1µm.
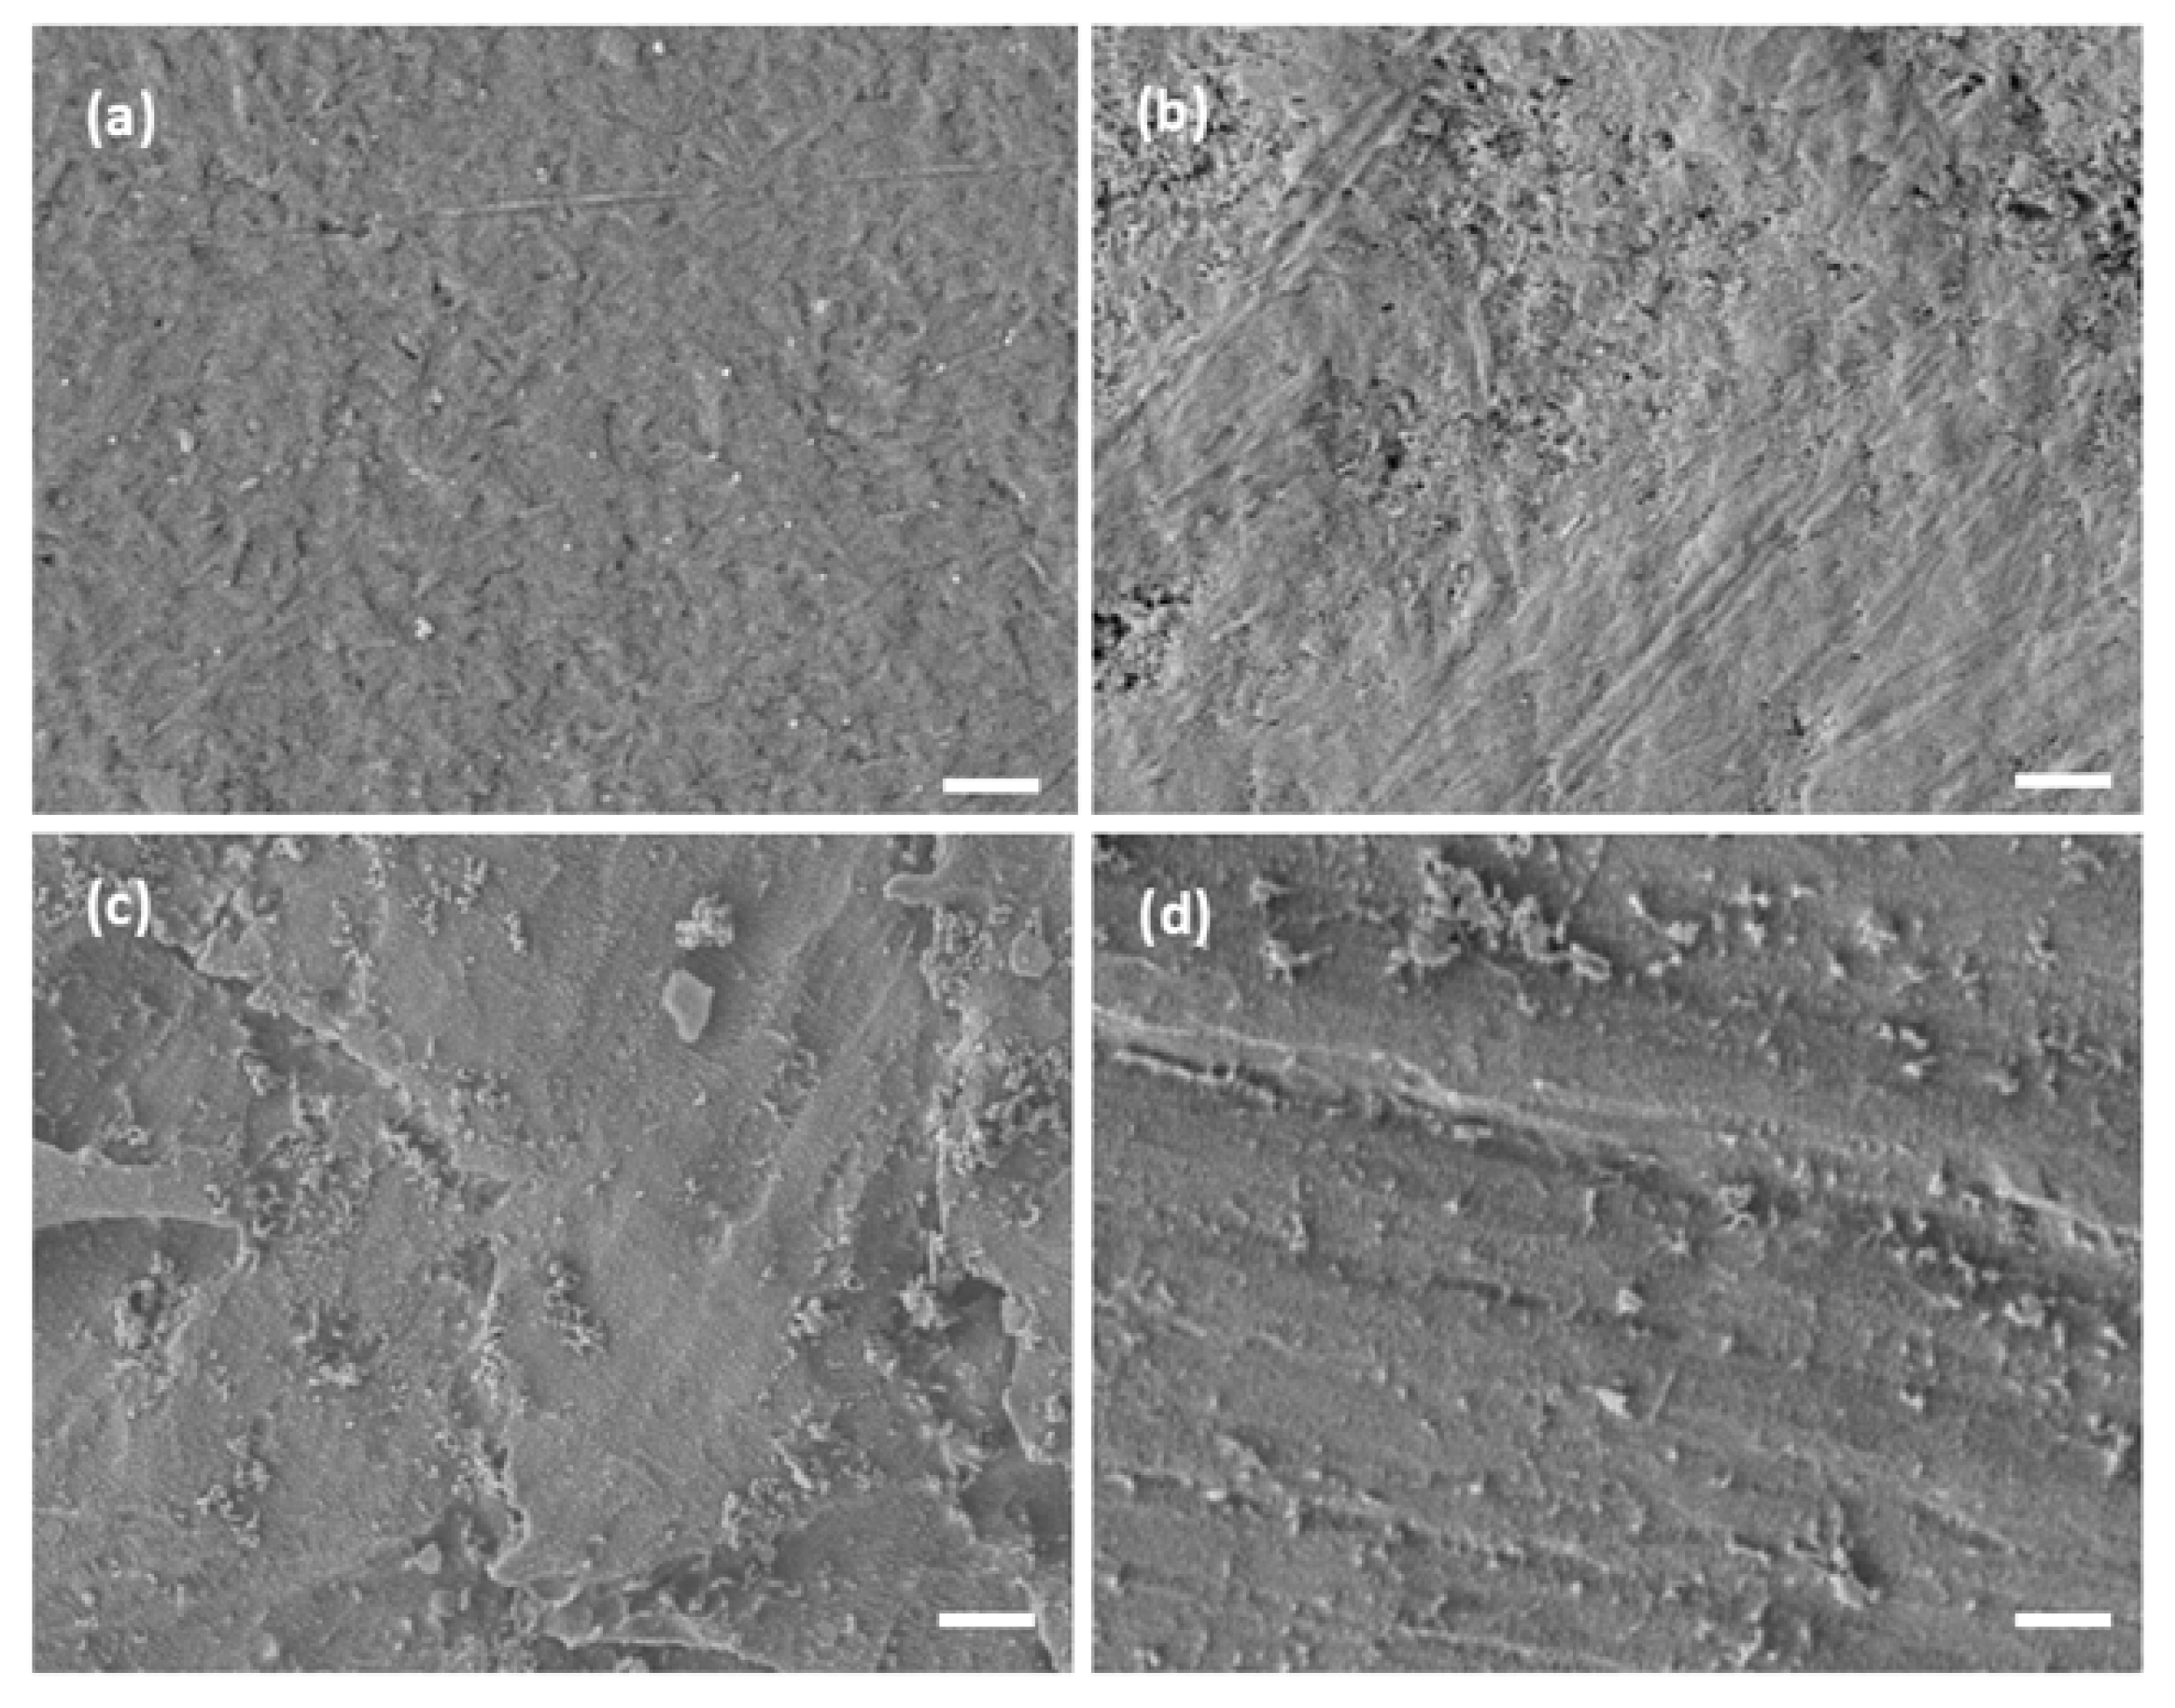
Figure 4.
XPS chemical analysis: (a) survey spectrum and peak representation for (b) Ca-S sample Ca2p, (c) PCa-S sample Ca2p, and P2p.
Figure 4.
XPS chemical analysis: (a) survey spectrum and peak representation for (b) Ca-S sample Ca2p, (c) PCa-S sample Ca2p, and P2p.
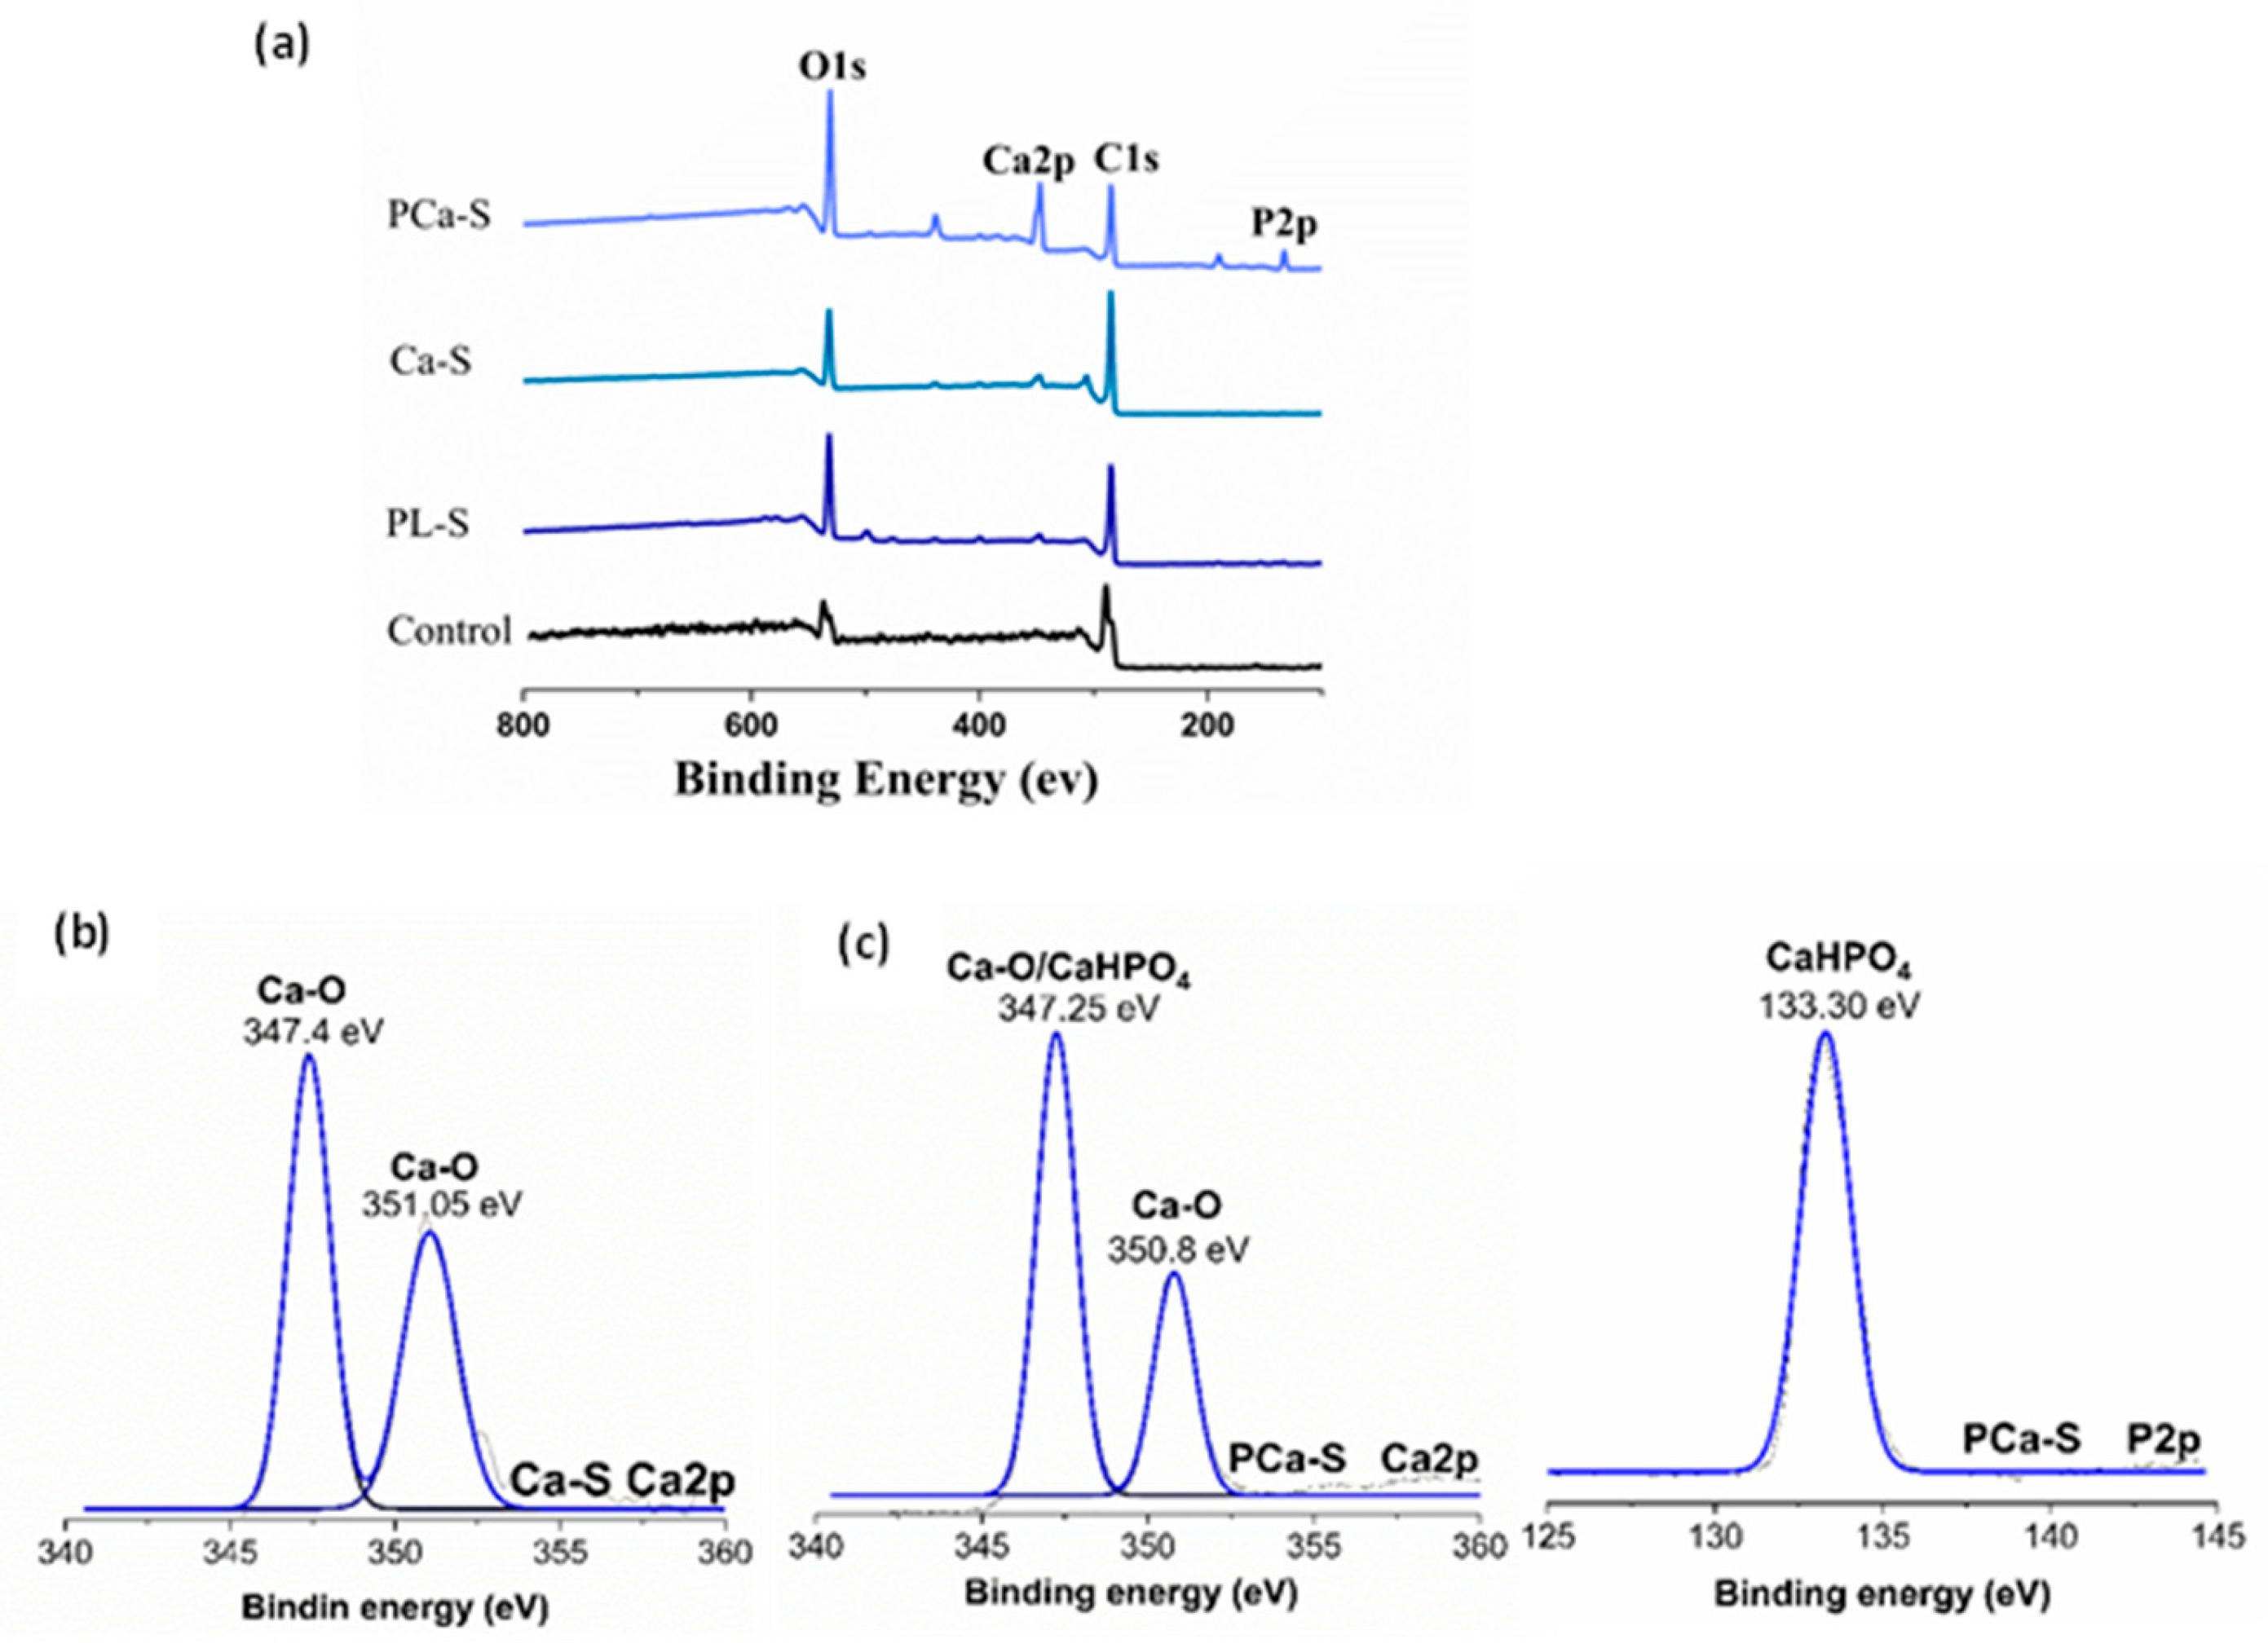
Figure 5.
Cell viability by MTT assay at 24h (a) Fibroblast and (b) Osteoblast cells. **** represents p < 0.0001 vs. Control. The bars denote the standard error.
Figure 5.
Cell viability by MTT assay at 24h (a) Fibroblast and (b) Osteoblast cells. **** represents p < 0.0001 vs. Control. The bars denote the standard error.
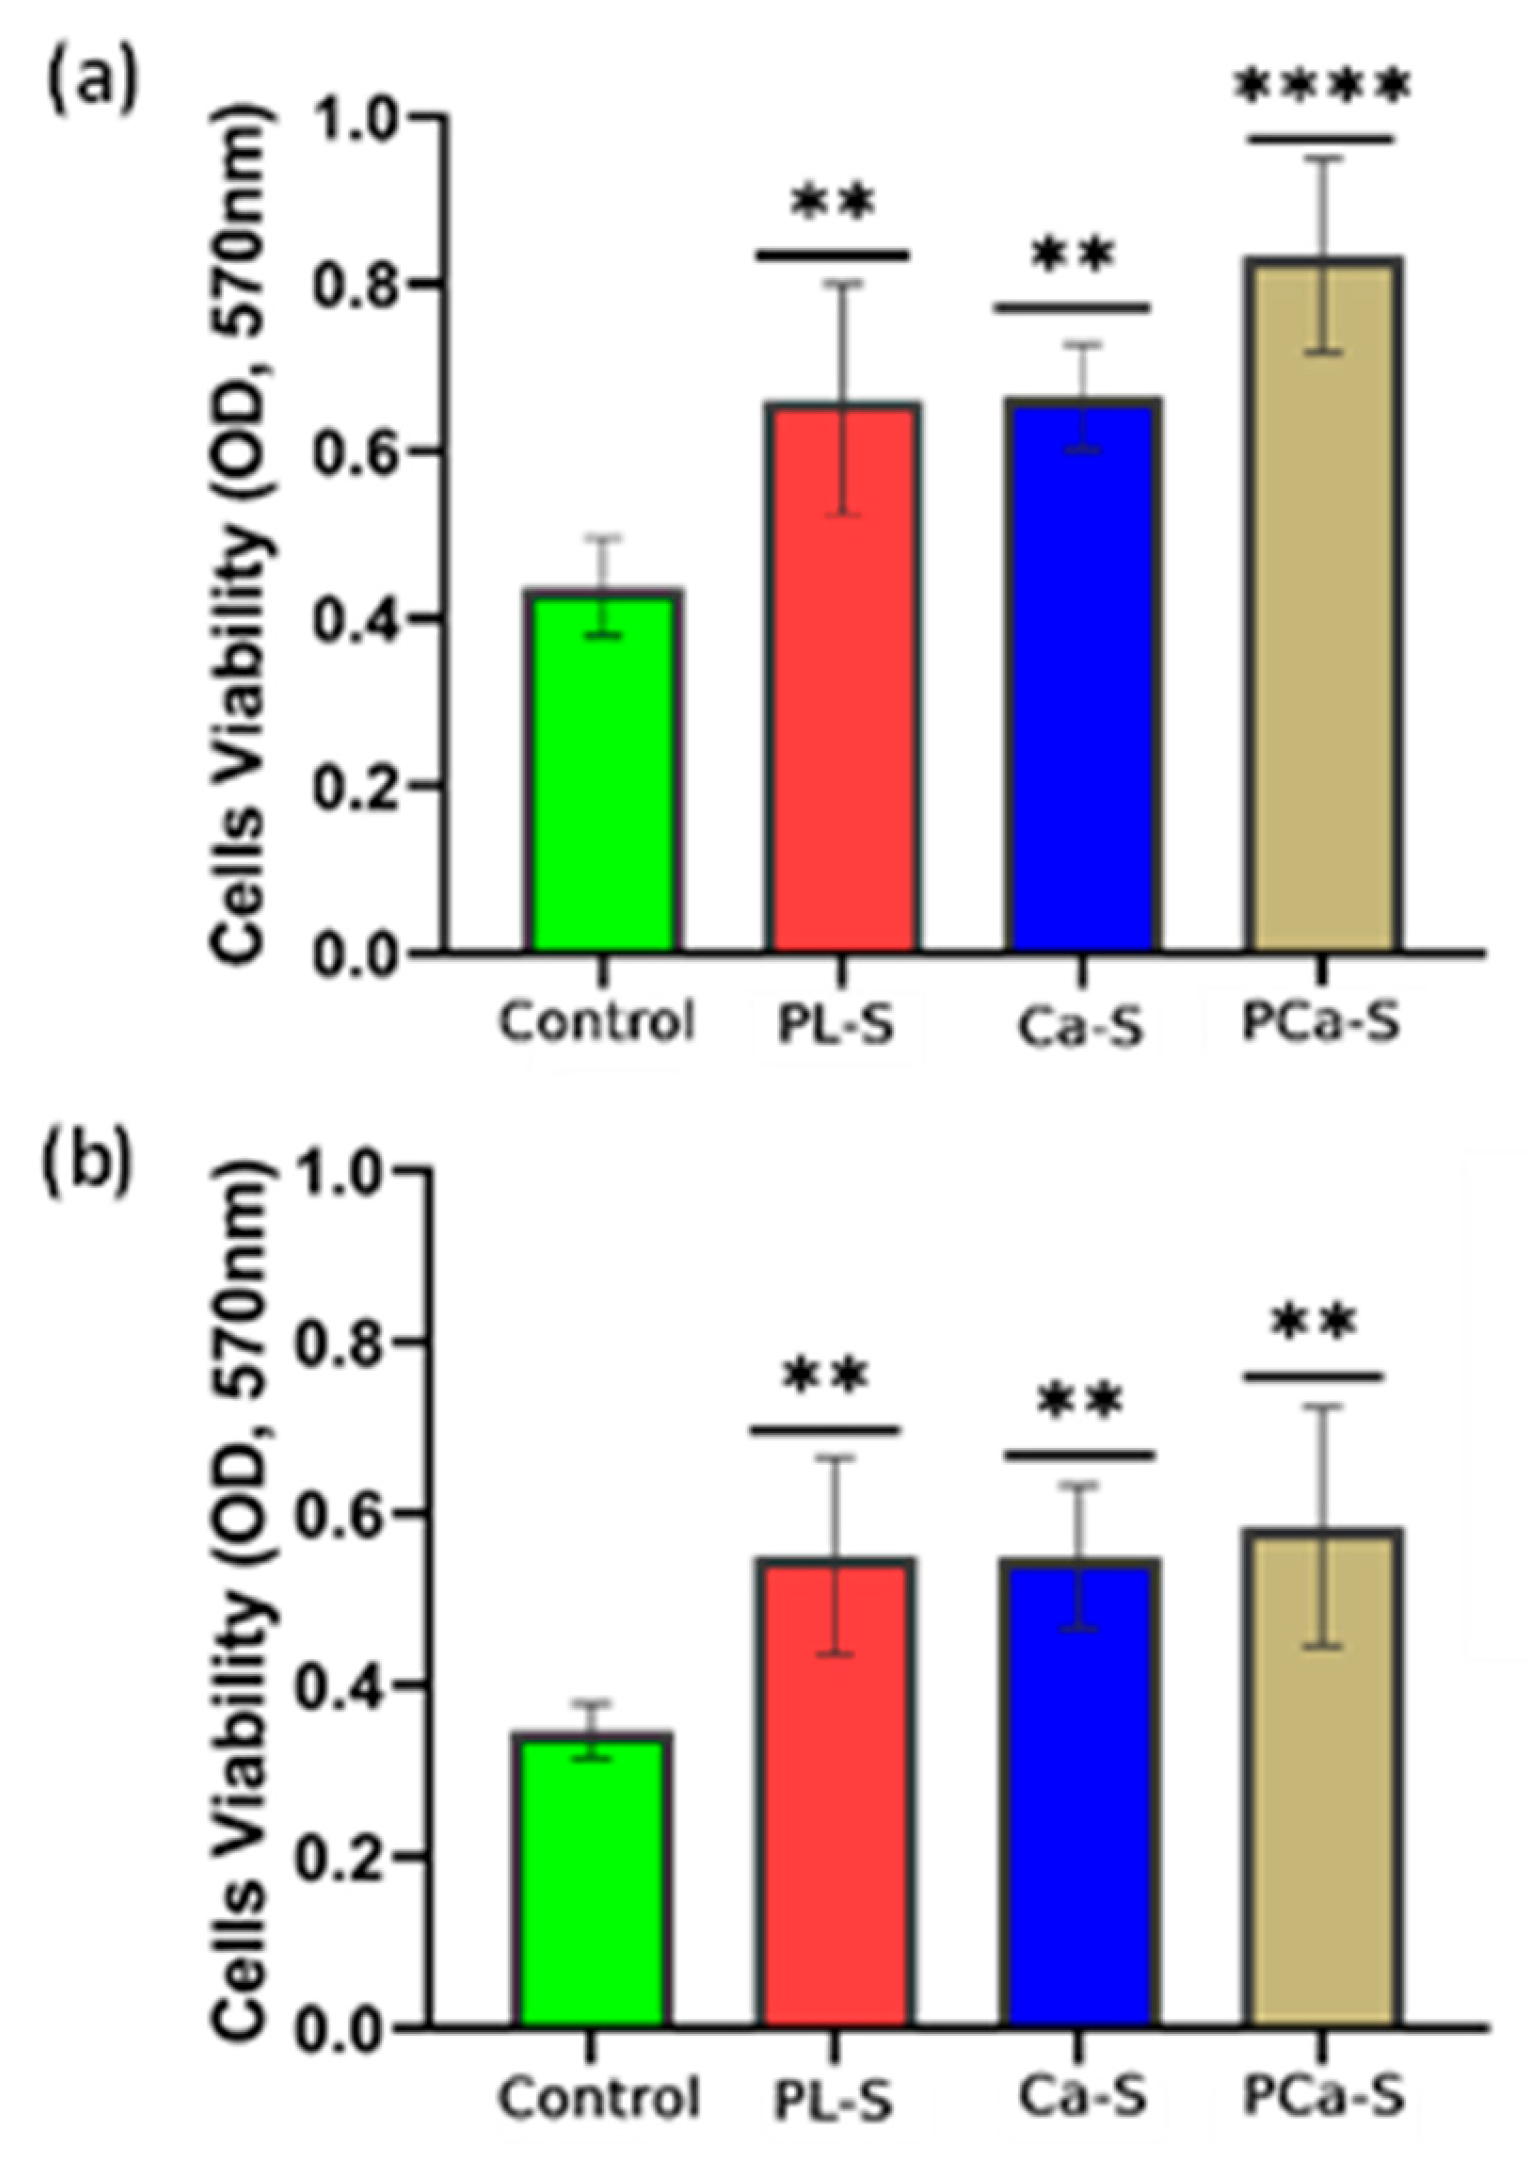
Figure 6.
(a) Fibroblast NIH/3T3 and (b) Osteoblast HOS cell proliferation analyzed at 24 and 96 h, (n = 2; 20 fields analyzed per sample). **** represents p < 0.0001 vs. Control.
Figure 6.
(a) Fibroblast NIH/3T3 and (b) Osteoblast HOS cell proliferation analyzed at 24 and 96 h, (n = 2; 20 fields analyzed per sample). **** represents p < 0.0001 vs. Control.
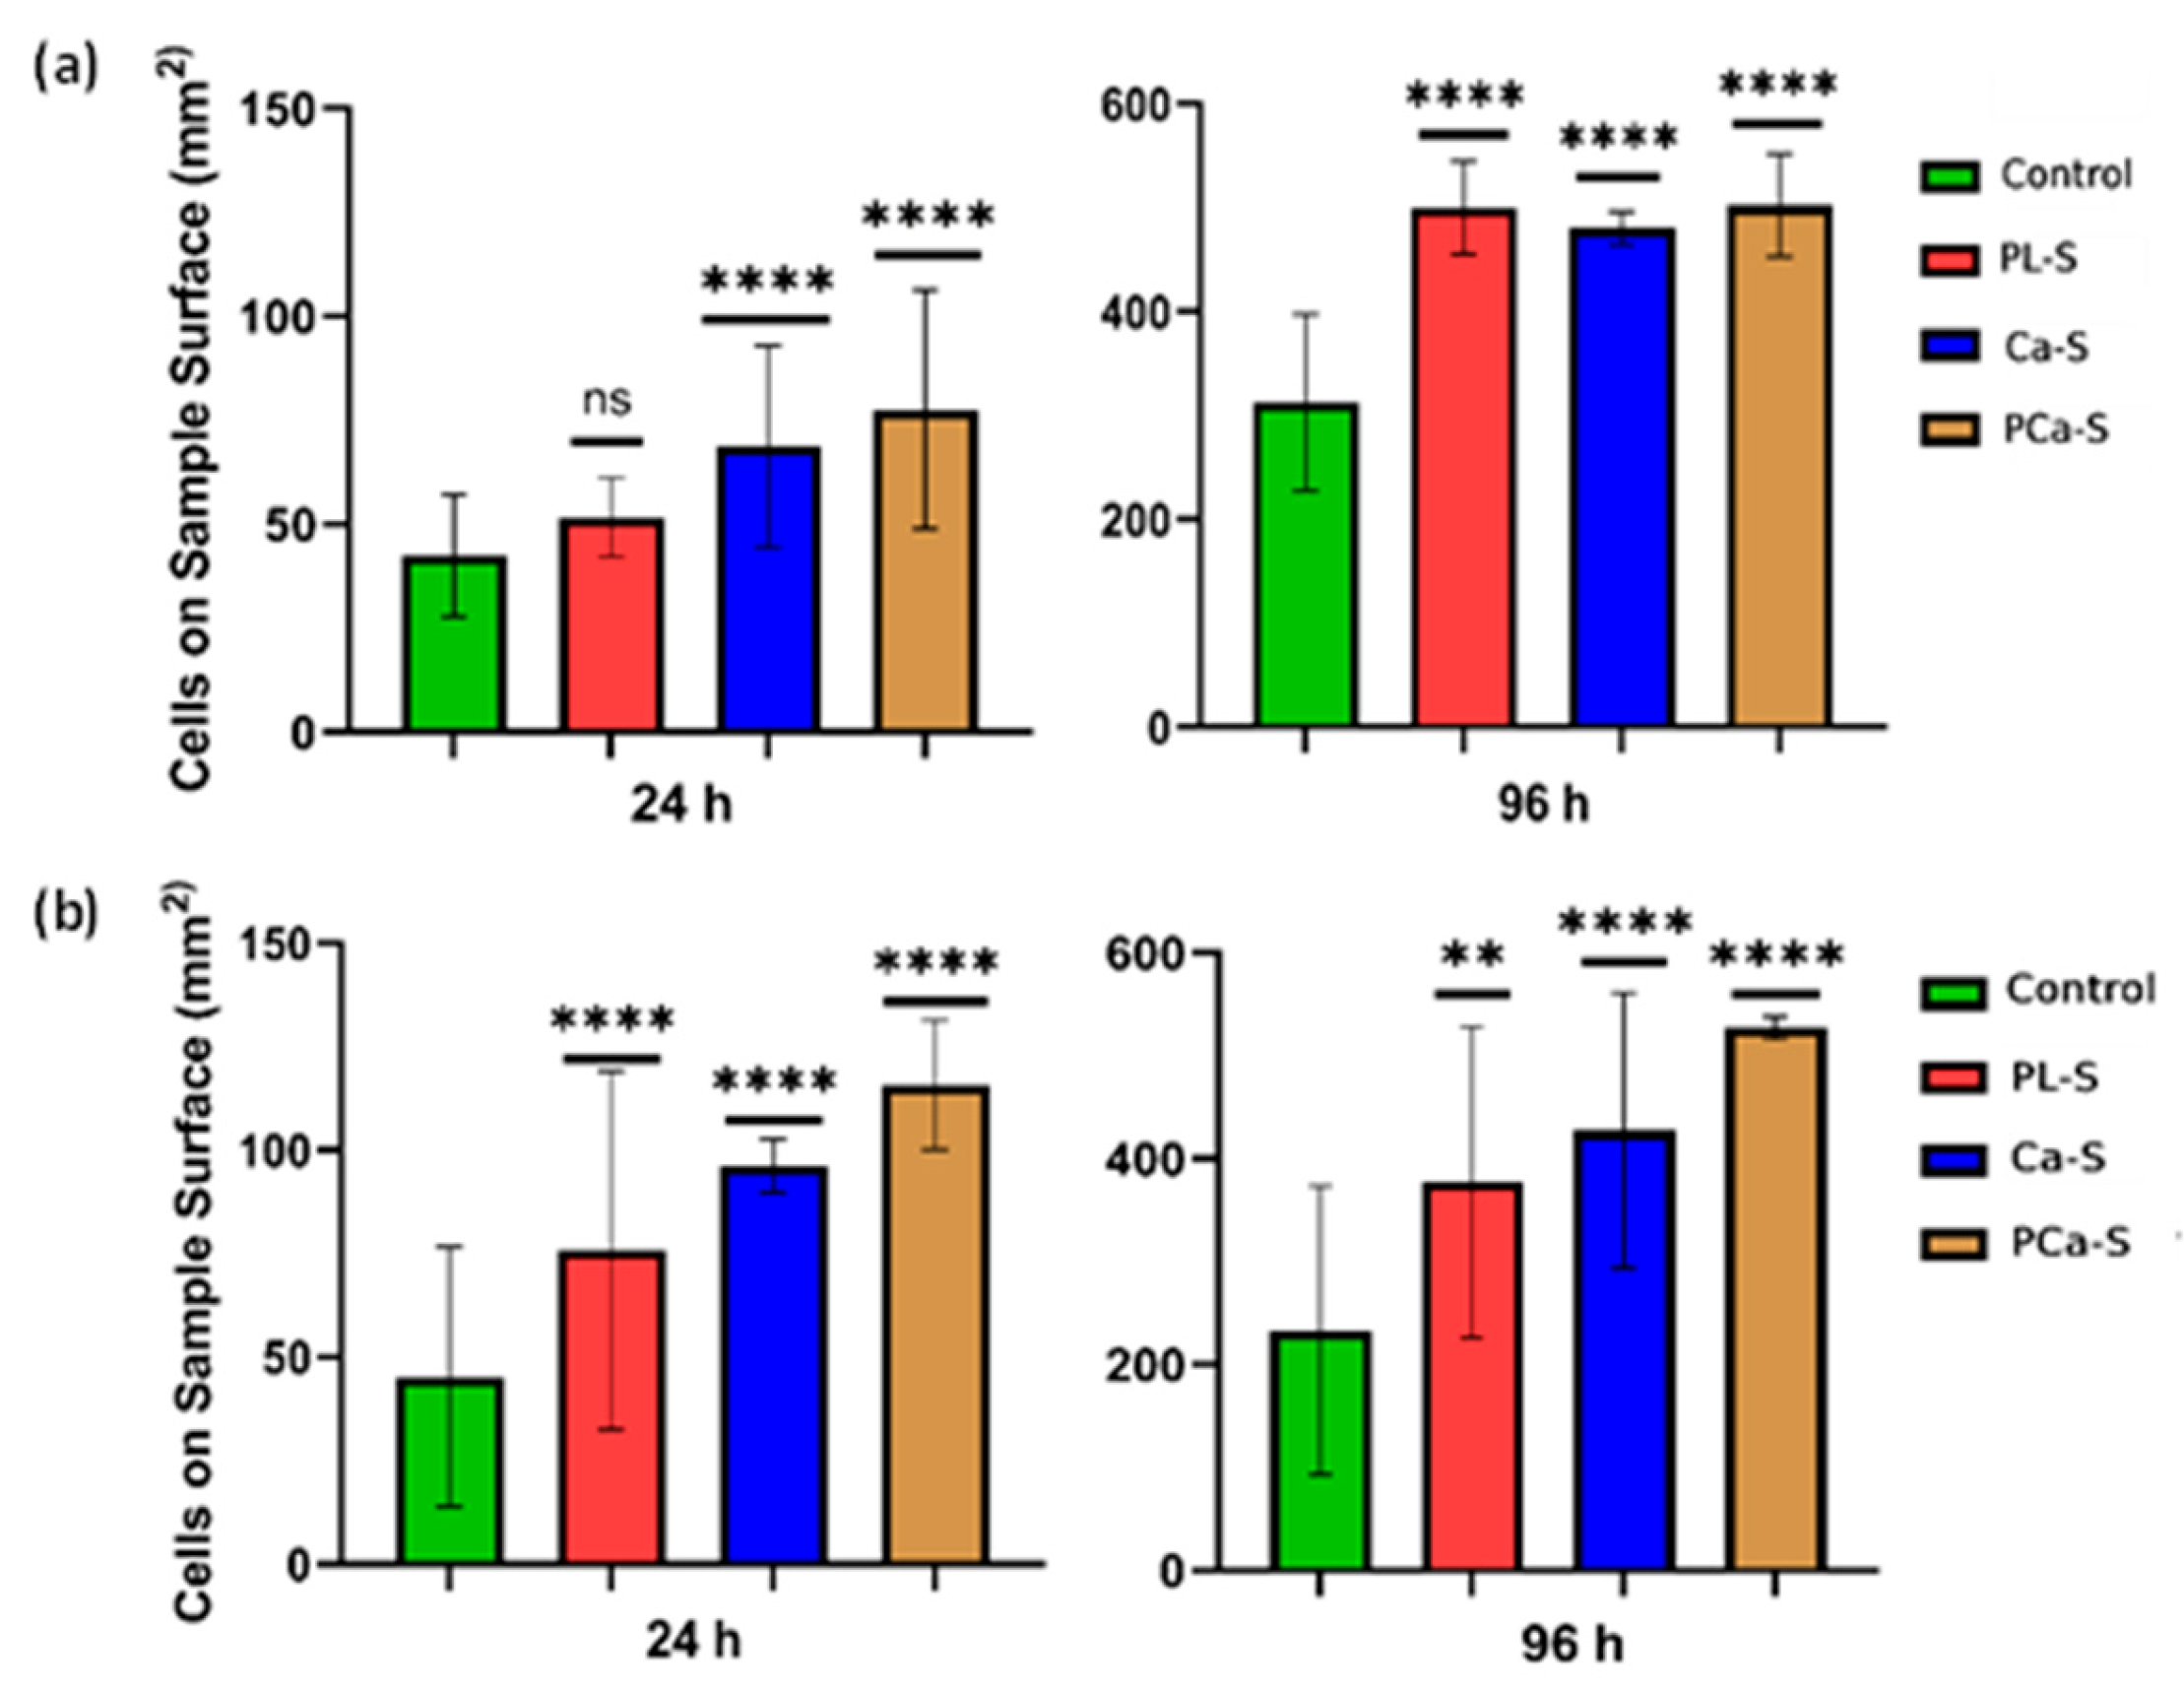
Figure 7.
Cell adhesion and spreading after 24 h. Nuclear and cytoskeletal structures were stained with Hoechst and Phalloidin, respectively. Bars are 20 µm.
Figure 7.
Cell adhesion and spreading after 24 h. Nuclear and cytoskeletal structures were stained with Hoechst and Phalloidin, respectively. Bars are 20 µm.
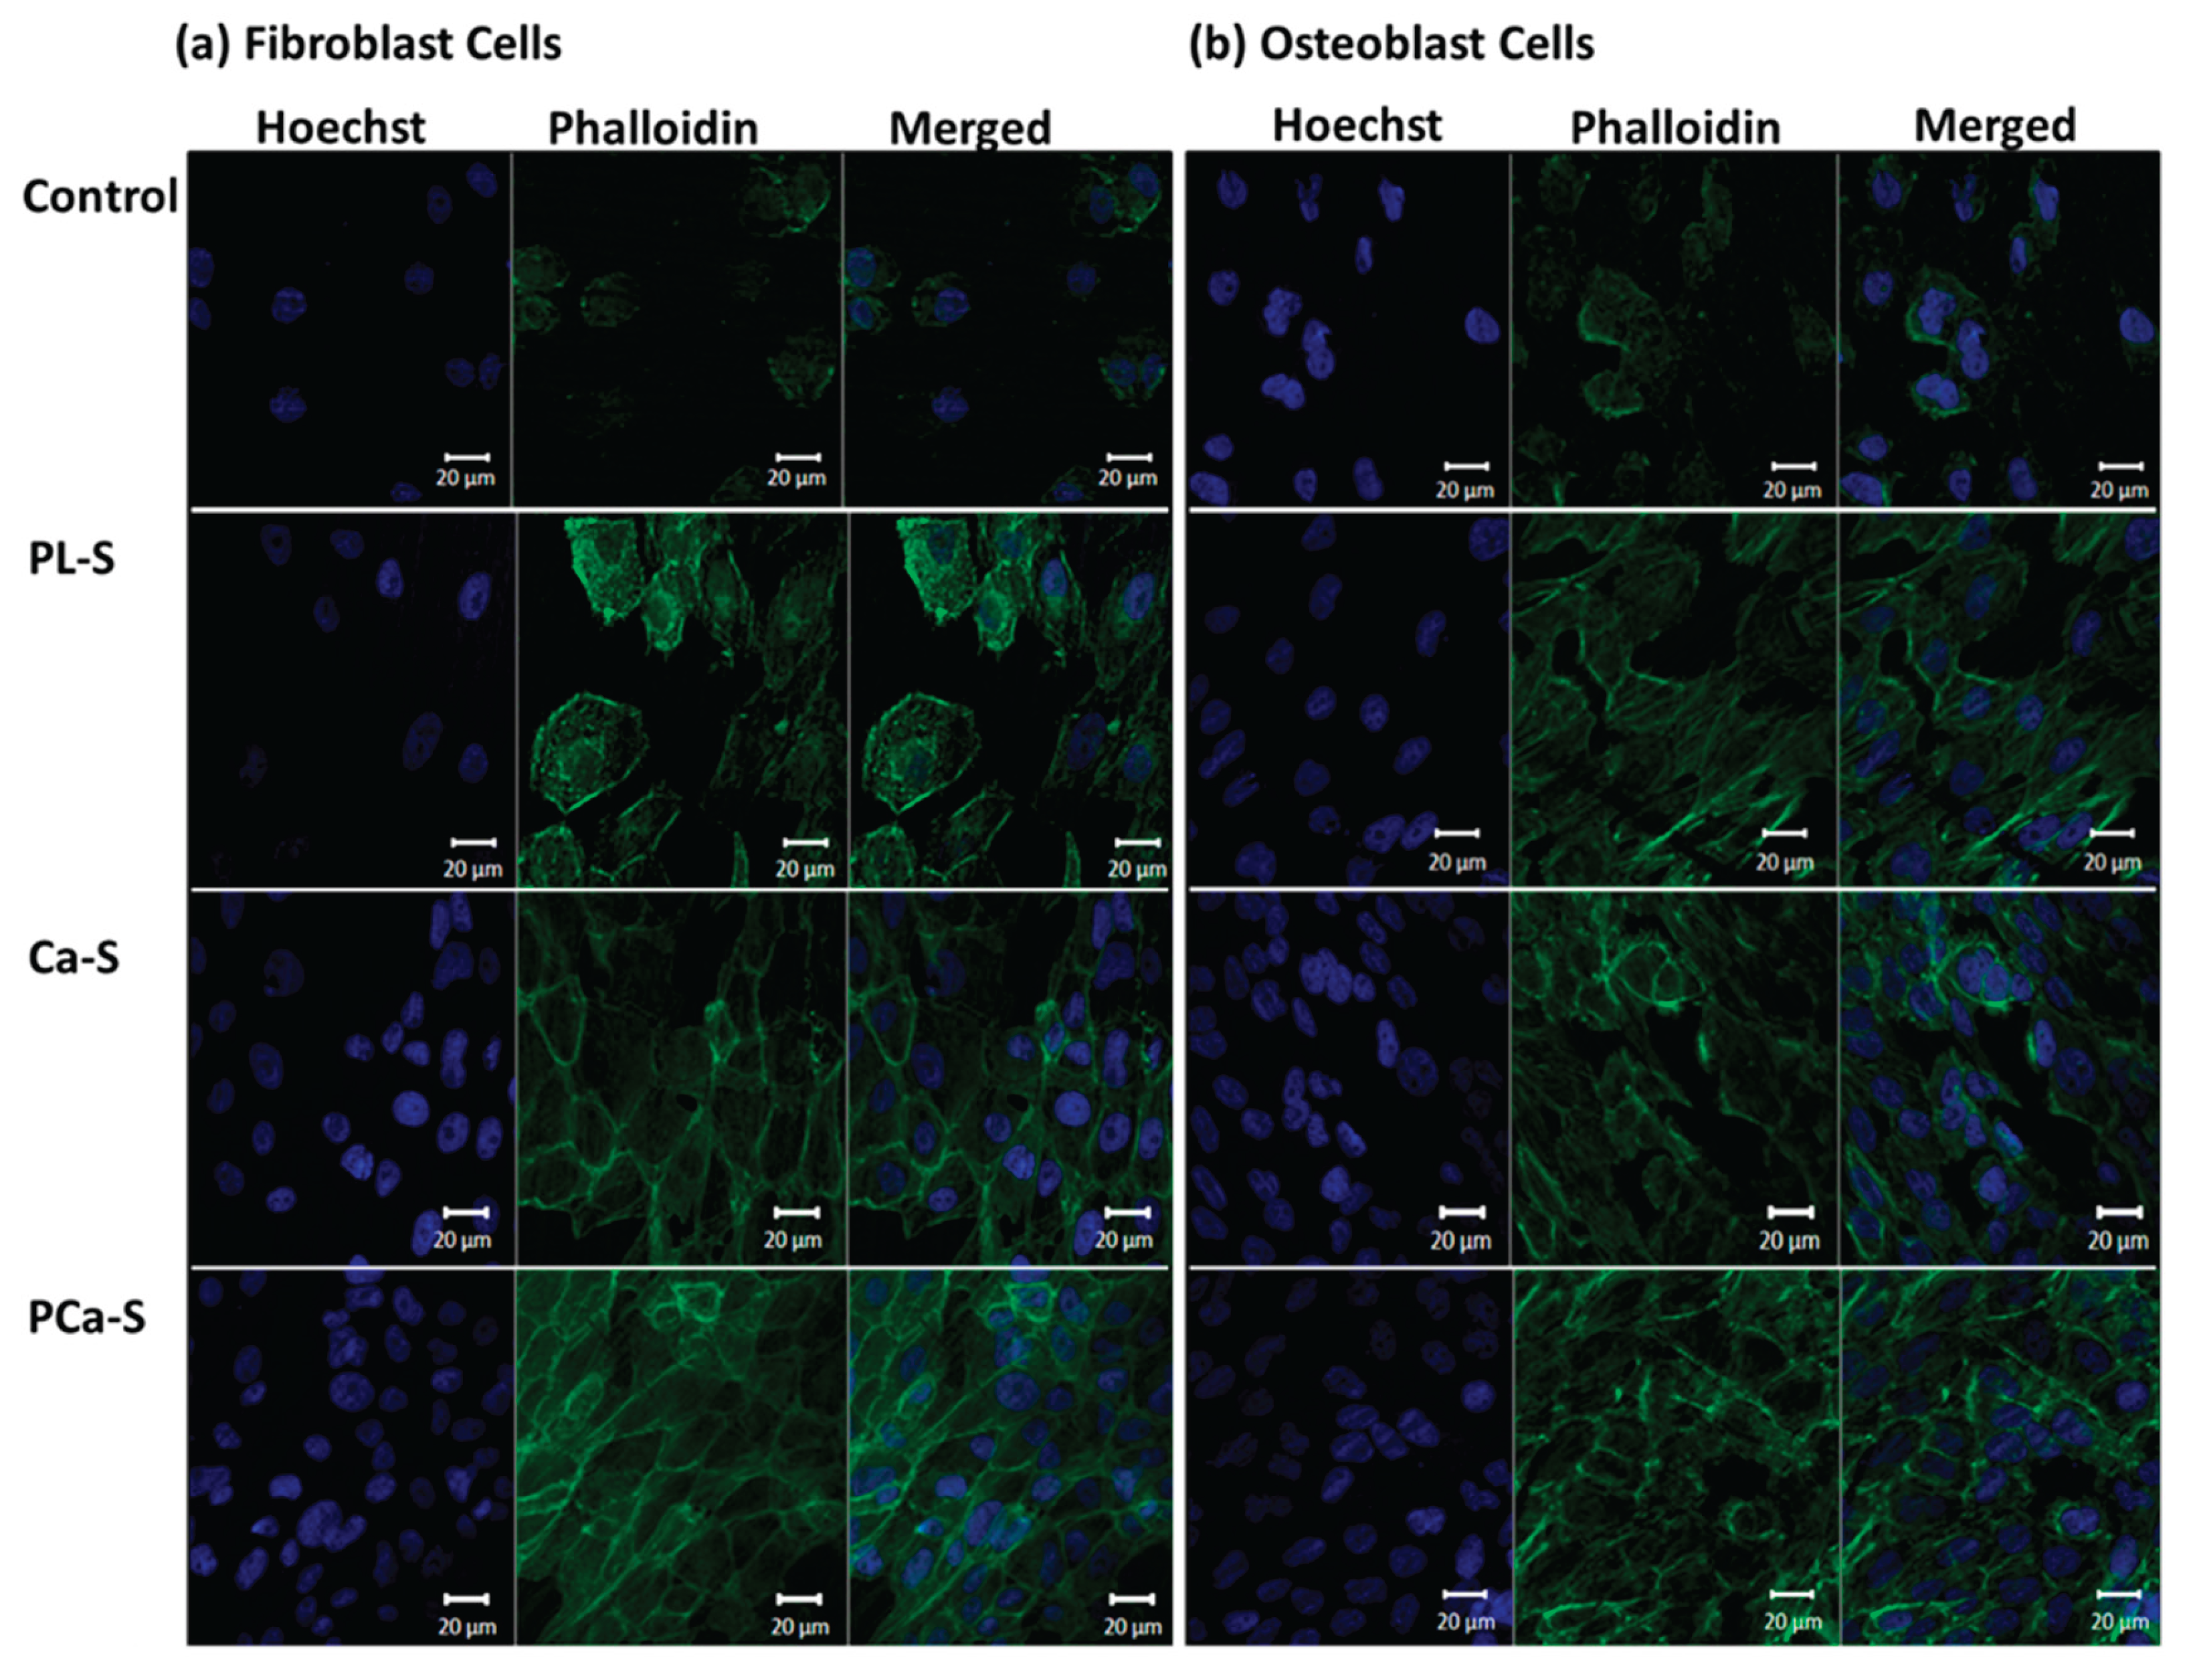

Table 1.
Sample labeling.
| Label | Name | Surface treatment |
|---|---|---|
| Control | Control sample | No surface treatment |
| PL-S | Plasma sample | Plasma activated surface |
| Ca-S | Calcium sample | Calcium functionalized surface |
| PCa-S | Phosphate and calcium sample | Phosphate and calcium functionalized surface |
Table 2.
Atomic percentage composition.
| Sample | C1s | O1s | P2p | Ca2p | Ca/P |
|---|---|---|---|---|---|
| P-P | 79.47±0.11 | 20.54±0.11 | |||
| PL-P | 73.27±3.62 | 26.73±3.62 | |||
| Ca-P | 72.69±4.69 | 24.92±3.63 | 2.38±1.12 | ||
| PCa-P | 50.5±3.03 | 34.83±1.52 | 6.47±0.56 | 8.20±1.07 | 1.26 |
Disclaimer/Publisher’s Note: The statements, opinions and data contained in all publications are solely those of the individual author(s) and contributor(s) and not of MDPI and/or the editor(s). MDPI and/or the editor(s) disclaim responsibility for any injury to people or property resulting from any ideas, methods, instructions or products referred to in the content. |
© 2025 by the authors. Licensee MDPI, Basel, Switzerland. This article is an open access article distributed under the terms and conditions of the Creative Commons Attribution (CC BY) license (http://creativecommons.org/licenses/by/4.0/).
Copyright: This open access article is published under a Creative Commons CC BY 4.0 license, which permit the free download, distribution, and reuse, provided that the author and preprint are cited in any reuse.


