
Submitted:
23 October 2025
Posted:
24 October 2025
You are already at the latest version
Abstract
This study introduces GAT-CAMDA, a novel framework for structural health monitoring (SHM) of composite materials under temperature-induced variability, leveraging the powerful feature extraction capabilities of Graph Attention Networks (GATs) and advanced domain adaptation techniques. By combining Maximum Mean Discrepancy (MMD) and Correlation Alignment (CORAL) losses with domain-discriminative adversarial layer, the framework achieves precise alignment of feature distributions across temperature domains, ensuring robust damage detection without relying on labelled target data. A bespoke data augmentation process extrapolates damage behaviour across unmeasured temperature conditions, addressing the scarcity of damaged-state observations. Hyperparameter optimisation via Optuna not only identifies optimal settings to enhance model performance, achieving a classification accuracy of 95.83% on a benchmark dataset but also illustrates hyperparameter significance for explainability. Additionally, the GAT architecture’s attention demonstrates the importance of various sensors, enhancing transparency and reliability in damage detection. The dual use of Optuna serves to refine model accuracy and elucidate parameter impacts, while GAT-CAMDA represents a significant advancement in SHM, enabling precise, interpretable, and scalable diagnostics across complex operational environments.
Keywords:
structural health monitoring
; composite materials
; graph attention networks
; domain adaptation
; temperature variability
; explainability
1. Introduction
Ultrasonic-guided waves (UGW), particularly Lamb waves, have become fundamental in SHM due to their ability to propagate over long distances with minimal attenuation, making them highly effective for inspecting large structures such as wind turbine blades and aerospace components. Their high sensitivity to both surface and internal defects facilitates robust damage detection when interacting with structural anomalies that alter propagation characteristics [1,2,3]. Piezoelectric sensors, pivotal in generating and detecting Lamb waves, offer a scalable and cost-effective SHM solution, providing widespread monitoring capabilities [4,5]. However, the multimodal and dispersive nature of Lamb waves introduces significant challenges in interpreting signals and accurately localising damage. These difficulties are compounded by environmental and operational variabilities (EOVs) such as temperature, humidity, and mechanical stress, which distort wave propagation and impair system reliability [2,6]. In composite materials such as Carbon Fibre-Reinforced Polymer (CFRP), the heterogeneity and anisotropy of the material further necessitate specialised techniques to manage failure modes, including delamination and matrix cracking [7,8,9,10].
1.1. Temperature-Induced Variability and Conventional Compensation Methods
Among the various EOVs, temperature changes can influence guided wave propagation by affecting wave speed, phase, and amplitude, potentially masking or mimicking damage signatures [11,12,13]. Numerous compensation strategies have been proposed to mitigate these effects. Scheerer and Lager [14] evaluated three temperature compensation techniques (Best Baseline, Signal Interpolation, and Frequency Shift), concluding that Frequency Shift was effective under moderate temperature variations (≤5°C). In addition, statistical modelling approaches have been applied to tackle temperature-induced variability. For example, Silva et al. [15] used auto-regressive models with cubic spline extrapolation to track damage progression under temperature fluctuations, although the approach required extensive baseline data and thus faced scalability limitations. Ren et al. [16] adopted Gaussian Process Regression with Monte Carlo sampling to quantify uncertainty in damage detection, demanding large datasets that may not be practical for real-time SHM. Complementing these statistical methods, semi-analytical and finite element (FE) modelling also feature prominently. Ren et al. [17] explored temperature compensation in composite structures through a semi-analytical FE model, validating their findings experimentally but relying on well-defined material and geometric properties. Similarly, Perfetto et al. [18] studied guided wave propagation under thermal loads using FE modelling, deriving time compensation factors that nonetheless require extensive experimental corroboration.
1.2. Data-Driven Methods for Temperature Compensation
Given the limitations of purely model-based and statistical strategies, data-driven methods are increasingly used to compensate for temperature effects. Ferreira et al. [19] proposed a Bayesian framework that integrates FE model updating with neural networks to produce synthetic datasets for temperature compensation, reducing reliance on physical experiments but introducing potential inaccuracies when dealing with poorly characterised conditions. Giannakeas et al. [20] presented an up-scaling methodology using Bayesian regression to extend temperature compensation factors across structural scales, thus improving damage detection reliability, though at the expense of comprehensive validation efforts. Meanwhile, Cheng et al. [21] combined fibre optic sensors with piezoelectric transducers in a hybrid system for guided wave monitoring, although the sensitivity adjustments required for fibre optic sensors add complexity to the system.
GATs have garnered particular interest for capturing intricate spatial-temporal dependencies in graph-structured sensor data [22,23]. Niu et al. [24], for instance, leveraged attention mechanisms within GATs to handle incomplete SHM datasets by accounting for spatial-temporal relationships among sensors. Zhao et al. [25] further demonstrated a virtual sensor for bearing load prediction using heterogeneous temporal graph neural networks, explicitly modelling sensor signal dependencies, and outperforming standard convolutional neural networks in load estimation tasks.
1.3. Transfer Learning for Mitigating EOVs in SHM
While data-driven models can capture complex wave behaviours, they often depend on large, high-quality labelled datasets that may not be available across different environmental regimes. Transfer learning (TL) therefore offers a promising solution, focusing on translating knowledge obtained in one domain to enhance performance in another [26]. Among TL methods, adversarial approaches such as Domain-Adversarial Neural Networks (DANN) operate by minimising discrepancies between source and target distributions, thereby generating domain-invariant features. Ozdagli and Koutsoukos [27] demonstrated this technique in SHM, achieving improved cross-domain damage detection. Other feature-based alignment methods have also emerged: Zhuojun et al. [28] used MMD to reconcile simulated and experimental Lamb wave data for precise damage localisation, and Wang et al. [29] combined MMD with techniques including Variational Mode Decomposition and Transfer Component Analysis (TCA) to boost damage detection performance. However, many of these studies do not explicitly address EOVs such as temperature.
CORAL offers another feature-alignment strategy, albeit less commonly applied to UGW-based SHM. Poole et al. [30] employed CORAL in a partial domain adaptation setting, illustrating the benefit of aligning source and target covariance matrices for population-based SHM. By normalising datasets to account for anticipated EOVs, CORAL mitigates negative transfer and class imbalance, thereby improving damage localisation even with limited target-domain data. These advances collectively illustrate how transfer learning can address data scarcity and ensure robust performance under varying environmental or operational conditions, making it an attractive approach for temperature compensation.
1.4. The Need for Explainability in ML-based SHM
Despite these advances in data-driven and transfer learning approaches, the opaque nature of many ML algorithms can hinder adoption in critical SHM tasks, where trust, interpretability, and actionable insights are essential. Explainable AI methods, including SHapley Additive exPlanations (SHAP) and Local Interpretable Model-agnostic Explanations (LIME), have been proposed to tackle the “black box” problem. Salih et al. [31] integrated SHAP and LIME into SHM workflows, with SHAP quantifying feature contributions and LIME providing localised signal interpretations. Tiwari et al. [32] harnessed SHAP in an ensemble approach for estimating shear strength in reinforced concrete, highlighting its utility in identifying sensor contributions. Azad and Kim [33] developed an explainable Vision Transformer for polymer composite diagnostics, employing attention mechanisms to highlight crucial decision regions, although at a substantial computational cost.
1.5. Main Contributions
This research addresses key limitations in the SHM of composite plates under temperature-induced EOVs through a novel framework, GAT-CAMDA. The main contributions are:
- Combines multiple temperature domains into a single target domain, improving generalisation and reflecting real-world variability for greater robustness and practicality.
- Integrates CORAL and MMD losses to align feature distributions across temperatures, explores CORAL’s effectiveness in SHM, and employs GATs to capture complex spatial-temporal dependencies in UGW data for accurate damage detection.
- Uses GAT attention weights to visualise and quantify sensor contributions, enhancing model transparency and providing valuable insights into sensor importance for both theoretical and practical SHM applications.
- Utilises hyperparameter optimisation with Optuna to achieve robust, generalisable unsupervised domain adaptation (UDA) without labelled target data, outperforming existing techniques in managing cross-domain temperature variations.
The novelty of this work lies in its ability to generalise across diverse temperature conditions by merging multiple temperature domains into a unified framework. In contrast to previous studies restricted to narrow or isolated settings, this approach more closely represents real-world operational variability. Furthermore, the thorough investigation of CORAL loss, an underexplored method in SHM applications, combined with the advanced feature extraction capabilities of GATs, marks a substantial step forward in aligning feature distributions and extracting discriminative patterns. By incorporating explainability through attention-weight visualisation and leveraging unsupervised optimisation with Optuna, the proposed framework not only enhances damage detection accuracy but also delivers a transparent and scalable solution, setting a higher benchmark in SHM under complex environmental conditions.
The remainder of this paper is structured as follows: Section 2 presents the proposed framework, detailing its methodological advancements along with the implemented data synthesising technique. Section 3 outlines the case study, including the dataset and experimental setup. Section 4 discusses the results and evaluates the framework's performance, and Section 5 concludes with key findings and future directions.
2. Materials and Methods
In this study, an SHM framework was designed to address the influence of temperature variations on damage detection in composite plates. The framework integrates domain-discriminative adversarial adaptation with MMD and CORAL losses to improve feature alignment between source and target domains. To compensate for the lack of data at different temperatures and for damaged plates, a data augmentation stage was performed by extrapolating the behaviour of damaged signals at target temperatures using the temperature dependence observed in healthy signals. Optimal hyperparameters were identified through an optimisation process using Optuna, with the objective of maximising classification accuracy during the target test phase. To improve the explainability of the framework, the contributions of various hyperparameters and the significance of individual sensors were calculated and visualised.
2.1. Graph Attention Networks
GATs were implemented as the feature extractor to capture both local and global relational structures within the input data. While conventional feature extraction methods excel at identifying localised patterns, they often struggle to comprehensively represent the complex interdependencies present in certain datasets. GATs address this challenge by employing attention mechanisms that dynamically adjust the weights of connections based on the significance of neighbouring features, thereby enabling a richer and more contextually informed representation. The process of a GAT can be summarised as [22]:
- Feature transformation: each node’s input feature vectors, , , undergoes a shared linear transformation:where is a learnable weight matrix; the transformed feature vectors , are then used in subsequent steps.
- Computation of importance scores: a self-attention mechanism computes unnormalised importance scores , quantifying the relevance of the -th node’s features to the -th node:in which, is a learnable parameter vector, denotes concatenation.
- Normalisation of attention coefficients: the scores are normalised using the softmax function to produce attention coefficients :
This ensures that the coefficients are comparable across the neighbourhood of node . On the assumption of a single layer feedforward neural network as the attention mechanism, , and the LeakyReLU (Rectified Linear Unit) as the activation function, the calculated coefficients using the attention mechanism can be shown as:
where is the transpose of attention mechanism, i.e., .
- 5.
- Feature aggregation: each node’s output feature is computed as a weighted sum of its neighbours’ transformed features:
In this equation, denotes an activation function (e.g., ReLU), and represents the refined feature for node .
- 6.
- Multi-head attention: to improve stability and expressiveness, multiple attention mechanisms (heads) are employed. Each head independently computes its own set of attention coefficients and aggregated features:here, denotes the number of attention heads, and represents concatenation; for the final layer, concatenation is replaced by averaging:
Figures 1-a and 1-b present the mentioned above attention mechanism, e.g., and the multi-head attention when there are four heads, i.e., by node 1 and its neighbour nodes, respectively.
In Figure 1-b, each line style and colour present independent (here 4) attention calculation.
2.2. Maximum Mean Discrepancy
The MMD loss quantifies the distance between the average feature representations of the source and target domains within an expanded, high-dimensional feature space. This metric is pivotal in evaluating how effectively the feature distributions of the two domains align, which is essential for successful domain adaptation. The MMD loss can be computed as [34]:
in which and represent the sets of features from the source and target domains, respectively. The function maps these features into a higher-dimensional feature space, and and are the number of samples in each domain.
Mapping the features into a higher-dimensional space, MMD loss effectively captures more intricate patterns and discrepancies between the domains; a lower MMD loss indicates a greater similarity between the domains, which is indicative of improved domain adaptation performance.
When applying MMD, it is essential to select an appropriate kernel type, such as linear or Radial Basis Function (RBF). Specifically, for RBF kernels, adjusting the Gamma parameter is crucial, as it governs the kernel’s bandwidth and subsequently influences the sensitivity of the MMD measure to discrepancies in feature distributions.
2.3. Correlation Alignment
The CORAL loss functions as a metric for evaluating the alignment between two domains by quantifying the discrepancies in their feature covariance matrices. Within the scope of domain adaptation, it is employed to synchronise the data distributions of the source and target domains, thereby reducing statistical variations to enhance generalisation. By minimising this loss, the features that are learned become more consistent across both domains, thereby increasing the prediction accuracy for the target domain. The central concept of CORAL loss involves addressing domain shift by aligning second-order statistics, specifically through the minimisation of the Frobenius norm of the difference between the covariance matrices of the source and target domains. The CORAL loss function can be expressed as [35]:
where and denote the covariance matrices of the source and target features, respectively, represents the dimensionality of the features, and refers to the Frobenius norm. CORAL loss can be computed on a per-class basis or as an overall measure. Typically, the aggregate CORAL loss is more indicative, as it captures the general alignment across all classes, thereby ensuring that the adaptation generalises well across the entire domain rather than merely fitting specific classes.
2.4. Domain Adaptation
The domain adaptation framework in this study integrates damage classification and domain discrimination classifiers; the damage classification unit predicts fault classes, while the domain discriminator determines whether input data come from the source or target temperature. The strategy employs adversarial training with discrepancy metrics, specifically MMD and CORAL. A Gradient Reversal Layer (GRL) is used between the feature extractor and domain discriminator; during the forward pass, the GRL acts as an identity layer, but during backpropagation, it reverses the gradients by -1. The total training loss comprises weighted losses from damage classification, domain discrimination, MMD, and CORAL, expressed as:
where , , , and are the assigned weights to the damage detection (), temperature discriminator (), MMD (), and CORAL losses (), ordinary. It is worth mentioning that is equivalent to the adversarial loss, i.e., GRL. GATs are the chosen feature extractors, as illustrated in Figure 2, which schematises the framework's structure for both domain adaptation and damage detection.
Each training iteration involves forward and backward propagation. In the forward pass, data from both domains pass through the feature extractor to produce embeddings, which then enter the damage classifier and temperature discriminator. The GRL aids in ensuring that these embeddings do not reveal their domain origin to the discriminator. The MMD and CORAL losses are also calculated once per iteration to minimise discrepancies between feature distributions from different domains.
Throughout the backward pass, the combined losses update the model parameters; parameter controls the GRL's effect, starting small to ensure stability and increasing progressively, following a sigmoidal adjustment defined as:
in which , is the maximum value of , and is the total number of training epochs. This method ensures gradual and effective domain adaptation while maintaining the utility of the features for fault classification.
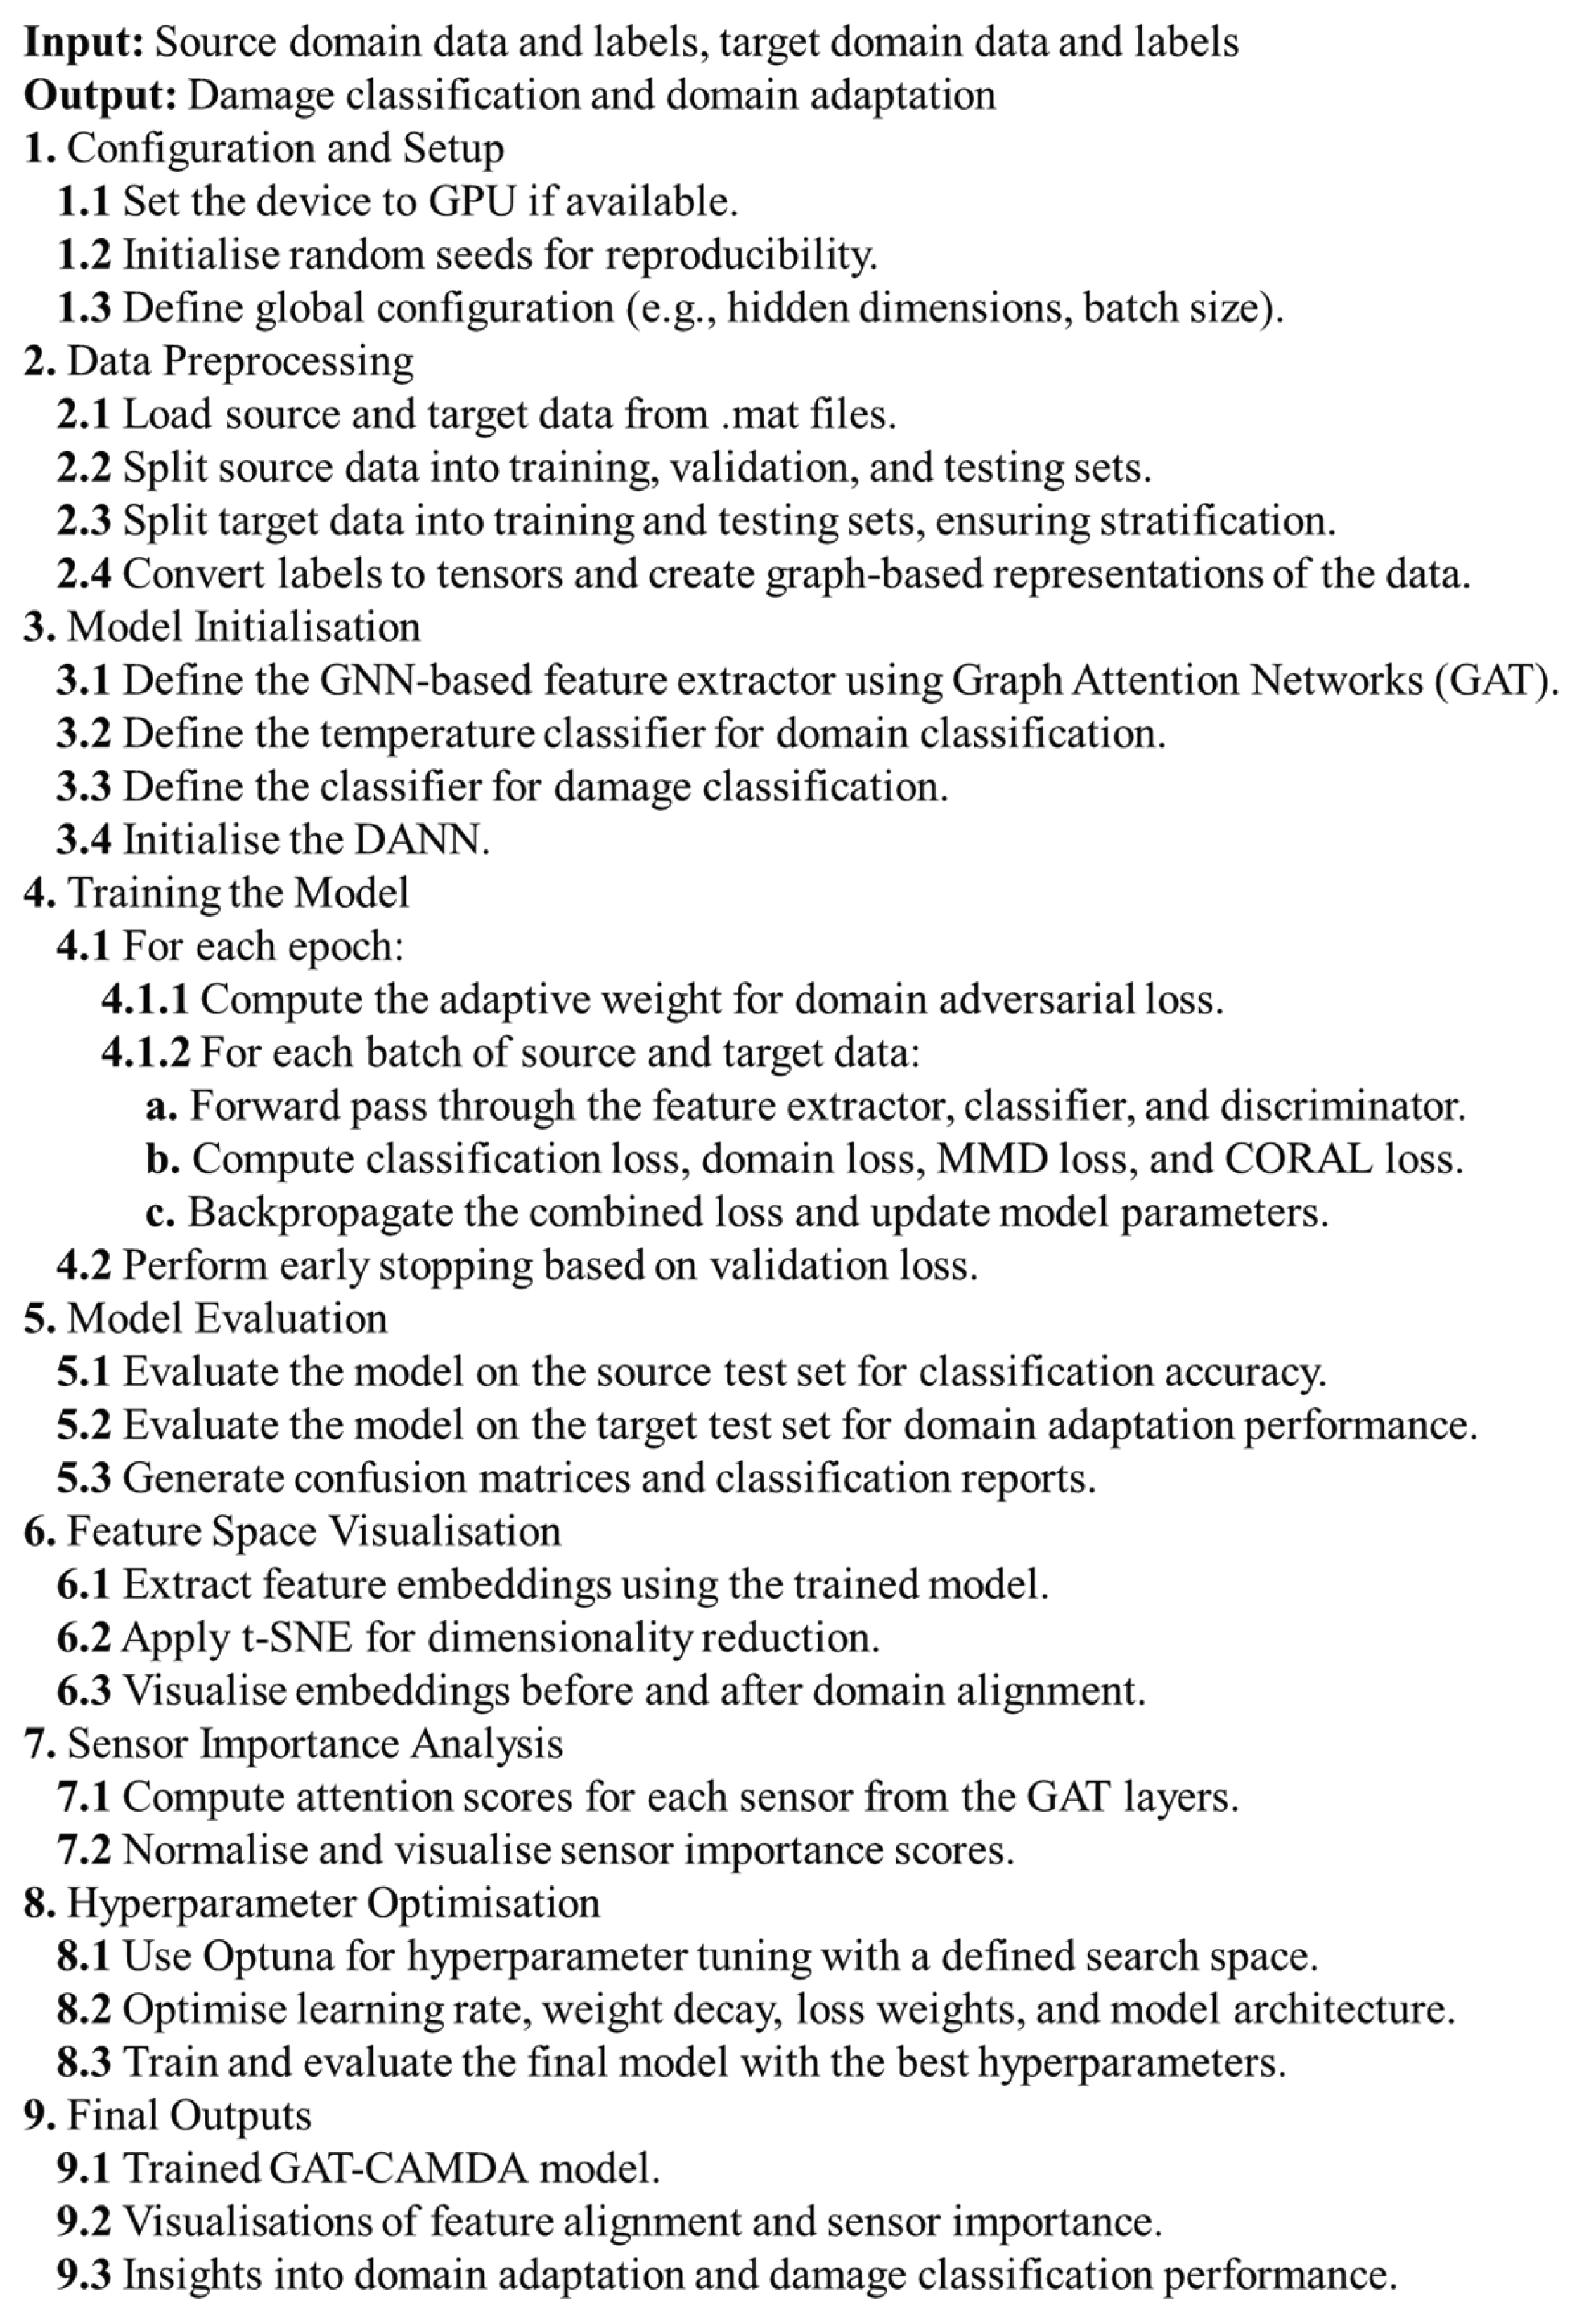
Designed as a UDA framework, GAT-CAMDA does not use the labels from the target domain observations during the process. Additionally, given that there are multiple target domains, i.e., signals recorded at various temperatures these are consolidated into a single target domain to further assess the generalisability of the framework. Algorithm 1 denotes a pseudocode for GAT-CAMDA.
The damage classifier consists of 3 blocks, i.e., input, hidden, and output blocks, each of which is composed of various layers such as linear layers, batch normalisation, dropout, among others. Figure 3 presents a schematic of this neural network.
Structuring an overly complex damage classifier in domain adaptation tasks can lead to overfitting to the source domain. Consequently, it is crucial to establish a trade-off between the model's complexity and its capacity to generalise effectively to target domains. This balance ensures that the classifier maintains robust performance across diverse domains without being unduly influenced by the intricacies of the source data. As a result, a simple structure was chosen as the classifier in GAT-CAMDA.
The domain discriminator, i.e., the temperature detection network, on the other hand, consists of 5 blocks. Each block comprises a linear layer followed by a LeakyReLU activation to introduce non-linearity and mitigate the dying ReLU problem. Additionally, appropriate dropout layers are incorporated for regularisation to prevent overfitting. The final block maps the transformed features to domain-specific logits, enabling accurate classification between source and target domains.
| Algorithm 1. GAT-CAMDA Framework for SHM. |
 |
2.5. Data Synthesising
As will be shown in the following section, the employed dataset contains observations for all health states at a baseline temperature (, e.g. 30°C), whilst for the remaining temperatures only healthy measurements are available. To address the lack of the data at other temperatures and for the damaged plates, a data augmentation stage was applied. The methodology extrapolates the behaviour of damaged signals at new target temperatures () by leveraging the temperature dependence observed in healthy signals.
First, the data for the healthy and damaged plates were separated based on their labels, ensuring a clear delineation of reference (healthy) and target (damaged) conditions. The average healthy response () was computed for each available temperature ; a spline interpolation function was then fitted to these mean signals, providing a continuous approximation of () across the temperature range. Using this interpolation, the mean healthy signal at the target temperature () was estimated as:
To derive the temperature-specific scaling factor for the damaged data, the ratio between the mean healthy signals at the target and baseline temperatures was employed:
This scaling factor was then applied to the damaged signals at the baseline temperature,, to generate the corresponding signals at the target temperature. A small stochastic term , drawn from a Gaussian distribution with an incredibly low variance, was included to introduce realistic variability. Thus, the synthesised damaged data were obtained as:
Following this procedure, new labels were assigned to the synthesised datasets to maintain consistency with the classification scheme.
2.6. Hyperparameter Optimisation
The optimisation process in the case study applies Optuna to maximise the classification accuracy on the target domain, which directly aligns with the overarching objective of UDA in the domain-discriminant adversarial network. Optuna employs the Tree-structured Parzen Estimator (TPE) to model the probability distribution of being maximised. This approach allows the optimiser to focus on hyperparameter regions that are more likely to yield improvements in target domain accuracy. The TPE method effectively constructs a model of and updates this model iteratively as new data (hyperparameter values and their corresponding ) are observed.
The objective function is designed to maximise the classification of the test subset of the target domain accuracy that can be formulated as:
where and present the vector of model hyperparameters and the classification accuracy on the target test set, obtained by training the adversarial model with the hyperparameters , respectively
The goal of the optimisation is to find the optimal set of hyperparameters that maximises :
This optimisation problem involves dynamically adjusting to achieve the highest possible , which indicates the model's performance in effectively transferring learned knowledge from the source domain to the target domain without requiring labelled data in the target domain.
2.7. Computing Sensor Importance
To determine which sensor had the greatest impact on the final results of the damage detection, the importance of each of the three sensors was assessed. To end this, the attention weights () from the GAT are implemented as indicators of the contribution of each sensor (node) to the task at hand. For each layer of the GAT, the attention weights associated with the edges connecting the sensors are extracted. These weights are distributed equally between the two connected sensors, with their contributions aggregated to compute a per-sensor score. This process is repeated for every batch of data, and the batch-wise scores are normalised by dividing each score by the total sum of attention weights within the batch. The normalised scores ensure consistency and comparability across batches.
The aggregated scores from all batches are summed to calculate a final score for each sensor, which is then normalised to produce a comprehensive sensor importance metric. Let represent the set of edges, where each edge connects two nodes , and denotes the attention weight of edge in layer . The sensor score are computed as follows:
In the following section, the calculated weights are visualised as a gradient bar chart for the three receiving sensors.
3. Case study
A publicly available dataset, CONCEPT: CarbON-epoxy CompositE PlaTe, was employed to evaluate the effectiveness of the SHM framework designed in this study. The dataset includes Lamb wave measurements captured on a carbon-epoxy laminate plate made of unidirectional plies, in both healthy and damaged states. The experiments focused on the effects of temperature variations and damage progression on the structural integrity of the plate.
Four Lead Zirconate Titanate transducers from Acellent Technologies were bonded to the plate, with one (PZT1) serving as an actuator and the others (PZT2, PZT3, and PZT4) as receiving sensors. To minimise wave propagation constraints, the laminate was mounted under free-free boundary conditions. Figure 4 shows the setup along with the test rig and instrumentation; Table 1 presents the test rig, and the instruments used.
The experiments were conducted in a Thermotron thermal chamber to precisely control temperature. A sinusoidal tone burst served as the excitation signal, with response signals sampled accordingly. Signal generation and measurement were managed by designated data acquisition systems, controlled via LabVIEW software. For the intact plate, 100 measurements were conducted at each of 7 temperatures, ranging from 0°C to 60°C, with an increment of 10°C. For the damaged scenarios, 100 observations were recorded only at 30°C, which was considered the baseline. No observations were recorded for damaged scenarios at other temperatures.
The damage scenarios were simulated by applying industrial adhesive putty to the composite plate's surface, representing delamination-like defects. The damage was progressively increased in a localised region between PZT1 and PZT2 to examine the attenuation and propagation changes caused by the defects. Various health scenarios along with their severities and brief descriptions are summarised in Table 2 that contains the allocated labels to the different temperatures too. This dataset was employed in multiple research studies that represented its capability in evaluating SHM frameworks in mitigating EOVs [15,36,37].
4. Result and Discussion
This section aims to show that the proposed SHM system, i.e., GAT-CAMDA, can accurately identify different health states of the structure, even with temperature changes that occur during operation. As previously mentioned, the source domain dataset comprises measurements from all health scenarios at a baseline temperature of 30 °C, with one PZT functioning as the actuator positioned at the centre of the plate (PZT1) and the remaining three PZTs (PZT2, PZT3, and PZT4) capturing the received Lamb waves. Initially, a data synthesis approach was employed as detailed in the preceding sections. Subsequently, the performance of the end-to-end hybrid domain adaptation and classification model was evaluated under the assumption that the testing data encompassed a range of background temperatures. Finally, a comparative study was performed to assess the superiority of GAT-CAMDA. Additionally, the analysis identified which receiver sensors were more significant and which hyperparameters had a substantial impact on the results.
4.1. Dataset Complementation
To produce data for target temperatures, e.g., 0°C, 10°C, 20°C, 40°C, 50°C, and 60°C the interpolation and extrapolation processes were executed for each temperature and sensor using MATLAB®. Spline interpolation technique was employed to estimate signal values at unmeasured temperatures. In synthesising the damaged scenario data for new temperatures, a scaling factor, derived from the healthy data across different temperatures, was applied to adjust the signals. To add realism and account for natural variations in the data, a controlled variability of ±1% was introduced to the scaled signals. For each of the damaged health scenarios at the target temperatures 100 observations were generated.
To evaluate the effectiveness of the applied data synthesis, the source temperature, e.g., 30°C, was employed. To this end, among the 100 observations belonging to the healthy situation, 50 observations were selected randomly and employed to produce synthesised data, while the remaining 50 samples were used for the validation phase. Figure 5 displays an experimental observation of the intact plate, i.e., C0 (recorded at the baseline temperature) alongside its synthesised counterpart for the three channels.
Plots in Figure 5 present that the experimental and the synthesised data are close to each other for all the 3 sensors in the time-domain. To further analysis that the synthesised data mimic the behaviour of the experimental signals, two metrics, namely Dynamic Time Warping (DTW) [38] and Cross-Correlation (CC) [39], were employed. Data was generated for the base temperature of 30°C, which includes observations for all health scenarios. From each health state, 50 observations were used for data synthesising, while the remaining 50 observations per class were reserved for comparison with the synthesised data; this approach ensured a balanced and consistent evaluation process.
DTW measured the optimal alignment between temporal sequences, with lower DTW values indicating greater similarity between the real and synthesised signals. CC assessed the linear relationship between the signals, where values close to -1 or +1 demonstrated higher similarity in amplitude and phase. The results of this validation process are presented in the bar graphs of Figure 6-a and 6-b, providing a visual representation of the synthesised data's fidelity to the original observations by measuring the average values of DTW and CC metrics for the 3 sensors.
The acquired results demonstrate the effectiveness of the data synthesising process, as indicated by the low DTW values and CC values near 1 across all sensors. For PZT2, the DTW value is slightly higher (0.122) compared to PZT3 (0.034) and PZT4 (0.0321), which can be attributed to the larger amplitude of signals recorded by this sensor. However, the CC values for all sensors, e.g., PZT2 (0.99994), PZT3 (0.99977), and PZT4 (0.99979) are consistently close to 1, highlighting a strong similarity between the synthesised and real signals in terms of their temporal structure and amplitude relationships. These results validate the ability of the data synthesising process to generate realistic signals that align closely with the real observations, even in the presence of sensor-specific amplitude differences.
4.2. Damage Detection
To assess the performance of the proposed SHM framework, i.e., GAT-CAMDA, for detecting damage in composite plates subjected to EOVs, the data acquired at 30°C was designated as the source domain. This source dataset was split into training (63%), validation (27%), and testing (10%). The remaining temperatures (0, 10, 20, 40, 50, and 60°C) were combined to form a single dataset serving as the target domain, of which 85% was allocated for domain adaptation (with equal representation from each target temperature ensured by the ‘stratify’ option). The remaining 15% of the target dataset was reserved for testing; as a result, each of the 12 damage classes (C0-C11) in the target test set comprises 90 samples. Among these 90 observations, 15 belonged to 0°C, 15 to 10°C, among others for the remaining target temperatures. Table 3 provides a summary of the source and target datasets.
GAT-CAMDA was executed for 100 trials using an Optuna optimisation schedule to identify the framework’s optimal configuration, guided by 13 hyperparameters outlined in Table 4. The number of epochs was fixed at 50, and the objective function was defined as the maximum classification accuracy achieved on the target test dataset.
During the domain adaptation phase, class labels were removed to facilitate an unsupervised setup, mirroring real-world industrial applications where annotated data may be scarce or cost-prohibitive. A random seed of 42 was then fixed to ensure reproducibility; the entire process of running GAT-CAMDA was performed through Jupyter Notebook in Python.
Executing GAT-CAMDA through the mentioned optimisation scheme, the highest damage detection accuracy was found at trial 56, as can be observed in the optimisation history plot (e.g., Figure 7).
Results from Figure 7 illustrate the extent to which choosing suitable hyperparameters can affect the outcome. For instance, at trial 20, the accuracy reached nearly 20%, while in the most optimal scenario (i.e., trial 56), it developed to 95.83%.
The slice plot in Figure 8 shows the values and options (for the categorical hyperparameters such as pooling function, normalisation approach, and the type of MMD kernel) throughout the optimisation process and, more specifically, the trial in which the most optimal objective function was discovered; the hyperparameter values for this trial are surrounded by the red rectangle.
The prominent results presented in Figure 8 indicate that implementing a normalisation process within GAT-CAMDA led to inferior outcomes compared to using the original signals during the signal processing stage. Additionally, employing lower learning rate values resulted in improved performance. Furthermore, the mean pooling function was found to be unsuitable for GAT-CAMDA, as the highest accuracy achieved in this scenario was approximately 75%.
Before representation of the damage detection results utilising the full version of GAT-CAMDA and to demonstrate the effectiveness of the feature extraction phase and the capability of the classifier, the trained GAT-CAMDA framework was evaluated using the test subset of the source domain. Moreover, the domain adaptation component of GAT-CAMDA was removed, and the trained network was subsequently tested on the target test subset. The confusion matrices presented in Figures 9-a and 9-b display the damage detection outcomes for both of these scenarios, respectively.
The confusion matrix presented in Figure 9-a demonstrates that the feature extraction method employed can effectively differentiate between the various damage scenarios. Furthermore, the damage detection classifier, trained using the source domain data, achieved a 100% accuracy rate on its test set, confirming that the classifier is trained impeccably. Figure 9-b, on the contrary, reveals that this well-trained network fails to accurately identify the different damage classes (approximately 36% accuracy) when the feature distribution space of the test set is altered due to EOVs. Consequently, these findings underscore the need for a domain adaptation phase to ensure that the framework trained on the source domain functions properly when applied to data from the target domain.
The outcomes of the most optimum framework in classifying the target test set are depicted in Figure 10-a and 10-b; the latter one shows the classification metrics, i.e., Precision, Recall, and F1-Score [40].
The classification metrics indicate that the proposed GAT-CAMDA framework achieves a robust differentiation among the 12 structural health scenarios, maintaining high precision and recall values across most classes (with an average accuracy of 95.83%). In particular, classes exhibiting a precision of 1 reveal that the model consistently classifies those specific damage conditions without false positives, demonstrating its capacity to accurately identify even subtle differences in wave propagation patterns. Moreover, the consistently elevated recall across all classes signifies a low rate of missed damage instances, a critical requirement in damage detection tasks where undetected flaws may compromise structural integrity. The marginally reduced precision for C10 nonetheless retains a high recall, suggesting that, although the model occasionally misassigns instances into this category, it rarely overlooks genuine damage of that type.
To visualise the impact of GAT-CAMDA on feature distribution, t-distributed Stochastic Neighbour Embedding (t-SNE) [41] was employed. This dimensionality reduction technique projected the extracted features into a two-dimensional space, both before and after the hybrid domain adaptation stage within GAT-CAMDA. The resulting data distributions are displayed in Figure 11-a and 11-b, respectively, with each scatter point representing an observation belonging to a specific temperature and damage scenario.
When comparing the t-SNE scatter plots before and after the GAT-CAMDA-based domain adaptation, a marked improvement in feature-space alignment is evident. Specifically, observations corresponding to identical temperature-damage scenarios become more cohesively clustered post-adaptation, illustrating that GAT-CAMDA effectively compensates for the distributional shifts introduced by varying temperature. Consequently, data points representing identical classes converge into denser, well-separated regions, underscoring the framework’s ability to disentangle and preserve class-discriminative characteristics. These findings underscore GAT-CAMDA’s capacity to capture subtle signal features and thereby distinguish healthy from damaged states with high fidelity that is an essential requirement for robust and generalised SHM system. By mitigating the confounding effects of temperature variation, GAT-CAMDA enhances inter-class separability while maintaining intra-class consistency, providing a scalable and reliable platform for advanced SHM applications.
4.3. Comparative Study
The performance of the GAT-CAMDA framework was compared with different established feature-based domain adaptation methods. All the approaches took an equal number of observations, 85% of the combined target domain, for feature alignment phase. The hyperparameters were tuned by trial and error to determine the best performances of these methods. In total, 8 domain adaptation methods, i.e., TCA, Feature Selection with MMD (fMMD), CORAL, Deep CORAL, SrcOnly Prediction (PRED), Subspace Alignment (SA), and Domain-Adversarial Training of Neural Networks (DANN) were investigated using the augmented version of the CONCEPT dataset, out of which 2 fall under the category of supervised while the rest of the 6 are UDA methods. Table 5 presents the classification metrics for these approaches along with the proposed GAT-CAMDA framework.
Results in Table 5 show that, although it is a challenging case study because of the integration of disjoint target domains, GAT-CAMDA sharply outperformed the comparative approaches. It achieved an accuracy of 95.83%, with precision and F1-scores each at 0.96. This is further improved upon from DANN, which, though outperforming the other methods assessed, having an accuracy of 82%, precision and F1-scores of 0.83 and 0.82 respectively, was not as effective as GAT-CAMDA. The better performance underlines the robustness of the procedure proposed within this work. Confusion matrices in Figures 12-a to 12-d display the classification results of Deep CORAL, PRED, SA, and DANN, respectively on the target test set, providing further visual insight into the class-wise performance.
From Figure 12, it is evident that GAT-CAMDA exhibits exceptional precision in classifying the intact plate scenario (C0) and distinct damage states (C5 and C11) compared to other methods such as SA and DANN, which frequently misclassify closely related classes (e.g., C2 and C3). However, it is important to acknowledge that C6 presented considerable classification challenges for all evaluated methods, although GAT-CAMDA managed to resolve this challenge more effectively.
4.4. Hyperparameter Importance
To illustrate the relative influence of the 13 hyperparameters involved in the optimisation process on the outcomes of GAT-CAMDA, their importances were calculated using Optuna and are depicted in Figure 13. This visual representation facilitates informed decision-making by highlighting the hyperparameters with the most significant impact, allowing one to prioritise these for fine-tuning to enhance the model's accuracy and efficiency in the future applications.
From Figure 13, it can be observed that the learning rate is the most critical hyperparameter, with a significant importance value of 0.59, underlining its pivotal influence on model performance. The weight of the MMD loss and the number of heads in the GAT also hold considerable importance, with values of 0.10 and 0.08 respectively, highlighting their substantial roles in shaping the model's effectiveness. Additionally, the dimension of the hidden layer, though less influential at 0.04, is crucial for fine-tuning the model’s operational capabilities in damage detection. This analysis underscores the necessity of prioritising these hyperparameters during the optimisation process to maximise the model's accuracy and efficiency.
4.5. Sensor Importance
In GAT-CAMDA framework, the attention scores for each sensor were normalised to effectively evaluate their significance in the damage detection process. These scores were determined by the extent to which each sensor contributed to identifying structural anomalies, with all calculations having been performed under the optimal configuration settings of the framework. The normalised scores ranged from 0 to 1, providing a consistent and comparative metric of sensor importance. Figure 14 displayed these scores, visualised as a gradient bar chart, which illustrated the relative contribution of each sensor to the overall damage detection capability.
As previously noted, the most optimal framework identified was for scenarios in which the signals were not normalised. Figure 5 demonstrates that the amplitude of the signals recorded by PZT2 is approximately 8 times greater than those from the other two receivers, PZT3 and PZT4. Furthermore, the signal amplitude captured by PZT4 is marginally higher than that of PZT3. These differences in signal amplitude play a pivotal role in determining the final outcome, as evidenced by the calculated sensor importance scores, whereby PZT2, PZT4, and PZT3 exhibit progressively higher importance in the final output, respectively.
The same optimal framework was assessed under the assumption that normalisation was not applied, while maintaining the other hyperparameter values unchanged; the computed sensor importances are displayed in Figure 15.
The pronounced significance of PZT3 within the designed SHM framework on the assumption that the unnormalised versions of the data were fed into the signal processing and learning network is consistent with the findings in [37]. It was confirmed that PZT3 exhibits a wider confidence interval in its signal data compared to PZT2, indicating greater variability. This increased variability is influenced by temperature changes, which affect the material's mechanical properties. Specifically, as temperature rises, the stiffness of the carbon/epoxy laminate decreases, with the shear modulus reducing by 7%. This decline is much higher than the 1.3% decrease observed in the elastic modulus . This difference is crucial because PZT3 is positioned at a 45-degree angle from the excitation point, making it particularly sensitive to changes in the shear modulus due to its orientation relative to the main direction of wave propagation. The heightened signal dispersion at PZT3 results from its unique placement and the viscoelastic characteristics of the epoxy resin, which are not present in the carbon fibres. Consequently, despite a lower signal-to-noise ratio, PZT3 shows an enhanced ability to detect subtle anomalies in wave propagation that may indicate structural damage. Figure 15 reflects the intricate relationship between sensor placement, material properties, and wave behaviour in composite structures.
5. Conclusion and Future Work
The GAT-CAMDA framework was designed to address the challenge of variability in SHM caused by temperature fluctuations, with its effectiveness demonstrated on a carbon-epoxy laminate composite plate. By leveraging GATs for advanced feature extraction and incorporating MMD, CORAL, and adversarial losses for discriminative domain adaptation, the framework successfully aligned feature distributions across diverse temperature domains. This alignment significantly improved the accuracy of damage detection within the system. Comparative studies with established methods further validated the framework's superior performance, highlighting its ability to handle the complexities of temperature-integrated target domain datasets.
To address the challenge of data scarcity, particularly for unmeasured damage conditions at different temperatures, a synthetic data generation algorithm was employed. This algorithm enriched the dataset by creating synthetic samples, enhancing the framework's generalisability and robustness. As a result, the framework was extensively evaluated and refined for conditions that were not physically measured, ensuring consistent performance across a theoretical range of operational scenarios.
Explainability techniques played a crucial role in clarifying the decision-making processes of GAT-CAMDA. These techniques visualised the contributions of various sensors, identifying the most influential one for damage detection. Furthermore, the study displayed the impact of key hyperparameters on damage detection accuracy, providing valuable insights into optimal model configurations.
Although the GAT-CAMDA framework effectively addresses variability in SHM caused by temperature changes, further improvements are needed to enhance its computational efficiency for real-time deployment. This includes optimising graph processing algorithms and integrating hardware accelerations, such as Tensor Processing Units, to reduce processing times. Additionally, increasing the realism and diversity of synthetic data through advanced generative models could further strengthen the framework’s practical utility. Extending the framework's adaptability to include a wider range of environmental conditions beyond temperature, such as humidity or load variations, could broaden its applicability across different industrial settings.
Author Contributions
Conceptualisation, N.R., F.A.; methodology, N.R., D.P., A.D.L., M.D.O.; investigation, N.R. and A.D.L.; writing original draft, preparation, review, and editing, N.R., M.D.O., D.P., F.A., and G.L.; supervision, A.D.L. and M.D.O. All authors have read and agreed to the published version of the manuscript.
Funding
This research study was carried out in the framework of the project “TU-LEARN—sTrUctural Life Extension enhAnced by aRtificial iNtelligence”, funded by Unione Europea—Next Generation EU, as part of Prin 2022 PNRR—D.D. n. 1409 del 14-09-2022 program.
Data Availability Statement
The employed dataset is available upon request via https://github.com/shm-unesp/DATASET_PLATEUN01?tab=readme-ov-file.
Acknowledgments
Also, the authors acknowledge Structural Health Monitoring Research Group at São Paulo State University - UNESP, for building the employed dataset.
Conflicts of Interest
The authors declare no conflicts of interest.
Abbreviations
The following abbreviations are used in this manuscript:
| CC | Cross-Correlation |
| CORAL | Correlation Alignment |
| DANN | Domain-Adversarial Training of Neural Networks |
| DTW | Dynamic Time Warping |
| EOVs | Environmental and Operational Variabilities |
| FE | Finite Element |
| fMMD | Feature Selection with MMD |
| GATs | Graph Attention Networks |
| GRL | Gradient Reversal Layer |
| ML | Machine Learning |
| MMD | Maximum Mean Discrepancy |
| PRED | SrcOnly Prediction |
| PZT | Lead Zirconate Titanate |
| RBF | Radial Basis Function |
| ReLU | Rectified Linear Unit |
| SA | Subspace Alignment |
| SHM | Structural Health Monitoring |
| TCA | Transfer Component Analysis |
| TL | Transfer learning |
| t-SNE | t-distributed Stochastic Neighbour Embedding |
| TPE | Tree-structured Parzen Estimator |
| UDA | Unsupervised Domain Adaptation |
References
- Cawley, P. Guided Waves in Long Range Nondestructive Testing and Structural Health Monitoring: Principles, History of Applications and Prospects. NDT and E International 2024, 142. [Google Scholar] [CrossRef]
- Gorgin, R.; Luo, Y.; Wu, Z. Environmental and Operational Conditions Effects on Lamb Wave Based Structural Health Monitoring Systems: A Review. Ultrasonics 2020, 105. [Google Scholar] [CrossRef]
- De Luca, A.; Greco, A.; Rezazadeh, N.; Perfetto, D.; Aversano, A. Guided Waves Propagation in Additively Manufactured GF30-PA6 Panel. Macromol Symp 2024, 413. [Google Scholar] [CrossRef]
- Giurgiutiu, V. Structural Health Monitoring with Piezoelectric Wafer Active Sensors–Predictive Modeling and Simulation. INCAS Bulletin 2010, 2, 31–44. [Google Scholar] [CrossRef]
- De Luca, A.; Perfetto, D.; Polverino, A.; Aversano, A.; Caputo, F. Finite Element Modeling Approaches, Experimentally Assessed, for the Simulation of Guided Wave Propagation in Composites. Sustainability (Switzerland) 2022, 14. [Google Scholar] [CrossRef]
- Zheng, S.; Luo, Y.; Xu, C.; Xu, G. A Review of Laser Ultrasonic Lamb Wave Damage Detection Methods for Thin-Walled Structures. Sensors 2023, 23. [Google Scholar] [CrossRef]
- Yin, Z.; Tie, Y.; Duan, Y.; Li, C. Optimization of Nonlinear Lamb Wave Detection System Parameters in Cfrp Laminates. Materials 2021, 14. [Google Scholar] [CrossRef]
- Rezazadeh, N.; Perfetto, D.; Polverino, A.; De Luca, A.; Lamanna, G. Guided Wave-Driven Machine Learning for Damage Classification with Limited Dataset in Aluminum Panel. Struct Health Monit 2024. [Google Scholar] [CrossRef]
- Zeng, X.; Liu, X.; Yan, J.; Yu, Y.; Zhao, B.; Qing, X. Lamb Wave-Based Damage Localization and Quantification Algorithms for CFRP Composite Structures. Compos Struct 2022, 295, 115849. [Google Scholar] [CrossRef]
- Zou, L.; Gong, Y.; Tian, D.; Zhao, L.; Zhang, J.; Hu, N. Effect of Interface Angle on Mode I Delamination Damage Behavior of Multidirectional Fully Isotropic Laminates with the Same Global Stiffness. Thin-Walled Structures 2023, 182. [Google Scholar] [CrossRef]
- Konstantinidis, G.; Wilcox, P.D.; Drinkwater, B.W. An Investigation into the Temperature Stability of a Guided Wave Structural Health Monitoring System Using Permanently Attached Sensors. IEEE Sens J 2007, 7. [Google Scholar] [CrossRef]
- Moll, J.; Kexel, C.; Pötzsch, S.; Rennoch, M.; Herrmann, A.S. Temperature Affected Guided Wave Propagation in a Composite Plate Complementing the Open Guided Waves Platform. Sci Data 2019, 6. [Google Scholar] [CrossRef]
- Rezazadeh, N.; De Luca, A.; Perfetto, D.; Salami, M.R.; Lamanna, G. Systematic Critical Review of Structural Health Monitoring under Environmental and Operational Variability: Approaches for Baseline Compensation, Adaptation, and Reference-Free Techniques. Smart Mater Struct 2025, 34, 073001. [Google Scholar] [CrossRef]
- Scheerer, M.; Lager, D. Validation of Temperature Compensation Techniques for Impact Damage Detection and Localization Using Ultrasonic Sparse Arrays. In Proceedings of the 7th European Workshop on Structural Health Monitoring, EWSHM 2014 - 2nd European Conference of the Prognostics and Health Management (PHM) Society; 2014. [Google Scholar]
- da Silva, S.; Paixão, J.; Rébillat, M.; Mechbal, N. Extrapolation of AR Models Using Cubic Splines for Damage Progression Evaluation in Composite Structures. J Intell Mater Syst Struct 2021, 32. [Google Scholar] [CrossRef]
- Ren, F.; Giannakeas, I.N.; Sharif Khodaei, Z.; Aliabadi, M.H.F. Sensitivity Analysis of Temperature Effects on Guided Wave-Based Damage Detection. Mech Syst Signal Process 2023, 196. [Google Scholar] [CrossRef]
- Ren, F.; Giannakeas, I.N.; Sharif Khodaei, Z.; Aliabadi, M.H.F. Theoretical and Experimental Investigation of Guided Wave Temperature Compensation for Composite Structures with Different Thicknesses. Mech Syst Signal Process 2023, 200. [Google Scholar] [CrossRef]
- Perfetto, D.; Sharif Khodaei, Z.; De Luca, A.; Aliabadi, M.H.; Caputo, F. Experiments and Modelling of Ultrasonic Waves in Composite Plates under Varying Temperature. Ultrasonics 2022, 126, 106820. [Google Scholar] [CrossRef]
- Ferreira, L.deP.S.; Teloli, R.deO.; da Silva, S.; Figueiredo, E.; Maia, N.; Cimini, C.A. Bayesian Data-Driven Framework for Structural Health Monitoring of Composite Structures under Limited Experimental Data. Struct Health Monit 2024. [Google Scholar] [CrossRef]
- Giannakeas, I.N.; Sharif Khodaei, Z.; Aliabadi, M.H. An Up-Scaling Temperature Compensation Framework for Guided Wave–Based Structural Health Monitoring in Large Composite Structures. Struct Health Monit 2023, 22. [Google Scholar] [CrossRef]
- Cheng, X.; Sharif Khodaei, Z. Temperature Calibration for Guided Wave Hybrid System with FBG-Based Fabry-Perot Sensor. J Intell Mater Syst Struct 2023, 34. [Google Scholar] [CrossRef]
- Abdel-Basset, M.; Moustafa, N.; Hawash, H.; Tari, Z. Responsible Graph Neural Networks; 2023. [Google Scholar]
- Vrahatis, A.G.; Lazaros, K.; Kotsiantis, S. Graph Attention Networks: A Comprehensive Review of Methods and Applications. Future Internet 2024, 16, 318. [Google Scholar] [CrossRef]
- Niu, J.; Li, S.; Li, Z. Restoration of Missing Structural Health Monitoring Data Using Spatiotemporal Graph Attention Networks. Struct Health Monit 2022, 21. [Google Scholar] [CrossRef]
- Zhao, M.; Taal, C.; Baggerohr, S.; Fink, O. Virtual Sensor for Real-Time Bearing Load Prediction Using Heterogeneous Temporal Graph Neural Networks. PHM Society European Conference 2024, 8, 8. [Google Scholar] [CrossRef]
- Rezazadeh, N.; Perfetto, D.; de Oliveira, M.; De Luca, A.; Lamanna, G. A Fine-Tuning Deep Learning Framework to Palliate Data Distribution Shift Effects in Rotary Machine Fault Detection. Struct Health Monit 2024. [Google Scholar] [CrossRef]
- Ozdagli, A.; Koutsoukos, X. Domain Adaptation for Structural Health Monitoring. Annual Conference of the PHM Society 2020, 12, 9. [Google Scholar] [CrossRef]
- Zhuojun, X.; Hao, L.; Jianbo, Y.; Jingwen, Y. A Transfer Learning Approach for Data-Driven Localization of Damage Areas in Plate-like Structures of CFRP Materials. Eng Struct 2024, 314, 118352. [Google Scholar] [CrossRef]
- Wang, Y.; Cui, X.; Liu, Q.; Zhao, B.; Liao, Y.; Qing, X. An Adaptive Damage Monitoring Method Based on Transfer Features Mapped for Advanced Composite Structures. Compos Struct 2024, 329, 117742. [Google Scholar] [CrossRef]
- Poole, J.; Gardner, P.; Dervilis, N.; Bull, L.; Worden, K. On Statistic Alignment for Domain Adaptation in Structural Health Monitoring. Struct Health Monit 2023, 22, 1581–1600. [Google Scholar] [CrossRef]
- Salih, A.M.; Raisi-Estabragh, Z.; Galazzo, I.B.; Radeva, P.; Petersen, S.E.; Lekadir, K.; Menegaz, G. A Perspective on Explainable Artificial Intelligence Methods: SHAP and LIME. Advanced Intelligent Systems 2024. [Google Scholar] [CrossRef]
- Tiwari, A.; Gupta, A.K.; Gupta, T. A Robust Approach to Shear Strength Prediction of Reinforced Concrete Deep Beams Using Ensemble Learning with SHAP Interpretability. Soft comput 2024, 28. [Google Scholar] [CrossRef]
- Azad, M.M.; Kim, H.S. An Explainable Artificial Intelligence-based Approach for Reliable Damage Detection in Polymer Composite Structures Using Deep Learning. Polym Compos 2024. [Google Scholar] [CrossRef]
- Kim, B.; Pineau, J. Maximum Mean Discrepancy Imitation Learning; 2016. [Google Scholar]
- Sun, B.; Feng, J.; Saenko, K. Return of Frustratingly Easy Domain Adaptation. In Proceedings of the 30th AAAI Conference on Artificial Intelligence, AAAI 2016; 2016. [Google Scholar]
- Almeida, E.F. de; Chavarette, F.R.; Merizio, I.F.; Gonçalves, A.C. Artificial Immune System for Fault Detection and Localization in a Composite Material Plate with Temperature Variation. Journal of the Brazilian Society of Mechanical Sciences and Engineering 2024, 46, 717. [Google Scholar] [CrossRef]
- Ferreira, L.deP.S.; Teloli, R. de O.; da Silva, S.; Figueiredo, E.; Moldovan, I.D.; Maia, N.; Cimini, C.A. Bayesian Calibration for Lamb Wave Propagation on a Composite Plate Using a Machine Learning Surrogate Model. Mech Syst Signal Process 2024, 208. [Google Scholar] [CrossRef]
- Senin, P. Dynamic Time Warping Algorithm Review. Science (1979) 2008, 2007. [Google Scholar]
- Habermehl, S.; Schlesinger, C.; Prill, D. Comparison and Evaluation of Pair Distribution Functions, Using a Similarity Measure Based on Cross-Correlation Functions. J Appl Crystallogr 2021, 54. [Google Scholar] [CrossRef] [PubMed]
- Rezazadeh, N.; De Oliveira, M.; Lamanna, G.; Perfetto, D.; De Luca, A. WaveCORAL-DCCA: A Scalable Solution for Rotor Fault Diagnosis Across Operational Variabilities. Electronics (Basel) 2025, 14, 3146. [Google Scholar] [CrossRef]
- van der Maaten, L.; Hinton, G. Visualizing Data Using T-SNE. Journal of Machine Learning Research 2008, 9, 2579–2605. [Google Scholar]
- Pan, S.J.; Tsang, I.W.; Kwok, J.T.; Yang, Q. Domain Adaptation via Transfer Component Analysis. IEEE Trans Neural Netw 2011, 22. [Google Scholar] [CrossRef] [PubMed]
- Uguroglu, S.; Carbonell, J. Feature Selection for Transfer Learning. 2011; pp. 430–442. [Google Scholar]
- Sun, B.; Saenko, K. Deep CORAL: Correlation Alignment for Deep Domain Adaptation. In Proceedings of the Lecture Notes in Computer Science (including subseries Lecture Notes in Artificial Intelligence and Lecture Notes in Bioinformatics); 2016; Vol. 9915 LNCS. [Google Scholar]
- III, H.D. Frustratingly Easy Domain Adaptation. CoRR 2009. [Google Scholar]
- Fernando, B.; Habrard, A.; Sebban, M.; Tuytelaars, T. Unsupervised Visual Domain Adaptation Using Subspace Alignment. In Proceedings of the Proceedings of the IEEE International Conference on Computer Vision.
- Ganin, Y.; Ustinova, E.; Ajakan, H.; Germain, P.; Larochelle, H.; Laviolette, F.; Marchand, M.; Lempitsky, V. Domain-Adversarial Training of Neural Networks. Journal of Machine Learning Research 2016, 17. [Google Scholar]
Figure 1.
A schematic of (a) Self-attention mechanism, (b) Multi-head attention mechanism in GAT layer
Figure 1.
A schematic of (a) Self-attention mechanism, (b) Multi-head attention mechanism in GAT layer
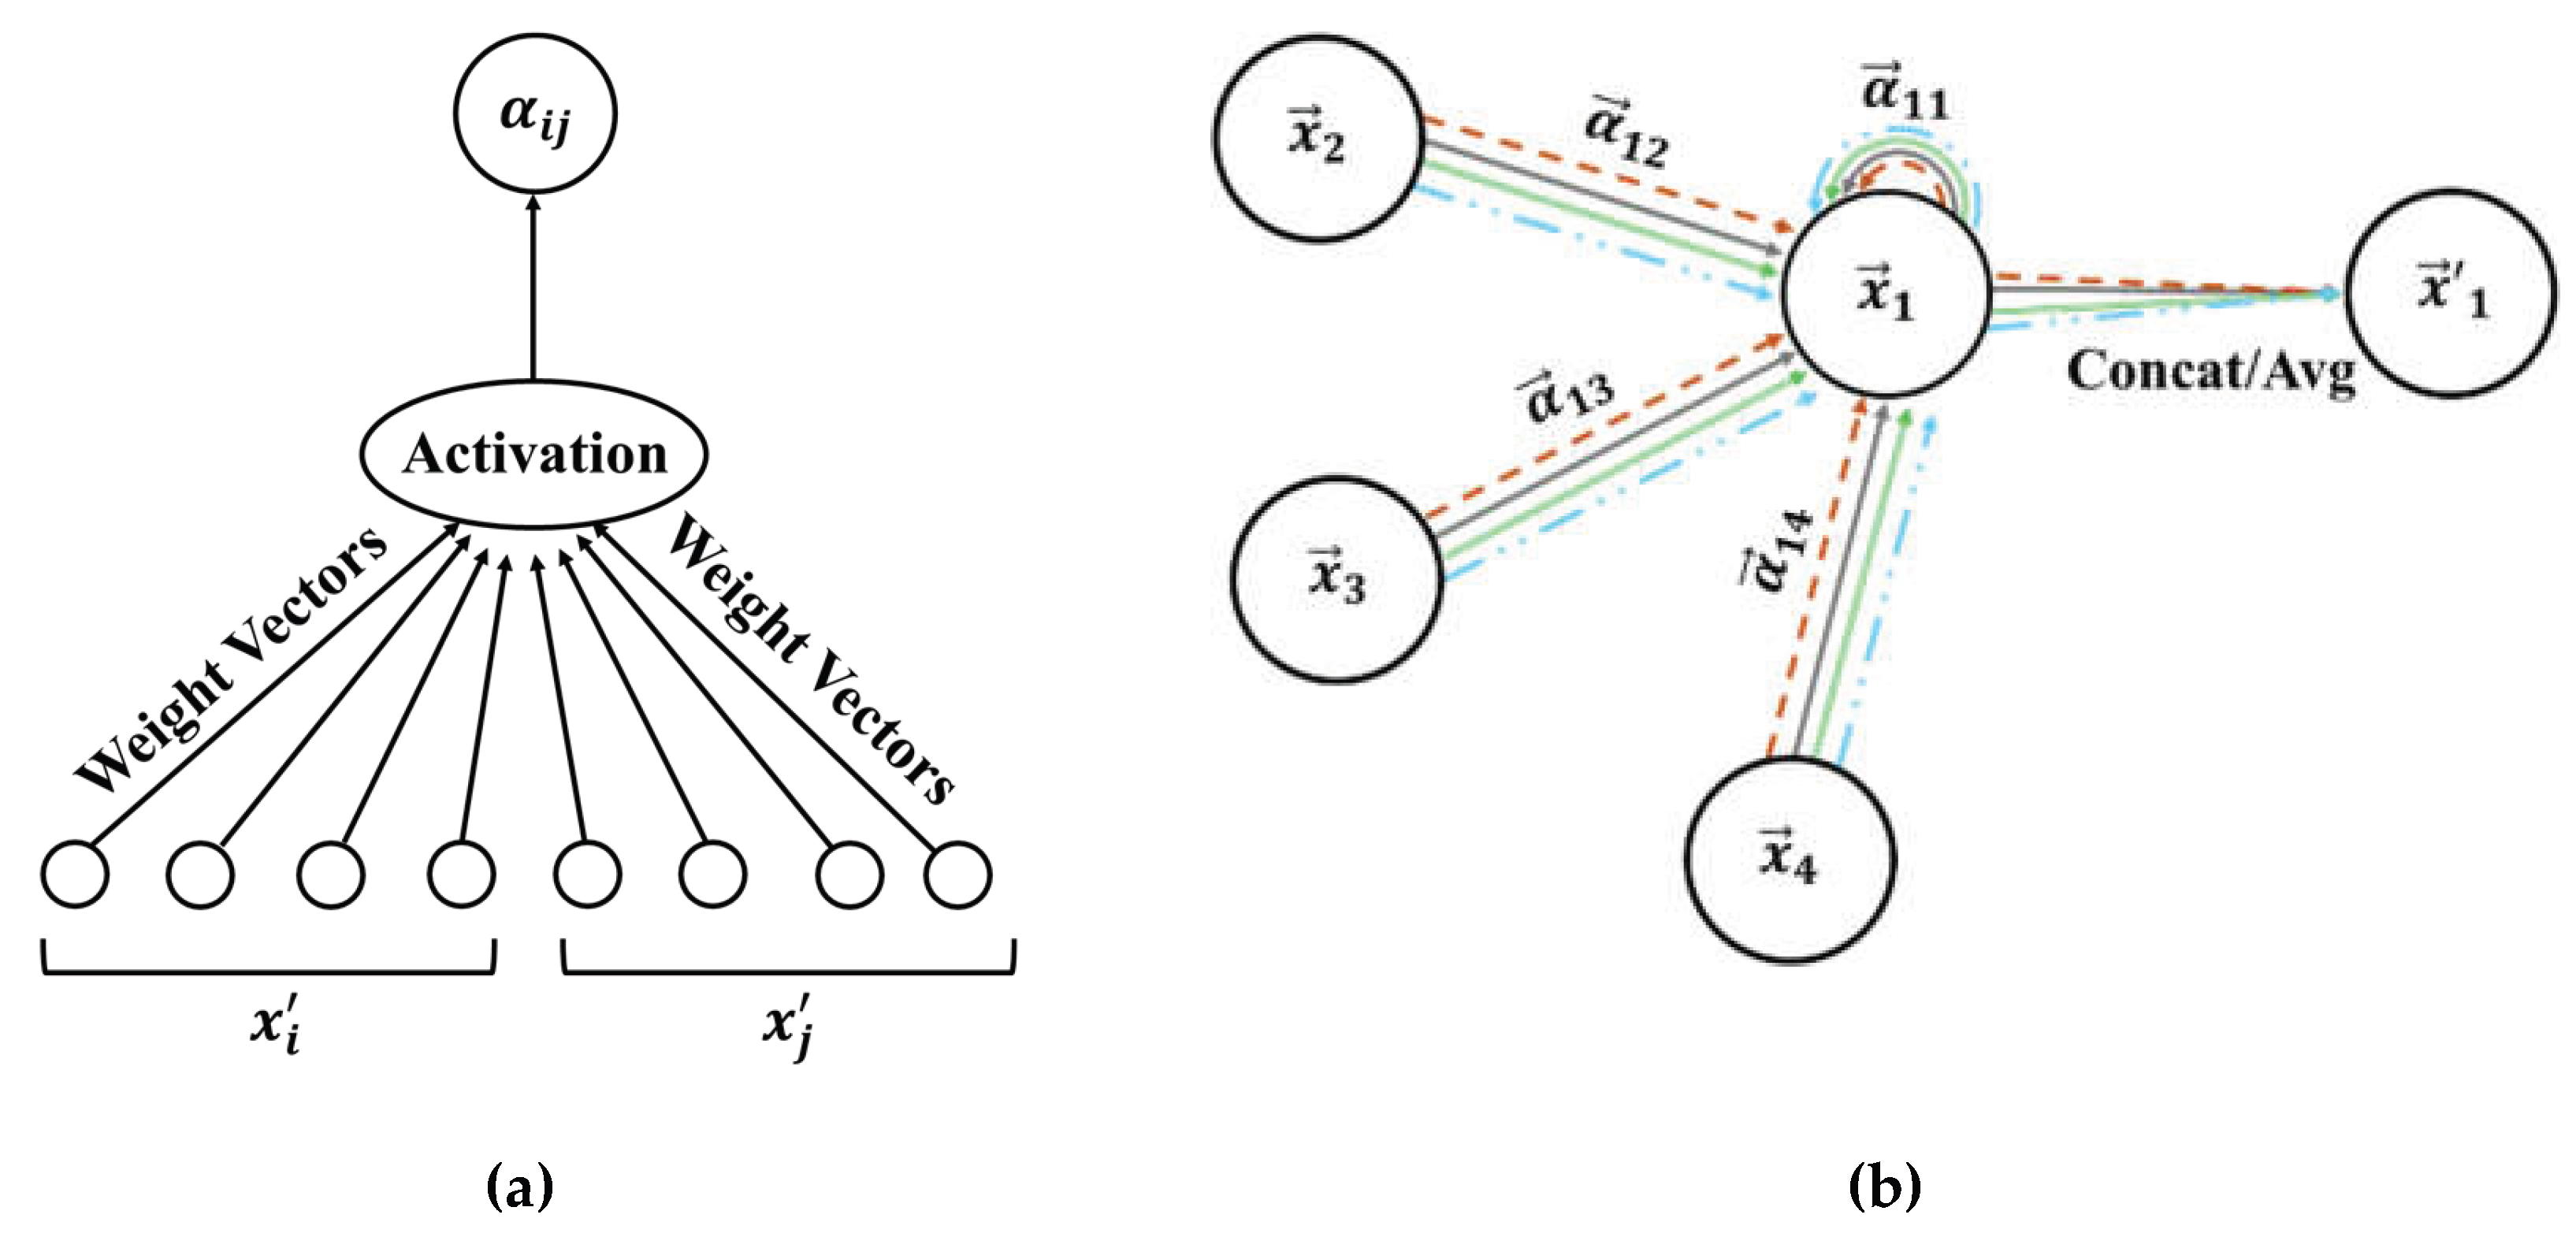
Figure 2.
A schematic of GAT-CAMDA
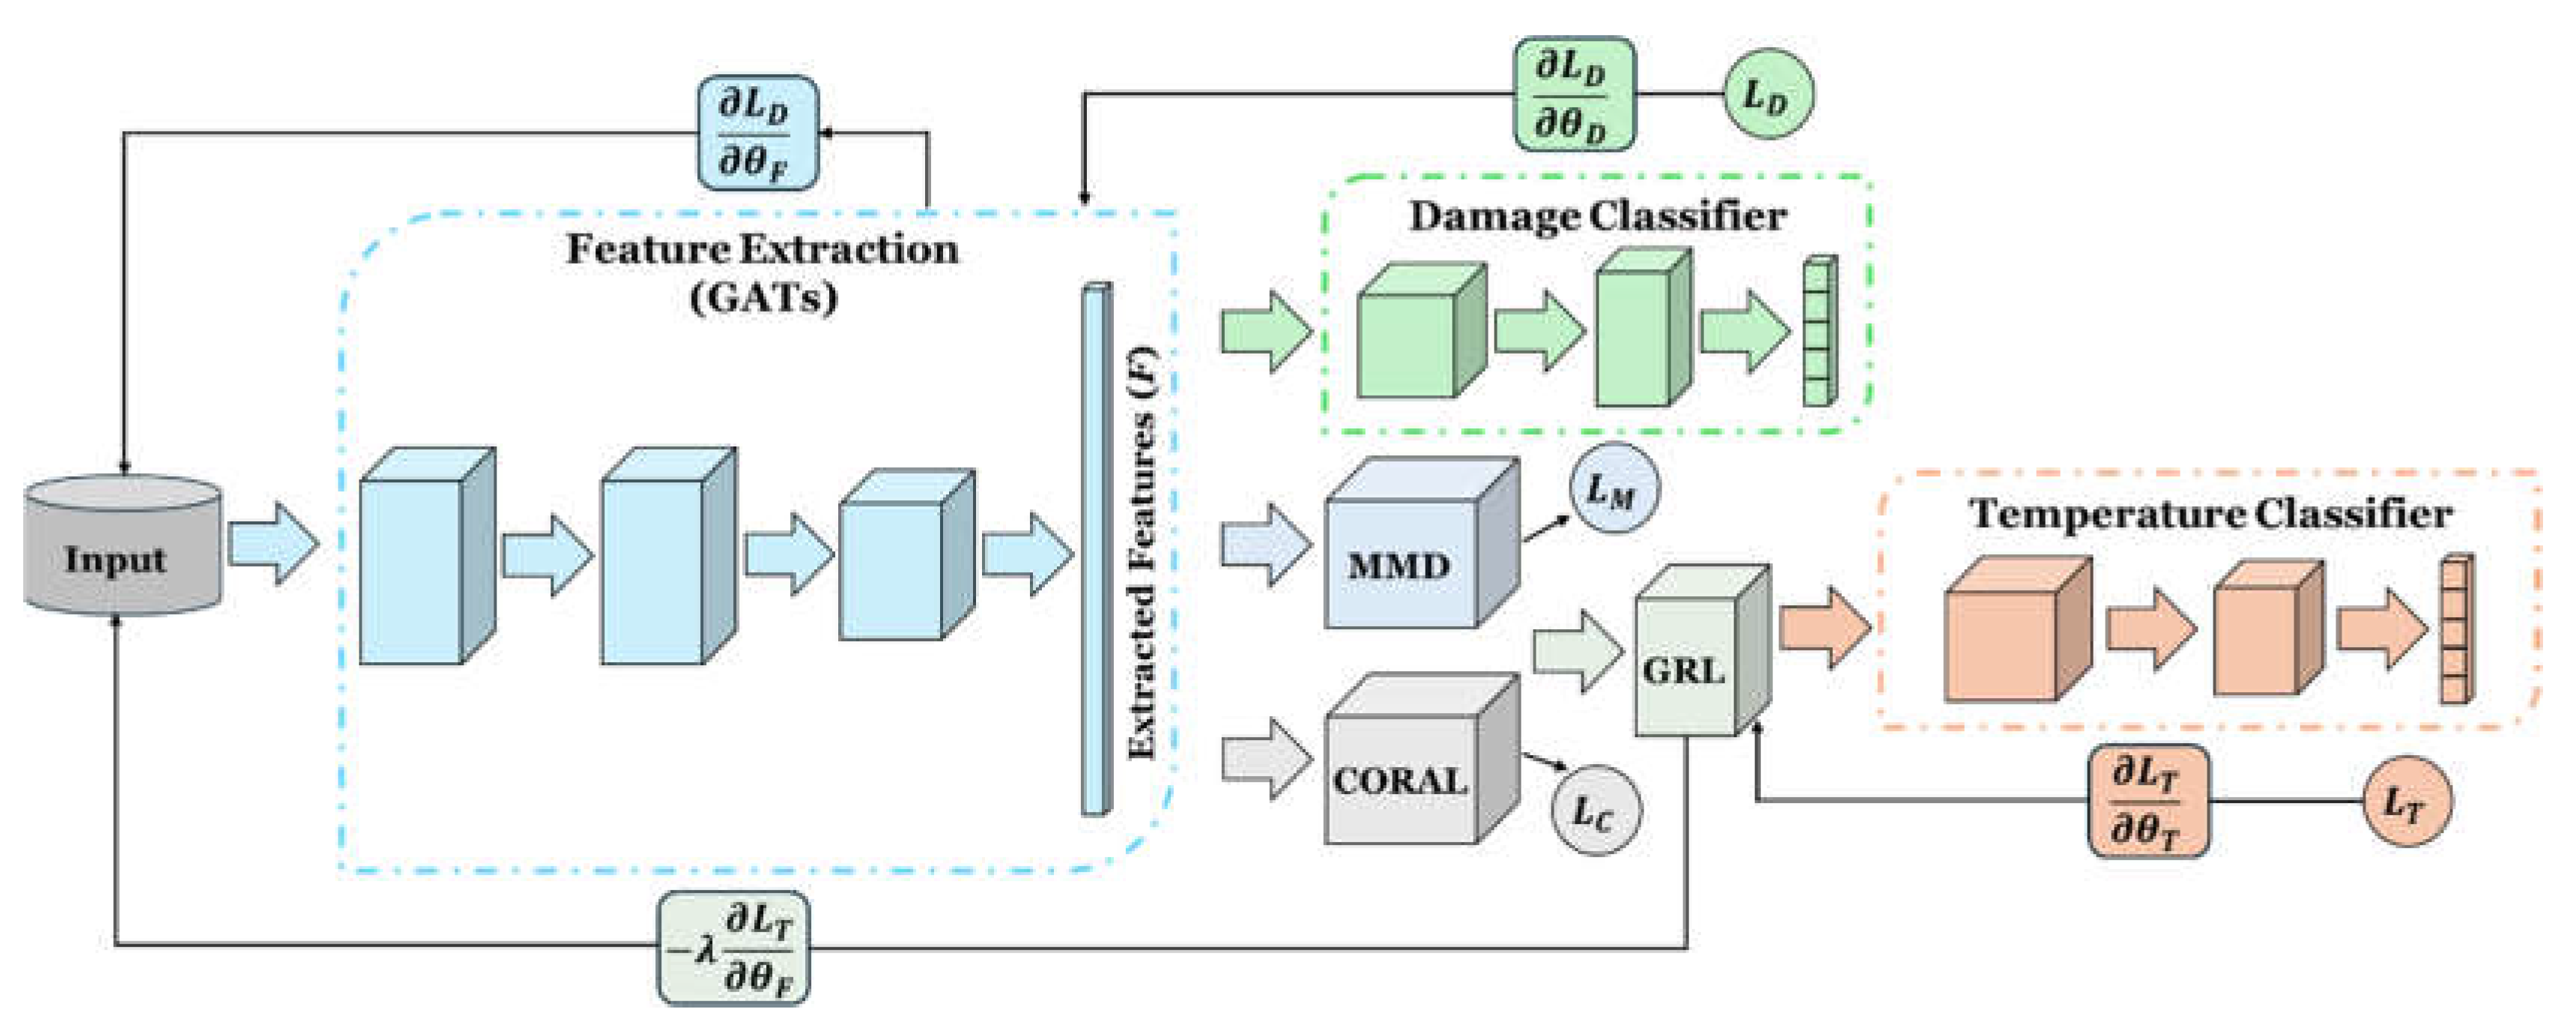
Figure 3.
Schematic of damage classifier in GAT-CAMDA
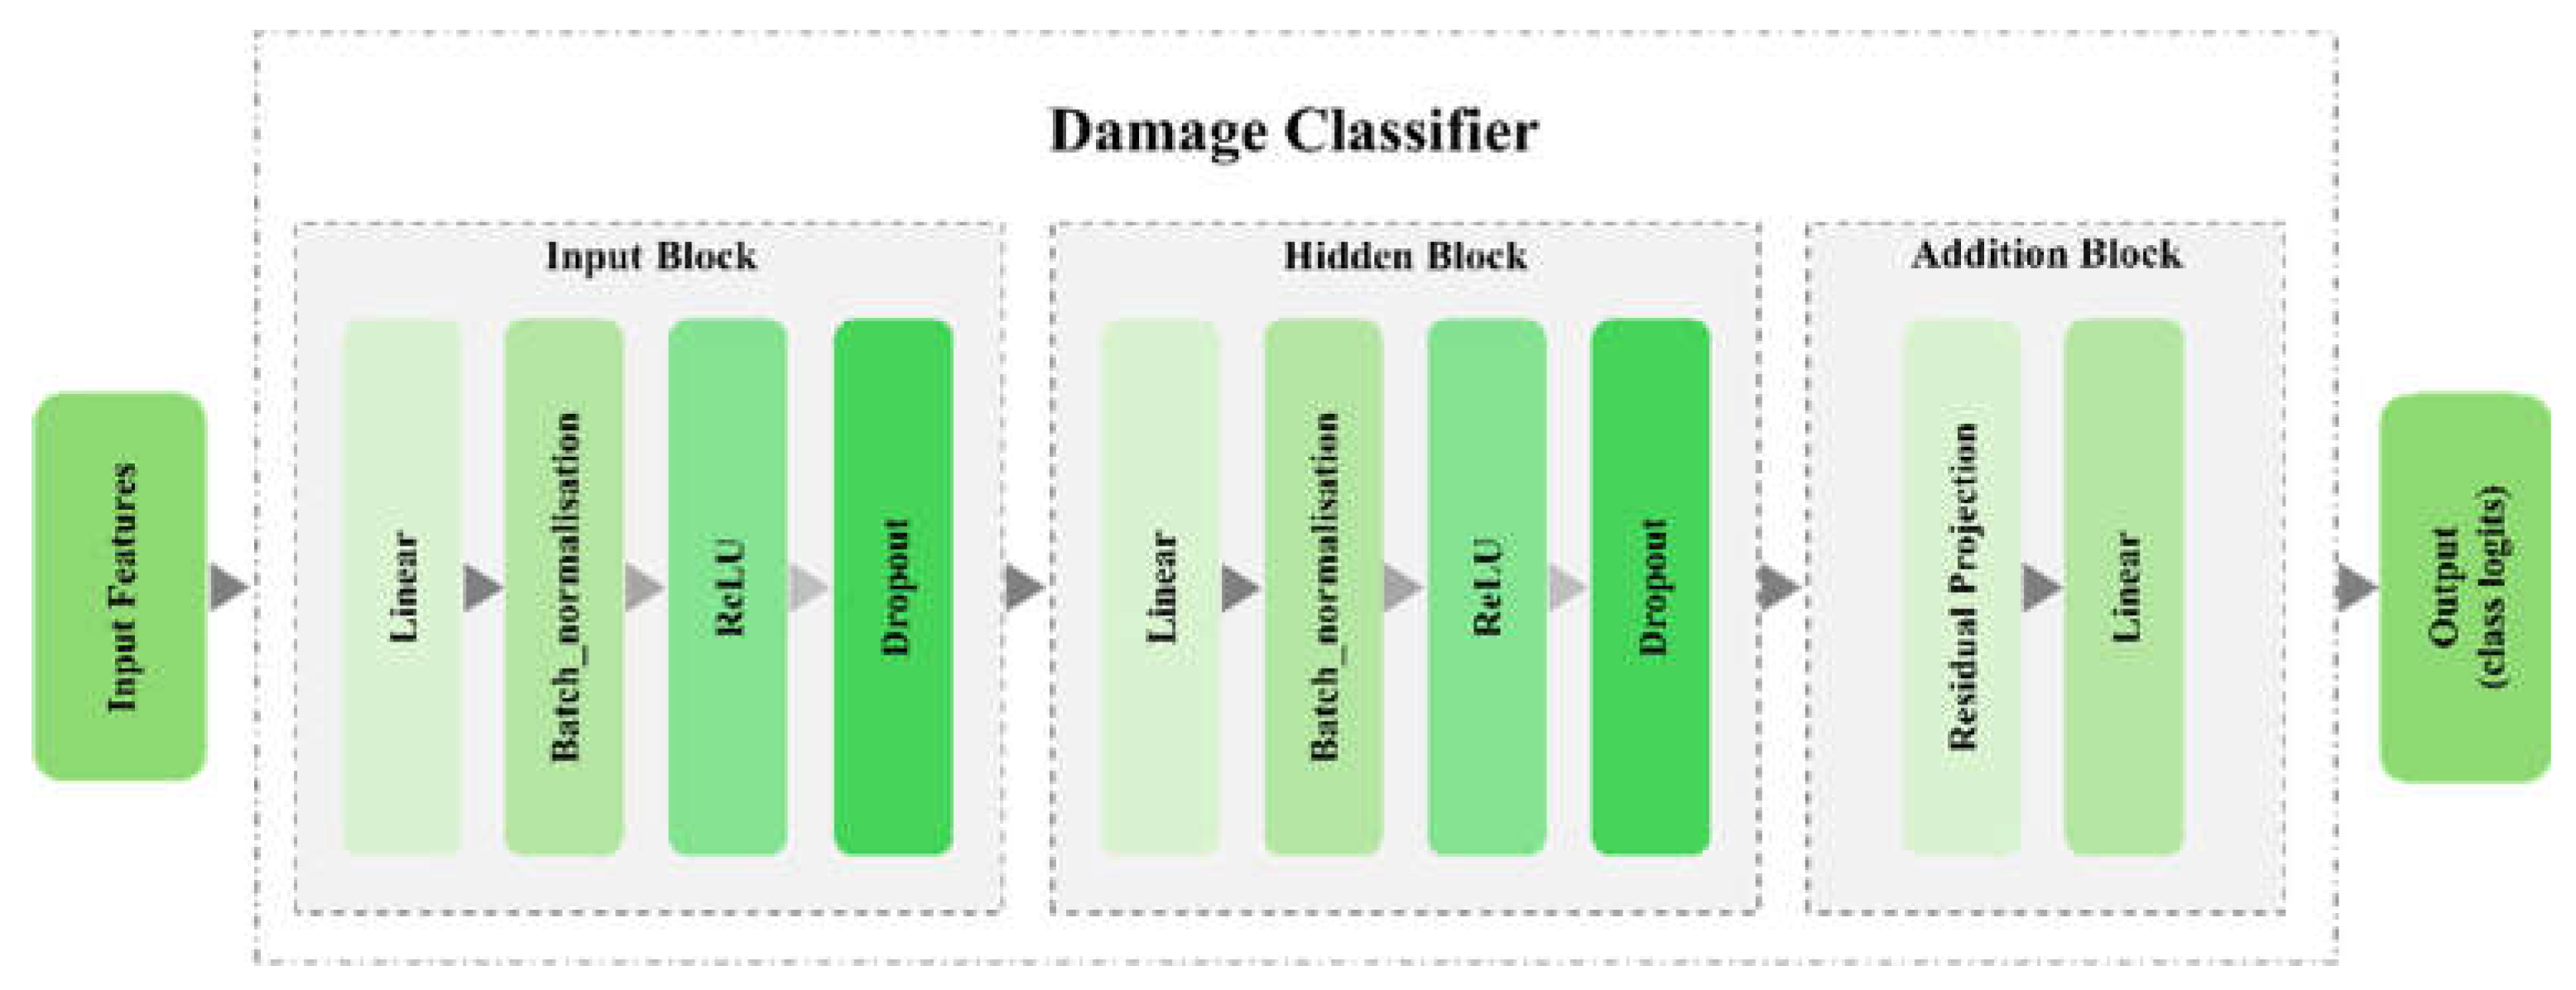
Figure 4.
The test rig setup with carbon-epoxy laminate plate and PZT transducers and temperature chamber from the CONCEPT experiments
Figure 4.
The test rig setup with carbon-epoxy laminate plate and PZT transducers and temperature chamber from the CONCEPT experiments
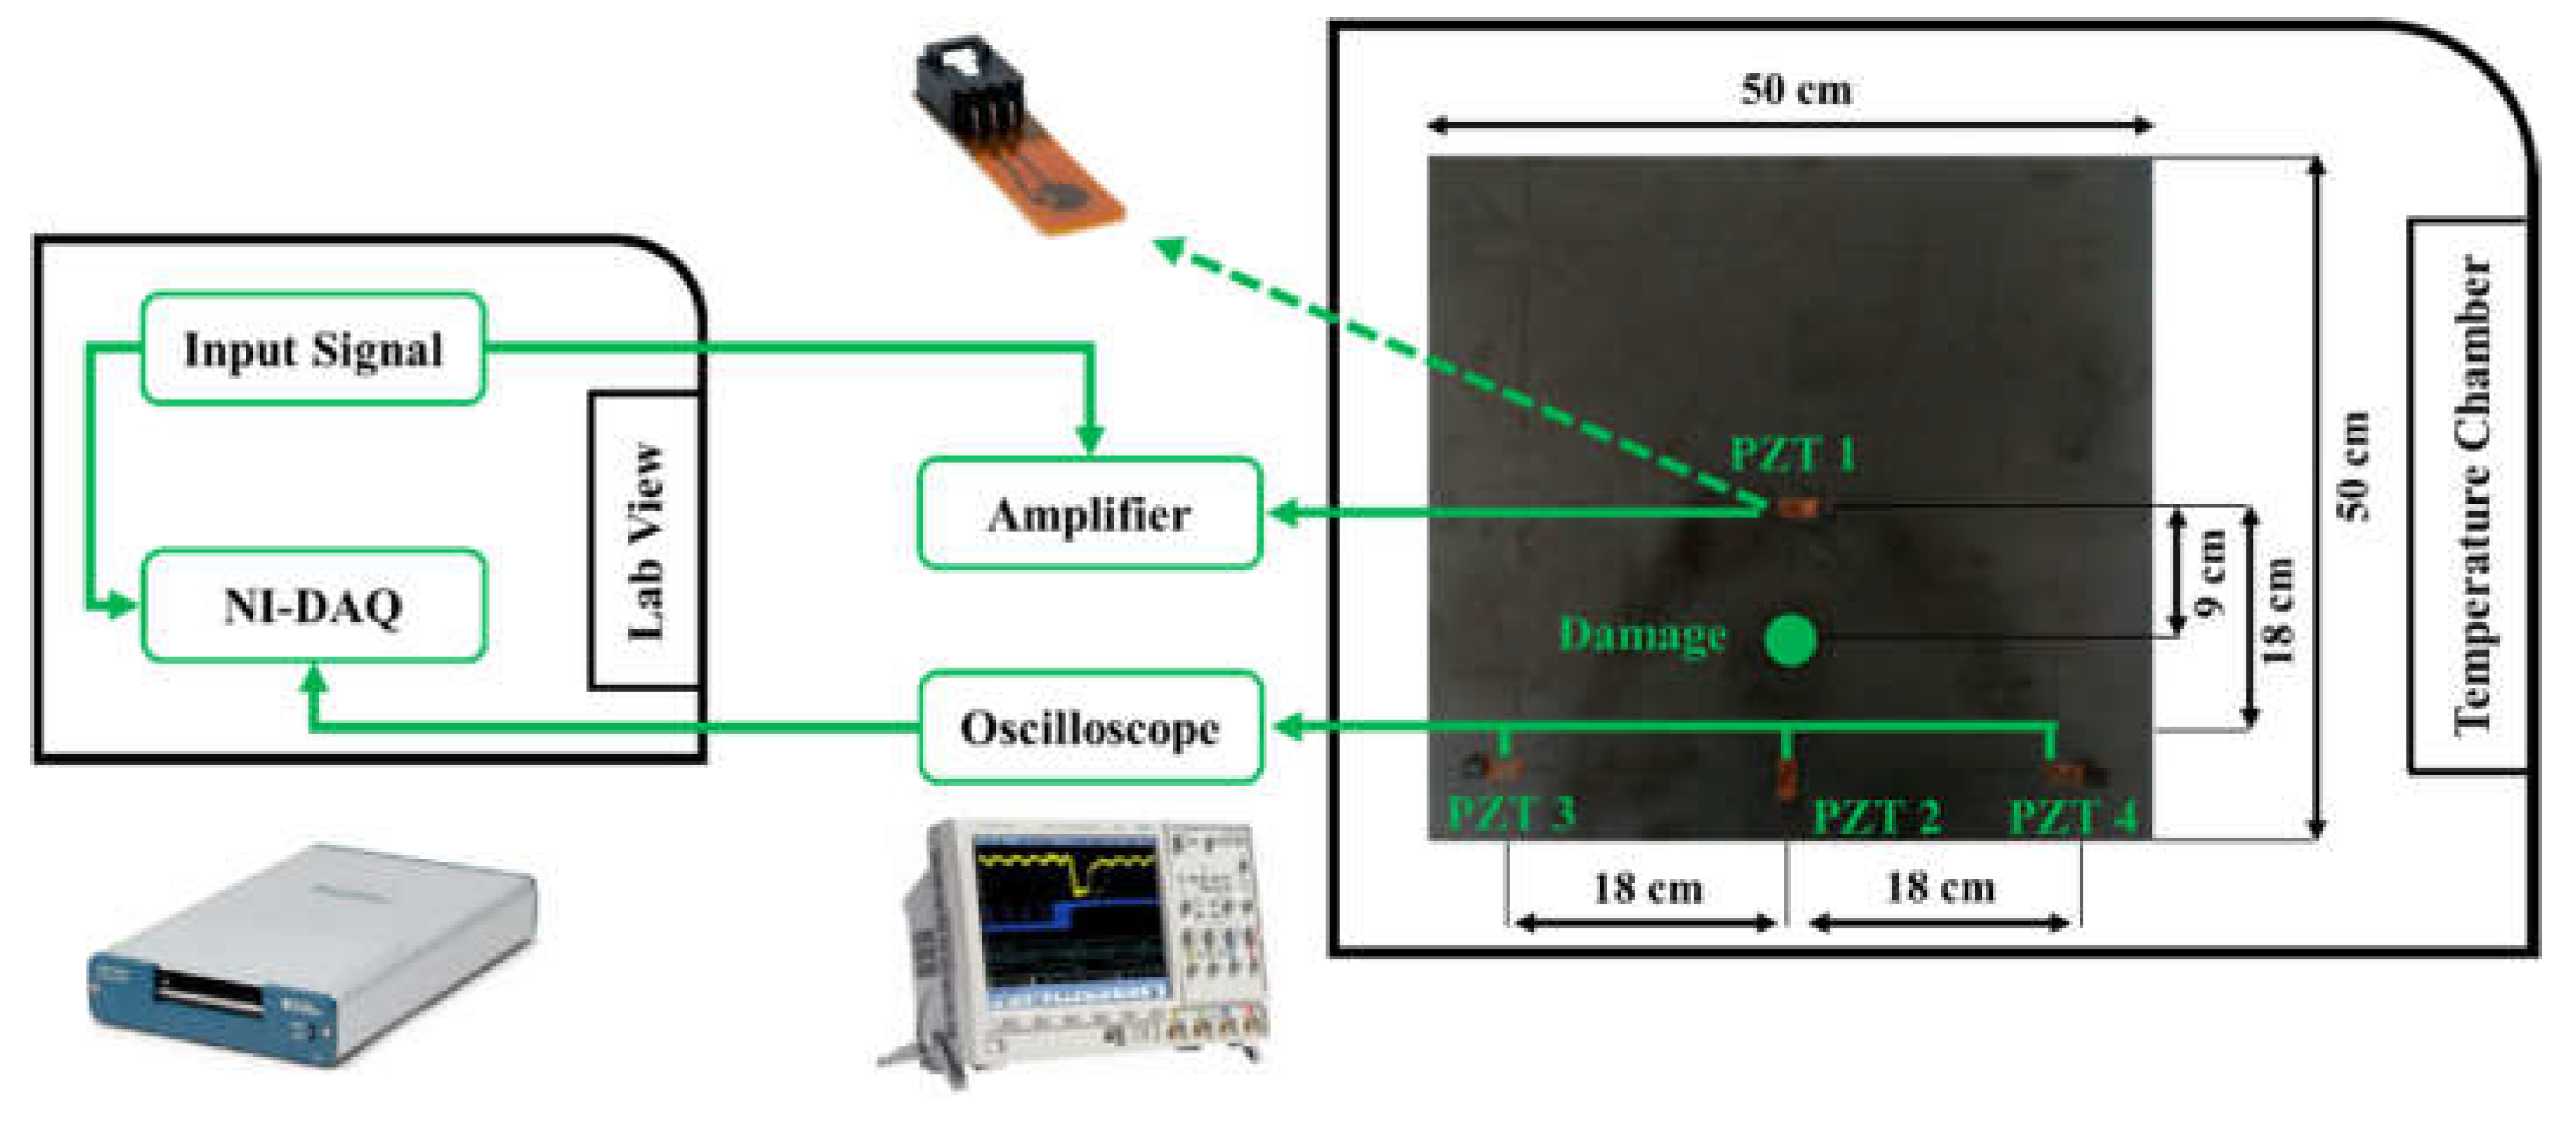
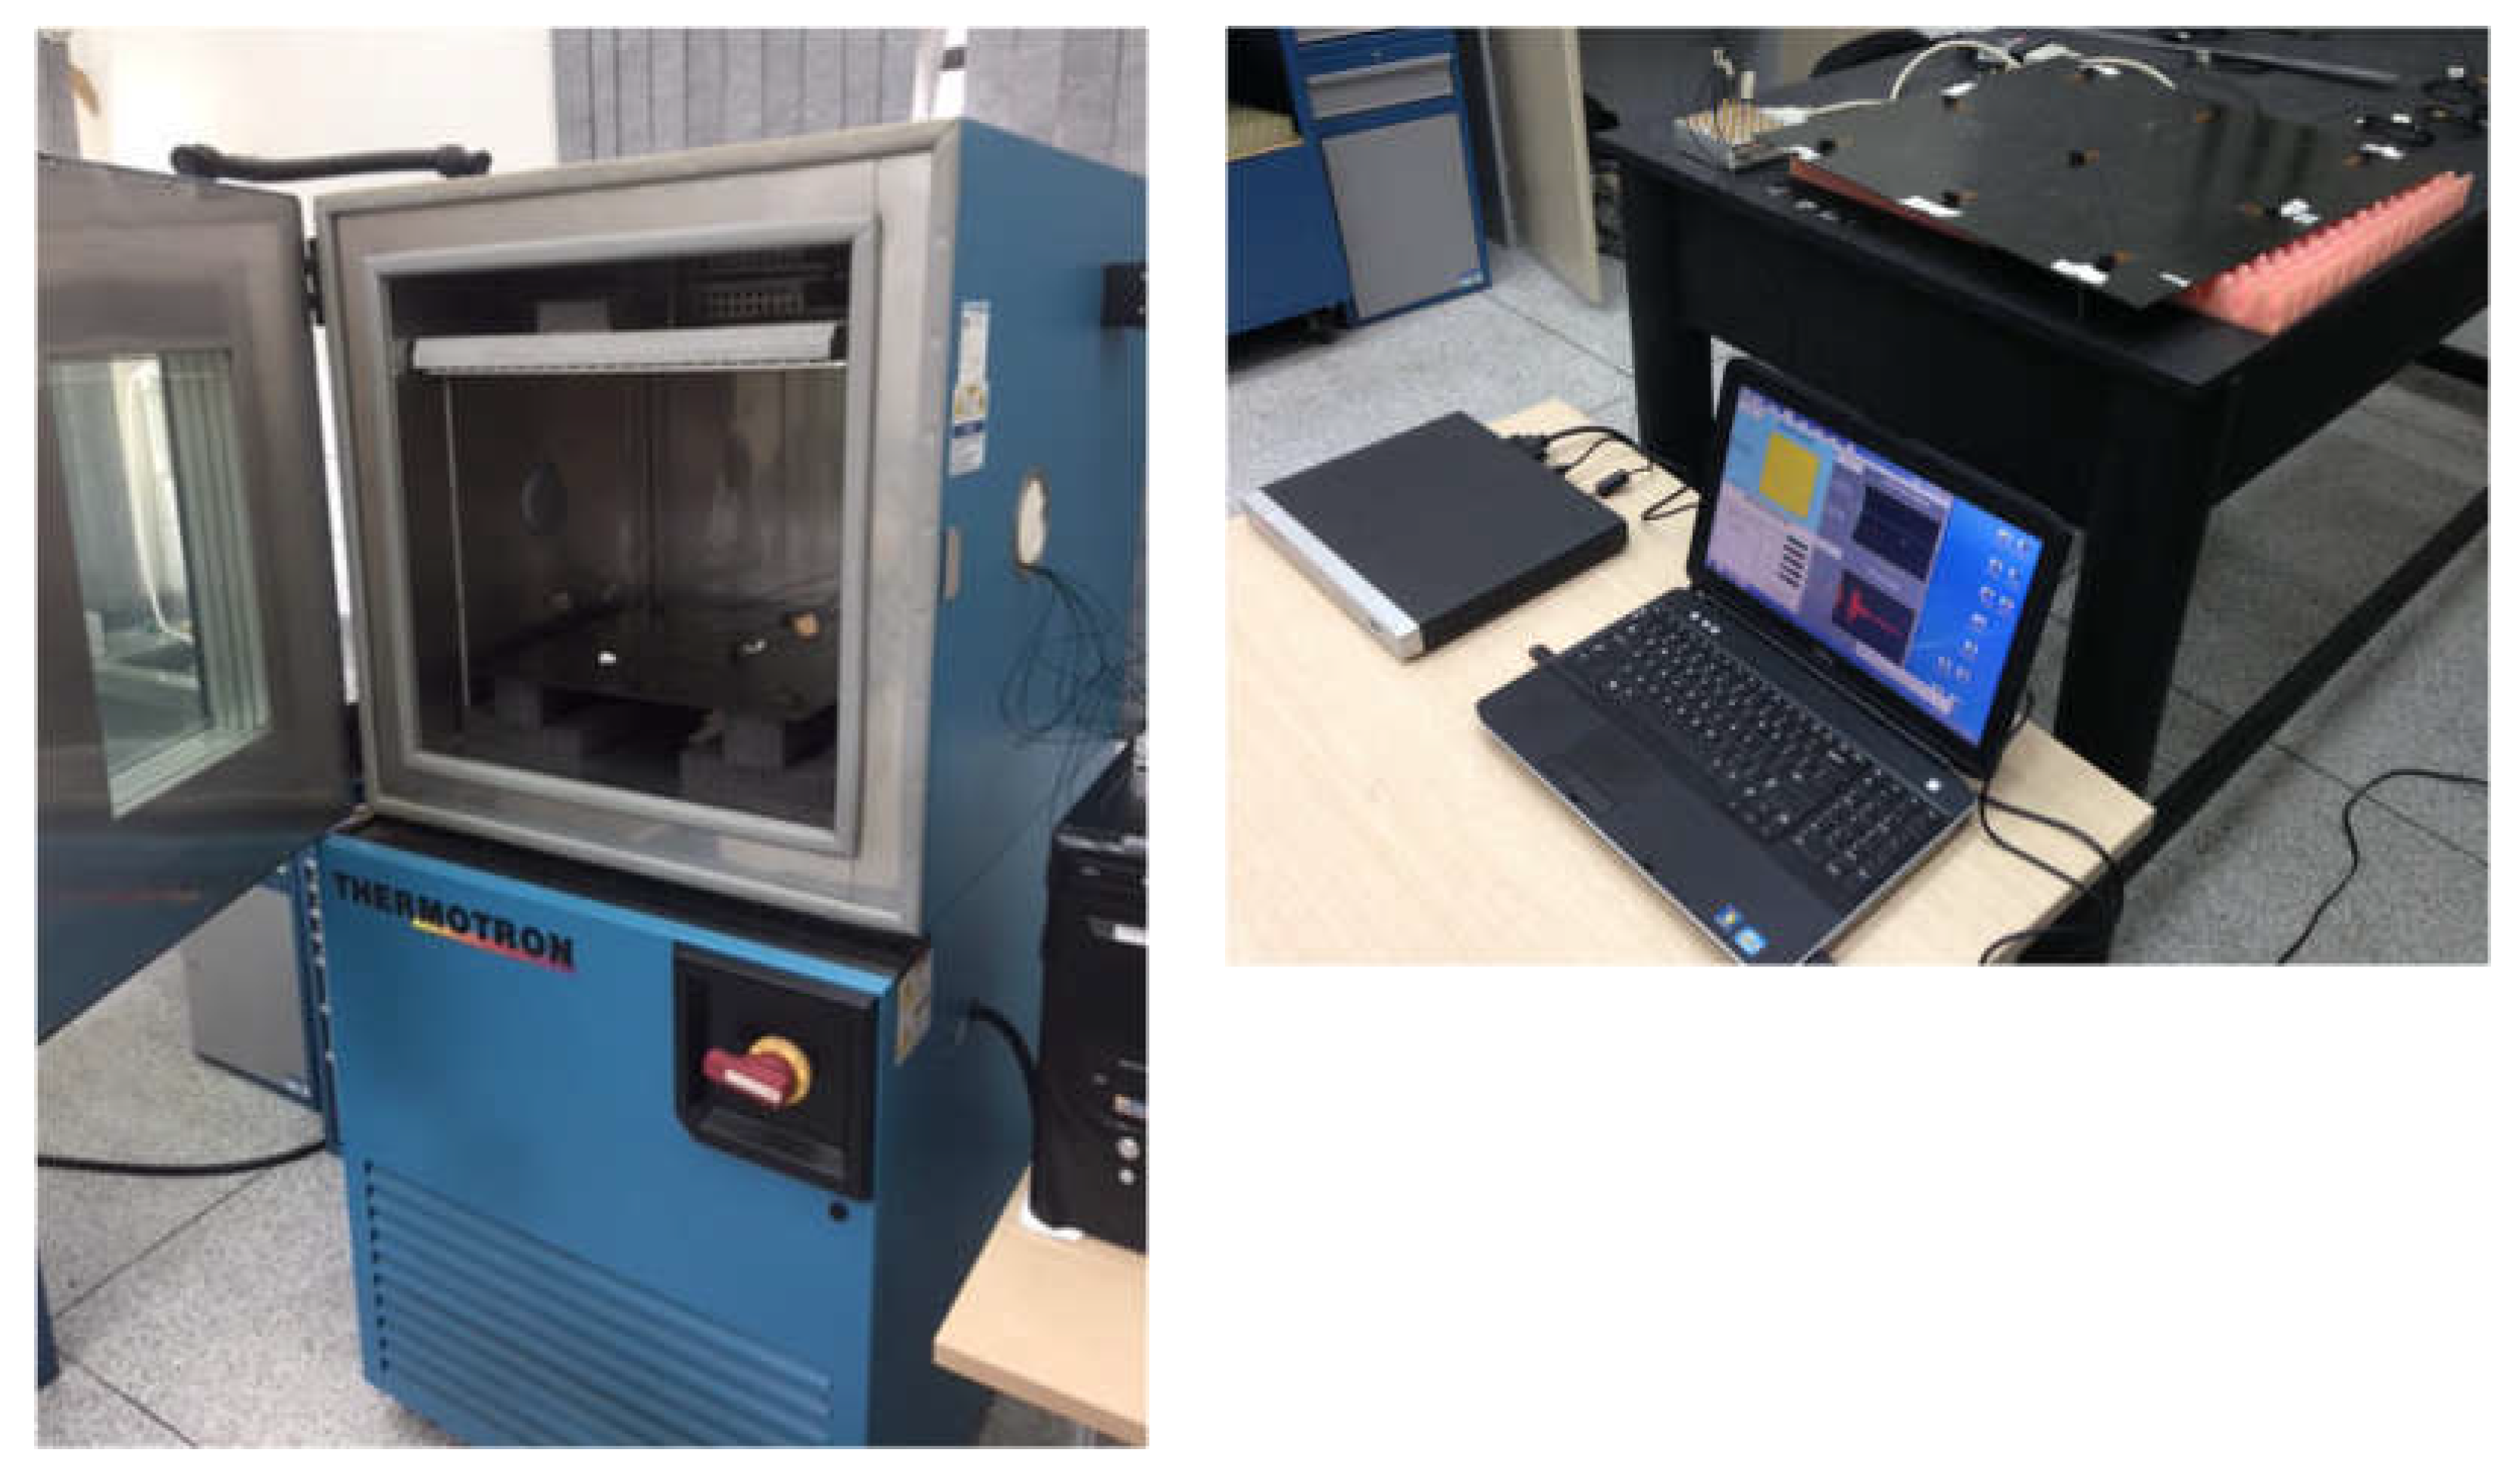
Figure 5.
Time-domain signal of the experimental and synthesised data for the healthy plate for (a) PZT2, (b) PZT3, and (c) PZT4
Figure 5.
Time-domain signal of the experimental and synthesised data for the healthy plate for (a) PZT2, (b) PZT3, and (c) PZT4
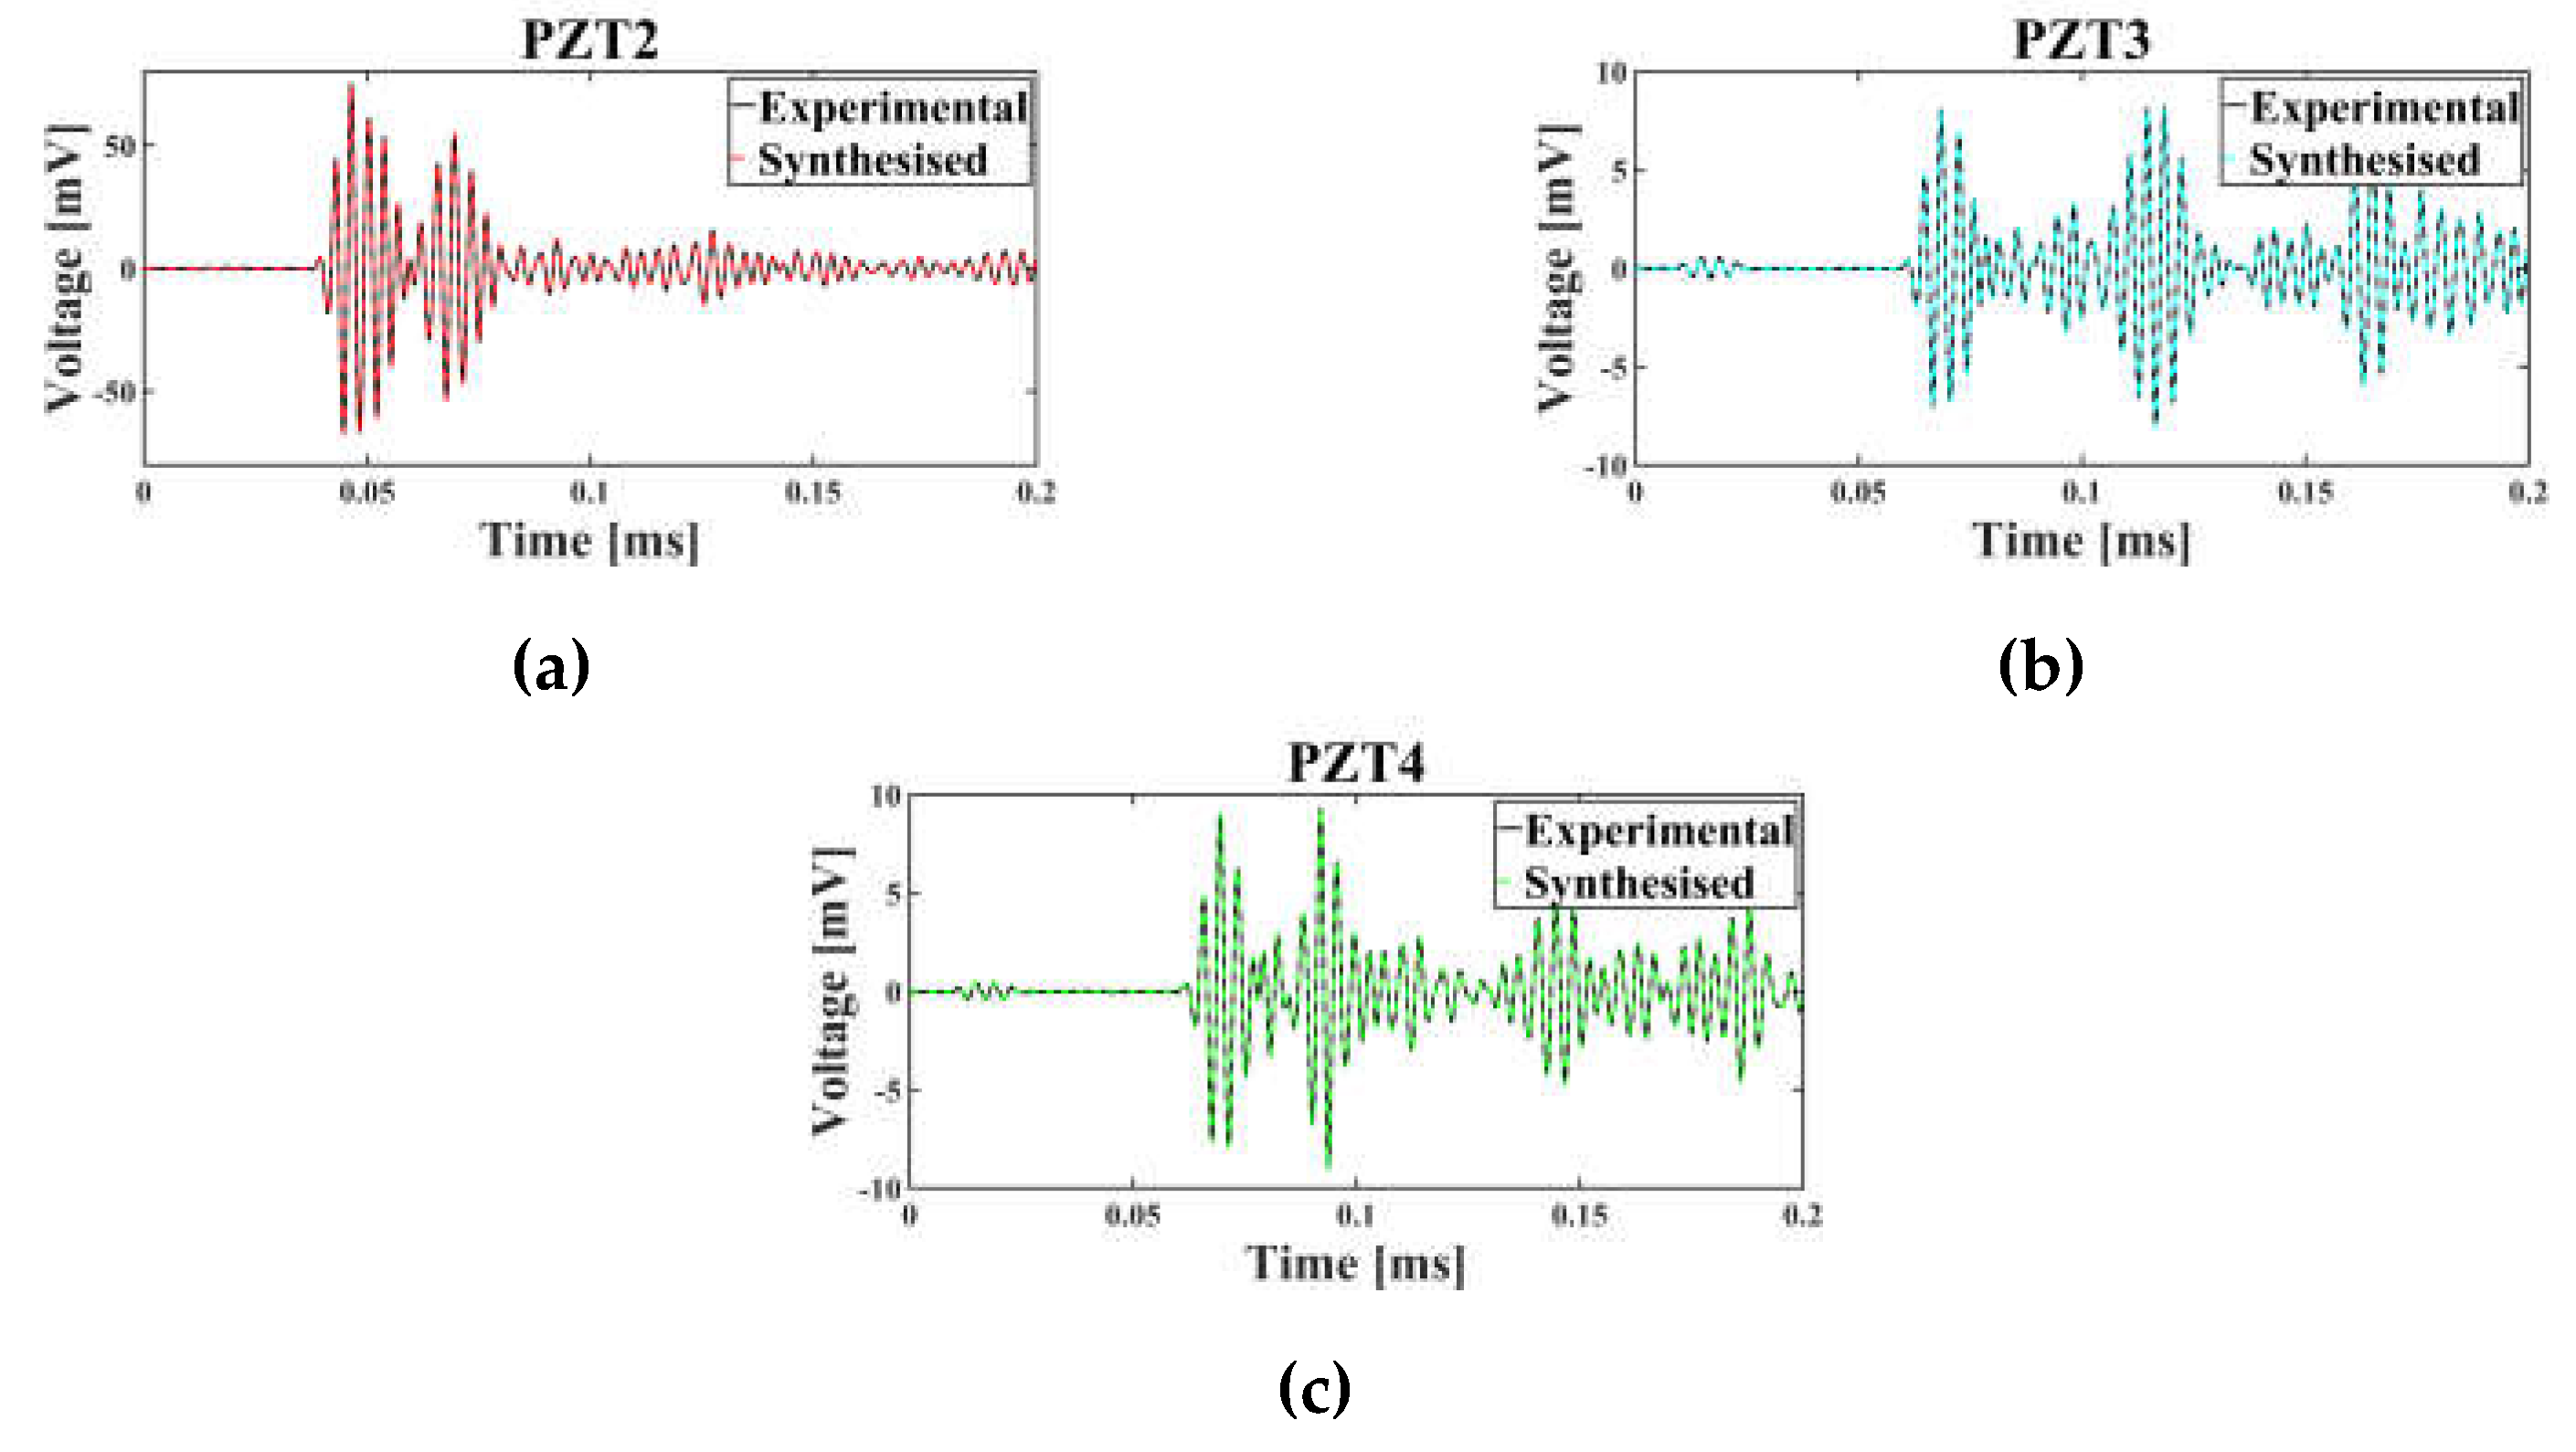
Figure 6.
Comparison of synthesised and real data across sensors (PZT2, PZT3, PZT4) at 30°C using (a) mean DTW values and (b) mean CC values
Figure 6.
Comparison of synthesised and real data across sensors (PZT2, PZT3, PZT4) at 30°C using (a) mean DTW values and (b) mean CC values
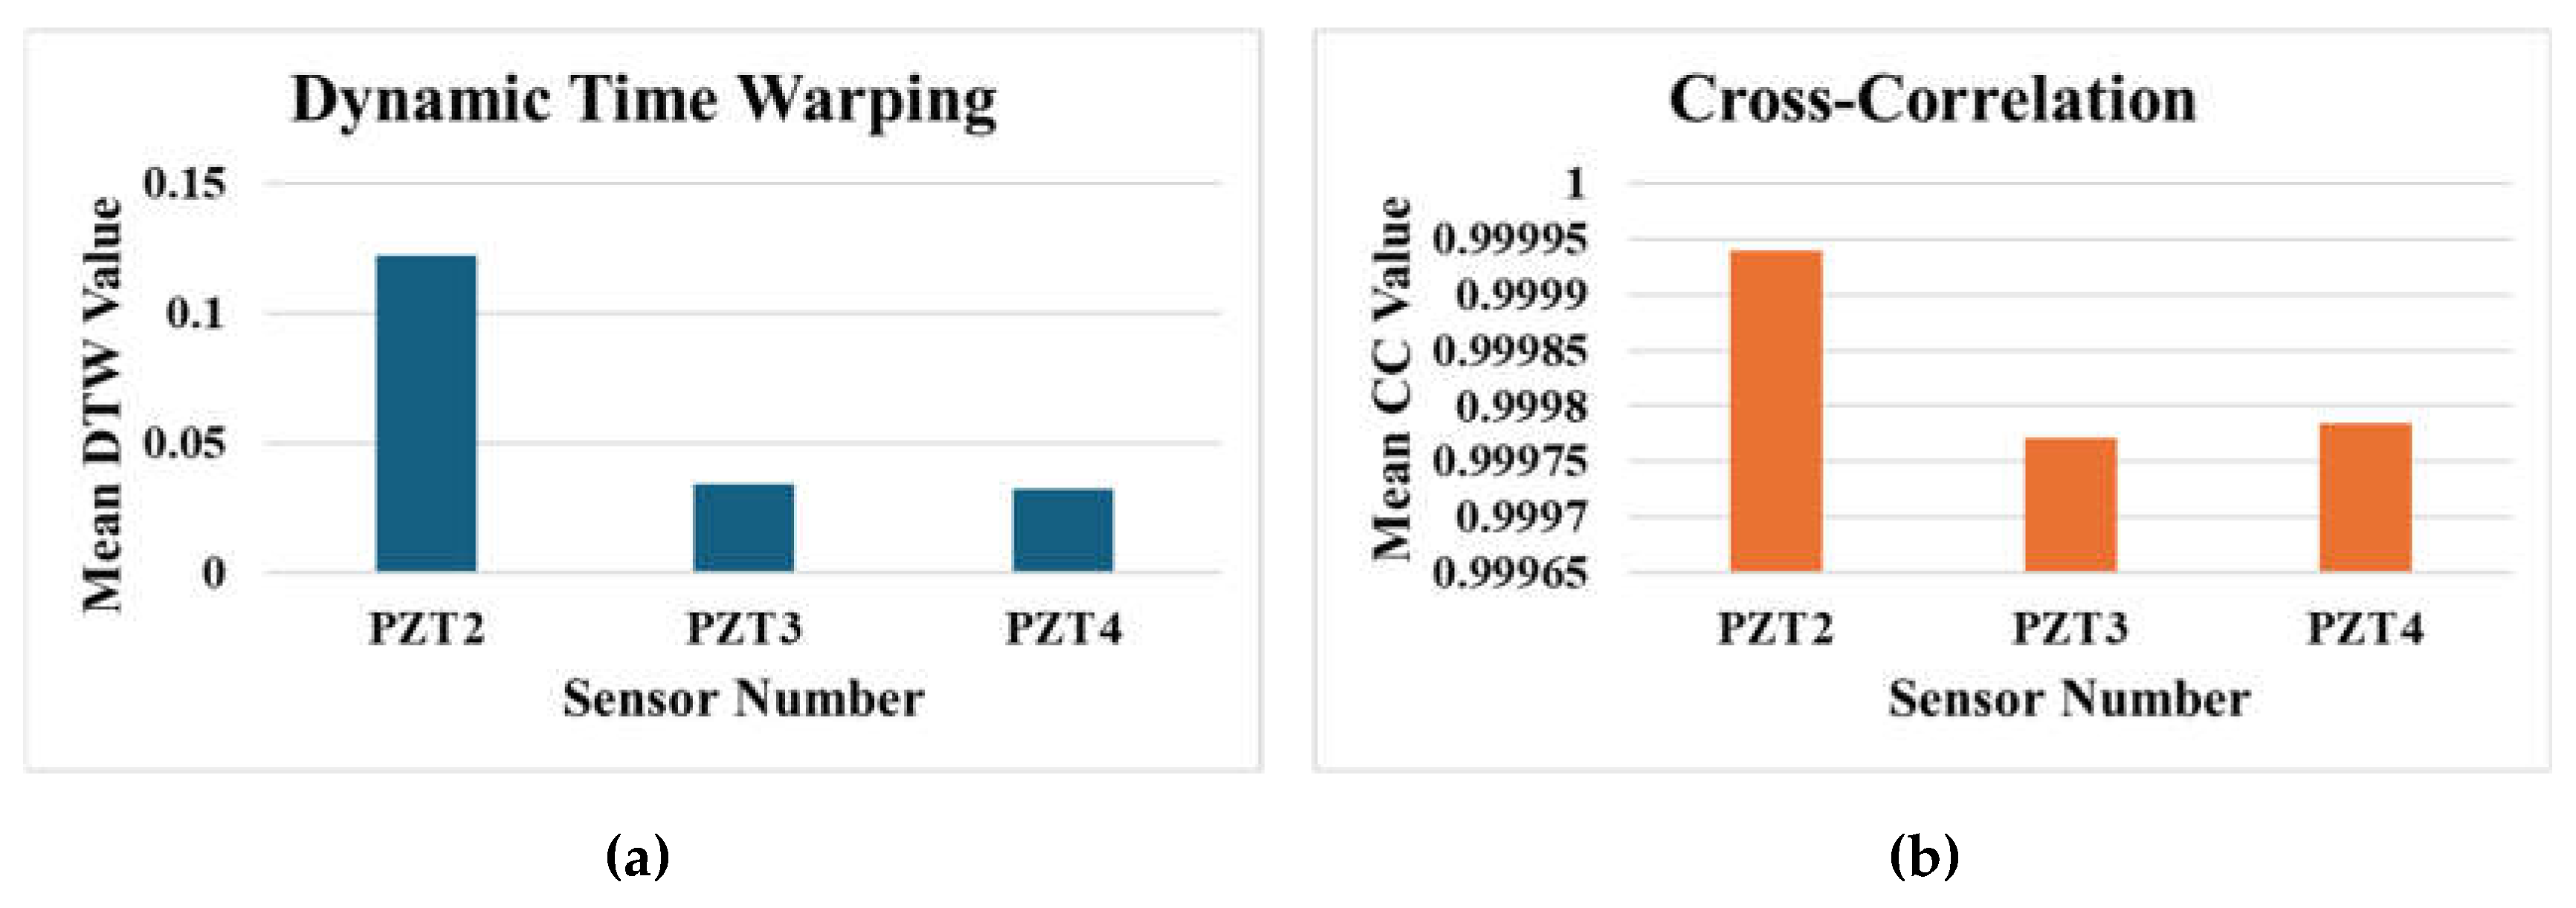
Figure 7.
Hyperparameter optimisation history
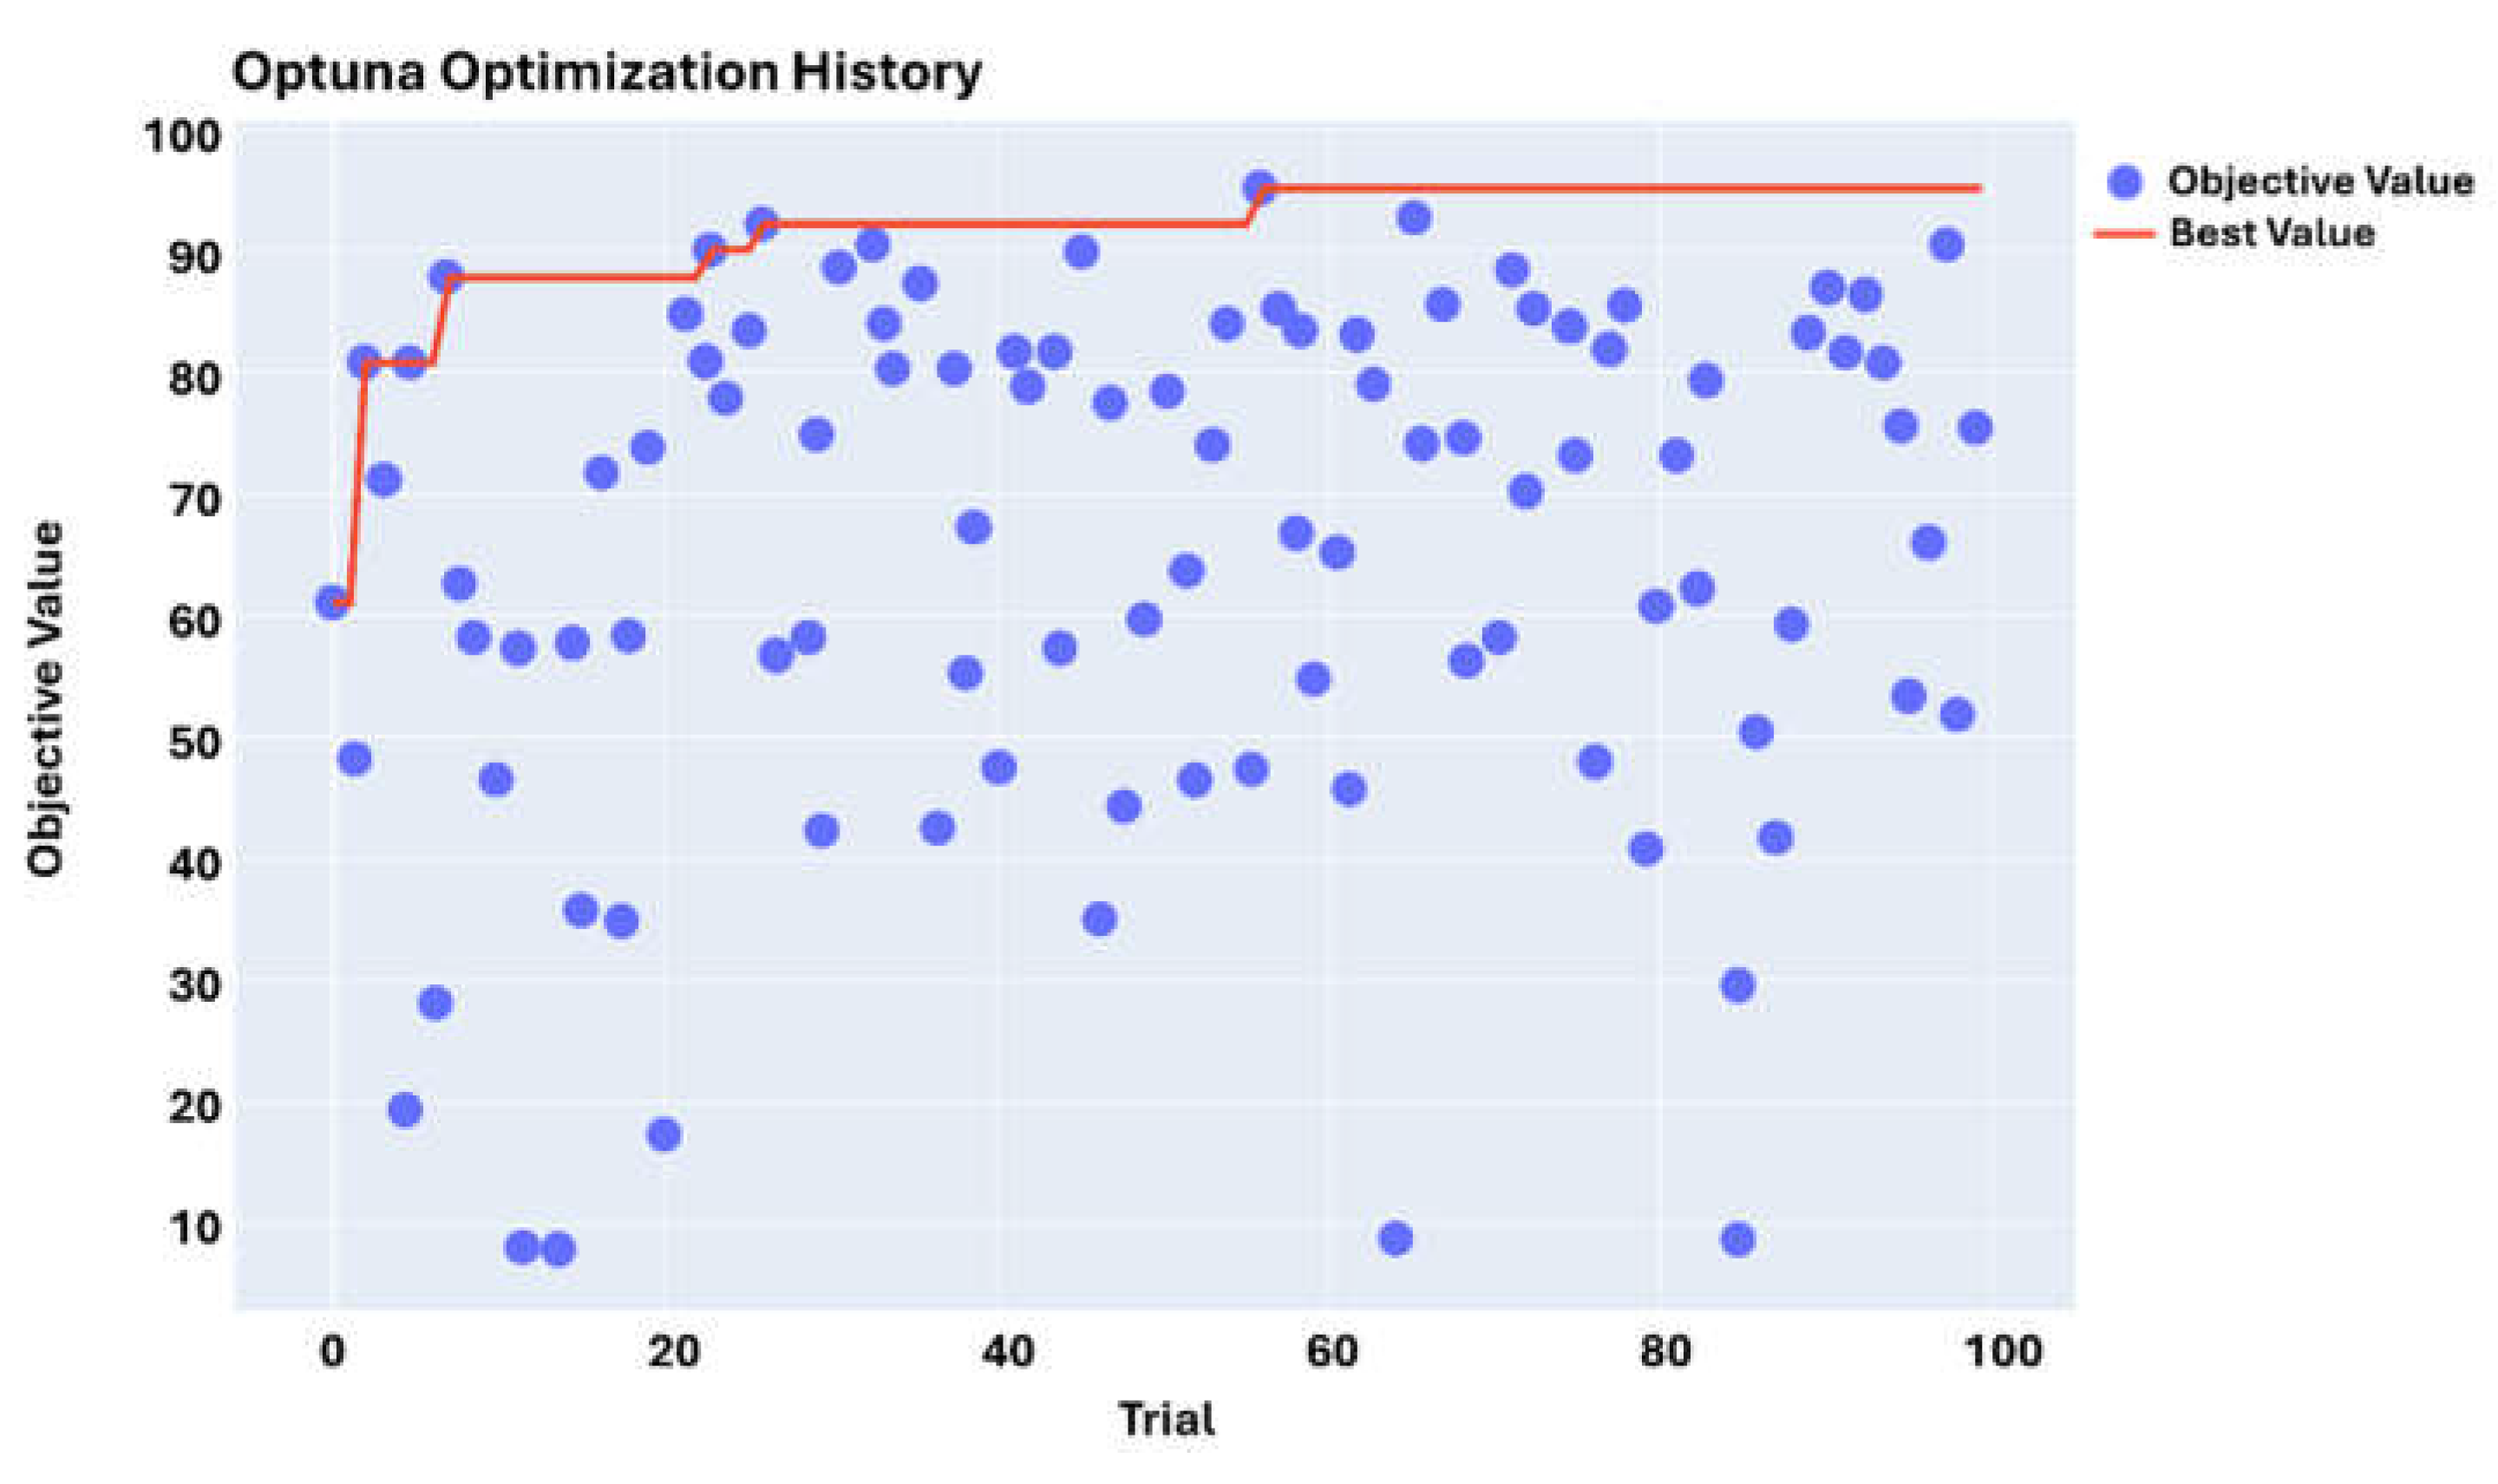
Figure 8.
Slice plot of hyperparameters during optimisation
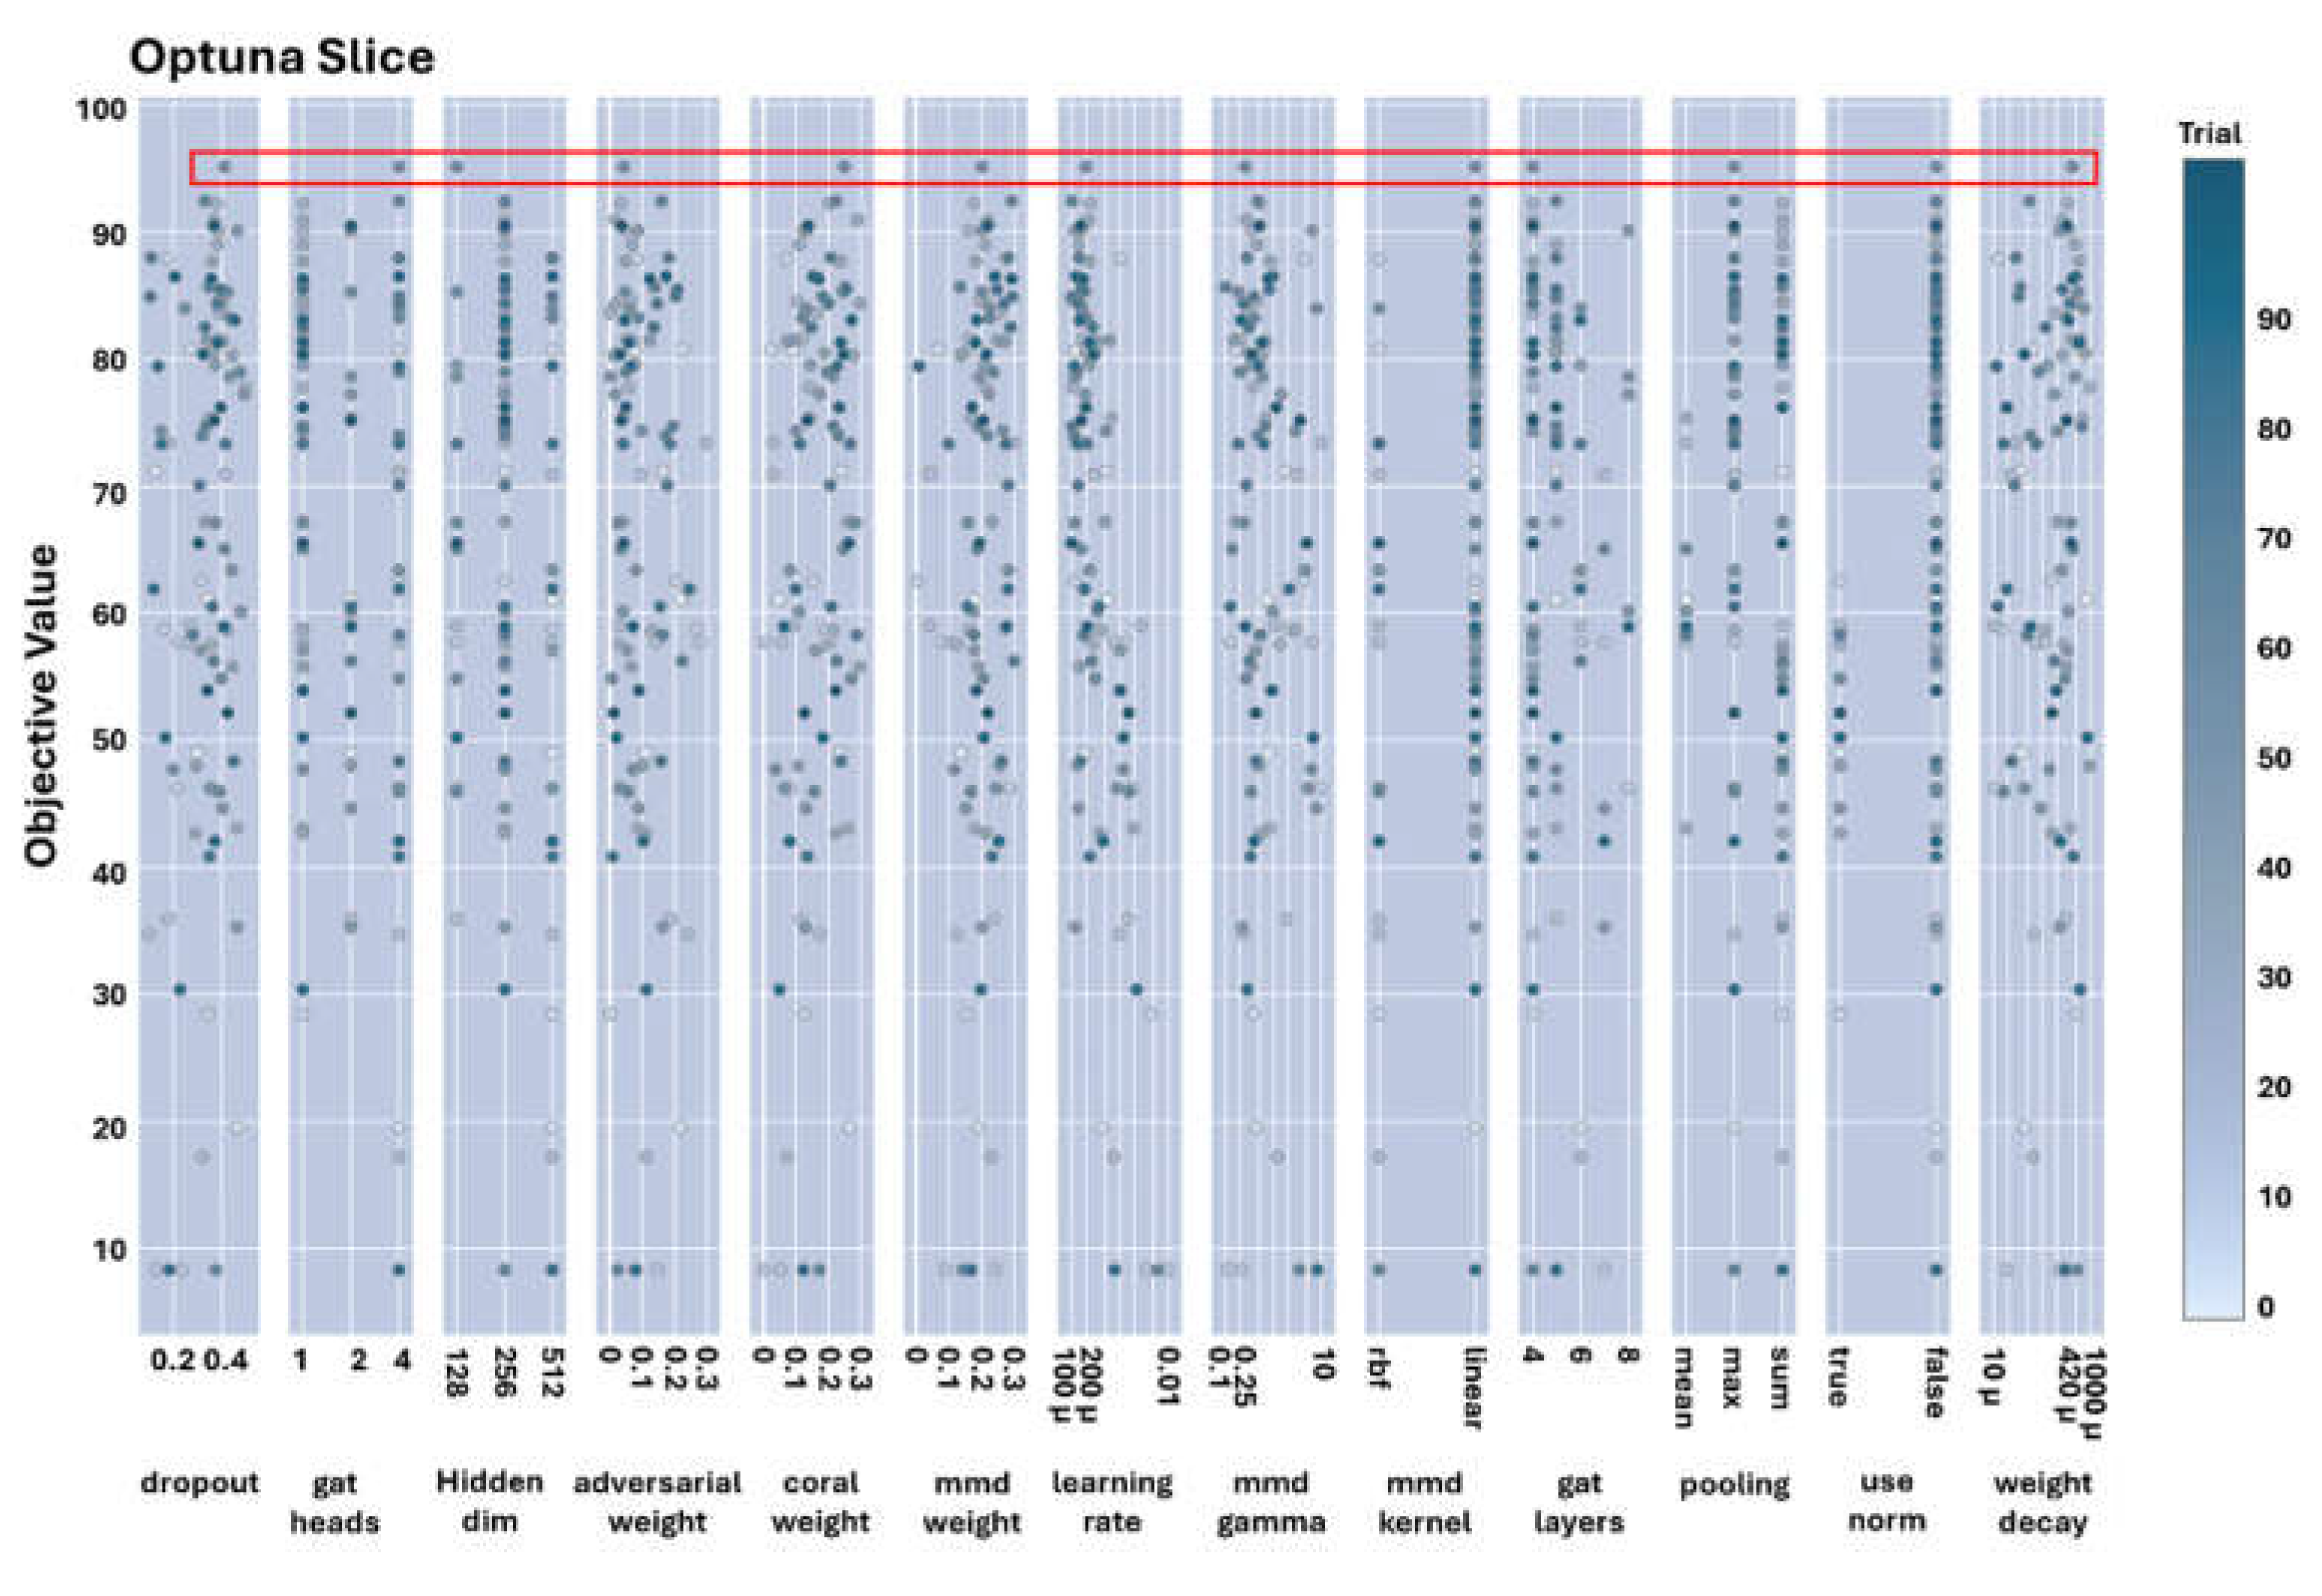
Figure 9.
Classification outcomes through GAT-CAMDA without domain adaptation section for (a) source domain test set and (b) target test set
Figure 9.
Classification outcomes through GAT-CAMDA without domain adaptation section for (a) source domain test set and (b) target test set
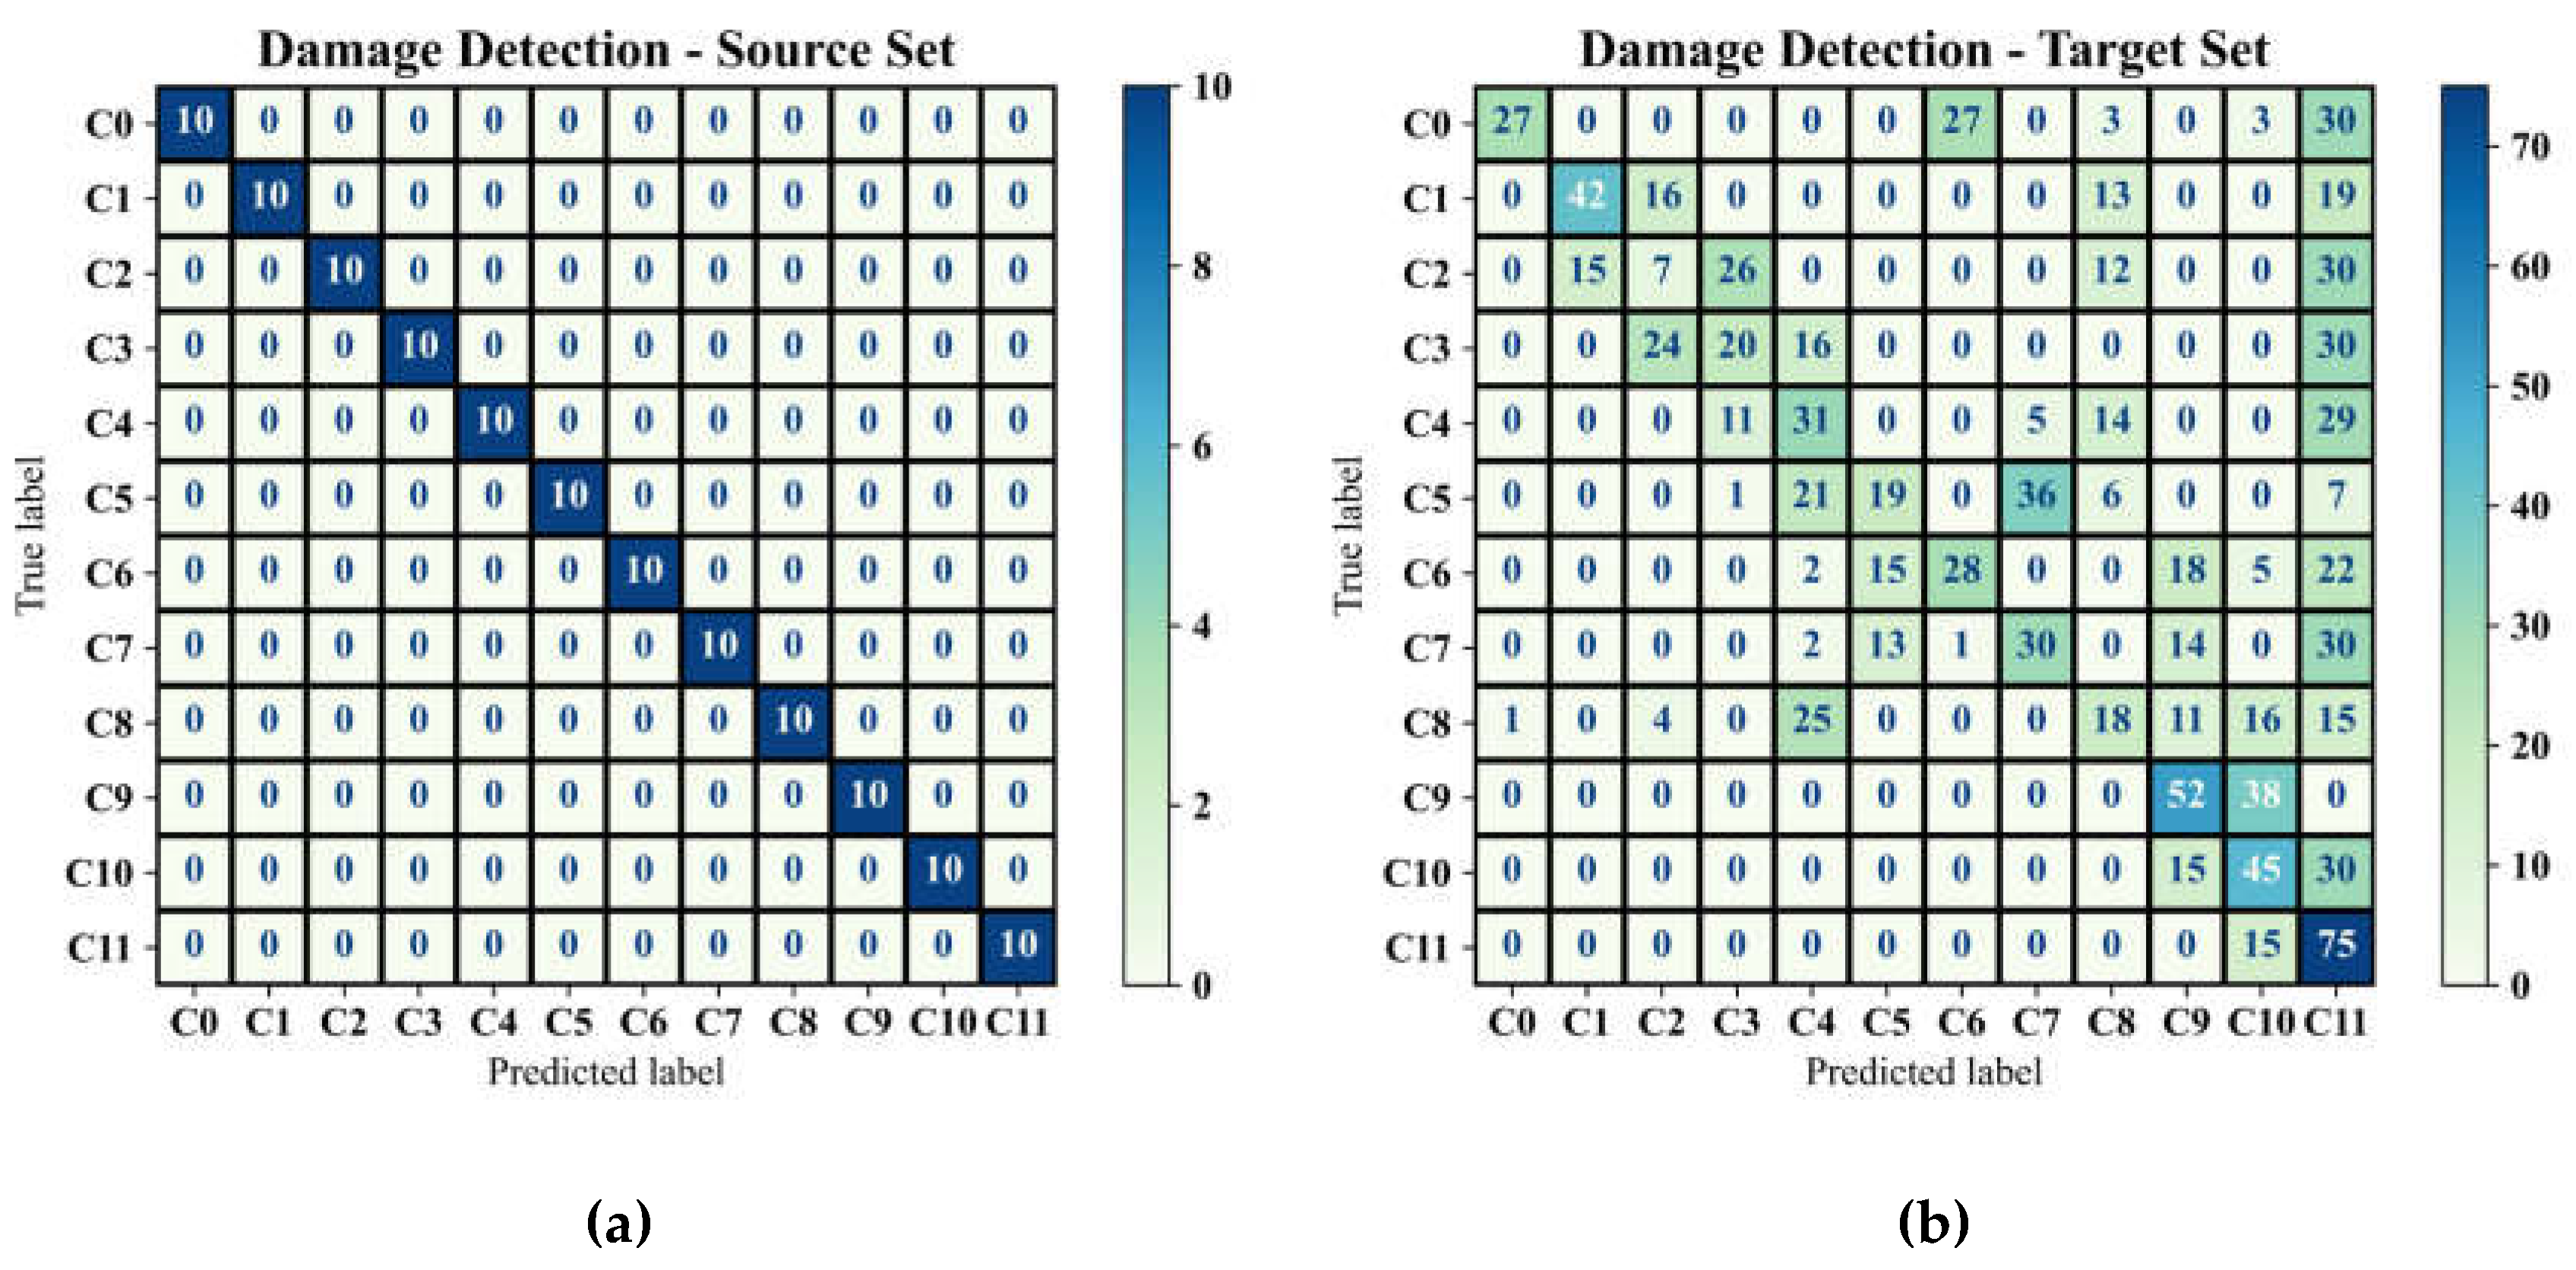
Figure 10.
Classification outcomes produced by the optimum GAT-CAMDA framework on the target test set, showing (a) the confusion matrix and (b) the classification performance metrics
Figure 10.
Classification outcomes produced by the optimum GAT-CAMDA framework on the target test set, showing (a) the confusion matrix and (b) the classification performance metrics
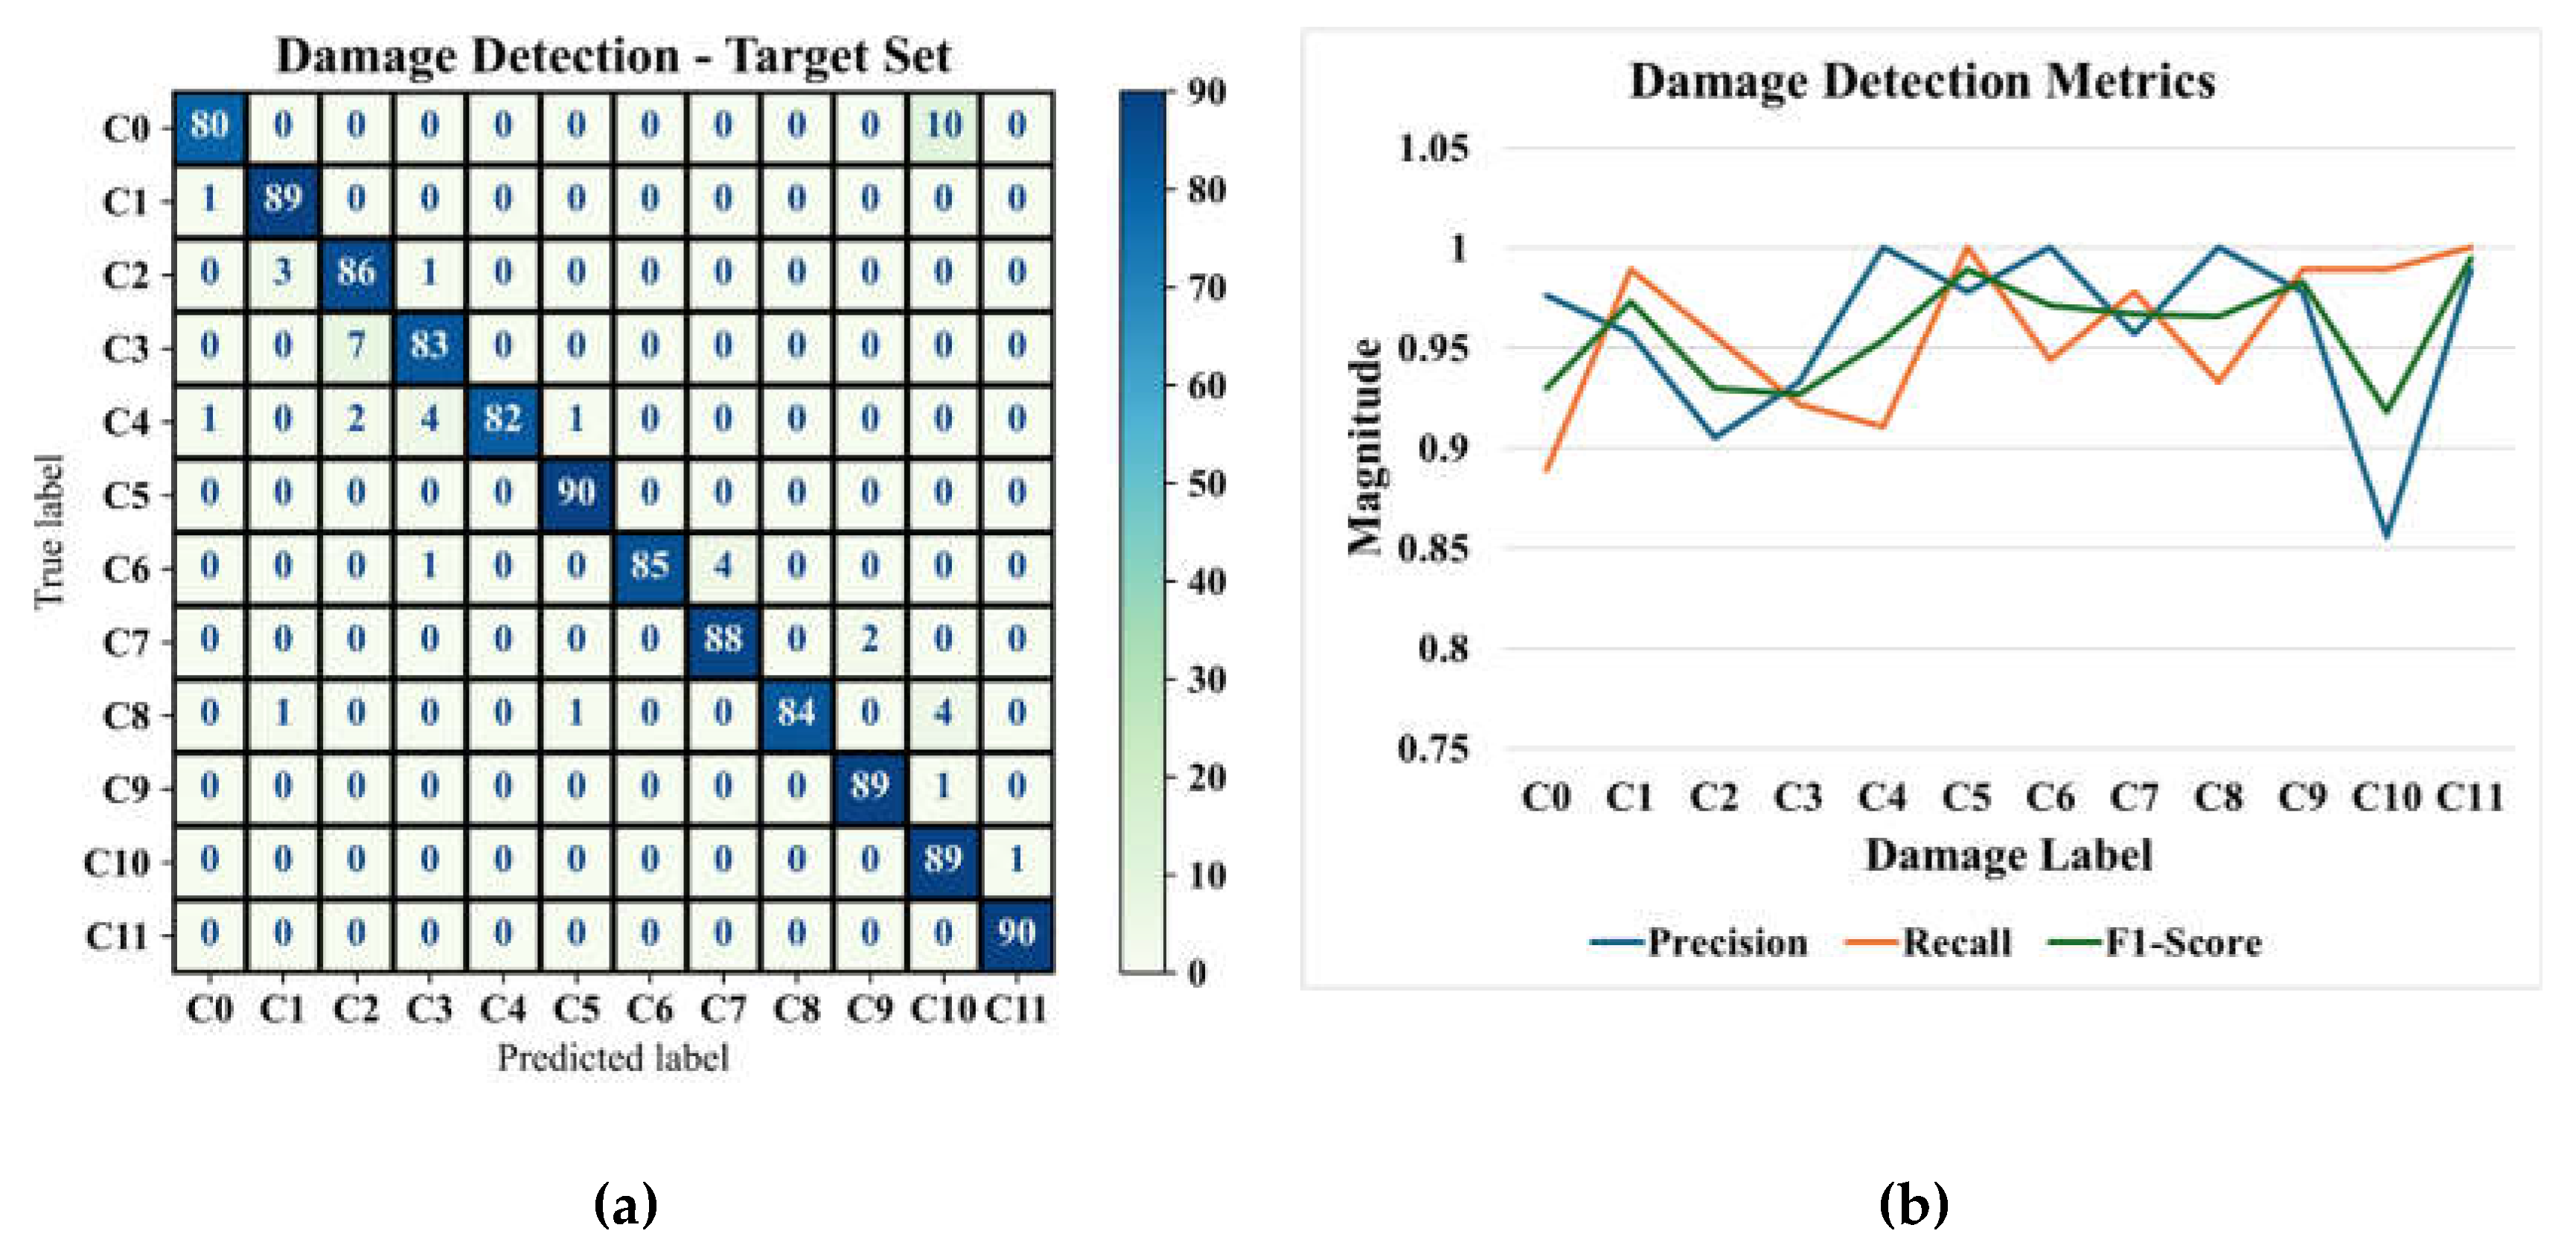
Figure 11.
Two-dimensional t-SNE projections illustrating the distribution of extracted features (a) before domain adaptation and (b) after domain adaptation using the GAT-CAMDA framework
Figure 11.
Two-dimensional t-SNE projections illustrating the distribution of extracted features (a) before domain adaptation and (b) after domain adaptation using the GAT-CAMDA framework
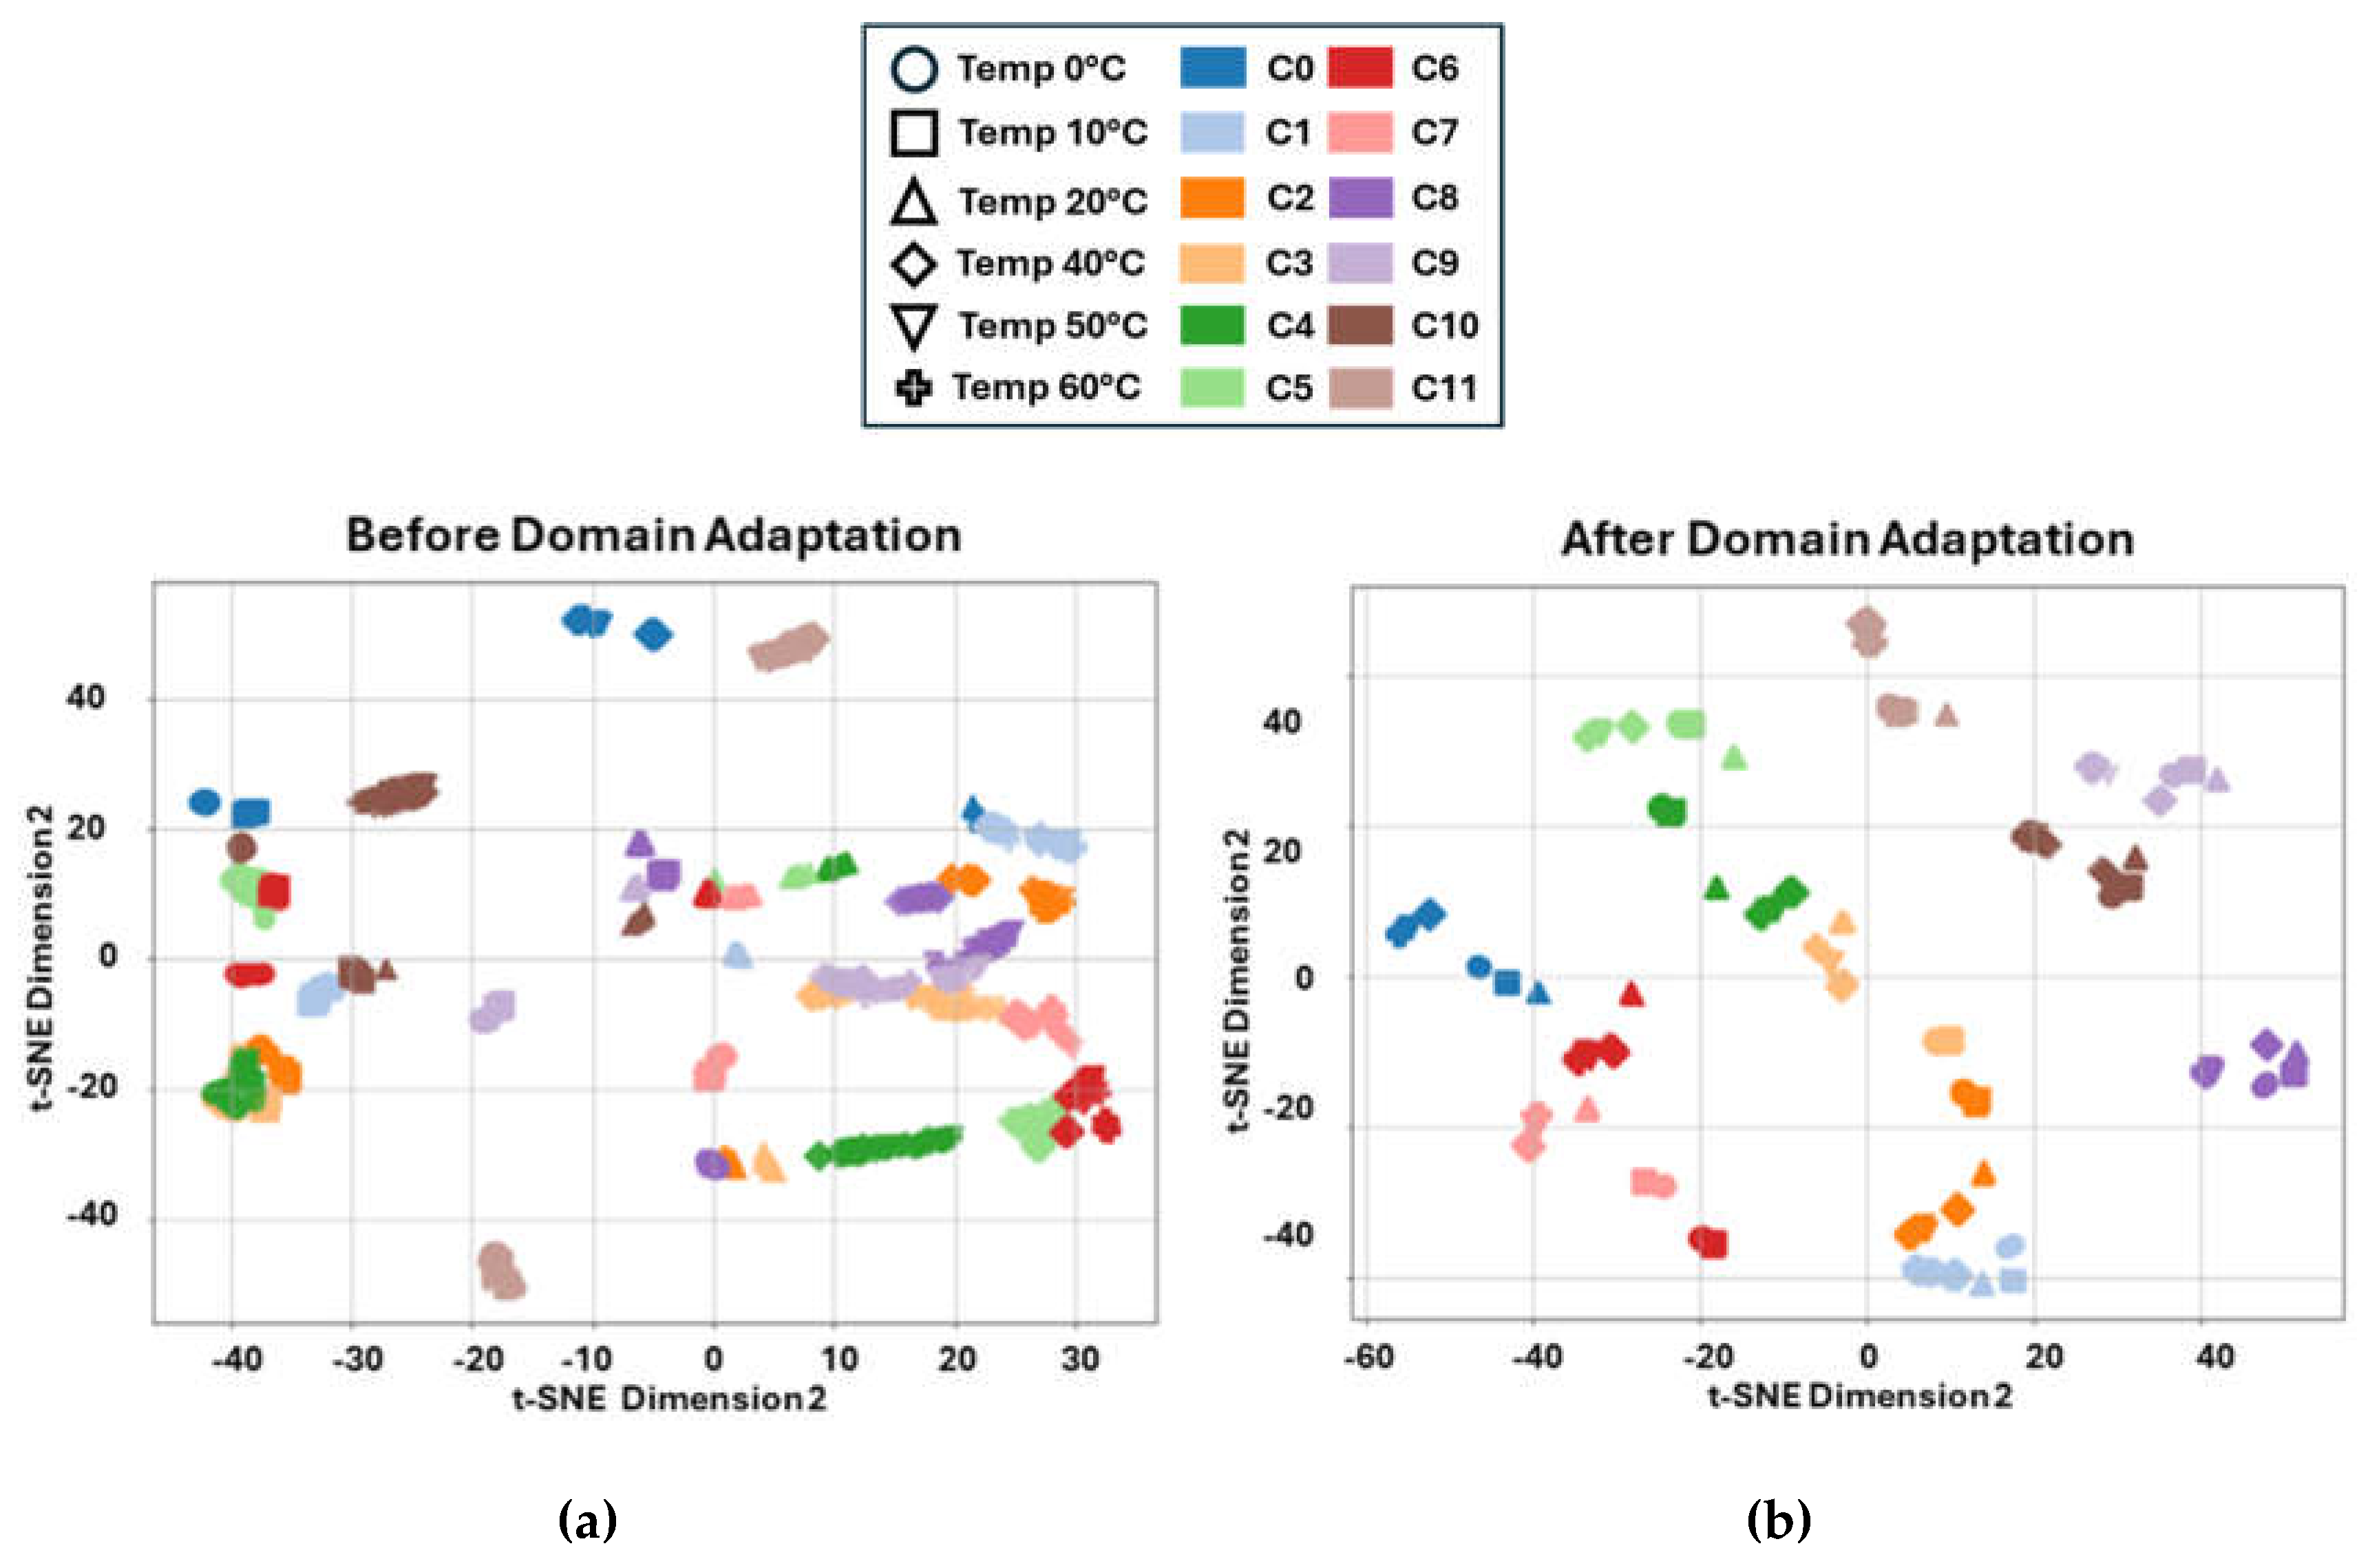
Figure 12.
Damage detection result utilising (a) Deep CORAL, (b) PRED, (c) SA, and (d) DANN
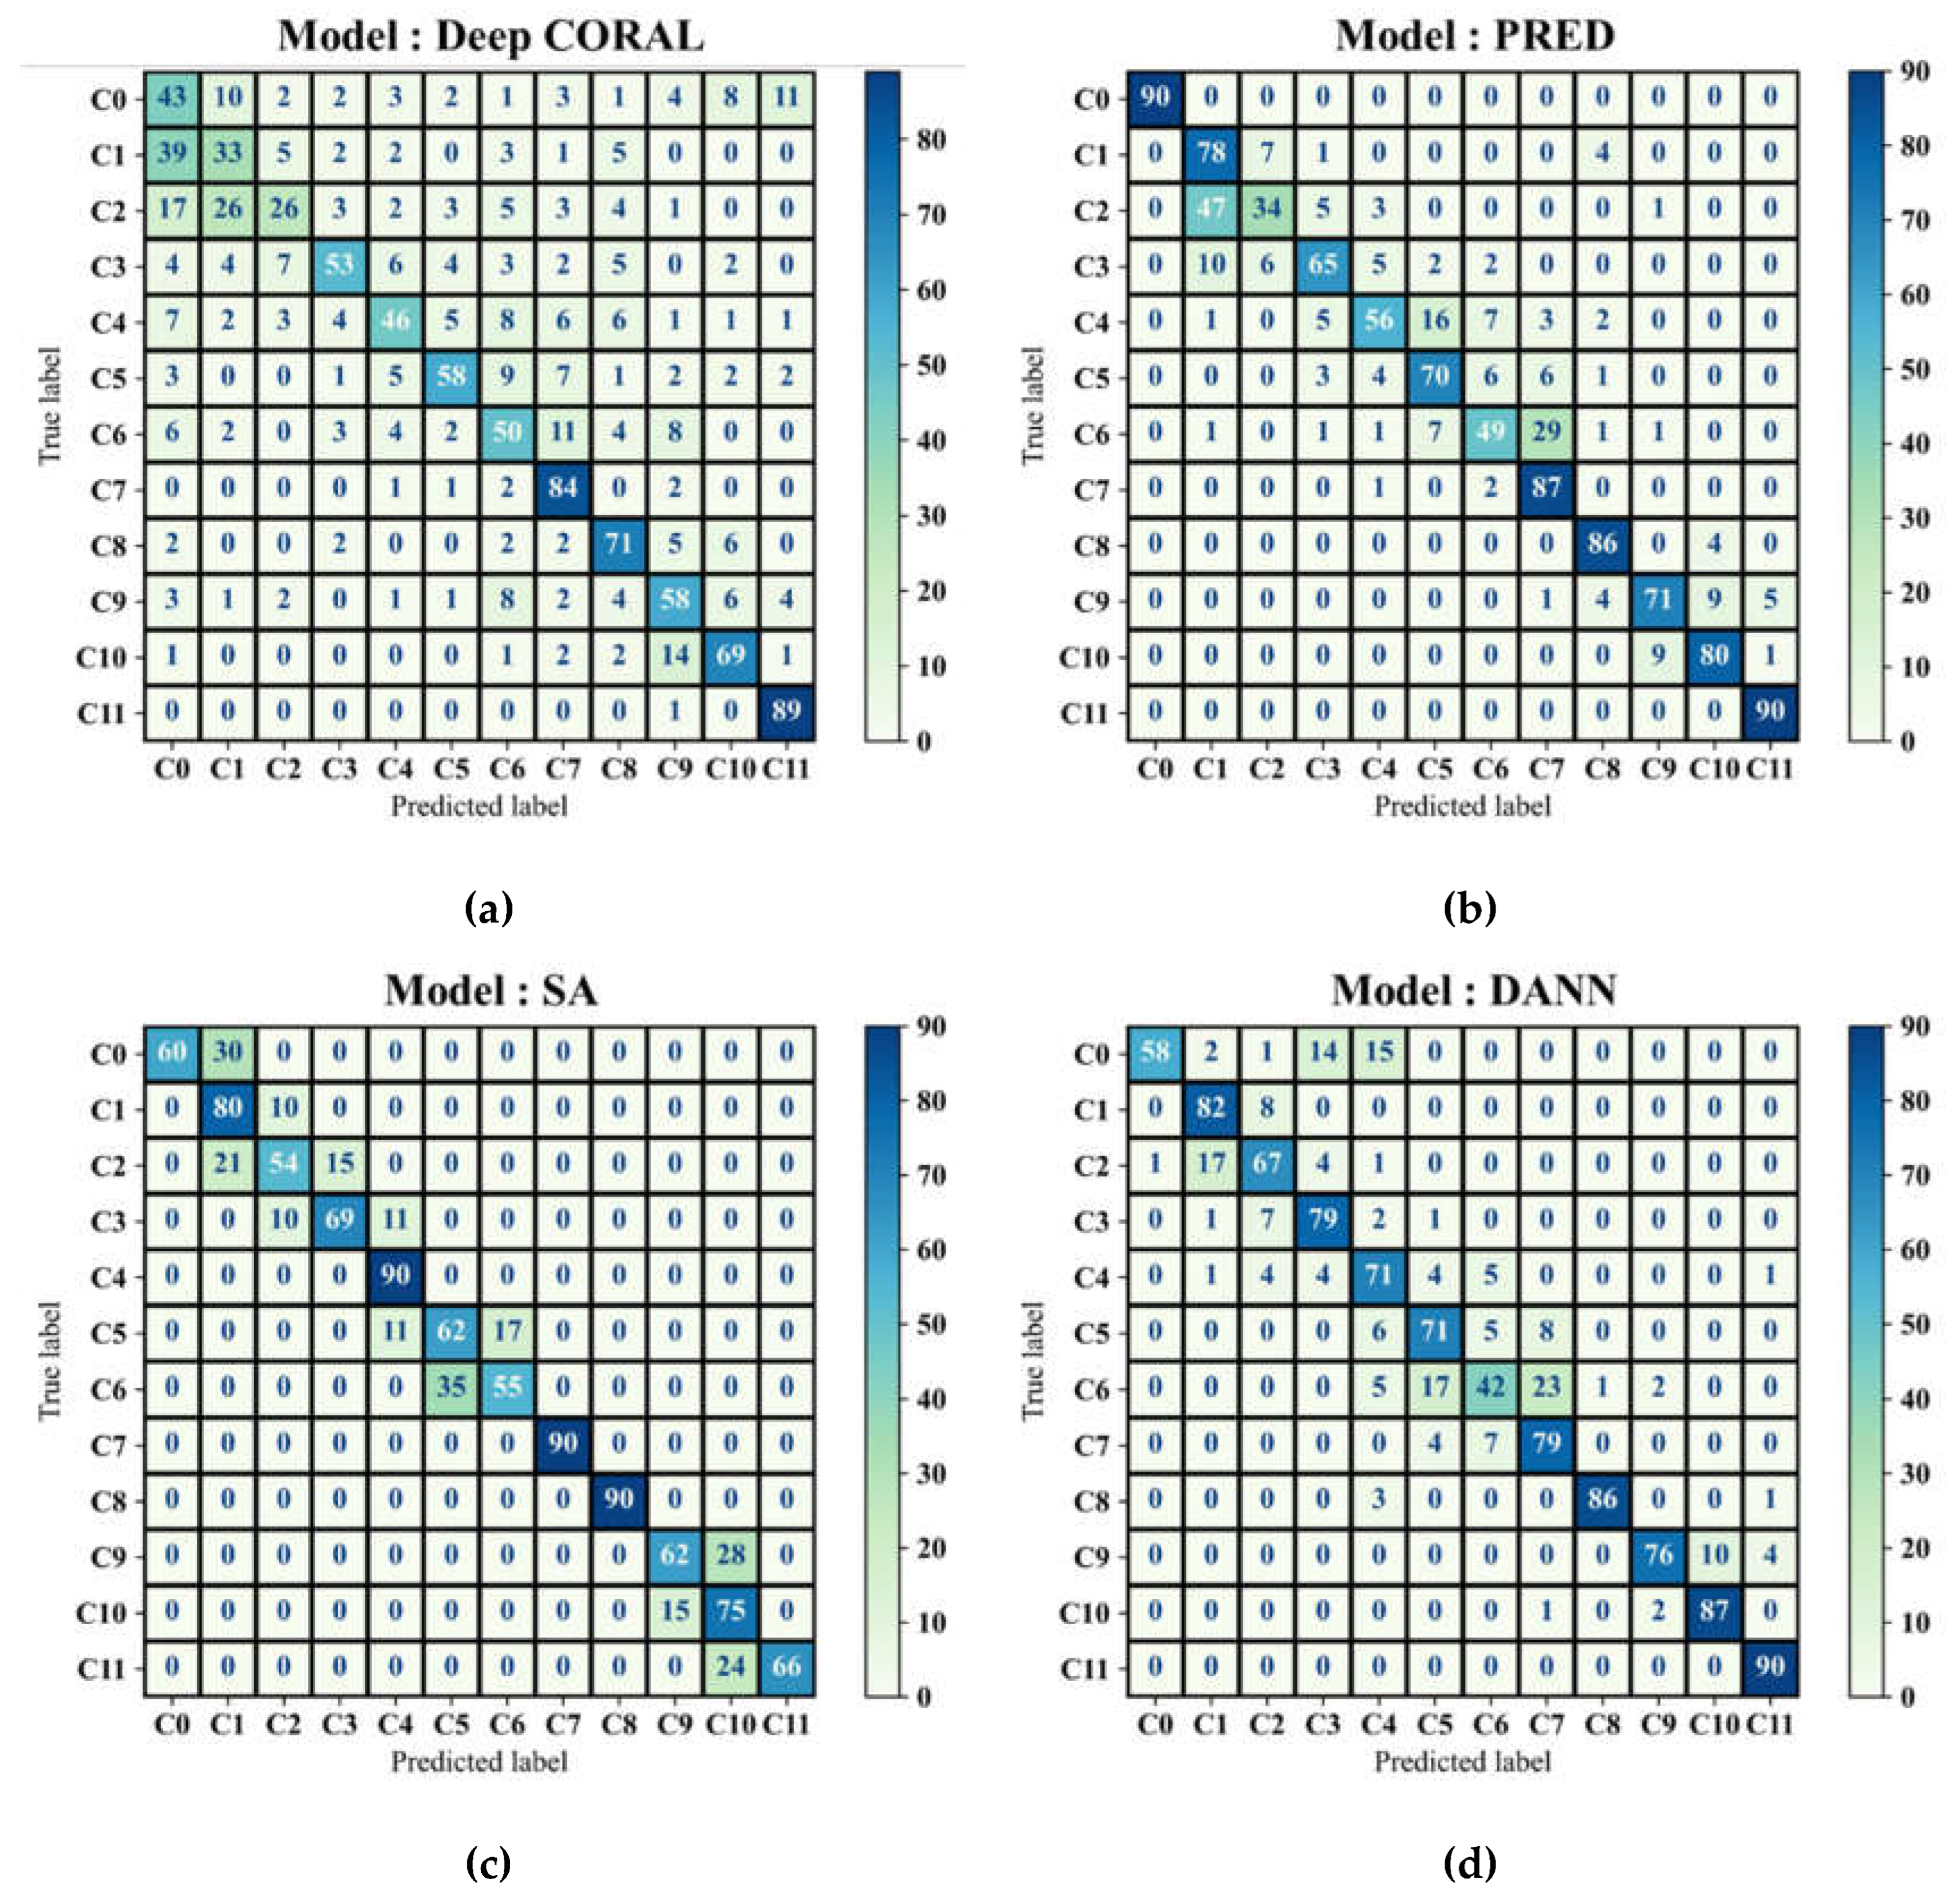
Figure 13.
The relative influence of hyperparameters on model performance in damage detection
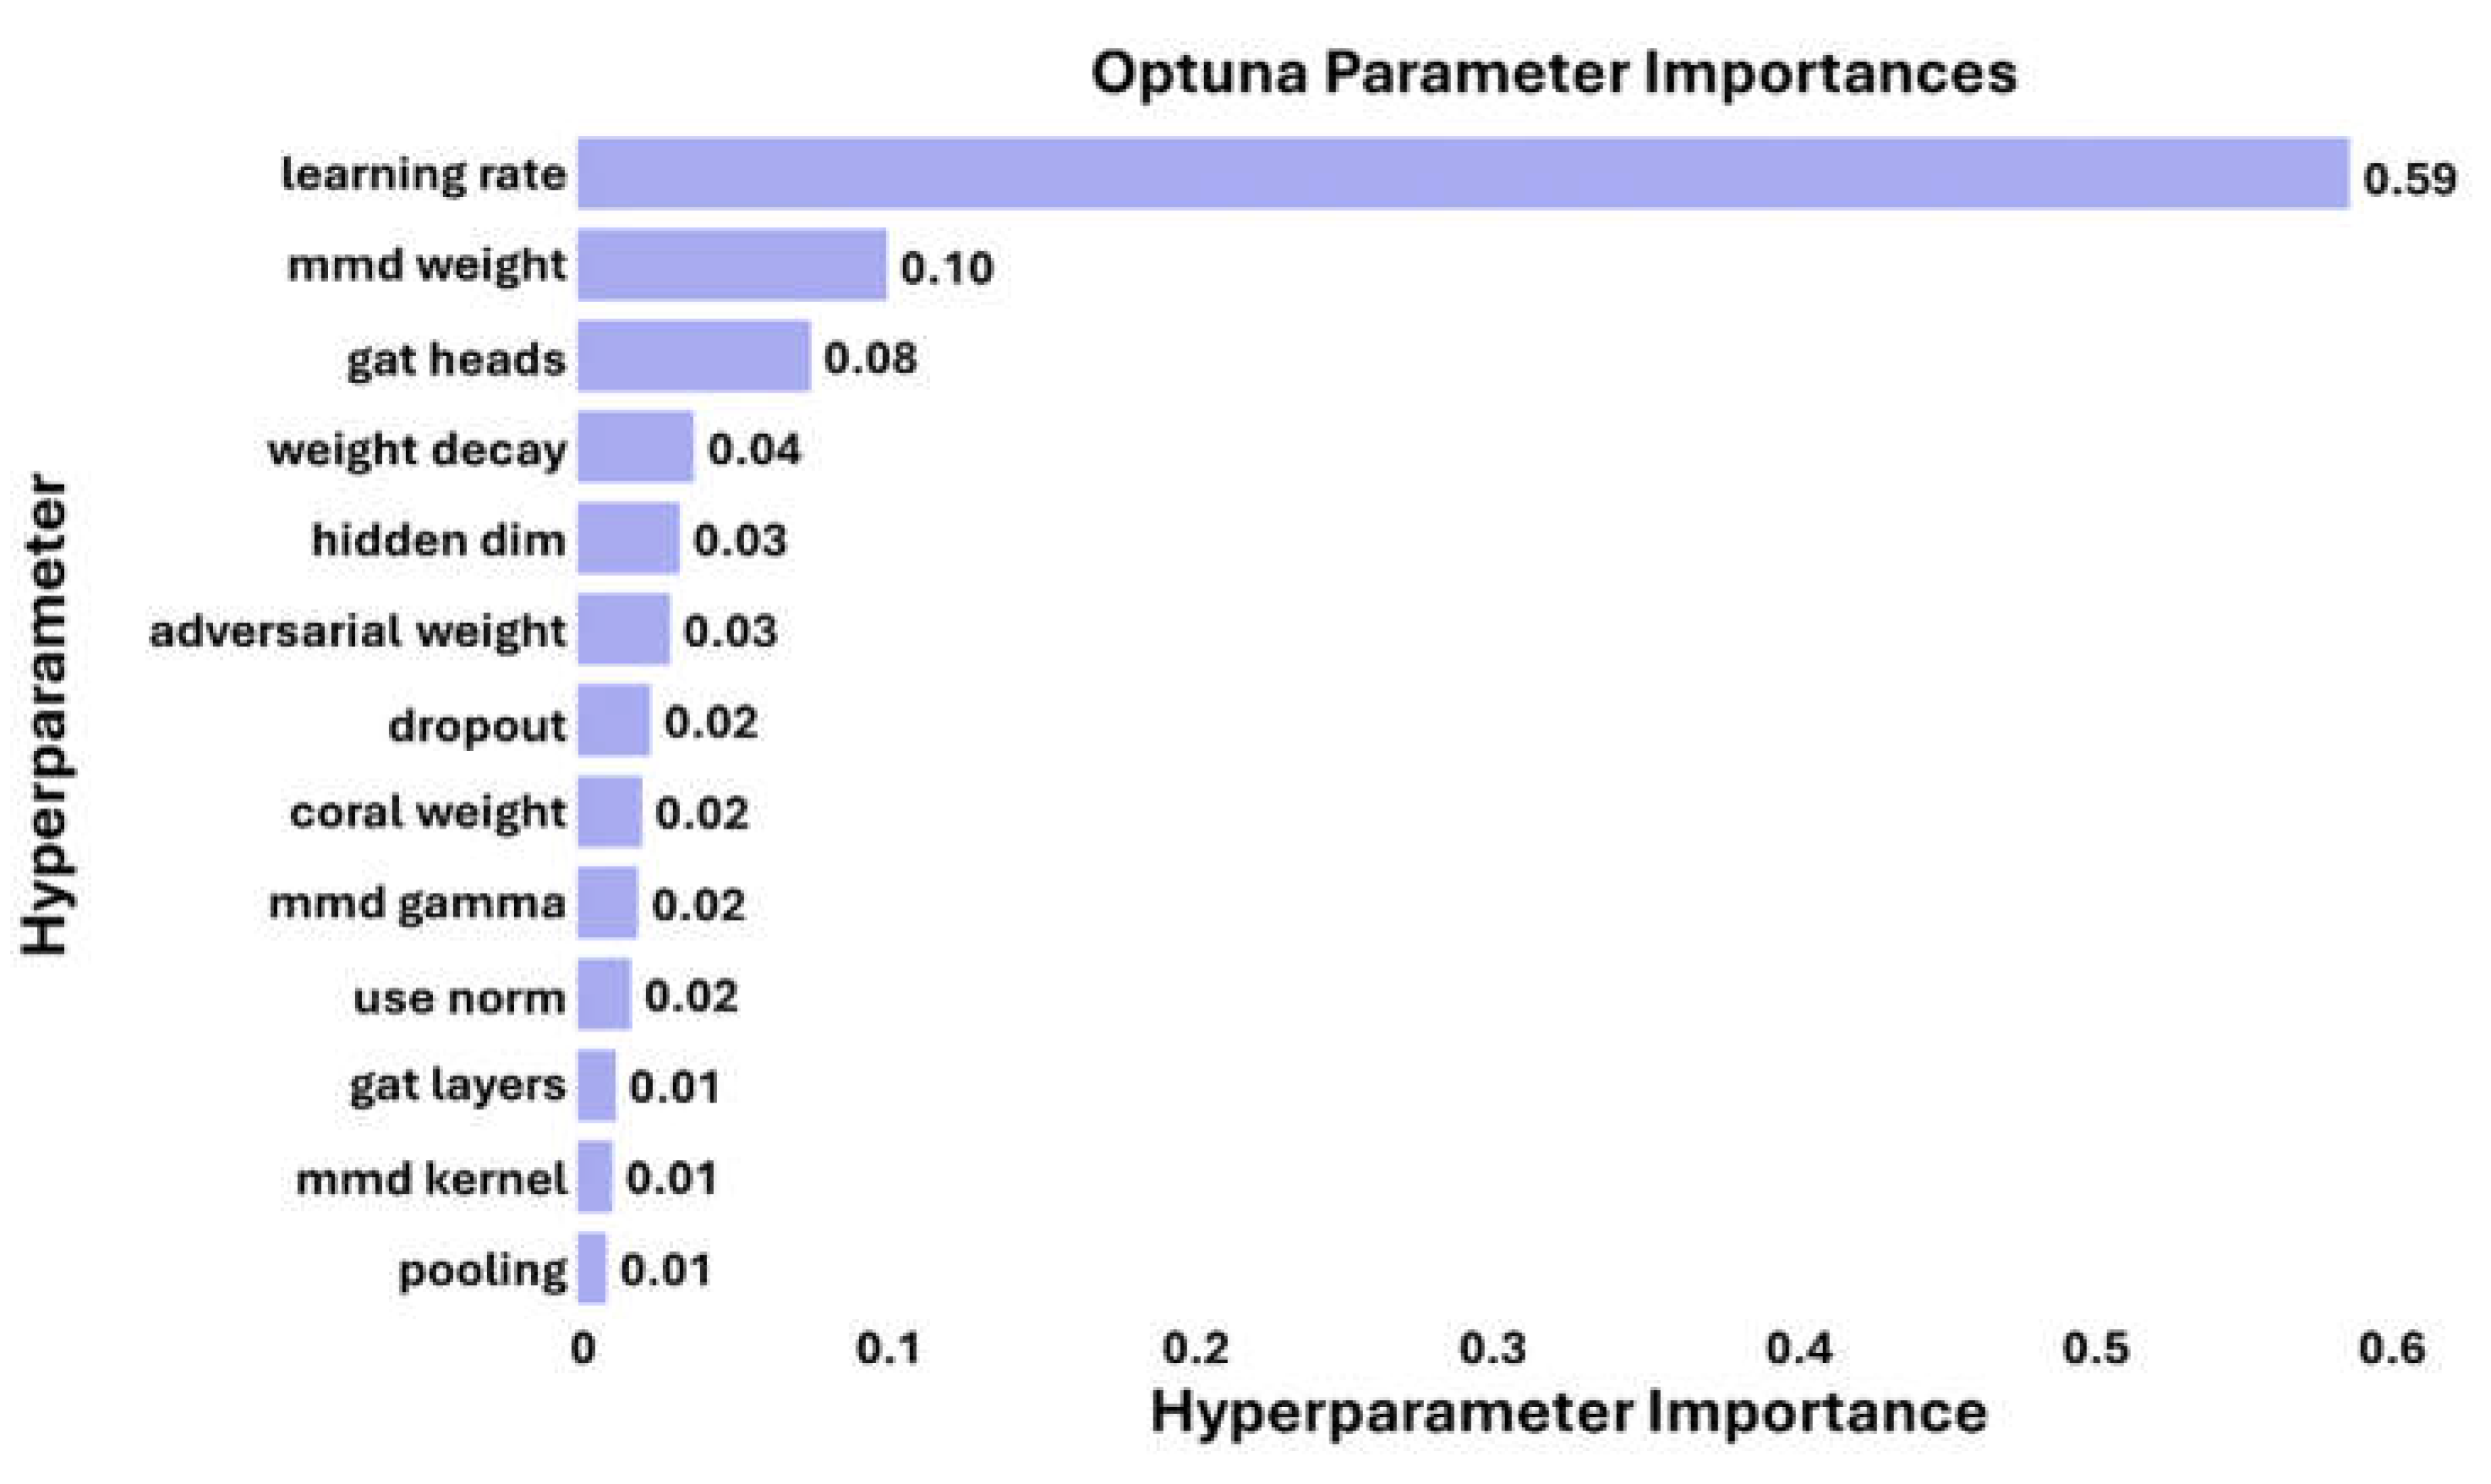
Figure 14.
Sensor contribution levels determined by attention mechanism for the most optimum framework
Figure 14.
Sensor contribution levels determined by attention mechanism for the most optimum framework
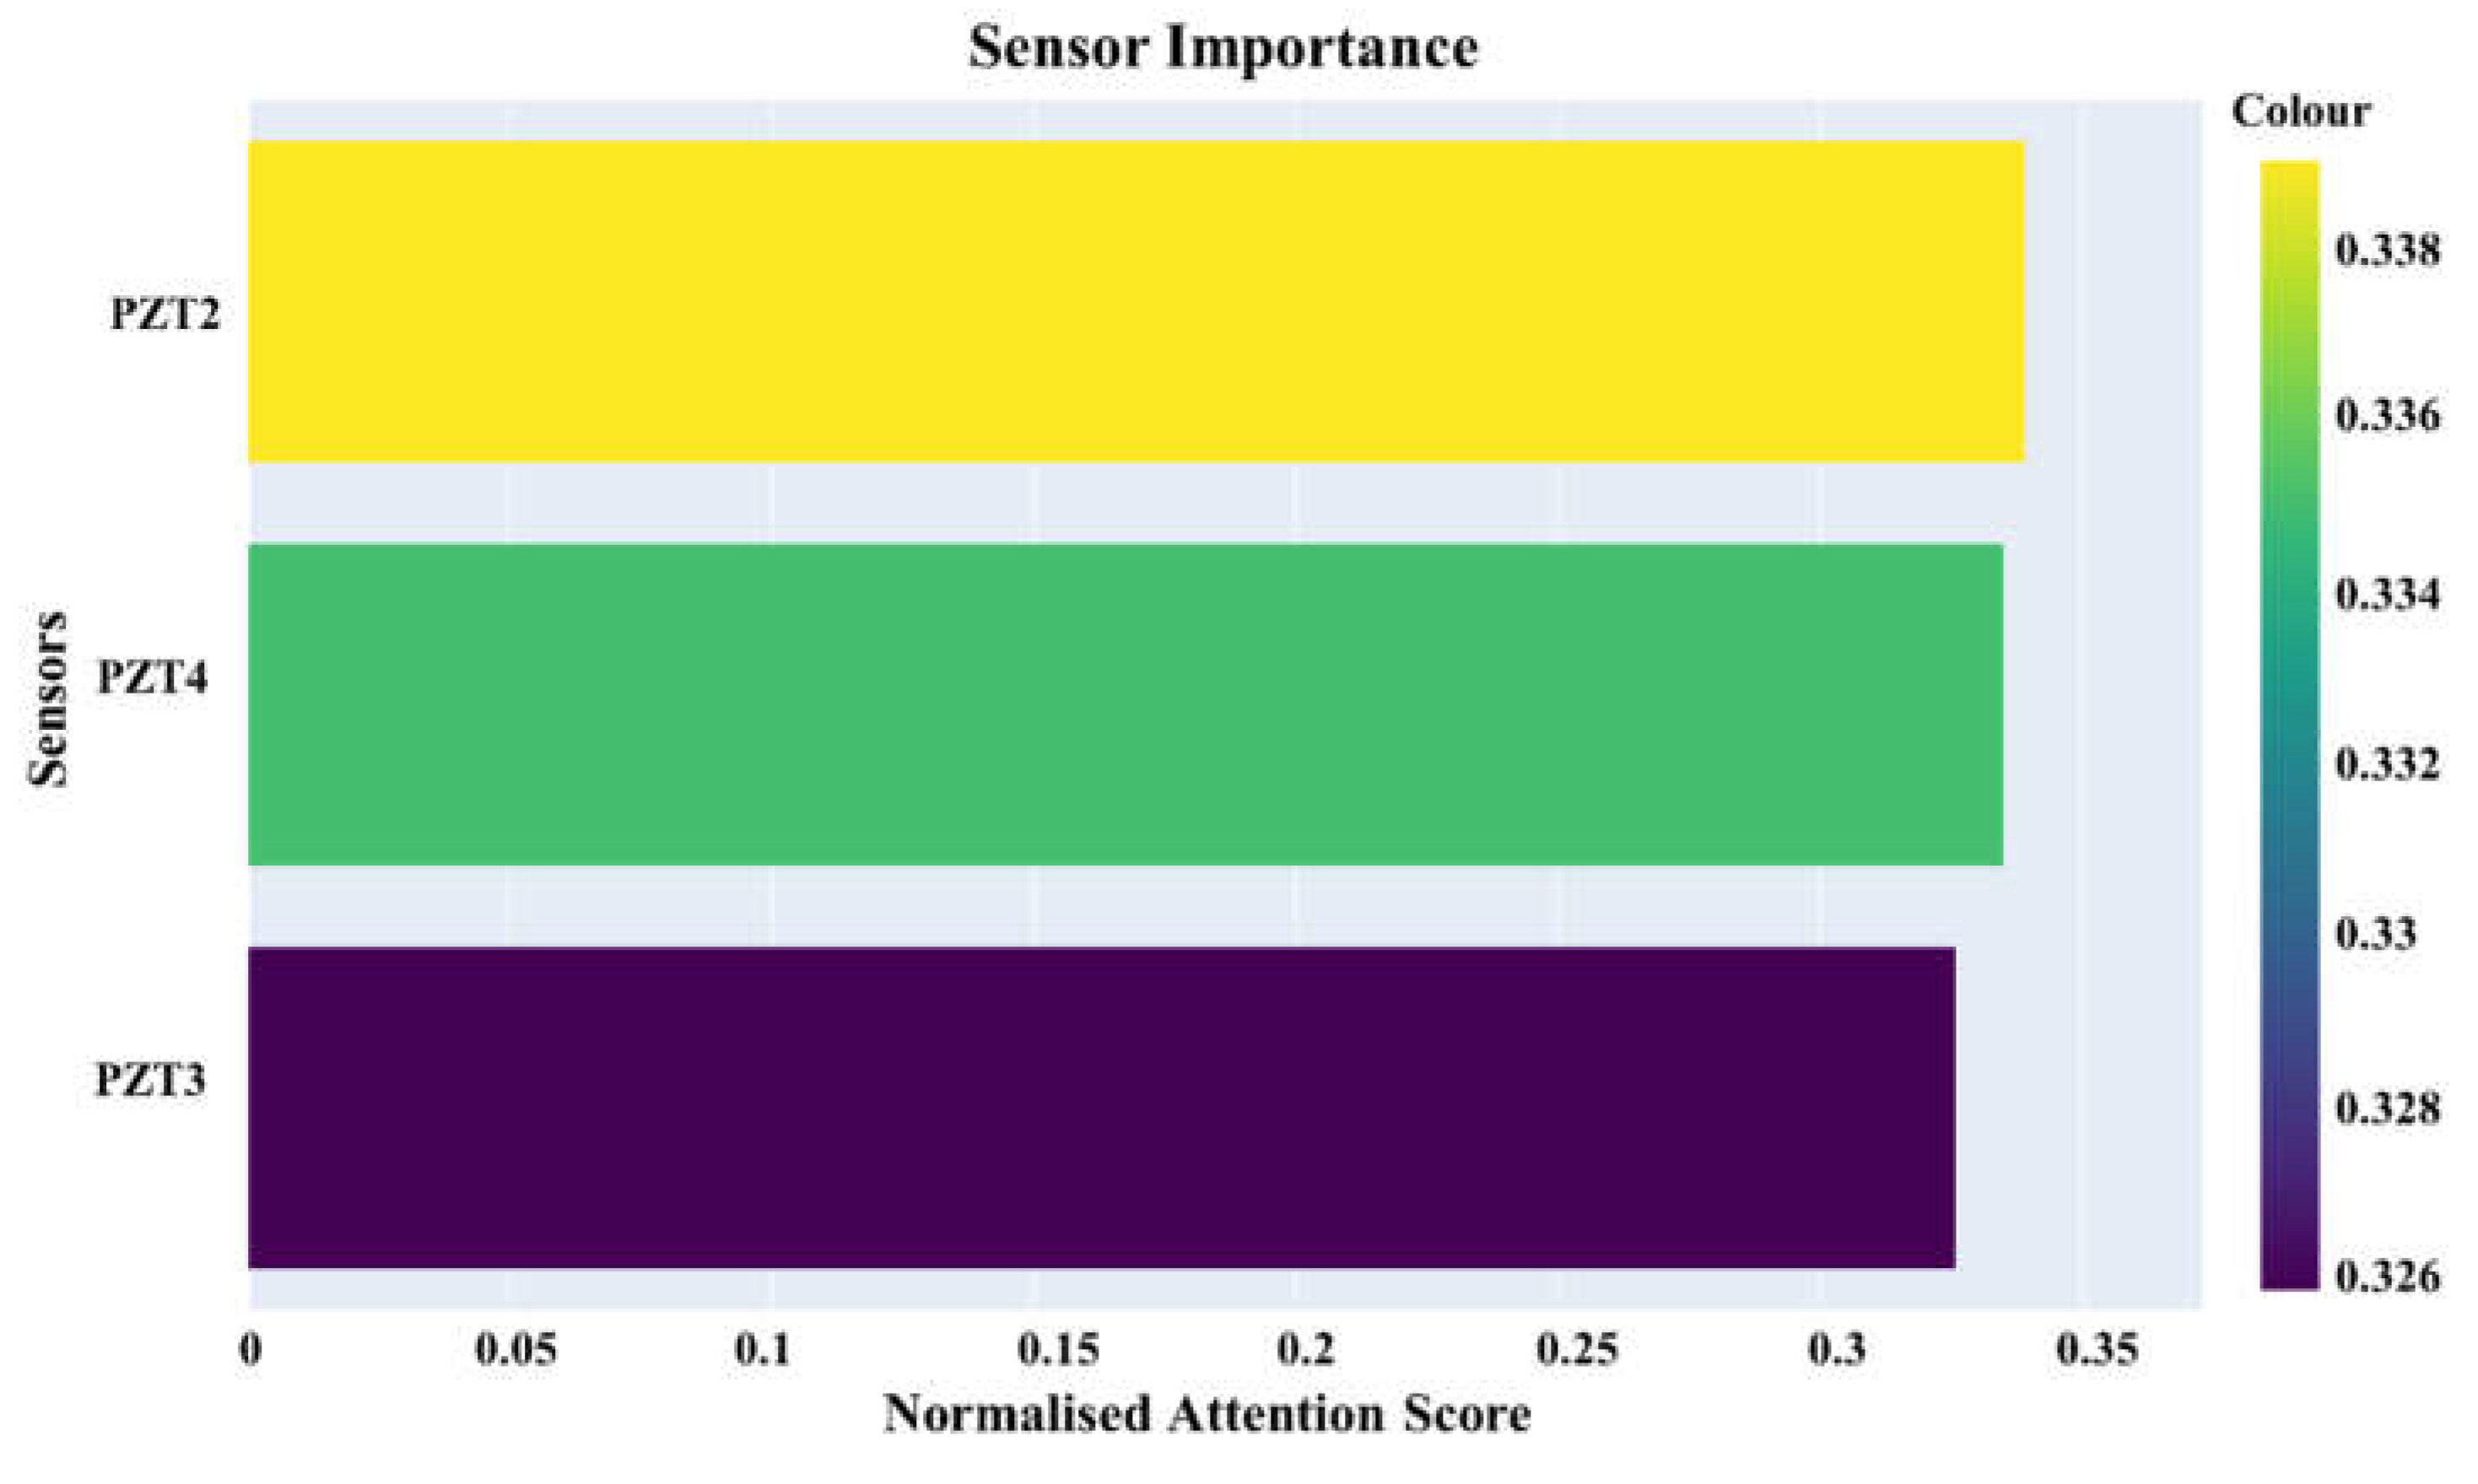
Figure 15.
Sensor contribution levels determined by attention mechanism for unnormalised signals
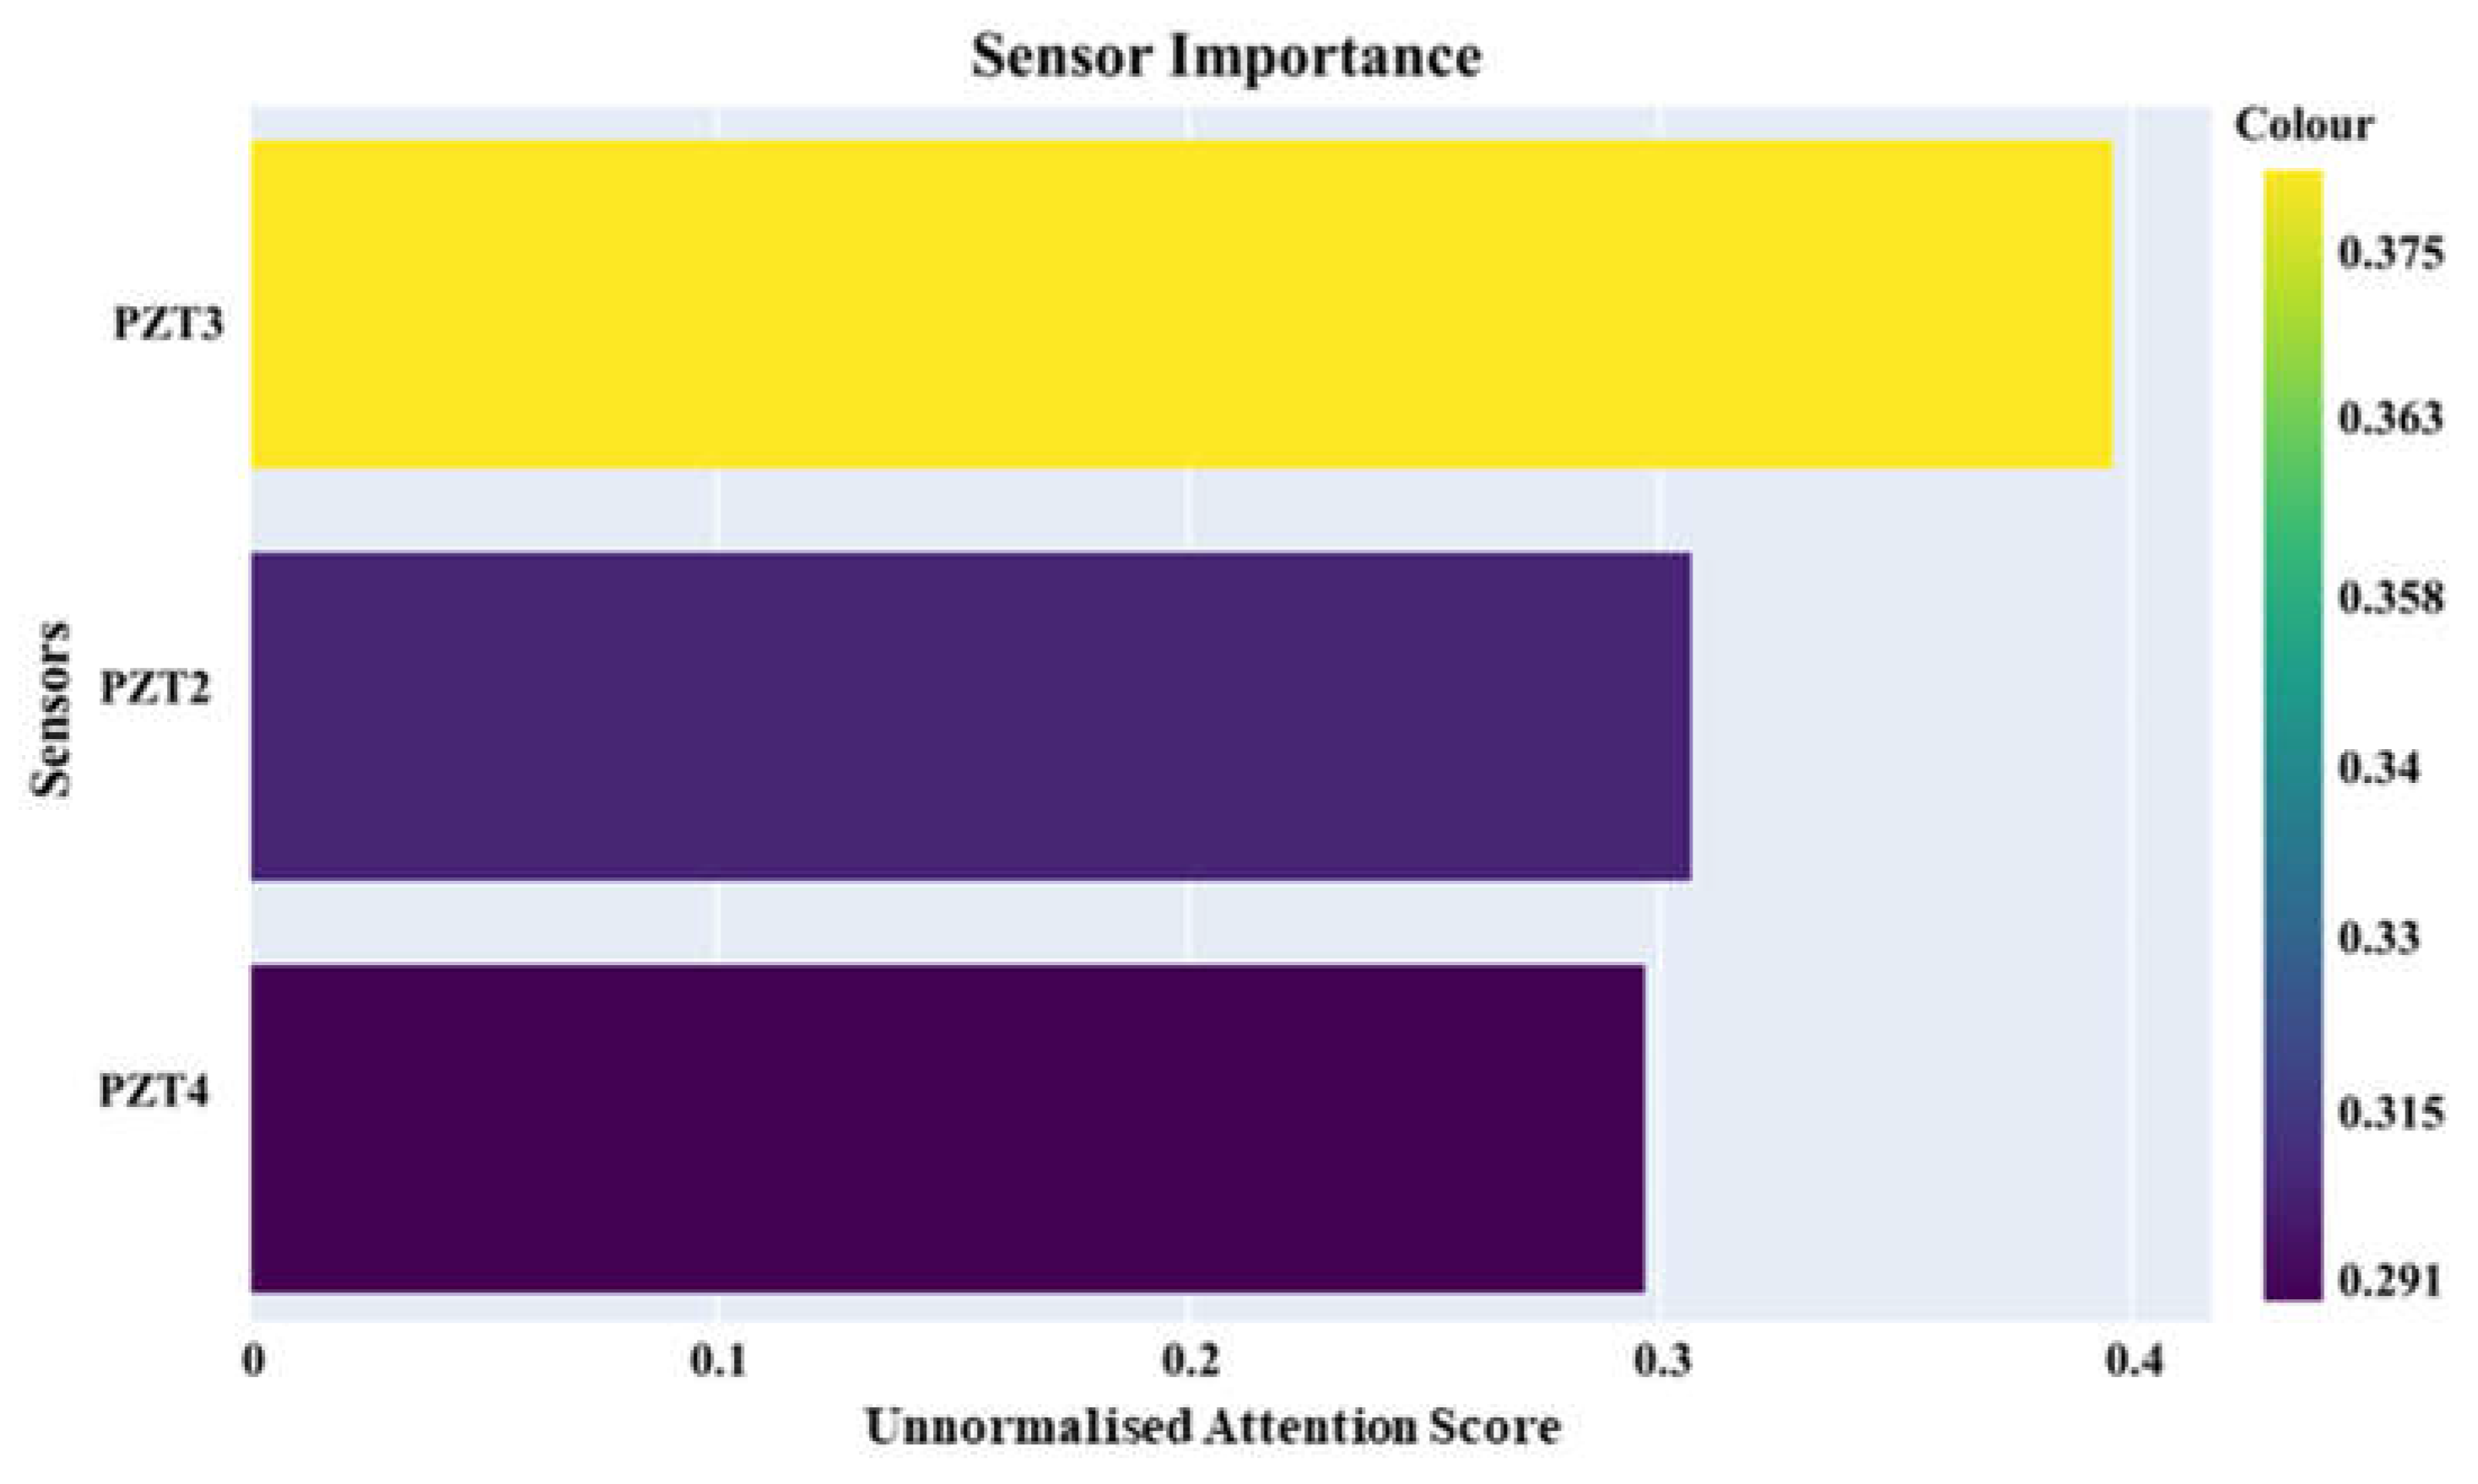

Table 1.
Summary of the test rig and instruments used in the CONCEPT experiments.
| Category | Parameter | Value |
|---|---|---|
| Laminate Plate | Dimensions (L × W × T) | 500 mm × 500 mm × 2 mm |
| Number of Plies | 10 | |
| Transducers | Type | PZT |
| Diameter | 6.35 mm | |
| Configuration | 1 Actuator, 3 Sensors | |
| Mounting Conditions | Boundary Condition | Free-Free |
| Temperature Control | Range | 0°C to 60°C |
| Increment | 10°C | |
| Excitation Signal | Type | 5-cycle sinusoidal tone burst |
| Frequency | 250 kHz | |
| Data Sampling | Sampling Rate | 5 MHz |
| Duration per Measurement | 100 ms | |
| Data Acquisition | Generation System | NI USB 6353 |
| Measurement System | Keysight DSO7034B | |
| Control Software | LabVIEW |
Table 2.
Damage scenarios and severities for simulated defects in the CONCEPT experiment.
| Damage Scenario | Severity (Area Covered) | Damage Label | Description | Temperature (Degree Celsius) | Temperature Label |
| Healthy | 0% | C0 | No damage | 0 | 0 |
| 10 | 1 | ||||
| 20 | 2 | ||||
| 30 | 3 | ||||
| 40 | 4 | ||||
| 50 | 5 | ||||
| 60 | 6 | ||||
| Damaged D1 | 0.196% | C1 | Industrial putty | 30 | 3 |
| Damaged D2 | 0.282% | C2 | Increased coverage of putty | ||
| Damaged D3 | 0.384% | C3 | Further increase in coverage | ||
| Damaged D4 | 0.502% | C4 | Progressive increase | ||
| Damaged D5 | 0.785% | C5 | Larger area covered | ||
| Damaged D6 | 1.13% | C6 | Substantial coverage | ||
| Damaged D7 | 1.53% | C7 | Continued increase | ||
| Damaged D8 | 1.95% | C8 | Different progression pattern | ||
| Damaged D9 | 2.01% | C9 | Extensive coverage | ||
| Damaged D10 | 2.27% | C10 | High severity | ||
| Damaged D11 | 2.54% | C11 | Maximum simulated severity |
Table 3.
Splitting the dataset for source and target domains.
| Domain | Number of Observations per Class | ||
| Training | Validation | Testing | |
| Source | 63 | 27 | 10 |
| Target | 510 | 0 | 90 |
Table 4.
Hyperparameter values for executing GAT-CAMDA.
| Hyperparameter | Value | Hyperparameter | Value |
|---|---|---|---|
| Learning Rate | Number of GAT Heads | 1, 2, 4 | |
| Weight Decay | Pooling option | Max, Mean, Sum | |
| Adversarial Weight | [0, 0.3] | Normalisation | True, False |
| MMD Weight | [0, 0.3] | MMD Kernel | Linear, RBF |
| CORAL Weight | [0, 0.3] | Gamma Parameter | [0.1, 10] |
| Hidden Dimension | 128, 256, 512 | Number of GAT Layers | 4, 8 |
| Dropout Rate | [0.1, 0.5] | Batch Size | 32 |
Disclaimer/Publisher’s Note: The statements, opinions and data contained in all publications are solely those of the individual author(s) and contributor(s) and not of MDPI and/or the editor(s). MDPI and/or the editor(s) disclaim responsibility for any injury to people or property resulting from any ideas, methods, instructions or products referred to in the content. |
© 2025 by the authors. Licensee MDPI, Basel, Switzerland. This article is an open access article distributed under the terms and conditions of the Creative Commons Attribution (CC BY) license (http://creativecommons.org/licenses/by/4.0/).
Copyright: This open access article is published under a Creative Commons CC BY 4.0 license, which permit the free download, distribution, and reuse, provided that the author and preprint are cited in any reuse.


