Submitted:
23 October 2025
Posted:
24 October 2025
You are already at the latest version
Abstract
While marketing campaigns enhance customer acquisition in consumer finance, they may also induce unintended credit risk spillovers. This study develops a computer-aided causal inference framework to quantitatively evaluate the trade-off between conversion gains and risk exposure under various promotional strategies. Leveraging real-world A/B testing data from over two million users, the system integrates doubly robust estimation, causal forest modeling, and offline policy evaluation techniques into a unified computational pipeline. The modeling components are implemented using high-performance computing tools, including gradient-boosted decision trees and cross-fitted treatment effect learners, to capture nonlinear covariate interactions and estimate treatment heterogeneity. Furthermore, a counterfactual simulation engine is designed to evaluate policy effects under safety constraints based on Conditional Value at Risk (CVaR), allowing scalable strategy testing without online deployment. Experimental results show that promotions increase loan conversion rates by 12.3% but raise default rates by 1.8 percentage points on average. By deploying a CATE-based selective targeting strategy through the computational framework, the optimized policy reduces default rates by 9.7% while maintaining acquisition efficiency. The findings demonstrate the value of combining machine learning and causal inference with computer-based simulation platforms to support risk-sensitive decision-making in financial marketing. This research contributes a replicable computational approach for credit risk-aware campaign optimization, offering both methodological innovation and practical relevance for consumer finance institutions.
Keywords:
causal inference
; credit risk
; marketing promotions
; A/B testing
; consumer finance
; addressing effect heterogeneity
1. Introduction
Amid rapid expansion and intensifying competition in consumer finance, marketing promotions have become a key strategy for institutions to acquire users and release credit. However, overreliance on promotional tactics may elevate conversion rates while simultaneously deteriorating the risk profile of potential borrowers, thereby amplifying the spillover transmission of systemic credit risk. Traditional correlation analysis struggles to uncover the causal mechanisms linking promotional activities to default outcomes, limiting the refinement of risk control strategies and their compliance assessment. There is an urgent need to leverage causal inference tools with identification capabilities to establish quantifiable, constrained risk-reward balancing mechanisms, thereby achieving synergistic optimization of targeted promotions and controllable risk. Under conditions of sufficient data and well-defined experimental structures, establishing a strategy optimization framework based on treatment effect heterogeneity holds significant theoretical value and practical relevance for addressing risk mismanagement driven by marketing activities.
2. Research Design
2.1. Data Sources and Description
The data utilized in this study originates from the historical operational database of a nationally licensed consumer finance institution. It encompasses comprehensive log data from ten cumulative rounds of online marketing promotions conducted between 2020 and 2023. The original sample size exceeds 2 million customers, incorporating complete variables such as static customer attributes, behavioral characteristics, credit scores, loan records, and repayment performance, totaling approximately 180 feature dimensions. The dataset includes identified promotion intervention statuses, marketing outreach channels, and individual response records, providing the necessary treatment and outcome variables for causal identification. Furthermore, the platform employed stratified random sampling to configure experimental and control groups in each promotion round, establishing a robust experimental design foundation for subsequent causal inference modeling [1]. To ensure data quality, points exhibiting abnormal repayment statuses, missing data rates exceeding 10%, or duplicate loan behaviors were excluded. This yielded a high-quality analytical sample comprising 1.186 million customers. All sensitive information underwent de-identification processing, and variable fields were uniformly standardized and normalized according to credit risk modeling specifications to enhance model robustness and feature interpretability.
2.2. Experimental Design: Randomized Controlled Trial
To identify the causal impact of marketing promotions on credit risk, a structured randomized controlled trial (RCT) design was employed, allocating target customers to treatment groups at a predetermined ratio. Prior to each promotional campaign launch, the system stratified customers based on historical behavioral variables, credit score quantiles, and borrowing activity to ensure experimental and control groups maintained representativeness and comparability across multiple dimensions. The intervention variable was defined as receiving targeted promotional SMS messages and in-app activity pushes. The response window was uniformly set as clicks or applications within 7 days, with subsequent tracking of credit behavior performance over 60 days [2]. To control for cross-contamination and selection bias, cross-validation shielding, sample isolation, and a double-blind execution mechanism were implemented. The treatment assignment probability was set at 0.5 in the design to ensure the ATE estimate satisfies identifiability. Table 1 below presents the key variables and treatment allocation logic in the experimental design.
2.3. Research Methodology
2.3.1. Doubly Robust Estimation
To enhance the accuracy and robustness of treatment effect estimation, this study implements a computer-aided doubly robust (DR) estimation framework that integrates both propensity score modeling and outcome regression into a unified computational pipeline. Specifically, the model is operationalized using Python-based machine learning libraries, including scikit-learn, XGBoost, and NumPy, which support efficient high-dimensional data processing and parallel computation. Let Yi denote the default outcome for customer i, Ti∈{0,1} represent the binary treatment indicator (i.e., whether the user received a promotion), and Xi∈Rp be the covariate feature vector[3]. The propensity score is estimated using a logistic regression classifier with L2 regularization to ensure generalization, while the outcome model is constructed using gradient-boosted decision trees (GBDT), which are optimized through early stopping and grid search-based hyperparameter tuning. To mitigate the estimation instability caused by extreme propensity scores, a score clipping mechanism is embedded into the model, where estimated scores are constrained within [0.01, 0.99] during training. Furthermore, the DR estimator is constructed as:
where e^(Xi) is the estimated propensity score, and m^t(Xi)=E[Yi∣Ti=t,Xi] is the predicted outcome under treatment t∈{0,1}. The first term performs a residual bias correction based on inverse probability weighting, while the second term computes the conditional mean difference across treatment groups. The entire DR estimation pipeline is deployed on a multi-core CPU cluster using joblib-based parallelization for scalability. Intermediate outputs, including model residuals, feature importances, and weight distributions, are logged and visualized using Matplotlib and Seaborn for model interpretability and debugging. This computational framework ensures statistical consistency while supporting real-time analytics and adaptive refinement, serving as the foundational component for downstream heterogeneity modeling and policy simulation.
2.3.2. Causal Forest Modeling
To estimate the conditional average treatment effect (CATE) across diverse customer subpopulations, this study employs a computer-driven Causal Forest modeling framework, implemented via the Generalized Random Forest (GRF) package in R and mirrored using EconML in Python for compatibility with high-dimensional machine learning pipelines. The core objective is to identify treatment heterogeneity and facilitate targeted strategy design using scalable, interpretable algorithms. The modeling process begins by obtaining cross-fitted predictions of the propensity score e^(Xi) and the potential outcome functions m^t(Xi) through out-of-sample learners. These components are computed using gradient-boosted decision trees (GBDT) or Random Forest regressors, depending on the dimensionality and nonlinearity of the covariate space. To enhance computational efficiency, data preprocessing (e.g., missing value imputation, one-hot encoding) and feature selection are conducted using the scikit-learn pipeline framework, and all models are trained using multi-threaded job execution under Python's joblib or R's parallel library. The Causal Forest estimates CATE by applying orthogonal residual transformation, followed by tree ensemble modeling on sub-samples with honesty constraints. Each tree is split using a heterogeneity-aware splitting criterion, minimizing within-leaf variance of treatment effects. At query point xxx, the estimator is given by:
where Y_i denotes individual default outcomes, T_i represents treatment indicators, X_i denotes covariates, , and α_i(x) denotes forest neighbor weights. The splitting criterion employs heterogeneity gain (e.g., minimizing intra-leaf τ variance), with minimum leaf node sample size and depth set to control bias-variance tradeoffs; extreme e^(X) values are truncated to stabilize weights [6]. The resulting τ^(X) serves as input for heterogeneity analysis and policy optimization. Figure 1 illustrates the modeling workflow and sample partitioning relationships.
2.3.3. Off-Policy Strategy Evaluation
To compare the net benefits and risk spillovers of candidate promotional strategies π(X) without additional online experiments, an Off-Policy Evaluation (OPE) framework is employed: using RCT logs {Xi, Ti, Yi} and behavioral strategy b(T∣X) as the baseline, cross-validation first yields propensity scores b^(T∣X) and outcome regression q^t(X) = E[Y∣T=t,X]. Self-normalizing importance sampling and dual robust evaluation are then performed on out-of-sample splits to mitigate optimism bias from dual model-evaluation usage [7]. We implement weight clipping and stabilization for extreme values to control variance. A composite objective maps "conversion gains - default costs" to policy value V(π), while simultaneously outputting risk measures (e.g., default rate thresholds or CVaR quantiles) for security constraint configuration. The DR-OPE estimator is defined as follows:
where Xi denotes covariates, Ti represents treatment, Yi denotes outcomes, and (T|X) denotes the probability of the target policy selecting action T given feature X. Table 1 lists the employed estimators and robust configurations (SNIPS/DR/Switch-DR, weight truncation thresholds, out-of-sample evaluation settings), providing a consistent evaluation interface for counterfactual policy simulation and safety constraint concretization.
2.3.4. Safety Constraint Setting
To ensure promotional strategies optimize conversion rates without inducing systemic risk spillover, this study introduces a risk tolerance-based safety constraint mechanism as a hard condition for strategy optimization design [8]. This mechanism builds upon the constructed offline valuation framework, modeling potential default performance under strategies as constraint functions. Specifically, it adopts Conditional Value at Risk (CVaR) at the 95% confidence level (i.e., CVaR₉₅), unless otherwise specified. This choice reflects a trade-off between tail-event sensitivity and empirical stability, commonly adopted in financial risk control. The CVaR metric is computed on the distribution of predicted default probabilities at the individual level, which are derived from the outcome regression component of the doubly robust estimator. This approach focuses on credit event likelihood rather than loss magnitude or expected monetary exposure, given the anonymized nature of the dataset and the lack of transaction-level loss information. The risk constraint is formalized as:
where denotes the tail-quantile average of predicted defaults under policy π, and γ represents the externally preset risk tolerance threshold. The threshold γ is selected based on historical benchmark default rates under similar marketing conditions, with tuning granularity aligned to operational policy requirements. During the strategy learning phase, the optimization objective function is defined as U(π), and the candidate strategy space Π is constrained accordingly. To decouple strategy optimization from risk control, the study employs parallel modeling of posterior hierarchical evaluation and penalty term relaxation. This dual-path design allows the exploration of locally optimal subspaces while ensuring that no policy exceeding the γ-bound is accepted. Figure 2 illustrates the workflow of embedding the safety constraint mechanism into the optimization pipeline. The process begins with sample-level counterfactual valuation, followed by CVaR₉₅ computation on simulated default risks. Only those policies satisfying Rrisk(π)≤γ enter the feasible subset Π_safe for downstream evaluation.
2.4. Assumption Validation
To ensure the validity of causal effect estimation, this study relies on three key identification assumptions: unconfoundedness, overlap, and the Stable Unit Treatment Value Assumption (SUTVA). While the stratified randomized controlled trial (RCT) design helps support these assumptions, it is critical to assess their applicability within the real-world marketing context. Unconfoundedness, or the assumption that all confounding variables affecting both treatment assignment and outcomes are observed, is partially addressed through stratified randomization based on credit score quantiles, behavioral history, and borrowing frequency. This process aims to balance key observed covariates between treatment and control groups. However, latent factors such as individual responsiveness to marketing stimuli or financial literacy levels may remain unobserved. These unmeasured confounders could potentially influence both exposure to promotions (e.g., engagement with app content) and default risk, thereby violating the ignorability assumption. While such risks cannot be fully eliminated, their impact is mitigated through large-scale randomization, covariate balancing checks, and robustness tests using alternative model specifications. Overlap, which requires that every individual has a non-zero probability of receiving either treatment, is addressed through equal-probability assignment (0.5) in each RCT stratum and verified using overlap diagnostics. Density plots and co-support visualizations indicate sufficient common support across covariates. Truncation of extreme propensity scores between [0.01, 0.99] further stabilizes weight estimation under DR and CATE models. SUTVA, which assumes no interference between units and consistent treatment definition, is plausible in this study. Customers are randomly assigned to receive personalized SMS or in-app promotions, and communication is anonymized and individualized. There is no peer-to-peer referral, information spillover, or platform-wide promotional broadcasting that would introduce interference between units. The treatment is defined consistently as exposure to targeted messages, regardless of user behavior post-receipt (e.g., whether or not the message is opened or clicked). In sum, while real-world promotional settings may introduce minor deviations from ideal assumptions, the experimental design and modeling techniques employed here—such as stratification, random assignment, and DR estimation—jointly support credible identification of causal effects, with reasonable safeguards against major violations.
3. Empirical Analysis and Results
3.1. Descriptive Statistical Analysis
Prior to formal causal identification modeling, we first compared the fundamental statistical characteristics of sample conversion performance between the experimental and control groups to examine the initial overall effect of the promotional intervention. Results indicate that after removing missing data and standardizing the observation window, the loan conversion rate for customers in the treatment group was significantly higher than that in the control group, with a difference of 12.3 percentage points. This demonstrates the promotional strategy's significant short-term pull effect [10]. To control for sample variation, the standardized mean difference (SMD) was calculated. Results showed that differences in core covariates before and after treatment were both less than 0.1, supporting the assumption of group balance. The conversion rate formula is as follows:
where Yiapply indicates whether customer i submitted a credit application within 7 days after the promotion, and n represents the total sample size.
3.2. Average Treatment Effect (ATE) Analysis of Promotion on Credit Risk
Using stratified RCT samples and a double robust (DR) estimation framework, we identified the average treatment effect on default (ATE) for the treatment "receiving the promotion." Results indicate that the promotion significantly increases the customer default probability by 1.8 percentage points across the sample population. The 95% confidence interval for this point estimate does not cross zero, achieving statistical significance at p < 0.01 under stratified cluster robust standard errors. From a robustness perspective, the direction and magnitude of the DR estimate remained consistent across different propensity score modeling approaches (logistic regression/GBDT) and weight truncation thresholds, indicating that the conclusion is not driven by extreme weights or model specifications. Overlap diagnostics suggest sufficient common support between the treatment and control groups on key covariates, ruling out spurious effects due to insufficient sample comparability. Compared to unadjusted group differences, DR estimates provide more robust average spillover risk signals after controlling for covariate distribution differences and potential confounders. To aid intuitive understanding and facilitate subsequent methodological integration, Figure 3 presents point estimates and their 95% confidence intervals across different models and truncation configurations using forest-style plots. These are complemented by tendency score overlap density/co-support hotspot visualizations, both collectively indicating promotion-induced average-level risk elevation. This average effect provides a baseline reference for the Controlled Average Treatment Effect (CATE) profile in the next section and establishes the starting point for setting risk thresholds and benefit trade-offs in constrained strategy optimization.
3.3. Heterogeneity-by-Treatment Effect (HTE) Analysis
To delve deeper into the differential impact of promotional offers on credit risk across distinct customer segments, this section employs a causal forest model to estimate the conditional average treatment effect (CATE). This analysis identifies key characteristic variables with significant heterogeneity effects, including customer credit history length, borrowing frequency, income stability, and recent delinquency patterns. Subgroup analysis reveals that users with short credit histories (<6 months) and multi-platform borrowing behavior (≥4 platforms) exhibit consistently high CATE values, suggesting they are disproportionately harmed by promotional offers. Conversely, customers in the top credit score quartile and those with stable monthly income (≥90th percentile) demonstrate near-zero or negative CATE values, indicating that promotions may safely boost conversions without exacerbating default risk. Stratified CATE distribution plots by income, score, and delinquency count confirm that risk spillovers are concentrated in low-income, high-volatility cohorts, whereas higher-income users benefit most. Figure 4 illustrates these group-specific patterns. Additionally, Shapley value rankings show that credit score, monthly income, and recent repayment behavior are the most influential drivers of heterogeneity splits. These insights enable the design of risk-aware, segment-specific promotion rules and inform variable-based constraints for selective targeting strategies.
3.4. Strategy Optimization and Counterfactual Simulation
Building on the CATE heterogeneity estimated from the causal forest, this section develops a computationally driven strategy optimization framework to identify optimal promotion targeting rules under credit risk constraints. Specifically, a selective intervention policy π∗(X) is designed by applying a dynamic threshold τ\tauτ on the computed CATE values, where promotions are only offered to customers with τ^(X)≥τ. This policy aims to balance conversion uplift and risk exposure based on data-driven individual treatment effects. To evaluate the performance of π∗(X) without online deployment, an offline policy simulation engine is implemented using Doubly Robust Off-Policy Evaluation (DR-OPE) and Switch-DR estimators. These modules are executed within a scalable computational environment built on Python, using EconML, scikit-learn, and NumPy to support large-scale matrix operations, model parallelism, and result caching. Monte Carlo sampling with bootstrapping is integrated to estimate variance and confidence intervals for simulated outcomes, while a CVaR-based risk filter is applied to enforce safety constraints. The policy space Π is explored through a grid-based threshold search and adaptive refinement, where each candidate policy is evaluated on two dimensions: expected conversion gain and expected default probability. A scoring function maps this two-dimensional tradeoff into a scalar utility function U(π), with filtering based on safety thresholds γ (e.g., maximum allowed default rate or 95th percentile CVaR). The search process is conducted in a multi-core CPU cluster using joblib-parallelized evaluation batches to accelerate convergence and prevent compute bottlenecks. Simulation results indicate that π∗(X) excludes the top 1.8% of customers with the highest risk CATE values, achieving a 9.7% relative reduction in the default rate (from 8.5% to 7.7%) while maintaining the original level of conversion. Consistency across DR-OPE and Switch-DR outputs reinforces the robustness of the optimization results. All simulations, model metrics, and risk indicators are logged and visualized using Matplotlib and Plotly dashboards.
4. Conclusion
This study presents a computational framework for evaluating the spillover effects of marketing promotions on credit risk in consumer finance. By integrating causal inference techniques with computer-aided estimation and simulation, the proposed approach quantifies the trade-offs between customer acquisition and default risk using real-world A/B testing data. The adoption of doubly robust estimators and causal forest algorithms enables high-dimensional treatment effect modeling with statistical validity and computational scalability. Moreover, the use of offline policy evaluation tools—such as DR-OPE and Switch-DR—within a simulation environment allows for reliable counterfactual analysis without deploying high-risk interventions in production systems. Through this computer-driven framework, a selective targeting policy based on CATE thresholds is optimized under Conditional Value at Risk (CVaR) constraints, reducing default rates by 9.7% while preserving conversion efficiency. The results demonstrate the practical value of combining machine learning models, simulation pipelines, and risk-aware optimization for credit-sensitive campaign design. Despite its empirical strength, the study has limitations. The data is sourced from a single institution and lacks behavioral signals from external platforms, which may affect generalizability. Furthermore, the current analysis focuses on a unified class of promotions (primarily interest rate discounts and cashback), without differentiating across heterogeneous campaign levers such as fee waivers, credit limit increases, or loyalty points. These distinct mechanisms may induce divergent risk–conversion dynamics and behavioral responses. Future extensions could stratify treatment assignments by campaign type and examine interaction effects across promotional dimensions. This would enable the framework to model cross-treatment heterogeneity and inform optimal lever selection for risk-aware marketing design. Additionally, while the current framework is implemented on multicore CPU clusters, future work may explore GPU-accelerated causal modeling, reinforcement learning-based adaptive strategy generation, and end-to-end automation of real-time campaign control systems. Such directions will further strengthen the role of computer technologies in risk-informed decision-making in digital finance.
References
- Hu, L. (2025). GPU Computing Resource Allocation and Prediction Based on Machine Learning Algorithms. Applied and Computational Engineering, 176, 79-86. [CrossRef]
- Kasaian K, Murthi B P S, Steffes E. Effects of teaser rates on new credit card customers’ spending and borrowing: an empirical analysis[J]. International Journal of Bank Marketing, 2022, 40(7): 1555-1574. [CrossRef]
- Zhang D J, Dai H, Dong L, et al. The long-term and spillover effects of price promotions on retailing platforms: Evidence from a large randomized experiment on Alibaba[J]. Management Science, 2020, 66(6): 2589-2609.
- He Z D, Rao V R. Methods for Causal Inference in Marketing[J]. Foundations and Trends® in Marketing, 2024, 18(3-4): 176-309.
- Jiang C, Wang Y, Li W, et al. The time-varying bidirectional causal relationship between household education expenditure and resident credit behavior: Dynamic quantile evidence and heterogeneous mechanisms[J]. PLoS One, 2025, 20(8): e0329213. [CrossRef]
- Wessel M, Gleasure R, Kauffman R J. Sustainability of rewards-based crowdfunding: A quasi-experimental analysis of funding targets and backer satisfaction[J]. Journal of Management Information Systems, 2021, 38(3): 612-646. [CrossRef]
- Wang H, Li Y, He B. Spatial spillover effects of digital finance on corporate ESG performance[J]. Sustainability, 2024, 16(16): 6987. [CrossRef]
- Wang F, Zhang H, Zhou J. Impact of Green Finance on Chinese Urban Land Green Use Efficiency: An Empirical Study Based on a Quasinatural Experiment[J]. Land, 2025, 14(2): 332. [CrossRef]
- Sodero A C. Good cause, not so good business? Sales and operations performance of cause-related marketing[J]. Journal of Business Logistics, 2022, 43(4): 566-592. [CrossRef]
- Barsyte J, Fennis B M. When innovation backfires: Preference for predictability moderates the spillover of functional food ambivalence to the entire parent category[J]. Journal of Business Research, 2023, 158: 113670. [CrossRef]
Figure 1.
Causal forest modeling workflow and sample partitioning diagram.
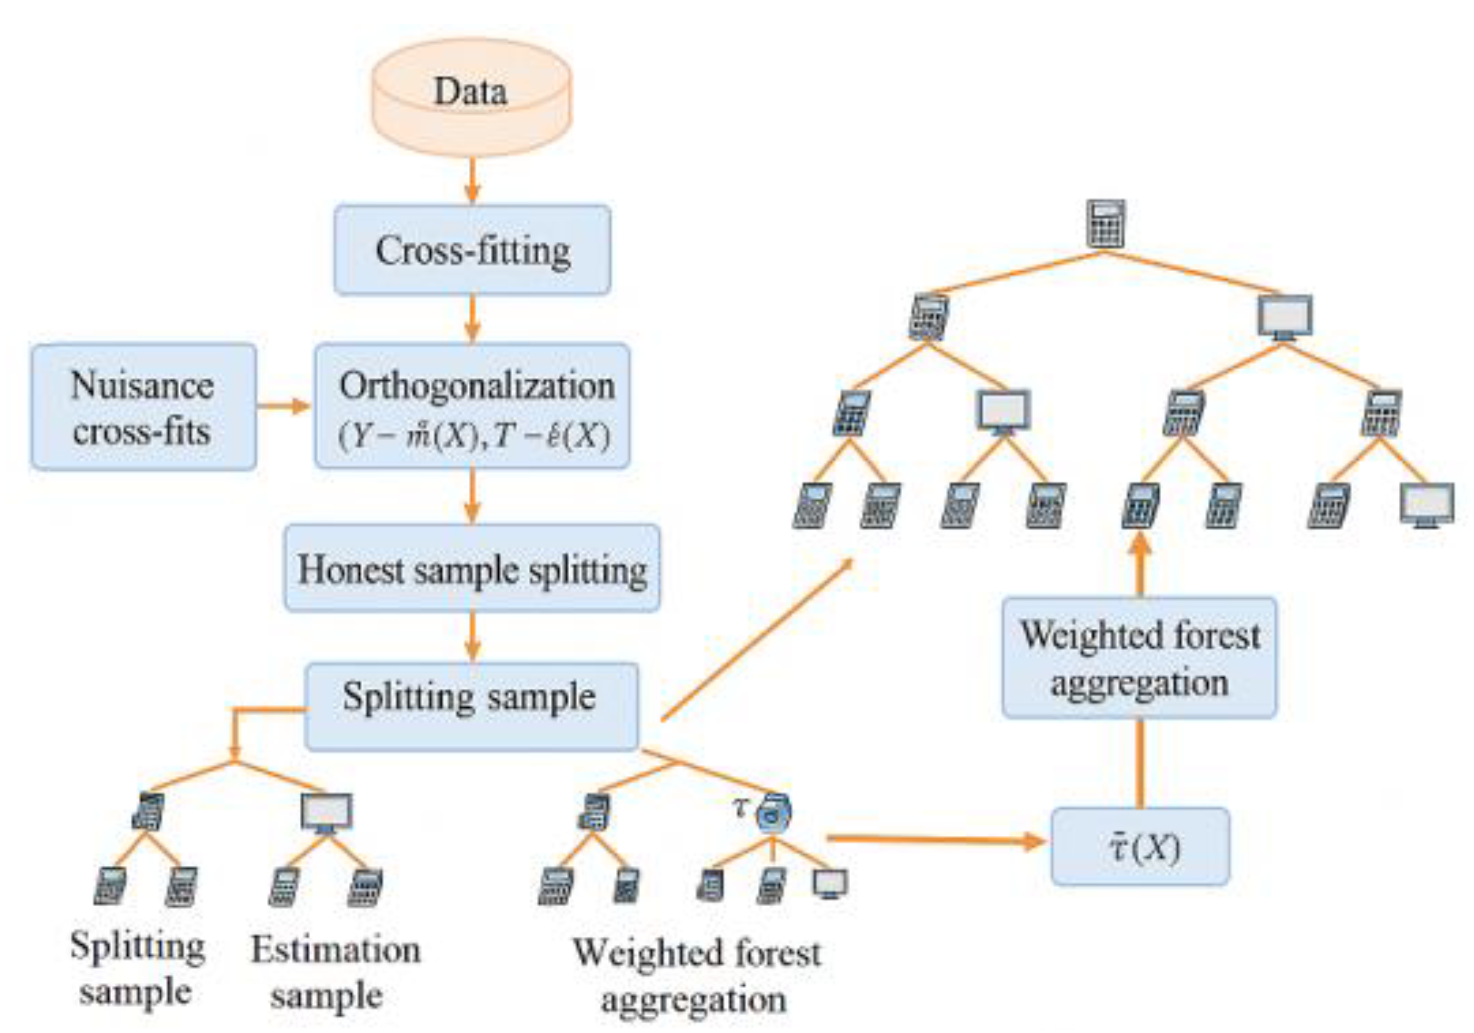
Figure 2.
Path Diagram of Safety-Constrained Strategy Space Contraction and Screening.
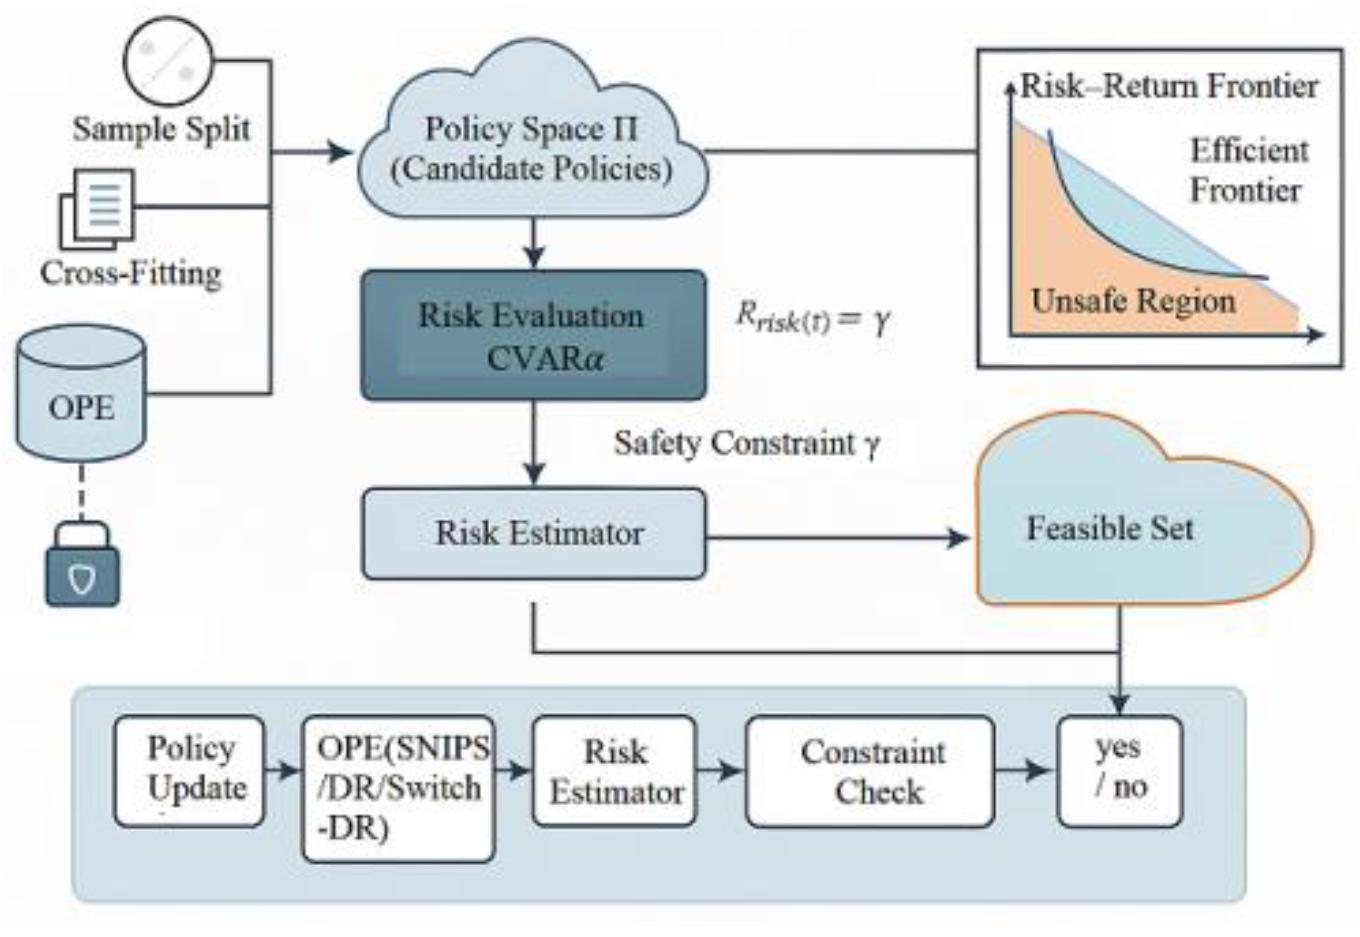
Figure 3.
DR-ATE Robustness Contour and Overlap Diagnostic Plot.
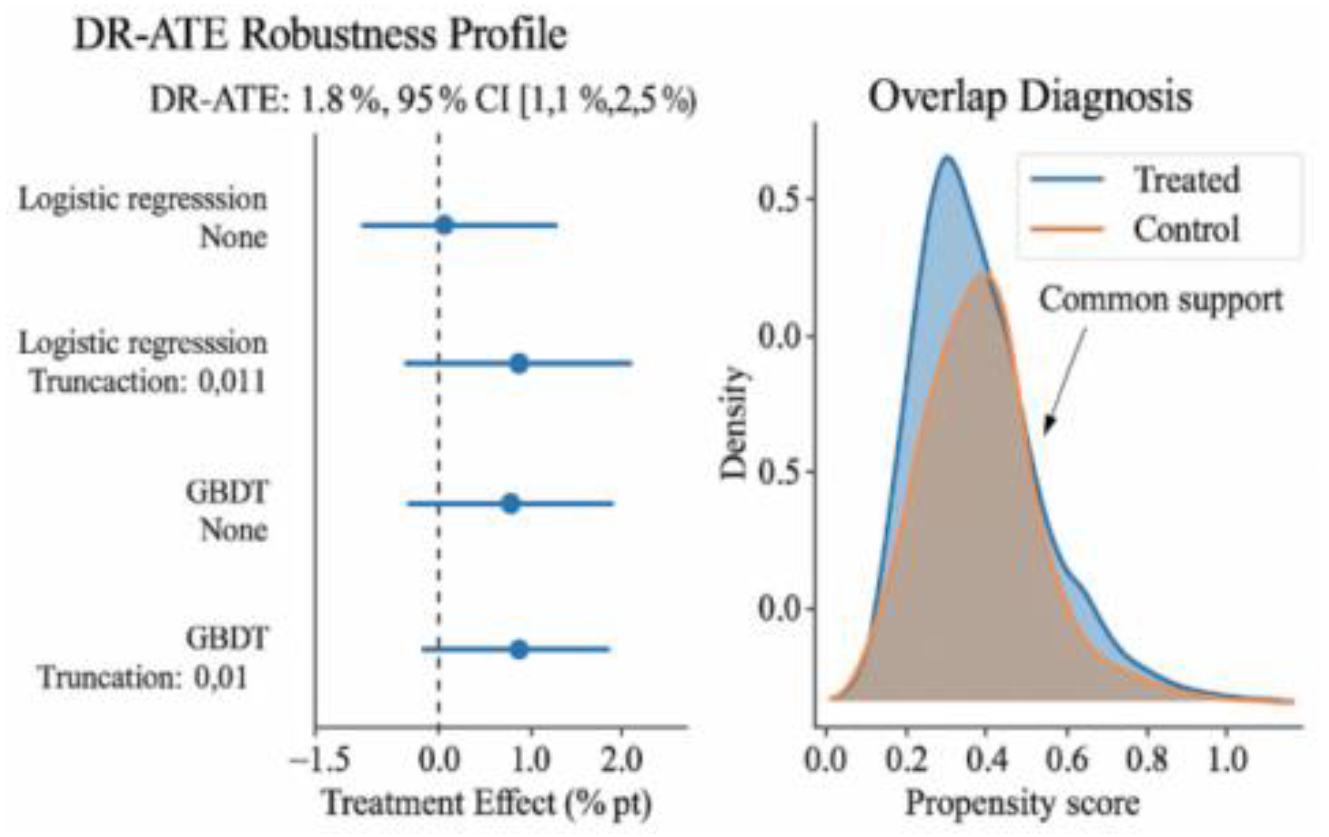
Figure 4.
Multidimensional Causal Profile.
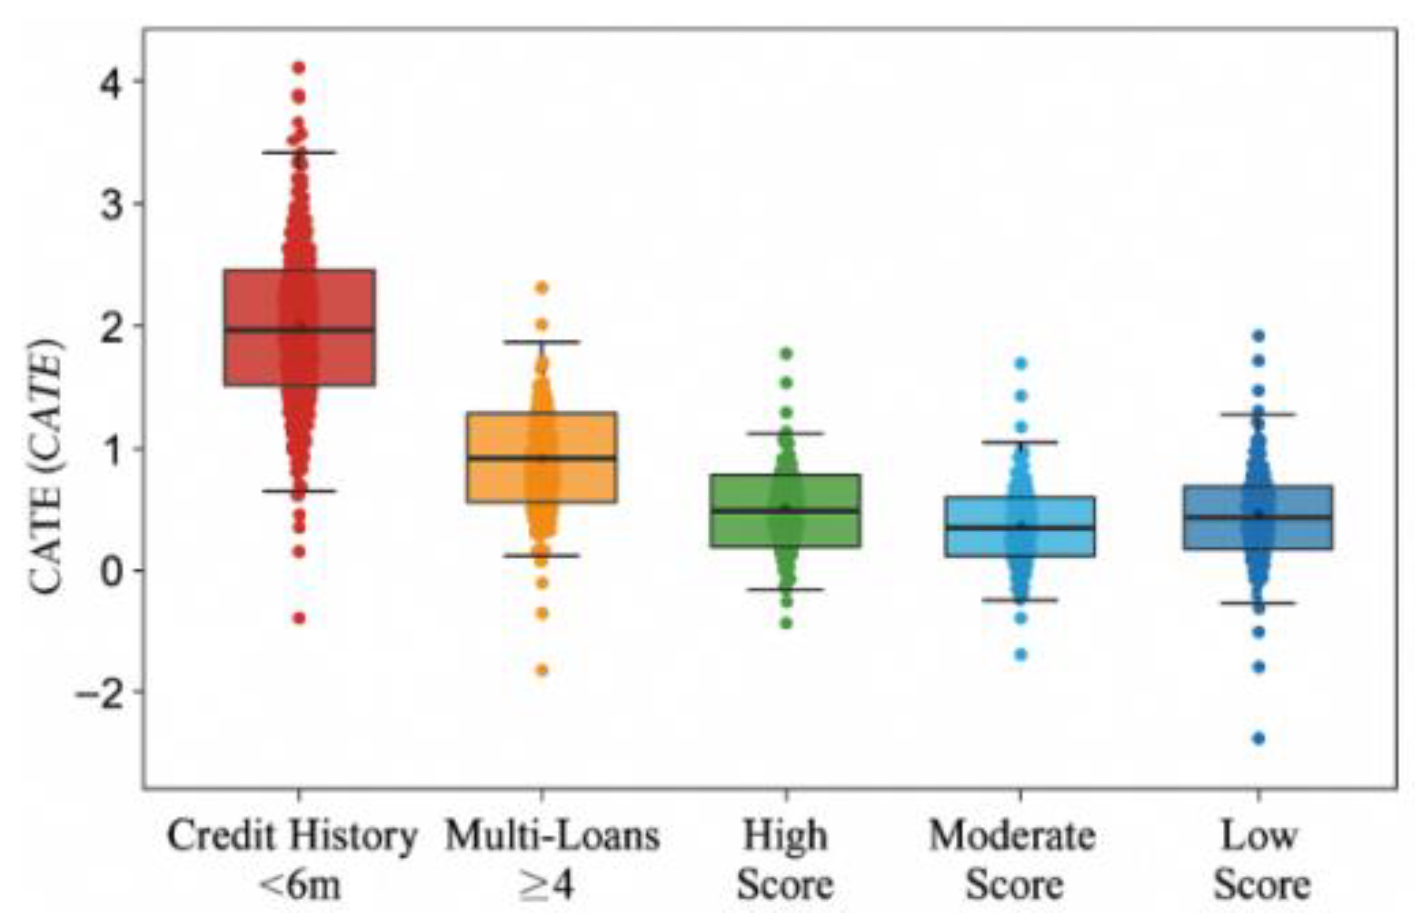

Table 1.
Experimental Variable Definitions and Treatment Settings.
| Variable Name | Type | Description | Coding Method |
| treatment | Treatment variable | Whether promotional intervention was received (SMS + App) | 1=Yes, 0=No |
| click_flag | Mediating variable | Whether promotional content was clicked | Binary variable |
| conversion | Mediating variable | Applied for credit product | Binary variable |
| default_60d | Outcome variable | Default within 60 days | Binary variable |
| strata_id | Strata identifier | Stratification basis (credit score/lending history) | Categorical variable |
Table 1.
Offline Policy Evaluation Estimators and Robustness Configurations.
| Estimator | Definition/Weighting | Key Points for Variance-Bias Control |
| SNIPS | Self-normalizing IPS, wi∝ | Weight normalization, variance controllable but potential bias |
| DR-OPE | Weak dual robustness | Residual correction reduces bias, combined with truncated stable weights |
| Switch-DR | High weights switched to model terms | Threshold-controlled switching between IPS and model terms for enhanced robustness |
Disclaimer/Publisher’s Note: The statements, opinions and data contained in all publications are solely those of the individual author(s) and contributor(s) and not of MDPI and/or the editor(s). MDPI and/or the editor(s) disclaim responsibility for any injury to people or property resulting from any ideas, methods, instructions or products referred to in the content. |
© 2025 by the authors. Licensee MDPI, Basel, Switzerland. This article is an open access article distributed under the terms and conditions of the Creative Commons Attribution (CC BY) license (http://creativecommons.org/licenses/by/4.0/).
Copyright: This open access article is published under a Creative Commons CC BY 4.0 license, which permit the free download, distribution, and reuse, provided that the author and preprint are cited in any reuse.


