
Submitted:
22 October 2025
Posted:
23 October 2025
You are already at the latest version
Abstract
Modern port operations face increasing challenges from rapidly changing weather and environmental conditions, requiring accurate short-term forecasting to support safe and efficient maritime activities. This study presents a sensor fusion–based machine learning framework for real-time nowcasting of meteorological variables in port environments. Using an IoT architecture compliant with the oneM2M standard and deployed at the Port of Livorno, heterogeneous data from environmental sensors (meteorological stations, anemometers) and vessel-mounted LiDAR systems were integrated through feature-level fusion to enhance situational awareness. A comparative performance analysis of Random Forest, XGBoost, LSTM, ConvLSTM, Bayesian neural networks, and transformer models was performed on a four-month dataset (April–August 2025). Results show that LSTM achieved the lowest single-step prediction error, while Bayesian and ensemble models offered superior robustness and uncertainty quantification during cross-validation. These findings indicate that probabilistic and ensemble methods are better suited for deployment in dynamic maritime contexts. The proposed fusion-based machine learning framework demonstrates the potential for integrating real-time environmental intelligence into future Maritime Autonomous Surface Ship (MASS) operations, enabling safer maneuvering and decision-making under variable weather conditions.
Keywords:
sensor fusion
; autonomous vessels
; MASS
; machine learning
; ports
; oneM2M
1. Introduction
The ability to navigate modern maritime ports keeps getting difficult due to constant change in weather, the currents, and changing operational limits. This situation presents unique challenges to both modern and traditional ships; the need to develop and improve situational awareness is of vital importance to ensure that port operations are done in a safe environment. Nonetheless, improving the situational awareness will inherently improve the efficiency of those operations that, in the "port of the future", will be undertaken by autonomous ships (MASS) in conjunction with Remote Operation Centres (ROCs) [1].
Most of the sensors deployed in port environments, such as Light Detection and Ranging (LiDARs), radars, anemometers, weather stations, cameras and GNSS, offer crucial streams of operational and environmental data. Due to the heterogeneous nature of these data coming from multiple data sources, sensor fusion is needed to combine them. This process greatly improves the reliability, accuracy and completeness of the data. For instance, radar provides strong range coverage, while infrared and optical sensors offer fine angular precision; combining both helps lower the uncertainty and improves the tracking of dynamic entities nearby [2].
While several efforts have explored environmental forecasting and sensor fusion in maritime contexts, most have focused either on open-sea navigation or on single-modality sensing systems, leaving a gap in port-specific, real-time predictive frameworks.
Ports now require integrated solutions that can nowcast localised operational and weather conditions in real time. Having this capability is of crucial importance in the ports of the future because any variation of the environmental conditions must be accounted for by prediction algorithms to guarantee the safety of various entities during the berthing, docking and manoeuvring.
In this paper we propose and validate an IoT-enabled, oneM2M-compliant sensor fusion framework deployed in a private cloud at the Port of Livorno. The framework integrates data from meteorological stations, anemometers, and vessel-mounted LiDARs using feature-level fusion to synchronize multimodal data streams. On top of this infrastructure, we evaluate and compare a suite of machine learning and deep learning algorithms, including Random Forest, XGBoost, LSTM, ConvLSTM, Bayesian Neural Networks, and Transformers, for real-time wind speed nowcasting. Therefore, the objectives of this work are summarized as follows:
- To design and validate a hybrid sensor fusion architecture that unifies heterogeneous maritime data sources for environmental nowcasting.
- To benchmark multiple machine learning models and algorithms for short-term wind speed prediction in port conditions.
- To assess the robustness and generalization of these models under real-world constraints and propose a pathway for integration into future MASS and digital twin systems.
This study contributes to the development of data-centric, AI-assisted situational awareness for smart ports, an essential step toward autonomous maritime operations and smart remote operation centers.
The rest of the paper is organized as follows: Section 2 reviews existing literature on sensor fusion, machine learning, and environmental prediction within maritime and related domains, highlighting the gaps this work aims to address. Section 3 presents the proposed architecture, detailing the data sources, oneM2M-compliant infrastructure, and the machine learning pipeline used for wind speed nowcasting. Section 4 reports the experimental results and comparative performance of different algorithms under real port conditions. Section 5 provides an in-depth discussion of the findings, including practical implications, observed limitations, and insights for operational deployment. Finally, Section 6 concludes the paper and outlines future research directions, focusing on extending the dataset, refining the models, and exploring broader integration with port digital twins and MASS operations.
2. Related Works
The fields of sensor fusion, environmental prediction, and maritime IoT systems have seen rapid advances, yet integration across these domains for port-specific predictive modeling remains limited.
A transformer-based model that deeply integrates RGB, long-wave infrared, LiDAR, X-band radar, and electronic chart data, creating a bird’s-eye view around a vessel, demonstrated robustness with its multimodal integration in adverse conditions during real-world trials [3]. However, this work highlights the value of multimodal fusion for perception, yet its focus is situational awareness in open-sea navigation, not environmental prediction or real-time nowcasting in ports. Another study on sensor fusion proposed a fusion framework integrating radar, AIS, and visual camera data for maritime surveillance; Venice’s ARGOS was used to demonstrate efficacy in detecting and tracking non-cooperative targets in congested waterways [4]. The work extended visual fusion methods for maritime surveillance, showing effectiveness in tracking non-cooperative targets. However, their framework addressed detection rather than prediction, and lacked temporal modelling capabilities essential for forecasting.
A statistical anomaly detection system that predicts system faults based on data from a straddle carrier hydraulic sensor demonstrated high accuracy and an F1 score [5]. However, the study focus on operational analytics rather than environmental dynamics or sensor fusion-based prediction.
Machine-to-machine (M2M) communication has become an integral part of complex systems; a lot of work has been put into this area, from the creation of global standards on the common service layer for M2M communication. This task is carried out by the oneM2M partnership project. The players in this industry have been developing commercial and open-source oneM2M-compliant software. Telecom Italia (TIM) described in the AUTOPILOT project [9] a deployment of a oneM2M-compliant platform for IoT, with REST APIs, SSL security, access control policies and device provisioning. However, this deployment was applied in a smart-city pilot use case, not maritime or port scenarios. Another test was conducted by researchers on how to scale the oneM2M IoT open-source platform in a software-defined network (SDN) for an optical network controller scenario; this research found that the platform can be used in pre-production network deployments [8]. Nonetheless, this platform was not tested or evaluated in maritime or port scenarios.
In [10] the authors studied a sequential nowcasting framework that was derived from a process-agnostic Kalman filter and then used constrained regression to enable the estimation of signals not observed using near real-time data. This work demonstrated a sensor fusion framework using health data and not the maritime or port domain. [11] used data from the Automatic Identification System (AIS) to train two sets of artificial neural networks (ANN); they first trained a two-class network and a three-class network. Their models are able to detect anomalies related to the AIS with around 99.9 per cent accuracy in the order of microseconds. This type of fusion on the model level is a decision-level fusion (late fusion) and was focused only on AIS data.
Using historical data from the port of Bordeaux, a machine learning-based application was trained to predict vessel turnaround time; this system outperforms the manual expert-based system [6]. Nonetheless, this study was confined to measuring timing metrics rather than environmental prediction or sensor fusion nowcasting. Another paper uses an autoencoder to detect anomalies from time-series data streams [7]; they first use a band-pass filter to reduce noise and then use a functional neural network autoencoder to detect anomalies. This paper’s approach was generic and did not perform any form of sensor fusion or real-time forecasting.
3. Materials and Methods
In this section, we will lay out the details of the architecture, datasets, and the techniques employed to overcome the limitations discussed in the previous chapters. Firstly, we will describe the sensors that are present in the port and those that are on the ship. Next we will describe the IoT-enabled oneM2M-compliant infrastructure that we use to integrate both the heterogeneous environmental and the operational sensors’ data. After this, the preprocessing steps that we applied to ensure quality and consistencies across modalities such as LiDAR, meteorological sensors, will be discussed. In addition, we will present the machine learning pipeline for real-time nowcasting, the choice of models, the training strategy and the evaluation metrics. Lastly, the experimental setup and simulation environment were used to assess the performance of the system under the representative port conditions.
3.1. Data Sources
Maritime operations in a port environment depend highly on various data sources; we have obtained them from both fixed environmental sensors deployed across the port area and from operational sensors installed onboard of a test vessel. The environmental sensors continuously provide meteorological, hydrodynamic, and atmospheric conditions, while the operational sensors continuously capture the immediate navigational context of the ship. Combining these heterogeneous data streams forms the basis of our sensor fusion and predictive modelling.
For this work, we selected a subset of these sensors: for the environmental sensors category we selected the data coming from the meteorological stations and anemometers while for the operational sensor we used LiDAR installed on the ship.
3.1.1. Environmental Sensors
The sensors previously mentioned serve as the backbone of our port monitoring system. Amongst them, the meteorological station measures the temperature, pressure, wind speed, wind direction, dew point, etc.; all these variables influence the local weather dynamics. The anemometer, on the other hand, complements these measurements by providing high-resolution measurements such as wind speed, wind direction, humidity, pressure, etc. These sensors are strategically placed across the harbour to provide broad spatial coverage of the atmospheric and wind patterns. The image in Figure 1 shows the placements of the sensors.
3.1.2. Operational Sensors
The operational sensors used in this study are mounted on a vessel to enhance the situational awareness during navigation and port manoeuvres. The LiDAR(Figure 2) system enhances the object detection capacity of the ship, also in low-light conditions, by providing three-dimensional spatial mapping capabilities and precise distance. The fusion of these data improves the prediction and situational awareness capabilities.
3.2. System Architecture
The system architecture used in this study follows the three canonical layers approach and integrates heterogeneous port and vessel data sources into one unified private cloud environment [12]. This architectural design was chosen specifically because it offers interoperability, real-time response and scalability to perform sensor fusion-driven predictive analytics.
The physical infrastructure layer is divided into an IoT layer composed by all the sensors responsible of collecting various readings from the surrounding environment and a connectivity layer that enables the connection between the physical layer and the private cloud through different communication mediums. The private cloud layer is the backbone of this architecture. Within this layer, the oneM2M platform alongside various data sources, form a data lake that can be accessed through the Data Virtualisation Layer (DVL). Thanks to the DVL, it is possible to virtualise data and abstract from their actual representation. On top of this infrastructure there is the Application layer which contains all the smart applications deployed to implement all the services useful in port scenarios.
3.2.1. oneM2M Platform
The oneM2M platform deployed in the private cloud layer is the open-source implementation of the oneM2M standard called Mobius. This is developed by the Korea Electronics Technology Institute (KETI). This implementation is designed for research and development. The platform acts as a middleware for IoT applications. The core functionalities of the Mobius platform include registration, data management, subscription, notification and security.
3.2.2. Data Flow Pipeline
The flow of our data starts from the sources; this means that any of our heterogeneous sensors will read the data and push it to the layer above it until the smart applications at the top of our architecture consume it. When any of our environmental sensors (i.e., anemometers) and operational sensors (i.e., LiDAR) transmit raw data in the IoT sublayer, these streams are carried by the connectivity sublayer using a combination of wire and wireless technologies such as the deployed fibre optics, 4G/5G, and Narrow Band IoT (NB-IoT). From the connectivity sublayer, data is ingested into our Mobius machine-to-machine platform. On this platform, initial processing of the data, such as authentication of the origin device, metadata tagging, and synchronisation, occurs.
In the data lake sublayer, the data ingested into the Mobius platform can be accessed via a request from the DVL in conjunction with the message broker from the service management and orchestration sublayer; both manage to decouple the sensors on the physical infrastructure layer with the use of standardised APIs for the smart applications layer. This flow allows the developer to access data from multiple sensors in a harmonised way, and it ensures the interoperability of sensors. The smart applications then use the data for predictive analysis. The enhanced awareness for vessel manoeuvre application is able to utilise this pipeline to perform analysis and manoeuvre planning. Using such an end-to-end pipeline guarantees that the system is able to perform sensor fusion and run predictive algorithms that can operate on consistent, high-quality, and real-time data streams, as shown in Figure 3.
3.3. Sensor Fusion Strategy
A dedicated strategy is needed to fuse the sample data produced by our range of heterogeneous sensors, which operate at different rates, formats, and levels of precision, so that we can create a harmonised dataset for nowcasting. By doing this, we aim to improve the accuracy and robustness of the smart application. The strategy that we adopt in this work is the mid-level fusion technique, also known as the feature-level fusion. This strategy helps us to capture the intricate relationship between data from different sensors. The selected features from the combined dataset will be used to nowcast a target; in our case, the wind speed as detected by our meteorological station. The combination of the environmental data and the operational data into a single context helps us achieve our goals with high precision and accuracy.
3.3.1. Early, Middle, and Late Fusion
The most common strategies or approaches to perform sensor fusion are three: early fusion, middle fusion, and late fusion [13]. We can implement sensor fusion at different stages of a pipeline. Early fusion, or low-level fusion, is a strategy whereby at the lowest level, raw data from multiple sensors are fused together. In this strategy, all information from all the sensors is retained, and this enables models such as deep neural networks to learn the correlation between the sensors. However, this strategy has a high computational demand, and with large enough features, we might run into the curse of dimensionality.
The second strategy to fuse sensor data is the middle-level fusion strategy or approach. This strategy is also known as feature-level fusion; this is a level of abstraction between the early-level and late-level fusion. In this strategy, extracted features from the sensors are chosen and then fused together. Unlike the early-level fusion, we reduce the dimensionality while we retain the critical spatial and temporal information.
Contrary to early fusion, in late fusion or high-level fusion, each dataset from a sensor is used to train a model. When we have various models built specifically on a particular dataset, we use the combination of the sensors to perform detection or prediction. This combo helps improve the robustness, reliability, and accuracy of our system, as if one of the sensors malfunctions, other sensors, even if not exactly the same, like the meteorological sensor and the anemometer, provide the redundancy that our system can rely upon.
3.3.2. Data Preprocessing and Data Quality
A systematic preprocessing pipeline was used before our data could be used for modelling; by doing so, we ensure the consistency, reliability, and alignment of all the data sources.
Data Acquisition and Inspection: As discussed in Section 3.1.1 and Section 3.1.2, data were collected from various sources, both environmental and operational. The first environmental data source is the meteorological station. The data consist of 53572 rows as shown in Figure 4; as seen from the figure, there are years in which readings were missing for some of the attributes.
The second environmental sensor is the anemometer sensor. We collect the raw data from two anemometers, which then goes through the pipeline and quality checks are performed just as the previous dataset. After cleaning each of the anemometer datasets, we combined them into a single anemometer dataset. In Figure 5 we can see the distribution of some of the columns over time.
From the operational data, we first extracted attributes from the .las LiDAR files, such as the means of x, y, and z; the min; the max; the standard deviation of z; etc.
All of the data were imported using Pandas dataframes for the inspection, cleaning and preparation.
Timestamp Standardization: To make sure that our datasets are consistent, we converted the timestamp field into a datetime format and set it as a DataFrame index. The reason for this is to better allow us to fill in missing columns. Due to the imbalance of the timestamp and readings of the sensors, we performed operations such as interpolation to fill missing columns.
Missing Data Treatment: To handle missing or incomplete data, we looked at our datasets, and we can see that the data from the Meteorological station in Figure 4 started from 2021 to 2025, and between mid 2021 to early 2025 only pressure-meteo and temperature-meteo were recorded. Thereby, dropping the rows within this period is more appropriate than filling it.
Data Fusion: After completing the preprocessing steps, we merged the different datasets from the sensors into a single synchronised dataframe based on their timestamps. To do so, we decided to take only data starting from 1st April 2025 to 21st August; this is about four months of data. The reason behind this is because there is not much data before this period to use. For time slots in which data was not present due to the rate at which all the sensors publish their data, we performed time-based interpolation to fill/replace them. This method fills the columns by estimating the temporal distance between points/columns that are known; this helps us have continuity and minimise distortion. Our task is defined as a single-step-ahead prediction of wind speed measured by the meteorological station (wind_speed_meteo_target). The nowcasting target was generated by shifting the wind speed series one timestep forward:
Correlation Analysis and Feature Selection: In order to reduce dimensionality and multicollinearity, we used correlation-based filtering to compute the correlation coefficients between the target features and the target variables. We used the Pearson[14] method. Doing this reduced the dimensions of our dataset by removing those with low correlation or high redundancy. With the Pearson method, 14 features were selected.
The Pearson correlation coefficient as shown in equation 1 evaluates correlations between different sensor variables. This method fits suitably into our pipeline as we have many features from various sensors.
Data Normalization and Scaling: We utilise the StandardScaler algorithm( equation 2) to standardise data by scaling to a zero mean and a unit variance, as defined by:
where x is the starting value, is the mean value, and is one standard deviation of a feature. Such scaling is particularly convenient for our data set because sensors for environmental and operational parameters measure with very different units (e.g., temperature in °C, pressure in hPa, wind speed in m/s). Otherwise, features with large magnitudes could dominate learning, leading to bias. Making all variables contribute equally, StandardScaler ensures more stable learning and convergence of models across the entire fusion pipeline.
3.4. Machine Learning Models
We employed ensemble methods, recurrent neural networks, convolution-recurrent hybrids, probabilistic deep learning, and attention-based architectures to predict short-term wind speed within port areas. These models were selected to capture both the nonlinear relationships and temporal dynamics inherent in the data.
Random Forest
Random Forest (RF) [15] is an ensemble learning method that constructs multiple decision trees using bootstrap samples and random feature subsets. The final prediction is obtained by averaging across all trees, providing robustness against overfitting and variance.
XGBoost
Extreme Gradient Boosting (XGBoost) [16] is a scalable tree-based ensemble technique that builds additive models sequentially, where each tree corrects the residuals of the previous ones. Regularization and efficient parallelization make it suitable for structured data regression tasks.
Long Short-Term Memory (LSTM)
Long Short-Term Memory networks [17] extend recurrent neural networks by incorporating gating mechanisms that allow them to retain long-term dependencies. This makes them particularly effective for modeling temporal sequences such as wind speed data.
Convolutional LSTM (ConvLSTM)
ConvLSTM [18] integrates convolutional operations within the LSTM architecture to simultaneously model spatial and temporal correlations. It is especially useful for spatiotemporal forecasting problems like port-level wind prediction.
Bayesian Neural Network (BNN)
Transformer
Transformers [21] leverage self-attention mechanisms to capture long-range dependencies in sequences without relying on recurrence. Their parallel computation and scalability make them powerful for complex temporal modeling tasks.
Training Parameters
The Hyper-parameters set on each model to balance complexity and performance is shown in the table below.

Table 1.
Key hyperparameters for the machine learning models.
| Model | Key Parameters |
|---|---|
| Random Forest (RF) | 200 estimators; controlled randomness. |
| XGBoost | 200 boosting rounds; reg:squarederror objective; learning rate decay. |
| LSTM / ConvLSTM | Adam optimizer (); batch size 64; sequence length 10; |
| hidden dimension: 64 (LSTM), 32 (ConvLSTM). | |
| BNN | Two dense hidden layers (64, 32 units); dropout probability 0.2; |
| 100 Monte Carlo dropout samples for uncertainty. | |
| Transformer | Two encoder layers; four attention heads; hidden dimension 64; |
| Adam optimizer () with early stopping. |
3.5. Experimental Setup
Details of the data split, evaluation metrics, and system setup are provided below.
Train/Validation/Test split
To prevent look-ahead bias, we applied a chronological split: the first 80% of samples were used as the training set, while the last 20% were used for testing. Models requiring validation (e.g., Transformer with early stopping) used a further 10% slice from the training portion. For cross-validation, time-series-aware folds (rolling/expanding windows) were employed instead of random shuffling.
Evaluation Metrics
Model performance was assessed using root mean squared error (RMSE), mean absolute error (MAE), and the coefficient of determination ():
Hardware and Software
All models were trained on a workstation with a 6-core (12-thread) Intel CPU (x86_64), 16 GB RAM, and an NVIDIA GeForce RTX 2060 GPU. Experiments were implemented in Python 3.12.3 using PyTorch 2.8.0+cu128, scikit-learn 1.7.1, and CUDA 12.8 for GPU acceleration.
4. Results
In this section we will present the results of the experiments carried out, including prediction accuracy, visualisation of model outputs along with a comparative analysis of sensor fusion. We report single- target prediction results as well as cross-validation outcomes to evaluate the robustness and the ability of the models to generalise.
4.1. Prediction Accuracy
The summary of single-target performances of all models in terms of RMSE, MAE, and can be seen in Table 2. The optimal overall accuracy can be obtained by LSTM (, , ), and Bayesian Neural Network presented relatively similar results (). Random Forest and XGBoost also presented stable performances as well, although lower can be obtained. ConvLSTM did not perform well due to negative , and Transformer model presented the largest error rates.
The cross-validation results can be seen in Table 3. The standard ensemble schemes (XGBoost, Random Forest) showed very stable performance across folds, . The Bayesian Neural Network also demonstrated strong performance () , which can be regarded as evidence in favor of uncertainty-aware modeling. The sequence models, LSTM and ConvLSTM, showed higher variance across folds, showing sensitivity to hyperparameters and temporal dynamics.
4.2. Visualization
Figure 6 compares models in terms of RMSE, MAE, and . The bar plots indicate LSTM and Bayesian NN have outperformed other methods, and Transformer underperformed at all times.
Finally, Figure 7 shows a radar chart of normalised criteria over RMSE, MAE, and , facilitating multi-dimensional comparison. Bayesian NN and LSTM occupy larger areas, which confirms their stability, and ConvLSTM and Transformer occupy the smallest areas.
5. Discussion
The results from our experiment show a varying degree of strengths and weaknesses from the classical machine learning models, Bayesian methods, recurrent architectures, and attention-based models used to nowcast wind speed. Random Forest and XGBoost are the two best-performing models, which consistently achieved very low error metrics in the cross-validation phase, thereby indicating their ability to capture short-term dependencies in the data. However, the difference between their stellar performance in cross-validation compared to their single-target performance might suggest possible data leakage within the cross-validation pipeline. In addition, the Bayesian Neural Network showed strong performance with its ability to generalise while it provides an estimate of predictive uncertainty, which is valuable for maritime operations that are risk-aware while making a decision.
In contrast, the recurrent and attention-based models (LSTM, ConvLSTM, and Transformers) underperformed relative to the expected outcomes. LSTM, ConvLSTM, and Transformer all produced negative scores across all cross-validation folds, indicating that they are the worst performers even against a simple baseline model. The Transformer performed exceptionally badly amongst all models with a mean of -31.89, thus suggesting that its high parametrisation and architectural complexity do not align with the size and characteristics of our dataset. In addition, this underperformance of the models highlights the challenges of applying sequence models to datasets with limited sequence length and complexity without extensive fine-tuning.
Looking at the result, we can see that there are practical implications for port operations, vessel traffic services, and digital twin systems. Ability to accurately predict the wind speed is vital to inform decisions for safe navigation, optimise berth allocation, and reduce risks while handling cargo. Lightweight models such as Random Forest and XGBoost demonstrated their effectiveness and suggest that their deployment on edge devices or SmartNIC-enabled maritime infrastructure is feasible. Meanwhile, Bayesian models demonstrate their ability to be used in risk-aware systems where predicting uncertainty influences operational decision-making.
Limitations
An important limitation of this study is the temporal scope of the dataset. The experimental data used to conduct the training and testing of the models were of approximately four and a half months from the sensor, that is, between April and August 2025. Although this dataset captures some seasonal dynamics in wind speed, this does not cover a full annual cycle. With that, the models were tested with inter-seasonal variations. To allow for more improvement on the model’s robustness and generalisation capabilities across seasonal changes, extending the dataset to cover at least one year is required. In the future, we will prioritise the collection of data over a long period of time to validate whether the performance observed is a consistent pattern over broader temporal scales.
6. Conclusions and Future Works
In this study, we investigated a single-step wind speed prediction by fusing environmental (meteorological) and operational (vessel-mounted sensor) data. We evaluated the accuracy, robustness, and interpretability of a range of models from classical machine learning methods to deep learning and Bayesian approaches.
It was concluded from the results that Random Forest and XGBoost performed consistently strong and are suitable for real-time deployment in operational systems. Bayesian neural networks also performed well while simultaneously showing they can be an effective factor for risk-aware maritime operations. However, LSTM, ConvLSTM, and Transformer performed badly; this can be attributed to the limitations on the dataset and the need for fine-tuning of these complex models.
The following are the key contributions from this study:
- Comparison among multiple model paradigms for maritime wind speed nowcasting.
- Bayesian Neural Networks was used to demonstrate capacity to predict in situations with high uncertainty.
- We got practical insights on how to select models to integrate with port digital twins and real-time decision support systems (Remote Operation Centres for MASS).
It is required to verify potential data leakage in our cross-validation pipeline, especially on those models that perform exceptionally well. Furthermore, there is a need to collect more datasets, at least over a period of a year, so that we can have more enriched data.
Author Contributions
Conceptualization, M.H. and F.K.D.A.; methodology, M.H. and F.K.D.A.; software, M.H. and F.K.D.A.; validation, M.H., F.K.D.A., K.G.G. and A.T.; formal analysis, M.H. and F.K.D.A.; investigation, M.H. and F.K.D.A.; resources, P.P.; data curation, M.H. and F.K.D.A.; writing original draft preparation, M.H. and F.K.D.A.; writing review and editing, A.T., K.G.G. and P.P.; visualization, M.H. and K.G.G.; supervision, P.P.; co-supervision, A.T.; project administration, A.T. and P.P.; funding acquisition, A.T. and P.P. All authors have read and agreed to the published version of the manuscript.
Funding
This research received no external funding.
Acknowledgments
The authors gratefully acknowledge the Grimaldi Group for facilitating LiDAR data collection activities on board their vessel. The authors also wish to thank the Port Network Authority of the North Tyrrhenian Sea for authorizing the use of sensor infrastructure within their port area for this research.
References
- M. Haruna, K. G. Gebremeskel, M. Troscia, A. Tardo, and P. Pagano, “Mechanisms for Securing Autonomous Shipping Services and Machine Learning Algorithms for Misbehaviour Detection,” Telecom, vol. 5, no. 4, pp. 1031–1050, 2024. doi:10.3390/telecom5040053.
- Z. Liu, Y. Cai, H. Wang, and L. Chen, “Surrounding Objects Detection and Tracking for Autonomous Driving Using LiDAR and Radar Fusion,” Chinese Journal of Mechanical Engineering, vol. 34, no. 5, p. 117, 2021. doi:10.1186/s10033-021-00630-y.
- Dagdilelis, D.; Grigoriadis, P.; Galeazzi, R. Multimodal and Multiview Deep Fusion for Autonomous Marine Navigation. arXiv 2025, arXiv:2505.01615.
- Bloisi, D.; Iocchi, L.; Nardi, D.; Fiorini, M. Integrated Visual Information for Maritime Surveillance. In Clean Mobility and Intelligent Transport Systems; 2015; pp. 237–263. doi:10.1049/PBTR001E_ch11.
- Aslam, S.; Navarro, A.; Aristotelous, A.; Garro Crevillen, E.; Martínez-Romero, A.; Martínez-Ceballos, Á.; Cassera, A.; Orphanides, K.; Herodotou, H.; Michaelides, M.P. Machine Learning-Based Predictive Maintenance at Smart Ports Using IoT Sensor Data. Sensors 2025, 25, 3923. doi:10.3390/s25133923.
- Stepec, D.; Martincic, T.; Klein, F.; Vladusic, D.; Costa, J.P. Machine Learning Based System for Vessel Turnaround Time Prediction. In Proceedings of the 21st IEEE International Conference on Mobile Data Management (MDM), Versailles, France, 30 June–3 July 2020; pp. 258–263. doi:10.1109/MDM48529.2020.00060.
- Backhus, J.; Rao, A.R.; Venkatraman, C.; Gupta, C. Time Series Anomaly Detection Using Signal Processing and Deep Learning. Appl. Sci. 2025, 15, 6254. doi:10.3390/app15116254.
- Troscia, M.; Sgambelluri, A.; Paolucci, F.; Castoldi, P.; Pagano, P.; Cugini, F. Scalable OneM2M IoT Open-Source Platform Evaluated in an SDN Optical Network Controller Scenario. Sensors 2022, 22, 431. doi:10.3390/s22020431.
- Velizhev, A.; Hebgen, B.; Ravesteijn, D.; Legaspi, X.; Bosi, I.; Martin, D.; Gavazzi, R.; Dingenen, F.; Viola, L.; Bauer, M.; Simeon, J.-F.; Scholliers, J.; Tcheumadjeu, L.; Alaya, M.; Falcitelli, M. AUTOPILOT Deliverable 2.7: Report on the Implementation of the IoT Platform, 2019.
- Jahja, M. Sensor Fusion Frameworks for Nowcasting. Ph.D. Thesis, Carnegie Mellon University, Pittsburgh, PA, USA, 2022. doi:10.1184/R1/19669542.v1.
- Singh, S.K.; Heymann, F. Machine Learning-Assisted Anomaly Detection in Maritime Navigation Using AIS Data. arXiv 2020, arXiv:2002.05013.
- D. Barasti, M. Troscia, D. Lattuca, A. Tardo, I. Barsanti, and P. Pagano, “An ICT Prototyping Framework for the “Port of the Future”,” Sensors, vol. 22, no. 1, p. 246, 2022. doi:10.3390/s22010246.
- Banerjee, K.; Notz, D.; Windelen, J.; Gavarraju, S.; He, M. Online Camera LiDAR Fusion and Object Detection on Hybrid Data for Autonomous Driving. In Proceedings of the 2018 IEEE Intelligent Vehicles Symposium (IV), Changshu, China, 26–30 June 2018; pp. 1632–1638. doi:10.1109/IVS.2018.8500648.
- I. M. Nasir, M. A. Khan, M. Yasmin, J. H. Shah, M. Gabryel, R. Scherer, and R. Damaševičius, “Pearson Correlation-Based Feature Selection for Document Classification Using Balanced Training,” Sensors, vol. 20, no. 23, p. 6793, 2020. doi:10.3390/s20236793.
- Breiman, L. (2001). Random forests. Machine Learning, 45(1), 5–32. [CrossRef]
- Chen, T., & Guestrin, C. (2016). XGBoost: A scalable tree boosting system. Proceedings of the 22nd ACM SIGKDD International Conference on Knowledge Discovery and Data Mining, 785–794. [CrossRef]
- Hochreiter, S., & Schmidhuber, J. (1997). Long short-term memory. Neural Computation, 9(8), 1735–1780. [CrossRef]
- Shi, X., Chen, Z., Wang, H., Yeung, D.Y., Wong, W.K., & Woo, W.C. (2015). Convolutional LSTM network: A machine learning approach for precipitation nowcasting. Advances in Neural Information Processing Systems (NeurIPS), 28.
- Blundell, C., Cornebise, J., Kavukcuoglu, K., & Wierstra, D. (2015). Weight uncertainty in neural networks. Proceedings of the 32nd International Conference on Machine Learning (ICML), 1613–1622. https://proceedings.mlr.press/v37/blundell15.html.
- Gal, Y., & Ghahramani, Z. (2016). Dropout as a Bayesian approximation: Representing model uncertainty in deep learning. Proceedings of the 33rd International Conference on Machine Learning (ICML), 1050–1059. https://proceedings.mlr.press/v48/gal16.html.
- Vaswani, A., Shazeer, N., Parmar, N., Uszkoreit, J., Jones, L., Gomez, A.N., Kaiser, Ł., & Polosukhin, I. (2017). Attention is all you need. Advances in Neural Information Processing Systems (NeurIPS), 30. https://arxiv.org/abs/1706.03762.
Figure 1.
Sensors at the port of Livorno
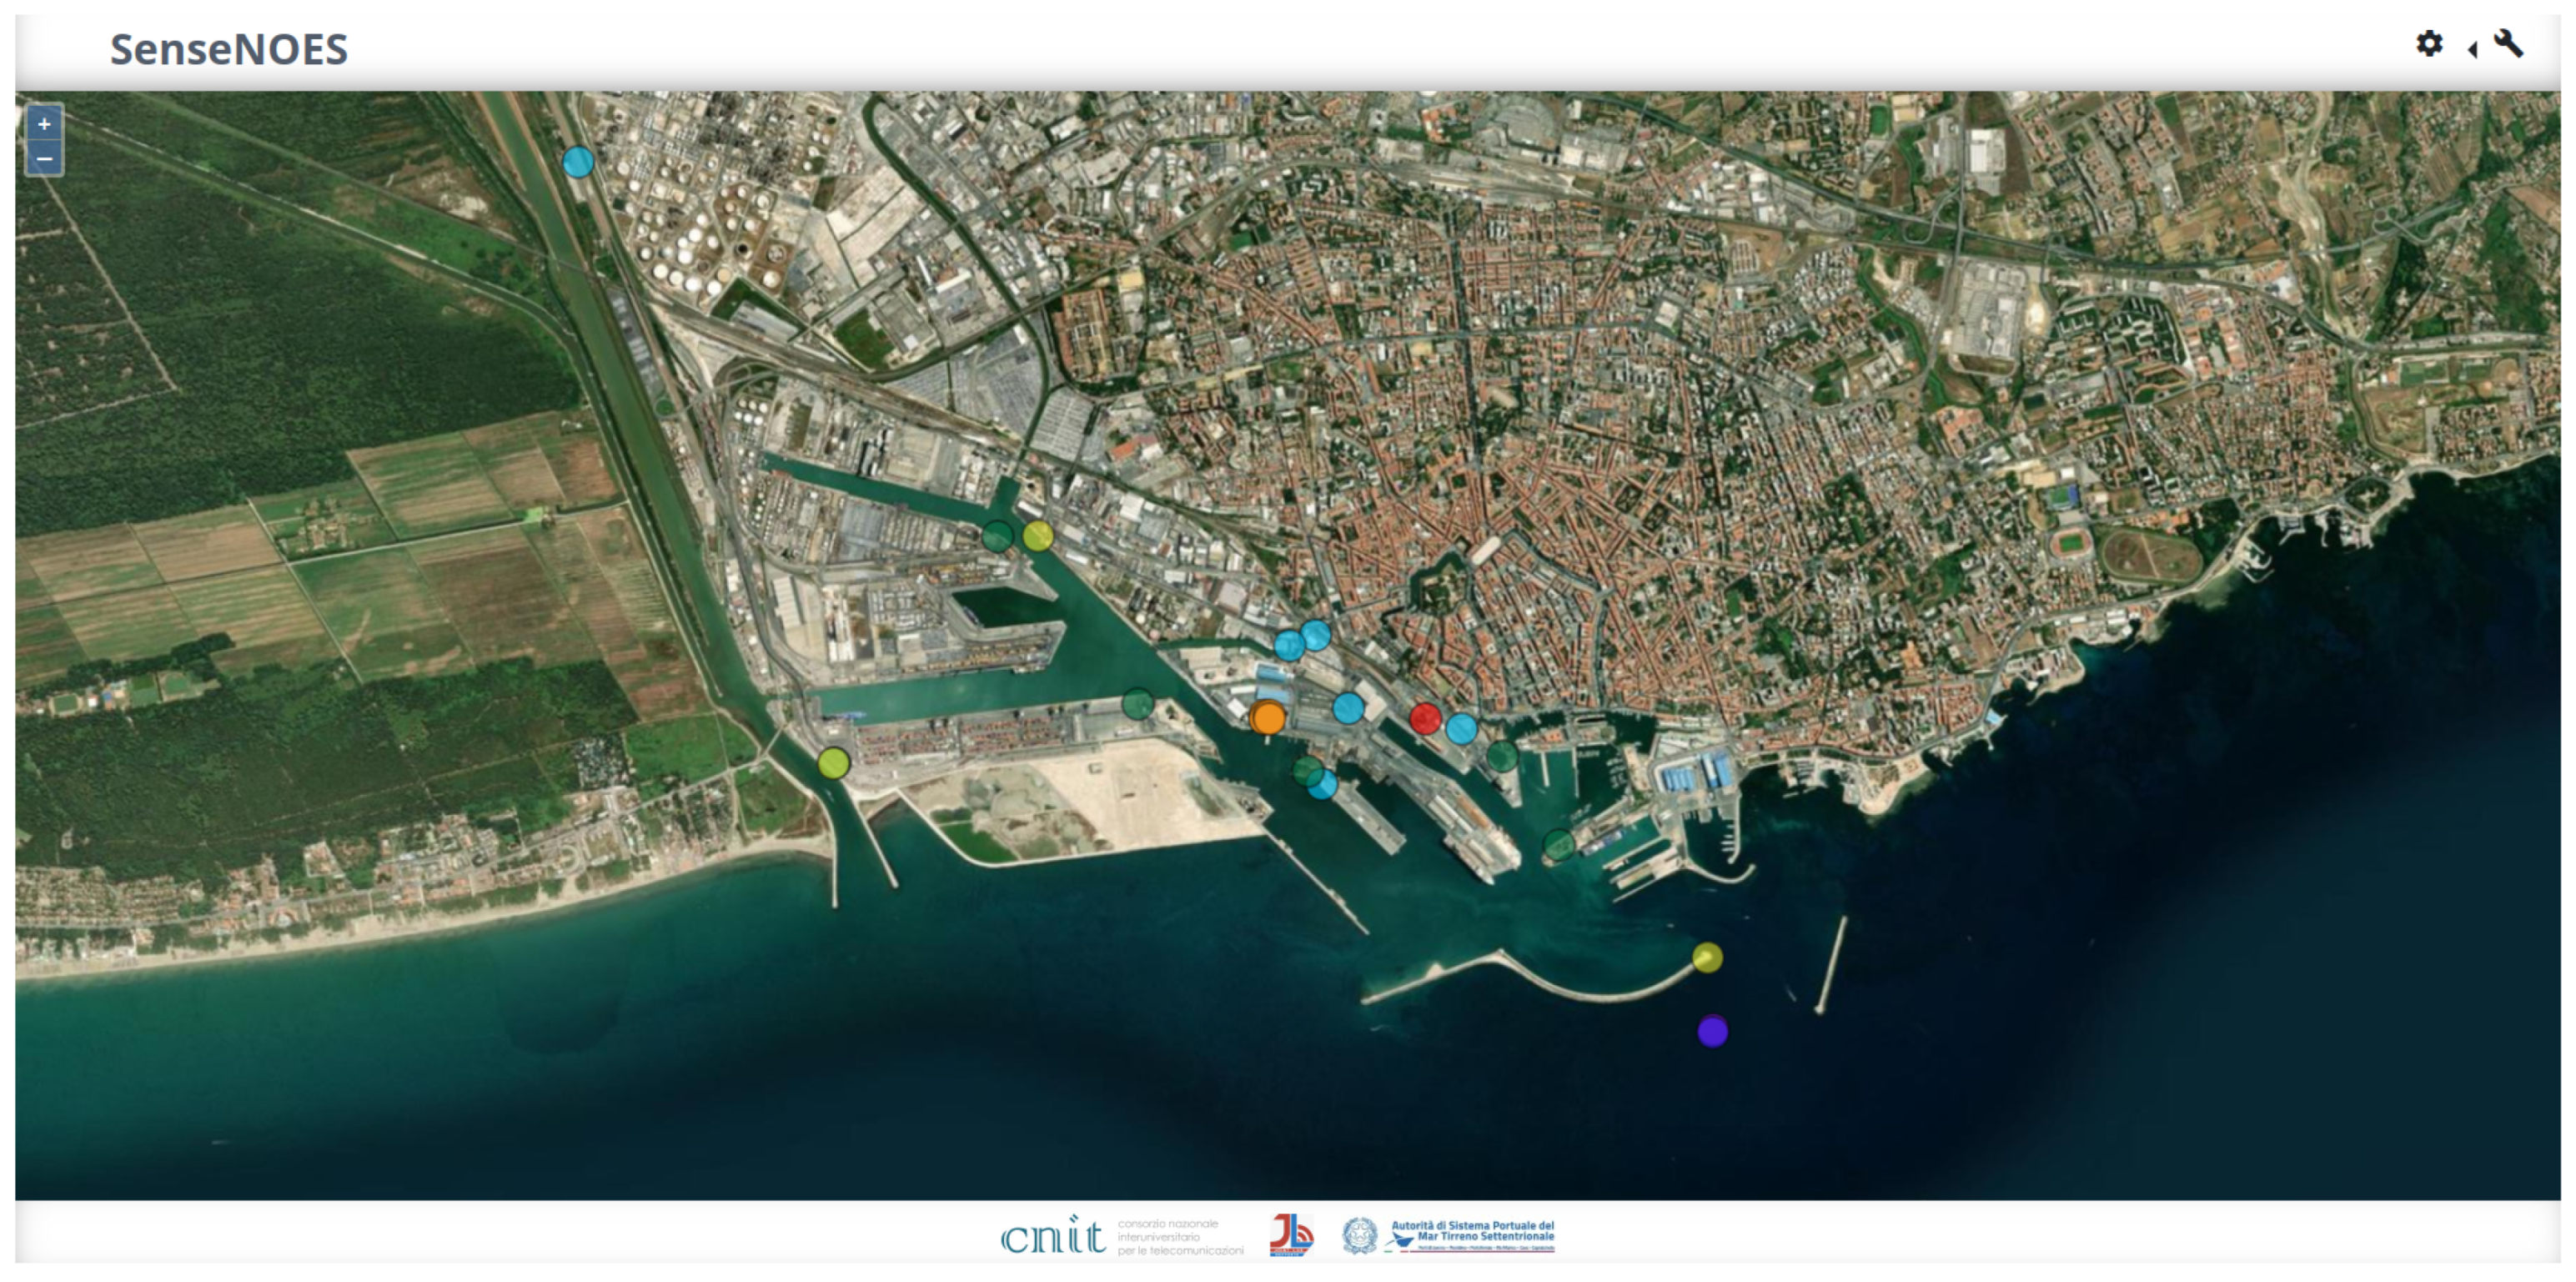
Figure 2.
LiDARs on Board
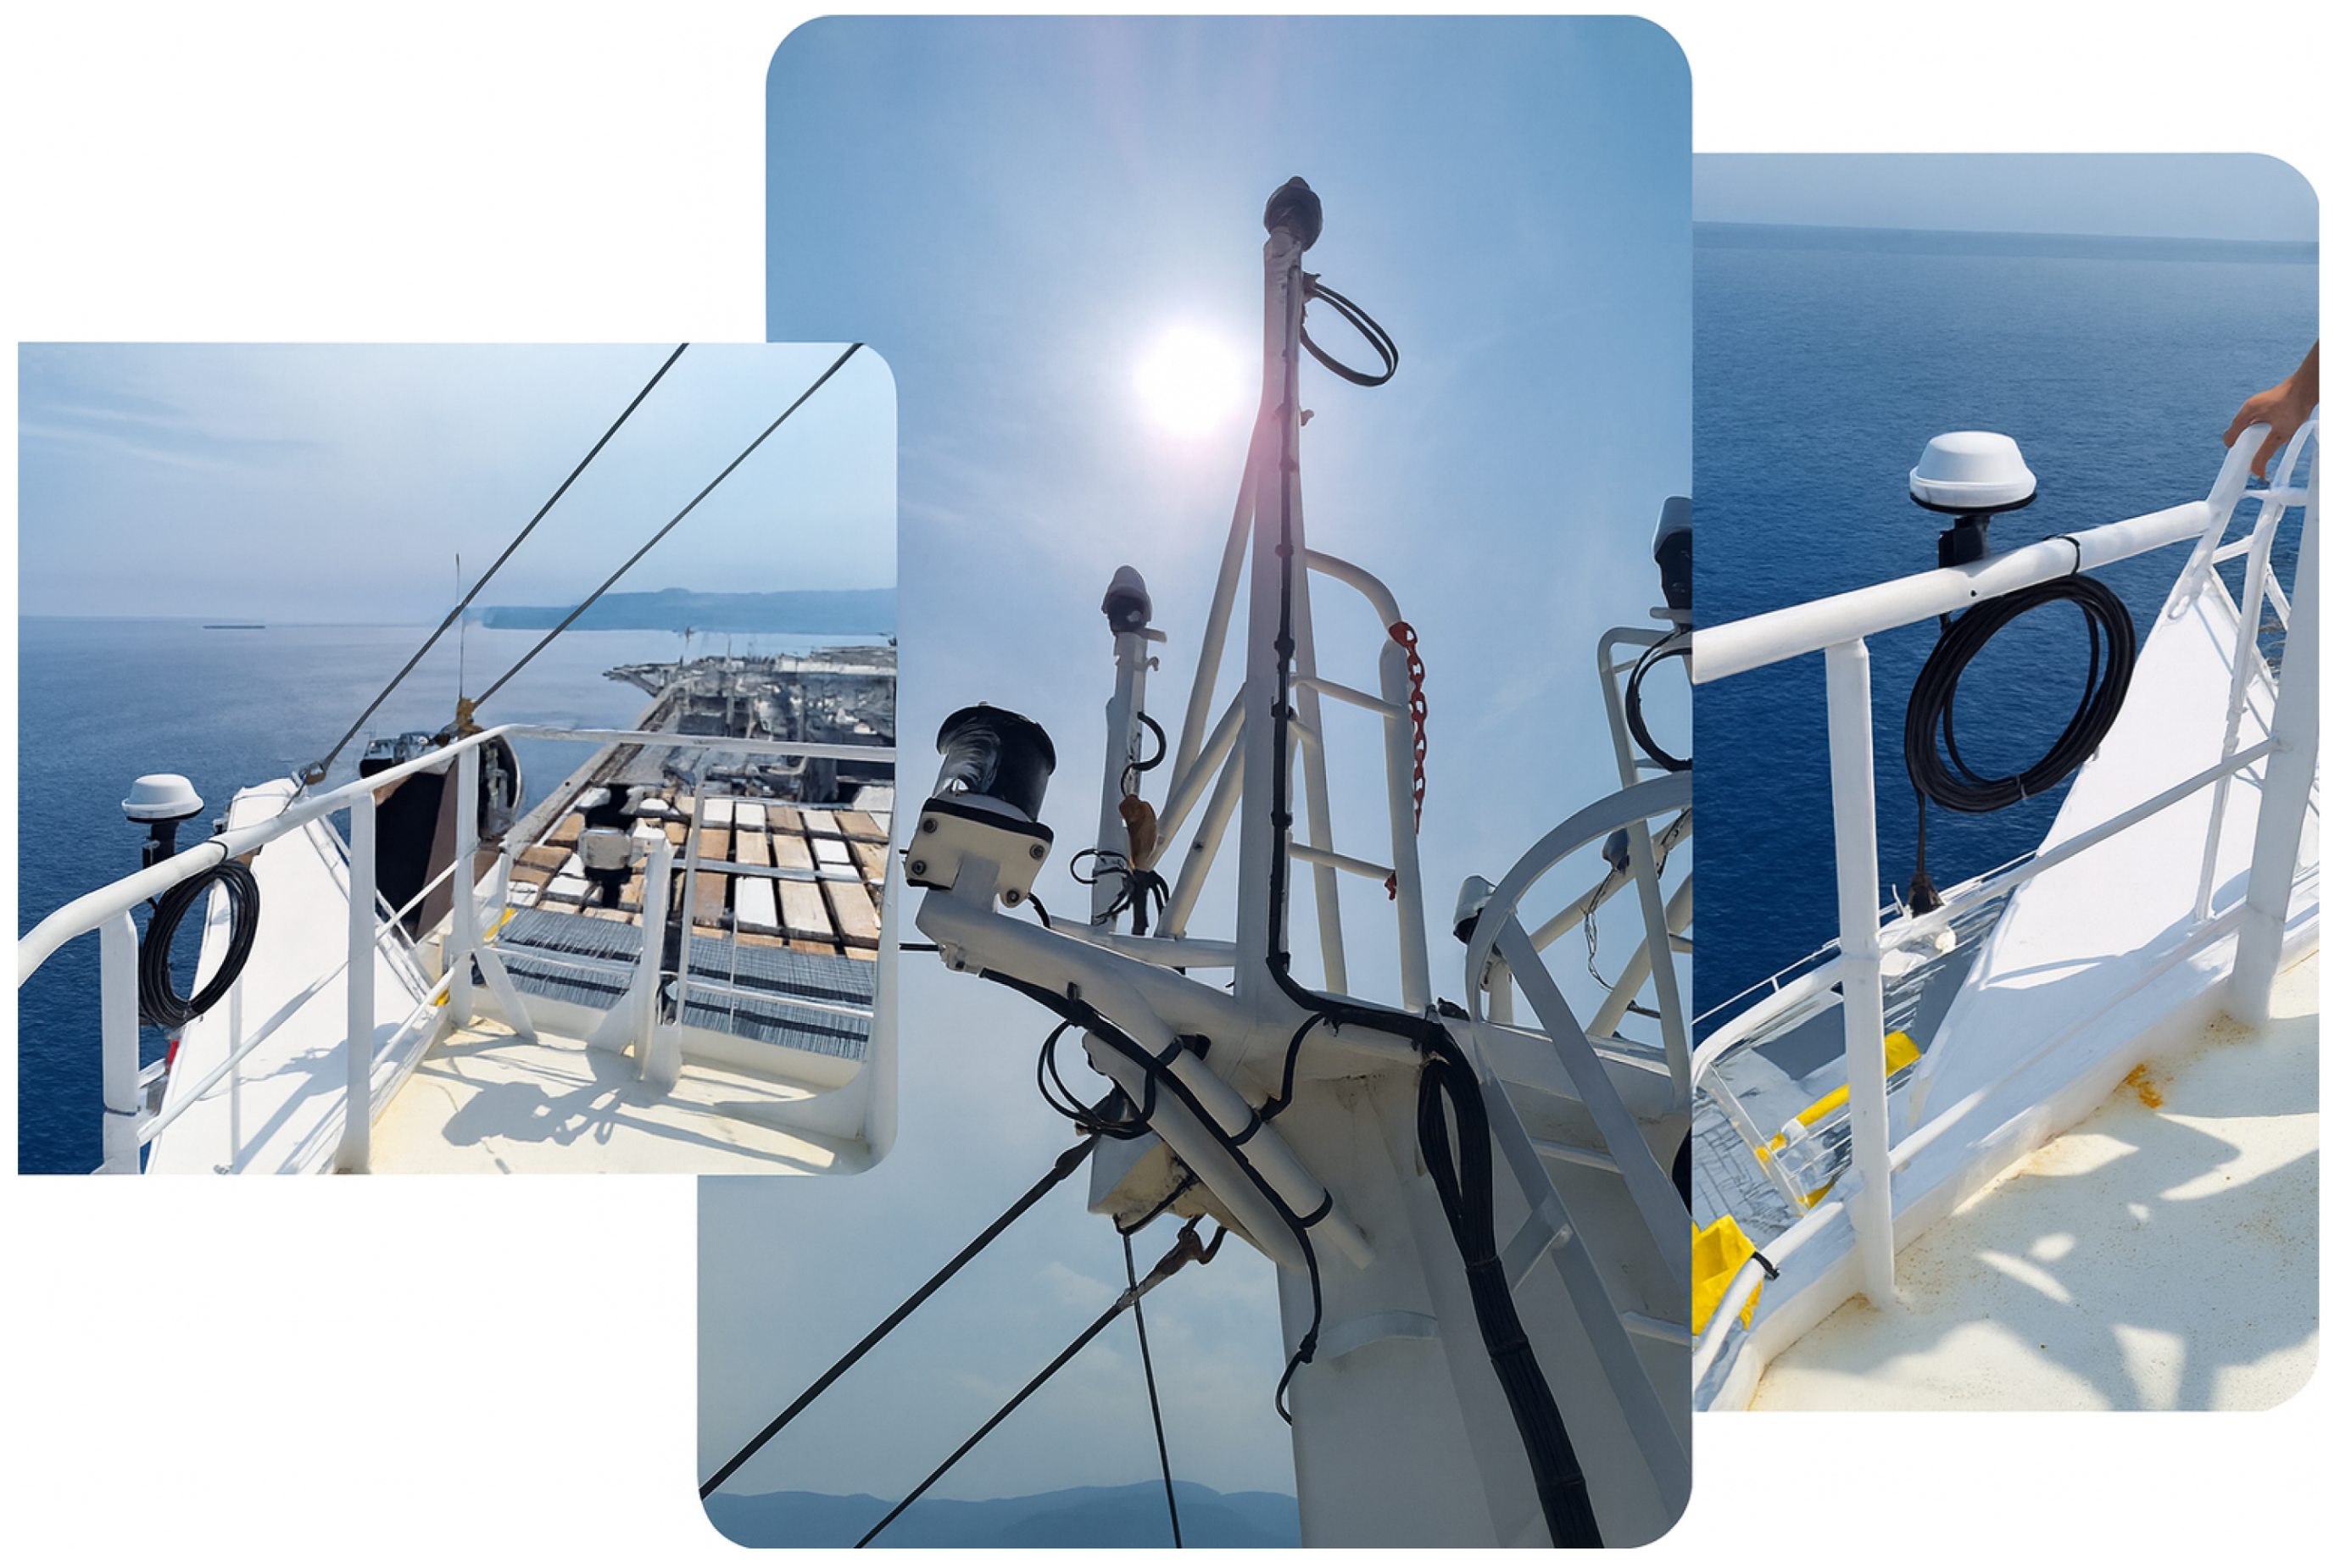
Figure 3.
Data Flow Pipeline
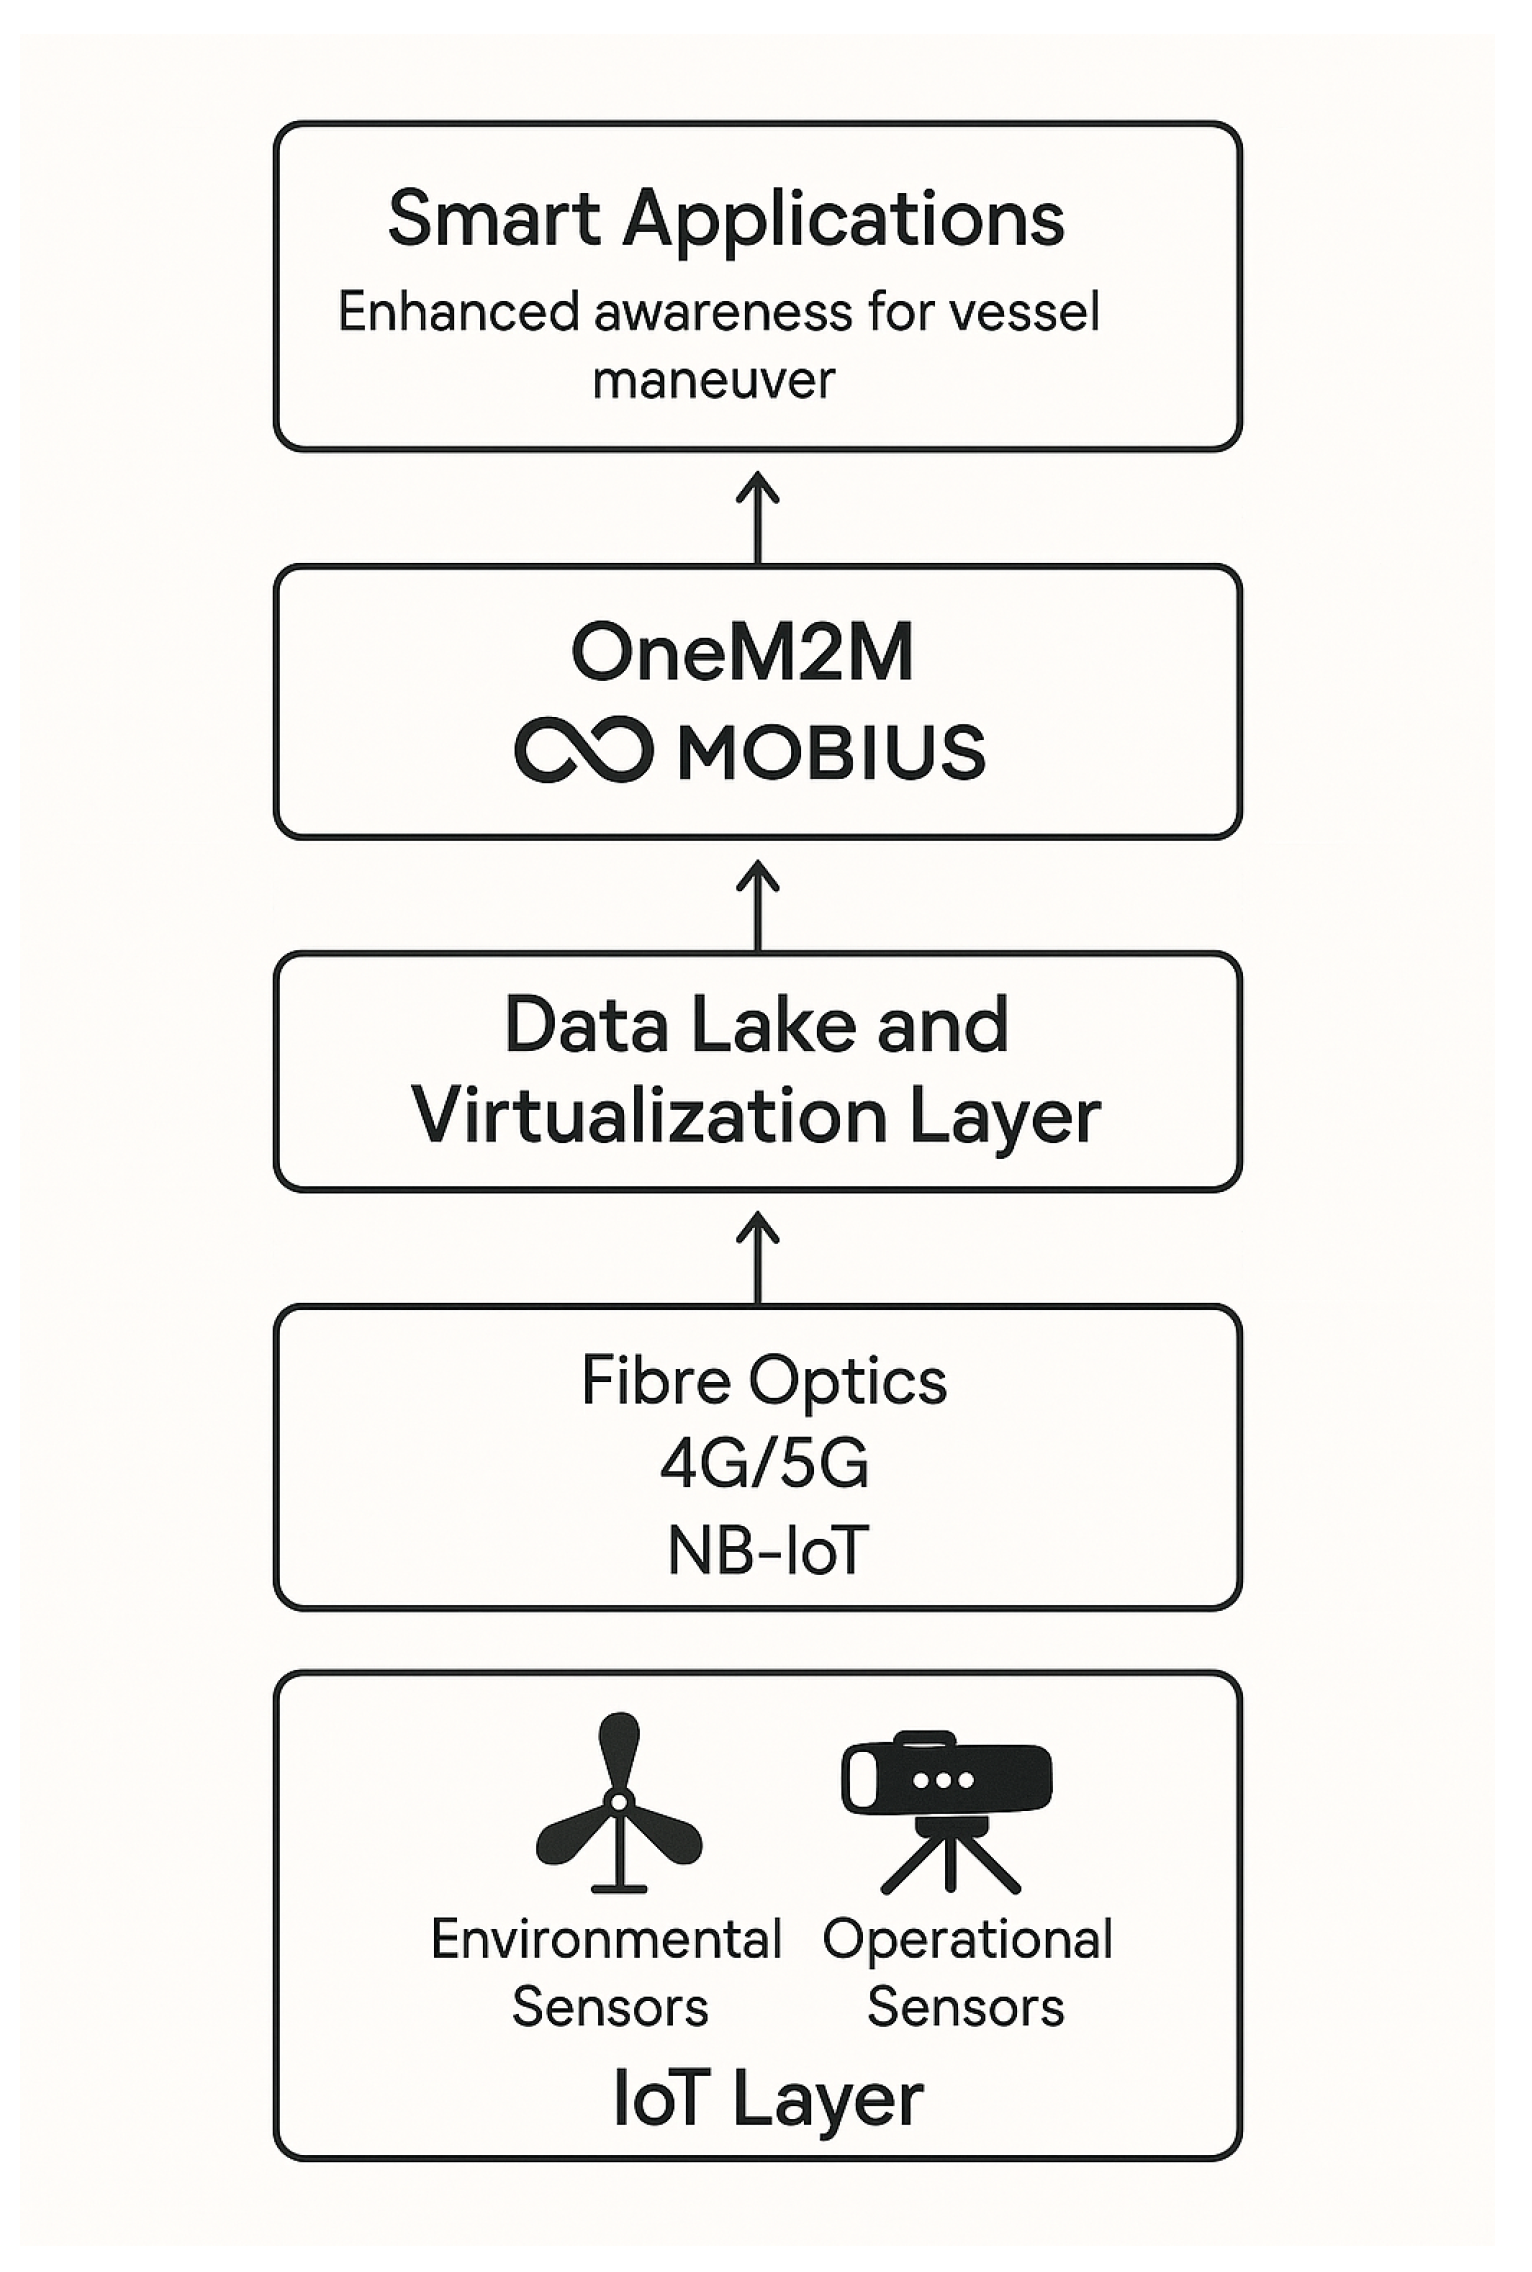
Figure 4.
Meteorological Data
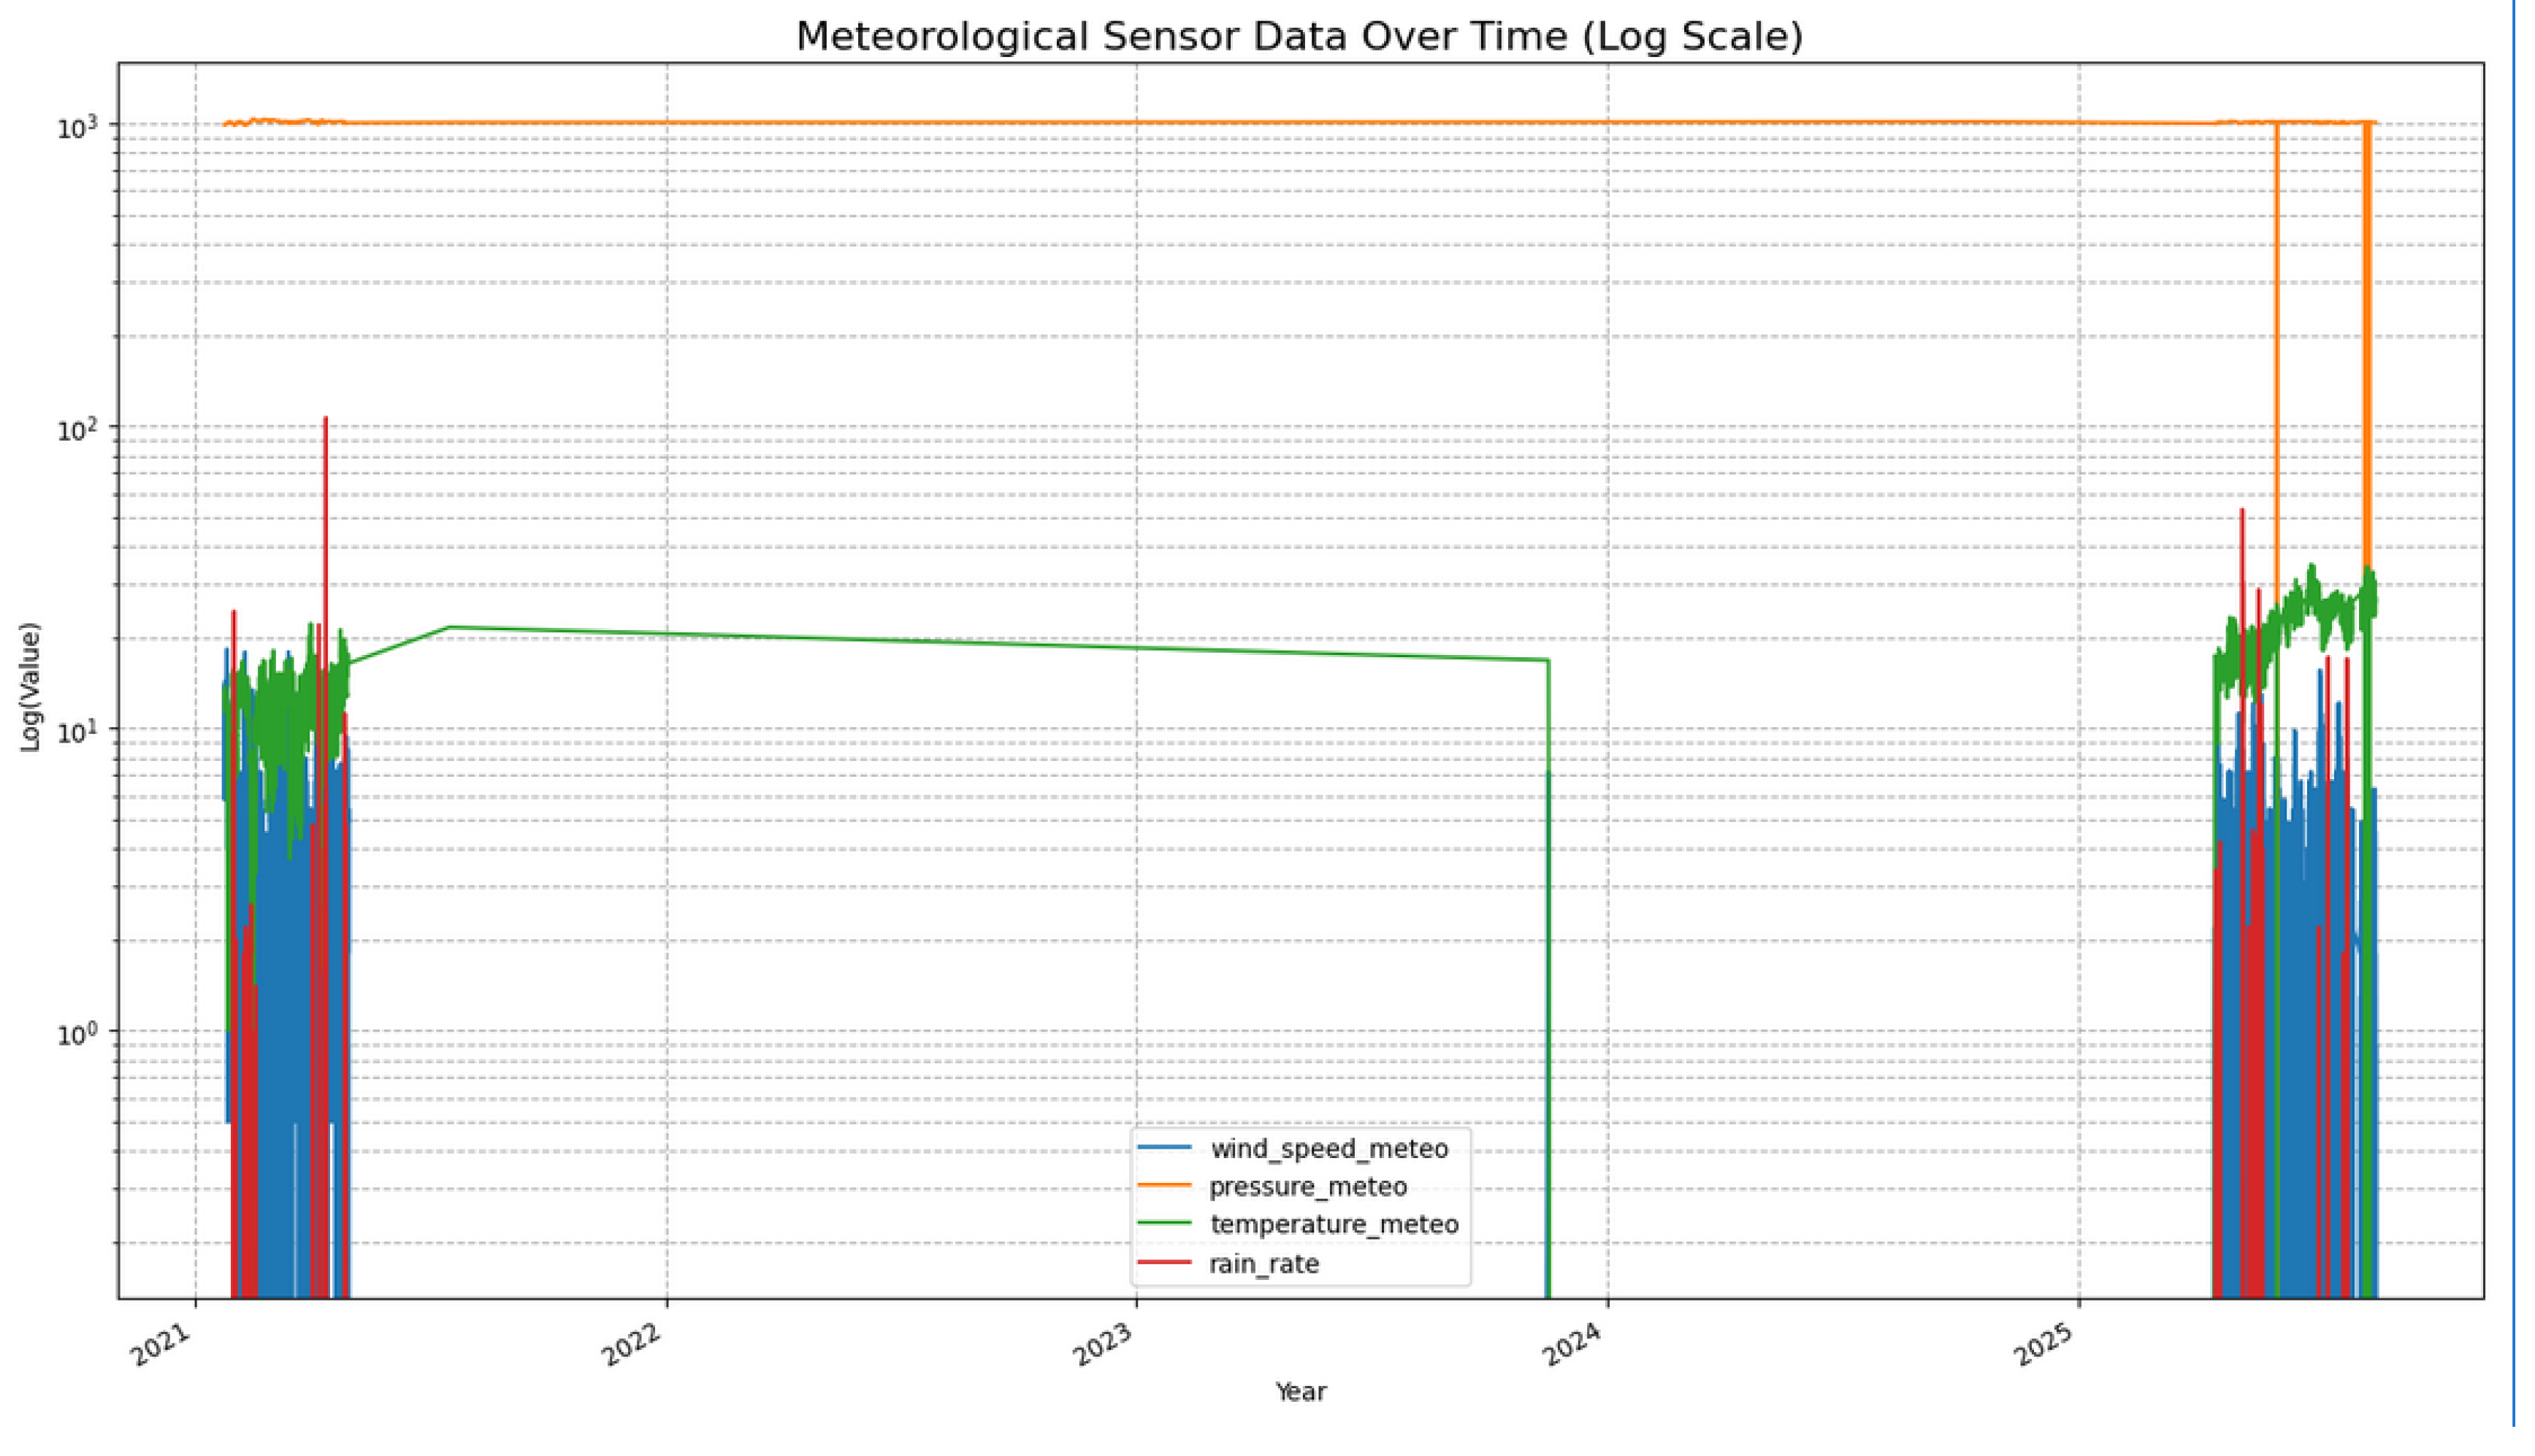
Figure 5.
Anemometer Data
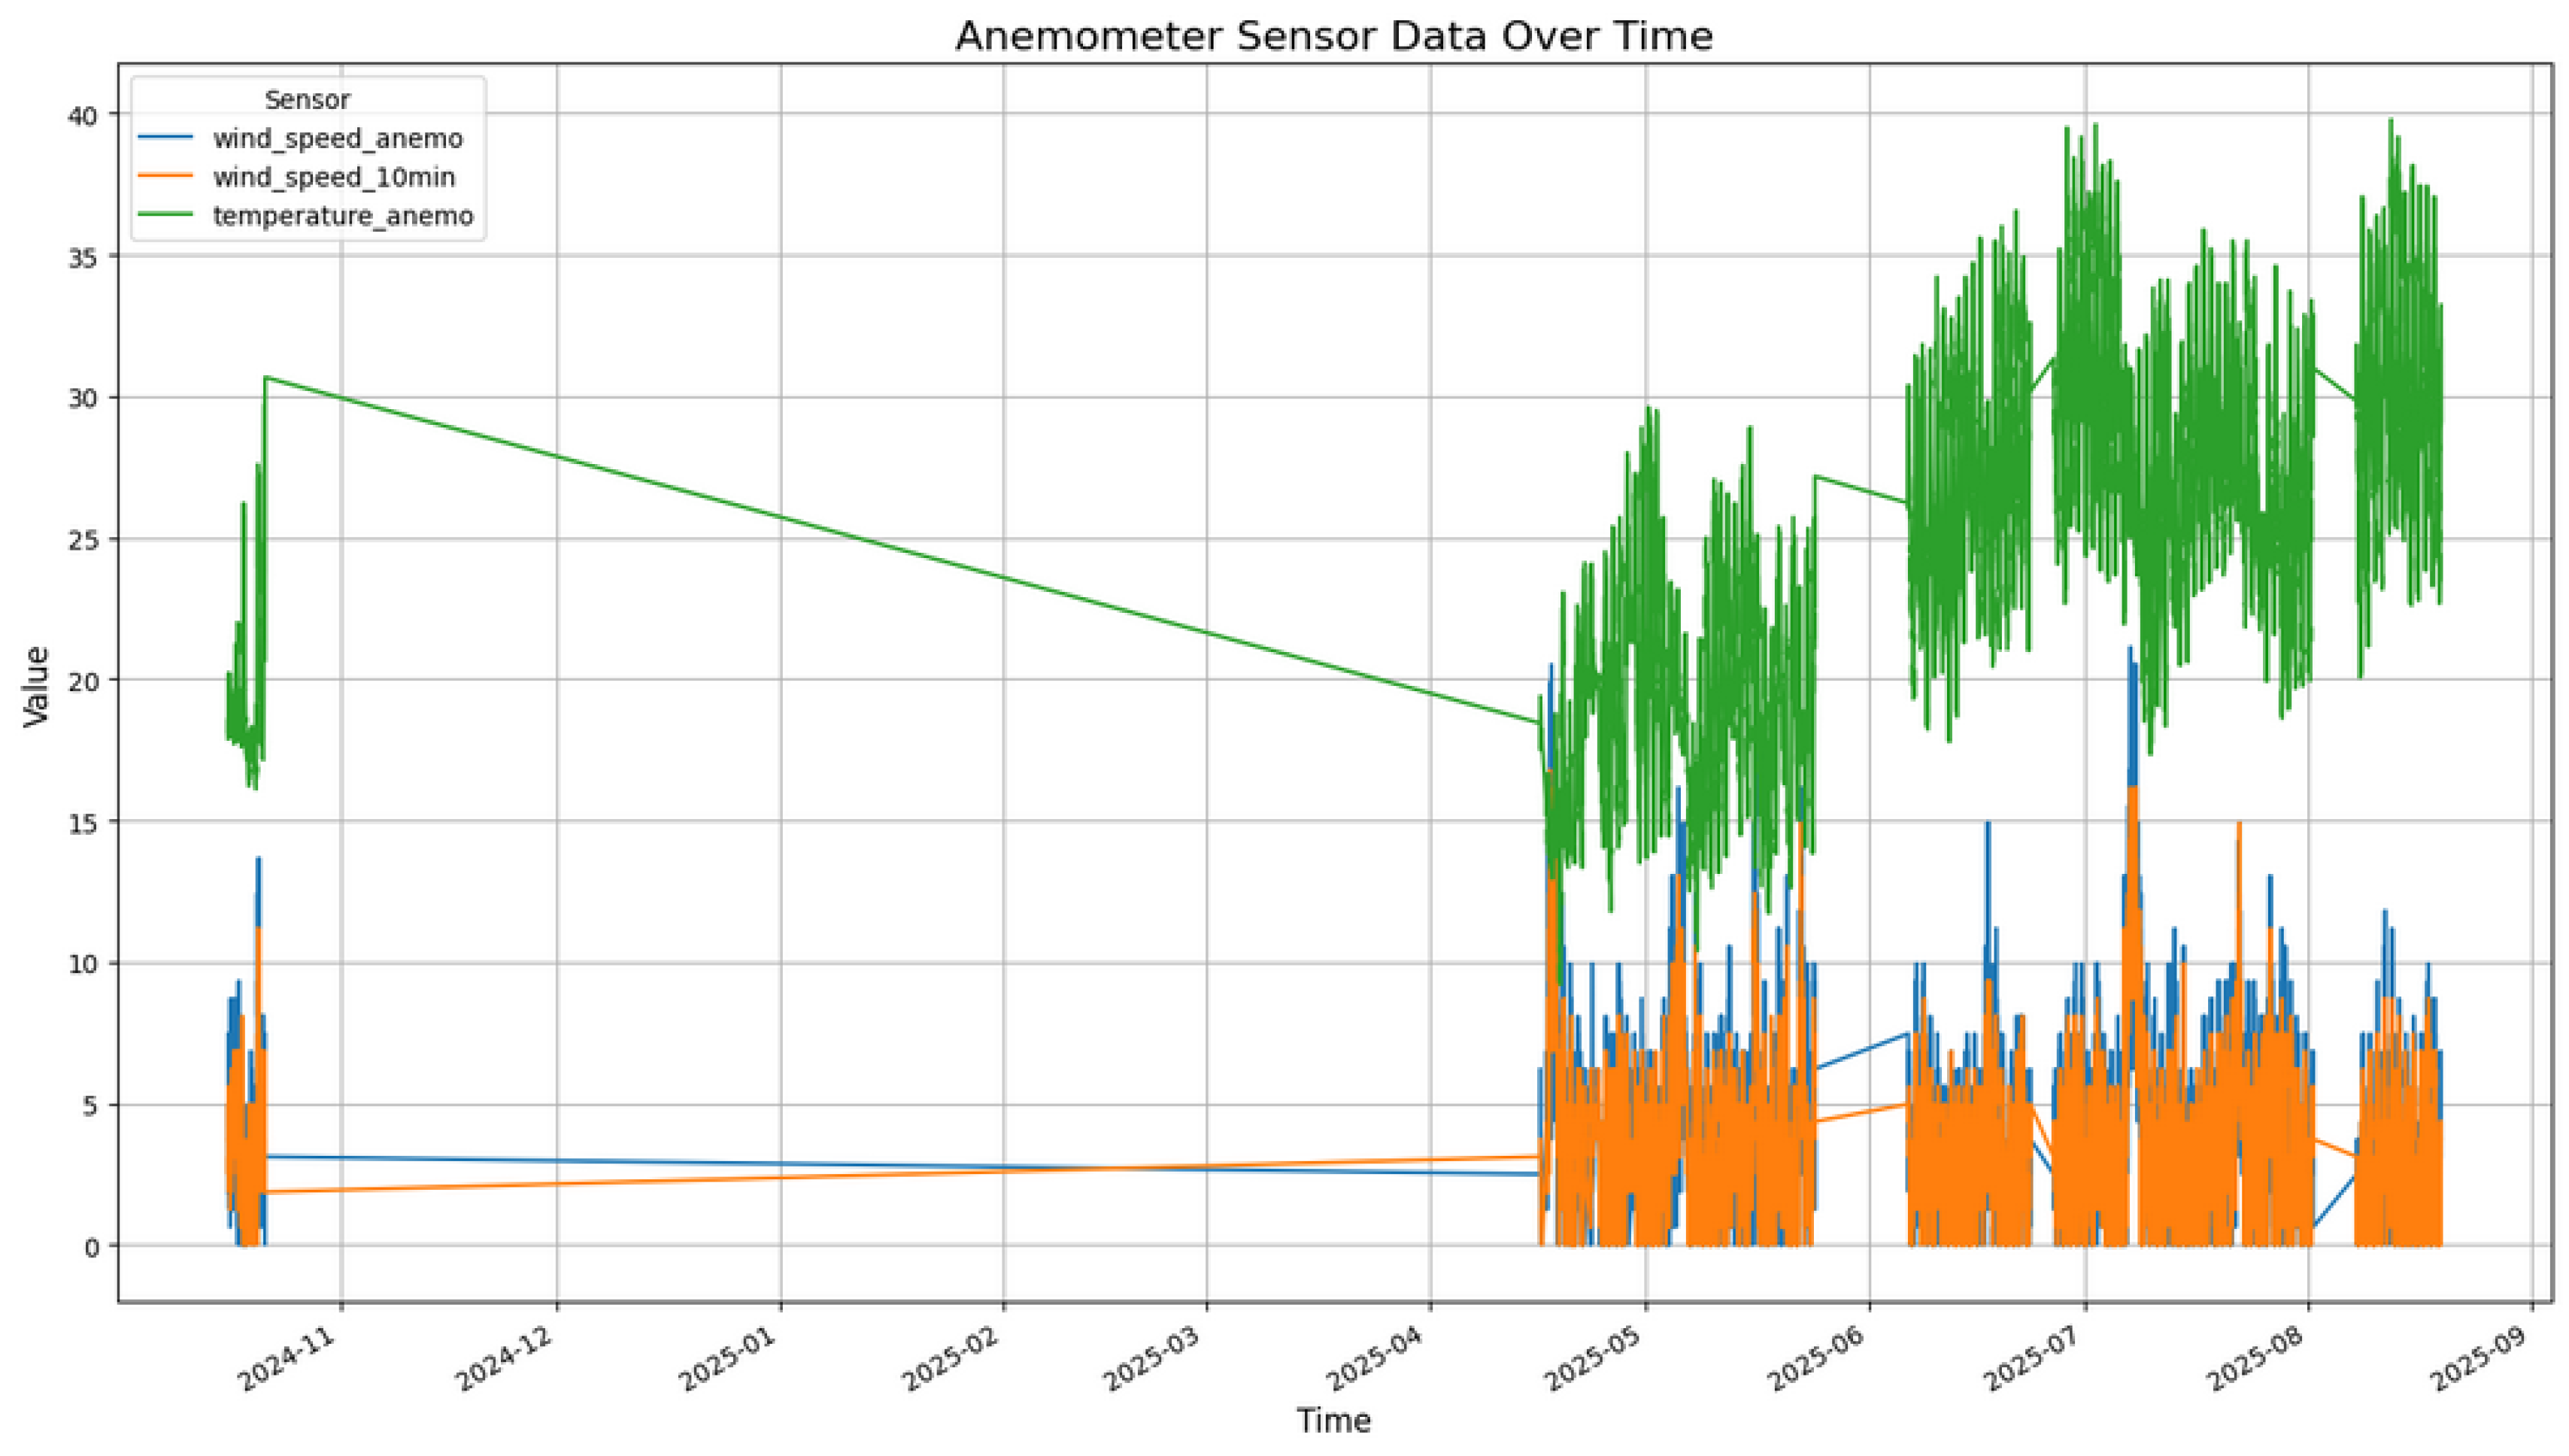
Figure 6.
Bar chart with exact metric values for each model.
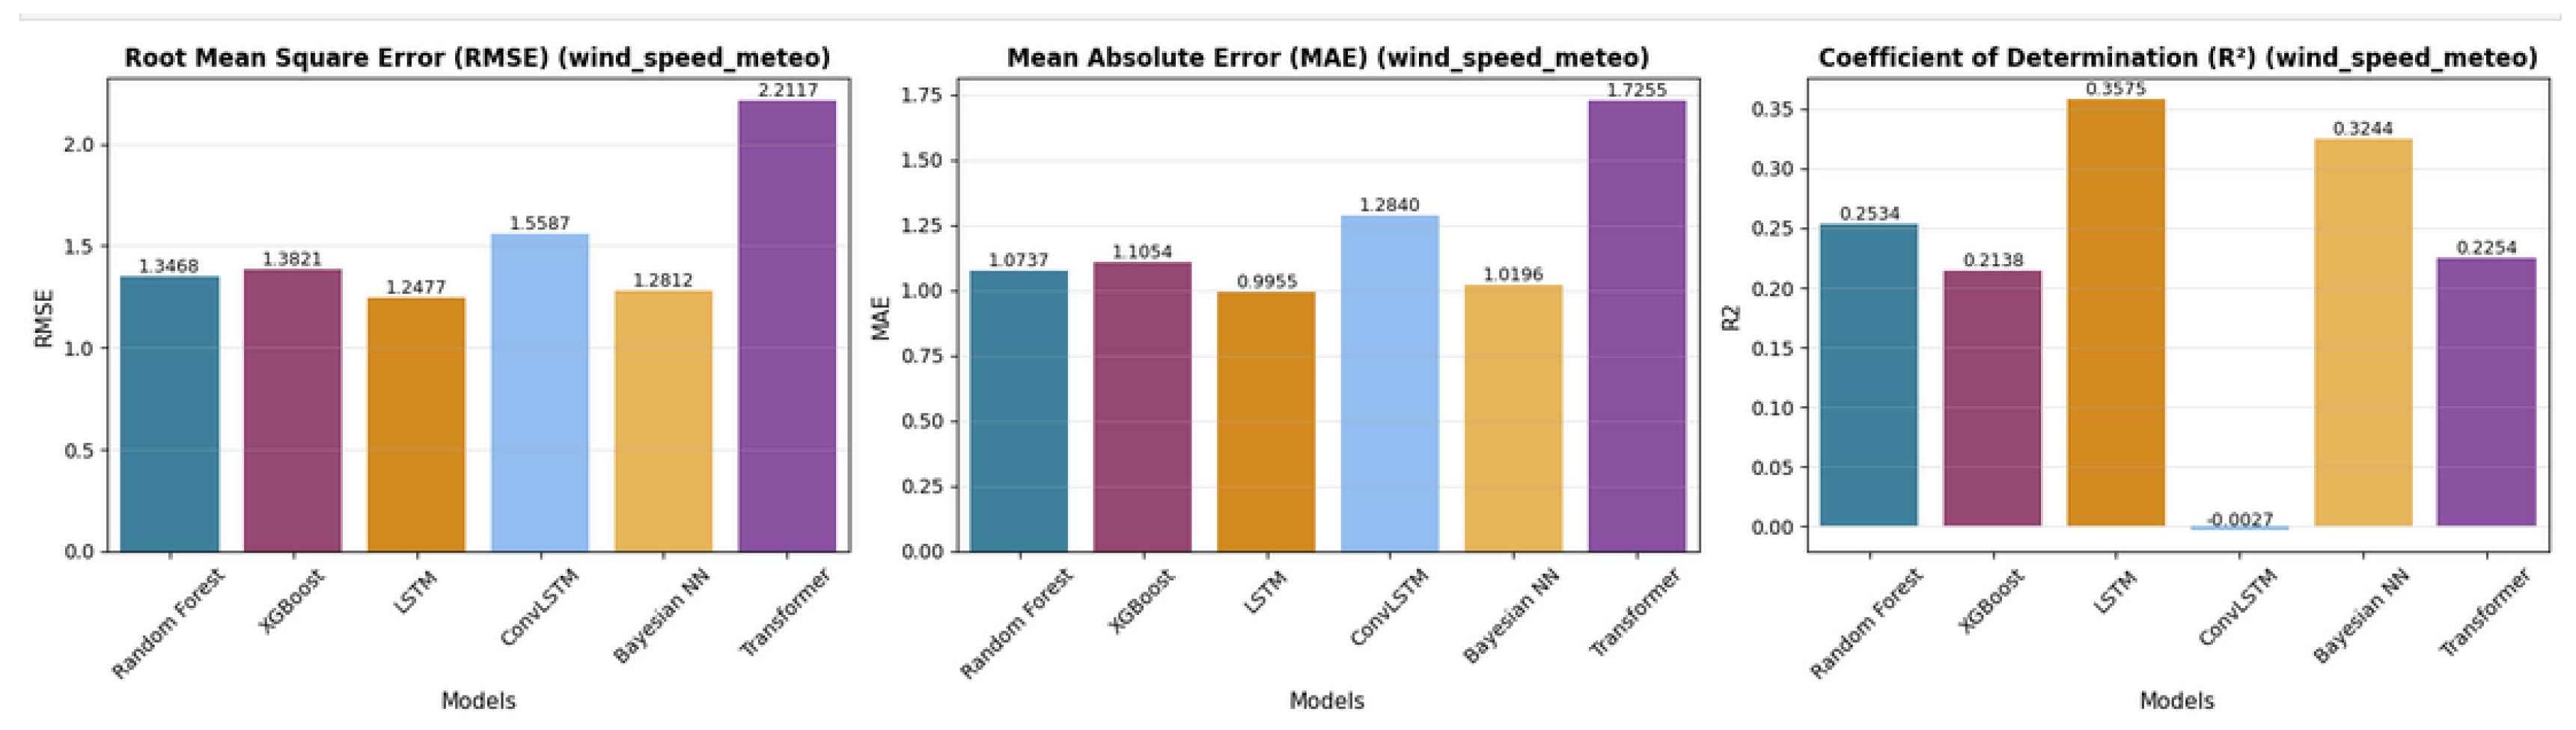
Figure 7.
Radar plot of normalized model performance across RMSE, MAE, and .
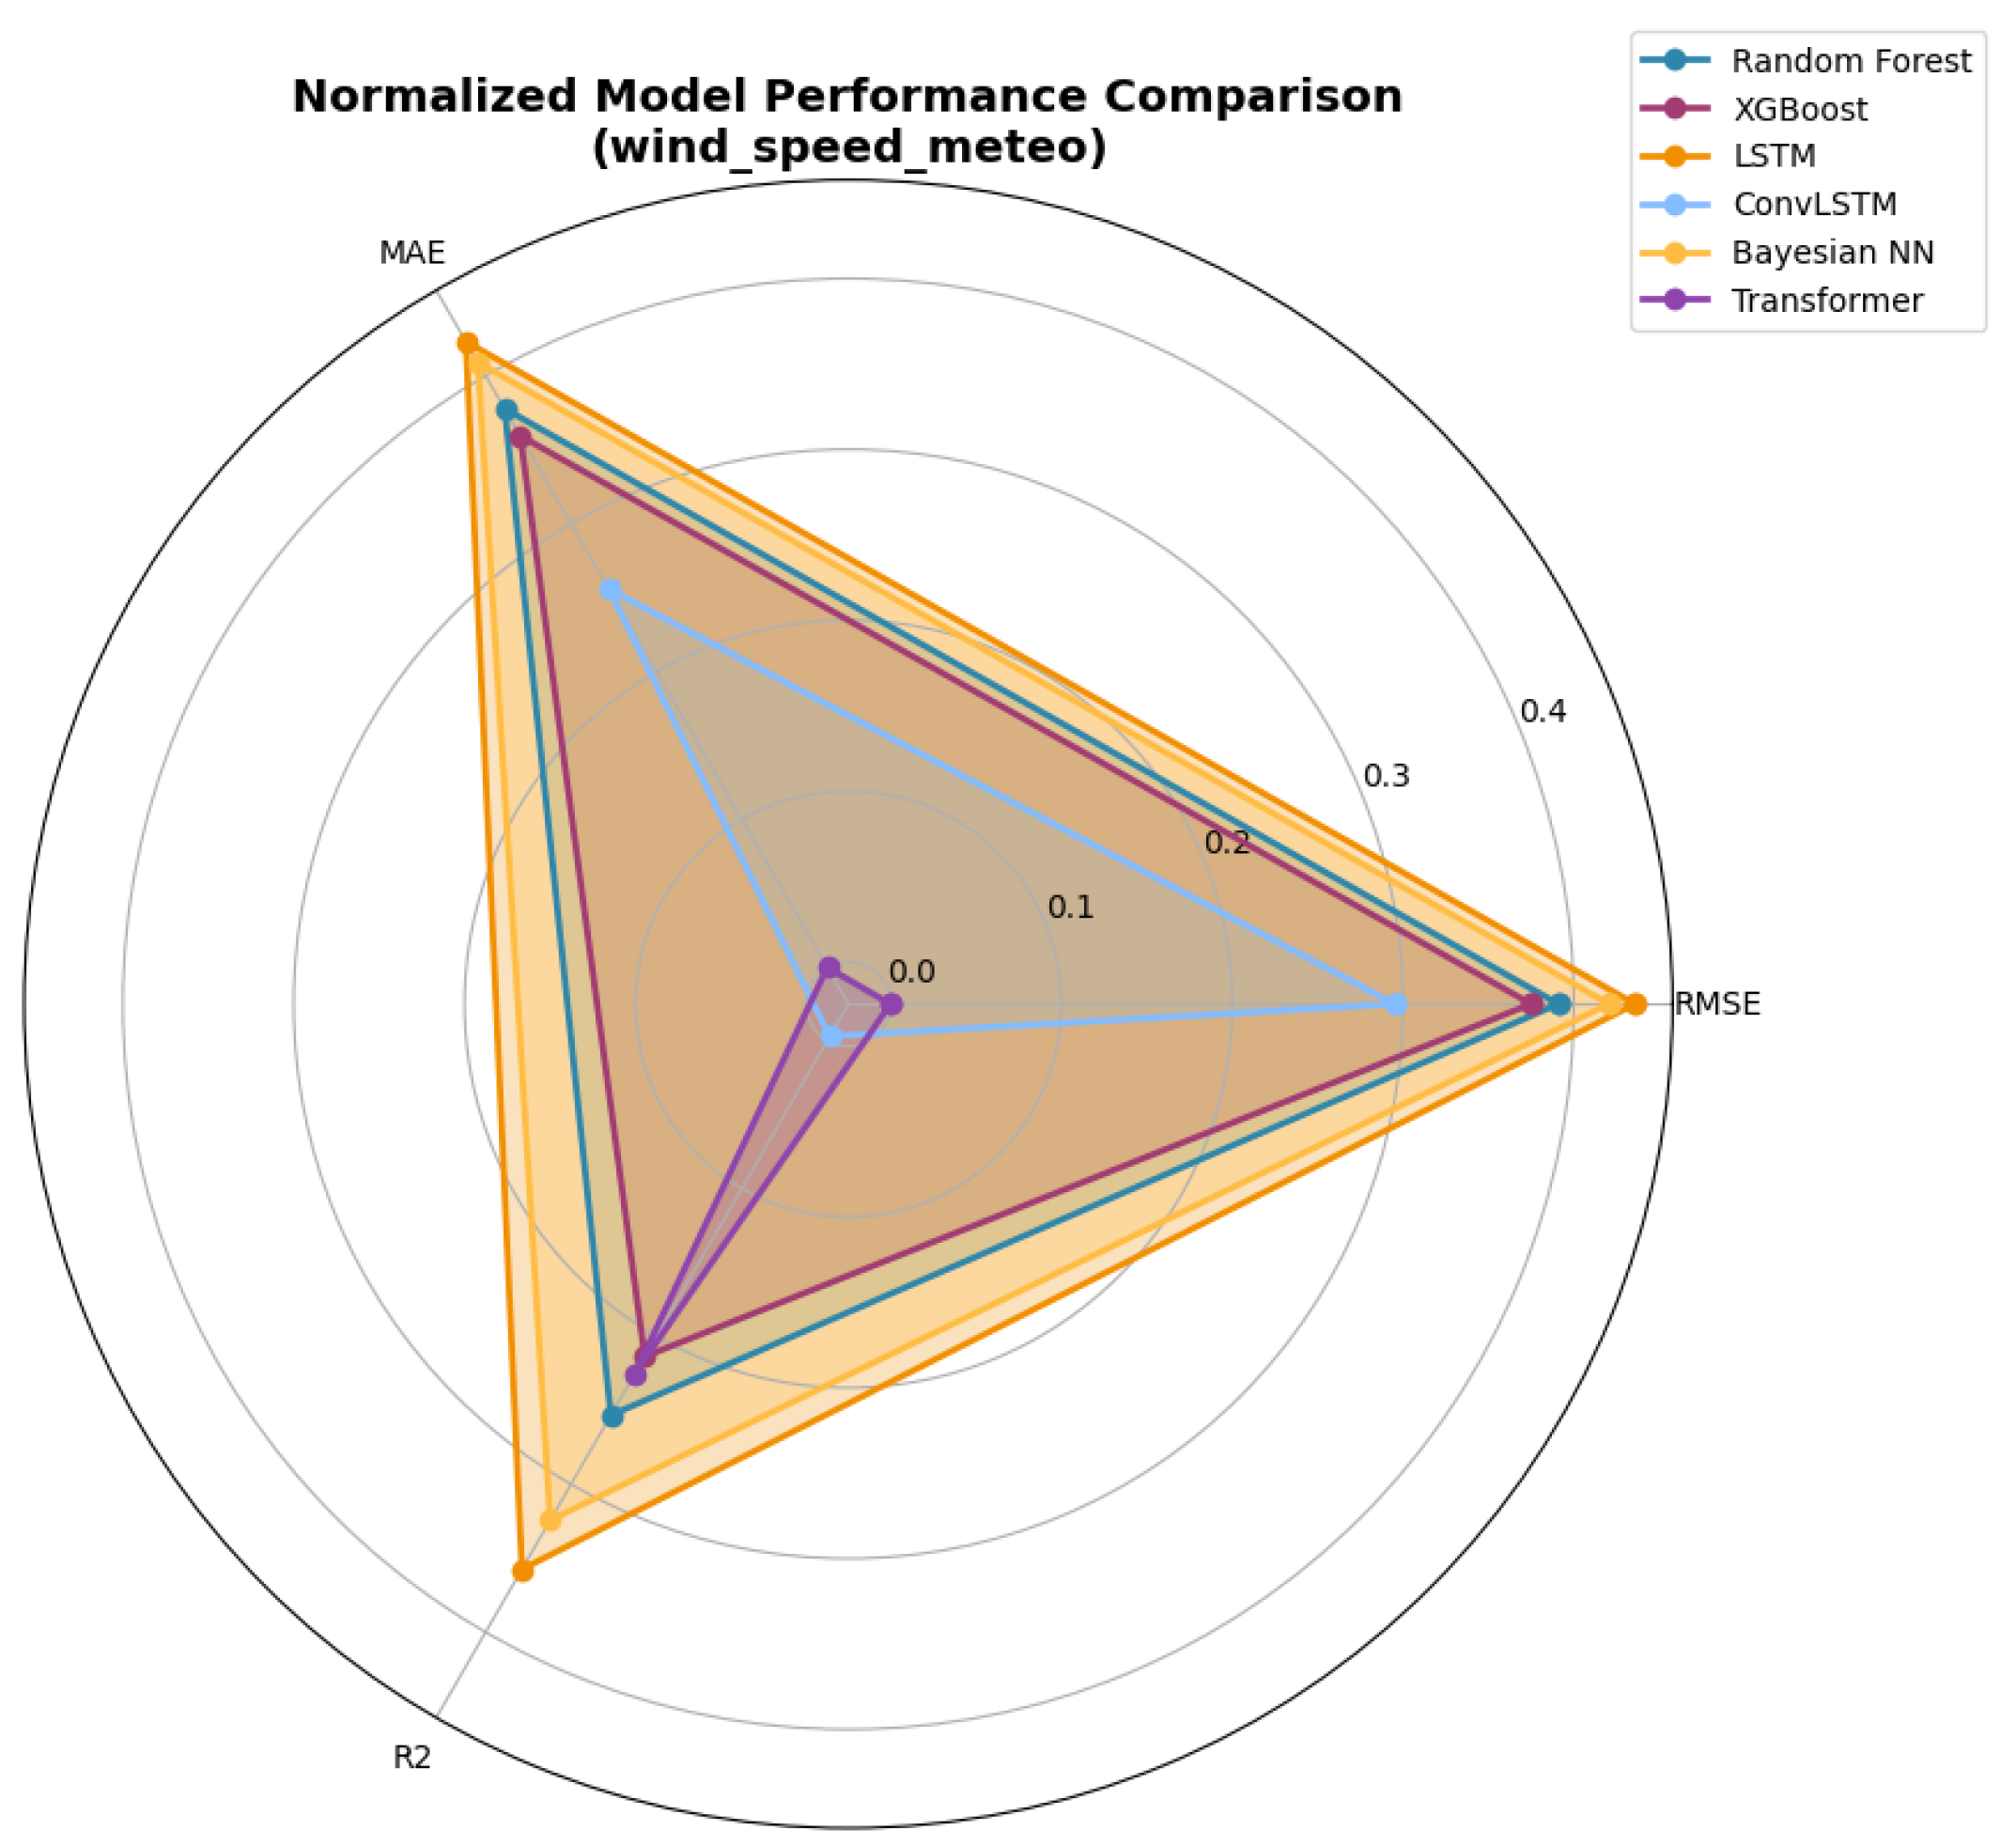
Table 2.
Single-target model performance for wind speed prediction.
| Model | RMSE | MAE | |
| Random Forest | 1.3468 | 1.0737 | 0.2534 |
| XGBoost | 1.3821 | 1.1054 | 0.2138 |
| LSTM | 1.2477 | 0.9955 | 0.3575 |
| ConvLSTM | 1.5587 | 1.2840 | -0.0027 |
| Bayesian NN | 1.2812 | 1.0196 | 0.3244 |
| Transformer | 2.2117 | 1.7255 | 0.2254 |
Table 3.
Cross-validation results (5-fold) for wind speed prediction.
| Model | RMSEmean | RMSEstd | MAEmean | MAEstd | ||
| Random Forest | 0.0039 | 0.0036 | 0.0011 | 0.0017 | 0.99999 | 0.00001 |
| XGBoost | 0.0198 | 0.0112 | 0.0061 | 0.0046 | 0.99981 | 0.00016 |
| LSTM | 0.7634 | 0.4606 | 0.6103 | 0.3705 | 0.7034 | 0.3546 |
| ConvLSTM | 1.3438 | 0.4041 | 1.0749 | 0.3210 | 0.1612 | 0.3705 |
| Bayesian NN | 0.2945 | 0.0908 | 0.2197 | 0.0770 | 0.9630 | 0.0205 |
| Transformer | 8.503486 | 2.590748 | 8.343342 | 2.631084 | -31.889156 | 22.964683 |
Disclaimer/Publisher’s Note: The statements, opinions and data contained in all publications are solely those of the individual author(s) and contributor(s) and not of MDPI and/or the editor(s). MDPI and/or the editor(s) disclaim responsibility for any injury to people or property resulting from any ideas, methods, instructions or products referred to in the content. |
© 2025 by the authors. Licensee MDPI, Basel, Switzerland. This article is an open access article distributed under the terms and conditions of the Creative Commons Attribution (CC BY) license (http://creativecommons.org/licenses/by/4.0/).
Copyright: This open access article is published under a Creative Commons CC BY 4.0 license, which permit the free download, distribution, and reuse, provided that the author and preprint are cited in any reuse.


