
Submitted:
03 October 2025
Posted:
16 October 2025
You are already at the latest version
Abstract
Accurate prediction of electric vehicle (EV) charging behavior in residential settings is essential for optimizing grid load management and supporting the transition to sustainable transportation. This paper introduces a novel transformer-based methodology for inferring EV charging events directly from smart meter time series data. Our approach, which employs a divide-and-conquer strategy, effectively captures intricate charging patterns by processing segmented load data in parallel. This enables high-resolution, short-term forecasting of EV charging occurrences without relying on explicit charging records. The efficacy of our method is validated using real-world smart meter data, demonstrating its potential to provide valuable predictive insights for grid operators and facilitate more efficient energy distribution and management strategies.
Keywords:
transformer models
; smart meter data
; electric vehicle charging
; residential load forecasting
; Time Series Analysis
; divide-and-conquer strategy
; load disaggregation
; short-term forecasting
; grid load management
; data-driven inference
; energy consumption patterns
; predictive modeling
; sustainable transportation
; deep learning for energy systems
1. Introduction
The global transition towards sustainable transportation has significantly accelerated the adoption of electric vehicles (EVs). This increasing penetration of EVs into the residential and commercial sectors has resulted in a considerable rise in electricity demand, particularly from EV charging activities. One of the major concerns associated with this trend is the growing stress it places on the existing power distribution infrastructure, especially when EV charging is uncoordinated. Such unregulated demand can lead to steep increases in peak load on distribution networks, ultimately compromising the efficiency, reliability, and lifespan of key grid components [1,2].
In particular, at-home EV charging—where vehicles are plugged in during evening or overnight hours—can exacerbate the strain on local transformers and distribution lines, as highlighted in several studies [3,4,5]. This pattern of residential charging behavior presents a unique set of operational challenges for utility providers and distribution system operators (DSOs), who must forecast and plan accordingly to avoid overloads and maintain grid stability.
To address these emerging concerns, it is imperative to develop advanced forecasting models that can anticipate EV charging behaviors with a reasonable degree of accuracy. Predictive analytics in this context is not only useful for planning and operational purposes but is also vital for real-time energy management, demand response initiatives, and the integration of renewable energy sources [6,7]. In particular, predicting when and how often charging events are likely to occur can provide DSOs with actionable insights, thereby enabling them to balance loads, reduce stress on network assets, and improve service reliability.
In recent literature, numerous approaches have been proposed to estimate and manage EV charging demands [8]. Many of these strategies rely on diverse input features such as vehicle traffic patterns, ride-hailing service logs, charging rates, and arrival times [9,10,11,12,13]. A wide range of machine learning (ML) and optimization algorithms have been applied to forecast variables like charging duration [14], power consumption [15], and instantaneous charging rates [16]. However, a majority of these studies concentrate on public charging infrastructure, such as fast-charging stations, and assume the availability of granular charging data. While these insights are valuable, they often fall short when it comes to residential charging, which constitutes a significant portion of daily EV energy consumption and remains largely invisible to utility companies.
A key challenge in modeling residential EV charging behavior is the absence of direct measurements. Unlike public stations, home chargers are usually behind-the-meter, and their energy consumption is aggregated with other household appliances. This lack of visibility complicates the application of traditional prediction techniques, which rely on explicitly labeled charging data. Therefore, there is a pressing need for solutions that can leverage more commonly available sources—such as smart meter data—to infer and forecast EV charging events.
Non-intrusive load monitoring (NILM) methods have shown considerable promise in related domains, such as appliance usage detection and load disaggregation [17,18,19,20,21]. These techniques aim to extract individual appliance signatures from aggregated energy usage data, offering an avenue for EV event detection without the need for direct metering. However, most NILM research has focused on retrospective or real-time detection, offering little insight into future behaviors. There remains a significant research gap in terms of forward-looking prediction—particularly predicting imminent residential EV charging events.
To bridge this gap, our study introduces a new methodology, termed the Divide-and-Conquer Transformer for EV Charging Prediction (DCT-EV), designed to predict upcoming EV charging events at home using only historical smart meter readings. By transforming the forecasting challenge into a sequence modeling task, and using a transformer-based deep learning architecture, our approach achieves highly accurate predictions several minutes ahead of the actual charging event.
The main contributions of our study are threefold:
- A novel and practical prediction task: Unlike most existing research that focuses on public charging infrastructure using historical charging logs, our study targets the more difficult problem of predicting residential EV charging behavior from aggregated smart meter data. This task aligns more closely with the real-world challenges faced by grid operators and utilities.
- A robust, non-intrusive prediction model: Our proposed DCT-EV framework is built upon a transformer architecture, well-suited for handling long-range dependencies in time-series data. By partitioning long smart meter sequences into manageable sub-sequences and processing them in parallel, the model effectively captures subtle patterns associated with home EV charging, without the need for intrusive sensors or labeled datasets.
- Comprehensive evaluation and insight generation: We rigorously evaluate DCT-EV on a real-world dataset and compare its performance against four well-known machine learning and deep learning baselines. Our experimental analysis explores key aspects of the prediction task, including: (1) how the length of historical input affects prediction accuracy, (2) the trade-offs between forecast horizon and model performance, and (3) the optimal threshold selection for binary event classification.
2. Related Work
Recent research in smart grid optimization, machine learning, and software intelligence offers several contributions relevant to energy prediction and residential behavior modeling. Saimbhi [22]introduced a novel method for vulnerability detection using code property graphs and convolutional neural networks, which emphasizes advanced static representations and automated feature extraction in complex codebases. His work parallels the application of deep neural networks to structured data as seen in our transformer-based model. Furthermore, Saimbhi [23] proposed a DCT-based machine learning framework to distinguish authentic UHD images from synthetically upscaled ones, showcasing the effectiveness of signal processing and statistical learning techniques—principles that are applicable in processing smart meter time series for accurate pattern recognition.
Desai [24] contributed to the domain of system optimization through his work on Progressive Web Applications (PWAs) for scalable inventory management. Desai[25] emphasizes responsiveness and platform efficiency, which mirrors the goals of our architecture in achieving real-time, efficient prediction using transformer models. Desai [26] also explored active learning strategies for text classification, reducing data annotation needs—an idea relatable to label-scarce energy datasets. Additionally, Katta [27] applied deep learning in medical diagnostics and federated learning for distributed AI, both of which reflect the growing need for non-intrusive, distributed, and privacy-preserving solutions. Katta’s [28]research on high-frequency financial forecasting using WebSocket data aligns closely with our objective of capturing short-term fluctuations in electricity load data. Collectively, these works of Saimbhi, Katta and Desai highlight the convergence of AI, system efficiency, and decentralized learning as a foundation for solving high-resolution prediction challenges in modern smart grids.
3. Methodology
Accurate forecasting of at-home electric vehicle (EV) charging behavior is increasingly critical for maintaining grid stability and optimizing energy distribution. This section details the architecture and operational flow of our proposed model, termed DivideConquer Transformer for EV Charging Prediction (DCT-EV). The model is tailored to anticipate EV charging activity by analyzing smart meter load data, specifically household-level electricity consumption records. Our framework comprises three integral components: the load segmentation and encoding unit, the temporal representation module utilizing attention mechanisms, and the predictive output layer that estimates forthcoming charging events. A visual overview of this system is provided in Figure 1.
3.1. Load Segmentation and Embedding
To effectively handle long and potentially noisy time-series data from residential smart meters, the first module of our architecture segments the input sequence into overlapping shorter chunks. This approach allows for parallel processing and reduces the computational burden associated with long sequence analysis.
Given a time-series input , representing the household’s energy usage over T time steps, the sequence is divided into N overlapping segments. Each segment has a length L, and the segmentation stride is defined as . The resulting segments are denoted by , where each is a subsequence of the original time-series.
Each sub-sequence is then transformed into a latent representation through a one-dimensional convolutional layer, defined as:
where is a learned convolution kernel, and D is the dimensionality of the feature space.
By treating each sub-sequence as a token, we significantly reduce the number of input tokens from T to N. This reduction in token count leads to improved scalability and efficiency in subsequent attention-based operations, as the complexity of self-attention grows quadratically with the number of tokens ( vs ).
3.2. Temporal Representation Learning
To capture long-range temporal dependencies in household electricity consumption patterns, we employ a Transformer-based encoder. The encoder relies on a self-attention mechanism, which has proven effective in modeling sequential dependencies in numerous domains.
Prior to feeding the embedded tokens into the Transformer layers, we enhance them with positional encodings to retain temporal information:
where denotes the positional encoding vectors, implemented using fixed sinusoidal functions as in the original Transformer architecture [29].
Within each attention head h, the model computes the queries, keys, and values as follows:
followed by computing attention weights and output representations:
where is the dimension of the key vectors. The outputs of all attention heads are then concatenated and passed through a feed-forward layer:
with denoting the multi-head attention output and representing trainable parameters of the feed-forward network.
3.3. Charging Prediction Layer
The output representation is flattened into a one-dimensional vector to be input to the final prediction layer. For each prediction time horizon m (e.g., 10 or 60 minutes ahead), the model estimates the probability of an EV charging event via a sigmoid-activated linear transformation:
where is a trainable weight matrix for time horizon m, and is the sigmoid function.
3.4. Training Objective
The model is trained using a binary cross-entropy loss function, which penalizes incorrect predictions of charging event occurrences:
where is the ground truth binary label indicating whether a charging event occurs for instance i at time m, and is the model’s predicted probability.
This structured approach allows our model to effectively handle the nuances of home charging detection using solely smart meter readings, thereby providing a non-intrusive, scalable solution for future grid-aware energy forecasting systems.
Figure 2.
EV charging event prediction for home #4526.
4. Numerical Results and Analysis
This section provides a comprehensive overview of the experimental configuration, the evaluation metrics adopted, and a detailed analysis of the obtained results. We conducted simulation experiments using our proposed model, DCT-EV, to forecast upcoming electric vehicle (EV) charging events at a minute-level granularity. The goal is to assess how effectively DCT-EV can learn from historical electricity consumption data to anticipate imminent charging activities.
4.1. Experimental Setup and Evaluation Protocol
We utilized the 2018 minute-resolution residential electricity usage dataset from the Pecan Street project, which includes corresponding EV charging load data. Each data point consists of a timestamped energy reading, with charging labels derived using a predefined threshold. Specifically, any instance where the EV load exceeds 3 kW is labeled as a “charging” event, while others are labeled as “not charging.” These labels serve as ground truth for training our supervised model.
We filtered the dataset to include only households equipped with EVs and exhibiting at least one charging event. This filtering process resulted in a final dataset comprising 22 households with a total of 8,063,175 meter readings, out of which 402,296 are charging events. Importantly, although the EV charging data is available for evaluation, our model relies solely on aggregate electricity usage data during training. The dataset is divided into 80% for training and 20% for testing.
Due to the infrequent nature of charging events compared to non-charging periods, the dataset is highly imbalanced. As a result, we adopt multiple performance metrics suited for imbalanced binary classification tasks. These include accuracy (ACC), precision, recall, F1 score, mean squared error (MSE), area under the receiver operating characteristic curve (AUC), and average precision (AP). These diverse metrics enable a holistic understanding of model performance across various dimensions.
The DCT-EV model outputs a probability score reflecting the likelihood of a charging event. By default, we use a 0.5 threshold to classify each output as either "charging" or "not charging." Variations in this threshold are also explored to understand their impact on performance.
4.2. Results and Analysis
4.2.1. Overall Model Performance
the performance of DCT-EV with several baseline models, including Random Forest, XGBoost, Deep Neural Networks (DNN), and Long Short-Term Memory (LSTM) networks, across short-term (1-10 min) and mid-term (1-60 min) prediction horizons. DCT-EV consistently outperforms all baselines across all metrics, including F1@.5, AUC, AP, and MSE.
For the 1–10 minute prediction span, DCT-EV achieves the highest F1 score (87.35%), AUC (97.90%), AP (88.55%), and the lowest MSE (0.0102). While LSTM and DNN models also exhibit strong performance, DCT-EV sets a new benchmark, highlighting the effectiveness of its design in capturing temporal patterns from load profiles.
For the longer 1–60 minute span, performance drops across all models due to the increased uncertainty in long-term forecasting. However, DCT-EV remains the top performer, maintaining a relatively high F1 score of 63.78% and the best scores in AUC, AP, and MSE.
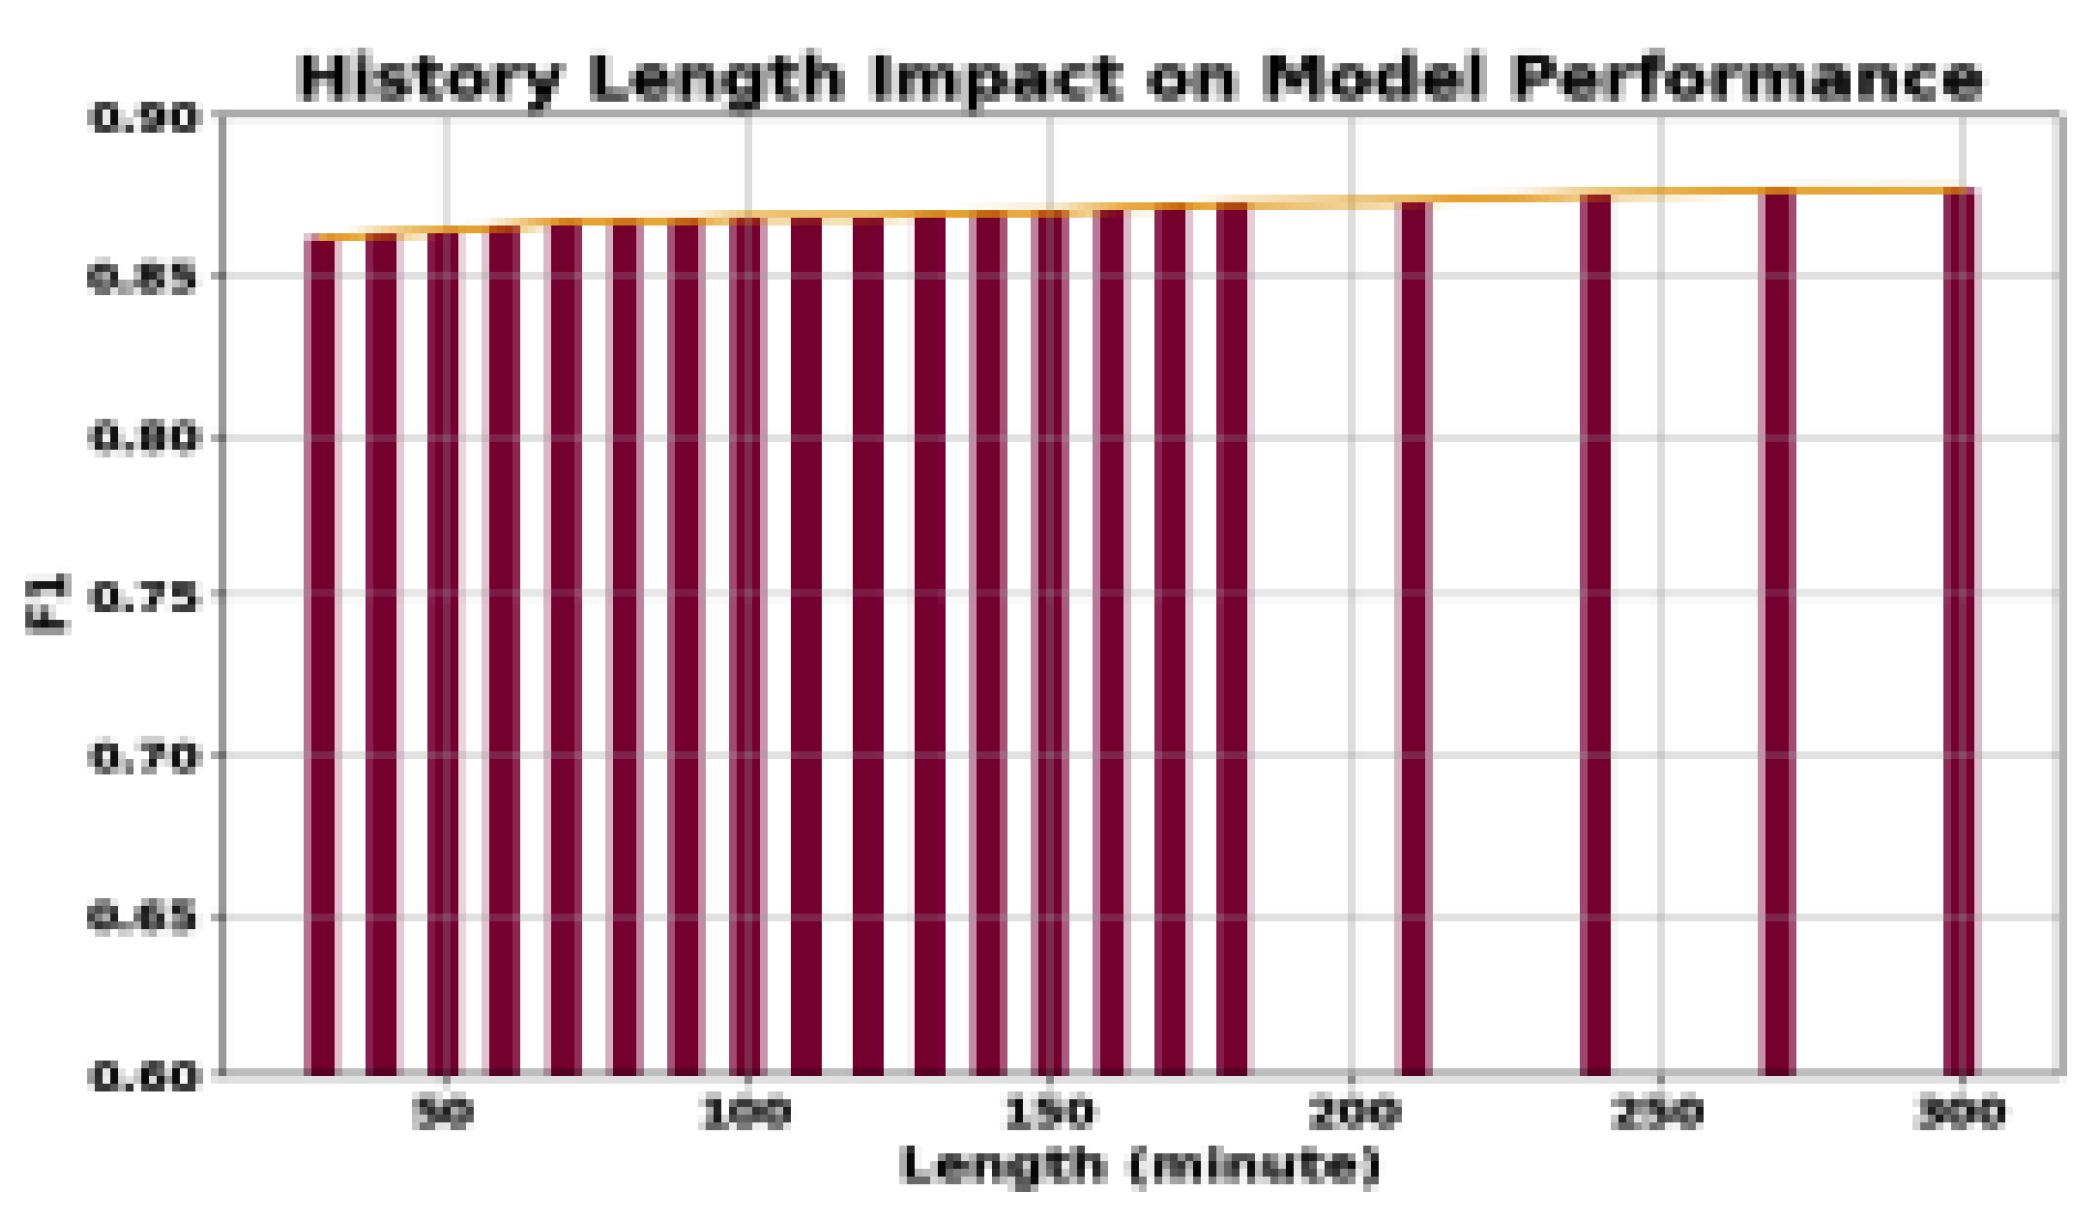
4.2.2. Impact of Historical Input Length
The choice of input history length—i.e., how much past data the model considers—significantly affects the model’s performance. Figure 3 illustrates the relationship between input length and prediction accuracy. The F1 score improves as input length increases, indicating the utility of incorporating long-term historical trends. However, this gain saturates beyond 180 minutes. Thus, we select 180 minutes as the optimal trade-off point, balancing accuracy with computational cost and model complexity.
4.2.3. Effect of Prediction Horizon
DCT-EV’s performance by specific future prediction minutes (from 1 to 10 minutes). As expected, predictive accuracy degrades with increasing time horizon. The F1 score, AUC, and AP are highest for 1-minute-ahead predictions and decrease gradually as the model forecasts further into the future. This trend underscores the inherent challenge in predicting distant events and affirms the robustness of DCT-EV in handling short-term forecasting tasks effectively.
Notably, even at 10 minutes, DCT-EV retains respectable performance (F1: 81.59%, AUC: 94.78%, AP: 78.75%), showcasing its adaptability.
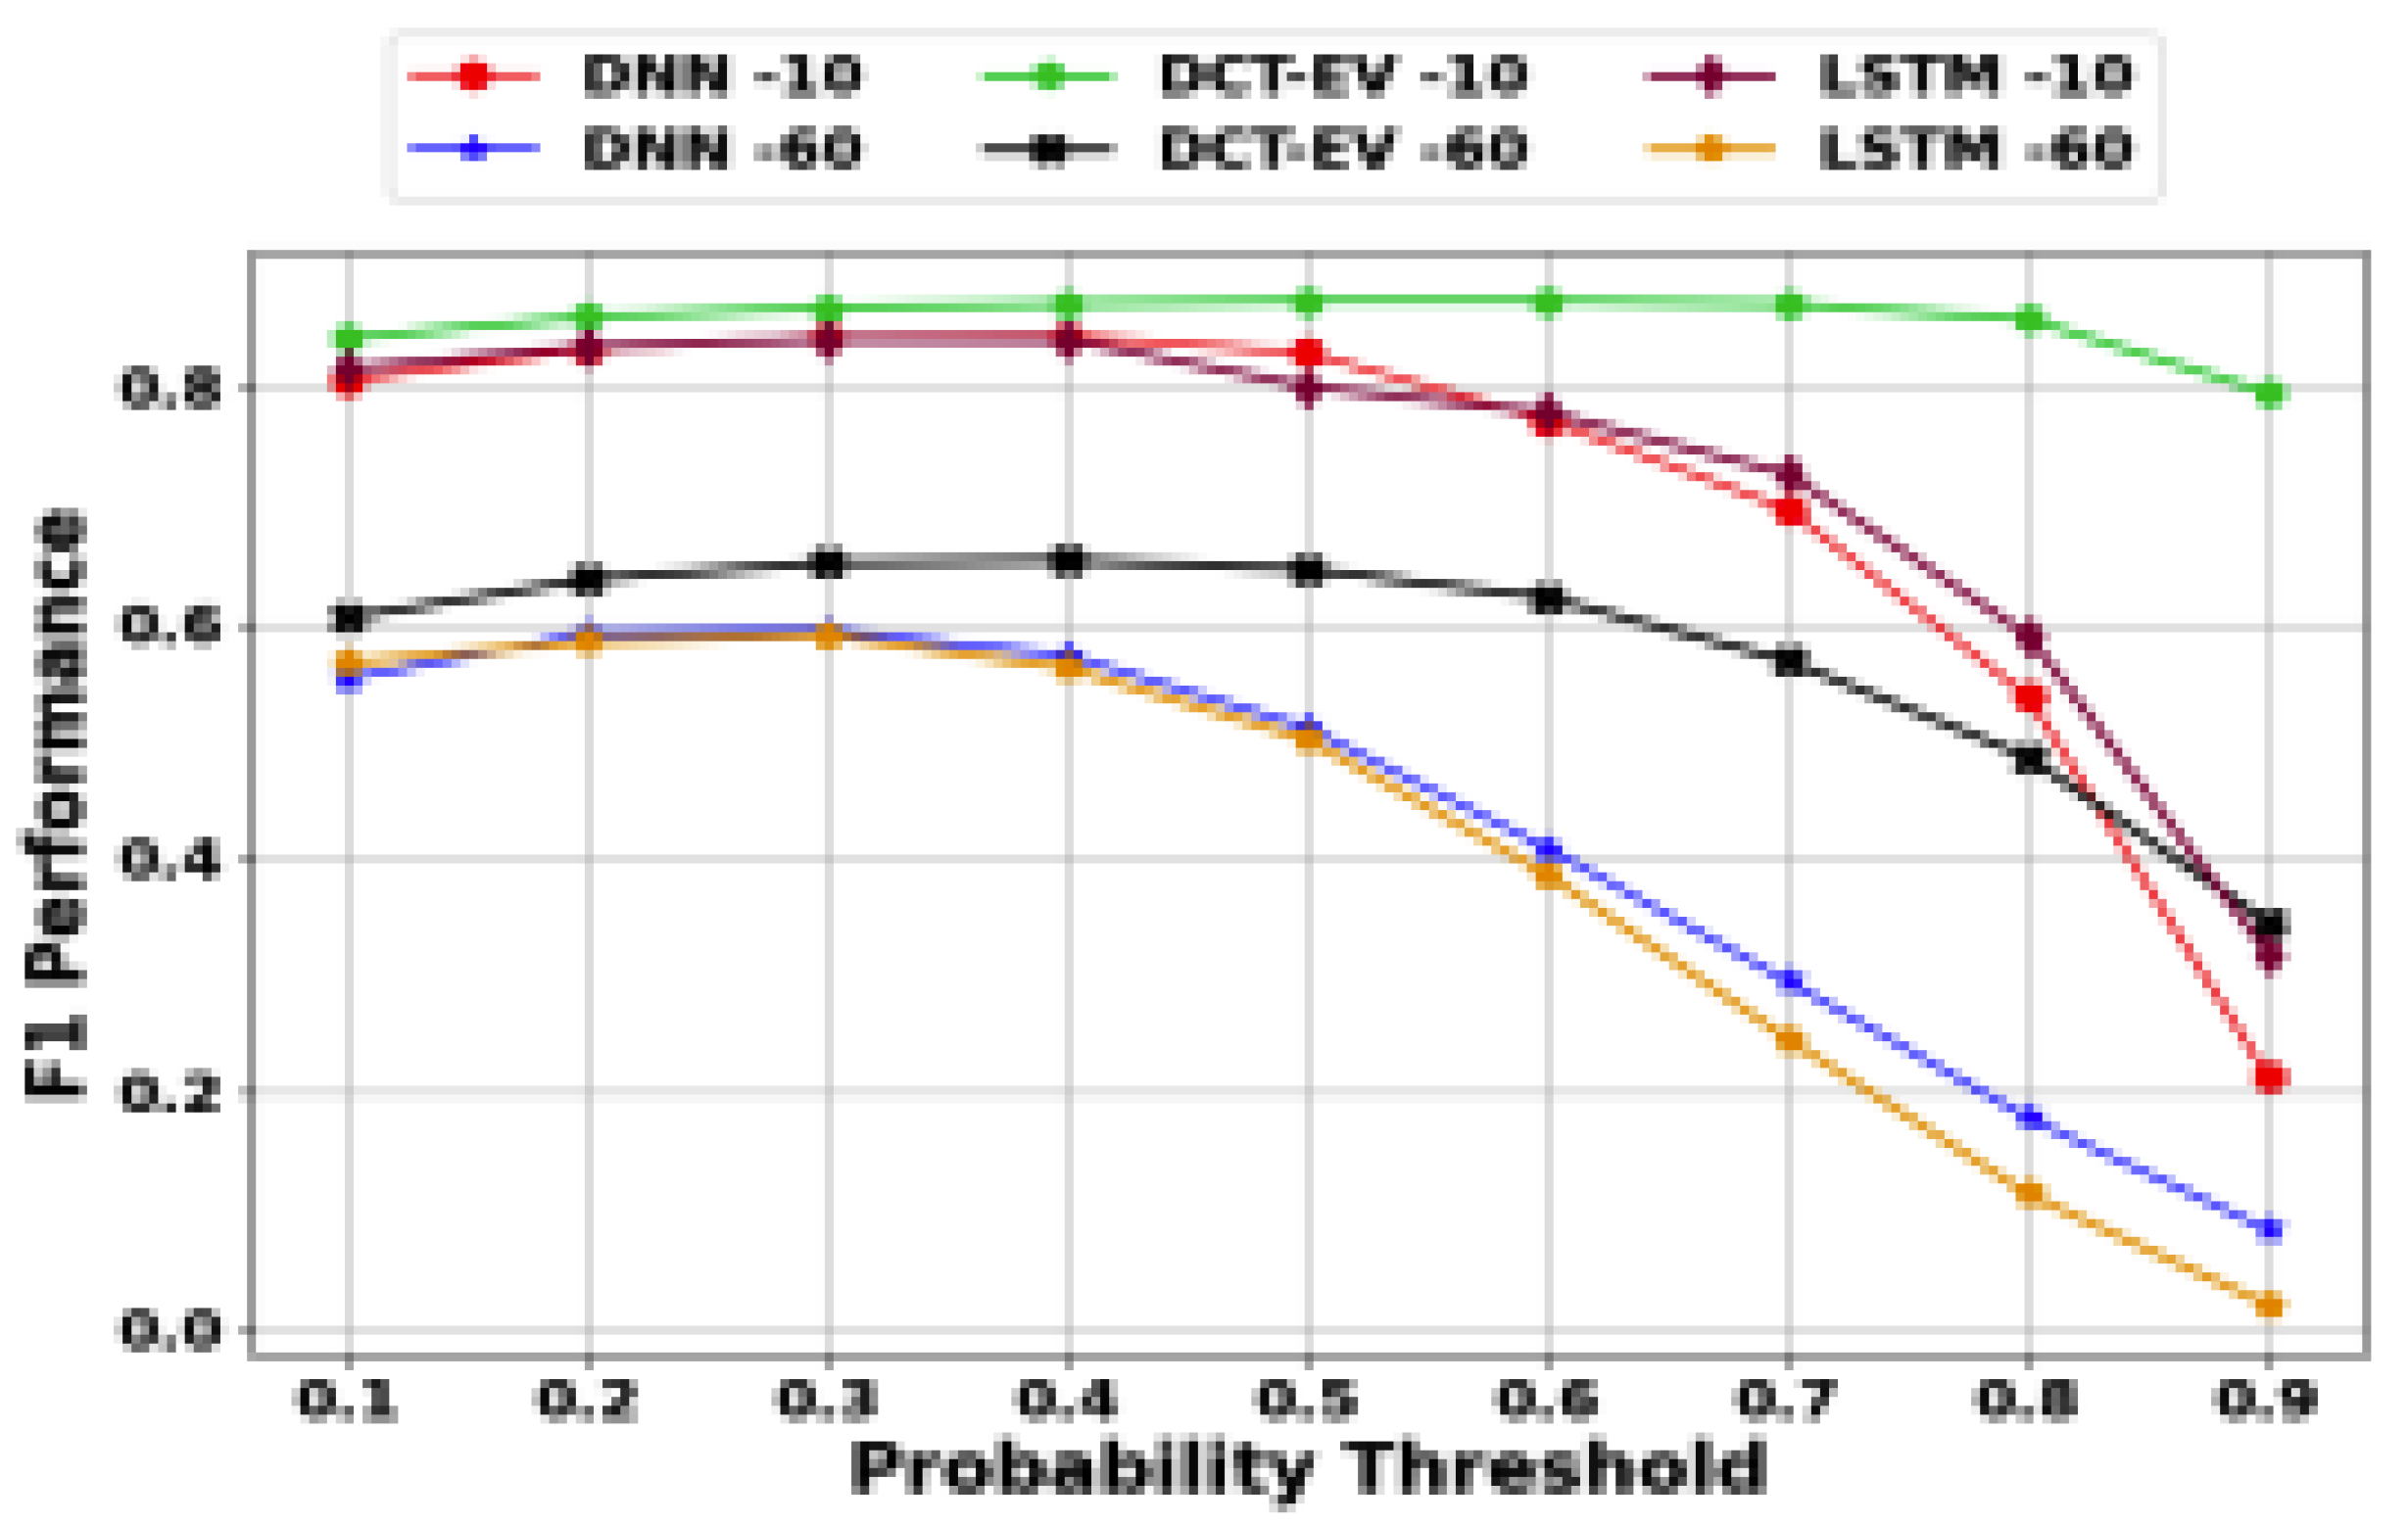
4.2.4. Threshold Sensitivity and Selection
The binary classification decision threshold plays a critical role in performance tuning. Figure 4 presents performance curves under varying threshold values. Interestingly, DCT-EV achieves peak performance within the 0.6 to 0.8 range, showing resilience to threshold variation and a clear operating sweet spot. In contrast, DNN and LSTM models exhibit optimal behavior at lower thresholds (between 0.2 and 0.4), reflecting differing calibration characteristics across architectures.
This threshold-insensitivity feature of DCT-EV suggests that its probability outputs are more calibrated and less prone to overconfidence or uncertainty, further validating its robustness.
4.2.5. Summary of Findings
Overall, DCT-EV demonstrates strong, consistent performance across multiple scenarios. It outperforms conventional and neural baseline models, especially in short-term prediction tasks. Its performance remains stable across input lengths and decision thresholds, suggesting it is well-suited for real-world deployment in smart grid and energy management systems.
In summary, the experimental analysis validates the superiority of DCT-EV and highlights key factors that influence EV charging prediction performance. These insights are valuable for practitioners seeking to implement predictive solutions using smart meter data.
5. Conclusion
The accurate forecasting of electric vehicle (EV) charging events is essential for effective energy management and the reliable operation of modern power grids. While prior research has primarily concentrated on predicting EV charging activities at public or commercial charging stations, these models generally assume access to detailed EV charging profiles—a limitation when dealing with at-home EV charging, especially in scenarios lacking such granular historical data. This oversight poses a significant gap given the rising adoption of EVs and the increasing reliance on home-based charging solutions.
To bridge this gap, we proposed DCT-EV, a deep learning-based prediction framework that harnesses self-attention mechanisms and parallel computation to deliver highly accurate, minute-level forecasts of future charging events. One of the most notable strengths of DCT-EV lies in its independence from explicit EV charging data; it instead utilizes standard household smart meter readings to infer charging behavior. This characteristic not only circumvents the common issue of unavailable charging profiles but also ensures broader applicability in practical energy management systems.
Through rigorous empirical evaluation across multiple performance metrics—such as F1 score, AUC, average precision, and mean squared error—DCT-EV demonstrated superior predictive capability, achieving accuracy levels exceeding 96%. These results were consistently observed across varying time horizons and decision thresholds, attesting to the model’s robustness and adaptability.
By accurately forecasting charging events without relying on proprietary or device-specific EV data, DCT-EV offers a scalable and privacy-preserving solution. It stands as a powerful tool for utilities and grid operators aiming to optimize load balancing, enhance grid reliability, and proactively manage energy demand in an era of accelerating EV integration.
In conclusion, DCT-EV not only fills a critical methodological gap in the literature but also sets a new benchmark for practical, data-efficient EV charging prediction, paving the way for smarter and more sustainable energy systems.
References
- Luo, Z.; et al. Forecasting charging load of plug-in electric vehicles in China. In Proceedings of the IEEE PES GM, 2011. [CrossRef]
- Islam, M.S.; et al. Feasibility of PV and battery energy storage based EV charging in different charging stations. In Proceedings of the ECTI-CON, 2016. [CrossRef]
- Muratori, M. Impact of uncoordinated plug-in electric vehicle charging on residential power demand. Nature Energy 2018. [Google Scholar] [CrossRef]
- Hoque, M.M.; et al. Network-aware coordination of aggregated electric vehicles considering charge-discharge flexibility. IEEE Trans. Smart Grid 2022. [Google Scholar] [CrossRef]
- Liu, J.; et al. A planning strategy considering multiple factors for EV charging stations along German motorways. Int. J. Elec. Power & Energy Syst. 2021. [Google Scholar] [CrossRef]
- Frendo, O.; et al. Improving smart charging prioritization by predicting EV departure time. IEEE Trans. Intell. Transp. Syst. 2020. [Google Scholar] [CrossRef]
- Cui, D.; et al. Stacking regression technology with event profile for electric vehicle fast charging behavior prediction. Appl. Energy 2023. [Google Scholar] [CrossRef]
- Qian, K.; et al. Load model for prediction of electric vehicle charging demand. Power Syst. Technol. 2010. [Google Scholar] [CrossRef]
- Xing, Q.; et al. Charging demand forecasting model for EVs based on online ride-hailing trip data. IEEE Access 2019. [Google Scholar] [CrossRef]
- Arias, M.B.; Bae, S. EV charging demand forecasting model based on big data technologies. Appl. Energy 2016. [Google Scholar] [CrossRef]
- Li, G.; Zhang, X.P. Modeling of PHEV charging demand in probabilistic power flow calculations. IEEE Trans. Smart Grid 2012. [Google Scholar] [CrossRef]
- Wang, R.; et al. Two-stage mechanism for massive EV charging involving renewable energy. IEEE Trans. Veh. Tech. 2016. [Google Scholar] [CrossRef]
- Yu, L.; et al. Centralized bi-level spatial-temporal coordination charging strategy for area EVs. CSEE J. Power Energy Syst. 2015. [Google Scholar] [CrossRef]
- Beaude, O.; et al. Reducing the impact of EV charging operations on the distribution network. IEEE Trans. Smart Grid 2016. [Google Scholar] [CrossRef]
- Tang, Y.; et al. Aggregated optimal charging and V2G control for EVs under large EV population. IET Gen. Transm. Distrib. 2016. [Google Scholar] [CrossRef]
- Nie, Y.; et al. System state estimation considering EV penetration with unknown behavior using quasi-Newton method. IEEE Trans. Power Systs. 2016. [Google Scholar] [CrossRef]
- Wang, X.; et al. EVSense: A robust and scalable approach to non-intrusive EV charging detection. In Proceedings of the ACM e-Energy; 2022. [Google Scholar] [CrossRef]
- Wang, S.; et al. A deep generative model for non-intrusive identification of EV charging profiles. IEEE Trans. Smart Grid 2020. [Google Scholar] [CrossRef]
- Zhang, Z.; et al. Training-free NILM of EV charging with low sampling rate. In Proceedings of the IECON; 2014. [Google Scholar]
- Zhou, R.; et al. Non-intrusive extraction and forecasting of residential EV charging load. In Proceedings of the iSPEC; 2020. [Google Scholar] [CrossRef]
- Martin, C.; et al. NILM for feeder-level EV charging detection. In Proceedings of the EI2, 2023.
- Saimbhi, A.S. Enhancing Software Vulnerability Detection Using Code Property Graphs and Convolutional Neural Networks. In Proceedings of the Proc. Int. Conf. on Computational, Communication and Information Technology (ICCCIT), 2025, pp. 435–440.
- Saimbhi, A.S. Distinguishing True and Fake Ultra-High Definition Images Using Relative DCT Analysis and Machine Learning. In Proceedings of the Proc. Int. Conf. on Emerging Systems and Intelligent Computing (ESIC), 2025, pp. 172–178.
- Desai, A. Desai, A. Enhancing Inventory Management with Progressive Web Applications (PWAs): A Scalable Solution for Small and Large Enterprises. TechRxiv, 2025.
- Desai, A. Active Learning Strategies for Efficient Text Classification. TechRxiv, 2025.
- Desai, A. Unveiling the Drivers of Ikea Product Pricing: A Random Forest Analysis. TechRxiv, 2025.
- Katta, K. Deep Learning for Early Lung Cancer Detection from CT Scans: A Data Science Bowl Approach. In Proceedings of the Proc. IEEE Int. Conf. on Future Machine Learning and Data Science (FMLDS), 2024, pp. 308–314.
- Katta, K. Asynchronous Hierarchical Federated Learning: Enhancing Efficiency in Distributed Learning Systems. In Proceedings of the Proc. Int. Conf. on Computers and Artificial Intelligence Technology (CAIT), 2024, pp. 462–469.
- Vaswani, A.; et al. Attention is all you need. In Proceedings of the NeurIPS, 2017.
Figure 1.
DCT-EV structure and application.
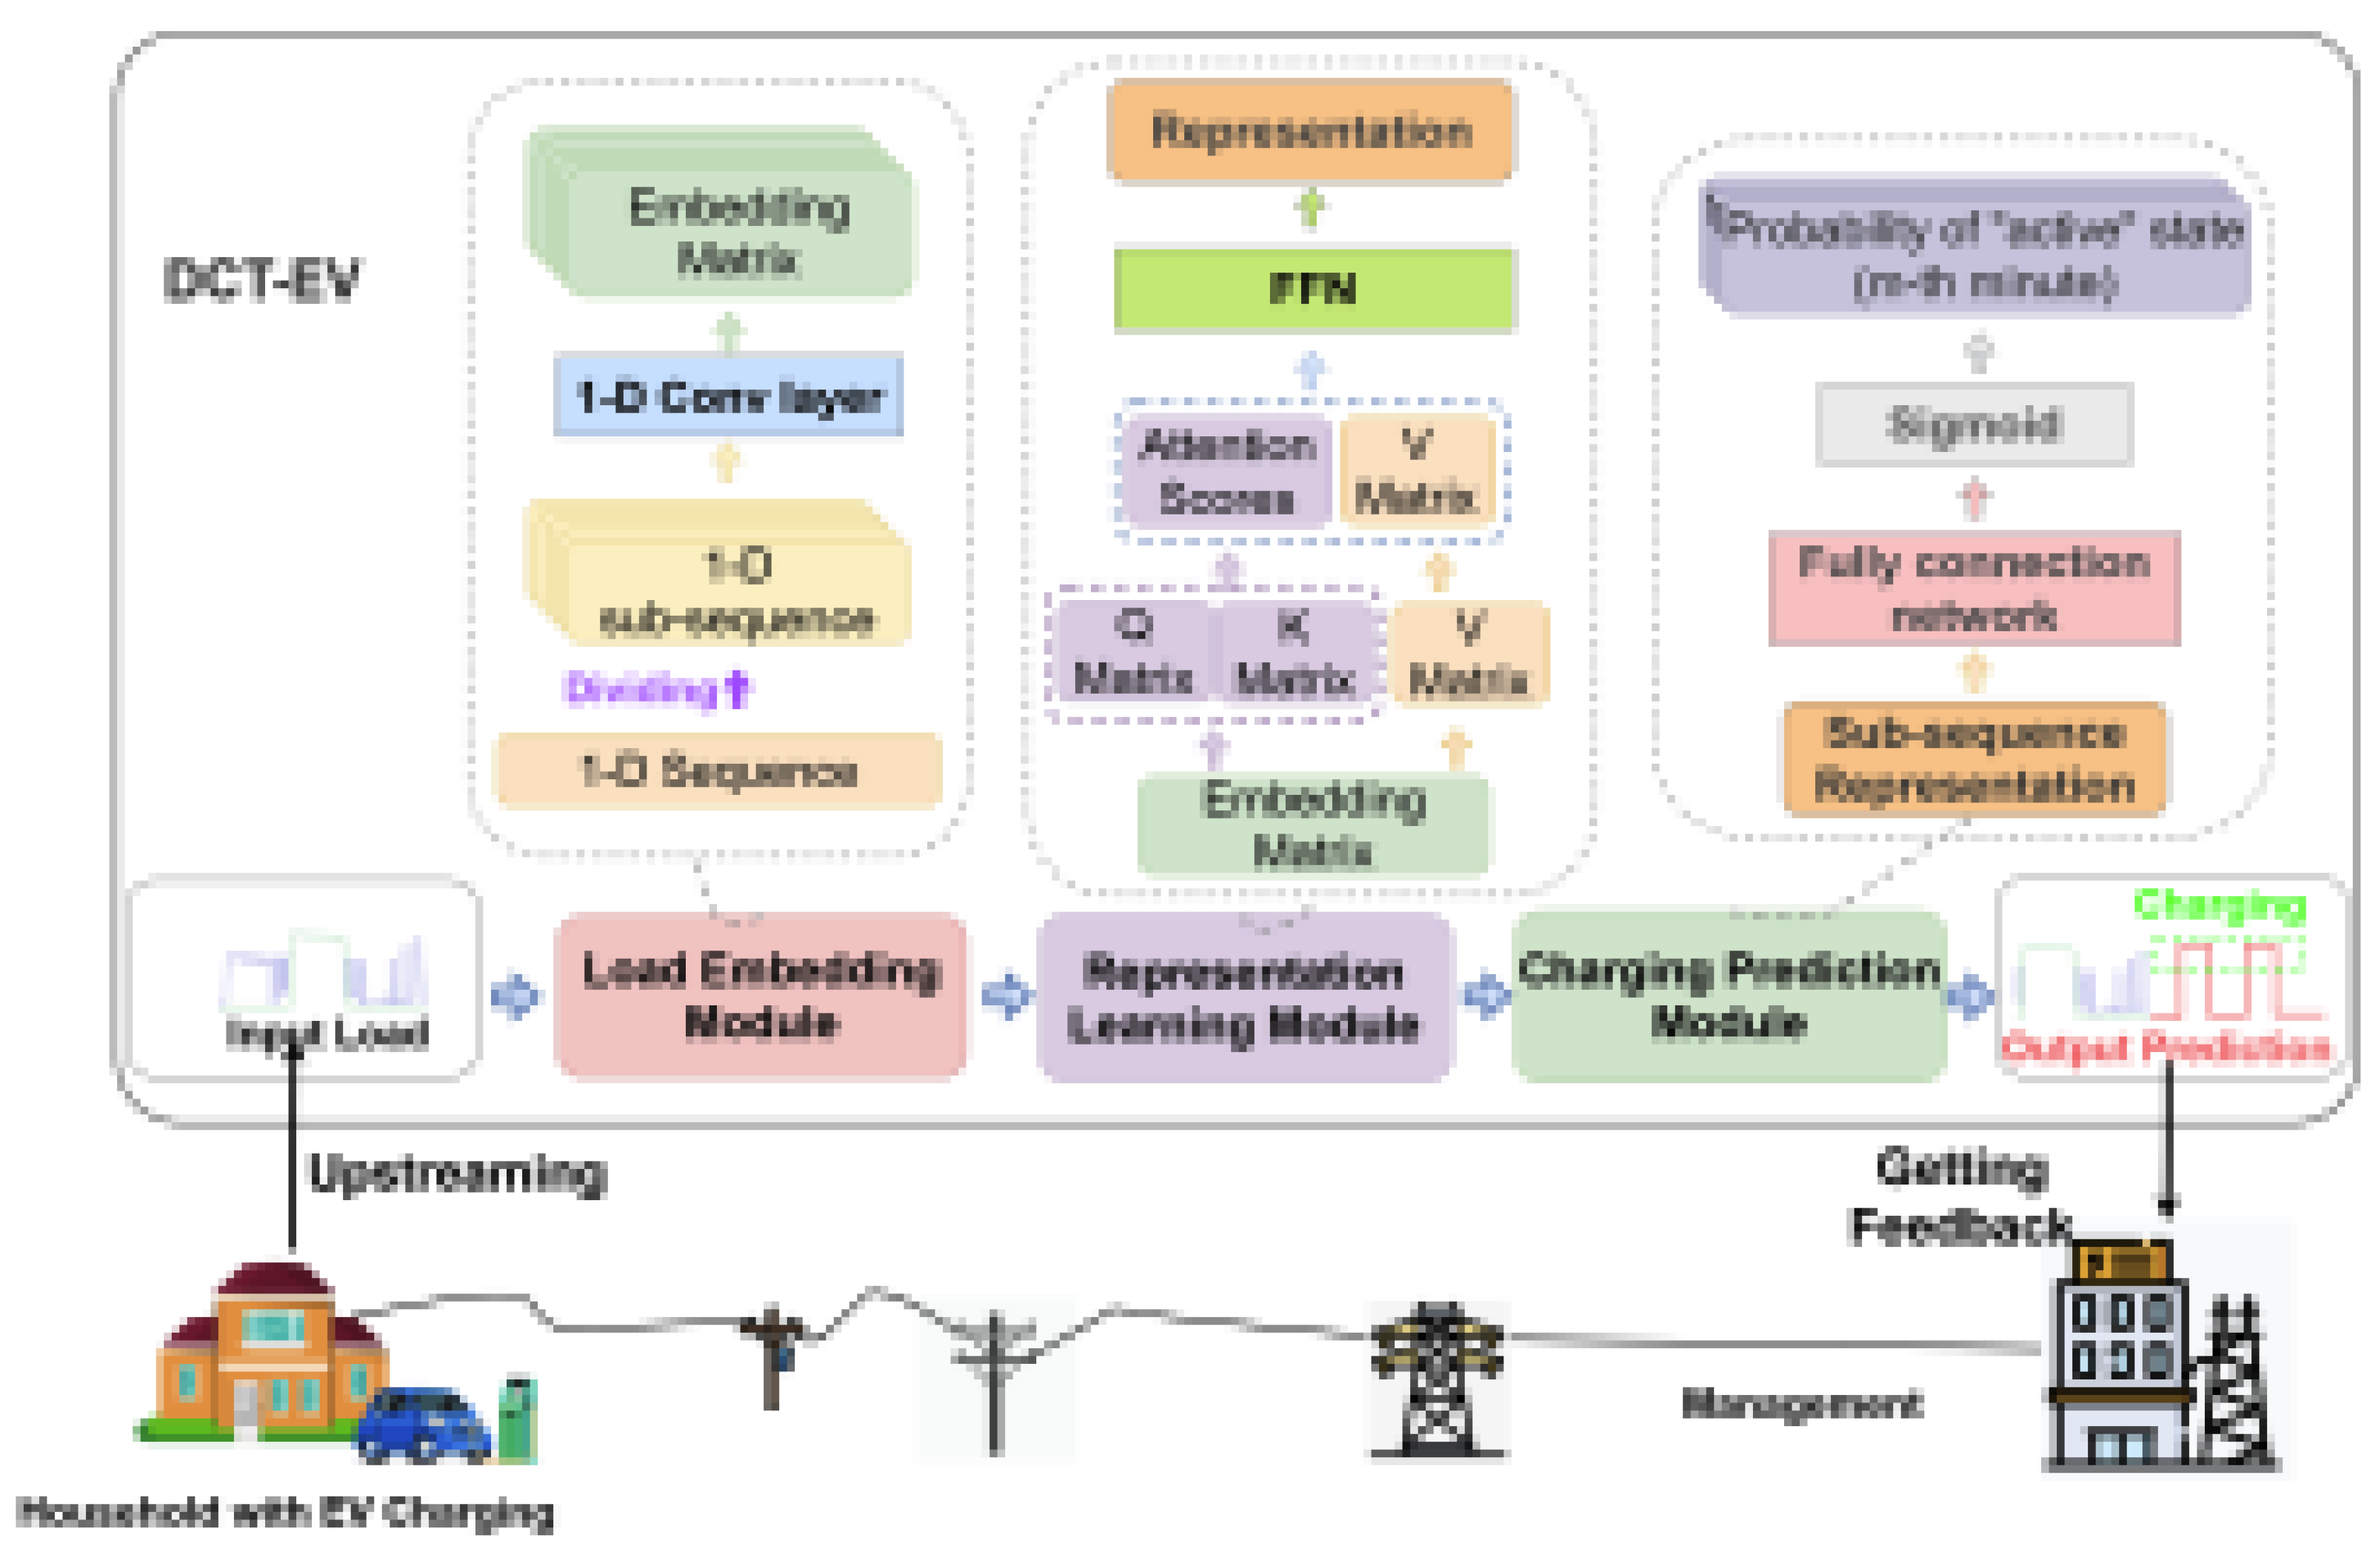
Figure 3.
Impact of input history length on model performance for predicting EV charging event in the next 60 minutes.
Figure 3.
Impact of input history length on model performance for predicting EV charging event in the next 60 minutes.
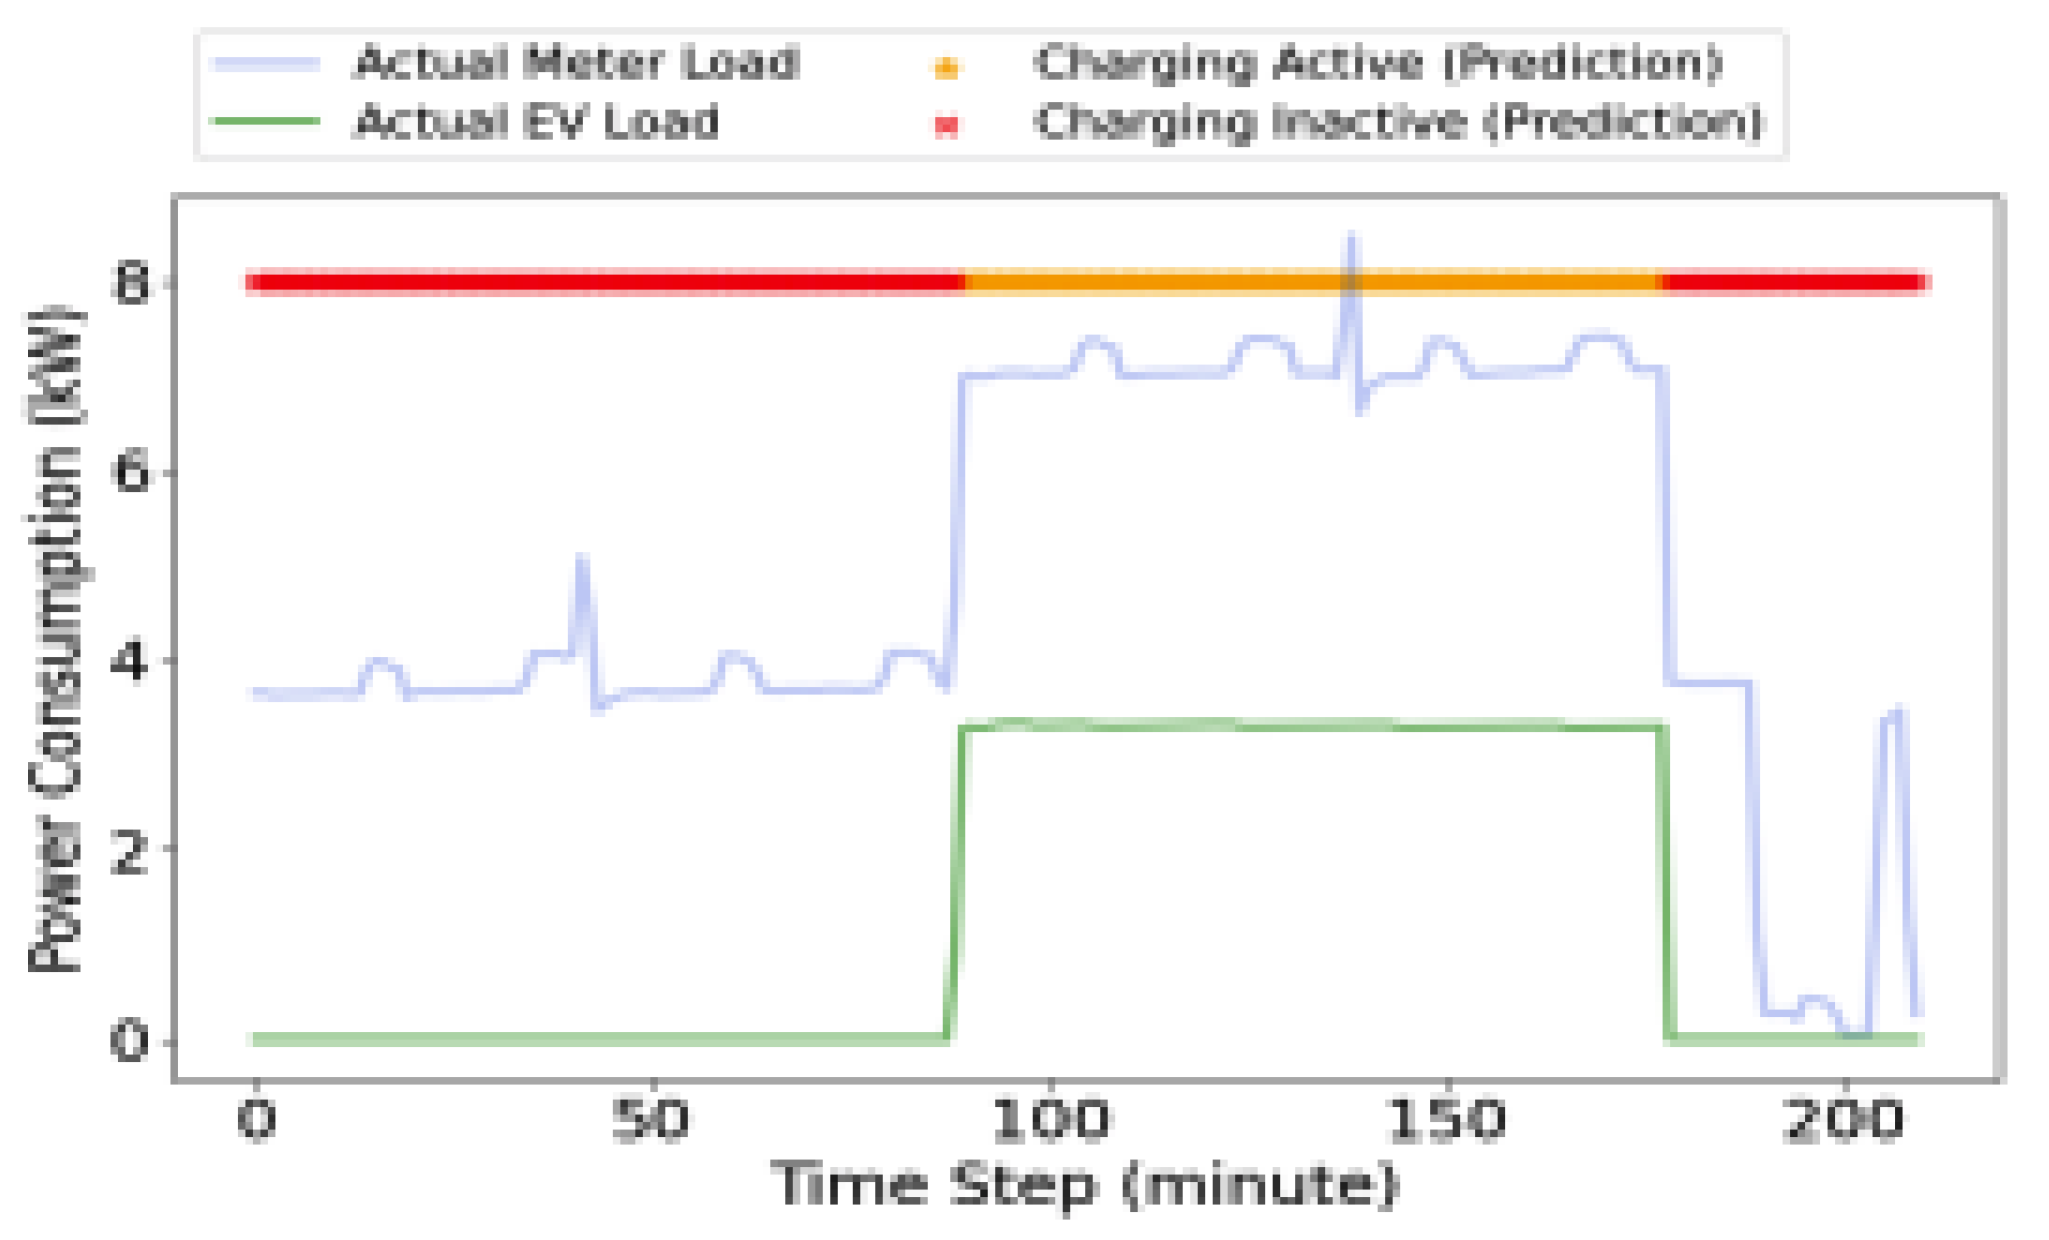
Figure 4.
Model performance sensitivity to prediction threshold.
Disclaimer/Publisher’s Note: The statements, opinions and data contained in all publications are solely those of the individual author(s) and contributor(s) and not of MDPI and/or the editor(s). MDPI and/or the editor(s) disclaim responsibility for any injury to people or property resulting from any ideas, methods, instructions or products referred to in the content. |
© 2025 by the authors. Licensee MDPI, Basel, Switzerland. This article is an open access article distributed under the terms and conditions of the Creative Commons Attribution (CC BY) license (http://creativecommons.org/licenses/by/4.0/).
Copyright: This open access article is published under a Creative Commons CC BY 4.0 license, which permit the free download, distribution, and reuse, provided that the author and preprint are cited in any reuse.


