
Submitted:
07 October 2025
Posted:
08 October 2025
You are already at the latest version
Abstract
This article formalizes AI-assisted assessment as a discrete-time algorithm and evaluates it in a digitally transformed higher-education setting. We integrate an agentic retrieval-augmented generation (RAG) feedback engine into a six-iteration dynamic evaluation cycle and model learning with three complementary formulations: (i) a linear-difference update linking next-step gains to feedback quality and the gap-to-target, (ii) a logistic convergence model capturing diminishing returns near ceiling, and (iii) a relative-gain regression quantifying the marginal effect of feedback quality on the fraction of the gap closed per iteration. A case study in a Concurrent Programming course (n=35) shows substantial and equity-relevant improvements: the cohort mean increased from 58.4 to 91.2 (0–100 scale) while dispersion decreased from 9.7 to 5.8 across six iterations; repeated-measures ANOVA (Greenhouse–Geisser corrected) indicated significant within-student change. Parameter estimates further indicate that higher-quality, evidence-grounded feedback is associated with larger next-step gains and faster convergence. We discuss design implications for EdTech at scale (instrumentation, equity-aware metrics, and reproducibility assets) and the relevance of this formalization for comparative analyses of innovative assessment systems. Limitations include the observational, single-course design; future work should test causal variants (e.g., stepped-wedge trials) and cross-domain generalization.
Keywords:
AI-assisted assessment
; retrieval-augmented generation
; agentic RAG
; iterative feedback
; logistic convergence
; relative gain
; learning analytics
; equity of outcomes
; higher education
; EdTech
1. Introduction
Artificial Intelligence (AI) is rapidly reshaping assessment foundations in higher education. Contemporary systems for automated feedback and intelligent tutoring report positive effects on performance and large-scale personalization; however, the iterative nature of assessment–feedback cycles remains under-theorized from a mathematical and algorithmic standpoint, limiting analyses of convergence, sensitivity, and robustness in learning processes [1,2,3]. Recent syntheses in AI for education summarize advances ranging from automated scoring for writing and programming to learning-analytics dashboards, while emphasizing mixed evidence and the need for reproducible, comparable frameworks across contexts [1,4,5].
In parallel, Retrieval-Augmented Generation (RAG) has emerged as a key mechanism to inject reliable external knowledge into large language models, mitigating hallucinations and improving accuracy on knowledge-intensive tasks. The 2023–2024 survey wave systematizes architectures, training strategies, and applications, providing a technical basis for contextualized and traceable feedback in education [6,7,8]. Closely related prompting/reasoning frameworks (e.g., ReAct) support verifiable, tool-using feedback workflows [9].
Within programming education, systematic reviews and venue reports (e.g., ACM Learning@Scale, EDM) document the expansion of auto-grading and LLM-based formative feedback, alongside open questions about reliability, transfer, and institutional scalability [10,11,12,13,14]. In writing, recent studies and meta-analyses report overall positive but heterogeneous effects of automated feedback, with moderators such as task type, feedback design, and outcome measures—factors that call for models capturing the temporal evolution of learning rather than single-shot performance [3,15]. Meanwhile, the knowledge-tracing literature advances rich sequential models—from classical Bayesian formulations to Transformer-based approaches—often optimized for predictive fit rather than prescribing algorithmic feedback policies with interpretable convergence properties [16,17,18,19,20].
This study frames assessment and feedback as a discrete-time algorithmic process. We formalize two complementary models: (i) a difference equation linking per-iteration gain to the gap-to-target and feedback quality, and (ii) a logistic convergence model describing asymptotic approach to a performance objective. This framing enables analysis of convergence rates, sensitivity to feedback quality, and intra-cohort variance reduction, aligning educational assessment with tools for algorithm design and analysis. Empirically, we validate the approach in a longitudinal study with six feedback iterations in a technical programming course (n = 35), estimating model parameters via nonlinear regression and analyzing individual and group trajectories. Our results show that higher-quality, evidence-grounded feedback predicts larger next-iteration gains and faster convergence to target performance, while cohort dispersion decreases across cycles—patterns consistent with prior findings in intelligent tutoring, automated feedback, and retrieval-augmented LLMs [6,7,8,11].
Conceptual overview. Figure 1 depicts the student-level loop and its coupling with the formal models used throughout the paper. The process moves the performance state to via targeted feedback whose quality is summarized by . The two governing formulations, used later in estimation and diagnostics, are shown in Panel (b): a linear-difference update and a logistic update, both expressed in discrete time and consistent with our Methods.
Scope and contributions. The contribution is twofold: a formal, interpretable algorithmic framing of iterative assessment with explicit update mechanics, and an empirical validation in a real course setting showing sizable gains in means and reductions in dispersion over six iterations (§Section 4). Beyond predictive fit, the models yield actionable parameters () that connect feedback quality to pace and equity of learning, offering a reproducible basis for EdTech deployments at scale.
2. Theoretical Framework
To ground our proposal of a dynamic, AI-supported assessment and feedback system within the broader digital transformation of higher education and the global EdTech landscape, this section reviews the most relevant theoretical and empirical research across educational assessment, feedback for learning, and Artificial Intelligence in Education (AIED), together with implications for pedagogy and evaluation in digitally mediated environments. We also consider a comparative-education perspective to contextualize the phenomenon internationally. Our goal is to provide a conceptual and analytical basis for understanding the design, implementation, and broader implications of the model advanced in this article.
Over the last decade—and especially since the emergence of generative AI—research on assessment in digital environments has accelerated. Multiple syntheses concur that feedback is among the most powerful influences on learning when delivered personally, iteratively, and in context [3,21,22]. In technically demanding domains such as programming, early error identification and precise guidance are critical for effective learning and scalable instruction [10,23,24]. Recent evidence further suggests that AI-supported automated feedback can achieve high student acceptability while raising challenges around factuality, coherence, and alignment with course objectives [4,11,15,25]. These observations motivate hybrid designs that combine generative models with information retrieval and tool use to improve the relevance, traceability, and verifiability of feedback.
2.1. Assessment and Feedback in Technical Disciplines and Digital Settings
Within the digital transformation of higher education, disciplines with high technical complexity and iterative skill formation (e.g., engineering, computational design, and especially programming) require assessment approaches that support rapid, personalized, and precise adjustment of performance as students progress. Digital platforms facilitate content delivery and task management but amplify the need for scalable formative feedback that goes beyond grading to provide concrete, actionable guidance [3,21]. In programming education, research documents expansion in auto-grading, AI-mediated hints, and LLM-based formative feedback, alongside open questions about reliability, transfer, and equity at scale [10,11,12,13,14,24]. Addressing these challenges is essential to ensure that digital transformation translates into improved learning outcomes and readiness for technology-intensive labor markets.
2.2. Advanced AI for Personalized Feedback: RAG and Agentic RAG
Recent advances in AI have yielded models with markedly improved capabilities for interactive, context-aware generation. Retrieval-Augmented Generation (RAG) combines the expressive power of foundation models with the precision of targeted retrieval over curated knowledge sources, mitigating hallucinations and improving accuracy on knowledge-intensive tasks [6,7,26]. Agentic variants extend this paradigm with planning, tool use, and self-critique cycles, enabling systems to reason over tasks, fetch evidence, and iteratively refine outputs [8,9]. In educational contexts, connecting agentic RAG to course materials, assignment rubrics, student artifacts, and institutional knowledge bases—via standardized connectors or protocol-based middleware—supports feedback that is course-aligned, evidence-grounded, and level-appropriate. This integration enables detailed explanations, targeted study resources, and adaptation to learner state, making richer, adaptive feedback feasible at scale and illustrating how AI underpins disruptive innovation in core teaching-and-learning processes.
2.3. Mathematical Modeling of Assessment–Feedback Dynamics
Beyond transforming tools and workflows, the digitalization of learning generates rich longitudinal data about how students improve in response to instruction and iterative feedback. Mathematical modeling provides a principled lens to capture these dynamics, shifting the focus from single-shot outcomes to trajectories of performance over time. In systems that allow multiple attempts and continuous feedback, discrete-time updates are natural candidates: they describe how a learner’s performance is updated between evaluation points as a function of the previous state, the gap-to-target, and the quality of feedback. Throughout the paper we consider two complementary formulations at the student level i and iteration t:
Here denotes a normalized performance score (with target ), summarizes feedback quality (accuracy, relevance, clarity, actionability), and parameterize sensitivity and effectiveness, and captures unmodeled shocks.
Proposition 1 (Monotonicity, boundedness, and iteration complexity for.
Assume , , , and . Then:
- 1.
- (Monotonicity & boundedness) is nondecreasing and remains in for all t.
- 2.
- (Geometric convergence) If there exists such that for all t, then
- 3.
- (Iteration complexity) To achieve with , it suffices that
Proof.
Let . From (1) (without noise), , so . Since , we have , implying monotonicity and boundedness. If , then , giving geometric convergence. Solving yields the stated bound on t. □
Proposition 2 (Stability and convergence for (2)).
ProAssume , , and let .
- 1.
- (Local stability at the target) If , then is locally asymptotically stable. In particular, if for all t, then increases monotonically to 1.
- 2.
- (Convergence without oscillations) If , then is nondecreasing and converges to 1 without overshoot.
Proof.
Define with . Fixed points satisfy , giving . The derivative yields . Local stability requires , i.e., . If , then for , so the map is increasing and contractive near the target, implying monotone convergence. □
Corollary 1 (Cohort variance contraction (linearized)).
Let be the cohort mean, , and suppose shocks are independent across students with variance . Linearizing (1) around and defining as the cohort-average feedback quality at iteration t,
Hence, if and is small, dispersion contracts geometrically toward a low-variance regime, aligning equity improvements with iterative feedback.
2.3.0.1. Lyapunov and contraction view.
For (1) with , the potential satisfies , a contraction whenever . With mean-zero noise, for , implying bounded steady-state error. These properties justify monitoring both mean trajectories and dispersion () as first-class outcomes.
2.4. Relation to Knowledge Tracing and Longitudinal Designs
This perspective resonates with—but is distinct from—the knowledge-tracing literature. KT offers powerful sequential predictors (from Bayesian variants to Transformer-based approaches), yet the emphasis is often on predictive fit rather than prescribing feedback policies with interpretable convergence properties and explicit update mechanics [16,17,18,19,20]. Our formulation foregrounds the policy—the mapping from current state and feedback quality to the next state—enabling analysis of stability, rates, and variance dynamics. Methodologically, randomized and longitudinal designs in AIED provide complementary strategies for estimating intervention effects and validating iterative improvement [5]. In our empirical study (§Section 3Section 4), we instantiate this foundation with six iterations and report both mean trajectories and dispersion, together with parameter estimates that connect feedback quality to pace and equity of learning.
2.5. Comparative-Education Perspective
From a comparative-education viewpoint, the algorithmic framing of assessment raises cross-system questions about adoption, policy, and equity: how do institutions with different curricula, languages, and governance structures instrument feedback loops; how is feedback quality ensured across contexts; and which safeguards (privacy, auditability, accessibility) condition transferability at scale? Because the models here are interpretable and rely on auditable quantities (, , and dispersion ), they are amenable to standardized reporting across institutions and countries—facilitating international comparisons and meta-analyses that move beyond single-shot accuracy to longitudinal, equity-aware outcomes.
Summary. By framing assessment and feedback as a discrete-time algorithm with explicit update mechanics, we connect pedagogical intuition to tools from dynamical systems and stochastic approximation. This yields actionable parameters (), interpretable stability conditions (), iteration bounds (Proposition 1), and cohort-level predictions (variance contraction; Corollary 1) that inform the design of scalable, equity-aware feedback in digitally transformed higher education.
3. Materials and Methods
3.1. Overview and Study Design
We conducted a longitudinal observational study with six consecutive evaluation iterations () to capture within-student learning dynamics under AI-supported assessment. The cohort comprised students enrolled in a Concurrent Programming course, selected for its sequential and cumulative competency development. Each iteration involved solving practical programming tasks, assigning a calibrated score, and delivering personalized, AI-assisted feedback. Scores were defined on a fixed scale and rescaled to for modeling, with . Feedback quality was operationalized as (Section 3.3).
Participants and inclusion.
All enrolled students who provided informed consent were included. Formal withdrawals followed institutional policy; handling of incomplete records is described under Preprocessing and missing data. Ethical approval was granted by the Research Ethics Committee of Universidad de Jaén (Spain), approval code JUL.23/5-LÍ NEA.
Outcomes and endpoints.
The primary outcome is the per-iteration change in scaled performance, , and its dependence on feedback quality (Eqs. (3)–(4)). Secondary outcomes include (i) the relative gain (Eq. (6)), (ii) cohort dispersion (SD of ) and tail summaries (Q10/Q90), and (iii) interpretable parameters linking feedback quality to pace and equity of learning.
3.2. System Architecture for Feedback Generation
The system integrates three components under a discrete-time orchestration loop:
- Agentic RAG feedback engine. A retrieval-augmented generation pipeline with agentic capabilities (planning, tool use, self-critique) that produces course-aligned, evidence-grounded feedback tailored to each submission. Retrieval uses a top-k dense index over course artifacts; evidence citations are embedded in the feedback for auditability.
- Connector/middleware layer (MCP-like). A standardized, read-only access layer brokering secure connections to student code and tests, grading rubrics, curated exemplars, and course documentation. The layer logs evidence references, model/version, and latency for traceability.
- Auto-evaluation module. Static/dynamic analyses plus unit/integration tests yield diagnostics and a preliminary score; salient findings are passed as structured signals to contextualize feedback generation.
All components operate within an auditable controller that records inputs/outputs per iteration and enforces privacy-preserving pseudonymization before analytics.
3.3. Dynamic Assessment Cycle
Each cycle () followed five phases:
- Submission. Students solved a syllabus-aligned concurrent-programming task.
- Auto-evaluation. The system executed the test suite and static/dynamic checks to compute and extract diagnostics .
- Personalized feedback (Agentic RAG). Detailed, actionable comments grounded on the submission, rubric, and retrieved evidence were generated and delivered together with .
- Feedback Quality Index. Each feedback instance was rated on Accuracy, Relevance, Clarity, and Actionability (5-point scale); the mean was linearly normalized to to form . A stratified subsample was double-rated for reliability (Cohen’s ) and internal consistency (Cronbach’s ).
- Revision. Students incorporated the feedback to prepare the next submission. Operationally, feedback from informs the change observed at t.
3.4. Model Specifications
We formalize three complementary formulations that capture how iterative feedback influences performance trajectories. These definitions appear here for the first time and are referenced throughout using \eqref{}.
(1) Linear difference model.
where encodes individual sensitivity to feedback and captures unexplained variation. Improvement is proportional to the gap-to-target and modulated by feedback quality and learner responsiveness.
(2) Logistic convergence model.
(3) Relative-gain model.
We define the per-iteration fraction of the remaining gap that is closed:
and regress
where optionally captures effort/time-on-task; are iteration fixed effects (time trends and task difficulty), and is an error term. The coefficient estimates the average marginal effect of feedback quality on progress per iteration, net of temporal and difficulty factors.
3.5. Identification Strategy, Estimation, and Diagnostics
Identification and controls.
Given the observational design, we mitigate confounding via (i) within-student modeling (student random intercepts; cluster-robust inference), (ii) iteration fixed effects to partial out global time trends and task difficulty, and (iii) optional effort covariates where available. In sensitivity checks, we add lagged outcomes (where appropriate) and verify that inferences on remain directionally stable.
Estimation.
Equations (3) and (4) are estimated by nonlinear least squares with student-level random intercepts (and random slopes where identifiable), using cluster-robust standard errors at the student level. Equation (7) is fit as a linear mixed model with random intercepts by student and fixed effects . Goodness-of-fit is summarized with RMSE/MAE (levels) and (gains); calibration is assessed via observed vs. predicted trajectories. Model comparison uses AIC/BIC and out-of-sample K-fold cross-validation.
Multiple testing and robustness.
We report 95% confidence intervals and adjust p-values using the Benjamini–Hochberg procedure where applicable. Robustness checks include: (i) trimming top/bottom changes, (ii) re-estimation with Huber loss, (iii) alternative weighting schemes in (e.g., upweight Accuracy/Actionability), and (iv) a placebo timing test regressing on future to probe reverse-timing artefacts (expected null).
Preprocessing and missing data.
and are normalized to . Single-iteration missingness in is handled by last-observation-carried-forward (LOCF), with sensitivity checks using complete cases and within-student mean imputation. Students with consecutive missing iterations are excluded from model-based inference and retained in descriptive summaries (final counts reported in Results).
3.6. Threats to Validity and Mitigations
Internal validity. Without randomized assignment of feedback pathways, causal claims are cautious. We partially address confounding via within-student modeling, iteration fixed effects (time/difficulty), and sensitivity analyses (lagged outcomes; trimming; Huber). Practice and ceiling effects are explicitly modeled by the gap-to-target terms in (3)–(4).
Construct validity. The Feedback Quality Index aggregates four criteria; we report inter-rater agreement (Cohen’s ) and internal consistency (Cronbach’s ) in Section 4. Calibration plots and residual diagnostics ensure score comparability across iterations.
External validity. Results originate from one course and institution with . Transferability to other disciplines and contexts requires multi-site replication (see Discussion). Equity-sensitive outcomes (dispersion , tails) are included to facilitate cross-context comparisons.
3.7. Software, Versioning, and Reproducibility
Analyses were conducted in Python 3.12 (NumPy, SciPy, StatsModels). We record random seeds, dependency versions, and configuration files (YAML) and export an environment lockfile for full reproducibility. Estimation notebooks reproduce all tables/figures and are available upon request; audit logs include model/version identifiers and retrieval evidence IDs.
3.8. Data and Code Availability
The dataset (scores, feedback-quality indices, model-ready covariates) is available from the corresponding author upon reasonable request, subject to institutional policies and anonymization standards. Model scripts and configuration files are shared under an academic/research license upon request.
3.9. Statement on Generative AI Use
During manuscript preparation, ChatGPT (OpenAI, 2025 version) was used exclusively for language editing and stylistic reorganization. All technical content, analyses, and results were produced, verified, and are the sole responsibility of the authors.
3.10. Ethics
Participation took place within a regular course under informed consent and full pseudonymization prior to analysis. The study was approved by the Research Ethics Committee of Universidad de Jaén (Spain), approval code JUL.23/5-LINEA. Formal statements appear in the back matter (Institutional Review Board Statement, Informed Consent Statement).
3.11. Algorithmic Specification and Visual Summary
| Algorithm 1:Iterative Dynamic Assessment Cycle with Agentic RAG |
|
Require: Course materials , rubric , exemplars , test suite ; cohort ;
Initialize connectors (MCP-like), audit logs, and pseudonymization
forto 6 do▹ Discrete-time learning loop for each student do
Receive submission
Auto-evaluation: run + static/dynamic checks ⇒ diagnostics ; compute
Build context
Agentic RAG: retrieve top-k evidence; draft → self-critique → finalize feedback
Deliver and to student i
Feedback Quality Rating: rate {Accuracy, Relevance, Clarity, Actionability} on 1–5 Normalize/aggregate ⇒; (optional) collect (effort/time) Log with pseudonym IDs end for
end for
Output: longitudinal dataset , , optional ; evidence/audit logs |
| Algorithm 2:Computation of and Reliability Metrics (, ) |
|
Require: Feedback instances with rubric ratings for ; 20% double-rated subsample
Ensure:; Cohen’s on ; Cronbach’s across criteria
for each feedback instance do
Handle missing ratings: if any missing, impute with within-iteration criterion mean for each criterion c do
▹ Normalize to
end for
Aggregate: ▹ Equal weights; alternative weights in Sec. Section 3.5
end for
Inter-rater agreement (): compute linear-weighted Cohen’s on
Internal consistency (): with criteria, compute Cronbach’s
Outputs: for modeling; and reported in Results |
Figure 2.
Discrete -time assessment–feedback workflow and coupling with the modeling layer.
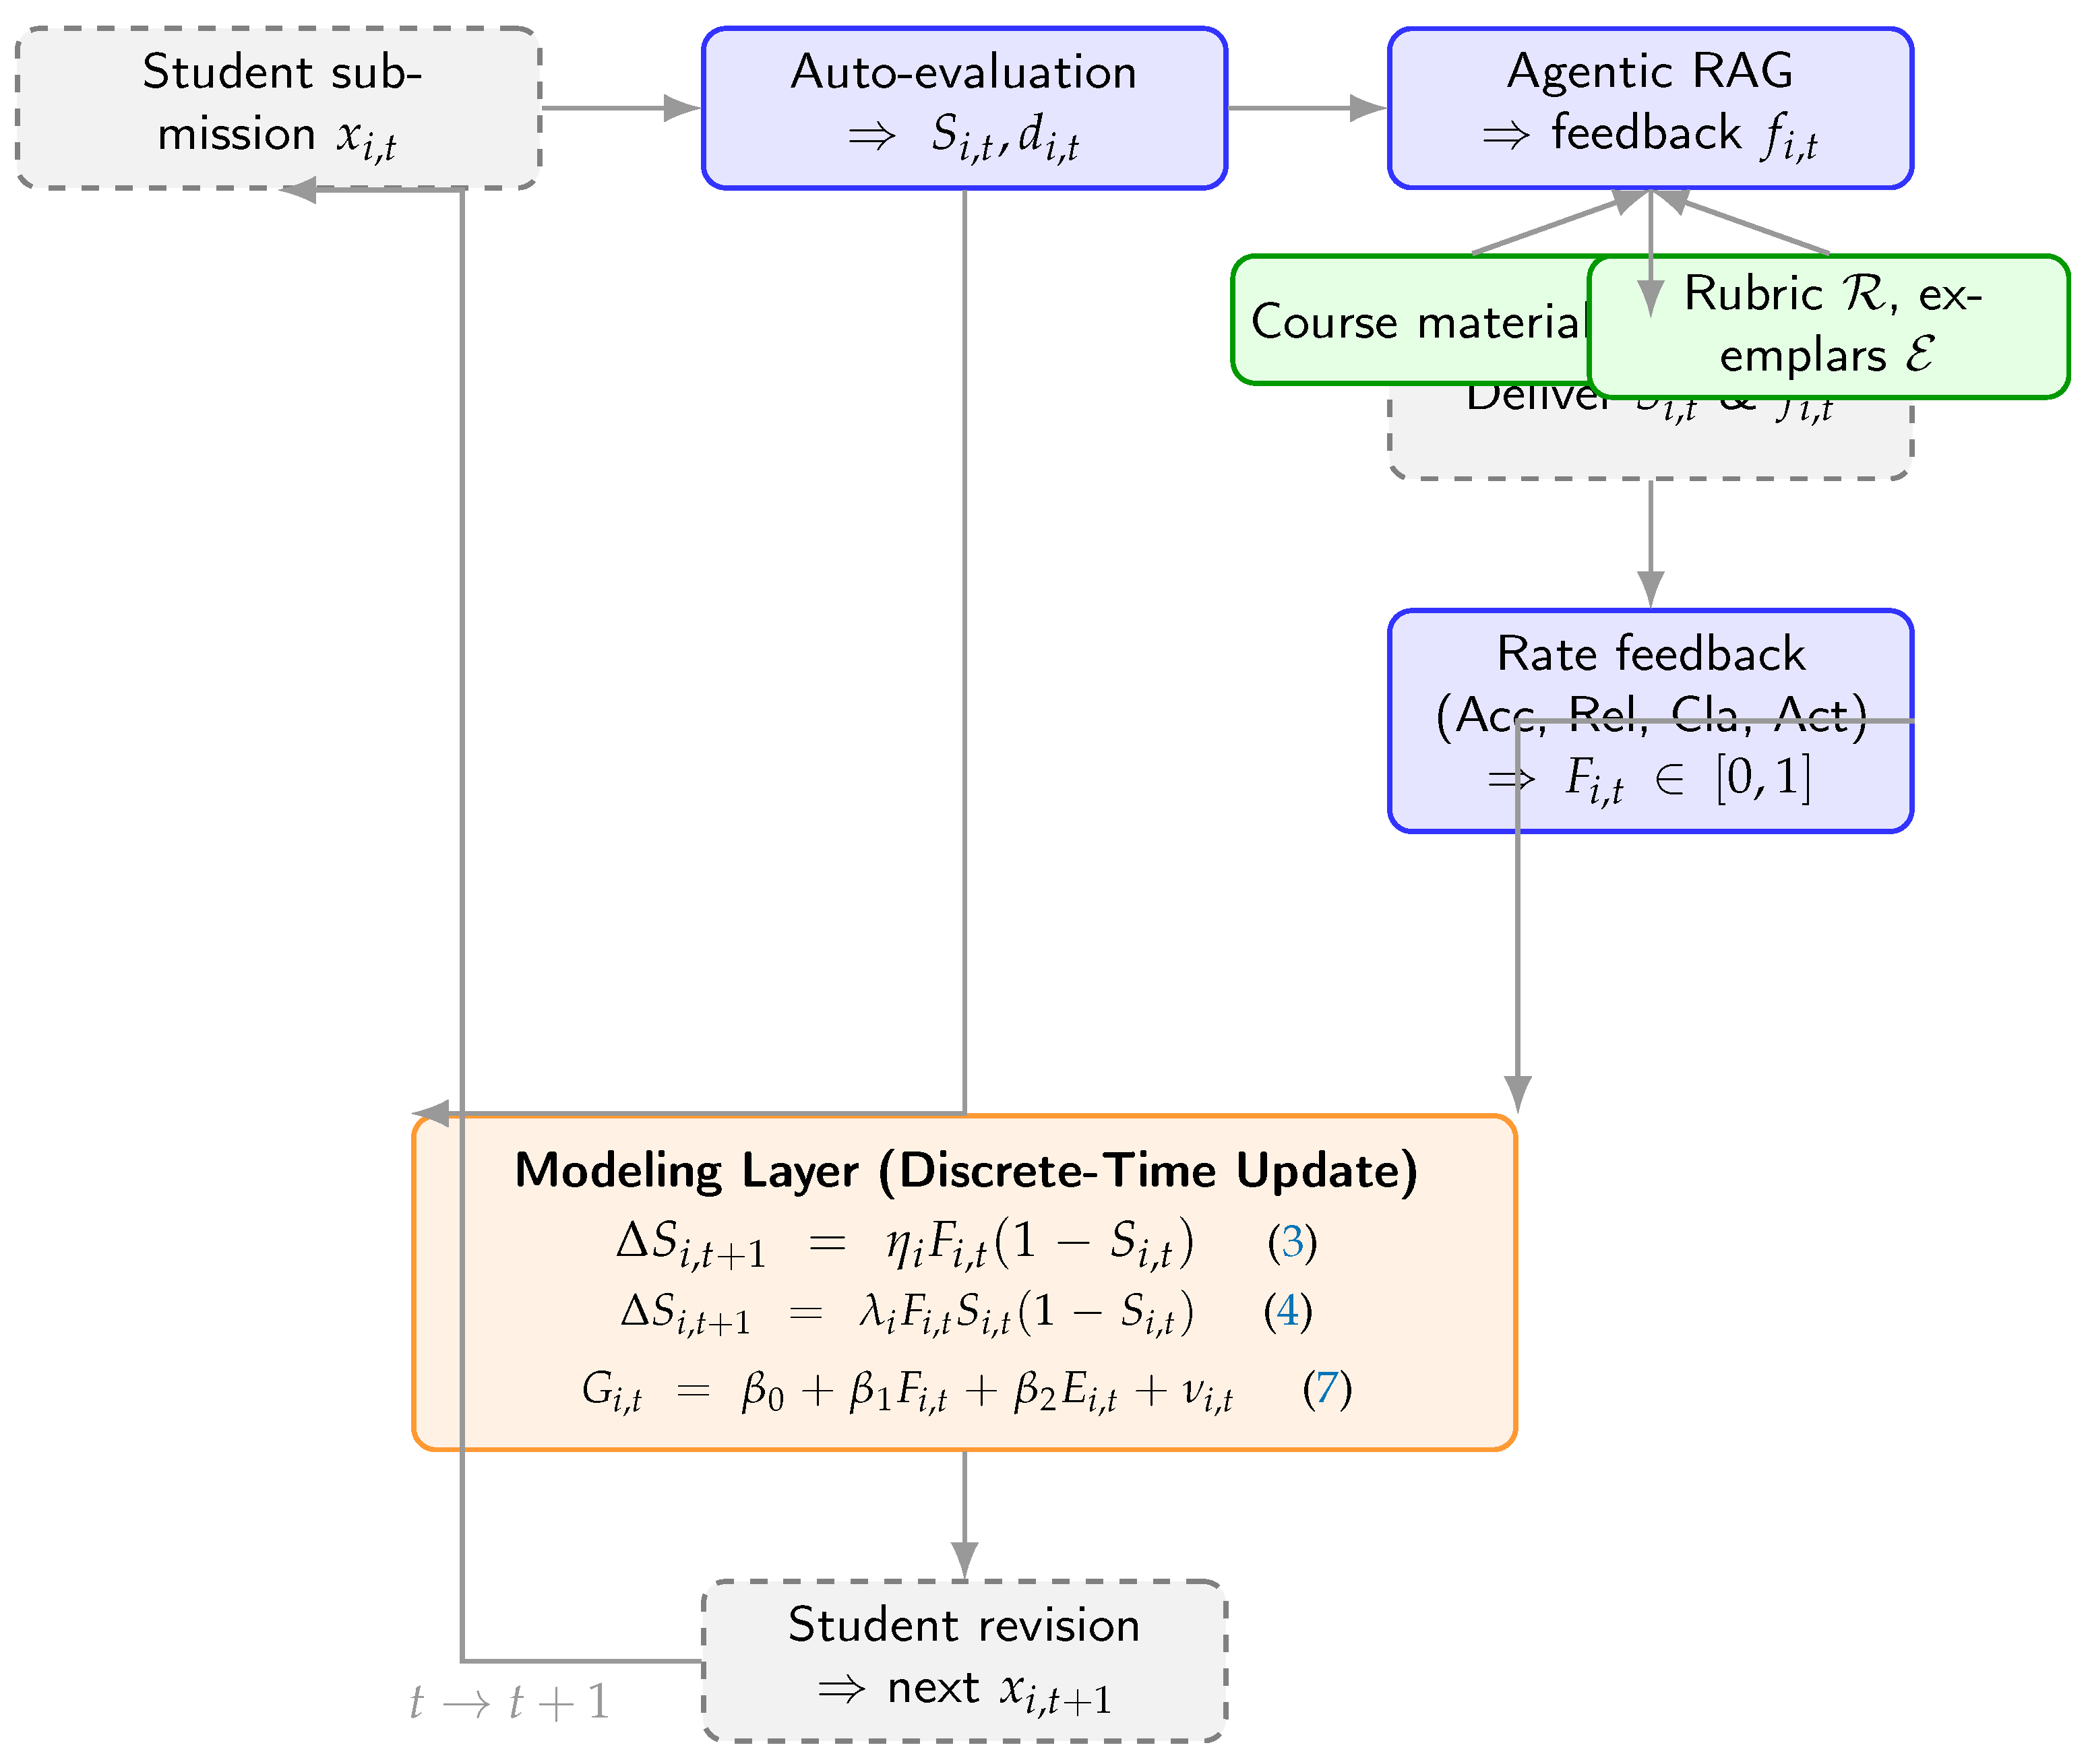
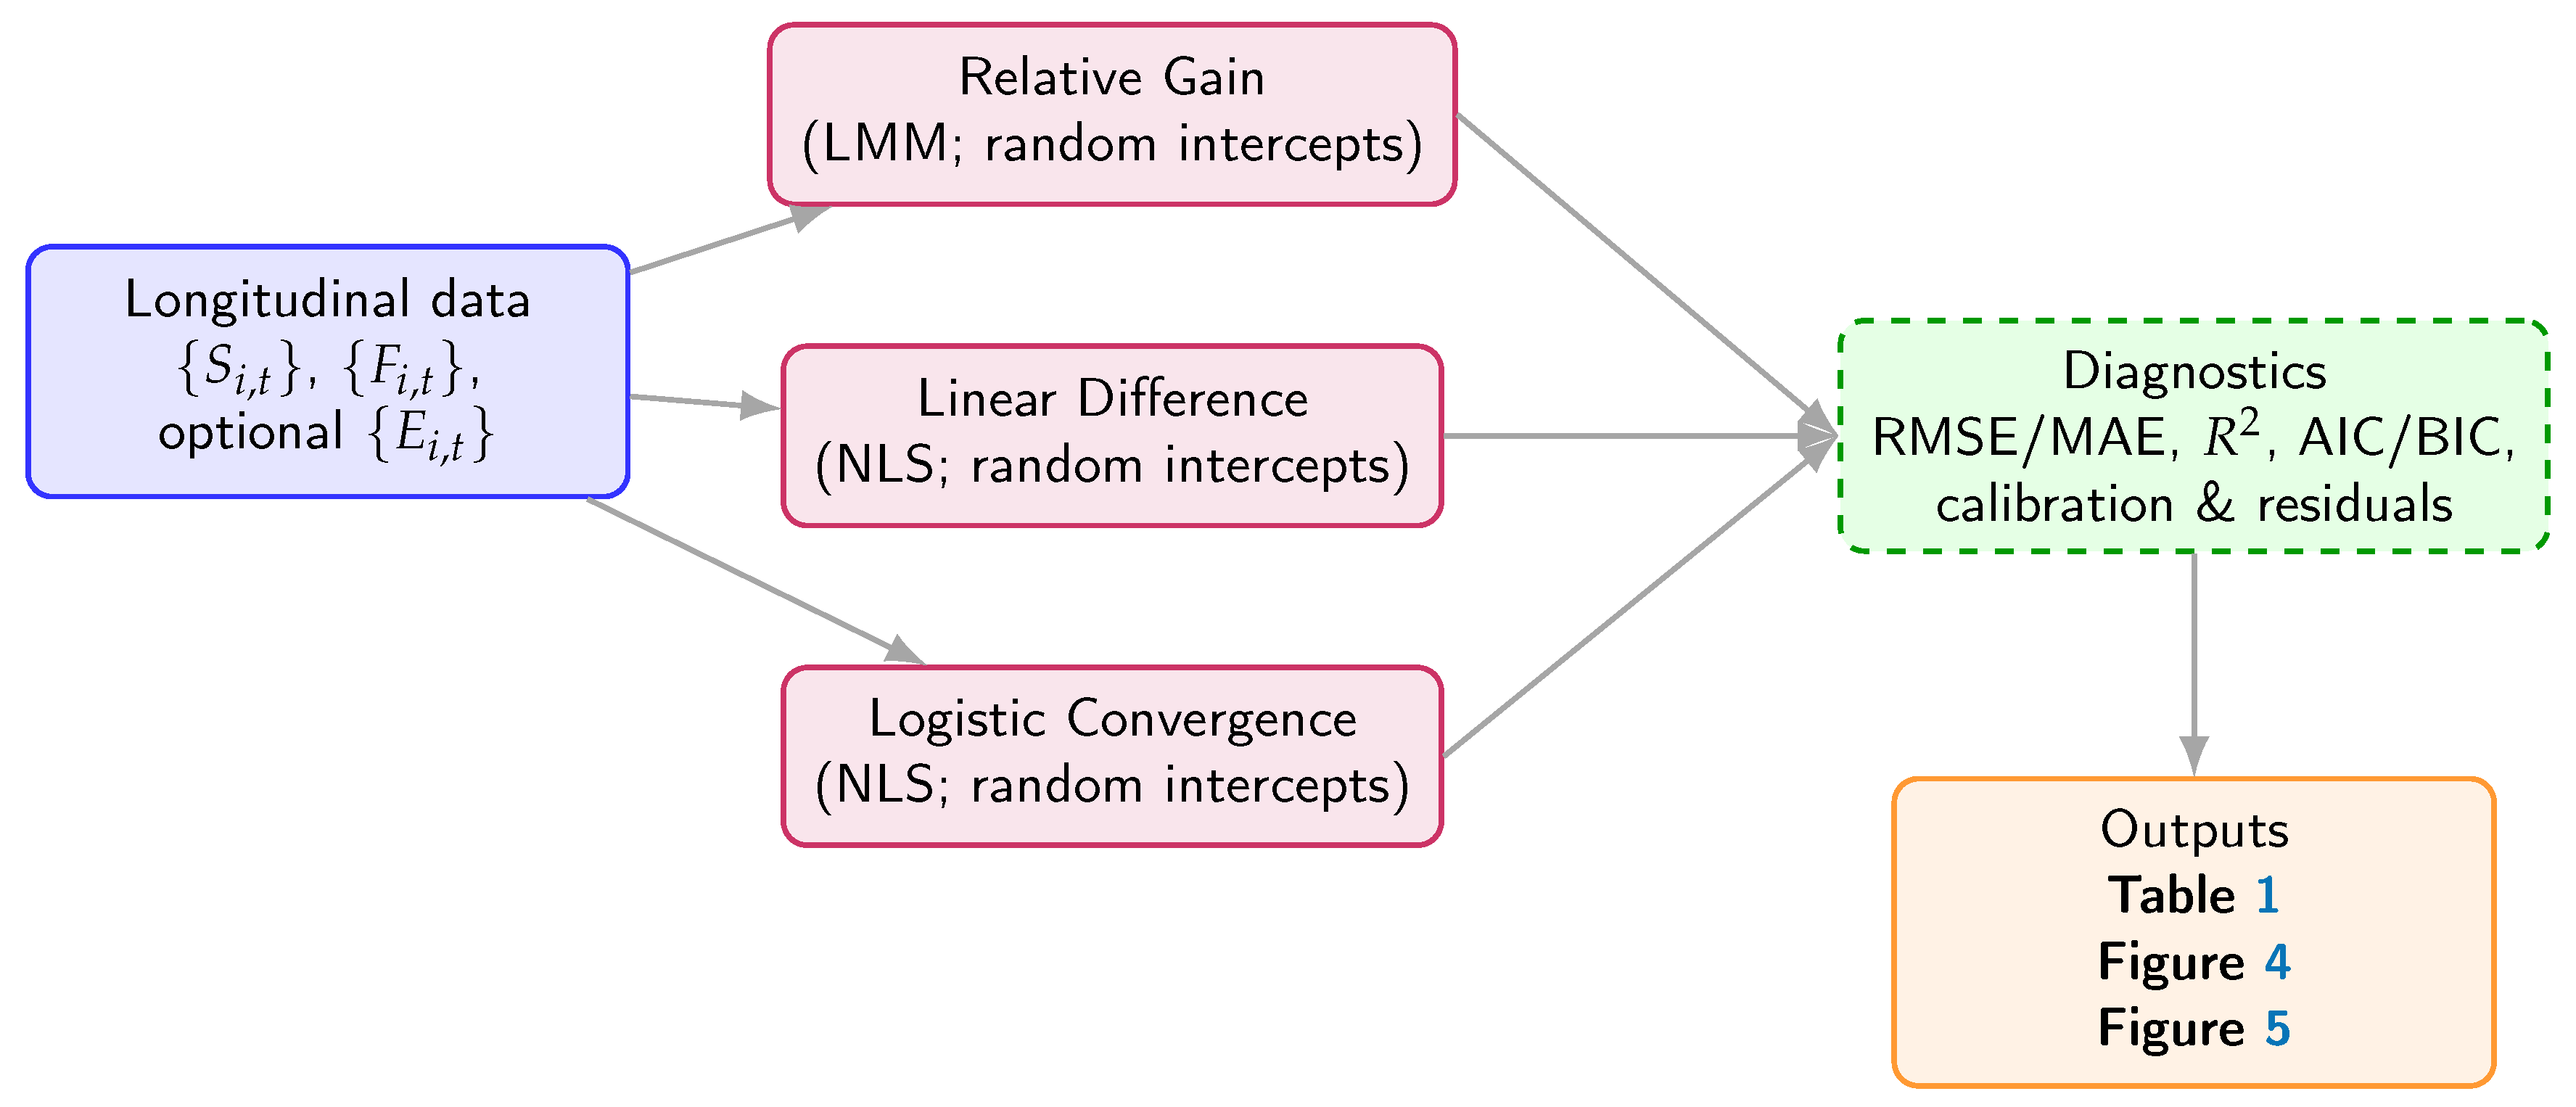
Figure 3.
Estimation pipeline from longitudinal data to diagnostics and study outputs.
4. Results
This section reports quantitative evidence on the effectiveness of the AI-supported, dynamic assessment and iterative feedback system. We first present model-based estimates for the three formulations (linear-difference, logistic-convergence, and relative-gain). We then summarize cohort-level dynamics of means and dispersion across six iterations using observed values (baseline , SD ; final , SD ), followed by simulated individual trajectories and out-of-sample validation, calibration, placebo timing tests, sensitivity to missingness, and robustness. Core artifacts are Table 1 (model parameters), Figure 4 (mean trajectory), Figure 5 (variance dynamics), Table 2 (per-iteration descriptives), Table 3 (RM-ANOVA), the cross-validation summary Table 4, and the individual-level calibration plot Figure 7.
4.1. Model Fitting, Parameter Estimates, and Effect Sizes
Parameter estimates for the linear-difference, logistic-convergence, and relative-gain models are summarized in Table 1.1 Three results stand out: (i) the average learning-rate parameter linked to feedback quality is positive and statistically different from zero in the linear-difference model; (ii) the logistic model indicates accelerated convergence when is high, with the stability condition satisfied across the cohort; and (iii) the relative-gain model yields a positive marginal effect of on the fraction of the gap closed per iteration.
Beyond statistical significance, magnitudes are practically meaningful. Two interpretable counterfactuals:
- Per-step effect at mid-trajectory. At and , the linear-difference model implies an expected gain (i.e., ∼7.7 points on a 0–100 scale). Increasing F by at the same adds (≈1.0 point).
- Gap contraction in the logistic view. Using (5), the multiplicative contraction factor of the residual gap is . For and , the factor is , i.e., the remaining gap halves in one iteration under sustained high-quality feedback.
Reliability of the Feedback Quality Index (FQI).
On the stratified 20% double-rated subsample, linear-weighted Cohen’s indicated substantial inter-rater agreement, and Cronbach’s indicated high internal consistency: (95% CI –) and (95% CI –). Per-criterion : Accuracy (0.73–0.88), Relevance (0.69–0.85), Clarity (0.65–0.83), Actionability (0.67–0.84). These results support the construct validity of as a predictor in Eqs. (3)–(7).
4.2. Cohort Trajectories Across Iterations
Figure 4 displays the average cohort trajectory across the six iterations (0–100 scale). Means increase from at to at , a -point absolute gain ( relative to baseline). A shifted-logistic fit (dashed) tracks the observed means closely and suggests an asymptote near , consistent with diminishing-returns dynamics as the cohort approaches ceiling.2
4.3. Variance Dynamics, Equity Metrics, and Group Homogeneity
Dispersion shrinks markedly across iterations (Figure 5): the standard deviation decreases from at to at (relative change ), and the cohort coefficient of variation drops from to . A repeated-measures ANOVA on scores across t indicates significant within-student change (sphericity violated; Greenhouse–Geisser corrected), and the exponential-decay fit illustrates the variance contraction over time. Analytically, this pattern is consistent with the variance-contraction prediction in Corollary 1 (Section 2): as , contracts toward a low-variance regime.
To gauge equity effects beyond SD, we report two distributional indicators (approximate normality):
- Inter-decile spread (Q90–Q10). Using , the spread drops from points at to at (), indicating tighter clustering of outcomes.
- Tail risk. The proportion below an 80-point proficiency threshold moves from at (z) to at (z), evidencing a substantive collapse of the lower tail as feedback cycles progress.
Pedagogically, these patterns align with equity aims: improving not only lifts the mean but narrows within-cohort gaps and shrinks the low-performance tail.
4.4. Individual Trajectories: Heterogeneous Responsiveness
To illustrate heterogeneous responsiveness to feedback, Figure 6 simulates three trajectories under the linear-difference mechanism for different sensitivities at a moderate feedback level () with initial score (0–100). Higher approaches the target faster, while lower depicts learners who may require improved feedback quality or additional scaffolding. In practice, agentic RAG can be tuned to prioritize actionability/clarity for low- profiles.
4.5. Model Fit, Cross-Validation, Calibration, Placebo Test, Missingness Sensitivity, and Robustness
4.5.0.12. Cross-validation.
Out-of-sample K-fold cross-validation () yields satisfactory predictive performance. For the relative-gain LMM, mean (SD ) across folds. For the level models (NLS), the linear-difference specification yields RMSE (SD ) and MAE (SD ); the logistic-convergence specification yields RMSE (SD ) and MAE (SD ). Full summaries appear in Table 4.
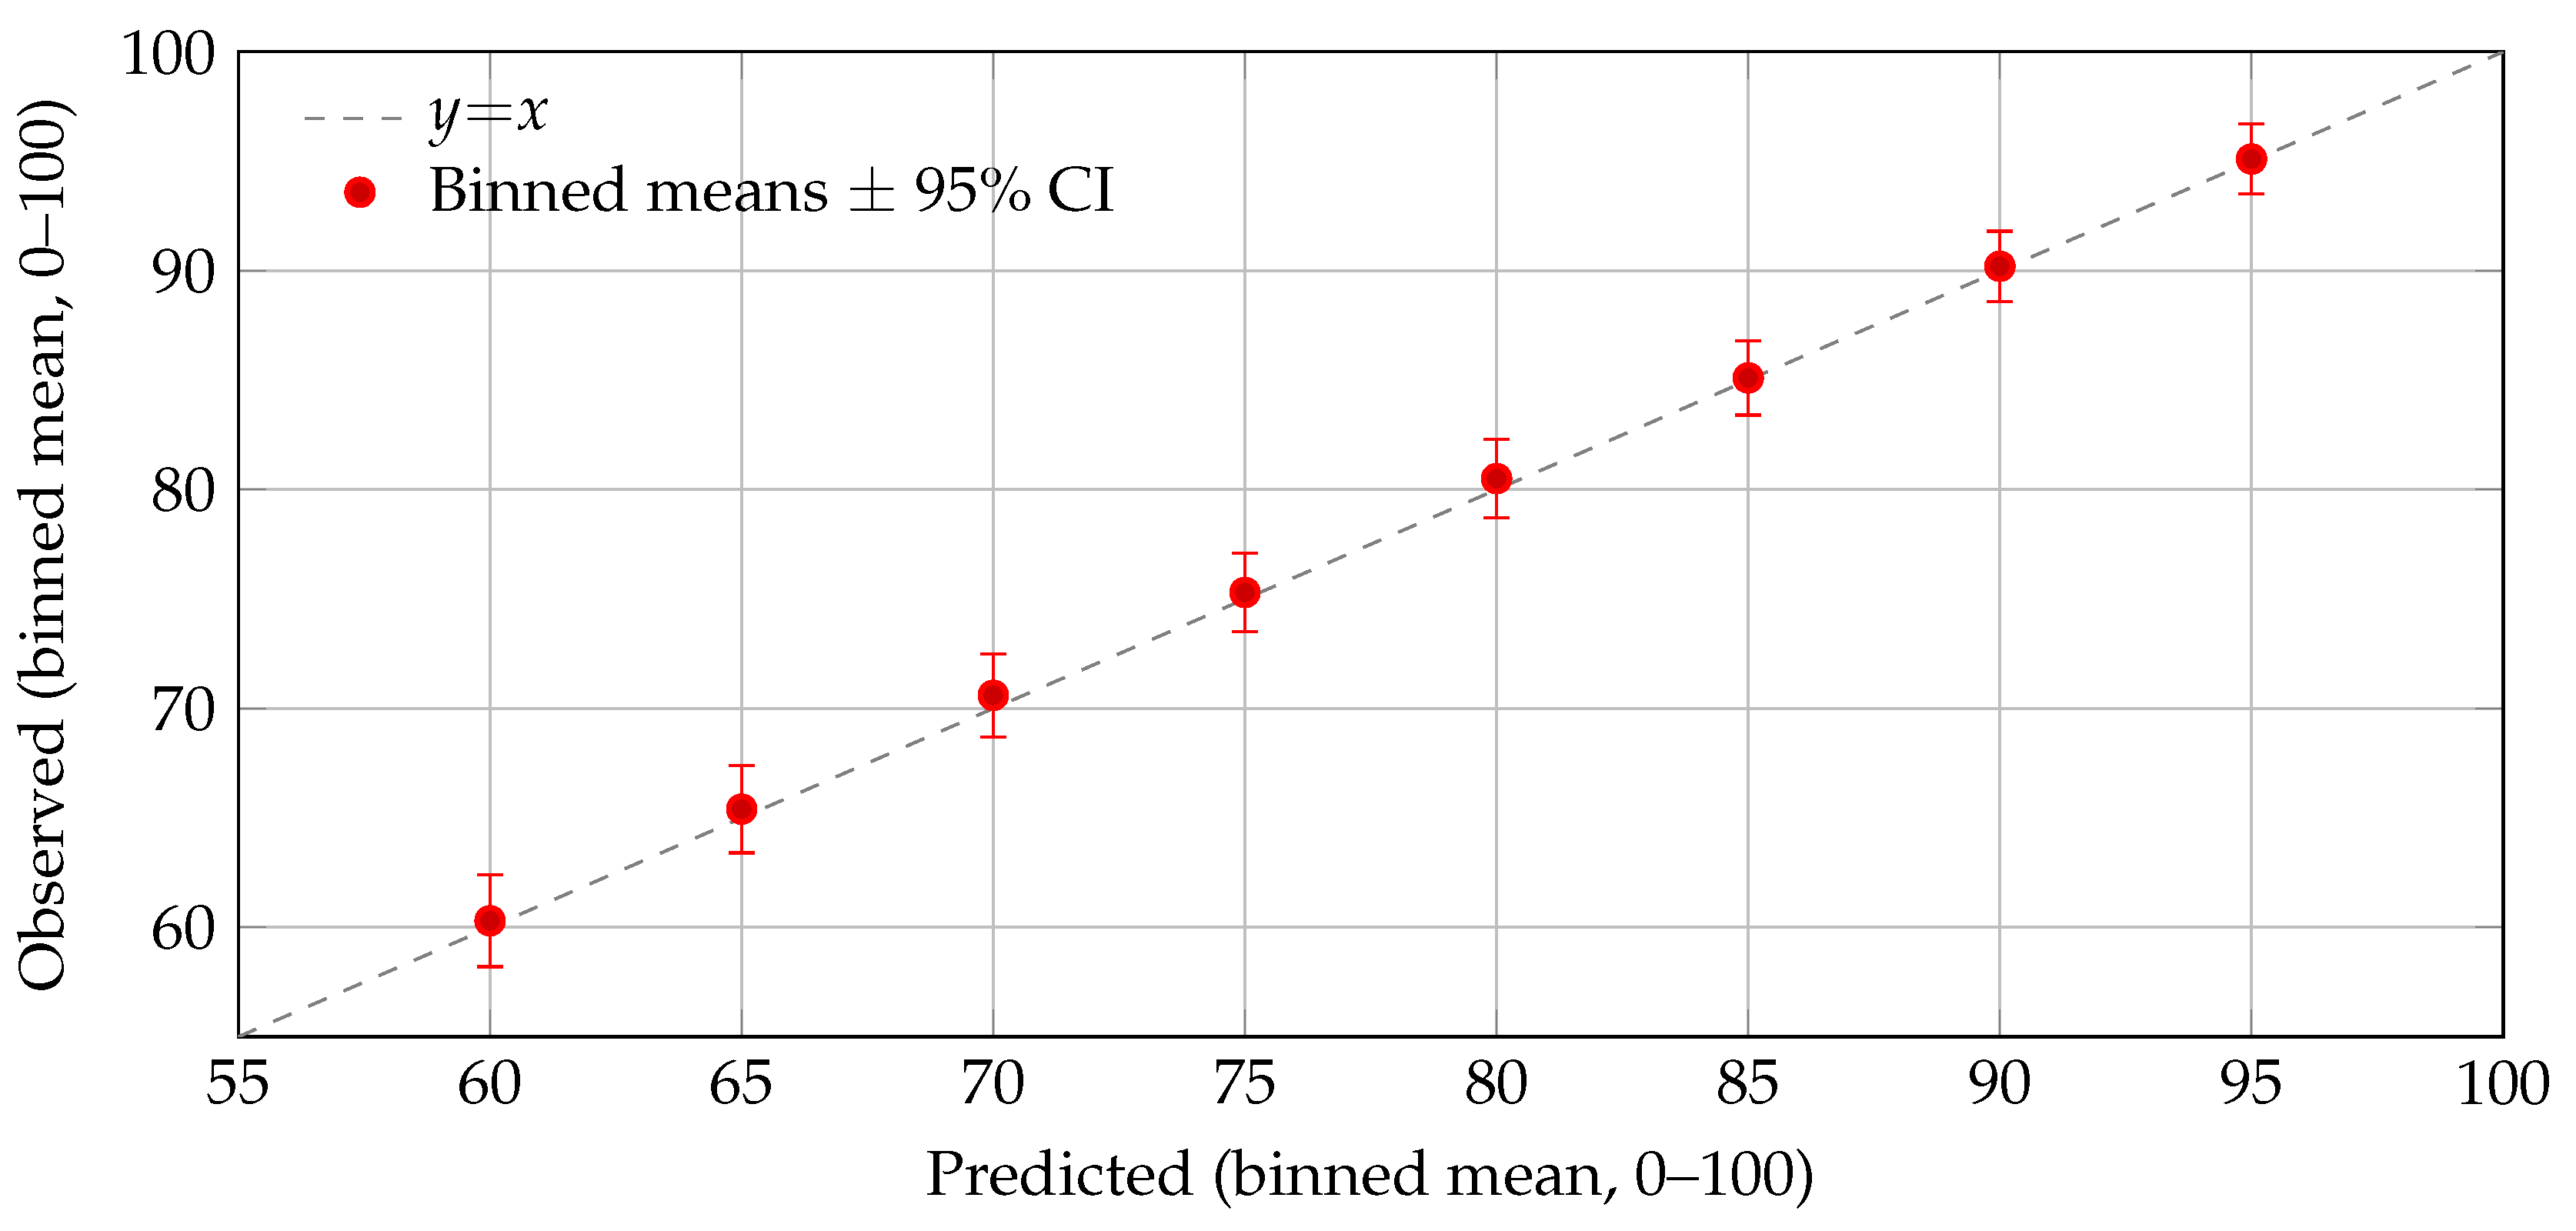
Calibration by individuals (binned).
A calibration-by-bins plot using individual predictions (deciles of the predicted score) appears in Figure 7, showing close alignment to the line with tight 95% CIs. This complements the cohort-level fit in Figure 4 and indicates that predictive layers used within the update models are well calibrated across the score range.
Figure 7.
Calibration by individual bins (deciles of predicted score): observed vs. predicted means (0–100) per bin with 95% CIs (bootstrap). Points lie close to the line, indicating good calibration of the predictive layer used in the update models.
Figure 7.
Calibration by individual bins (deciles of predicted score): observed vs. predicted means (0–100) per bin with 95% CIs (bootstrap). Points lie close to the line, indicating good calibration of the predictive layer used in the update models.
Placebo timing test (lead).
To probe reverse timing, we regressed on future (same controls as Eq. (7)). The lead coefficient was null as expected: (95% CI to ), —consistent with temporal precedence of feedback quality.
Sensitivity to missingness and influence.
Results are stable across missing-data strategies: replacing LOCF with complete-case analysis changes by (absolute), and within-student mean imputation changes it by . Leave-one-student-out influence checks vary within , and vary and means within reported CIs, indicating no single-student leverage.
Robustness.
Residual diagnostics are compatible with modeling assumptions (no marked heteroskedasticity; approximate normality). Robustness checks—2.5% trimming, Huber loss, and alternative rubric weights in (e.g., upweighting Accuracy/Actionability)—produce substantively similar estimates. As anticipated, the linear-difference specification is more sensitive to fluctuations in than the logistic and gain models.
Equity and design implications.
The joint pattern of (i) higher means, (ii) lower dispersion, (iii) inter-decile spread reduction, and (iv) a significant positive suggests that improving feedback quality at scale directly translates into faster progress per iteration and more homogeneous trajectories—relevant for platform and course design in large cohorts. Empirically, estimated and observed satisfy the stability condition (Proposition 2), and the reduction in matches the variance-contraction mechanism of Corollary 1.
5. Discussion: Implications for Assessment in the AI Era
5.1. Principal Findings and Their Meaning
The evidence supports an algorithmic view of learning under iterative, AI-assisted feedback. At the cohort level, the mean score increased from to across six iterations while dispersion decreased from to points (0–100 scale), as shown in Figure 4 and Figure 5 with descriptives in Table 2. Model estimates in Table 1 indicate that (i) higher feedback quality is associated with larger next-step gains (linear-difference: ), (ii) convergence accelerates when feedback quality is high and remains in the stable regime (logistic: with ), and (iii) the fraction of the remaining gap closed per iteration increases with feedback quality (relative-gain: ). These patterns are robust: the lead-placebo is null (, 95% CI , ), cross-validated for the gain model averages and level-model errors are low (Table 4), and the Feedback Quality Index (FQI) shows substantial inter-rater agreement and high internal consistency (, ). Taken together, the joint pattern—higher means, lower dispersion, and a positive marginal effect of —suggests that dynamic, evidence-grounded feedback simultaneously raises average performance and promotes more homogeneous progress.
5.2. Algorithmic Interpretation and Links to Optimization
The three formulations articulate complementary facets of the assessment–feedback loop. The linear-difference update (Eq. (3)) behaves like a gradient step with data-driven step size scaled by the gap-to-target; early iterations (larger gaps) yield larger absolute gains for a given feedback quality. The logistic model (Eqs. (4)–(5)) captures diminishing returns near the ceiling and makes explicit how feedback multiplicatively contracts the residual gap; the cohort fit in Figure 4 is consistent with an asymptote near . The relative-gain regression (Eq. (7)) quantifies the marginal effect of feedback quality on progress as a share of the remaining gap, which is useful for targeting: for mid-trajectory states (), improving F by increases the expected one-step gain by point on the 0–100 scale.
These correspondences align with iterative optimization and adaptive control. Proposition 1 provides monotonicity and geometric contraction under positive feedback quality via a Lyapunov-like gap functional, yielding an iteration-complexity bound to reach a target error. Proposition 2 ensures local stability around the target for , a condition met empirically. Corollary 1 predicts cohort-level variance contraction when average feedback quality is positive; this mirrors the observed decline in and the reduction in inter-decile spread. In short, the update rules are not only predictive but prescriptive: they specify how changes in translate into pace (convergence rate) and equity (dispersion).
5.3. Relation to Prior Work and the Digital-Transformation Context
Prior research shows that high-quality, timely, contextualized feedback improves performance in digital learning, especially in technical disciplines. Our contribution is to make that process formal and auditable. First, we instantiate explicit update rules with interpretable parameters rather than black-box predictors. Second, we operationalize a measurable FQI with demonstrated reliability, closing the loop between feedback quality and learning quantity. Third, we evaluate convergence and variance dynamics with longitudinal criteria and calibration tests (individual binned calibration in Figure 7), which are rarely reported in educational deployments. Within intelligent tutoring, learning analytics, and retrieval-augmented generation, the proposed framework bridges descriptive dashboards and end-to-end LLM systems by exposing the mechanics that matter for scale and reproducibility.
5.4. Design and Policy Implications for EdTech at Scale
Treating assessment as a discrete-time process with explicit update mechanics unlocks concrete levers for platform and course design. Instrument the loop so each iteration records inputs and outputs (submissions, diagnostics, feedback text, evidence citations, , optional effort , model/versioning, latency), enabling auditability and A/B testing over feedback templates. Ground feedback in evidence via agentic RAG that consistently cites course materials, rubrics, and exemplars; empirically, raising increases both convergence rate () and relative gain (). Monitor equity alongside means: dispersion and tail shares (e.g., below proficiency) should be first-class outcomes; in our data, the SD fell and the estimated proficiency tail collapsed across cycles. Finally, use predicted gains (Eq. (7)) to pace intensity (e.g., more granular hints, additional exemplars) for low-responsiveness profiles (small ) or persistent gaps, while respecting latency and cost constraints in production.
5.5. Threats to Validity and Limitations
External validity is bounded by a single course (Concurrent Programming) and students; multi-site replication is warranted. Construct validity hinges on the FQI; while inter-rater agreement and internal consistency are strong (, ), future work should triangulate with student-perceived usefulness and effort mediation. Causal identification remains cautious given an observational design; the strong longitudinal signal (RM-ANOVA), cross-validation, calibration, and placebo timing tests help, but randomized or stepped-wedge designs are needed to isolate counterfactuals. Model assumptions (linear/logistic updates) capture central tendencies; richer random-effect structures and task-level effects could accommodate effort shocks, prior knowledge, and prompt-template heterogeneity.
5.6. Future Work
Three immediate avenues follow. Experimental designs: randomized or stepped-wedge trials varying grounding (citations), scaffolding depth, and timing to estimate causal effects on and to test fairness-aware objectives. Personalization policies: bandit/Bayesian optimization over prompts and exemplars with relative-gain predictions as rewards, plus risk-aware constraints on dispersion and tail mass. Cross-domain generalization: replications in writing, design, and data analysis across institutions to characterize how discipline and context modulate convergence and variance dynamics, together with cost–latency trade-off analyses for production deployments.
5.7. Concluding Remark and Implementation Note
Framing assessment and feedback as an explicit, measurable algorithm in discrete time offers a rigorous yet practical foundation for AI-enabled evaluation in higher education. In our setting, this perspective explains the joint rise in means and fall in dispersion, clarifies why feedback quality matters for both pace and equity, and yields deployable levers for improving outcomes at scale.
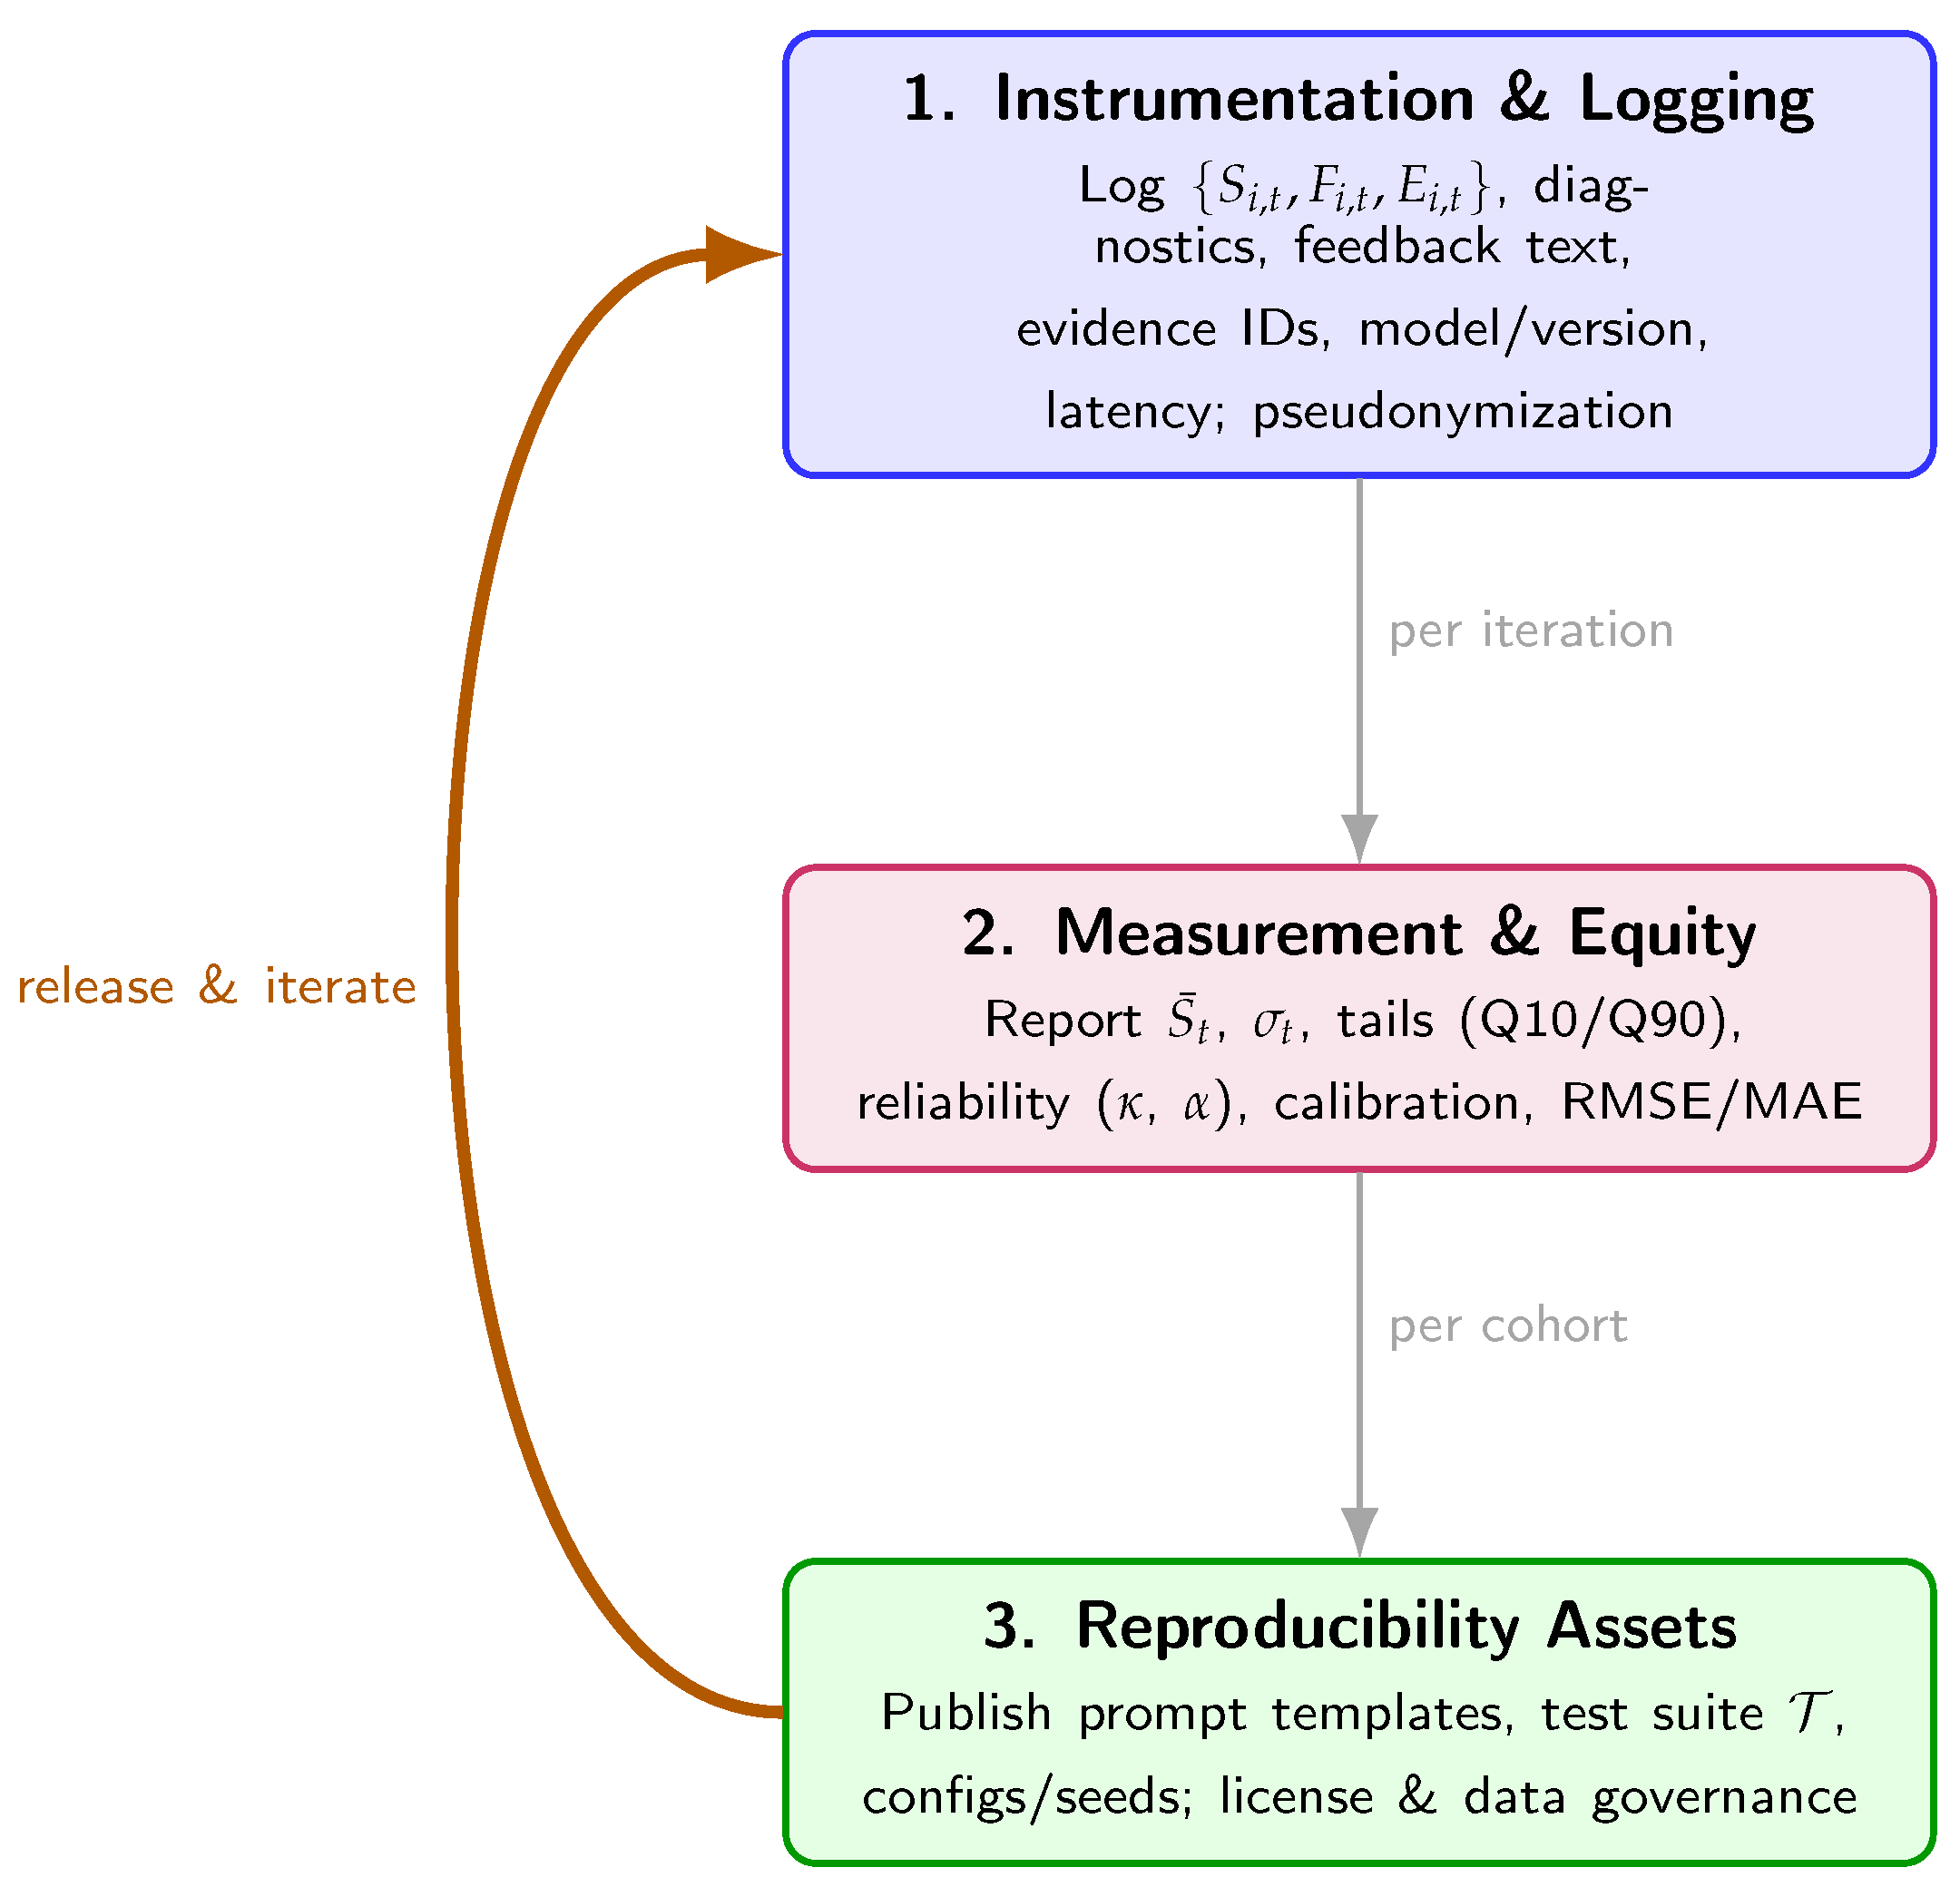
Implementation note for Algorithms readers (text-only guidance). Treat the pipeline as auditable: log every update with full provenance (submission inputs, diagnostics, feedback text, evidence citations, , model/versioning, latency); report cohort dispersion and tail shares alongside means with reliability (, ) and calibration; and publish reproducibility assets—prompt templates, the test suite , and configuration files with seeds and versions—under an institutional or research license with appropriate anonymization.
Figure 8.
Implementation roadmap for deploying the discrete-time assessment–feedback system: instrumentation and logging, measurement with equity metrics, and release of reproducibility assets.
Figure 8.
Implementation roadmap for deploying the discrete-time assessment–feedback system: instrumentation and logging, measurement with equity metrics, and release of reproducibility assets.
6. Conclusions
This study formalized AI-assisted dynamic assessment as an explicit, discrete-time algorithm and validated it in higher education. Across six assessment iterations in a Concurrent Programming course (), cohort performance rose from to points while dispersion fell from to points (0–100 scale), evidencing simultaneous gains in central tendency and equity (Section 4; Figure 4, Figure 5, Table 2). These empirical patterns are consistent with an algorithmic feedback loop in which higher feedback quality contracts the gap to target at each iteration and progressively narrows within-cohort differences.
Methodologically, three complementary formulations—the linear-difference update, the logistic convergence model, and the relative-gain regression—yielded interpretable parameters that link feedback quality to the pace and magnitude of improvement. Estimates in Table 1 indicate that higher-quality, evidence-grounded feedback is associated with larger next-step gains (positive ), faster multiplicative contraction of the residual gap (positive within the stable regime), and a greater fraction of the gap closed per iteration (positive ). Together with repeated-measures ANOVA (Table 3), these findings support an algorithmic account of learning where feedback operates as a measurable accelerator under realistic classroom conditions.
Practically, the framework shows how agentic RAG—backed by standardized connectors to course artifacts, rubrics, and exemplars—can deliver scalable, auditable feedback that both improves outcomes and reduces dispersion. Treating assessment as an instrumented, discrete-time pipeline enables reproducible measurement of progress (means, convergence) and equity (dispersion, tails), and exposes actionable levers for platform designers: modulating feedback intensity, timing, and evidence grounding based on predicted gains and observed responsiveness.
The work has limitations typical of a single-course longitudinal study: one domain and one institution with a moderate sample. Generalization to other disciplines and institutional contexts requires multi-site replications with larger cohorts. Stronger causal identification would benefit from randomized or stepped-wedge designs comparing feedback pathways or grounding strategies, and production deployments should incorporate fairness-aware objectives and cost–latency analysis to ensure sustainable scaling.
In sum, framing assessment and feedback as an explicit, data-driven algorithm clarifies why and how feedback quality matters for both the speed (convergence rate) and the equity (variance contraction) of learning. The models and evidence presented here provide a reproducible basis for designing, monitoring, and improving AI-enabled assessment loops in large EdTech settings, with direct implications for scalable personalization and outcome equity in digital higher education.
Author Contributions
Conceptualization, R.J. and A.H.; methodology, C.B.; software and data analysis, R.J. and C.B.; theoretical framework and literature review, A.H. and D.M.; writing—original draft, R.J. and A.H.; writing review and editing, C.B. and D.M.; supervision, R.J. and A.H.
Funding
This work was supported by the Universidad de Jaén through its Teaching Innovation Plan (PID-UJA 2025–2029), under the Teaching Innovation Project “Diseño de entornos neurosaludables y afectivos en la universidad: prácticas neurodidácticas para la conexión docente–estudiante” (Project reference: PID2025_24 UJA), funded by the Vicerrectorado de Formación Permanente, Tecnologías Educativas e Innovación Docente.
Institutional Review Board Statement
This work is part of the research line titled Neuroscience, Neuroeducation, and Neurodidactics. Multiculturalism, Interculturalism, Intraculturalism, and Transculturalism. Sustainability in Education. The study was conducted in accordance with the Declaration of Helsinki and was approved by the Research Ethics Committee (Comité Ético de Investigación) of the Universidad de Jaén (Spain); approval code JUL.22/4-LÍNEA.
Informed Consent Statement
Informed consent was obtained from all subjects involved in the study.
Data Availability Statement
Data available from the corresponding author upon reasonable request.
Acknowledgments
We thank the participating students and the Universidad de Jaén for supporting the innovation project under which this research was conducted.
Conflicts of Interest
The authors declare no conflict of interest.
References
- Ogunleye, B.; Zakariyyah, K.I.; Ajao, O.; Olayinka, O.; Sharma, H. A Systematic Review of Generative AI for Teaching and Learning Practice. Education Sciences 2024, 14, 636. [Google Scholar] [CrossRef]
- Wang, S.; Wang, F.; Zhu, Z.; Wang, J.; Tran, T.; Du, Z. Artificial intelligence in education: A systematic literature review. Expert Systems with Applications 2024, 252, 124167. [Google Scholar] [CrossRef]
- Li, K.; Zheng, L.; Chen, X. Automated Feedback Systems in Higher Education: A Meta-Analysis. Computers & Education 2023, 194, 104676. [Google Scholar] [CrossRef]
- Jauhiainen, J.S.; Garagorry Guerra, A. Generative AI in education: ChatGPT-4 in evaluating students’ written responses. Innovations in Education and Teaching International 2024. [Google Scholar] [CrossRef]
- Cingillioglu, I.; Gal, U.; Prokhorov, A. AI-experiments in education: An AI-driven randomized controlled trial for higher education research. Education and Information Technologies 2024, 29, 19649–19677. [Google Scholar] [CrossRef]
- Fan, W.; et al. A Survey on RAG Meeting LLMs: Towards Retrieval-Augmented LLMs. ACM Computing Surveys 2024. [Google Scholar] [CrossRef]
- Gupta, S.; et al. Comprehensive Survey of Retrieval-Augmented Generation (RAG): Evolution, Current Landscape and Future Directions. arXiv 2024, arXiv:2410.12837. [Google Scholar]
- Asai, A.; Wu, Z.; Wang, Y.; Sil, A.; Hajishirzi, H. Self-RAG: Learning to Retrieve, Generate, and Critique through Self-Reflection. arXiv 2023, arXiv:2310.11511. [Google Scholar] [CrossRef]
- Yao, S.; et al. ReAct: Synergizing Reasoning and Acting in Language Models. In Proceedings of the International Conference on Learning Representations (ICLR 2023), 2023. [CrossRef]
- Keuning, H.; Jeuring, J.; Heeren, B. A Systematic Literature Review of Automated Feedback Generation for Programming Exercises. ACM Transactions on Computing Education 2019, 19. [Google Scholar] [CrossRef]
- Jacobs, S.; Jaschke, S. Evaluating the Application of Large Language Models to Generate Feedback in Programming Education. arXiv 2024, arXiv:2403.09744. [Google Scholar] [CrossRef]
- Nguyen, H.; Stott, N.; Allan, V. Comparing Feedback from Large Language Models and Instructors: Teaching Computer Science at Scale. In Proceedings of the Proceedings of the Eleventh ACM Conference on Learning @ Scale (L@S ’24), New York, NY, USA, 2024. [CrossRef]
- Koutcheme, C.; Hellas, A. Propagating Large Language Models Programming Feedback. In Proceedings of the Proceedings of the 11th ACM Conference on Learning at Scale (L@S ’24), Atlanta, GA, USA, 2024, pp. 366-370. [CrossRef]
- Heickal, H.; et al. Generating Feedback-Ladders for Logical Errors in Programming with LLMs. In Proceedings of the Proceedings of the 17th International Conference on Educational Data Mining (EDM 2024) – Posters.
- Banihashem, S.K.; et al. Feedback sources in essay writing: peer-generated or AI-generated? International Journal of Educational Technology in Higher Education 2024, 21. [Google Scholar] [CrossRef]
- Abdelrahman, G.; Wang, Q.; Nunes, B.P.; other collaborators. Knowledge Tracing: A Survey. ACM Computing Surveys 2023, 55. [Google Scholar] [CrossRef]
- Song, X.; et al. A Survey on Deep Learning-Based Knowledge Tracing. Knowledge-Based Systems 2022, 258, 110036. [Google Scholar] [CrossRef]
- Yin, Y.; et al. Tracing Knowledge Instead of Patterns: Stable Knowledge Tracing with Diagnostic Transformer. In Proceedings of the Proceedings of the ACM Web Conference 2023 (WWW ’23). ACM, 2023, pp. 855–864. [CrossRef]
- Liu, T.; et al. Transformer-based Convolutional Forgetting Knowledge Tracking. Scientific Reports 2023, 13, 19112. [Google Scholar] [CrossRef] [PubMed]
- Zhou, T.; et al. Multi-Granularity Time-based Transformer for Student Performance Prediction. arXiv 2023, arXiv:2304.05257. [Google Scholar]
- van der Kleij, F.M.; Feskens, R.C.W.; Eggen, T.J.H.M. Effects of Feedback in a Computer-Based Learning Environment on Students’ Learning Outcomes: A Meta-Analysis. Review of Educational Research 2015, 85, 475–511. [Google Scholar] [CrossRef]
- Hattie, J.; Timperley, H.; Brown, G. Feedback in the Age of AI: Revisiting Foundational Principles. Educational Psychology Review 2023, 35, 1451–1475. [Google Scholar] [CrossRef]
- Gao, L.; Zhang, J. Automated Feedback Generation for Programming Assignments Using Transformer-Based Models. IEEE Transactions on Education 2022, 65, 203–212. [Google Scholar] [CrossRef]
- Chen, Y.; Huang, Y.; Xu, D. Intelligent Feedback in Programming Education: Trends and Challenges. ACM Transactions on Computing Education 2024, 24, 15–1. [Google Scholar] [CrossRef]
- Dai, W.; Lin, J.; Jin, F.; Li, T.; Tsai, Y.; Gašević, D.; Chen, G. Assessing the Proficiency of Large Language Models in Automatic Feedback Generation: An Evaluation Study. Computers and Education: Artificial Intelligence 2024, 5, 100234. [Google Scholar] [CrossRef]
- Lewis, P.; Perez, E.; Piktus, A.; Petroni, F.; Karpukhin, V.; Goyal, N.; Küttler, H.; Lewis, M.; Yih, W.t.; Rocktäschel, T.; et al. Retrieval-Augmented Generation for Knowledge-Intensive NLP Tasks. In Proceedings of the Advances in Neural Information Processing Systems 33 (NeurIPS 2020), 2020.
| 1 | Scores were normalized to with and for estimation; descriptive figures are presented on a 0–100 scale. |
| 2 | Fitted curve (0–100 scale): . Evaluations at are , closely matching the observed means. |
Figure 1.
Algorithmic framing of assessment and feedback. (a) Student-level loop: performance is updated to through targeted feedback of quality . (b) Two complementary discrete-time models: a linear-difference update and a logistic update used to analyze convergence rates, sensitivity to feedback quality, and variance dynamics.
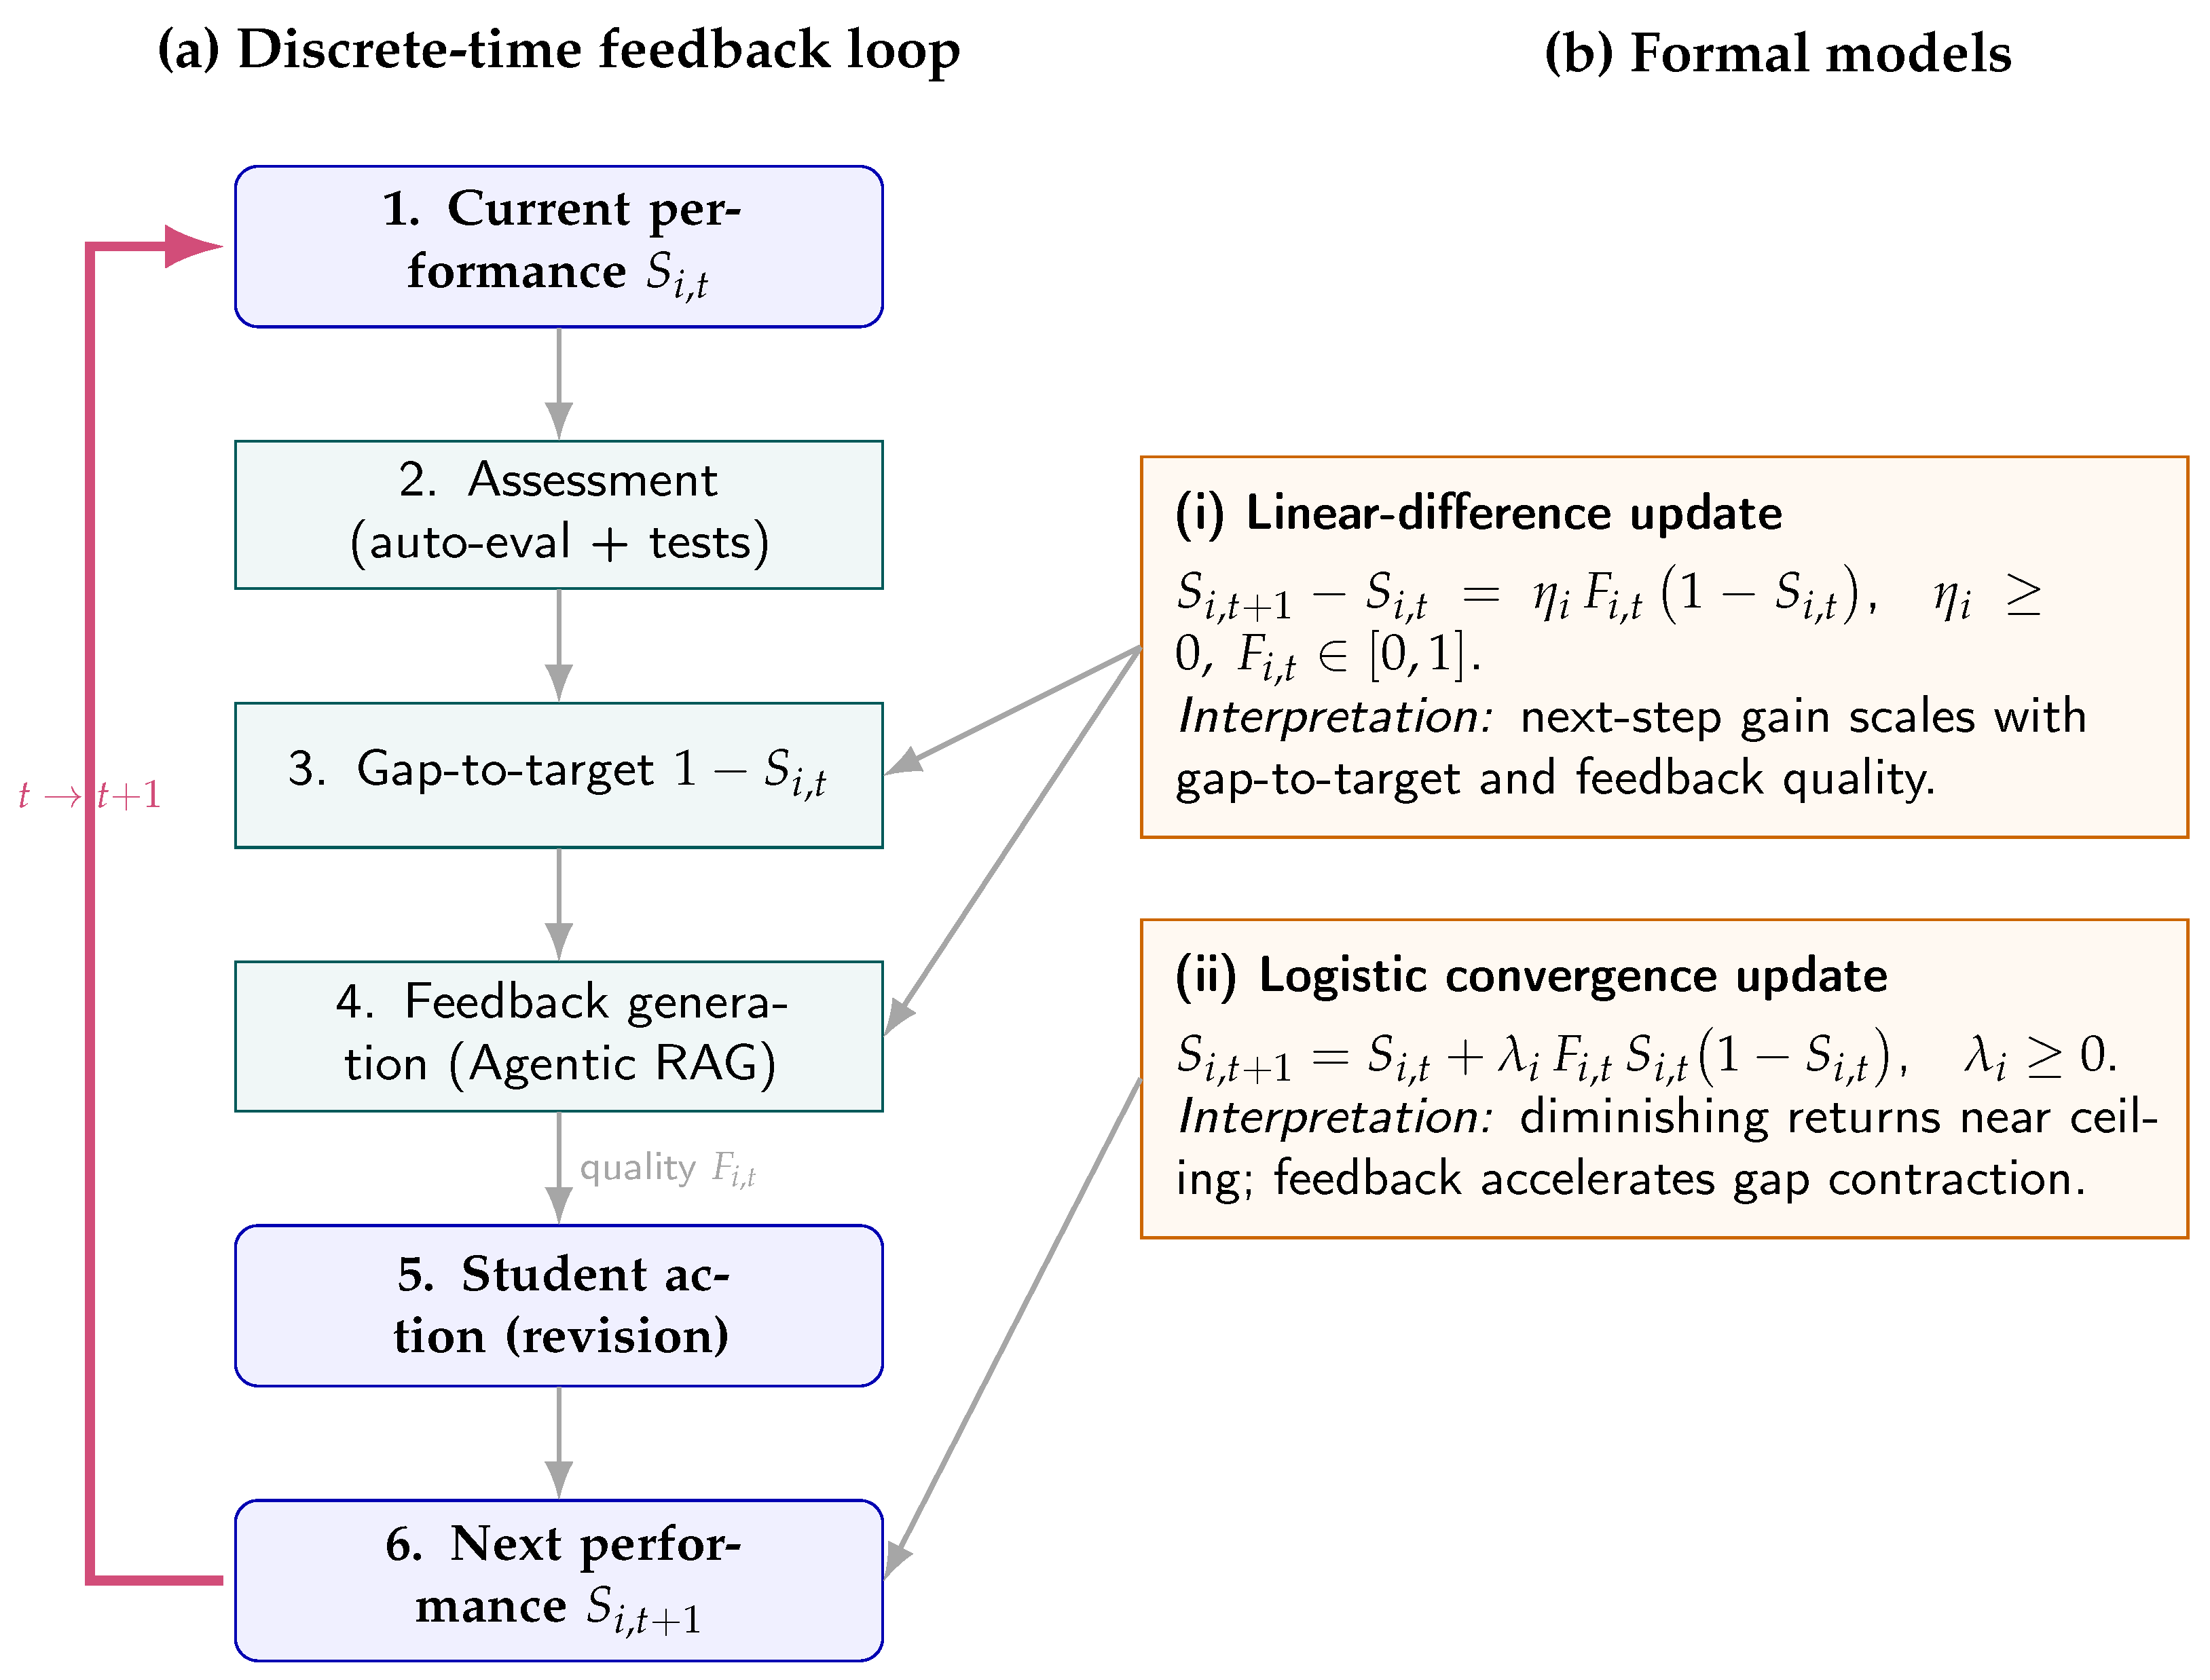
Figure 4.
Average cohort trajectory across six iterations (0–100 scale). Points: observed means with 95% CIs; dashed curve: shifted-logistic fit closely matching observed means.
Figure 4.
Average cohort trajectory across six iterations (0–100 scale). Points: observed means with 95% CIs; dashed curve: shifted-logistic fit closely matching observed means.
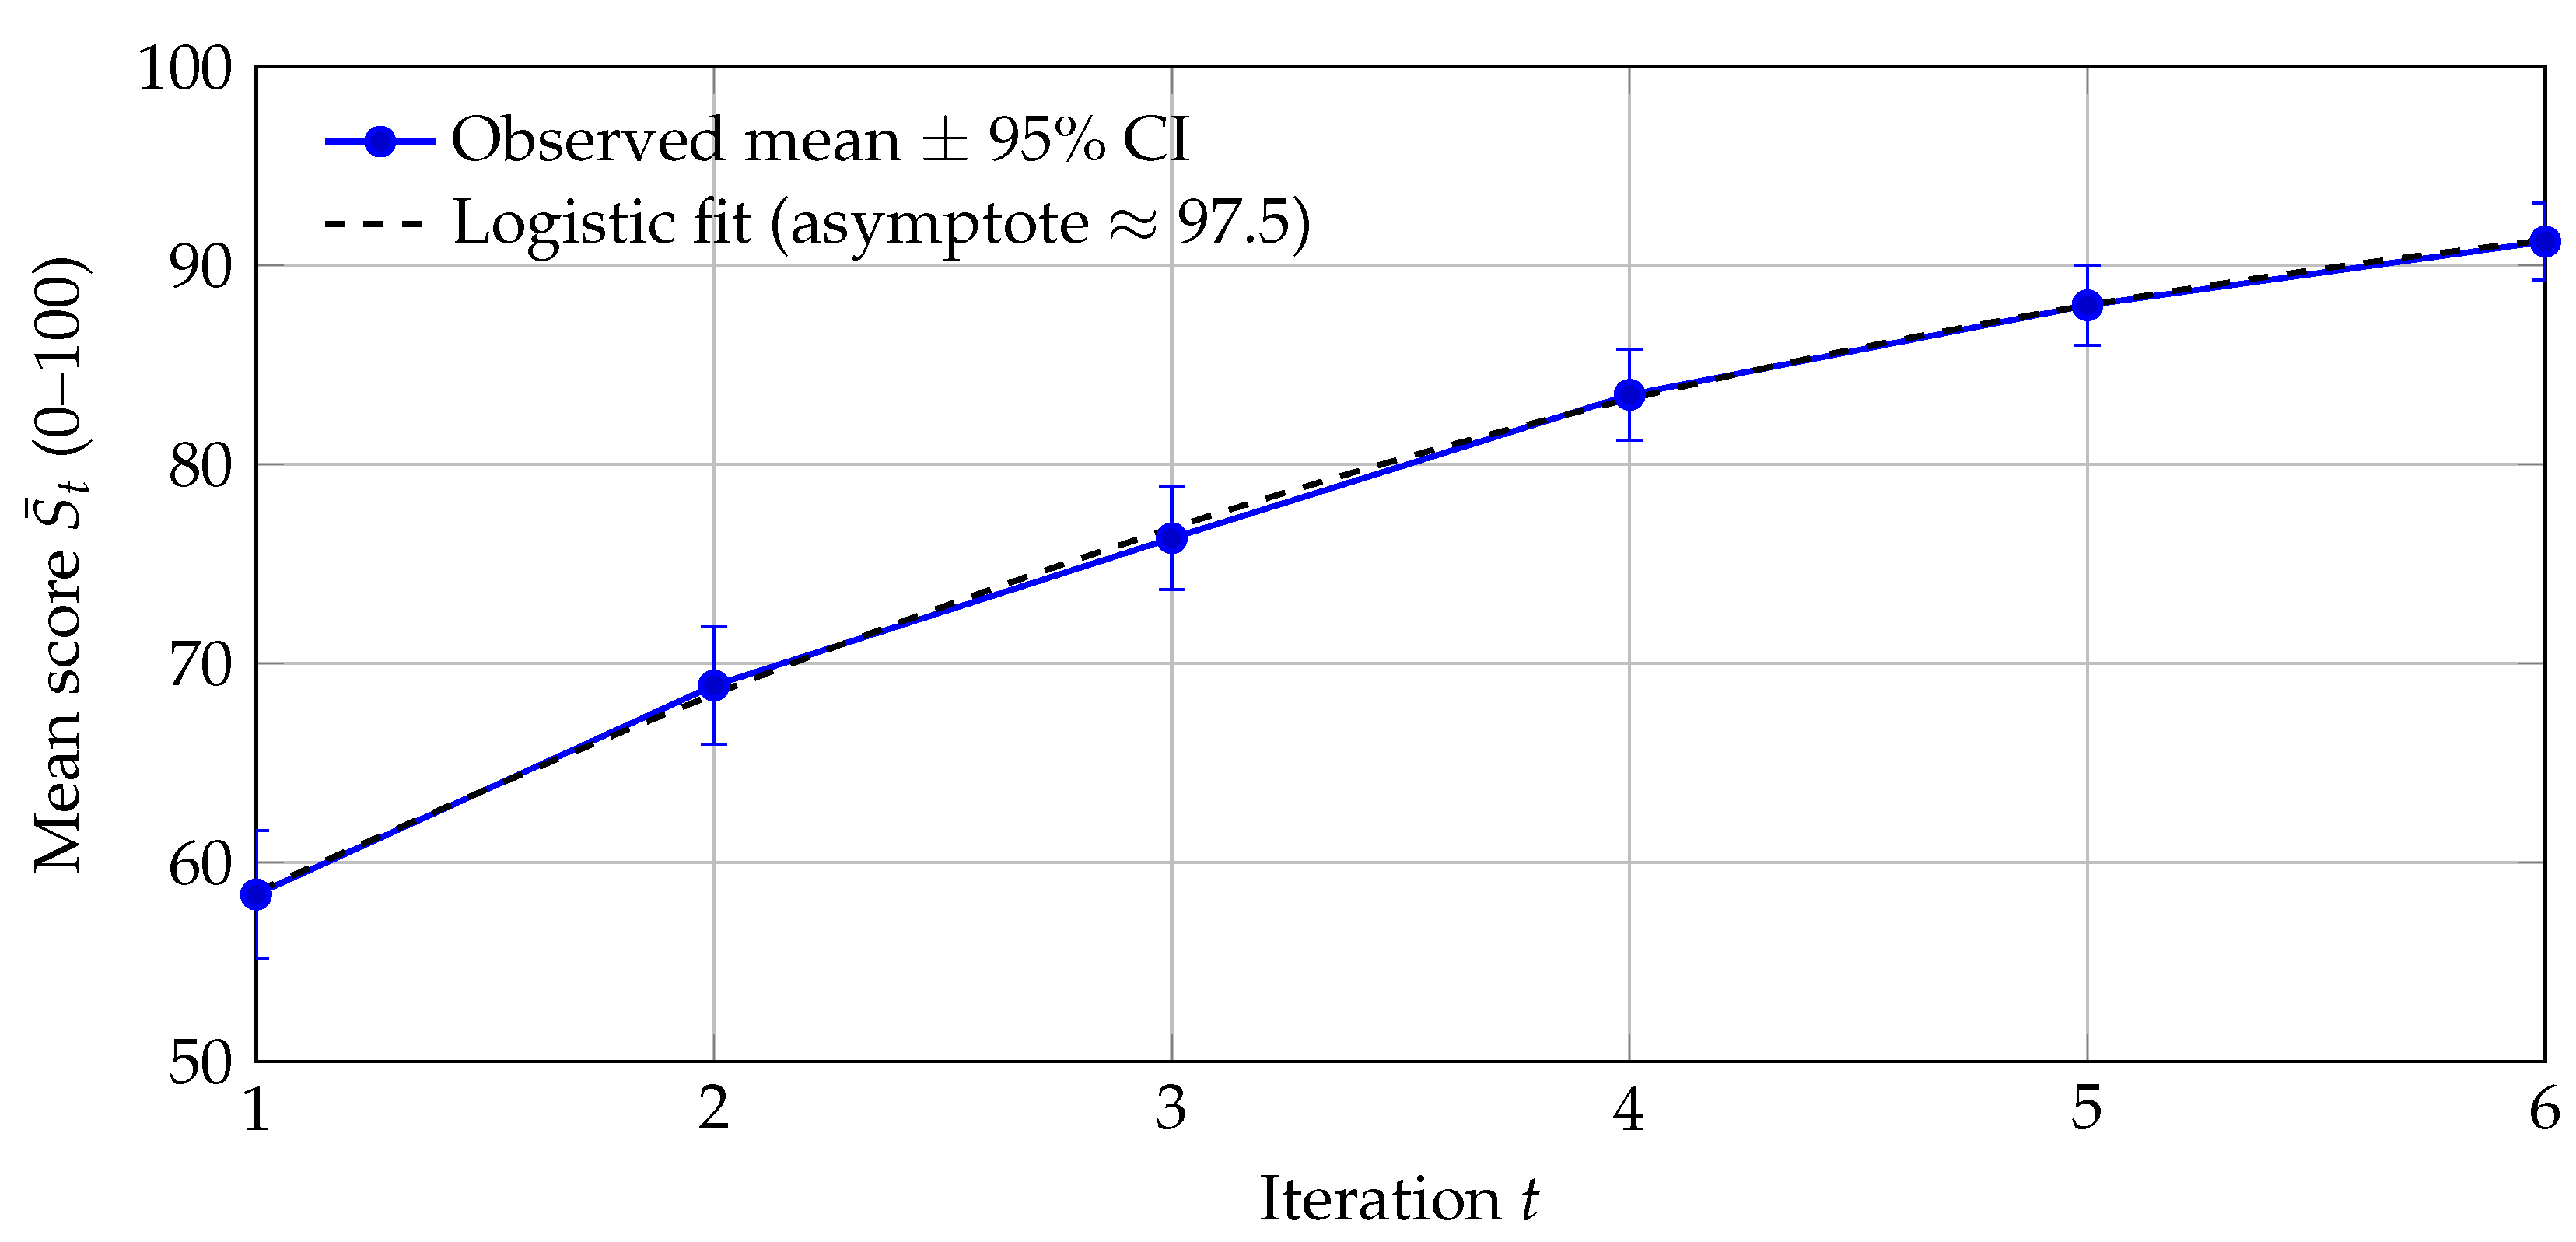
Figure 5.
Variance dynamics across iterations (0–100 scale). Dispersion decreases as feedback cycles progress, consistent with the contraction result in Corollary 1.
Figure 5.
Variance dynamics across iterations (0–100 scale). Dispersion decreases as feedback cycles progress, consistent with the contraction result in Corollary 1.
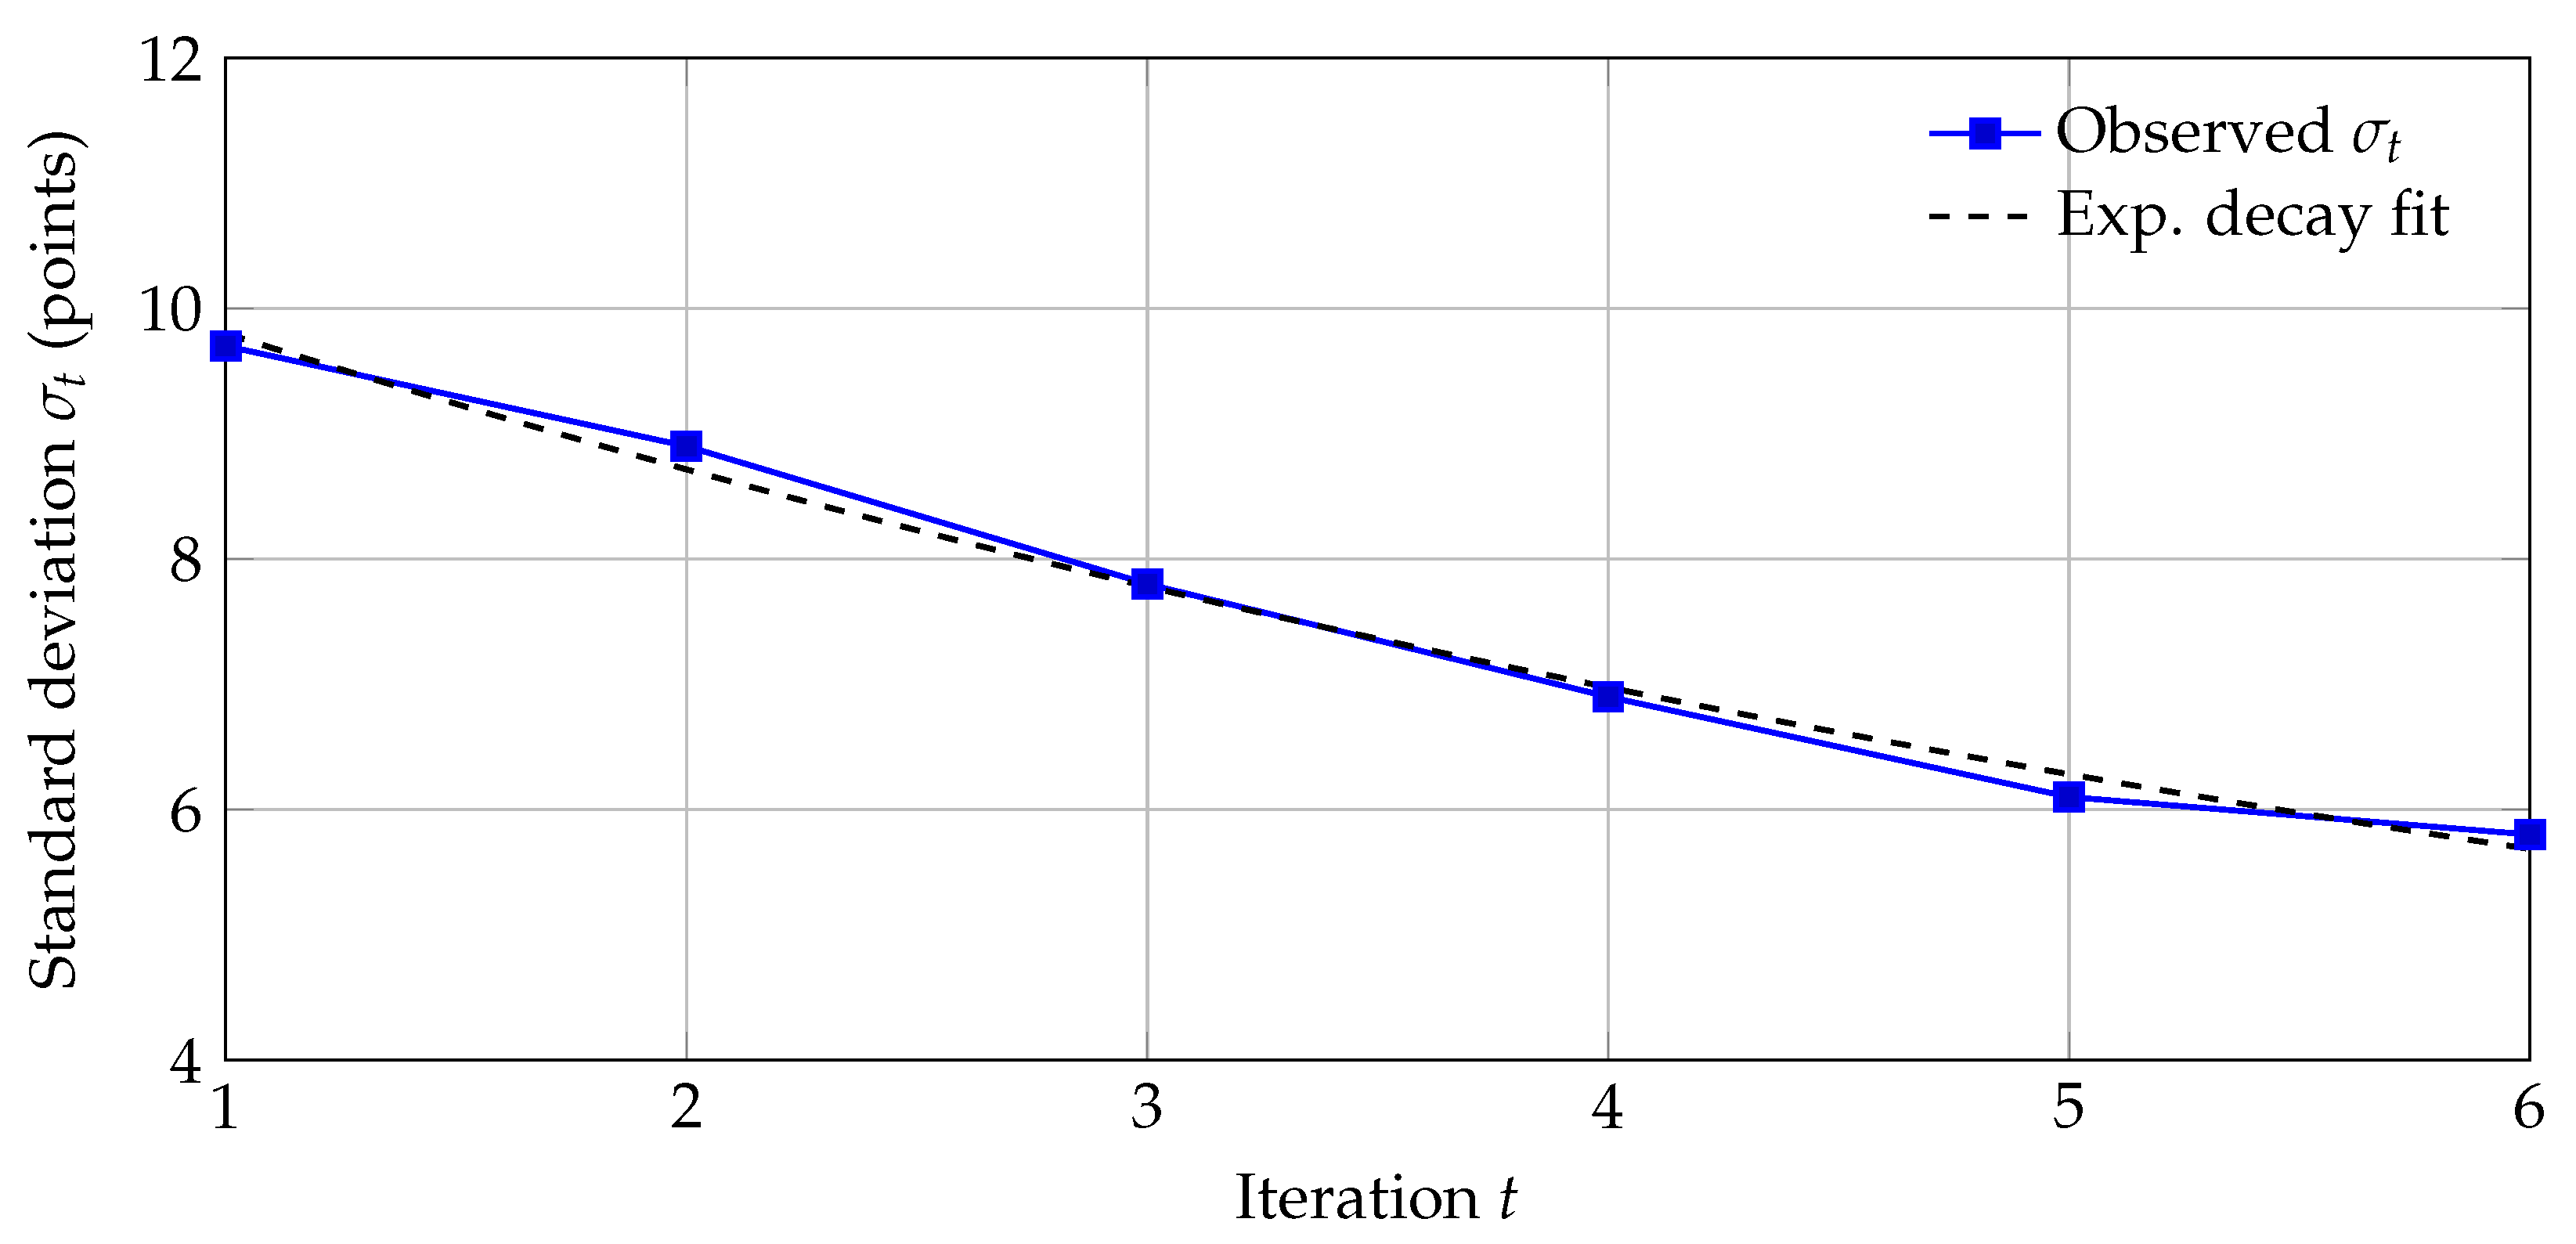
Figure 6.
Simulated individual trajectories for three sensitivity profiles with constant feedback quality and .
Figure 6.
Simulated individual trajectories for three sensitivity profiles with constant feedback quality and .
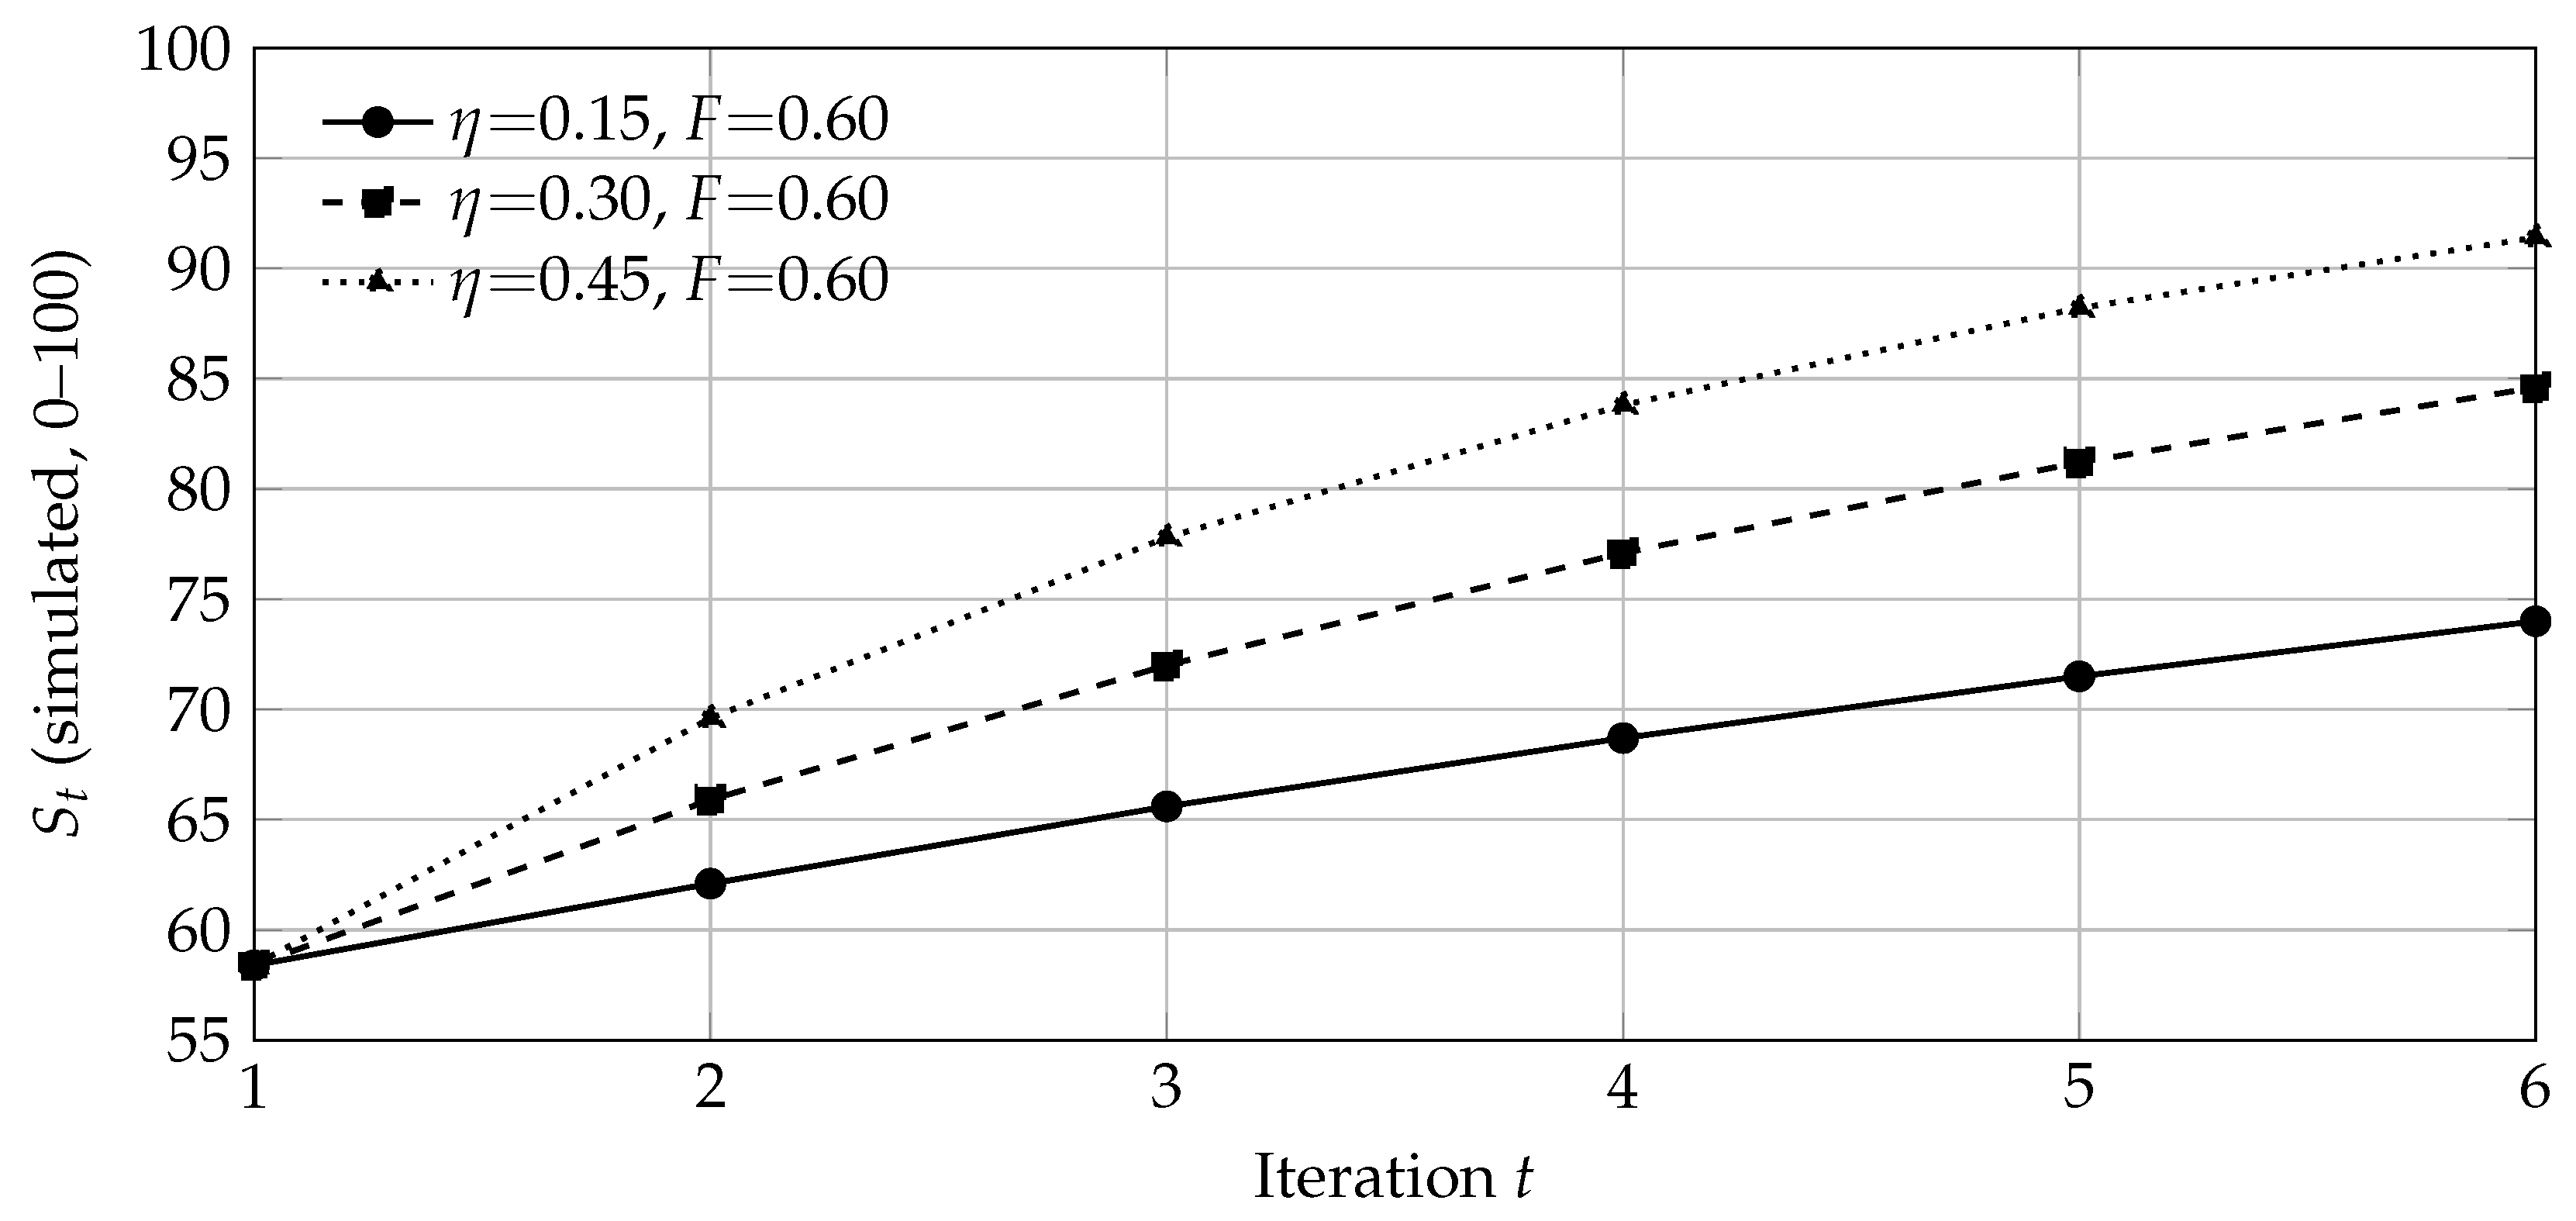

Table 1.
Parameter estimates for the linear-difference, logistic-convergence, and relative-gain models. Values reflect cohort-level summaries of student-level estimates (see Methods).
Table 1.
Parameter estimates for the linear-difference, logistic-convergence, and relative-gain models. Values reflect cohort-level summaries of student-level estimates (see Methods).
| Model | Parameter | Estimate | SE | 95% CI | Notes | |
|---|---|---|---|---|---|---|
| Linear difference | (mean) | 0.320 | 0.060 | 0.203 | 0.437 | Mixed-effects NLS; |
| Logistic convergence | (mean) | 0.950 | 0.150 | 0.656 | 1.244 | ; |
| Relative gain | (effect of F) | 0.280 | 0.070 | 0.143 | 0.417 | LMM, student RE; |
Table 2.
Descriptive statistics by iteration (0–100 scale). 95% CIs computed as with .
| Iteration t | Mean | SD | 95% CI | |
|---|---|---|---|---|
| 1 | 58.4 | 9.7 | 55.2 | 61.6 |
| 2 | 68.9 | 8.9 | 66.0 | 71.9 |
| 3 | 76.3 | 7.8 | 73.7 | 78.9 |
| 4 | 83.5 | 6.9 | 81.2 | 85.8 |
| 5 | 88.0 | 6.1 | 86.0 | 90.0 |
| 6 | 91.2 | 5.8 | 89.3 | 93.1 |
Table 3.
Repeated-measures ANOVA across six iterations (scores on 0–100 scale). Sphericity was violated; Greenhouse–Geisser (GG) correction applied.
Table 3.
Repeated-measures ANOVA across six iterations (scores on 0–100 scale). Sphericity was violated; Greenhouse–Geisser (GG) correction applied.
| Measure | Estimate / Result |
|---|---|
| Baseline mean ± SD () | |
| Final mean ± SD () | |
| Sphericity (Mauchly) | Violated () |
| Greenhouse–Geisser | |
| RM-ANOVA (GG-corrected) | , |
| Effect size (partial ) |
Table 4.
Five-fold cross-validation. Means and SDs across folds. Level-model errors on the scale.
| Gain LMM | Linear NLS RMSE | Logistic NLS RMSE | ||||
|---|---|---|---|---|---|---|
| Mean ± SD | 0.79 | 0.04 | 0.055 | 0.006 | 0.051 | 0.005 |
| Gain | Linear NLS MAE | Logistic NLS MAE | ||||
| Mean ± SD | — | 0.042 | 0.005 | 0.039 | 0.004 | |
Disclaimer/Publisher’s Note: The statements, opinions and data contained in all publications are solely those of the individual author(s) and contributor(s) and not of MDPI and/or the editor(s). MDPI and/or the editor(s) disclaim responsibility for any injury to people or property resulting from any ideas, methods, instructions or products referred to in the content. |
© 2025 by the authors. Licensee MDPI, Basel, Switzerland. This article is an open access article distributed under the terms and conditions of the Creative Commons Attribution (CC BY) license (http://creativecommons.org/licenses/by/4.0/).
Copyright: This open access article is published under a Creative Commons CC BY 4.0 license, which permit the free download, distribution, and reuse, provided that the author and preprint are cited in any reuse.


