
Submitted:
07 October 2025
Posted:
08 October 2025
You are already at the latest version
Abstract
Optimizing beneficiation processes of iron ore industry is essential to meet the increasing demand while coping with decreasing grade deposits. As grinding largely impacts the quality and production costs, the implementation of Advanced Process Control (APC) emerges as a solution to increase efficiency and operational stability. This study evaluates the improvements obtained with the application of an APC system in the ball griding circuit of the Mineração Usiminas industrial processing plant. The adopted methodology involved the collection and analysis of operational data with the system enabled and disabled, using statistical tests and literature review to support the analyses. The results indicate significant gains in throughput and stability. This work thus contributes to the assess the benefits of Advanced Process Control in an industrial operation.
Keywords:
comminution
; advanced process control
; iron ore
; griding and process optimization
1. Introduction
Natural resources play a fundamental role in sustaining industrial production chains on a global scale. Despite the challenges posed by the climate, economic and social aspects, their exploitation remains indispensable. In recent years, an increasing number of studies have been dedicated to a more sustainable and technically efficient exploration [1,2,3,4]. The growing global demand for raw materials contrasts with the gradual exhaustion of high-quality deposits, which makes process optimization an increasingly relevant guideline, both in the present and in future projections [5].
The grinding process represents a significant portion of the energy consumption of an industrial mineral processing plant and, consequently, of the processing cost [6]. The efficient operation of the grinding circuit directly influences both the overall metal recovery and the quality of the product obtained at the mill [7,8]. Although the relationship between overall recovery and product quality is typically inversely proportional, advanced process control strategies can improve these competing objectives while simultaneously improving the use of electrical energy [9,10]. Numerous studies, such as the work of [11,12,13,14,15] have confirmed that the implementation of Advanced Process Control - APC has resulted in significant improvements in the operation and performance of the grinding process.
The grinding circuit of Mineração Usiminas - MUSA operates with a basic PID (Proportional–Integral–Derivative) control strategy, whose main function is to control the level of the sump to avoid overflow. This approach prioritizes operational safety, but disregards the control of critical process variables, such as hydrocyclone feed pressure and pulp density.
This work aims to assess the performance of an advanced control strategy implemented in an industrial grinding circuit, in terms of stabilizing key operational variables, increasing circuit throughput, as well as reducing the specific energy consumption.
2. Grinding
Mineral processing plants generally includes comminution, which comprises of crushing and grinding operations. The comminution stage aims to reduce the size of the particles, for either liberating the selected minerals or adapting the particle size distribution to the requirements of subsequent processes [16]. On an industrial scale, grinding is predominantly carried out in tubular mills, which can be classified according to the type of grinding medium used: autogenous grinding (AG), in which the ore itself acts as a grinding medium; semi-autogenous grinding (SAG), which combines the use of ore with a fraction of steel grinding media; and rod or ball mills, in which fragmentation is promoted exclusively by metallic grinding bodies with a cylindrical or spherical shape, respectively [17].
Grinding is one of the most energy-intensive steps in mineral processing, accounting for about 30 to 50% of a plant's total energy [18,19,20]. Therefore, increasing the efficiency of this operation is crucial both for reducing operating costs and for mitigating the environmental impacts associated with power generation. In recent decades, driven by the advances of Industry 4.0, efforts have intensified in the development and application of automation and advanced control techniques aimed at increasing griding efficiency.
In the 1970s and 1980s, control systems applied to comminution were mostly based on relatively simple loops using PID controllers [21]. The advances in computer systems and the popularization of techniques such as fuzzy logic, artificial intelligence and neural networks, enhanced the developments of more robust specialist systems, capable of dealing with the dynamic complexity of grinding circuits [22,23].
The integration of advanced control into the grinding circuit aims to optimize variables such as circuit throughput, pulp dilution and hydrocyclones feed pressure. Chen et al. [22] highlighted the importance of controlling particle size distribution and the degree of particle liberation, which are key factors to maximize metal recovery in subsequent processing stages. Goubin et al. [23] reinforce that efficient grinding control is decisive for improving energy efficiency and concentrate quality. Zhou et al. [24], in a comprehensive review on control methods in griding, highlighted the relevance of hybrid approaches that combine historical data and process knowledge to ensure robust performance in industrial environments.
The integration of Industry 4.0 and Industrial Internet of Things (IIoT) technologies in mineral processing was discussed by Jämsä-Jounela [18], indicating a trend towards smarter, autonomous, and energy-efficient automation systems. Yamashita et al. [25] investigated multi-objective tuning techniques of Model Predictive Controllers (MPC) applied to the specific challenges of grinding circuits, such as slow dynamics and long dead times. Apelt and Thornihill [11] demonstrated that the application of well-tuned MPC can generate production increases of 1–2% per year, representing approximately US$ 1 million annually in copper beneficiation plants.
2.1. Grinding at Mineração Usiminas
Mineração Usiminas – MUSA, was created in 2010 as a joint venture between Usiminas and Sumitomo Corporation for producing iron ore concentrate to the Brazilian domestic market, as well as international markets [26]. Located in Itatiaiuçu, state of Minas Gerais, MUSA is currently the fifth largest iron ore producer in Brazil [27]. It includes four industrial mineral processing plants i.e. ITM West, ITM Samambaia, ITM Flotation and ITM East.
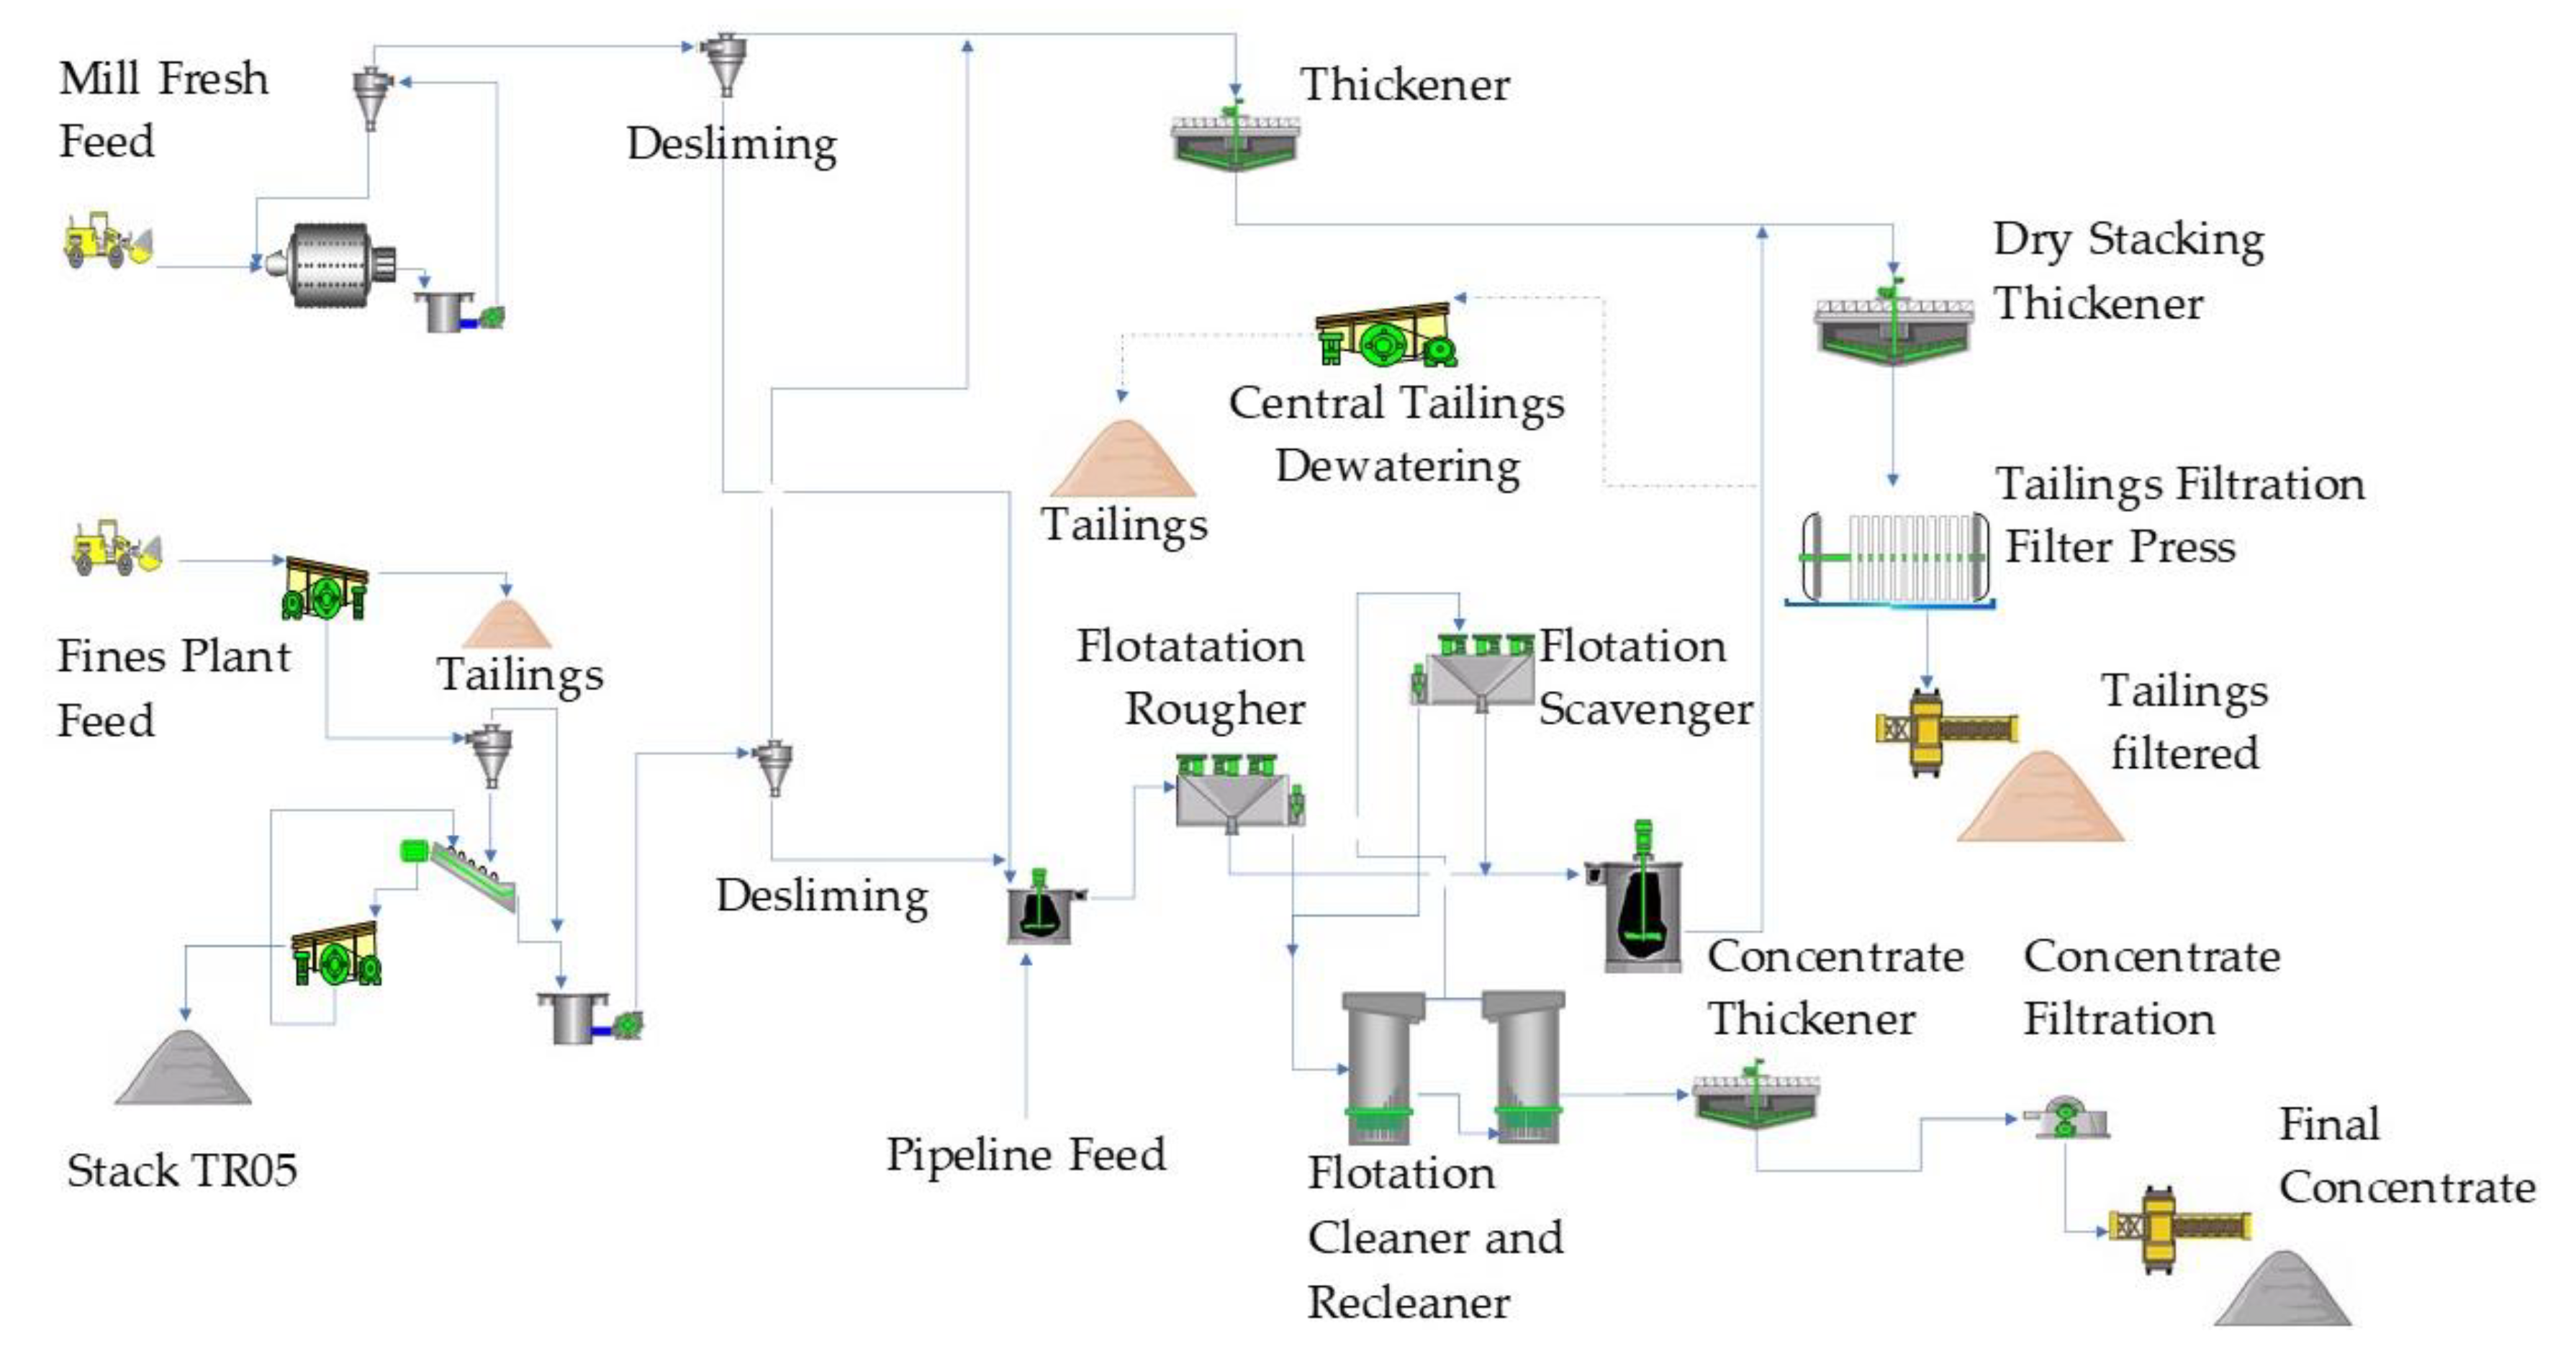
The ITM Flotation process flow sheet is shown in Figure . The plant feed comprises of the coarse tailings from the West and Samambaia ITM. The grinding circuit product is directed to desliming, followed by flotation, thickening and filtering. The flotation circuit operates with two parallel and independent lines, consisting of flotation cells and columns. Both tailings and concentrate are thickened and filtered before stacking.
Figure 1.
Simplified flow sheet of ITM Flotation at Usiminas processing plant.
The grinding circuit consists of a single CITIC ball mill of 5.8 m in diameter and 12.4 m in length, equipped with a 7.1 MW electric motor, operating at a rotational speed of 13.4 rpm, which corresponds to 75% of the respective critical speed at a 31% ball charge, the latter comprising of steel balls with 2.5 inches in diameter top size. The mill operates in a closed direct configuration with hydrocyclones. The circuit nominal throughput is 540 t/h of solids.
The fresh feed is conveyed to the ball mill feed, whose discharge flows onto a sump (CX-01), where water is added for achieving solids concentration in the range of 60–65%. The pulp is pumped (BP-01 or BP-02) to a 26-inch diameter hydrocyclone nest, all equipped with 8-inch vortex and 4.5-inch apex. The hydrocyclone nest combined underflow gravitates back to the ball mill feed, therefore consisting in the circulating load of the closed-circuit configuration. The circuit product consisting of the combined hydrocyclone nest overflow is directed to a dedicated sump (CX-02), from which it is pumped to de desliming circuit. In terms of size distribution, the circuit product specification is 92% passing of 0.150 mm, as well as a P80 (80% passing) of 0.106 mm.
The circuit monitoring is carried out by automatic instruments for measuring pulp density, pulp flowrate and pressure of the hydrocyclone feed, as well as ball mill speed. Sampling is conducted by automatic samplers in the overflow of the hydrocyclones, together with manual sampling of the mill fresh feed. Laboratory analyses include determination of Fe, SiO₂, P, Mn, Al₂O₃, PPC, TiO₂, MgO and CaO grades, in addition to particle size distributions.
2.2. Circuit Operation
Before the implementation of the APC system a few abnormal operating conditions were observed. A relatively frequent condition was the combination of very high circulating load (520%) together with a very high bypass in the hydrocyclones (72.5%), the latter referred to as the amount of fines returning to the ball mill, instead of directed to the grinding circuit product. The very high inefficiency in classification and very high flowrates around the hydrocyclone nest restricted the circuit throughput.
The absence of adequate pulp density control in CX-01 was also observed. The addition of water in CX-01 was regulated on the sump level basis, therefore disregarding the pulp density. As the sump level was set to 80% by water addition, it conflicted with the pump (BP-01 and 02) rotation speed, which was set for maintaining the same sump (CX-01) level at 20%. As a result, the pumps operated continuously at full speed, without reaching the proper pressures and densities in feeding the hydrocyclones.
The operational conditions described above were identified as the main factors limiting grinding circuit performance, and their adjustment is expected to increase overall throughput while ensuring consistent product quality.
3. Materials and Methods
The adaptative control approach was selected as the method for coping with the instability and challenging operating conditions occurring at the MUSA´s industrial grinding circuit. Accordingly, an APC system was developed and implemented, targeting a consistent higher overall performance of the plant. This section describes the strategy adopted for the application of the APC, the main parameters monitored, the architecture of the control system and the methods used to evaluate the performance of the grinding process.
3.1. BALL MILL ACE TM
Ball Mill ACE (Andritz Control Expert) is an advanced control and optimization solution for the ball griding circuits, focused on reducing process variability and adjusting the optimal operating points through layers of supervision and optimization. The ACE advanced control strategy is structured in two hierarchical levels. The first level aims to stabilize the process with Model Predictive Controllers (MPC) with the patented BrainWave® technology. The second level, composed of supervision and optimization logics implemented in the IDEAS™ & Metris™ platforms, was designed to optimize the process setpoints and manage the constraints and auxiliary controls necessary to maximize the performance of the grinding circuit.
BrainWave® controllers are predictive based on models implemented by state-space matrices derived from Laguerre's orthogonal basis functions [28]. In particular, BrainWave® includes a characteristic algorithm dedicated to multivariate processing, with long time constants, resulting in integrative responses, therefore surpassing the traditional approaches of expert systems or other controllers.
The IDEAS™ and Metris™ platforms are used for field signal processing and logic programming to manage the griding system, interacting directly with the various BrainWave® controllers and other process variables. The platforms generate setpoints, coordinate the activation of MPC controllers, interlocking logics, communication diagnosis, among other functions.
The ANDRITZ BrainWave® MPC, IDEAS™ Supervisory Control Logic, and ANDRITZ Metris™ Digital Solutions software, which make up the ACE system, were run on a dedicated server, provided by ANDRITZ, and integrated into the existing automation and process control network of the MUSA´s industrial grinding circuit through OLE Process Control (OPC) communication.
The control strategy was organized into three layers, highlighted in Figure by blue blocks. The first layer, represented in light blue, corresponds to the management of operational constraints, whose function is to preserve the integrity of the equipment and ensure the safe operation of the process. Included in the first layer are the control of the level of sump 01 (CX-01), the level of sump 02 (CX-02), the electric current of the BP01/02 pump motors, as well as the hydrocyclone feed pressure.
The second layer, represented in dark blue in Figure , covers the main controllers, dedicated to stabilizing the critical variables of the grinding and classification process. In this second layer, the following variables are controlled: the mill fresh feed throughput, the concentration of solids to the ball mill, the level of CX-01 and the hydrocyclone feed pulp density.
The third layer, indicated in even darker blue in Figure , is dedicated to process supervision and optimization. It includes three modules: (i) a fuzzy module for controlling the granulometry variable based on heuristic knowledge, (ii) a circuit throughput maximization module, activated when operating conditions are adequate, and (iii) a module for adding grinding media to the ball mill based on lower limit stipulated for power draw by the mill electric motor.
Figure 2.
Control strategy BALL MILL ACE – MUSA.
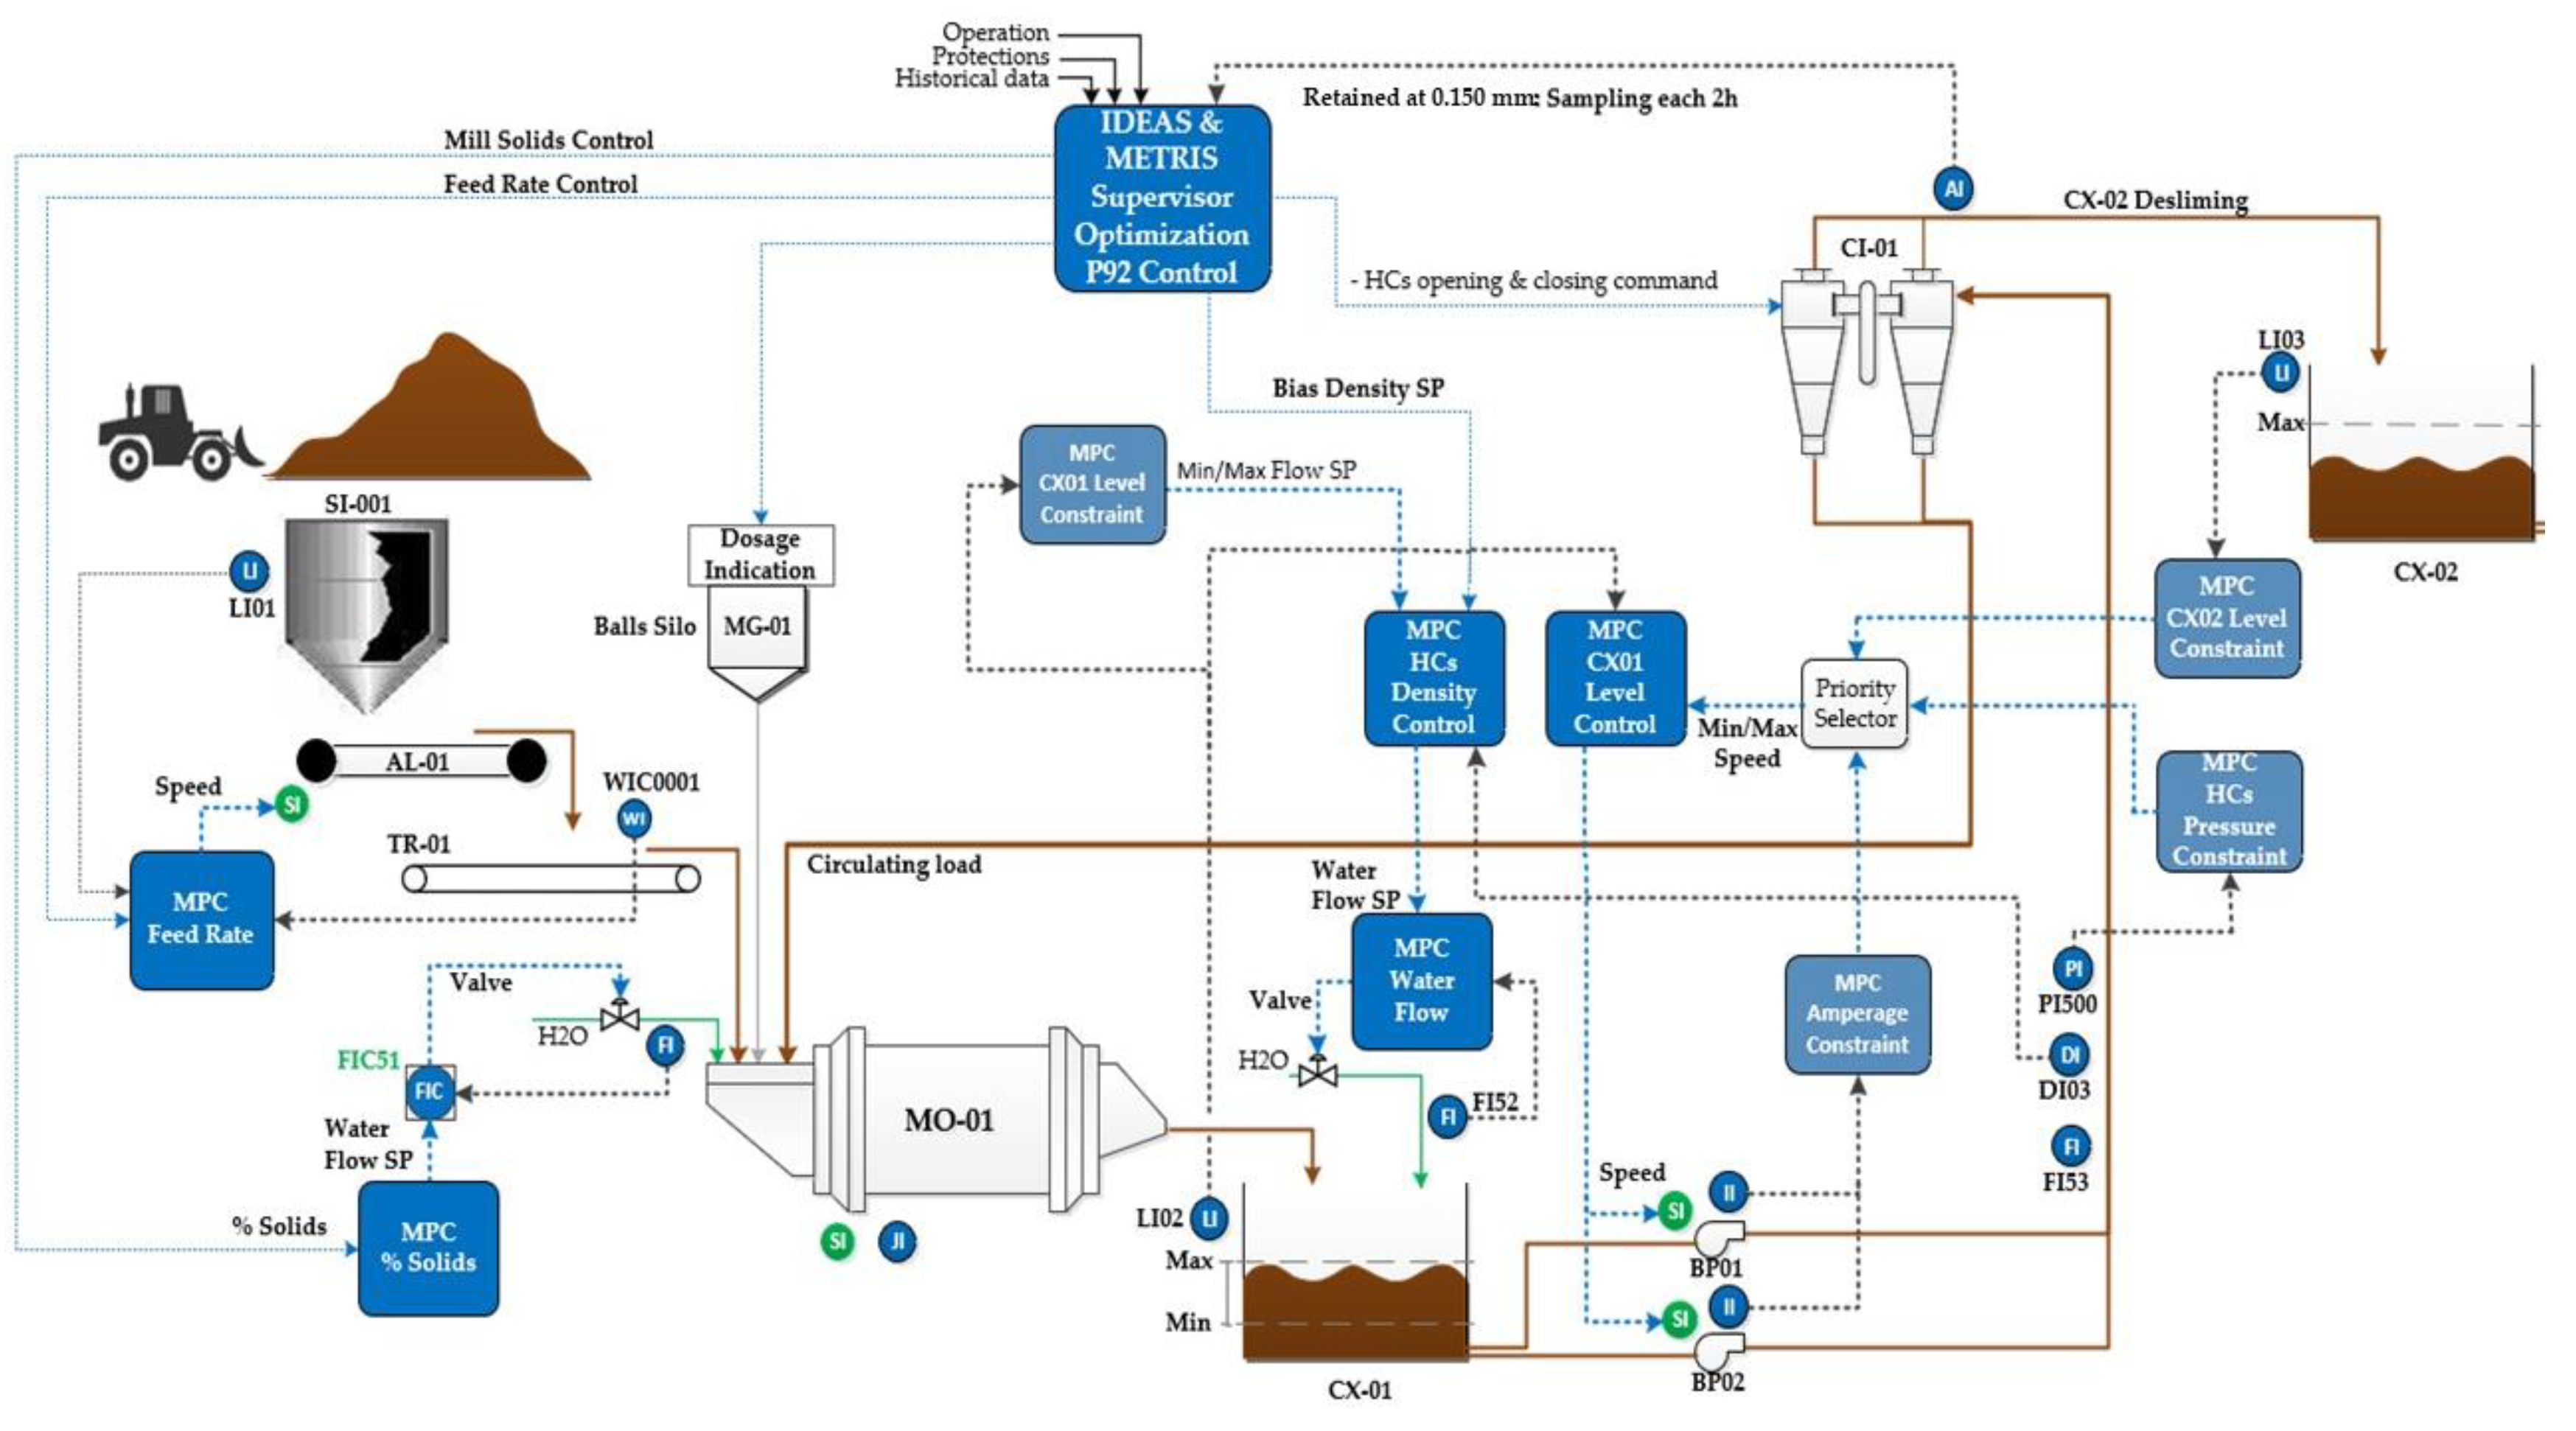
The multilayer APC strategy is designed for coordinated and efficient action on the process, ensuring operational safety, stability of critical variables, and continuous search for better performance. Constraint control acts directly on operational variables that must remain within strict limits. The main layer controls the process variables at the setpoints, while the supervision and optimization layer promote strategic adjustments aimed at maximizing circuit throughput and improving energy efficiency. The configuration of these layers was carried out in collaboration with the plant's process, automation, and operation teams. Table presents a summary of the loops involved in each layer, respective manipulated and controlled variables, and corresponding operational objectives, including the controllers of the BALL MILL ACE.

Table 1.
Summary of controlling levels of the APC installed at the Musa´s grinding circuit.
|
Control Layer |
Controlled Variable |
Objective |
Manipulated Variable |
Controller |
| Restriction | CX-01 level | Avoid overflow and emptying of CX-01 | Water addition to CX-01 |
MPC BrainWave® |
| CX-02 level | Avoid overflow of CX-02 |
Rotating speed of BP01 or BP02 |
MPC BrainWave® | |
| Hydrocyclone feed pressure | Ensure pressure within stipulated operating interval | Rotating speed of BP01 or BP02 |
MPC BrainWave® | |
| BP-01 e 02 electric current | Avoid damage to the electric motors | Rotating speed of BP01 or BP02 |
MPC BrainWave® | |
| Main | Circuit throughput | Keep the throughput steady | Feeder speed | MPC BrainWave® |
| Solids concentration in the mill | Keep the concentration in the setpoint | Water addition to the mill | Cascade of the MPC BrainWave® & PID | |
| Feed pulp density to hydrocyclones | Keep density steady | Water flowrate and water addition valve to CX-01 | Cascade of MPC BrainWave® Hydrocyclone feed density & CX-01 water addition flowrate |
|
| CX-01 level | Keep the level within the stipulated operating interval | Rotating speed of BP01 or BP02 |
MPC BrainWave® | |
|
Supervision and Optimization |
Product size distribution | Adjust the hydrocyclone cutting size | Bias of the density setpoint | Fuzzy Metris |
| Circuit throughput | Maximize throughput | Circuit feed setpoint | Expert IDEAS & Fuzzy Metris |
|
| Mill power draw | Keep the power draw within the stipulated operating interval | Amount of grinding media added to the mill | Fuzzy Metris |
3.2. Performance Testing
To evaluate the efficiency of the APC system with the BALL MILL ACE strategy in improving the operational stability and circuit throughput of the grinding process, a performance test was conducted based on the ON/OFF comparative method. The experiment was carried out over 67 days, consisting in weekly alternations between periods with the APC system activated (ON) and deactivated (OFF). This strategy was selected to reduce the effects of the natural variability of the plant's feed, ensuring comparable operating conditions between the two controlling scenarios.
The test was structured in five weeks under each control configuration (ON and OFF), according to previously defined operational assumptions with the objective of ensuring that both regimes worked within equivalent process ranges. Such assumptions, formalized in the project's technical documentation as described in this section, ensured consistency in the comparison between the selected scenarios, as well as isolating the effect of the multivariable control action on the main circuit variables.
The analysis included the following four main variables: (i) circuit throughput, (ii) hydrocyclone feed pulp density, (iii) product particle size distribution and (iv) size specific energy consumption. The circuit throughput and hydrocyclone feed pulp density were obtained directly from the plant's instrumentation system. The product size distribution derived from laboratory testing, while the size specific energy consumption was calculated.
Data were extracted using the PI DataLink tool, with a sampling time interval of 20 seconds. After collecting, the data were statistical treated for removing outliers and were later classified into the ON and OFF groups, as described in subsection 3.2.
The specific energy consumption was calculated based on the ratio between the mill power draw (kW) and the throughput (t/h) passing at 0.150 mm generated by the grinding, as expressed by Equation ( 1 ):
The specific energy consumption was selected for assessing the energy efficiency of the grinding process.
To assess the statistical significance of the differences between the ON and OFF scenarios of the APC system, a statistical inference analysis was conducted based on the sample distributions of the selected performance variables. Initially, the Shapiro-Wilk test was applied to verify the adherence of the data to the normal distribution, since this test is recognized for its sensitivity in small to moderate samples [29]. The assumed null hypothesis was that the data follows a normal distribution. However, in all the variables evaluated, the results indicated rejection of the null hypothesis (p-value < 0.05), showing that the analysed samples did not present sufficient evidence to guarantee statistical normality.
In view of this result, non-parametric statistical methods were adopted, which are more robust when the distribution of data does not meet the assumptions of normality. To evaluate possible differences in the median circuit throughput and specific energy consumption, the Mann-Whitney U test [30] was applied, suitable for comparisons between two independent samples. In the case of the analysis of variability, for comparing the standard deviation of the pulp density setpoint and the particle size of the product, Levene's test [31] was used, which allows the evaluation of the homogeneity of variances between groups.
Statistical comparisons were performed between the APC OFF scenario and three APC ON operational scenarios, the latter further detailed in the next section. Thus, for each performance variable, three sets of independent statistical tests were conducted, always comparing an ON scenario with the OFF scenario. In all analyses, the level of significance adopted was 5% (α = 0.05), and the p-values obtained guided the interpretation of the effects of the APC on the process parameters evaluated.
In addition to the experimental design with alternation between periods with the ON and OFF system, the performance test was conducted under controlled operating conditions, for ensuring comparison between the analysed scenarios. These conditions were: (i) circuit throughput equal to or greater than 450 tons per hour (tph), (ii) mill power draw higher than 5,500 kW, (iii) hydrocyclone feed pressure ranging between 0.7 kgf/cm² and 1.5 kgf/cm², (iv) hydrocyclone feed pulp density between 1.70 g/cm³and 1.90 g/cm³, and (v) simultaneous operation of five hydrocyclone units. Strict compliance with these conditions was essential to isolate the effect of the advanced control system and ensure the statistical validity of the obtained results.
3.3. Data Collection and Analysis
This section describes the methodology used in data collection and analysis of collected data. This step is essential to ensure the reliability of the results, eliminating external influences that may compromise the interpretation of the data and ensuring that the comparison between the scenarios with APC activated (ON) and deactivated (OFF) is accurate and representative of the operational reality. After the analysis, a total of 13 days were excluded from the database, essentially due to scheduled maintenance, ore feed out of specification.
Two filtering methods were applied on the database as follows:
The first filter, referred to as Base Filter, was applied to select the data representing steady periods of nominal operating conditions for the grinding circuit, whose limits were: throughput equal or higher than 450 tph for at least 10 minutes, and hydrocyclone feed pulp density equal or higher than 1.7 g/cm³ for at least 30 minutes.
The second filter, referred to as 3Std, was essentially a steadiness criterion, adopted as the variation of three standard deviations around the mean to eliminate outliers, without compromising the representativeness of stable periods. The sampling interval adopted was 20 seconds per collection point.
Table 1 shows the summary of data corresponding to APC ON and OFF periods, including the results of applied filtering criteria.
Table 1.
Summary of data for the OFF and ON periods.
| Criterion | Number of data | |
| Period OFF | Period ON | |
| Not filtered | 11,219,208 | 11,399,024 |
| Only Base Filter | 9,563,736 | 10,782,863 |
| Both Base Filter and 3STD Filter | 8,971,053 | 10,326,316 |
| Percent Base Filter and 3STD Filter | 79.96% | 90.59% |
The two data sets resulted from both Base Filter and 3STD Filter shown in Table 1 represented 28 full days of operation under the conditions of the APC ON and OFF control systems. They summed up more than 19 million data. The analysis of the process variables indicated trends that were associated with operational constraints on the stability of the control system. A critical constraint was the level of the CX-01. Accordingly, in the APC ON mode, the system imposes an automatic restriction when the CX-01 level exceeded 85% figure, for preventing sump overflow. However, this limitation directly affected the hydrocyclone feed pulp density control, resulting in severe limitations to maintain it in the set point, which in turn impacted on the hydrocyclones operation and consequently in increasing the circulating load. Another important source of operational instabilities in the same part of the circuit was the electric current of BP-01 and BP-02, as it limited the pump speed and therefore the respective pulp flowrate, for modulating the CX-01 pulp level.
Based on the above-described situations, the APC ON mode was divided into three operational scenarios, as follows:
DB_Geral: Dataset of the entire 28-day period.
DBCX1_OK: Dataset of the 9 days in which the level restriction of CX-01 acted on less than 35% of the daily operational time.
DBCX1_NOK: Dataset of the 19 days in which the level restriction of CX-01 acted on more than 35% of the daily operational time.
4. Results e Discussions
This chapter describes the results obtained from the comparisons between the APC OFF and APC ON selected periods, the latter including three operational scenarios, as discussed in the previous chapter. The four sections include individual analysis of the following variables: (i) grinding circuit throughput, (ii) hydrocyclone feed pulp density, (iii) grinding size and (iv) size specific energy consumption.
4.1. Circuit Throughput
The strategy of the APC BALL MILL ACE includes a module for maximizing circuit throughput. The adopted criterion is based on the stability of critical process variables. Accordingly, in situations where the selected parameters remain steady within the adopted operating limits, the system promotes gradual increases in throughput. Conversely, persisting operational instability and restrictions result in automatic reduction in throughput.
Figure 3 shows the effect of the APC implementation on circuit throughput. The upper chart (green) shows the process behaviour under APC OFF, where the feed rate presents higher variability and less consistent tracking of the setpoint. In contrast, the lower chart represents the APC ON (blue) condition, where the throughput distribution is concentrated at higher values, with clearer alignment to the feed rate setpoint. The shaded areas indicate days with reduced influence from the CX01 level constraint - DBCX1_OK, allowing a more direct comparison of the controller’s effectiveness.
Figure 3.
Variations of circuit throughput during the selected periods of APC OFF and APC ON - DB_GERAL.
Figure 3.
Variations of circuit throughput during the selected periods of APC OFF and APC ON - DB_GERAL.
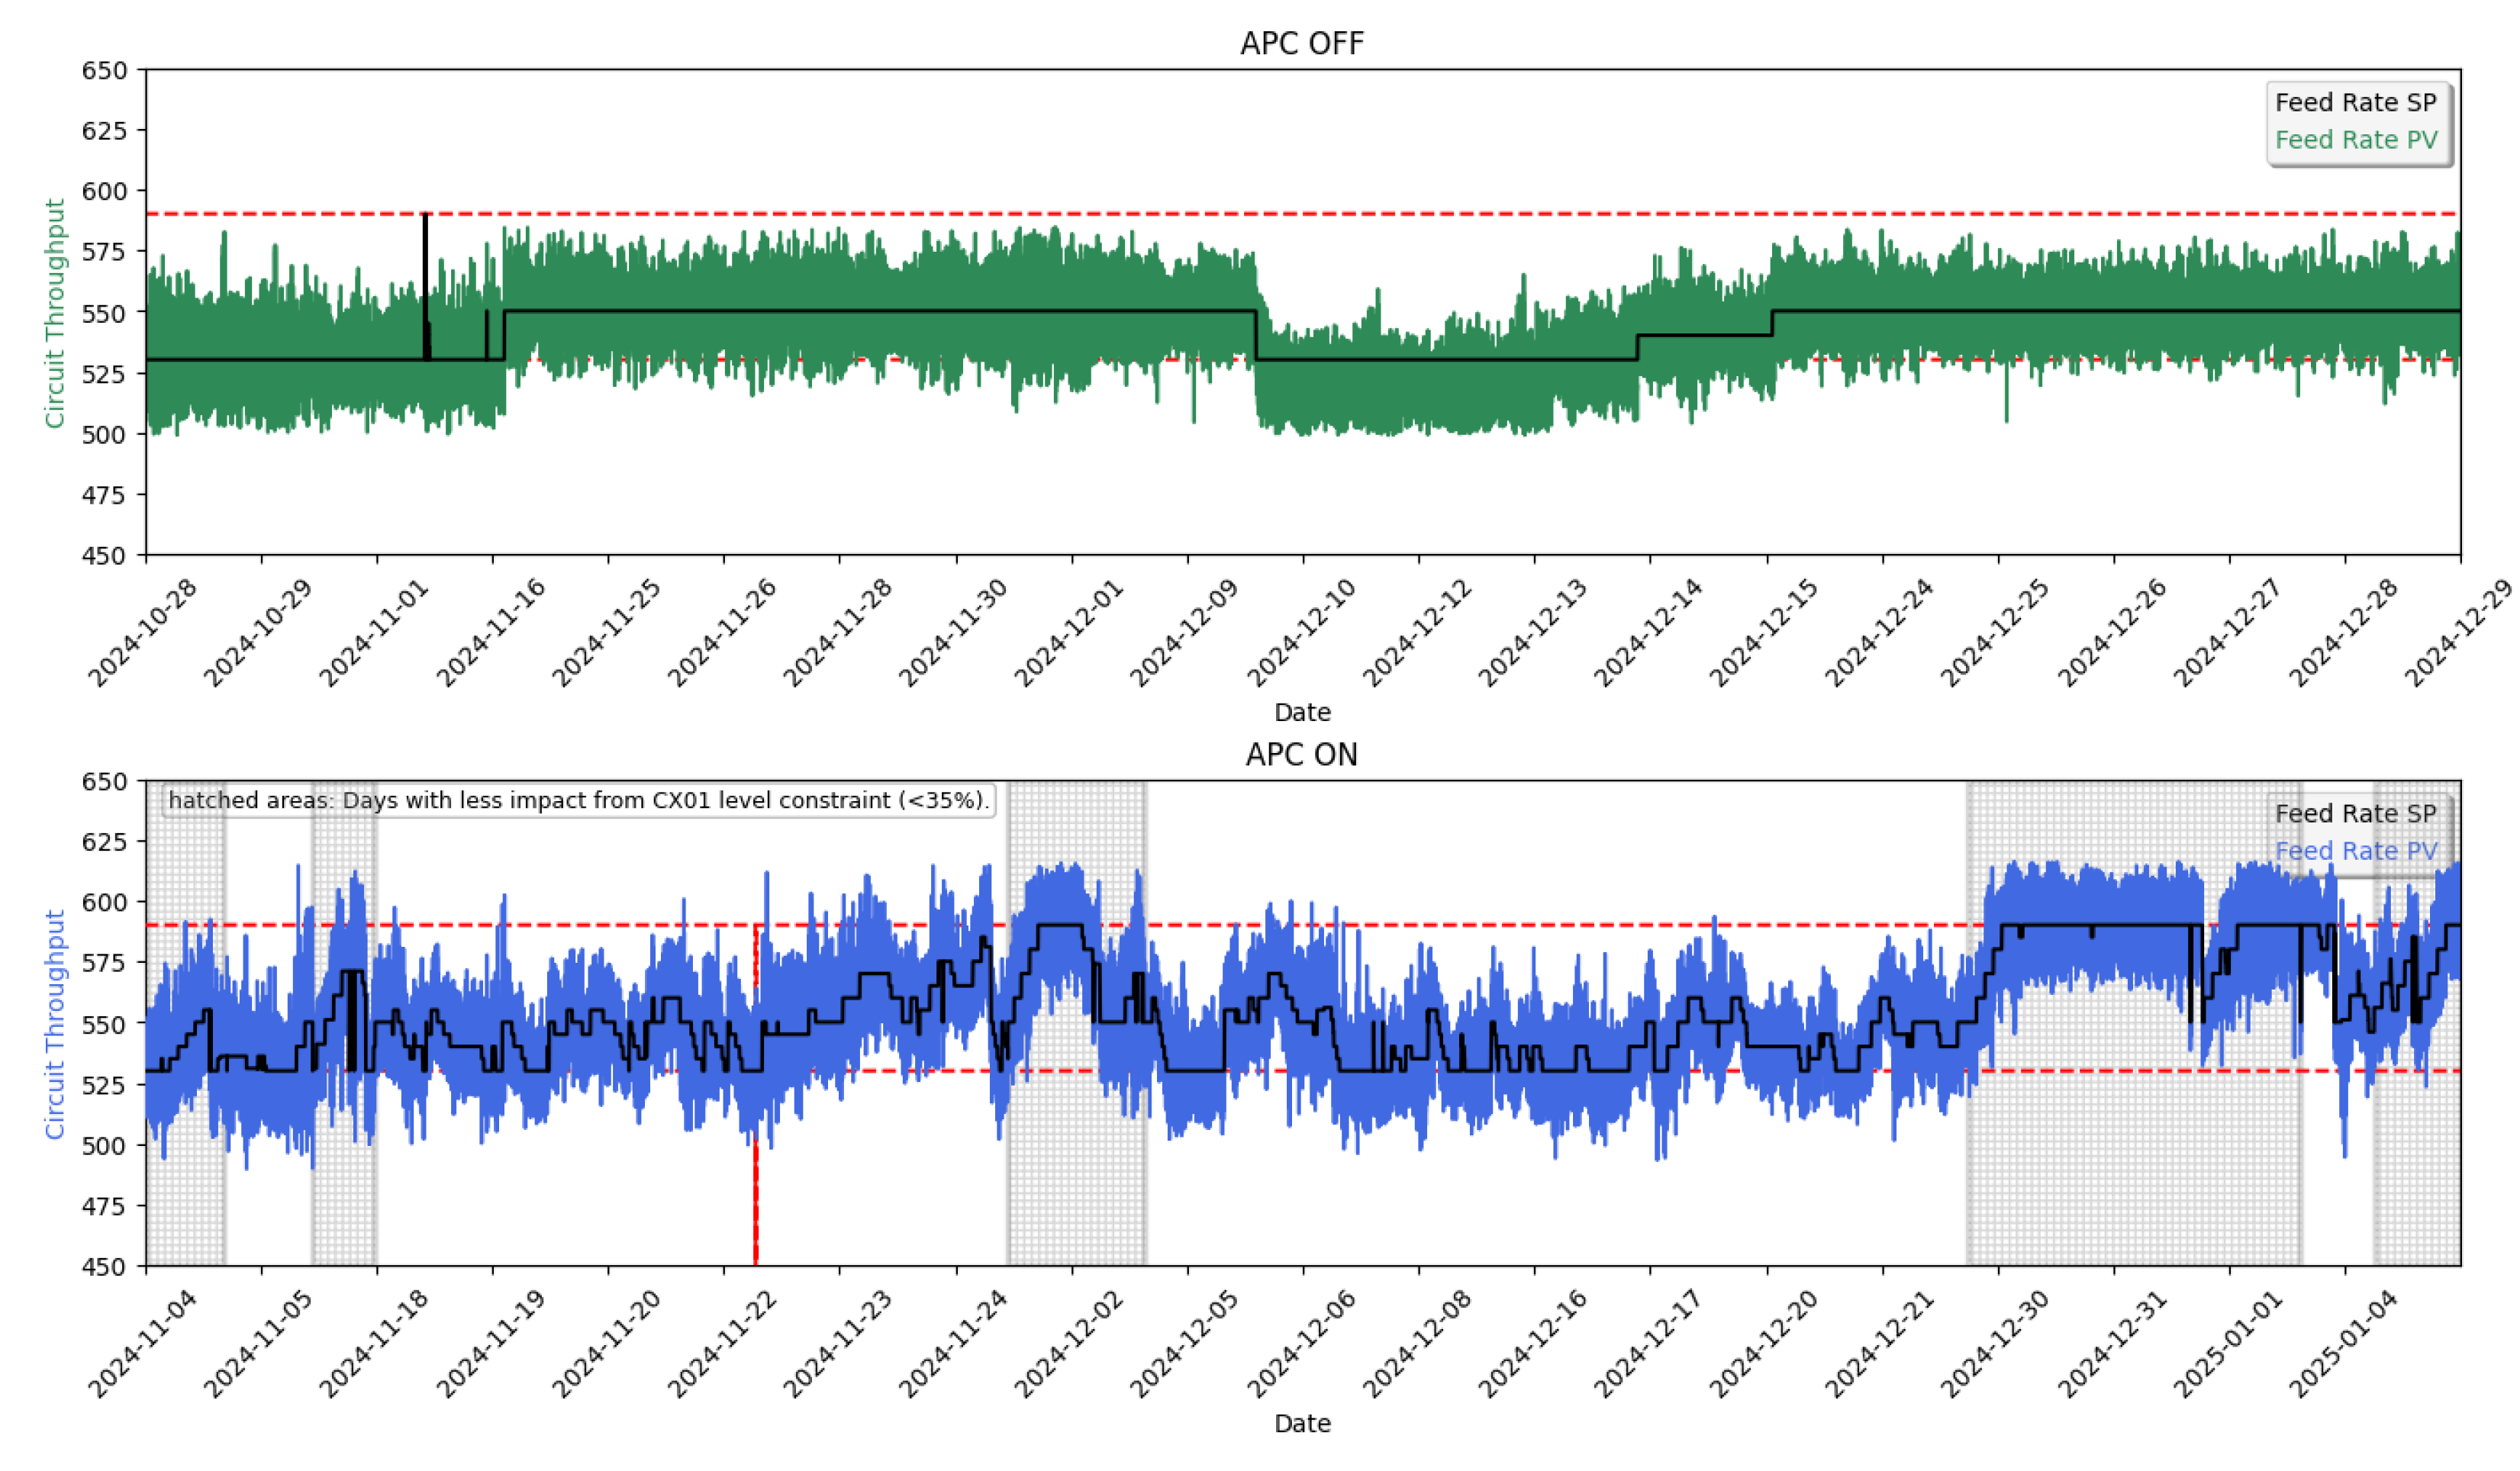
Table summarizes the average circuit throughput values, in tons per hour (t/h) under APC OFF and APC ON conditions. To provide a more consistent basis for comparison, the APC ON periods were further divided according to the influence of the sump level constraint in CX-01. Specifically, the subset DBCX1_OK corresponds to periods with reduced impact of this constraint, while the DBCX1_NOK subset represents the remaining periods. This approach allows for a clearer distinction of the APC performance under different operating conditions, and highlights the average throughput achieved in each scenario.
Table 3.
Average circuit throughput (tph) for APC OFF and APC ON conditions.
| Scenario | Circuit throughput (tph) | ||
| Average | Observation | ||
| (tph) | (%) | ||
| APC OFF | 541.2 | Reference | |
| APC ON - DB_Geral | 553.7 | +2.3 | APC ON vs APC OFF |
| APC ON - DBCX1_OK | 571.7 | +5.6 | APC ON (Hatched areas) vs APC OFF |
| APC ON - DBCX1_NOK | 545.1 | +0.7 | APC ON (No hatched areas) vs APC OFF |
With the implementation of the APC, there was an increase in the circuit throughput. The DBCX1_OK period showed a 5.6% increase, represented by 571.7 t/h as compared with 541.2 t/h, the latter resulted from the APC OFF period. This result highlights the ability of the APC to optimize the feed rate when the system operates under stable conditions. In the DB_Geral period, the increase in circuit throughput was 2.3%, while in the DBCX1_NOK period, the increase was marginal (+0.7%), which thus indicated that the performance of the APC is directly related to the stability of the process variables.
The observed behaviour indicates that the APC flow maximization module was effective in stable operational contexts, as evidenced in the set DBCX1_OK. The upper limitation imposed on the module (590 tph), defined by operational criteria, may have constrained additional increments in the DB_Geral and DBCX1_OK scenarios. In the DBCX1_NOK set, the high incidence of the level restriction of CX-01 compromised the performance of the module, resulting in marginal gain.
4.2. Hydrocyclone Feed Pulp Density
Controlling the pulp density in the hydrocyclone feed is a critical factor in ensuring the efficiency of classification process, which in turn modulates the circulating load and ultimately both grinding size and circuit throughput.
Figure presents the error histograms based on hydrocyclone feed pulp density setpoint, comparing the three scenarios of APC ON in blue (DB_Geral, DBCX1_OK and DBCX1_NOK) with the APC OFF in green. In all cases, solid lines represent normalized histograms, while the bars depict probability density estimates for each condition. The three tables summarize the standard deviation (Std) values and the relative percentage variation (%Std) between the selected conditions.
Figure 4.
Normalized frequency distribution of the error in hydrocyclone feed pulp density.
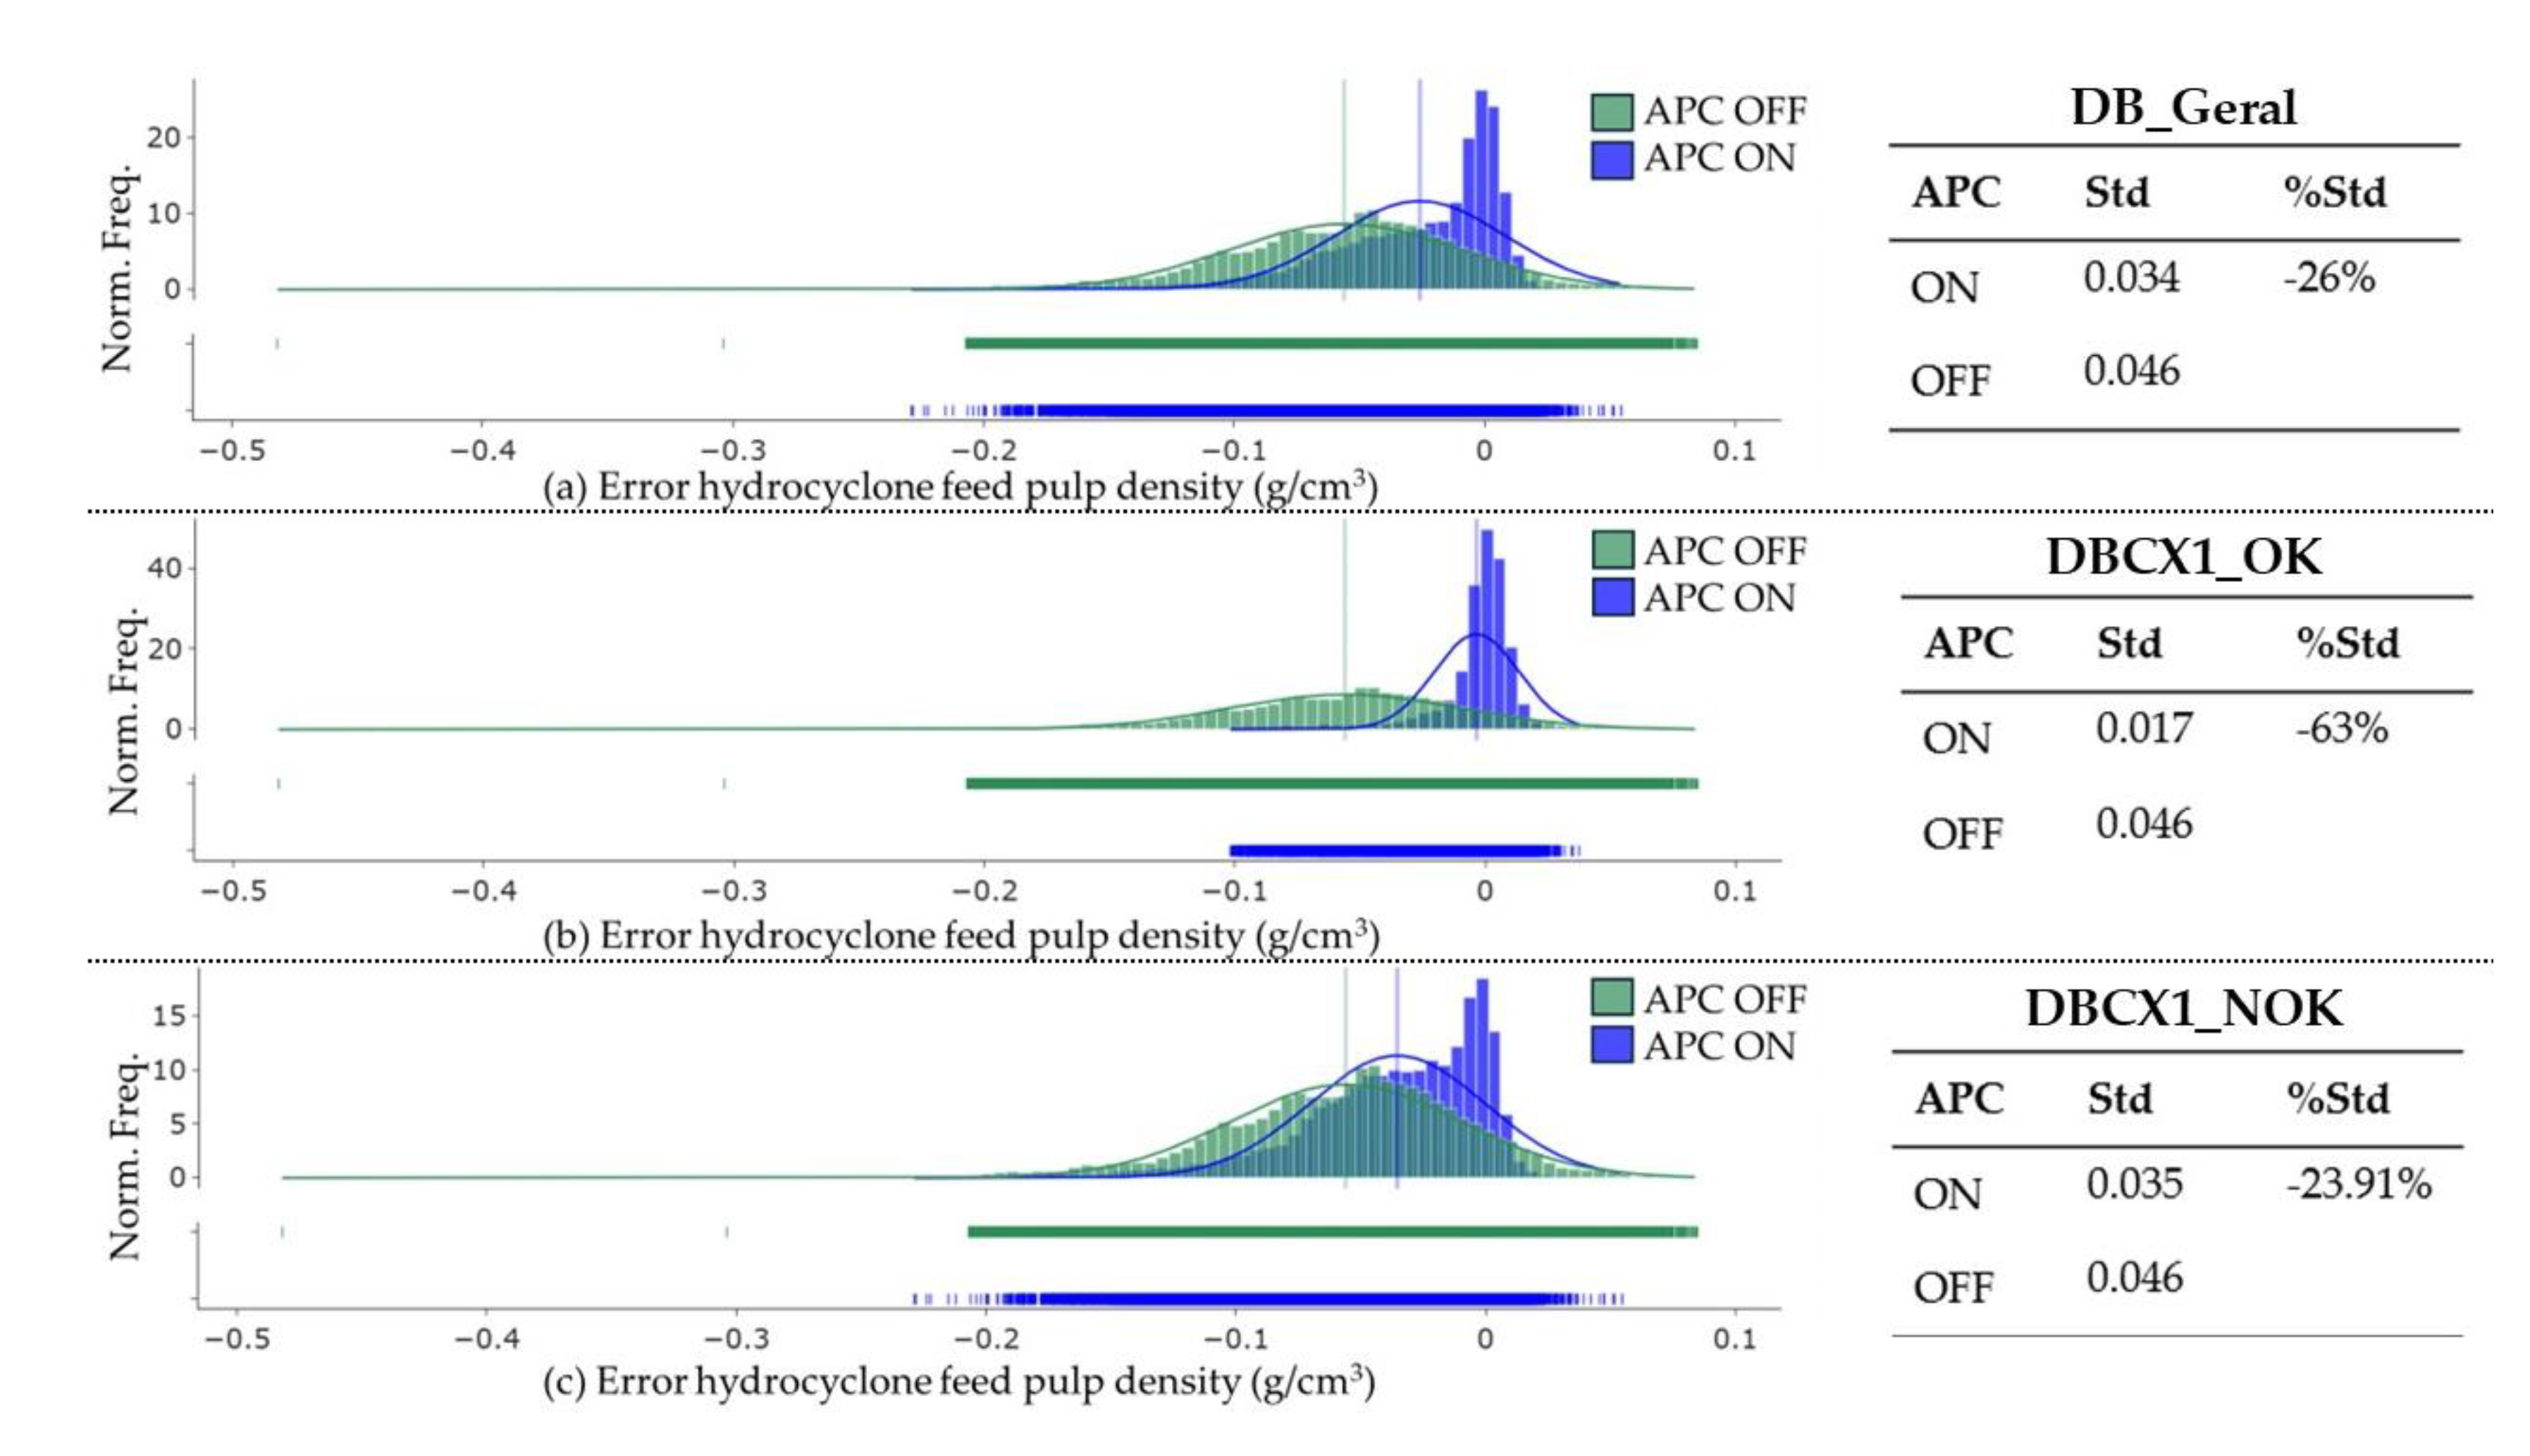
The application of the APC resulted in a consistent reduction in the variability of the hydrocyclone feed pulp density in all the evaluated scenarios. In scenario DBCX1_OK (Figure b), corresponding to the periods without operational restrictions in the feed box, the greatest relative reduction in standard deviation was observed, from 0.046 to 0.017 g/cm³, which represents an improvement of 63% in setpoint adherence. This result highlights the potential of APC to provide more precise and effective control, especially under stable operating conditions. In scenario DB_Geral (Figure a), the reduction was 26%, with the standard deviation decreasing from 0.046 to 0.034 g/cm³. Even under adverse operating conditions, represented by the DBCX1_NOK scenario (Figure c), the system showed a positive performance, with a 24% reduction in variability (from 0.046 to 0.035 g/cm³).
4.3. Grinding Size
The grinding size, here represented by the percent retained at 0.150 mm, is directly influenced by the control of density and pressure in the hydrocyclone pulp feed. The APC uses a control strategy based on a Fuzzy controller, which dynamically adjusts the density setpoint according to the deviation observed in retained at 0.150 mm. Accordingly, if the value of retained at 0.150 mm is higher than the stipulated setpoint, the controller reduces the pulp density setpoint by increasing the water flowrate to CX-01, therefore diluting the feed pulp, which in turn increases the pulp level in the sump. To stabilize the sump level, the controller increases the pump rotation, which in turn results in increasing the hydrocyclone feed pulp pressure. Both pulp feed density reduction and pressure increase result in a finer hydrocyclone overflow size distribution, therefore reducing the retained at 0.150 mm.
Figure presents the distributions of percent retained at 0.150 mm parameter according to three scenarios of APC ON in blue (DB_Geral, DBCX1_OK and DBCX1_NOK), as compared with the APC OFF in green. Solid lines correspond to normalized frequency distributions, while the bars indicate probability density estimates. The tables summarize the standard deviation (Std) values and the relative percentage variation (%Std) between the selected conditions.
Figure 5.
Normalized frequency histograms of the percentage retained at 0.150 mm parameter under APC OFF (green) and APC ON (blue) conditions.
Figure 5.
Normalized frequency histograms of the percentage retained at 0.150 mm parameter under APC OFF (green) and APC ON (blue) conditions.
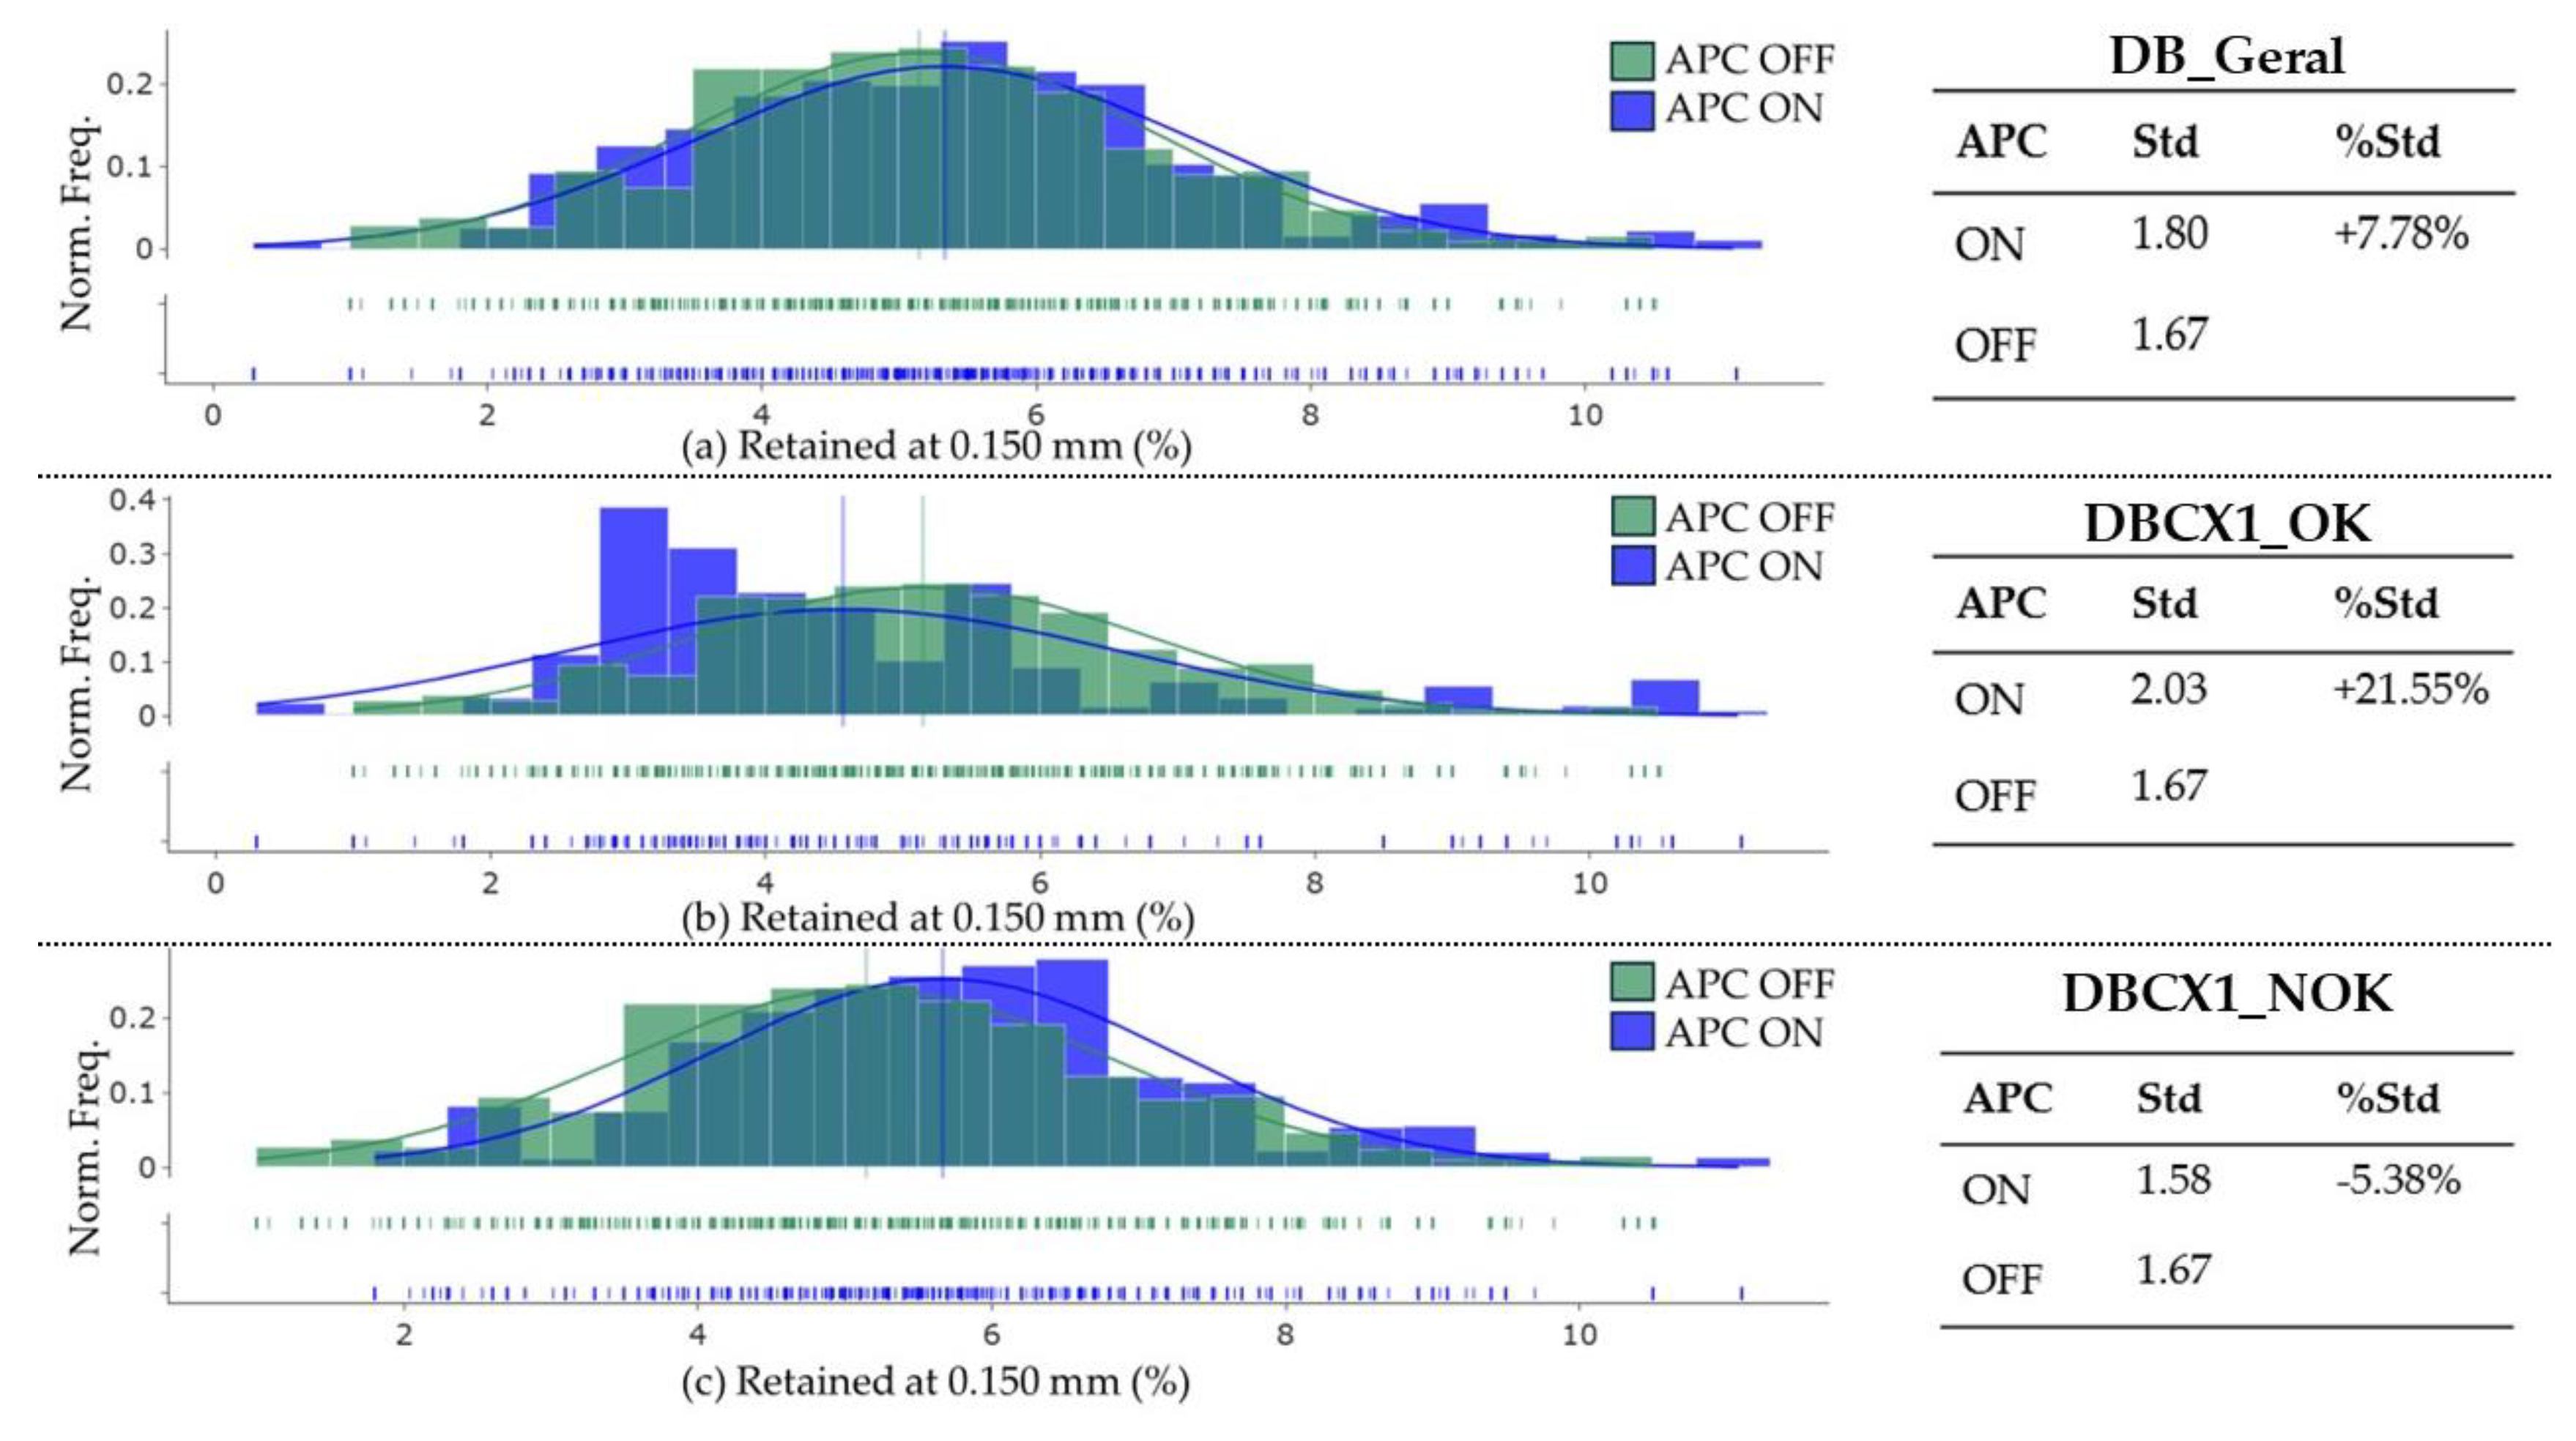
As illustrated in Figure (a) and Figure (b), which correspond respectively to scenarios DB_Geral and DBCX1_OK, it is observed that, despite the active pulp density control and a more stable average hydrocyclone feed pressure, there was an increase in the standard deviation in both cases. Accordingly, a 7.78% increase was observed in the former, as compared with the latter, whose standard deviation increase was +20.83%. In scenario DBCX1_NOK, represented in Figure (c), there was a slight improvement, with a standard deviation reduction of 5.38%.
The analysis of such scenarios indicates that as the level control of the CX-01 imposes restrictions when the level reaches 85% or higher, it limits the density controller to maintain the variable at the respective setpoint, therefore affecting the range of granulometry reduction. This problem does not occur in the APC OFF period, as in such a situation there is no pulp density control, resulting that both water flowrate added to the CX-01 and the pump speed operate as a function solely of the sump level.
4.4. Size Specific Energy Consumption
Figure 1 presents the distributions of size the specific energy consumption (kWh/t) according to three scenarios of APC ON in blue (DB_Geral, DBCX1_OK and DBCX1_NOK), as compared with the APC OFF in green. Solid lines correspond to normalized frequency distributions, while the bars indicate probability density estimates. The tables summarize the average (Avg) values for the corresponding conditions, as well as the variation in the average towards the APC ON cases, as compared with the APC OFF conditions.
Figure 1.
Normalized frequency histograms of size specific energy consumption (kWh/t) under APC OFF (green) and APC ON (blue) conditions.
Figure 1.
Normalized frequency histograms of size specific energy consumption (kWh/t) under APC OFF (green) and APC ON (blue) conditions.
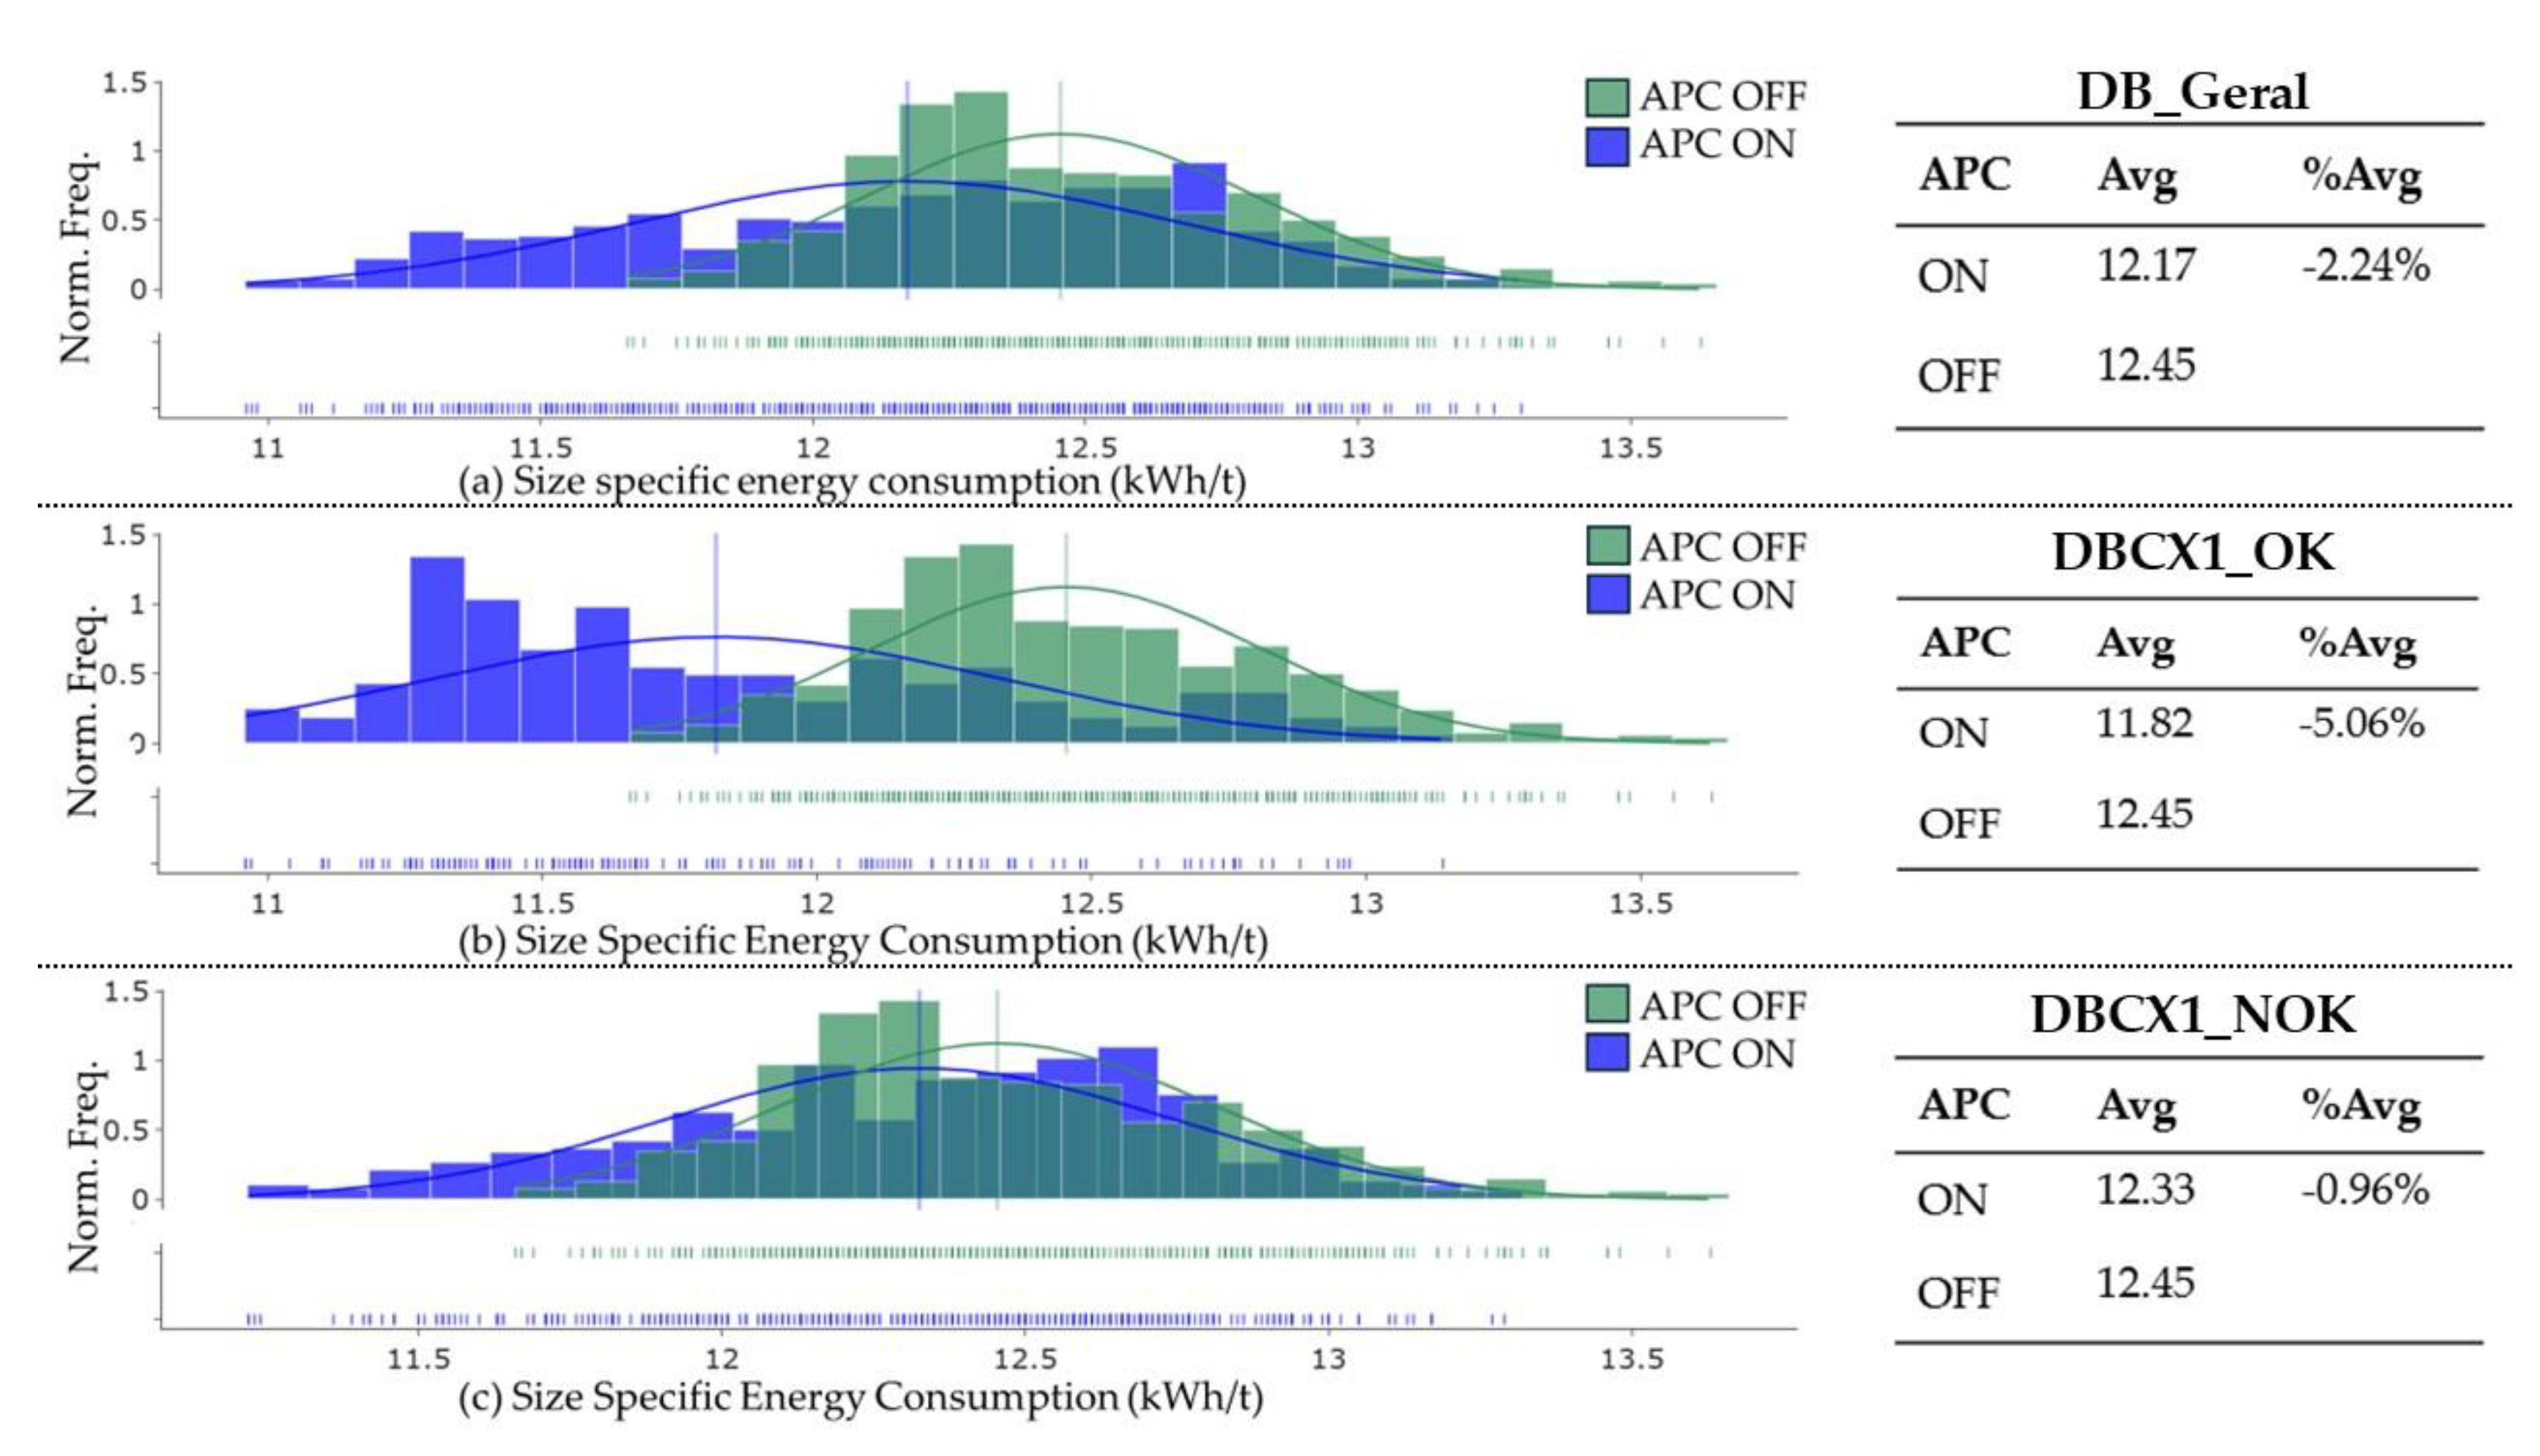
As shown in Figure 1(a), the average size specific consumption was reduced from 12.45 kWh/t (APC OFF) to 12.17 kWh/t (DB_Geral), thus representing a reduction of 2.24%. This trend is even more significant in the DBCX1_OK scenario, as per Figure 1(b), reaching an average reduction of 5.06%, as resulted from 12.45 kWh/t (DBCX1_OK) to 11.82 kWh/t (APC OFF). The comparison between the two above referred average variations indicate that the sump level control thus plays a relevant role in the energy efficiency of the system. Figure 1(c) shows that in the DBCX1_NOK scenario, although the control system also promoted gains, the percentage change was smaller than that observed in the two other situations, with a reduction of only 0.96% (from 12.45 to 12.33 kWh/t). This result may be associated with the greater operational instability observed in this period, indicating that the active restrictions may have negatively affected the benefits of the advanced control.
5. Summary
Table 2 summarizes the results obtained in the selected parameters as a function of the selected scenarios, the latter including periods with APC OFF and the three scenarios with APC ON (DB_GERAL, DBCX1_OK, and DBCX1_NOK). The averaged values were adopted for the circuit throughput and the size specific energy consumption, whereas the standard deviations were considered for the hydrocyclone pulp feed density and the grinding size. The averaged values were selected as the respective absolute values are key factors to assess the performance of the APC system. Conversely, the variation of hydrocyclone pulp feed density and the grinding size represented the circuit operational stability. Percentage changes (Δ%) were calculated based on the reference condition, APC OFF.
Table 2.
Summary of the operational performance results under the different control conditions analysed.
Table 2.
Summary of the operational performance results under the different control conditions analysed.
| Parameter | APC OFF | APC ON | |||||
| DB_Geral | DB_CX1_OK | DB_CX1_NOK | |||||
| Δ% | Δ% | Δ% | |||||
| Circuit throughput (t/h) | 541.2 | 553.7 | +2.3 | 571.7 | +5.6 | 545.1 | +0.7 |
| Hydrocyclones feed pulp density (g/cm3) | 0.046 | 0.034 | -26 | 0.017 | -63 | 0.035 | -24 |
| Retained at 0.150 mm (%) | 1.67 | 1.80 | +7.78 | 2.03 | +20.83 | 1.58 | -5.38 |
| Size specific energy consumption (kWh/t) | 12.45 | 12.17 | -2.24 | 11.82 | -5.06 | 12.33 | -0.96* |
6. Conclusions
A comprehensive testing campaign was carried out at Mineração Usiminas’s industrial grinding circuit resulting in consistent data base to assess the performance associated with the implemented Advanced Process Control – APC, in this case the BALL MILL ACE. The dataset selected according to the stipulated filter represented 28 operating days, comprising of 8 parameters obtained every 20 seconds by the system, summing up to more than 19 million individual records.
As the level of the sump CX-01 installed in the pumping system to hydrocyclone feed limited the control of hydrocyclone pulp feed density and pressure, the dataset was divided into the following three selected scenarios for periods where the APC was on.
DB_Geral: Dataset of the entire 28-day period.
DBCX1_OK: Dataset of the 9 days in which the level restriction of CX-01 acted on less than 35% of the daily operational time.
DBCX1_NOK: Dataset of the 19 days in which the level restriction of CX-01 acted on more than 35% of the daily operational time.
The scenario where the APC was off (APC OFF) was also included in the comparisons.
The averaged circuit throughput increased from 541.2 t/h to a 571.7 t/h figure, respectively obtained for the APC_OFF and the DBCX1_OK scenarios, thus representing a significant 5.6% higher circuit throughput. Furthermore, the averaged circuit throughput associated to the DBCX1_NOK scenario was 545.1 t/h, therefore close to the result obtained for the APC_OFF scenario, indicating that the restriction on CX_01 was the most significant aspect that limited the throughput increase in the system. Corroborating to this conclusion, the analysis of the standard deviation associated with hydrocyclone feed pulp density for DBCX1_OK e DBCX1_NOK selected periods indicated, respectively, 0.017 g/cm³ and 0.035 g/cm³, hence representing a significant reduction in such a parameter for the former, which in turn affects the sump (CX_01) level that controls the pump speed and therefore the hydrocyclone feed pressure. In summary, the stabilization of the combined hydrocyclone feed pulp density and pressure resulted in circuit throughput increase.
Even though the difference was considered relatively small and within the operating limits, the grinding size was less stable in the DBCX1_OK scenario as compared with the DBCX1_NOK one. However, the comparison between both APC ON scenarios and APC OFF one indicates that in the former, the CX-01's level control imposes restrictions when the level reaches 85% or higher, it limits the density controller to maintain the variable at its setpoint, therefore affecting the grinding size. This problem does not occur in the APC_OFF period, as in such a situation there is no pulp density control, resulting that both water flowrate added to the CX-01, and the pump speed operate as a function solely of the sump level.
The conclusion related to reduction of the size specific energy consumption associated with DBCX1_OK and the DBCX1_NOK scenarios also indicated a better performance (reduction in energy consumption) of the APC ON scenario as compared with the APC OFF one.
Author Contributions
Conceptualization, P.K.C. and D.S.T.; methodology, plant testing, and validation, P.K.C. and D.S.T.; data analysis, P.K.C., P.N.V., D.S.T. and H.D.J.; writing—original draft preparation, P.K.C., P.N.V and D.S.T.; writing—review and editing, P.N.V., M.F.C., M.G.B. and H.D.J.; supervision and guidance, M.G.B. and H.D.J. All authors have read and agreed to the published version of the manuscript.
Funding
This research received no external funding.
Data Availability Statement
The data are contained within the article.
Acknowledgments
The authors would like to thank Mineração Usiminas for their support and resources that made this research possible. The authors also acknowledge ANDRITZ for their collaboration and technical support, and the University of São Paulo (USP) for providing the opportunity to conduct this research.
Conflicts of Interest
No potential conflict of interest was reported by the authors.
Abbreviations
The following abbreviations are used in this manuscript:
| ACE | Andritz Control Expert |
| AG | Autogenous Grinding |
| APC | Advanced Process Control |
| IIoT | Industrial Internet of Things |
| ITM | Industrial Mineral Processing Plants |
| MPC | Model Predictive Control (or Controller, depending on context) |
| MUSA | Mineração Usiminas |
| ON/OFF | Activated / Deactivated mode |
| PID | Proportional–Integral–Derivative (control strategy) |
| P80 | 80% of the material passing a specific size (0.106 mm in this study) |
| SAG | Semi-Autogenous Grinding |
| 3Std | Three Standard Deviations (steadiness criterion) |
References
- Zou, G.; Zhou, J.; Song, T.; Yang, J.; Li, K. Hierarchical Intelligent Control Method for Mineral Particle Size Based on Machine Learning. Minerals 2023, Volume 13, 1143. [Google Scholar] [CrossRef]
- González-Vásquez, R.; García-Martínez, M.J.; Bolonio, D. Investigation of Gold Recovery and Mercury Losses in Whole Ore Amalgamation: Artisanal Gold Mining in Nambija, Ecuador. Minerals 2023, Volume 13, 1396. [Google Scholar] [CrossRef]
- Olivier, L.E.; Craig, I.K. A Survey on the Degree of Automation in the Mineral Processing Industry. In Proceedings of the 2017 IEEE AFRICON; 2017; pp. 404–409. [Google Scholar]
- Carvalho, P.S.L.; Silva, M.; Rocio, M.A.; Moszowicz, J. Biblioteca Digital BNDES - Minério de Ferro. BNDES Setorial, /: 39, 197–234. Available online: http, 1408; 39. [Google Scholar]
- Hodouin, D.; Jämsä-Jounela, S.L.; Carvalho, M.; Bergh, L. State of the Art and Challenges In Mineral Processing Control. Control Eng Pract, 9: Volume 9, 1005. [Google Scholar] [CrossRef]
- Curry, J.A.; Ismay, M.J.L.; Jameson, G.J. Mine Operating Costs and the Potential Impacts of Energy and Grinding. Miner. Eng. 2014, Volume 56, 70–80. [Google Scholar] [CrossRef]
- Pérez-García, E.M.; Bouchard, J.; Poulin, É. Integration of a Liberation Model in a Simulation Framework for Comminution Circuits. Miner. Eng. 2018, Volume 126, 167–176. [Google Scholar] [CrossRef]
- Sosa-Blanco, C.; Hodouin, D.; Bazin, C.; Lara-Valenzuela, C.; Salazar, J. Economic Optimisation of a Flotation Plant through Grinding Circuit Tuning. Miner. Eng. 2000, Volume 13, 999–1018. [Google Scholar] [CrossRef]
- Bauer, M.; Craig, I.K. Economic Assessment of Advanced Process Control – A Survey and Framework. J. Process Control 2008, Volume 18, 2–18. [Google Scholar] [CrossRef]
- Le Roux, J.D.; Craig, I.K. Plant-Wide Control Framework for a Grinding Mill Circuit. Ind. Eng. Chem. Res. 2019, Volume 58, 11585–11599. [Google Scholar] [CrossRef]
- Apelt, T.A.; Thornhill, N.F. Inferential Measurement of SAG Mill Parameters V: MPC Simulation. Miner. Eng. 2009, Volume 22, 1045–1052. [Google Scholar] [CrossRef]
- Remes, A.; Aaltonen, J.; Koivo, H. Grinding Circuit Modeling and Simulation of Particle Size Control at Siilinjärvi Concentrator. Int. J. Miner. Process. 2010, Volume 96, 70–78. [Google Scholar] [CrossRef]
- Yang, J.; Li, S.; Chen, X.; Li, Q. Disturbance Rejection of Ball Mill Grinding Circuits Using DOB and MPC. Powder Technol. 2010, Volume 198, 219–228. [Google Scholar] [CrossRef]
- Steyn, C.W.; Sandrock, C. Benefits of Optimisation and Model Predictive Control on a Fully Autogenous Mill with Variable Speed. Miner. Eng. 2013, Volume 53, 113–123. [Google Scholar] [CrossRef]
- Le Roux, J.D.; Steyn, C.W. Validation of a Dynamic Non-Linear Grinding Circuit Model for Process Control. Miner. Eng. 2022, Volume 187, 107780. [Google Scholar] [CrossRef]
- Kelly, E.G.; Spottiswood, D.J. Introduction to Mineral Processing, 1st ed; John Wiley & Sons: New York, NY, USA, 1982; 492p. [Google Scholar]
- Luz, A.B. da; Sampaio, J.A.; França, S.C.A. Tratamento de Minérios, 5ª Edição; Luz, A.B. da, Sampaio, França, S.C.A., Eds.; CETEM/MCT: Rio de Janeiro, 2010; pp. 465–512. [Google Scholar]
- Jämsä-Jounela, S.L. Future Automation Systems in Context of Process Systems and Minerals Engineering. IFAC-PapersOnLine, 52. [CrossRef]
- Ballantyne, G.R.; Powell, M.S.; Tiang, M. Proportion of Energy Attributable to Comminution. In Proceedings of the 11th Australas. Inst. Min. Metall. Mill Oper. Conf., October; 2012; pp. 25–30. [Google Scholar]
- Morrell, S. Presentation: A Global and Mining Industry Perspective of the Role of Comminution in the 1. In 5 °C Future. In Proceedings of the 2023 SME Annual Conference & Expo, Denver, CO, USA; 2023. [Google Scholar]
- Hulbert, D.G. Multivariable Control of a Wet Grinding Circuit; Ph.D. Thesis, University of Natal, Durban, South Africa, 1977. [Google Scholar]
- Chen, Y.; Lian, X.; Li, Z.; Zheng, S.; Wang, Z. Effects of Rotation Speed and Media Density on Particle Size Distribution and Structure of Ground Calcium Carbonate in a Planetary Ball Mill. Adv. Powder Technol. 2015, Volume 26, 505–510. [Google Scholar] [CrossRef]
- Guobin, W.; Qingfei, X.; Qiang, Z.; Xiangyang, L.; Saizhen, J.; Yingjie, P.; et al. An Innovatory Approach for Determining Grinding Media System to Optimize Fraction Compositions of Grinding Products Based on Grinding Dynamics Principle. Powder Technol. 2024, Volume 434, 119302. [Google Scholar] [CrossRef]
- Zhou, P.; Lu, S.; Yuan, M.; Chai, T. Survey on Higher-Level Advanced Control for Grinding Circuits Operation. Powder Technol. 2016, Volume 288, 324–338. [Google Scholar] [CrossRef]
- Yamashita, A.S.; Martins, W.T.; Pinto, T.V.B.; Raffo, G.V.; Euzébio, T.A.M. Multiobjective Tuning Technique for MPC in Grinding Circuits. IEEE Access 2023, Volume 11, 43041–43054. [Google Scholar] [CrossRef]
- Usiminas. Mineração Usiminas. Available online: https://www.usiminas.com/ (accessed on 30 September 2025).
- Alves, F. Brasil Mineral - As maiores empresas do setor mineral. Ed Especial n°441.
- Zervos, C.C.; Dumont, G.A. Deterministic adaptive control based on Laguerre series representation. Int. J. Control 1988, Volume 48, 2333–2359. [Google Scholar] [CrossRef]
- Shapiro, S.S.; Wilk, M.B. An Analysis of Variance Test for Normality (Complete Samples). Biometrika 1965, Volume 52, 591. [Google Scholar] [CrossRef]
- McKnight, P.E.; Najab, J. Test. In The Corsini Encyclopedia of Psychology, 4th ed.; Wiley: Hoboken, NJ, USA, 2010; p. 1. [Google Scholar]
- Levene, H. Robust Tests for Equality of Variances. Contrib. Probab. Stat. 1960, Volume 1, 278–292. [Google Scholar]
Disclaimer/Publisher’s Note: The statements, opinions and data contained in all publications are solely those of the individual author(s) and contributor(s) and not of MDPI and/or the editor(s). MDPI and/or the editor(s) disclaim responsibility for any injury to people or property resulting from any ideas, methods, instructions or products referred to in the content. |
© 2025 by the authors. Licensee MDPI, Basel, Switzerland. This article is an open access article distributed under the terms and conditions of the Creative Commons Attribution (CC BY) license (http://creativecommons.org/licenses/by/4.0/).
Copyright: This open access article is published under a Creative Commons CC BY 4.0 license, which permit the free download, distribution, and reuse, provided that the author and preprint are cited in any reuse.


