
Submitted:
01 October 2025
Posted:
02 October 2025
You are already at the latest version
Abstract
This study explores the relationship between government revenue per capita, governance quality, and the supply of teachers—an indicator under Sustainable Development Goal 4 (Target 4.c). Using annual data from 217 countries spanning 1980 to 2022, we apply a non-linear panel model with a logistic function that incorporates country-specific governance measures. Our findings reveal that increased government revenue is positively associated with teacher supply, and that improvements in governance amplify this effect. The model provides predictive insights into how changes in revenue may influence progress toward education-related SDG targets at the country level.
Keywords:
government revenue
; quality of governance
; teacher supply
; sustainable development goals
; pupil teacher ratio
; school age population teacher ratio
; tax abuse
; debt service
1. Introduction
The United Nations Universal Declaration on Human Rights (Article 26) states that education is a fundamental human right, and primary school education should be free and compulsory(United Nations, 1948). Article 28 of the United Nations Convention on the Rights of the Child (UNCRC) affirms this right (United Nations, 1990). Thus, governments are duty bearers and must ensure universal equal access to quality education, which is free and compulsory at the primary school level and universally accessible and progressively free at the secondary school level (Walker, 2023).
The United Nations General Assembly established the Sustainable Development Goals (SDGs) in 2015 to achieve an equitable and sustainable future for all by 2030. The SDGs are grounded in UN human rights treaties and conventions. The right to education enables all human rights (United Nations, 2022). The first target of the fourth SDG (SDG 4) is that all girls and boys complete free, equitable, and high-quality primary and secondary education, leading to relevant and effective learning outcomes. Target 4.c is that by 2030, countries will have substantially increased the supply of qualified teachers (see Box 1) (United Nations Department of Economic and Social Affairs et al., 2021).
In 2021, heads of state, ministers, and delegates met to discuss the educational crises amplified by the COVID-19 pandemic. They urged governments to allocate 4-6% of GDP or 15-20% of total public expenditure to education (UNESCO, 2021). The importance of education was again highlighted in 2022, when delegations from all countries and 65 heads of state met to address the education crisis at the Transforming Education Summit (The United Nations, 2022). One of the five themes discussed was Financing of Education, which noted that governments provide most of the education funding, but many governments have significant constraints.
The United Nations Educational, Scientific, and Cultural Organization (UNESCO) reported a global teacher deficit of 69 million because of the demand for education and a growing school-age population. The work environment of teachers is one of the most critical factors which influences young people’s career decisions and retention. The work environment includes factors such as salaries, personnel management, learning materials and equipment, and intra-school management. Critically, teacher shortages negatively impact educational outcomes. For example, in Thailand, schools with a shortage of mathematics teachers had statistically significantly lower mathematics test scores (Pholphirul et al., 2023).
A literature review to establish which interventions increase the time that students spend in school and their quality of learning found that increasing the number and salaries of teachers is critical. Other important inputs include improving school buildings (P.McCall, 2022). Another systematic review of the literature on recruiting and retaining teachers included financial incentives, housing, and moving expenses. Working conditions which affect teacher retention include large class size, a particular problem after primary school expansion, and the availability of electricity, sanitation, and equipment. The authors concluded that full staffing of schools will require considerable investment (Evans & Mendez Acosta, 2023). The importance of teachers is reflected in SDG 4.c, which aims to improve the teacher supply. The largest part of education budgets is teacher salaries (averaging 75-90% of the total budget), which makes predictable financing through domestic resource mobilisation critical (United Nations, 2022).
Here, we set out to model how additional government revenue would alter teacher numbers in individual countries by modelling the impact of government revenue on the school-age population to teacher ratio (SAPTR).
The structure of the paper is as follows: following this introductory section, section 2 gives a brief overview of the literature, section 3 outlines our methodological approach, section 4 gives the estimation results, and section 5 draws some general conclusions and discusses the results.
2. Literature Review
The History of Education Scale Up Globally
Over the last 40 years, there has been a massive scale up of primary school enrolment, and 86% of the world’s population aged more than 15 years have had at least some formal education in 2020. This ranges from 78% in Africa to 99% in Europe (Roser, 2020). Leaders in Africa have concentrated on expanding access to primary education with significant success. The expansion of education in most countries has followed an S-shaped curve. This is characterised by an initial slow or flat phase, followed by a rapid increase in enrolment, and finally a tapering off as countries enrol the most difficult to reach populations (Bashir et al., 2018).
The Benefits of Education to the Individual and Society
School attendance brings both economic and social benefits to the individual and society in which they live. The global average increase in an individual’s salary for every additional year of primary school education is ten percentage points (Montenegro & Patrinos, 2014). This varies by country; for example, in India, individual earnings increased by 13.5%. In other countries, including Indonesia, Nigeria, Uganda, Kenya, and Ethiopia, social benefits include delayed childbirth and reduced fertility. Thus, there are economic and social benefits at the individual and societal levels, even though, in some circumstances, formal measures of educational outcomes may not indicate success (Centre for Global Development, 2022).
Studies, systematic reviews, and metanalyses confirm that increased government spending on education drives economic growth (Baldacci et al., 2008; Churchill et al., 2015). A systematic review of the literature in sub-Saharan Africa found that education is good for the economic well-being of individuals, reduces inequality, and contributes to economic growth (Chikoko & Mthembu, 2020). Indeed, educational achievement is believed to account for 75% of the total cross-country variation in economic growth between countries over the last century (Woessmann, 2016). Further, there is positive feedback between education and economic growth; Dhrifi et al. studied 108 developing and developed countries using simultaneous equations models and found a bidirectional relationship between education and economic growth (Dhrifi, 2020).
Quantity Versus Quality
The massive expansion in access to education and the availability of international surveys of educational attainment which facilitates cross-country comparisons, has led some to question if there has been a trade-off between access to and the quality of education, and some argue that schooling without learning is of limited value both at the individual level and in terms of economic growth (Hanushek & Woessmann, 2021). However, Taylor and Spaull studied literacy and numeracy in 14 South and Eastern African countries which increased access to primary education between 2000 and 2007. They clearly demonstrate that, in most countries, the increased enrolment rates were accompanied by increased numeracy and literacy (Taylor & Spaull, 2013).
The Supply and Demand of Educational Scale-Up
Given its importance to both the individual and society, many researchers have sought to identify the key facilitators and barriers. Factors may be considered on the demand side (decisions made by the family or individual) or on the supply side (decisions or policies by governments). Factors critical to a government implementing educational policies include government strength (revenue) and capacity (quality of governance and their policies) (see Table 1).
Considering the demand side first, household income and levels of parental education have been shown to be the main explainers of the variance in education levels between countries. There is a positive feedback loop whereby educated parents increase household income and drive an increase in child education. Families and individuals invest in education when private benefits exceed their costs, and these costs are greater for secondary school than for primary school, as the opportunity cost of an older child not working is greater and the costs of education are higher. The benefits derived from this investment depend on the stage of economic development in the country and the need for skilled workers. Therefore, family decisions are driven by a country’s stage of economic development.
Regarding the supply side, important barriers include school fees. The Centre for Global Development have identified supply side interventions which are most effective in scaling up education, these interventions are; new teachers, new schools and the removal of user fees (96% of countries no longer charge fees for primary school) (Centre for Global Development, 2022). (Crawford & Ali, 2022). Duflo and Banerjee have provided evidence on the impact of increased access to secondary education in Ghana using scholarships by demonstrating that completion rates increased by 27 percentage points, and this also enabled healthier behaviours, delayed fertility, and marriage, with gains especially strong in females (Duflo & Banerjee, 2011).
Many argue that the demand side is the most important pathway and household decisions rather than government policies on access to (e.g., the number of schools or teachers) are critical (Clemens, 2011). Masino and Nino Zaruzua, in a systematic review of the literature, found that demand-side constraints undermine supply side interventions (Masino & Niño-Zarazúa, 2016). Government policies can, however, increase demand by reducing the opportunity costs for families by removing school fees, using cash transfers, and granting scholarships and with policies outside the education sector, for example, an improved road infrastructure (Masino & Niño-Zarazúa, 2016).
Government Revenue and Education
To pay for additional educational inputs, funding is critical, and 97% of education funding is domestically resourced. However, for many governments, investment in education is constrained by macroeconomic realities, including a burgeoning debt burden and tax abuse, which often leads to austerity and cuts to teacher salaries. Recommendations for the international community were to prioritise debt renegotiation and action on tax havens to curtail tax abuse (United Nations, 2022). When governments have more revenue, they spend more on public services, including education. O’Hare and Hall modelled the impact of government revenue on several SDGs, including SDG4, and found that as revenue per capita increases, school life expectancy increases. They also found that the relationship is S-shaped and that the shape of the curve is influenced by the quality of governance in individual countries (O’Hare & Hall, 2022).
Governance and Education
Richards and Vining studied the impact of several independent variables on primary school completion, including GDP, government spending per student, and quality of governance. They found governance to be the most important independent variable (Richards and Vining, 2015). Fomba et al. (2022) confirmed this finding (Fomba et al., 2022). Critically, Hall and O’Hare (2023) found that additional revenue improves governance which further amplifies the impact of additional revenue on school life expectancy.
Bottlenecks in the Supply-Side Scale Up in Education
Thus, the demand side is critical to the scale-up of education, but increasing demand in a given country will require long-term economic growth. Here, we are interested in factors which may be more amenable to intervention in the medium term and in decisions made by international actors that influence government revenue. Further, given the bidirectional relationship between education and economic growth, we consider it important to consider the supply side of educational inputs. Those factors critical to government making and implementing supply side policies include government revenue and the quality of governance, on the input which is the most critical and costly, the supply of teachers. We set out to model how additional government revenue would alter the number of teachers in an individual country by modelling the impact of government revenue and the quality of governance on the school-age population to teacher ratio. This will allow us to translate the impact of additional revenue, for example, if external debt was restructured or as the result of the contributions of a large taxpayer to public finances on teacher numbers in an individual country.
3. The Methods
The independent variable used is government revenue (as opposed to, say, total education spending) for two reasons.
- Understanding the link between government revenue and the Sustainable Development Goals (SDGs) is crucial, as the actions of governments and international or multinational entities—including corporations and commercial banks—are more likely to affect revenue than expenditure. For instance, tax evasion by individuals and tax avoidance by multinational corporations can significantly reduce government revenue. In contrast, most international actors—except for the International Monetary Fund (Kentikelenis, 2023)—and donors in countries heavily reliant on aid have limited influence over how governments allocate their spending (B. A.-M. O’Hare et al., 2018).
- Government revenue represents a government’s capacity to allocate resources across all sectors. While many studies focus narrowly on specific areas of social spending—such as health or education—these are only portions of total government expenditure. Our interest lies in the broader picture, encompassing all sectors that influence progress toward the Sustainable Development Goals (SDGs). In this study, we do not estimate the direct cost of achieving a specific SDG target, such as increasing the number of teachers, which could be calculated simply by multiplying teacher salaries. Instead, we recognize that if such funds were provided to a government, they would likely be absorbed into general spending rather than directed toward that specific goal. Therefore, our approach asks a different question: how much must government revenue increase for a government to make meaningful progress toward a given SDG target? This shifts the focus from cost estimation to understanding the fiscal conditions necessary for sustainable development.
Data
Education Data
Data which are frequently used to assess the outcomes of education include school attendance and measures of learning. For school attendance, enrolment, completion rates, and the proportion of children who are out of school are examples. In terms of educational attainment, international surveys have increased, including the Program for International Student Assessment (PISA), Trends in International Maths and Science Study (TIMSS), Progress in International Reading Literacy Study (PIRLS), and the Southern and East African Consortium for Monitoring Educational Quality (SACMEQ)(Taylor & Spaull, 2013).
Here, we are interested in educational inputs. Important educational inputs include the number of teachers in a school, district, or country which is often expressed as the pupil to teacher ratio (PTR). SDG 4, target c, aims to increase the supply of teachers. Difficulties arise in quantifying the number of teachers, including variations across countries in definitions and standards. Teachers are often described as trained or qualified; however, some countries use the same definition for both categories. See Box 1 for the definitions of teachers’ qualifications used by the United Nations Educational, Scientific and Cultural Organisation (UNESCO) and SDG4 target and indicators (UNESCO Institute for Statistics, 2022).
Box 1. Definitions of teaching qualifications and Sustainable Development Goal 4 targets.
| A qualified teacher | One who has the minimum academic qualifications necessary to teach at a specific level of education in each country. This is usually related to the subject (s) they teach. |
| A trained teacher | One who has fulfilled at least the minimum organized teacher-training requirements (pre-service or in-service) to teach a specific level of education according to the relevant national policy or law. These requirements usually include pedagogical knowledge (broad principles and strategies of classroom management and organization that transcend the subject matter being taught. |
| Sustainable Development Goals | |
| Target 4.c | Aims to substantially increase the supply of qualified teachers. |
| Indicator 4. c.1 | The proportion of teachers with the minimum required qualifications, by education level. |
| Indicator 4. c.2 | The pupil-trained teacher ratio by education level. |
| Indicator 4. c.3 | The percentage of teachers qualified according to national standards by education level and type of institution. |
| Indicator 4.c.4 | The pupil-qualified teacher ratio by education level |
UNESCO defines PTR as the average number of pupils in class per teacher. However, in countries where there are many school-age children who are not in school, this may give the impression of being adequate teachers when there is a shortage.
To explore this, we developed a novel dataset of the school age population to teacher ratio (SAPTR), using school age population data and the number of teachers from UNESCO, for primary, lower secondary, and upper secondary schools, for each country and each year. In the teacher number dataset, UNESCO does not categorise these as trained or qualified, but rather the total number of teachers. We included data from 1980-2022, as there is also data on government revenue for these years which is used for the modelling.
Before using this data set, we compared it with UNESCO data on PTR for trained and qualified teachers, which we call PTTR and PQTR, respectively, for each school level. There were data in the UNESCO dataset for PTTR and PQTR from 2010 to 2022. See Table 1 for the summary of the comparison of SAPTR for the years 1980-2022, for the years 2010-2022 (to allow direct comparison), and for PTTR and PQTR for each region by school level for the years 2010-2022, with the number of observations available in italics below each number. As expected, the largest discrepancies between SAPTR and PTTR/PQTR are in the African region and for lower secondary and upper secondary school levels. This is as we would expect given the massive expansion in primary school enrolments which has yet to be scaled up to secondary school. It is also interesting to note that this discrepancy is decreasing when comparing the average SAPTR 1980-2022 with SAPTR 2010-2022 for secondary education in the region, decreasing from 125 to 83 for the most recent time.

Table 2.
The school age population to teacher ration compared with the pupil to teacher ratio by region.
Table 2.
The school age population to teacher ration compared with the pupil to teacher ratio by region.
| Primary School | Lower Secondary | Upper Secondary | ||||||||||
|---|---|---|---|---|---|---|---|---|---|---|---|---|
| Region | SAPTR 1980-2022 | SAPTR 2010-2022 | PTTR 2010-2022 | PQTR Primary 2010-2022 | SAPTR 1980-2022 | SAPTR 2010-2022 | PTTR 2010-2022 | PQTR 2010-2022 | SAPTR 1980-2022 | SAPTR 2010-2022 | PTTR 2010-2022 | PQTR 2010-2022 |
| East Asia and Pacific | 25 | 25 | 23 | 25 | 21 | 23 | 19 | 35 | 27 | 18 | 19 | |
| Observations | 871 | 257 | 0 | 172 | 366 | 170 | 118 | 108 | 326 | 152 | 78 | 80 |
| Europe and Central Asia | 16 | 14 | 15 | 16 | 10 | 9 | 22 | 10 | 14 | 11 | 11 | 11 |
| Observations | 1,262 | 479 | 44 | 139 | 728 | 382 | 86 | 81 | 746 | 367 | 74 | 77 |
| Latin America and Caribbean | 22 | 17 | 23 | 31 | 19 | 17 | 23 | 23 | 24 | 18 | 20 | 19 |
| Observations | 988 | 312 | 50 | 165 | 407 | 185 | 126 | 104 | 394 | 183 | 119 | 100 |
| Middle East and North Africa | 27 | 21 | 16 | 19 | 23 | 21 | 16 | 17 | 26 | 20 | 15 | 13 |
| Observations | 546 | 133 | 16 | 99 | 226 | 106 | 66 | 71 | 211 | 96 | 66 | 70 |
| North America | 14 | 11 | 8 | 13 | 11 | 10 | 12 | 14 | 11 | 10 | 12 | 14 |
| Observations | 53 | 14 | 3 | 9 | 29 | 14 | 11 | 9 | 41 | 25 | 11 | 9 |
| South Asia | 41 | 31 | 62 | 31 | 40 | 30 | 29 | 28 | 68 | 48 | 28 | 25 |
| Observations | 202 | 81 | 2 | 41 | 146 | 81 | 55 | 43 | 112 | 72 | 37 | 35 |
| Sub-Saharan Africa | 56 | 40 | 55 | 46 | 91 | 64 | 47 | 33 | 125 | 83 | 38 | 26 |
| Observations | 1,408 | 401 | 30 | 248 | 336 | 164 | 94 | 84 | 271 | 151 | 78 | 70 |
Government Revenue Data and Quality of Governance Indicators
The most recent version of the Government Revenue Database (GRD) was used(UNU-WIDER, 2022). The GRD data has general, central, and merged government revenue, and we used the latter. We used data on government revenue which excluded grants and included social contributions, to reflect the capacity of domestic resource mobilisation. The GRD expresses all data as a percentage of GDP taken from the World Economic Outlook (WEO) in Local Currency Units (Kaufmann & Aart Kraay, 2020). We converted this into government revenue per capita in constant 2015 USD using GDP from the World Bank World Development Indicators (The World Bank, 2021). For the quality of governance of a country, we used the six dimensions of the World Bank Worldwide Governance Indicators.
The Modelling Strategy
We aimed to model three versions of the SAPTR: primary school, lower secondary school, and upper secondary school ratio. The raw data we use is the school-age population scaled by the number of teachers in a particular sector (primary, lower secondary, and upper secondary). Therefore, a number like 40 would mean that there are 40 children of a given school age per teacher. The main determinants in our model are government revenue per capita and the six indicators of the quality of governance from the Worldwide Governance Indicators. Before we begin the description of the formal modelling, it is helpful to present some plots of the data so that the actual form of the data transformations used can be better understood. To begin in Figure 1, we present a simple scatter plot of the data using the full data sample, 1980-2022 and for 241 regions or countries.
At first sight there seems very little to model here as it looks almost like an ‘L’ shape which suggests little can be extracted from this data other than a break point around government revenue per capita of $2000 constant 2015 USD above which the SAPTR rises dramatically and below which it is very low. Therefore, we need to transform the data in light of some basic properties which this ratio must obey and to spread it out in a way which reveals the basic relationship which we believe must be there. The first transformation which may help is to take the natural log of government revenue, which will help spread the data and allow a little more discrimination. Figure 2 shows the results of this transformation.
In Figure 2, we begin to see something of a non-linear relationship between the two variables. However, to fit with the modelling strategy outlined below, we would also like this relationship to be positive and to explicitly reflect the bounds which the ratio must obey. We therefore take the inverse of the ratio to give us Figure 3.
Now, we are starting to see something of a usable relationship. The inverse of the ratio is bounded below by zero (which would imply an infinite number of pupils per teacher) and above by 1 (which would imply a minimum of one pupil per teacher) and a highly non-linear ‘S’ shape relationship as government revenue goes from zero to a high level. There is clearly considerable dispersion around this central relationship, which we hope will be at least partly explained by the governance indicators of each country. We are interested in three SAPTR measures: primary, lower secondary, and upper secondary. Almost identical sets of graphs can be produced for primary and lower secondary graphs to those above. These will not be shown to save space.
Linear and log-log models with constant elasticities are unsuitable for this context. These models can produce unrealistic outcomes—such as ratios exceeding 1 at high levels of government revenue, which is not acceptable, or negative ratios at very low revenue levels, which are clearly implausible. Moreover, at extremely low income levels, increases in government revenue are likely to have minimal impact. What’s needed is a model that captures a more nuanced, nonlinear relationship—one that begins with negligible effects at low revenue, accelerates during a phase of rapid growth, and then tapers off as saturation is approached. This pattern resembles an ‘S’-shaped curve, of the following form
where Y is the dependent variable which in our case is the inverse of the three SAPTRs, x is the independent variable, the log of government revenue per capita in our case, M is the maximum of the curve and controls the steepness and shape of the curve.
In this case, we are also interested in investigating the effect of the quality of governance in determining this relationship. We, therefore, decided to adapt the basic logistic model by adding a set of exogenous variables to the function itself in the following way which capture the quality of governance
is a kx1 vector of weakly exogenous variables, that is to say, the indicators for governance and are 1xk vectors of parameters. We have now made the dependent variable explicitly , the inverse of our three pupil teacher ratios. And the main independent variable , the log of government revenue per capita. This allows the shape of the logistic curve to vary for each country depending on the vector and the measures of the quality of governance for each country in each period.
We focus on six dimensions of governance from the World Governance Indicators: control of corruption, government effectiveness, political stability, regulatory quality, the rule of law and voice, and accountability. We entered each of the six indicators into each equation for each of our three dependent variables, and then nest down from this general specification to a more parsimonious equation by eliminating each variable that proved insignificant. This then allowed us to identify the most important indicators for each of our dependent variables,
Finally we view equation (2) as a long-run relationship (formerly a non-linear cointegrating relationship (Asteriou & Hall, 2021). This means that we expect this relationship to hold over time, but not instantaneously. So, for example, if a lower-income country experienced a sudden increase in government revenue, it would not be able to instantly increase the number of teachers dramatically, but would have to build these up over time as teachers are trained and schools are built. This implies a process of dynamic adjustment, and we model this using the following dynamic adjustment equation.
where is one of our three pupil teacher ratios in period t and is the fitted value from equation (2) for that indicator, is a standard error term . This is a simple form of an equilibrium correction model (ECM), For stability, we require that which implies we are moving towards the long-run equilibrium, and this parameter partly controls the speed of adjustment towards the long-run equilibrium. 1.
- The results
The results of the unbalanced panel data estimation of equation 2 for each of the three SAPTR are shown in Table 3. Each column of the table gives the parameters set out in equation 2. are the two basic parameters of the logistic function. After each of these, we show the dimensions of governance that modify the shape of the logistic curve for each country, that is the in (2). Overall, five of the six models seem to work well and have high R2 and the coefficients are well determined as judged by the ‘t’ statistics.
We will refrain from interpreting individual coefficients in the conventional sense, as they do not represent partial derivatives. Rather, these coefficients determine the shape of the logistic function specific to each country. To gain insight into how they operate within the model, we will conduct simulations in the following section. These simulations effectively approximate the partial derivatives of the model with respect to governance and government revenue.
The governance indicators do not exhibit a consistent pattern of significance across models. Regulatory quality was found to be insignificant in the greatest number of cases (seven models), followed by rule of law (six), and voice and political stability (five). In contrast, corruption emerged as the most influential variable, showing significance in every model, with government effectiveness close behind. The consistent significance of certain indicators underscores the extent to which the shape of the logistic curve differs across countries, reflecting diverse governance dynamics.
Table 4 provides the details of the dynamic model (Equation 3) for each of the indicators. is in all cases negative and significant as required. is quite large and highly significant. The R2 is close to one, indicating a very good fit, and the DW statistic clearly shows no sign of serial correlation in the errors. As we would expect, the results suggest that it takes a number of years to approach the long run equilibrium.
The shape of the curves and the importance of the quality of governance
While the estimates appear reasonably robust—with statistically significant coefficients and high R² values—it remains difficult to gauge the precise importance of the governance variables based solely on the estimated parameters. This challenge arises in part because the model does not yield straightforward elasticities, and the impact of governance can vary considerably depending on where one is along the S-shaped curve. Although governance indicators are statistically significant, this does not necessarily imply they are numerically influential. The complexity is further compounded by the diversity of countries in the dataset, each exhibiting unique characteristics. Due to space limitations, we cannot present the behavior of each country individually. To better assess the relative influence of governance and government revenue per capita, we conducted a series of targeted simulations. We begin by setting all six dimensions of governance to -1.5, (we call this poor governance) which is representative of some of the countries in our sample. For example, in low-income countries in 2018, control of corruption ranged from -1.80 to +0.58, and government effectiveness, -2.19 to + 0.21. In the same year, the range for high-income countries was -0.57 to +2.21, and for government effectiveness, -0.02 to + 1.98.
We estimate the long-run relationship between governance and these three ratios. We then reset all the governance indicators to zero, the mid-point of the range, (which we call reasonable governance) and again calculate the relationship between per capita government revenue and the SDG variable. We then graph each pair of relationships to observe both the effect of an improvement in governance and the effect of government revenue per capita. Figure 4-6 shows the graphs for this experiment for the inverse SAPTR for the three levels of education: primary, lower secondary, and upper secondary. Figure 4 shows the relationship between governance, government revenue, and the primary SAPTR. The quality of governance makes relatively little difference to the primary SAPTR, and the main driving force is the level of government revenue. Figure 5 shows the effect of government revenue and governance on the inverse of SAPTR for lower secondary school education. Both lines slope upward which shows that an increase in government revenue always improves the SAPTR, but the striking feature is the dramatic increase in the ratio when moving from poor governance to neutral governance.
Figure 6 shows the equivalent experiment for the upper secondary SAPTR. This picture is very similar to that in Figure 4, but there is a striking difference between Figure 5. The effect of an improvement in governance is also positive but, in this case, much smaller than in the case of Figure 5. While in both figures the curves slope upward, showing that an increase in government revenue improves the ratio, the slope for the upper secondary ratio is much steeper.
The conclusion from these two pictures is therefore quite stark in that improving governance is the way to get more teachers into lower secondary education, while the upper secondary sector responds much more strongly to increases in government resources.
To summarise these results, both governance and the level of government revenue per capita work as we would expect to improve the SAPTR, but we have a somewhat surprising result for the lower secondary sector that improving the quality of governance has a much larger effect than simply increasing government revenue, while for primary and upper secondary, an increase in government revenue is more effective than improving the quality of governance. This may be because all governments recognise the importance of primary education, and so the quality of governance is not so important here. Lower secondary education is an area where good governance is important in establishing widespread secondary education. Once countries embark on widespread upper secondary education, it is again more a matter of resources than the quality of governance.
4. Discussion and Conclusions
Additional government revenue will result in additional teachers. Improved governance quality amplifies this effect, particularly in lower secondary education, while the primary and upper secondary sectors respond much more strongly to increases in government resources. This modelling and its accompanying visualisations allow us to predict the potential of an increase in government revenue (for example, if tax revenues increase or debt service is reduced) in an individual country on the SAPTR and thus on the number of teachers in that country and progress towards target 4.c. of the Fourth Sustainable Development Goal. We add to the literature because after comparing the SAPTR ratio to the TPR, we used this for our model. Furthermore, we have studied the upstream determinants of teacher supply, namely government revenue and the quality of governance in a country.
Limitations
Here, we have limited the focus to the supply side of education, specifically the supply of teachers, and to quantity but not quality. There is some support for this approach; for example, In South Africa, it was empirically found that increasing the number of teachers employed by the government significantly affects education quality(Kimani, 2022).
We now consider our findings in light of other works. Asongu and Odhiambo used OLS and quantile regressions to study the impact of indicators of the quality of governance on their proxy for educational quality which was the PTR in primary school in 49 African countries, between 2000 and 2012. They found a non-significant association between governance indicators and PTR, which is in tandem with our findings on SAPTR at the primary school level. Further, they found the strongest association between corruption and government effectiveness and PTR which is similar to our findings that these two governance indicators do most of the work in our model (Asongu & Odhiambo, 2020).
Hallerod et al. used mixed model regressions to study the impact of quality of governance, democracy and GDP on child deprivation including education. As their measure of education, they used ‘ever been to school’ and found surprisingly that the quality of governance had no effect, and their measure of education was only impacted by GDP per capita (Halleröd et al., 2013). Their interpretation of these findings was that even countries with a very low quality of governance managed to provide rudimentary educational systems to provide a very basic education for children. Their findings and interpretation are aligned with our findings that for primary school inputs, measured here as SAPTR, the important factor is revenue (which is correlated with GDP depending on the tax-to-GDP ratio), rather than governance.
Richards and Vining’s findings diverge from our findings on primary school education. They used primary school completion as a proxy for educational quality, whereas we used SAPTR. In addition to governance indicators, they included GDP per capita and government spending per student. They found the governance and literacy of the parents to be the most important independent variables (Richards and Vining, 2015). The inclusion of a demand-side variable (parental literacy) may have reduced the impact of the supply side variables in the model. Furthermore, including GDP per capita and government spending per student in the model, which are highly correlated and may have reduced the impact of both independent variables. Fomba et al., found the quality of governance, spending per pupil and GDP per capita and to be significant mediators of primary school completion which is in tandem with our findings (Fomba et al., 2022).
The surprising result that improving the SAPTR for the lower secondary level appears to be more sensitive to changes in the quality of governance than the primary and upper secondary levels needs to be explored. To try and explain this, we employ the S-shaped curve which refers to the typical pace of formal schooling growth (and in multiple other aspects of economic development.): slow initial development of education system coverage (the bottom of the S), followed by a rapid increase, and finally a tapering off at the top of the S. Clemens notes that the S shaped curve of the scale up in education reflects the pattern seen in economic development more generally, rather than specific to education and that there is a limited role for education policy i.e., education scale up will reflect economic development in any given country (Clemens, 2011). Could it be that this work has uncovered that quality of governance is critical when countries are at the steep part of the S-shaped curve for all aspects of economic and social development, and small increases in governance have a large impact at this stage of all countries’ developmental trajectory? However, when countries are at the bottom or when they reach the top of the S-shape, it is again revenue which is critical.
In summary, additional government revenue and improved governance will result in additional teachers, and this modelling and its accompanying visualisations allow us to predict the potential of an increase in government revenue on the number of teachers in any country. Improved governance quality amplifies this effect, particularly in lower secondary education, while the primary and upper secondary sectors respond much more strongly to revenue increases.
Author Contributions
Conceptualisation; Data curation; Formal analysis; Funding acquisition; Investigation; Methodology; Project administration; Resources; Software; Supervision; Validation; Visualisation; Roles/Writing - original draft; and Writing - review and editing.
Acknowledgments
During the preparation of this work the author(s) used Paperpal to correct spelling. After using this tool/service, the author(s) reviewed and edited the content as needed and take(s) full responsibility for the content of the publication.
Conflicts of Interest
None.
References
- Asongu, S. A., and N. M. Odhiambo. 2020. The role of governance in quality education in sub-Saharan Africa. International Social Science Journal 70, 237–238: 221–238. [Google Scholar] [CrossRef]
- Asteriou, D., and S. G. Hall. 2021. Applied Econometrics. Palgrave Macmillan. [Google Scholar]
- Baldacci, E., B. Clements, S. Gupta, and Q. Cui. 2008. Social spending, human capital, and growth in developing countries. World Development 36, 8: 1317–1341. [Google Scholar] [CrossRef]
- Bashir, S., M. Lockheed, E. Ninan, and J.-P. Tan. 2018. Facing Forward Schooling for Learning in Africa. Available online: http://hdl.handle.net/10986/29377.
- Center for Global Development. 2022. Schooling for all: feasible strategies to universal education. 1–149: Available online: https://www.cgdev.org/sites/default/files/schooling-for-all-feasible-strategies-universal-eduction.pdf#page=86.
- Chikoko, V., and P. Mthembu. 2020. Financing primary and secondary education in sub-Saharan Africa: A systematic review of literature. South African Journal of Education 40, 4: 1–9. [Google Scholar] [CrossRef]
- Churchill, S. A., S. Ling Yew, and M. Ugur. 2015. Effects of Government Education and Health Expenditures on Economic Growth: A Meta-analysis. Available online: http://ssrn.com/abstract=2693942Electroniccopyavailableat:http://ssrn.com/abstract=2693942.
- Clemens, M. A. 2011. The Long Walk to School: International Education Goals in Historical Perspective. SSRN Electronic Journal. [Google Scholar] [CrossRef]
- Crawford, L., and A. Ali. 2022. Edited by Centre for Global Development. The Case for Free Secondary Education. In Schooling for all:feasible strategies to universal educaiton. [Google Scholar]
- Dhrifi, A. 2020. Public Health Expenditure and Child Mortality: Does Institutional Quality Matter? Journal of the Knowledge Economy 11, 2: 692–706. [Google Scholar] [CrossRef]
- Duflo, E., and A. Banerjee. 2011. Poor economics. In Penguin books. [Google Scholar]
- Evans, D. K., and A. Mendez Acosta. 2023. How to recruit teachers for hard-to-staff schools: A systematic review of evidence from low- and middle-income countries. Economics of Education Review 95, February: 102430. [Google Scholar] [CrossRef] [PubMed]
- Fomba, B. K., D. N. D. F. Talla, and P. Ningaye. 2022. Institutional Quality and Education Quality in Developing Countries: Effects and Transmission Channels. Journal of the Knowledge Economy: pp. 86–115. [Google Scholar] [CrossRef]
- Hall, S., and B. O’Hare. 2023. A Model to explain the impact of government revenue on the quality of governance and the SDGs. Economies 11, 4. [Google Scholar] [CrossRef]
- Halleröd, B., B. Rothstein, A. Daoud, and S. Nandy. 2013. Bad Governance and Poor Children: A Comparative Analysis of Government Efficiency and Severe Child Deprivation in 68 Low- and Middle-income Countries. World Development 48: 19–31. [Google Scholar] [CrossRef]
- Hanushek, E. A., and L. Woessmann. 2021. The Role of School Improvement in Economic Development. SSRN Electronic Journal. [Google Scholar] [CrossRef]
- Kaufmann, D., and Aart Kraay. 2020. Worldwide Governance Indicators. [Google Scholar]
- Kaufmann, D., A. Kraay, and M. Mastruzzi. 2010. The Worldwide Governance Indicators Methodology and Analytical Issues. Development Research Group, The World Bank. [Google Scholar]
- Kentikelenis, A. 2023. A Thousand Cuts. 1–16: Available online: https://assets.nationbuilder.com/eurodad/pages/3039/attachments/original/1664184662/Austerity_Ortiz_Cummins_FINAL_26-09.pdf?1664184662.
- Kimani, M. E. 2022. Does Increased Government Spending on Additional Teachers Improve Education Quality? In The Palgrave Handbook of Africa’s Economic Sectors. Springer International Publishing: pp. 1–1118. [Google Scholar] [CrossRef]
- Masino, S., and M. Niño-Zarazúa. 2016. What works to improve the quality of student learning in developing countries? International Journal of Educational Development 48: 53–65. [Google Scholar] [CrossRef]
- Montenegro, C. E., and H. A. Patrinos. 2014. Comparable estimates of returns to schooling around the world (Policy Research Working Paper 7020). September, pp. 1–42. Available online: http://documents.worldbank.org/curated/en/2014/09/20173085/comparable-estimates-returns-schooling-around-world.
- O’Hare, B., and S. G. Hall. 2022. The Impact of Government Revenue on the Achievement of the Sustainable Development Goals and the Amplification Potential of Good Governance. Central European Journal of Economic Modelling and Econometrics The 14, 2: 109–129. [Google Scholar]
- O’Hare, B., E. Mfutso Bengo, D. Devakumar, and J. Mfutso Bengo. 2018. Survival rights for children: What are the national and global barriers? African Human Rights Law Journal (AHRLJ) 18, 2: 508–526. [Google Scholar] [CrossRef]
- P. McCall, B. 2022. The Routledge Handbook of the Economics of Education. In Reference Reviews. Routledge: Vol. 30, Issue 4. [Google Scholar] [CrossRef]
- Pholphirul, P., P. Rukumnuaykit, and S. Teimtad. 2023. Teacher shortages and educational outcomes in developing countries: Empirical evidence from PISA-Thailand. Cogent Education 10, 2. [Google Scholar] [CrossRef]
- Roser, M. 2020. Our World in Data. [Google Scholar]
- Taylor, S., and N. Spaull. 2013. The effects of rapidly expanding primary school access on effective learning: The case of Southern and Eastern Africa since 2000. Working Paper 41: 47–59. [Google Scholar] [CrossRef]
- The United Nations. 2022. Transforming Education Summit. Available online: https://www.un.org/en/transforming-education-summit/about.
- The World Bank. 2020. Databank - The World Bank.
- The World Bank. 2021. World Development Indicators. Available online: https://databank.worldbank.org/source/world-development-indicators.
- UNESCO. 2021. Paris Declaration: a Global Call for Investing in the Futures of Education. Available online: https://unesdoc.unesco.org/ark:/48223/pf0000380116.
- UNESCO Institute for Statistics. 2022. National definitions of trained and qualified teachers: National definitions of trained and qualified teachers: results from the metadata collection and feasibility survey. Available online: https://tcg.uis.unesco.org/wp-content/uploads/sites/4/2022/11/WG_T_3_Teachers_Definitions-and-global-minimum-standards-qualifications.pdf.
- United Nations. 1948. Universal Declaration of Human Rights. Available online: https://www.un.org/en/about-us/universal-declaration-of-human-rights.
- United Nations. 1990. The United Nations Convention on the Rights of the Child. Available online: http://www.unicef.org.uk/Documents/Publication-pdfs/UNCRC_PRESS200910web.pdf.
- United Nations. 2022. Transforming Education Summit Thematic Action Thematic Action Track 5: Financing of education. June. Available online: https://unesdoc.unesco.org/search/72a71bb0-74c9-4ef5-a26b-934dd8b90ab8/N-bfc7b5bb-83c9-4eb5-b570-4933aff3f0e4.
- United Nations Department of Economic and Social Affairs, United Nations, and Nations, U. 2021. The Sustainable Development Goals. Available online: https://sdgs.un.org/goals.
- UNU-WIDER. UNU-WIDER Government Revenue Dataset. Version 2022. [CrossRef]
- Walker, J. 2023. TRANSFORMING EDUCATION FINANCING: A toolkit for activists. June. [Google Scholar]
- Woessmann, L. 2016. The economic case for education. Education Economics 24, 1: 3–32. [Google Scholar] [CrossRef]
Figure 1.
Upper secondary school age population to teacher ratio and government revenue per capita.
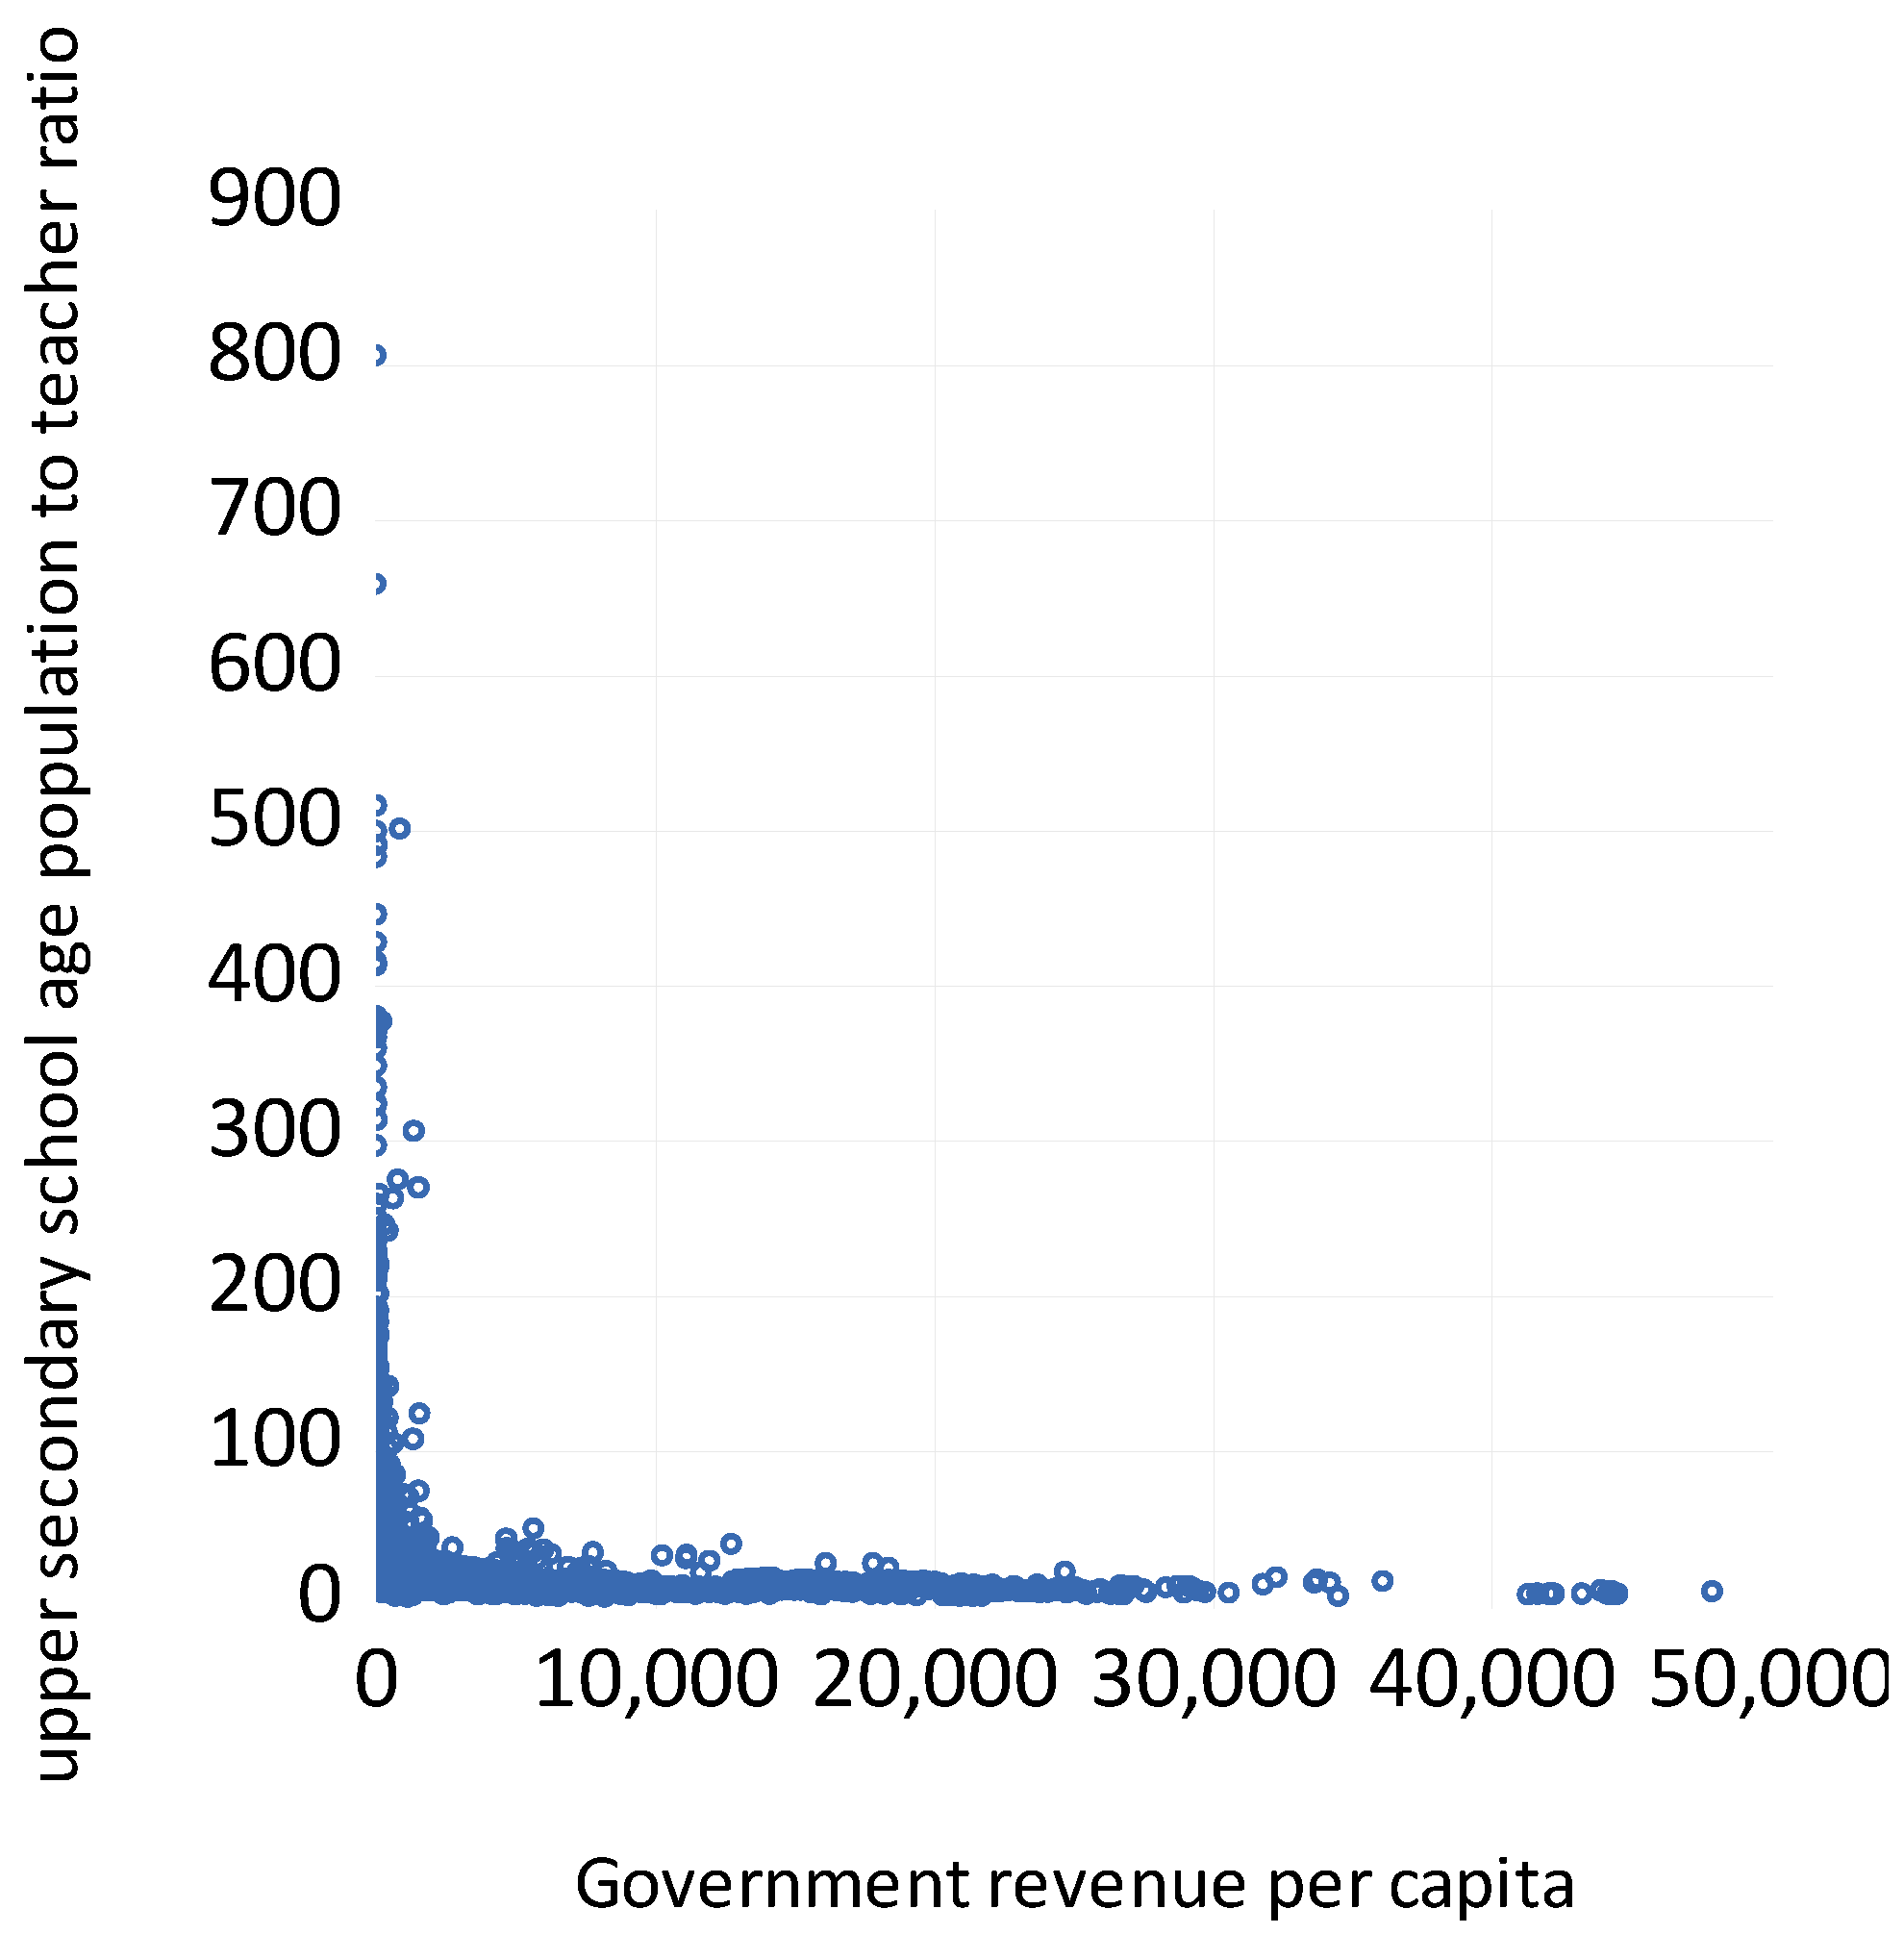
Figure 2.
Effect of using the upper secondary school age population to teacher ratio and the natural log of government revenue.
Figure 2.
Effect of using the upper secondary school age population to teacher ratio and the natural log of government revenue.
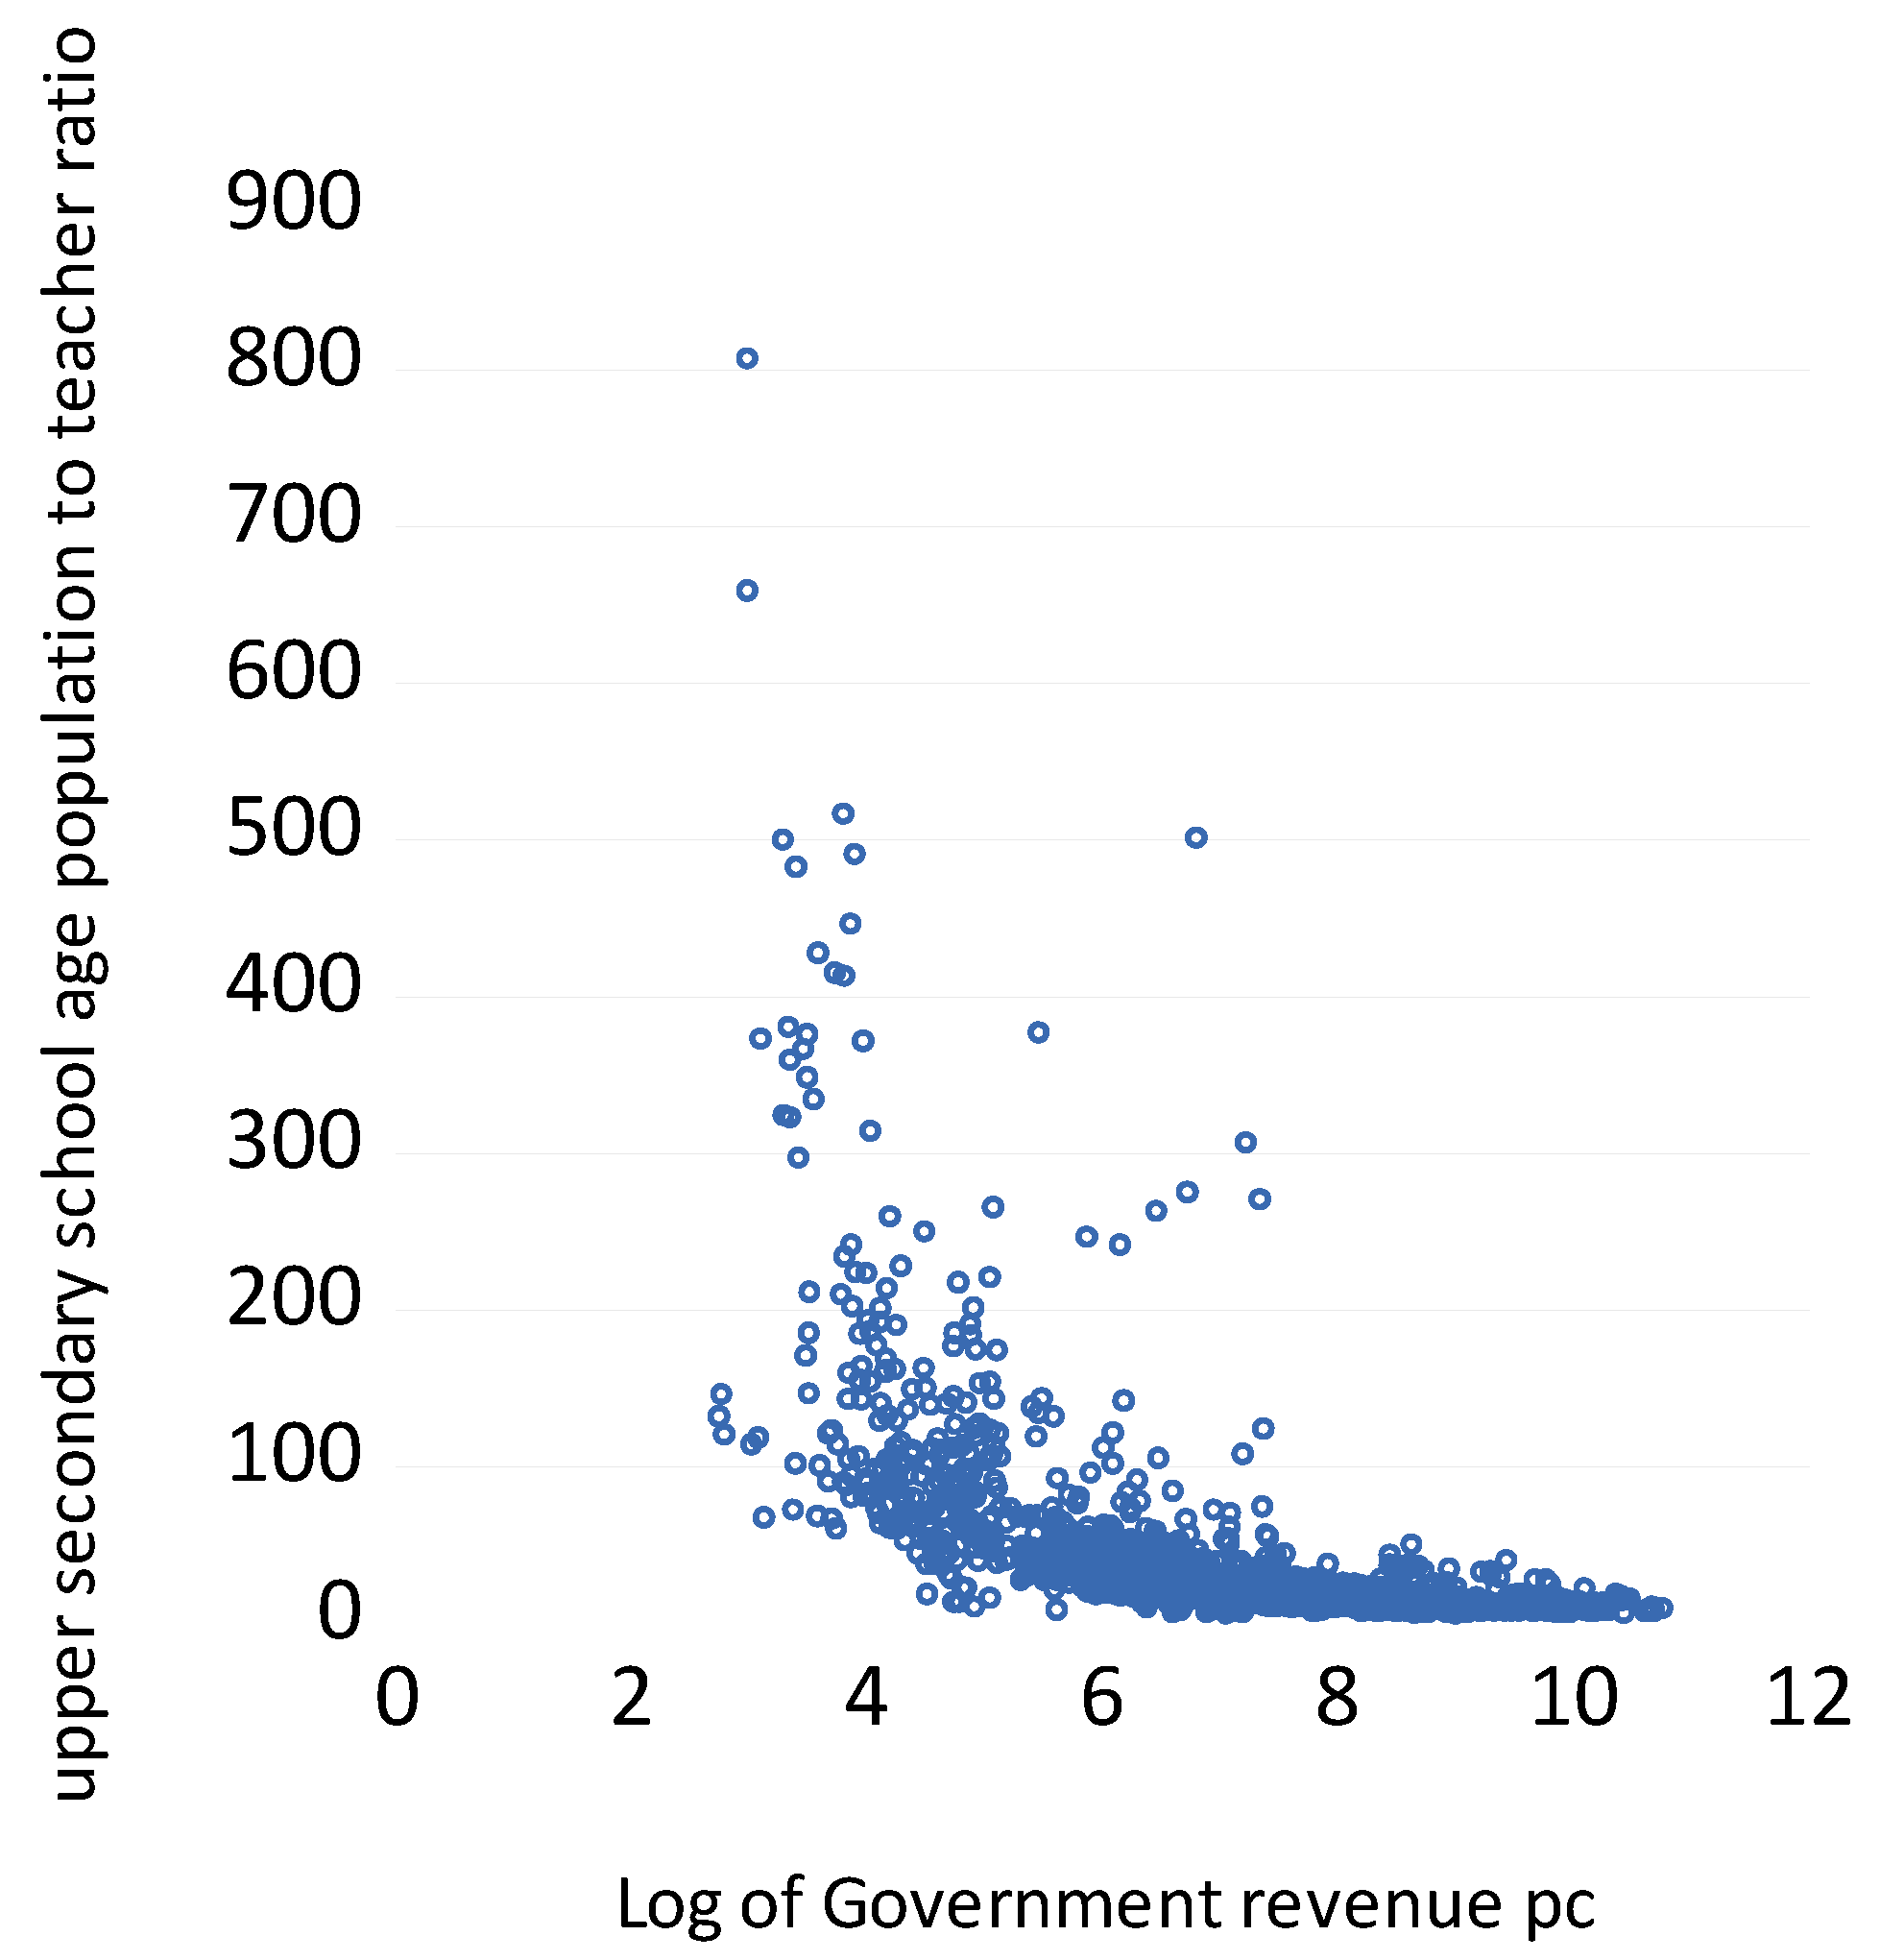
Figure 3.
The Inverse Upper secondary school age population to teacher ratio and the log of Government revenue.
Figure 3.
The Inverse Upper secondary school age population to teacher ratio and the log of Government revenue.
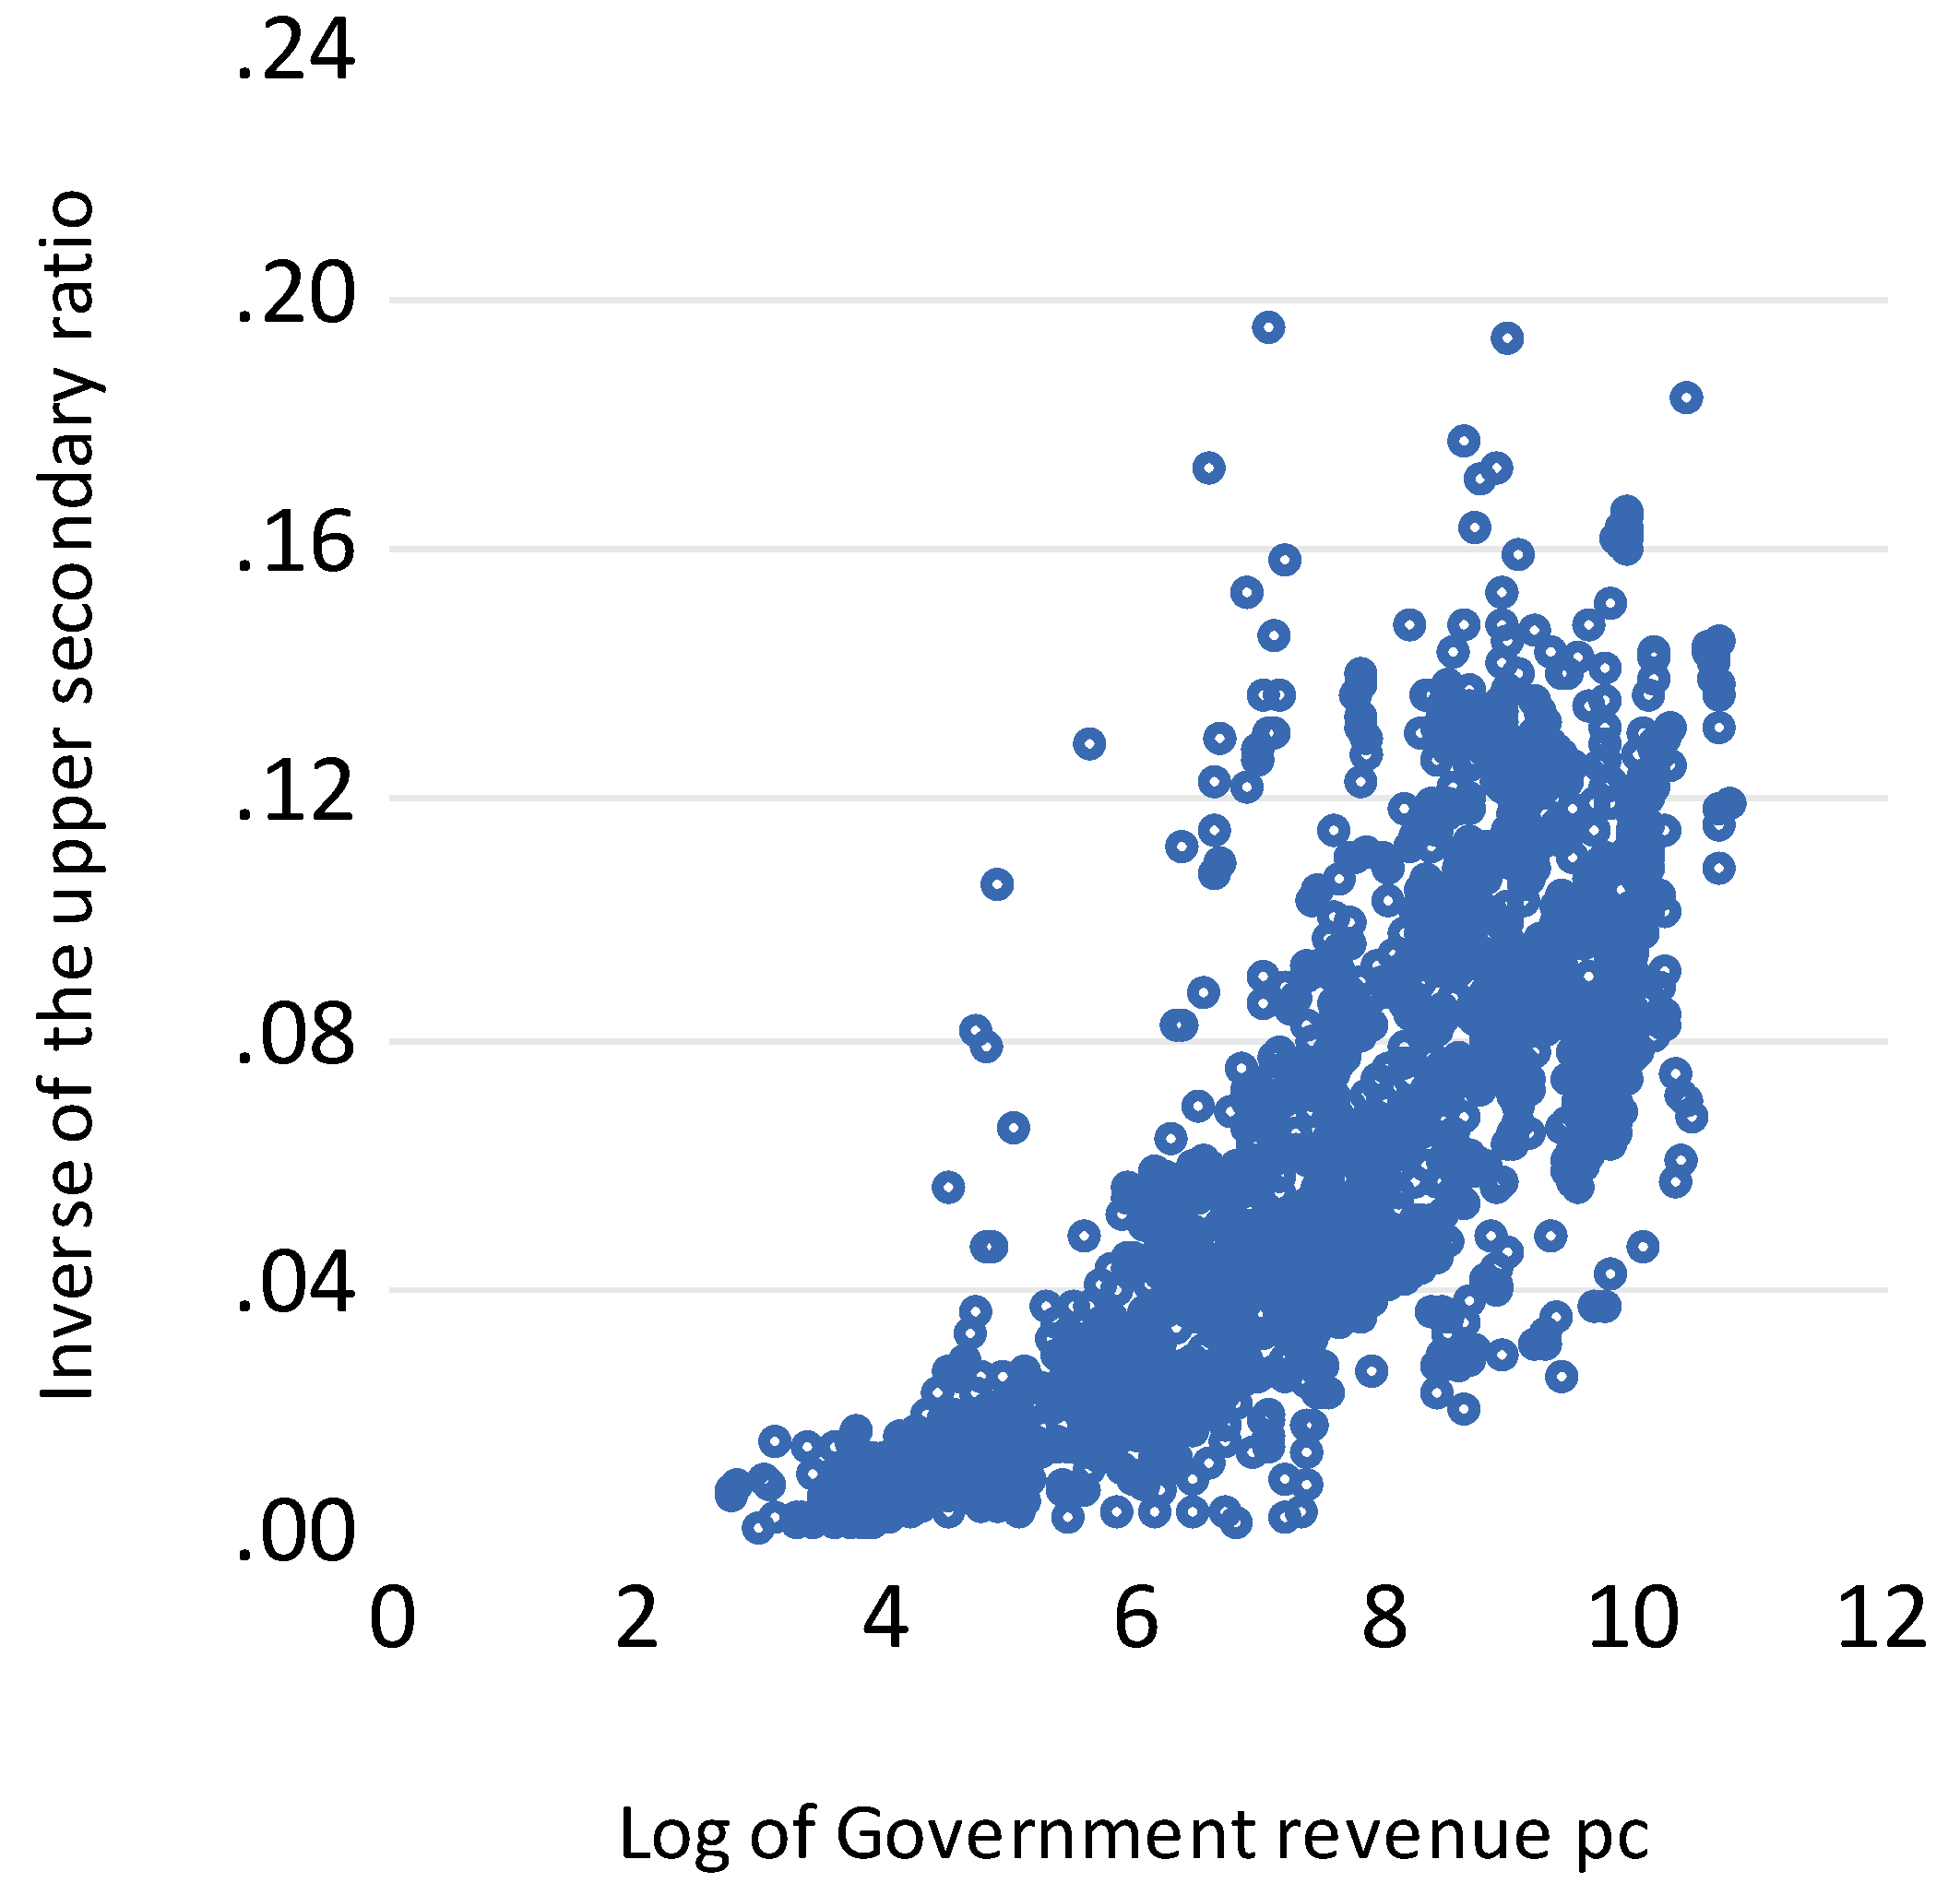
Figure 4.
The effect of increasing Government revenue and improving governance on the primary SAPTR.
Figure 4.
The effect of increasing Government revenue and improving governance on the primary SAPTR.
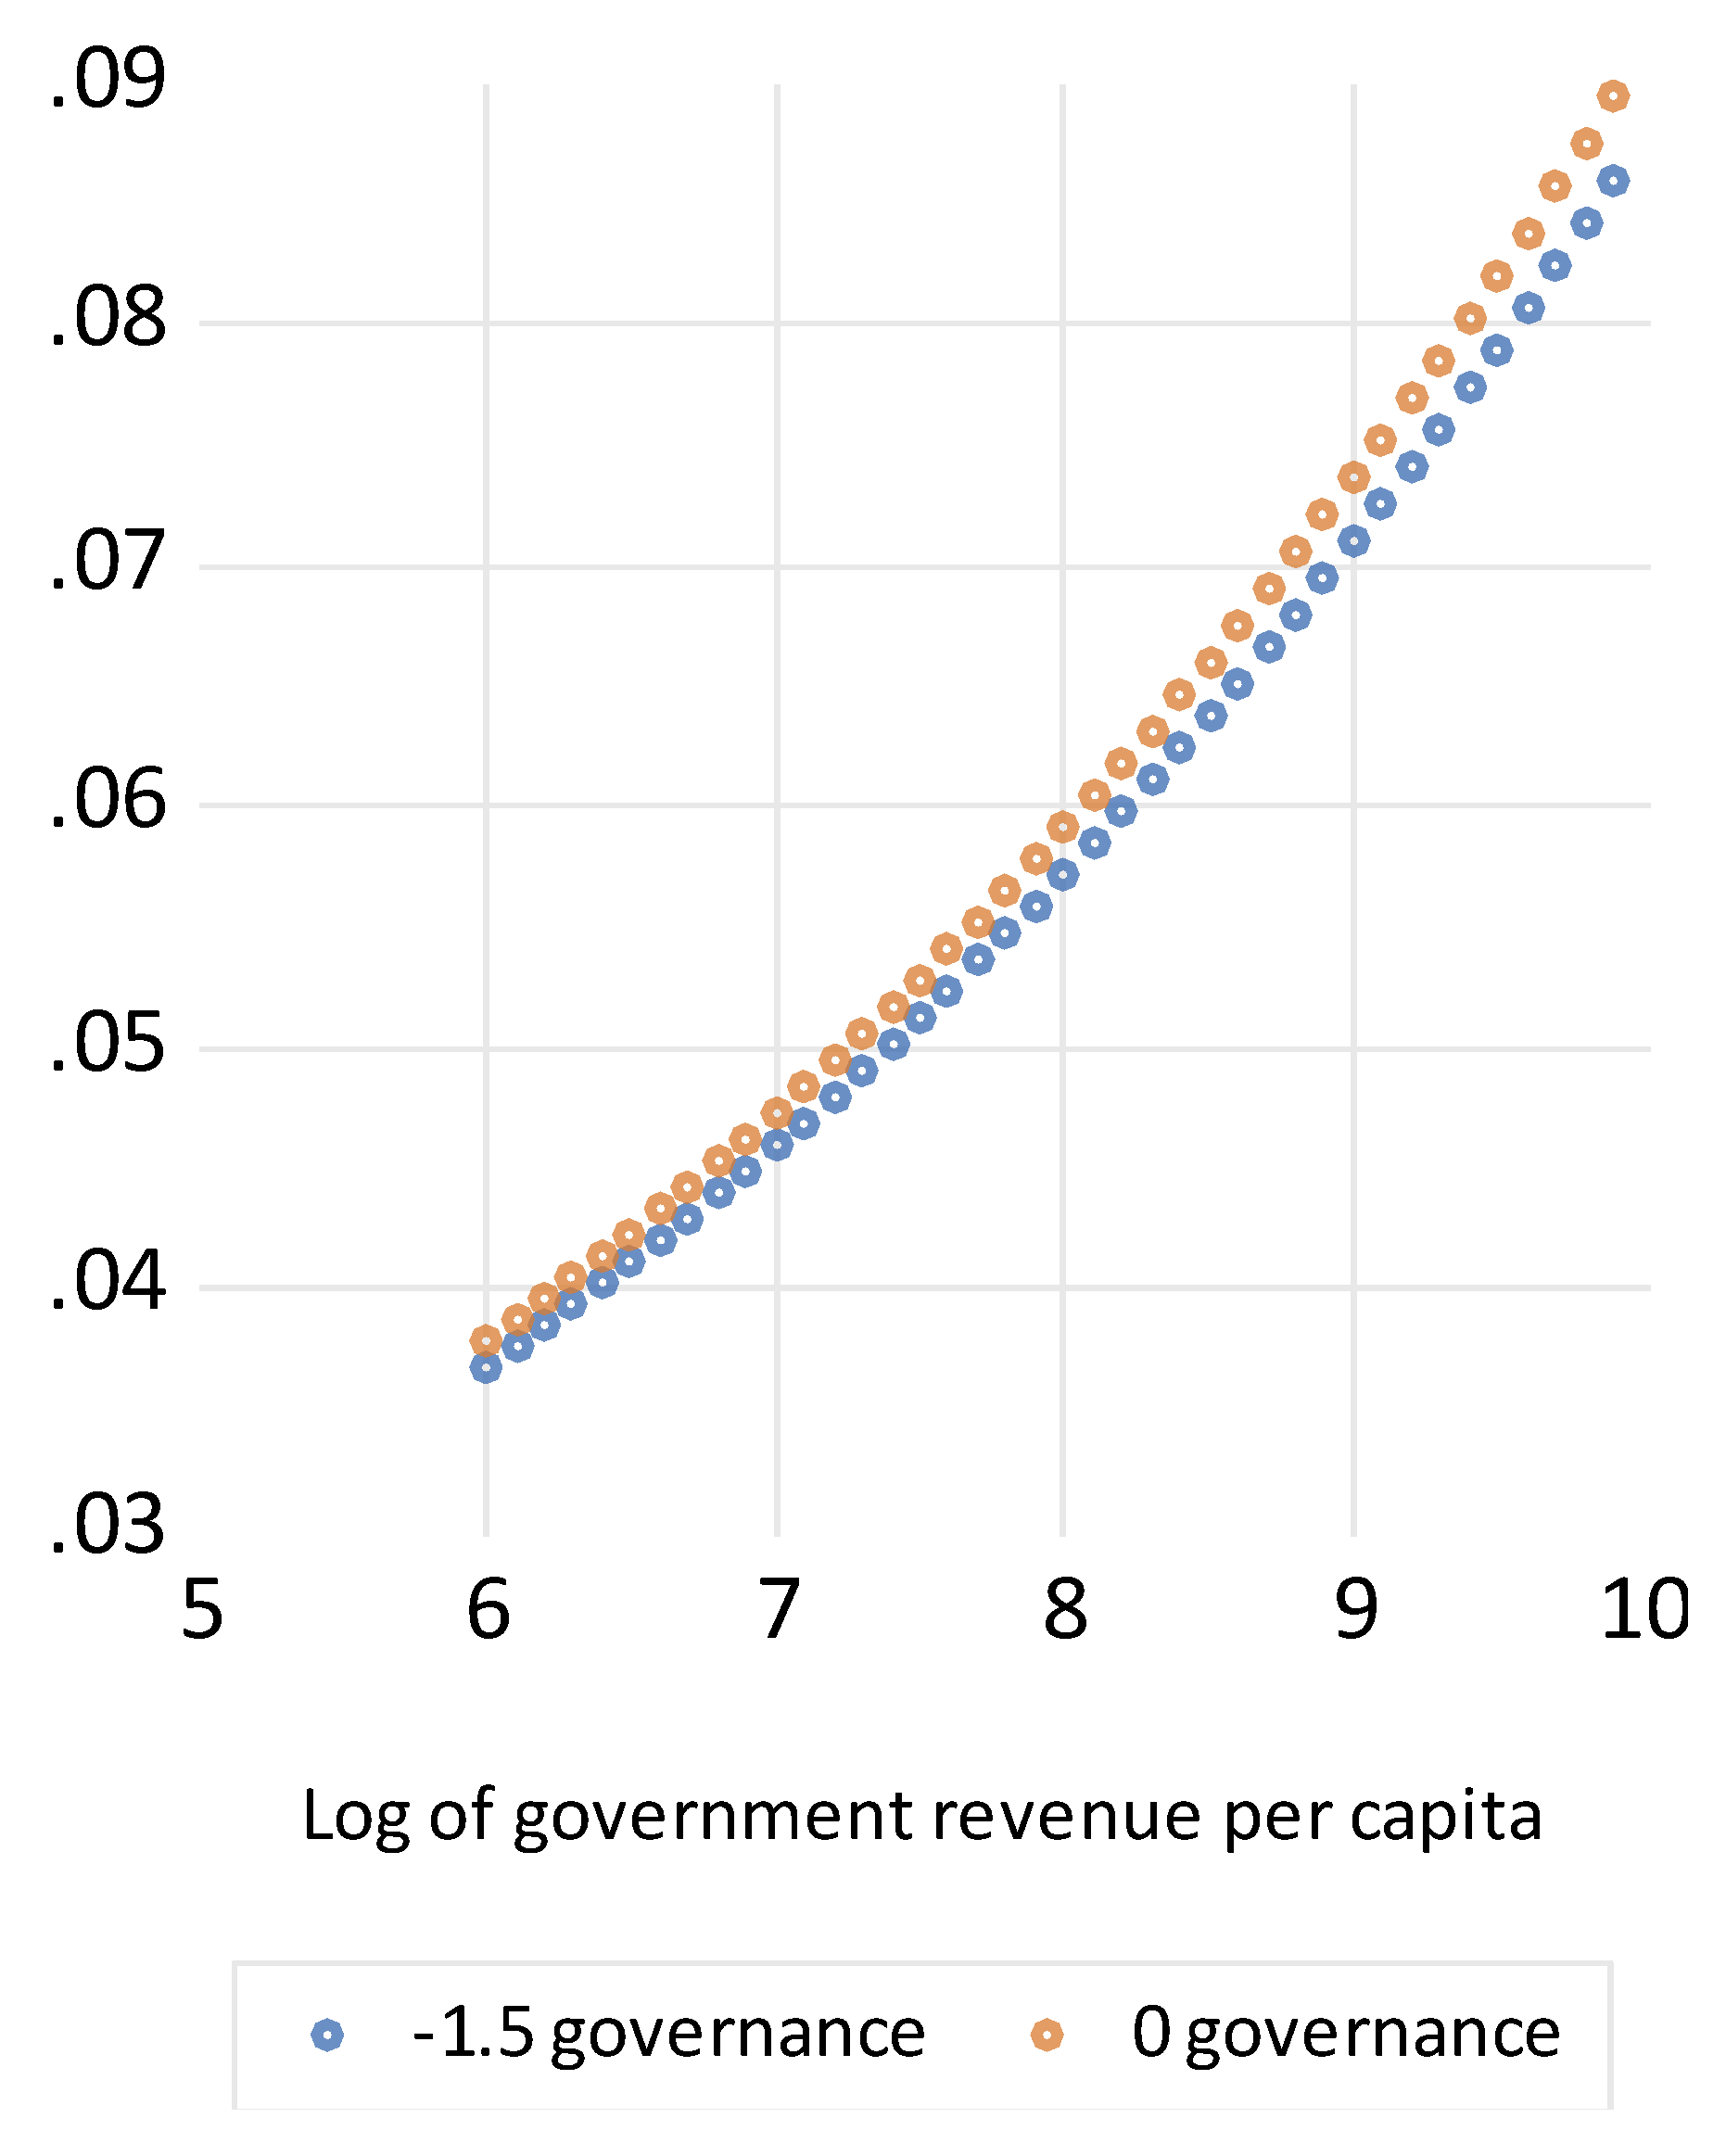
Figure 5.
The effect of increasing Government revenue and improving governance on the lower secondary SAPTR.
Figure 5.
The effect of increasing Government revenue and improving governance on the lower secondary SAPTR.
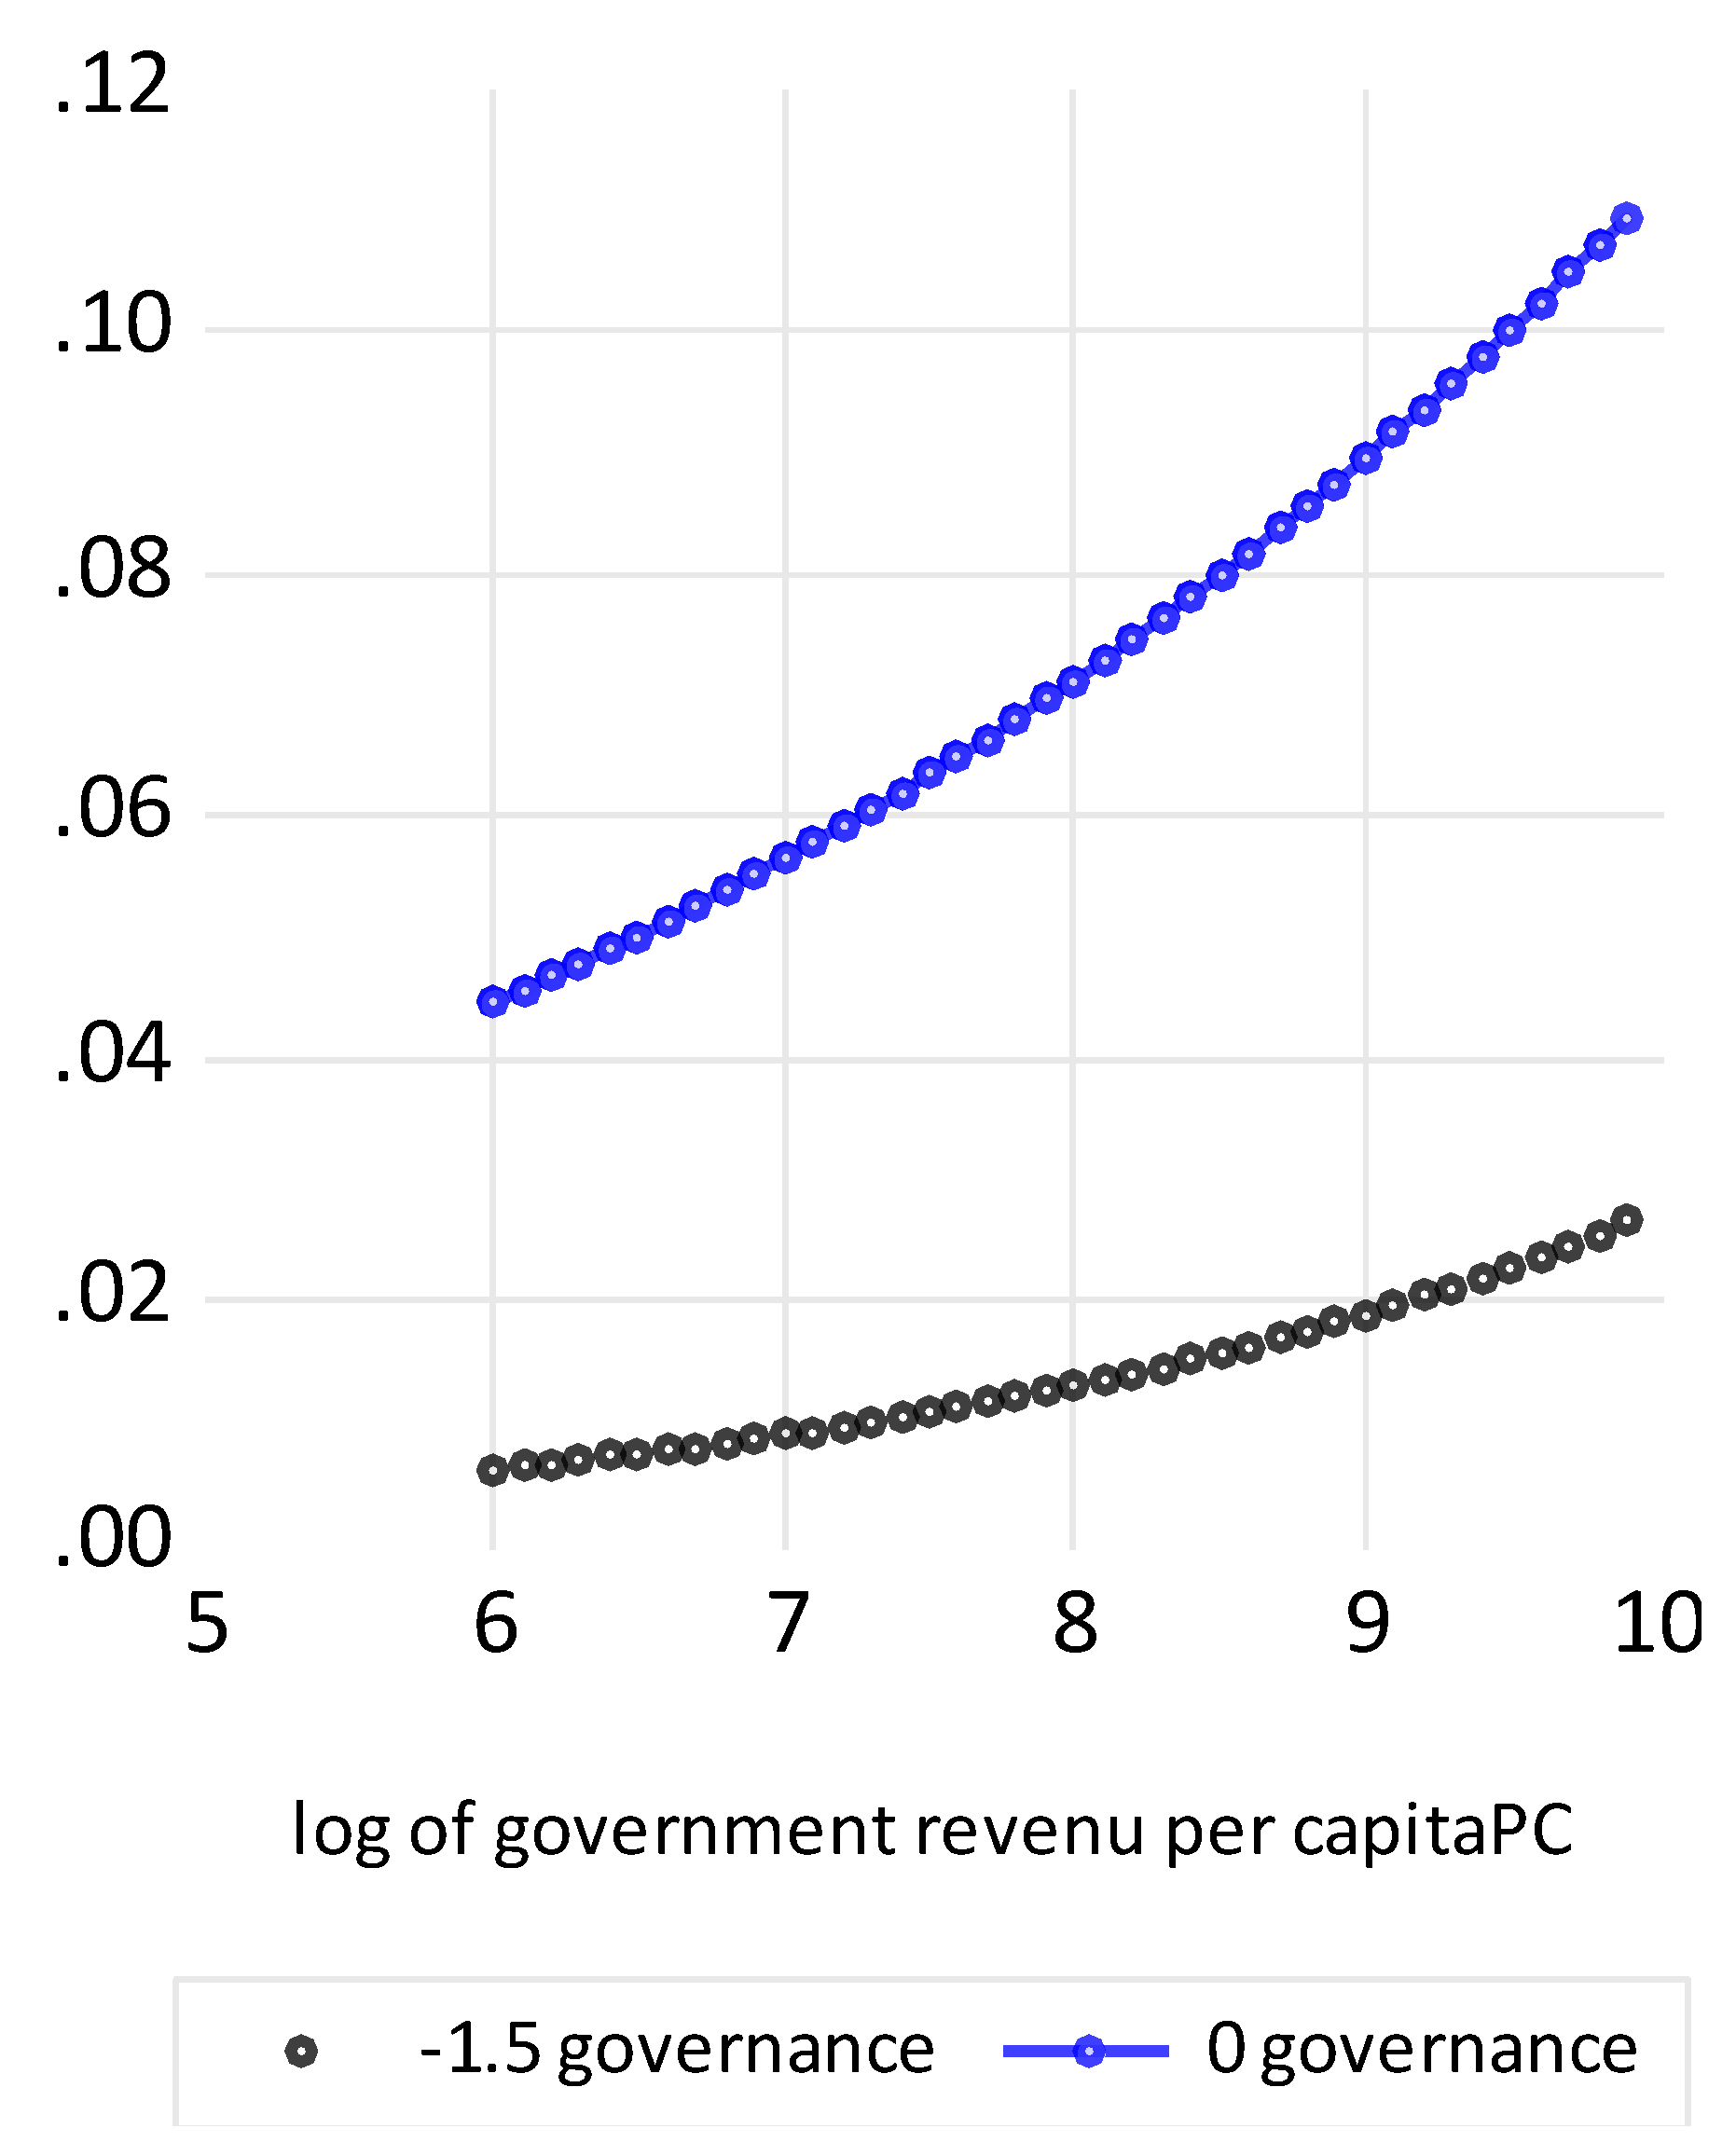
Figure 6.
The effect of increasing Government revenue and improving governance on the upper secondary SAPTR.
Figure 6.
The effect of increasing Government revenue and improving governance on the upper secondary SAPTR.
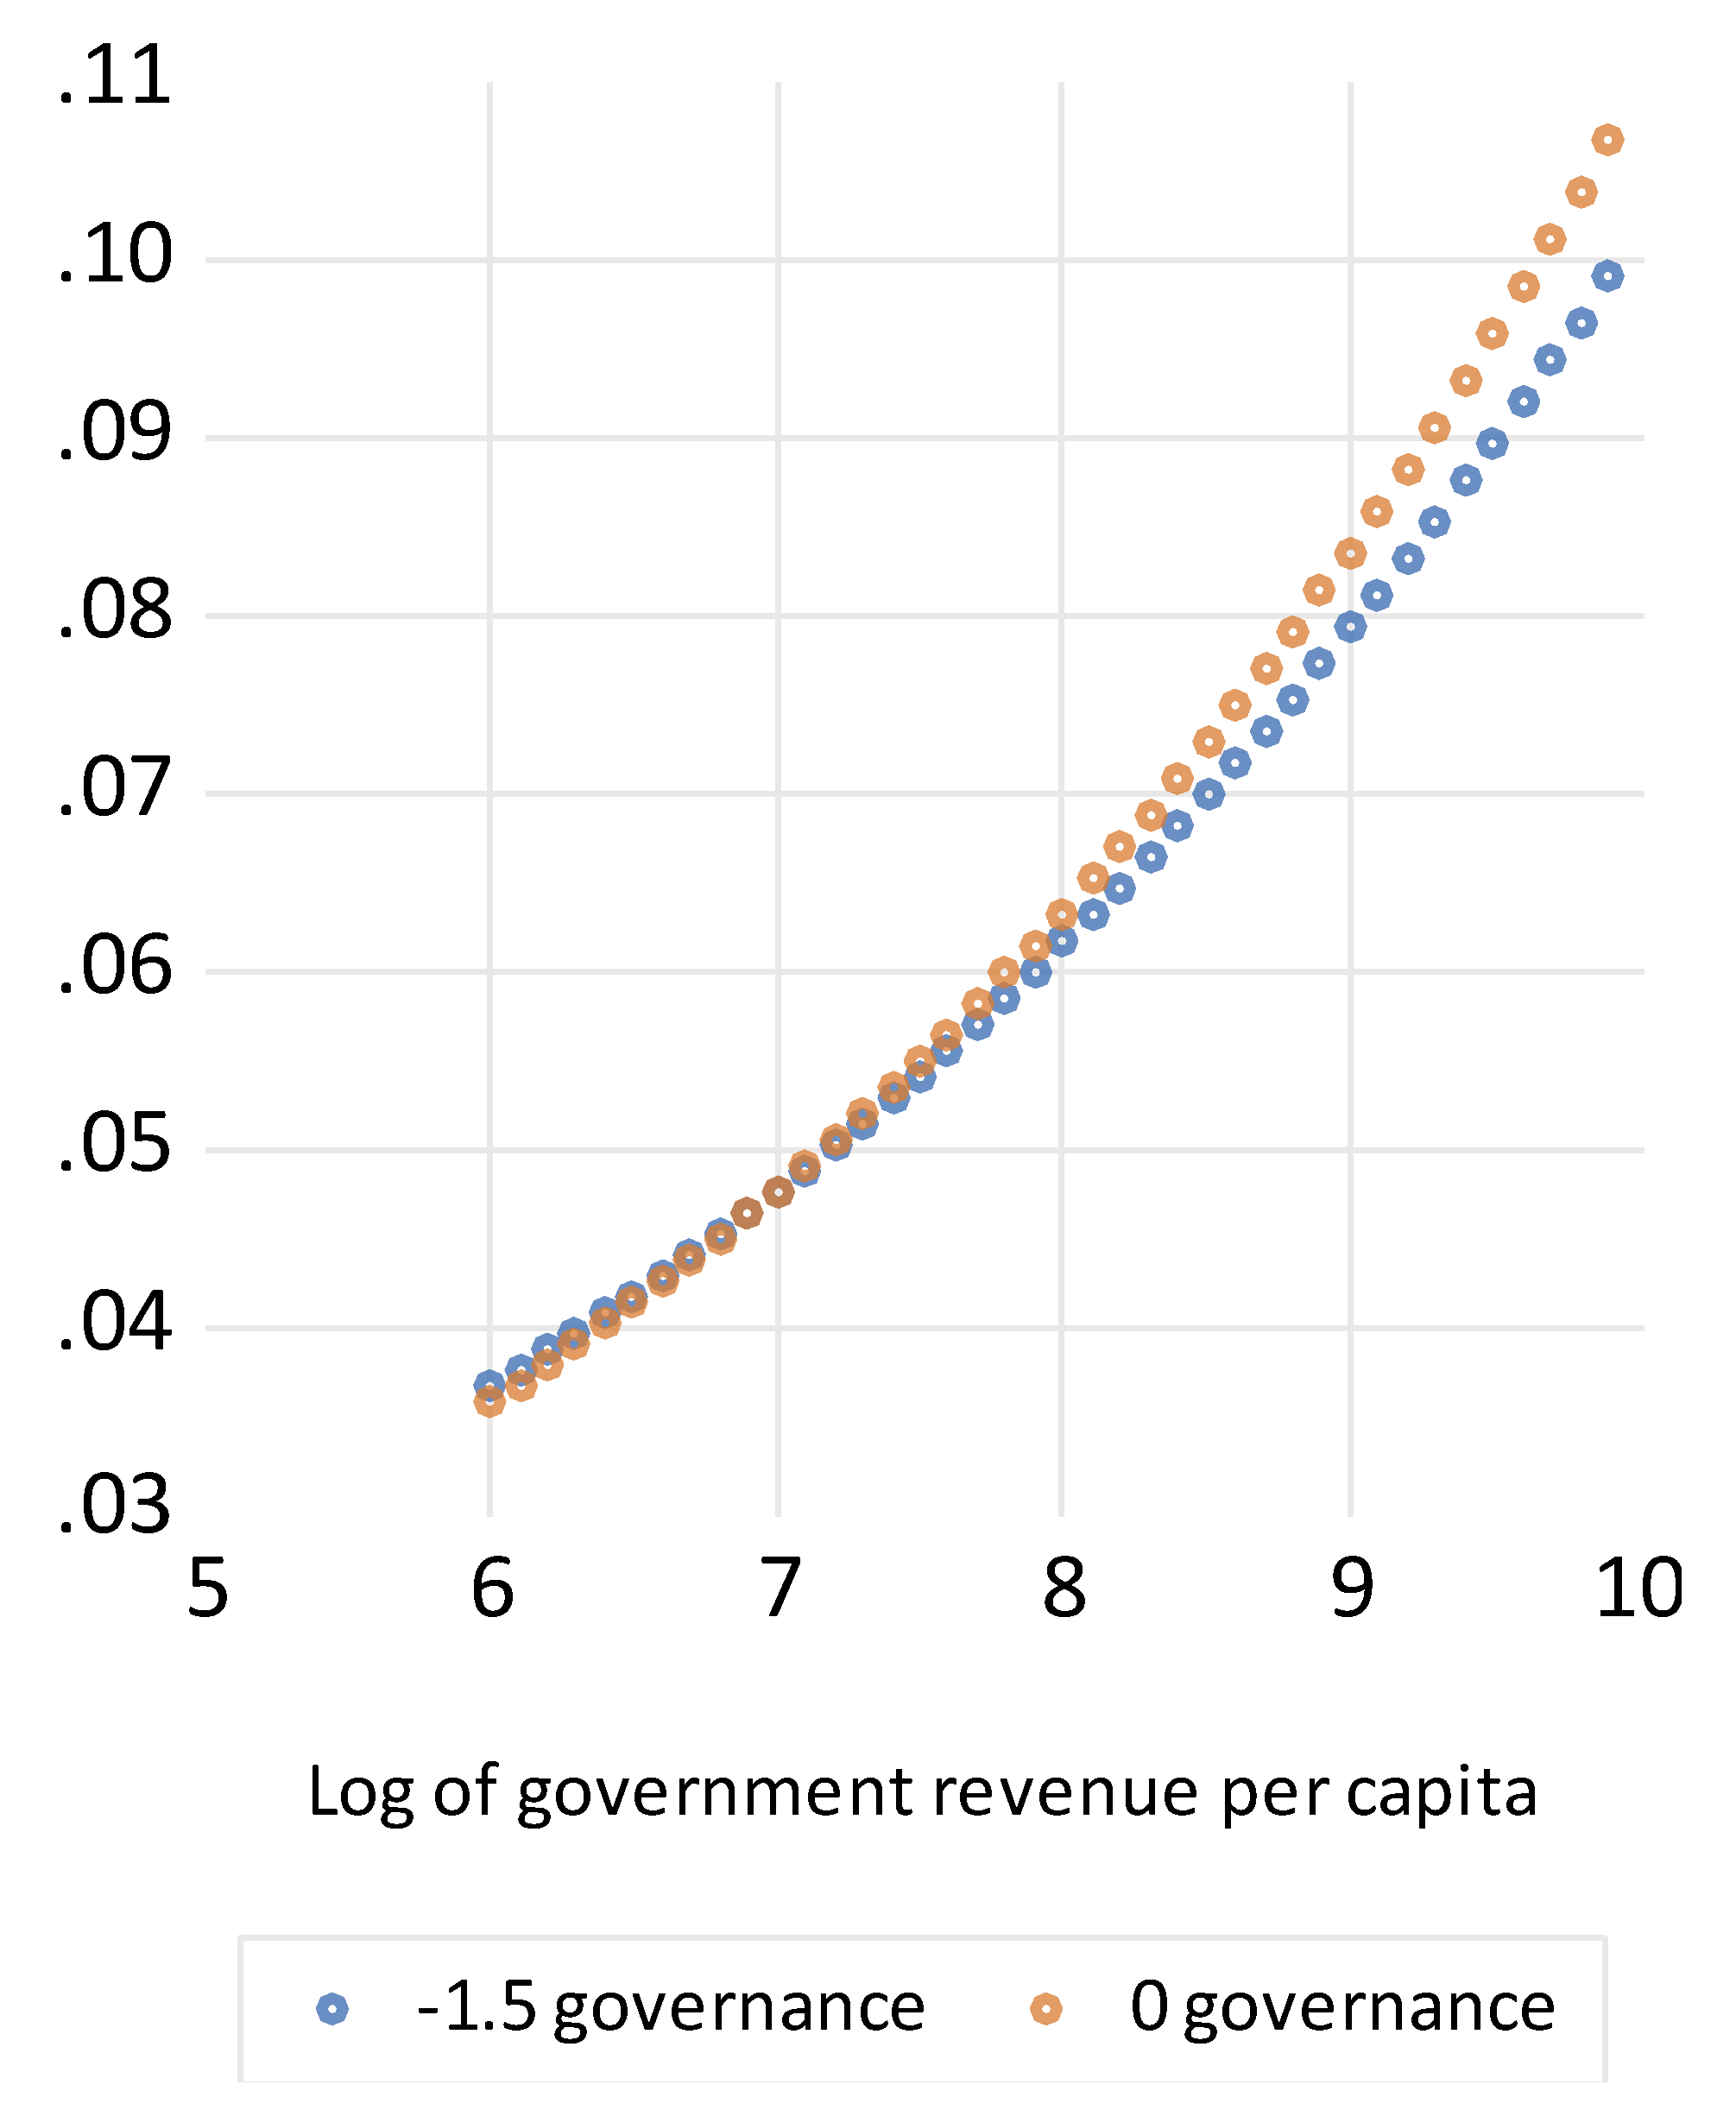
Table 1.
Drivers of increased access to education.
| Demand side (households) | Supply side (governance and government revenue) | |
|---|---|---|
| Household income Educated parents Private cost <private benefit GDP growth |
 |
Teachers (numbers, professional development, salary, incentives, monitoring and sanctions) Number of schools (distance) Removal of school fees (cash transfers, scholarships) Books and equipment |
Table 3.
The results for the logistic model for each SAPTR.
| 1/Lower secondary | 1/Upper secondary | 1/Primary | ||
|---|---|---|---|---|
| 0.25(32.6) | 0.3(37.1) | 0.23(62.2) | ||
| Control of corruption | - | 0.04(3.6) | - | |
| Government effectiveness | 0.02(6.2) | -0.02(2.0) | - | |
| Political stability | - | 0.009(4.6) | -0.009(2.2) | |
| Regulatory quality | -0.4(6.8) | - | - | |
| Rule of law | -0.2(5.1) | -0.08(7.3) | 0.03((8.5) | |
| Voice and accountability | 0.05(10.3) | 0.07(11.7) | -0.02(5.6) | |
| 18.3(61.0) | 17.0(75.1) | 19.8(107.0) | ||
| Control of corruption | -0.5(3.6) | -1.2((3.8) | - | |
| Government effectiveness | - | 0.85(3.2) | 0.4(5.0) | |
| Political stability | 0.38(4.8) | -3922.0(3.7) | 0.7(3.6) | |
| Regulatory quality | 1.7(8.9) | - | -0.5(6.1) | |
| Rule of law | - | 1.7(5.5) | -2.0(9.8) | |
| Voice and accountability | -2.3(9.1) | -2.0(9.0) | -1.1(6.6) | |
| R2 | 0.55 | 0.64 | 0.71 |
(‘t’ statistics in parenthesis).
Table 4.
The dynamic models for each Inverse SAPTR.
| 1/lower secondary | 1/upper secondary | 1/Primary | |
|---|---|---|---|
| 0.009(4.6) | 0.001(5.9) | 0.0006(6.8) | |
| -0.05(6.7) | -0.021(2.4) | -0.03(4.8) | |
| - | -0.05(2.4) | - | |
| R2 | 0.967 | 0.976 | 0.982 |
| DW | 2.1 | 1.8 | 1.99 |
(‘t’ statistics in parenthesis).
Disclaimer/Publisher’s Note: The statements, opinions and data contained in all publications are solely those of the individual author(s) and contributor(s) and not of MDPI and/or the editor(s). MDPI and/or the editor(s) disclaim responsibility for any injury to people or property resulting from any ideas, methods, instructions or products referred to in the content. |
© 2025 by the authors. Licensee MDPI, Basel, Switzerland. This article is an open access article distributed under the terms and conditions of the Creative Commons Attribution (CC BY) license (https://creativecommons.org/licenses/by/4.0/).
Copyright: This open access article is published under a Creative Commons CC BY 4.0 license, which permit the free download, distribution, and reuse, provided that the author and preprint are cited in any reuse.


