
Submitted:
30 September 2025
Posted:
30 September 2025
You are already at the latest version
Abstract
(1) Background: Steroid hormones (SH), including sex steroids and corticosteroids, are crucial for a healthy pregnancy. We identified and replicated the main determinants associated with a wide range of SH molecular features during later pregnancy. (2) Methods: We analyzed urinary SH metabolites in 1,221 pregnant women (aged 28 to 37 years) in the 3rd trimester from two cohorts: BiSC (2018-2021, n=721) and INMA-Sabadell (2004-2006, n=500). Using targeted UHPLC-MS/MS, we quantified 50 SH metabolites, resulting in 13 hormone groups, 9 sulfate/glucuronide (S/G) ratios, and 17 estimated steroid enzymatic activities across steroidogenesis pathways including progestogens, androgens, estrogens and corticosteroids metabolites. In total 89 SH molecular features were considered in the study. We applied Elastic Net Regression to identify determinants, and multivariable linear regression models to estimate variance explained (3) Results: Pregnant women with gestational age at sample collection of BiSC: 34.7 (SD 1.5) and INMA-Sabadell 34.3 (SD 1.6) gestational weeks were considered in the study. Among the 47 and 28 determinants from BiSC and INMA-Sabadell, respectively, 10 determinant-SH metabolome pairs showed statistically significant associations (P< 0.05) and were concordant in most cases in effect direction across the cohorts. Maternal BMI was the most influential predictor, accounting for 38% of the all associations, followed by maternal age (25%), maternal ethnicity (11%), physical activity (7%), smoking (5%), parity (4%), sex of the fetus (4%), dietary fat intake (4%), sleep (2%), and alcohol intake (2%). (4) Conclusions: Our findings provide evidence that clinical, lifestyle and sociodemographic factors shape the maternal SH metabolome during late pregnancy.
Keywords:
steroidomics
; sex steroid hormones
; corticosteroids
; pregnancy
; determinants
; steroidogenesis
; metabolomics
; placenta
; exposome
1. Introduction
Steroid hormones (SH), including sex steroid hormones and corticosteroids, play a critical role in regulating maternal and fetal physiology during pregnancy. These hormones influence a wide range of biological processes, including cell metabolism, immune cell function, stress response, and fetal growth [1]. Their concentrations change significantly throughout pregnancy, particularly in the last trimester, where estrogens and progesterones rise substantially to support fetal development. These hormonal changes facilitate maternal physiological and metabolic adaptations and may influence long-term health outcomes for the child [1,2].
SH include androgens, progestogens, and estrogens, which are distinct from corticosteroids such as glucocorticosteroids and mineralocorticoids, although all originate from cholesterol and share early biosynthetic steps (Figure 1) [3,4,5,6]. While the adrenal glands remain an important organ that produces corticosteroids, pregnancy introduces additional layers of endocrine regulation. During pregnancy, the placenta is the main endocrine organ of sex SH production, particularly estrogens and progestogens, meanwhile the fetal organs like adrenal cortex and liver produce corticosteroids and androgens [1].
Understanding interindividual SH variability during pregnancy is crucial, as this period represents a critical window where both physiological and environmental factors can influence maternal and fetal health. Given their metabolism via interconnected phase I and II pathways, it is crucial to investigate not only the parent SH but also their downstream metabolites. However, most previous studies have relied on enzymatic hydrolysis of glucuronide and sulfate conjugates, thereby overlooking potentially informative metabolites. Advances in liquid chromatography-tandem mass spectrometry (LC-MS/MS) now enable the direct quantification of a broader spectrum of metabolites, including monosulfated and disulfated forms [7]. Urine is a non-invasive suited for assessing these products in large-scale epidemiological studies. Urinary SH profiling enables the evaluation of phase I and II metabolism reactions, which modify steroid structures to enhance their solubility and excretion. These include sulfated SH metabolites, a relatively minor but highly informative component of the urinary SH profile, modulating placental and hepatic enzyme activity, and, critically, influence maternal brain neuroplasticity [7,8,9]. For example, recent neuroimaging work has linked fluctuations in estriol-3-sulfate and estrone-sulfate to dynamic U-shaped changes in gray matter volume across pregnancy and postpartum—a process associated with enhanced maternal attachment and mental health [9]. Their omission in earlier profiling represents a significant gap: by not capturing sulfated hormones directly, studies may miss key hormonal modulators of maternal brain adaptation and related clinical outcomes, including postpartum mood disorders, bonding, and cognitive changes [9].
Several factors contribute to interindividual variability in SH levels during pregnancy. Based on our review of the literature, we identified and summarized the main environmental and physiological determinants— such as lifestyle factors (diet, smoking, physical activity, and stress), maternal age, anthropometry, genetic predispositions, and sex of the fetuses (Table 1) [10,11,12,13]. Despite the increasing recognition of these factors, significant knowledge gaps remain regarding their combined effects, underlying biological mechanisms, and the available evidence remains notably limited. A recent large-scale study by Deltourbe et al. (2025), which quantified 17 SH in serum samples from 949 healthy non-pregnant adults, found that interindividual variability in hormone levels is strongly influenced by biological sex, age (decline of estrogens in older women), lifestyle factors (e.g., smoking, body mass index (BMI), hormonal contraceptive use), and genetic variation [14]. The study reported that up to 45% of the variance in certain SH levels could be explained by these combined factors, with hormonal contraceptive use in women and smoking in men showing particularly strong associations. Importantly, the study focused exclusively on serum measurements, highlighting the need for integrative studies across matrices and physiological states. Other studies focused on few SH, without considering the impact of upstream or intermediate metabolites and interconnected steroidogenesis pathways, or use techniques poorly adapted to measuring these compounds.
To address these gaps, this study aims to characterize the urinary 50 SH metabolites from all the steroidogenesis pathways (Figure 1, Table S1) by targeted LC-MS/MS in pregnant women in the third trimester of gestation and identify key environmental, physiological, and genetic determinants influencing SH variability. By integrating data from the richly phenotyped Barcelona Life Study Cohort (BiSC) and replicating our analysis in an independent cohort INfancia y Medio Ambiente (INMA)-Sabadell, this research provides novel insights into the interplay of these factors and their potential implications for maternal and fetal health outcomes.
2. Results
2.1. Participants’ Characteristics
A total of 721 participants from the BiSC study were included in the primary analysis (Figure 2, Table S2). The mean maternal age was 34.4 years (SD 4.4), and urine samples were collected at a mean gestational age of 34.7 weeks (SD 1.5). Most participants were of normal weight (64%), Spanish (69%), with university education (72%), and nulliparous (61%) (Table 2).
For the replication analysis, 500 participants from the INMA-Sabadell cohort were analyzed. The mean maternal age was 31.2 years (SD 4.3), and the mean gestational age at urine collection was 34.3 weeks (SD 1.6), where the 66% were of normal weight, 89% Spanish, 73% had higher education, and 57% were nulliparous (Table 2).
In both cohorts, over 85% of participants reported no alcohol consumption or smoking during pregnancy or at its onset (Table 2).
A total of 47 determinants from BiSC and 28 determinants from the INMA-Sabadell cohort were considered in the analysis (Figure 3, Table S3). Determinants covered sociodemographic (age, ethnicity, and education levels), clinical parameters (clinical and reproductive history, obstetric complications (OC), BMI, lifestyle factors (diet, supplements, physical activity, sleep, alcohol intake, smoking), mental health indicators (depression and stress in the 3rd trimester), selected maternal single-nucleotide polymorphism (SNPs), and fetus determinants (sex and estimated weight in the first/second and in the 3rd trimester). Correlation patterns among determinants are shown in supplementary data (Figure S1). In the replication analysis (INMA-Sabadell cohort), the following data was not available or they have a more than 70% of missing data: SNPs, mental health (stress and depression), fertility treatment, medication, Polycystic Ovary Syndrome (PCOS) and some OC like preeclampsia, and type I diabetes.
2.2. Identification of SH Metabolites
Of the 57 SH (sexual steroids and corticosteroid metabolites) detected in urine, 7 were excluded from the analysis due to their poor reproducibility (Relative Standard Deviation > 35%). These included 5α-androstan-3β 17β-diol-diSulfate -I, -II, and -III, pregnandiol-sulfoglucoconjugate, 5-pregnenolone-sulfate, 5-pregnendiol-sulfate, and cholesterol sulfate. A total of 50 SH were considered in the current analyses (Table S1), including the androgen, estrogen, progestogen, corticosteroid families from the steroidogenesis pathways (Figure 1).
The raw levels of the 50 SH metabolites are described in Figure S2 and Table S4. These metabolites were also aggregated into: 13 indicators of the total production of steroid families or subfamilies (Table S5), 9 sulfate/glucuronide (S/G) ratio (Table S6), and 17 indicators of steroidogenic enzymatic activity calculated as the ratio between product and precursor (Table S7), with a total of 89 SH molecular features considered as outcomes. For the statistical analysis, all SH levels were adjusted for gestational week when urine sample was collected using the multiples of normal median (MoM) approach [15]. Progesterone and pregnenolone were the predominant groups of metabolites in both cohorts, accounting for over 80% of total steroid hormone concentrations (Figure S3). The most abundant individual metabolites were pregnandiol-glucuronide (mean 82.5 and 84.6 µmol/L, SD 37.6 and 48.0 in BiSC and INMA-Sabadell respectively) and 5-pregnendiol-glucuronide (mean 51.2 and 61.5 µmol/L, SD 29.8 and 42.3 in BiSC and INMA-Sabadell respectively) (Table S4).
In addition, pairwise correlation analysis showed positive correlation between the steroid metabolites from each family in the BiSC cohort (Figure S4, Table S8). The androgens total dehydroepiandrosterone (DHEA) and total testosterone had positive correlation among each other (r=0.26, P<0.0001) and with total progestogens (r=0.24, P<0.0001). Given that testosterone is a precursor for estrogens that can be converted into each other, their positive correlations were also expected (r=0.19, P<0.0001).
2.3. Main Determinant Selection of the SH Metabolome (BiSC Cohort): ExWAS and ENET Analyses
We first systematically tested the association between each determinant variable and each SH molecular feature through an Exposome-Wide Analysis (ExWAS) (Table S9). Overall, we tested more than 4800 associations between exposure and SH molecular features (54 exposures (including dummy variables)*89 outcomes (50 SH metabolites, 13 indicators of the total production of steroid families or subfamilies, 9 S/G ratio, and 17 indirect indicators of steroidogenic enzymatic activity calculated as the ratio between product and precursor). ExWAS linear regression models were adjusted by technical variables related with urine collection such as hospital in the third trimester visit or at birth, COVID-19 exposure period (covid confinement), and season of birth. After the ExWAS analysis, 43 determinants were significantly associated with at least one of the 89 SH molecular features, yielding 236 positive and 265 negative suggestive associations (P < 0.05, Table S9 and Figure 4). Further multiple testing correction using the effective number of tests (ENT) was applied for each determinant within each SH molecular features (see Methods for more details). With this criteria, 47 determinant-SH molecular feature associations were statistically significant comprising 17 positive and 30 negative associations (Table S9). Miami plots display determinant-SH molecular feature associations by family of determinant (Figures S5-S8). Maternal BMI in the third trimester was the most predominantly determinant associated with SH molecular features (60% of the associations observed after multitesting correction), following by maternal age (17%), energy adjusted fat intake (9%), ethnicity (4%), fetal weight in the 3rd trimester (4%), adjusted Mediterranean diet (aMED) (2%), PCOS (2%), and progesterone medication (2%) (Figure S9).
To account for potential collinearity between predictors and to identify the most influential variables in a multivariable context, we applied Elastic Net regression (ENET), a penalized regression method that combines L1 and L2 regularization to perform variable selection and shrinkage simultaneously (see Methods for more details). Using ENET, we identified 45 determinants associated with at least one of 86 SH molecular features, including 49 individual SH metabolites, 11 summed families or subfamilies, 9 S/G ratio, and 17 phase I enzymatic activity (Figure 5, Table S10, and Table S11). Maternal anthropometry contributed the largest number of associations (n=78), followed by genetic variants (n=52), smoking (n=41), fetal variables (n=38), OC (n=32), diet (n=31), ethnicity (n=29), age (n=24), parity (n=18), physical activity (n=18), sleep (n=17), alcohol intake (n=14), PCOS (n=13), SH medication (n=12), depression (n=9), stress (n=9), mother education (n=7), and fertility treatment (n=4) (Figure 5).
2.5. Steroid Hormone Level Variations Are Explained by Physiological Variables, and Lifestyle: Relative Importance Analysis (BiSC Cohort)
To determine the relative contributions of main factors explaining interindividual variability in SH molecular features, we performed a relative importance analysis based on linear regression models (adjusted for hospital, season of birth, and COVID-19 confinement), including the 45 determinants selected by ENET. The proportion of variance explained by each determinant was estimated using the lmg method (more details in method section), which decomposes the model R2 into the contribution of each variable, averaged over all possible predictor orderings. Out of 45 determinants tested, we identified significant association with at least one SH molecular feature for 37 predictors, in the categories of clinical parameters, lifestyle, mental health, sociodemographic, genetic polymorphism, and fetus predictors (Table S12). The predictors contributed to up to 17% of the variance explained from the models (Figure 6).
We observed that among all clinical determinants, maternal BMI in the third trimester had an important contribution in multiple SH molecular features. Higher BMI was significantly associated with 46 of at least one of 86 different SH molecular features, including higher total corticosteroids, and lower total estrogens and individual progestogen metabolites. Regarding S/G ratio, we observed that BMI was associated with a lower S/G ratio of corticosteroids, progestogens, and androgens, indicating a lower concentration of these SH metabolites in their inactive form. Finally, BMI was also positively associated with several phase I enzymatic activity implicated in the progestogen, androgen and corticosteroid metabolism. Gestational weight gain also contributed substantially, being associated with 24 SH molecular features. Most of these associations were negative and involved androgens, estrogens, and progestogens, suggesting that higher weight gain is related to lower levels of these SH metabolites. An exception was observed for epiandrosterone sulfate (epiAN-S), which showed a positive association with weight gain. Some determinants related to OC were associated with alterations in SH molecular features. Mild preeclampsia was linked to higher levels of androgens (total testosterone, androsterone glucuronide (Andros-G)) and the corticosteroid dihydrocortisone glucuronide, as well as lower S/G ratios for progestogens and progesterone. In contrast, type I diabetes was associated with consistently lower levels of corticosteroids, including cortisol and 20ß-dihydrocortisol glucuronide, reduced phase I enzymatic activity (21-hydroxylase and 5β-reductase + 3α-HSD), and a higher S/G ratio for corticosteroids. Pregnant women with PCOS diagnosis before pregnancy had higher androgens levels. Parity was also an important determinant of SH molecular features. Compared with nulliparous women, primiparous women had lower levels of several corticosteroid metabolites, lower estrogen (E1-G), and reduced 5α-reductase activity. In addition, medication use had an influence on SH metabolism: corticosteroid treatment was associated with lower estrogen levels, whereas progesterone treatment was linked to lower levels of corticosteroid metabolites, but higher levels of testosterone metabolites.
Among lifestyle determinants, energy-adjusted fat intake in the second trimester was one of the main dietary predictors, associated with higher levels of androgens, progestogens, and S/G ratios of estrogens and progestogens. Higher adherence to the Mediterranean diet (aMED) was associated with increased S/G ratios of corticosteroids, cortisol, and androgens. In contrast, moderate alcohol intake (0.4–1 g/day) during the second trimester was linked to lower progestogen metabolites and reduced 20α-reductase activity, while one corticosteroid (F-S) was higher compared to abstainers. Maternal smoking was also an important predictor: women who smoked more than 10 cigarettes per day in the first trimester had higher levels of androgens (etiocholanolone glucuronide (Etio-G), total testosterone), progestogens, and corticosteroids (cortisol, tetrahydrocortisone glucuronide (THE-G), corticosterone) compared to non-smokers. Finally, moderate-to-vigorous physical activity (MVPA) exceeding 150 min/week in the third trimester was consistently associated with lower levels of total corticosteroids, cortisol, 20DHE-G, and other corticosteroid metabolites.
Among sociodemographic determinants, increasing maternal age was associated with lower levels of androgens, estrogens, and progestogens. Ethnicity was also a strong determinant of SH molecular features: compared with Spanish women, those born in Latin America had lower progestogen and corticosteroid levels, and higher S/G ratios for corticosteroids and androgens. Regarding maternal education, women with university-level studies had lower progesterone metabolite levels but higher total corticosteroid levels compared with women with primary education.
Regarding genetic variants, some maternal SNPs maternal SNPs were identified as significant determinants of SH molecular features. The rs2300701 at the SRD5A2 gene was associated with higher total androgens and total testosterone. rs1937863 at the AKR1C2 gene was linked to higher estradiol sulfate (E2-S) levels. rs6493497 at the CYP19A1 gene was associated with higher progestogen metabolites and increased S/G ratio of progesterone. rs743572 at the CYP17A1 gene showed associations with individual androgens and corticosteroids, whereas rs806645 at the SRD5A2 gene was associated with higher corticosteroid metabolites. Finally, rs700518 at the CYP19A1 gene was modestly associated with lower 11β-hydroxysteroid dehydrogenase type 2 (11β-HSD2) activity.
Among maternal mental health, high depressive symptoms in the third trimester were associated with higher androgen levels (16b-hydroxy-DHEA-diSulfate (16OH-DHEA-diS) 2, 5-androsten-3b17b-diol-diSulfate(5AD-diS) -1, testosterone) and slightly lower 3β-hydroxysteroid dehydrogenase (3βHSD) activity, while higher stress score showed higher levels of androgen and corticosteroid metabolites.
Finally, among fetal-related determinants, fetal weight at 20 weeks was significantly associated with multiple SH metabolites. Higher fetal weight predicted higher levels of corticosteroids and estrogen metabolites. In contrast, fetal weight was inversely related to androgens, including DHEA sulfate and 5-androsten-3b17b-diol-diSulfate, and was negatively associated with global CYP17 activity, suggesting suppressed androgenic enzymatic activity. Fetal sex was also a significant determinant of steroid metabolism. Pregnancies with female fetuses were characterized by higher levels of estriol metabolites including estriol-glucuronide (E3-G), and greater estimated activity of CYP17A1 and 3β-HSD enzymes compared to male fetuses. Pregnancies with female fetuses also had lower levels of 17-hydroxy-5-pregnenolone-3-sulfate, a progestogen metabolite.
2.6. External Replication Analysis (INMA-Sabadell Cohort)
We conducted an external replication analysis in the INMA-Sabadell cohort which included 500 pregnant women in their 3rd trimester, to validate the associations identified in the BiSC cohort (Table S13). Among the 28 determinants selected by ENET in BiSC and available in the INMA-Sabadell cohort, 10 determinants were associated with at least one SH molecular feature. In most cases, the direction of associations was consistent across cohorts, supporting the robustness of our findings (Table S14 and Figure S10).
Regarding clinical determinants, maternal BMI was the main clinical determinant of steroid metabolism, accounting 38% of all significant associations (n = 56). Higher BMI, measured in the third trimester in BiSC and pre-pregnancy in INMA, was consistently associated with higher corticosteroid metabolites, including cortolone-G1 (aβ = 0.22 [0.17, 0.27]; aβ = 0.30 [0.23, 0.38]), cortolone-G2 (aβ = 0.17 [0.11, 0.23]; aβ = 0.21 [0.12, 0.30]), THE-G (aβ = 0.18 [0.12, 0.25]; aβ = 0.24 [0.16, 0.32]), total cortisol (aβ = 0.18 [0.13, 0.22]; aβ = 0.22 [0.15, 0.30]), and androgen metabolites such as Etio-G (aβ = 0.09 [0.01, 0.17]; aβ = 0.23 [0.14, 0.32]). At the enzymatic level, BMI was positively associated with several phase I enzyme activities, including 21-hydroxylase, 20β-reductase, 5β-reductase + 3α-HSD, CYP17, 17,20 lyase, and 11β-HSD2, whereas 11β-HSD1 and aromatase showed inverse associations. BMI was also linked to lower S/G ratios for corticosteroids, cortisol, and testosterone. Parity was associated with corticosteroid metabolism, but the pattern differed between cohorts. In BiSC, primiparous women had lower total corticosteroid levels (B-S: aβ = −0.14 [−0.26, −0.03]) and cortolone-G concentrations (aβ = −0.13 [−0.23, −0.03]) compared with nulliparous women. In contrast, in INMA-Sabadell, primiparity was linked to lower total corticosteroids (B-S: aβ = −0.32 [−0.52, −0.13]) but higher cortolone-G2 levels (aβ = 0.21 [0.03, 0.39]).
Lifestyle factors showed consistent associations with SH metabolism across cohorts. Physical activity was robustly linked to lower glucocorticoid metabolites, including total cortisol and total corticosteroids. In BiSC, women with ≥150 min/week of moderate-to-vigorous physical activity (MVPA) in the third trimester had lower total corticosteroids (aβ = −0.18 [−0.30, −0.06]) and total cortisol (aβ = −0.18 [−0.31, −0.06]), with similar associations in INMA during the first trimester (total corticosteroids: aβ = −0.13 [−0.25, −0.01]; total cortisol: aβ = −0.13 [−0.26, −0.01]). Physical activity was also associated with lower progestogen metabolites, including PT-G (BiSC: aβ = −0.14 [−0.26, −0.02]; INMA: aβ = −0.13 [−0.25, −0.01]) and total 17-hydroxyprogesterone (BiSC: aβ = −0.15 [−0.27, −0.03]; INMA: aβ = −0.13 [−0.25, −0.01]). Sleep duration or quality was also associated with androgen metabolism. Higher sleep scores in BiSC or sleeping more than 7 hours per day in INMA during the first trimester were linked to lower SG ratios of testosterone (BiSC: aβ = −0.08 [−0.15, −0.004]; INMA: aβ = −0.26 [−0.51, −0.02]). Tobacco exposure predicted higher corticosteroid metabolites across both cohorts. In BiSC, passive smoking or active smoking >10 cigarettes/day in the first trimester was associated with higher cortolone-G (aβ = −0.12 [−0.24, −0.003]), THE-G (aβ = 0.52 [0.11, 0.92]), and total cortisol (aβ = 0.36 [0.08, 0.65]). Similar trends were observed in INMA (cortolone-G: aβ = 0.44 [0.01, 0.88]; THE-G: aβ = 0.49 [0.05, 0.93]; total cortisol: aβ = 0.46 [0.06, 0.85]). Alcohol intake and fat intake showed inconsistent associations across cohorts. For alcohol, moderate intake in the first trimester (0.4–1 g/day) was associated with significantly lower levels of the conjugated progestogen metabolite 5a-Pregnandiol-3b-sulfate-20a-Glucuronide in BiSC (aβ = −0.65 [−1.18, −0.12]). By contrast, in INMA, alcohol exposure was linked to higher levels of the same metabolite (aβ = 0.46 [0.01, 0.91]). For dietary fat intake, in BiSC, higher fat intake during the second trimester was positively associated with androgen metabolites, including 5AD-diS_2 (aβ = 0.09 [0.019, 0.156]) and 16OH-DHEAS_2 (aβ = 0.21 [0.08, 0.35]). In contrast, in INMA, where fat intake was assessed in the third trimester, these same metabolites showed inverse associations (5AD-diS_2: aβ = −0.20 [−0.33, −0.06]; 16OH-DHEAS_2: aβ = −0.24 [−0.45, −0.02]).
Among sociodemographic determinants, maternal age and ethnicity were significant predictors in both cohorts. Increasing maternal age was robustly associated with lower androgen metabolites across both cohorts, including 5AD-diS_2 (aβ = −0.16 [−0.22, −0.09]; aβ = −0.20 [−0.32, −0.08]), epiAN-S (aβ = −0.23 [−0.37, −0.09]; aβ = −0.26 [−0.50, −0.02]), Andros-G (aβ = −0.23 [−0.30, −0.17]; aβ = −0.29 [−0.39, −0.18]), total DHEA (aβ = −0.19 [−0.26, −0.11]; aβ = −0.16 [−0.30, −0.02]), AN-S (aβ = −0.15 [−0.27, −0.03]; aβ = −0.24 [−0.42, −0.05]), 16OHDHEA-diS_1 (aβ = −0.19 [−0.28, −0.11]; aβ = −0.13 [−0.25, 0.001]), total androgens (aβ = −0.21 [−0.27, −0.15]; aβ = −0.23 [−0.34, −0.13]), total testosterone (aβ = −0.21 [−0.27, −0.14]; aβ = −0.27 [−0.37, −0.17]), and Etio-G (aβ = −0.23 [−0.32, −0.15]; aβ = −0.28 [−0.41, −0.16]). Age was also associated with lower corticosteroid metabolite E-S (aβ = −0.10 [−0.15, −0.05]; aβ = −0.12 [−0.23, −0.02]), as well as lower progestogen metabolites PT-diS (aβ = −0.14 [−0.26, −0.02]; aβ = −0.28 [−0.45, −0.10]) and 21OH-5P-diS (aβ = −0.11 [−0.17, −0.05]; aβ = −0.19 [−0.31, −0.08]). Ethnicity also was an important determinant. Compared with Spanish women, women of Latin American origin had lower androgen and corticosteroid metabolites, including Etio-G (aβ = −0.24 [−0.42, −0.05]; aβ = −0.69 [−1.05, −0.33]) and cortolone-G2 (aβ = −0.27 [−0.41, −0.13]; aβ = −0.41 [−0.73, −0.09]), as well as lower 20β-reductase activity. In parallel, Latin American women had higher sulfation ratios for corticosteroids. Other ethnic groups showed altered estriol S/G ratios compared with Spanish women.
Fetal determinants also contributed to variation in maternal SH metabolism. Female sex was associated with higher 3β-HSD activity and lower levels of the progestogen metabolite 5PD-20one-S in both cohorts.
3. Discussion
In this study, we provide one of the most comprehensive characterizations to date of the maternal SH metabolome during late pregnancy, integrating data from two large and well-characterized Spanish cohorts. This analysis allowed us to identify how maternal clinical, lifestyle, sociodemographic, genetic, and fetal determinants contribute to interindividual variability in SH metabolism.
3.1. A New Window into Maternal Steroid Metabolism
Using a high sensitive targeted metabolomic LC-MS/MS approach we identified 50 conjugated urinary SH metabolites including different hormonal classes: glucocorticoids, androgens, estrogens, and progestogens. In addition to quantifying individual metabolites and total class SH, we also estimated functional indices of steroid metabolism. This included phase I enzymatic activity estimates (e.g., 3β-HSD, 17β-HSD, CYP17A1) and S/G ratios—metrics that provide information about the steroidogenesis pathway. Previous studies have focused on measuring free SH in plasma or serum using immunoassays [16]. Compared with immunoassay-based studies, our LC-MS/MS approach reduces cross-reactivity and expands analyte coverage, including an extensive range of phase II conjugates, such as sulfates, glucuronides, and sulfoglucoconjugates metabolites [17]. Our study identified some novel metabolites not previously described in the literature, such as pregnanediol sulfoglucoconjugate isomers (5-pregnendiol-SG), and estriol-sulfoglucoconjugate. Also, we considered bisulfate steroid metabolites, a minor fraction of the urinary steroid metabolome. Another advantage of our study is that urine is a non-invasive and easily collectible biological matrix which is appropriate for the pregnant population in epidemiology studies [18,19]. Urine contains the end products of SH metabolism and thereby offers indirect insight into enzymatic activity, clearance pathways, and hormonal disorders [7,19].
A recent study characterized a comprehensive panel of urinary SH metabolites in a small population (N=127) of Spanish pregnant women. The study measured 34 glucuronide and sulfate-conjugated metabolites in urine samples across multiple time points: pre-pregnancy, 18 and 34 weeks of gestation, and one month postpartum, providing a detailed longitudinal profile in urinary SH [9]. E3-G was the highest estrogen metabolite during the 3rd trimester, consistent with our findings. In both studies, pregnanediol glucuronide was the most abundant progestogen metabolite in the third trimester. Regarding corticosteroids, our data identified cortolone-G and THE-G were the most abundant metabolites, whereas Servin-Barthet et al. (2025) reported THE-G and 11-dehydrocorticosterone sulfate as the dominant corticosteroids [9]. Finally, Andros-G and Etio-G were the principal androgen metabolites in both studies, showing consistent patterns in SH metabolites in the 3rd trimester of gestation.
3.2. Clinical Factors Are Consistently Associated with SH-Level Differences
Maternal BMI was the main determinant of SH metabolism, explaining 38% of all significant associations in both cohorts. Higher BMI was associated with higher urinary androgens and glucocorticoids levels. Higher BMI was also associated with higher activity of phase I enzymes (precursor-to-product ratios) including 21-hydroxylase, 20β-reductase, and 11β-HSD2. These enzymes are key regulator of corticosteroid and androgen metabolism: 21-hydroxylase catalyses the conversion of progesteron and 17-hydroxyprogesteron into glucocorticoids, 20β-reductase participates in corticoid inactivation, and 11β-HSD2 controls the interconversion between active cortisol and inactive cortisone [20,21]. Interestingly, higher maternal BMI was also associated with lower aromatase activity, a critical enzyme that mediates the conversion of androgens to estrogens [20]. These observations are in line with previous studies showing that higher maternal BMI or obesity alters SH metabolism. Barret et al (2019) reported that higher maternal BMI is associated with 1-2% lower serum estrogen levels, and 1-2 % higher androgen (total testosterone), in a study performed in 548 women carrying singletons with a median of 12 weeks gestation [10]. In addition, Maliqueo et al. (2017) showed that obesity during pregnancy affects maternal SH steroid concentrations depending on fetal sex: 36 obese women had higher testosterone, lower progesterone, and altered placental P450 aromatase expression compared to 35 non-obese control women [22]. In a systematic review based on fifteen studies, Volqvartz et al. (2023) concluded that high maternal BMI downregulated the placental 11β-HSD2 activity, increasing the fetal exposure to active cortisol [23]. Together, these findings suggest that higher maternal adiposity may favour corticosteroid and androgen metabolism, and reduce estrogen biosynthesis, and have consequences for fetal programming and long-term offspring health.
Parity (primiparous vs nulliparous) was another clinical determinant associated with corticosteroid metabolism. Primiparous women showed lower cortolone-G1 concentrations compared with nulliparous women in the BiSC cohort, while in the replication cohort they had higher levels of the cortolone-G2 isomer. In line with our findings, Gillespie et al (2018) observed that primiparous women had higher cortisol levels during mid- and late pregnancy compared to multiparous women, partially mediated by increased pregnancy distress [24]. Similarly, Marteinsdottir et al. (2020) reported that hair cortisol levels were higher in primiparous women in later pregnancy compared to multiparous women, whereas multiparas showed a decline in cortisol three months prior to childbirth [25].
3.3. Lifestyle Behaviours: Physical Activity, Sleep, Smoking, Alcohol, and Diet Are Determinants of SH Levels
Physical activity was the lifestyle determinant with the major contribution to maternal SH metabolism. Participants with higher MVPA or with higher physical activity (mets) had lower glucocorticoid metabolites, including cortisol and corticosteroid levels in both cohorts. These findings suggest that physical activity during pregnancy can regulate corticosteroid metabolism, and are supported by different studies. Budnik-Przybylska et al (2020) observed a negative correlation between hair cortisol and exercise frequency in 29 pregnant women [26]. However, they did not observe similar results in the group of non-pregnant. Rauramo et al. (1982) reported that progestogens and estradiol declined by post-exercise sessions, which is relevant because progestogens are precursors of corticosteroids [29].
Sleep duration was also a lifestyle determinant associated with androgen metabolism in both cohorts. Pregnant women with higher sleep scores or who reported sleeping more than 7h in the first trimester showed lower testosterone S/G ratio, indicating a relative reduction in testosterone in its inactive (sulfated/glucuronidated) versus active form. Although the effect size is lower, these associations suggest that early-pregnancy sleep may influence androgen metabolism in later pregnancy. Evidence in pregnant women is limited. However, the study reported by Hernández-Perez et al. (2023) supports our findings in non-pregnant women. In a large NHANES study, women aged 41-64 years who reported very short sleep time (< 6 h) or long sleep (>=9h) had lower testosterone compared to women sleeping 7-8h [27].
Prenatal tobacco exposure was associated with marked alterations in corticosteroid and androgen metabolism. Smoking was consistently linked to higher cortisol, cortolone-G and THE-G in both cohorts. These findings align with previous studies that showed how maternal smoking during pregnancy impacts both maternal and fetal SH metabolism. Lopez&Seng (2014) showed that smoking during pregnancy was associated with higher salivary cortisol [28]. Varvarigou et al (2006) showed that cord blood cortisol levels were higher in newborns of smoking mothers compared to nonsmokers (23 vs 13 µg/dL), with positive correlation between the number of cigarettes smoked per day and neonatal cortisol levels [29]. Smoking may also modulate androgen metabolism. Rizwan et al (2026) reported that maternal smoking was associated with higher fetal testosterone, supporting the hypothesis that tobacco smoking can alter androgen metabolism in utero [30]. Evidence also highlights the long-term consequences of maternal smoking. Cajachagua-Torres et al. (2021) found that children prenatally exposed to maternal cannabis combined with tobacco had higher hair cortisol levels at 6 years of age [31].
Alcohol and dietary fat intake showed inconsistent associations with steroid hormone metabolism across cohorts. In BiSC, moderate alcohol intake during the first trimester (0.4–1 g/day) was associated with lower levels of the conjugated progestogen metabolite 5α-Pregnandiol-3β-sulfate-20α-Glucuronide, whereas in INMA, alcohol exposure was linked to higher levels of the same metabolite. These opposing directions highlight potential cohort-specific differences in drinking patterns, timing of exposure, or residual confounding. Halmesmäki et al. (1987) found that alcohol during pregnancy was associated with lower estrogens and progestogens levels in fetal alcohol syndrome cases [32]. Similarly, dietary fat intake showed opposite associations across cohorts. In BiSC, higher energy-adjusted fat intake during the second trimester was positively associated with androgen metabolites, including 5AD-diS_2 and 16OH-DHEAS, suggesting that fat intake may contribute to increased androgens during mid-pregnancy. In contrast, in INMA, where fat intake was assessed in the third trimester, these same metabolites were inversely associated, indicating that the timing of dietary assessment or cohort-specific nutritional patterns could influence the relationship between fat intake and androgen metabolism. Lof et al. (2009) did not find association with fat intake and plasma estradiol levels in 226 pregnant women on gestation weeks 12, 25 and 33 [33].
3.4. Maternal Age and Ethnicity as Sociodemography Determinants Associated with SH Metabolism
In both cohorts, older pregnant women had lower androgen, corticosteroid, and progesterone metabolites, and CYP17 activity. Barret et al. (2019) and Kallak et al. (2017) reported that older women had lower serum testosterone levels in the first and third trimester of pregnancy [10,12]. This age-related decline in steroidogenic output may contribute to the increased risk of adverse reproductive outcomes—including preterm birth and altered fetal growth—observed in pregnancies at advanced maternal age [34].
Ethnicity was another consistent determinant of corticosteroid metabolism in both cohorts. Latin American-born pregnant women were more likely to have lower cortolone levels compared to Spanish women. These differences may reflect a combination of biological and psychological factors. Ethnic variation in hypothalamic-pituitary-adrenal axis function has been documented, with African American pregnant women with lower levels of cortisol compared to non-Hispanic white women, and higher adrenocorticotropic hormone levels than Hispanic women [35]. Psychosocial stressors, such as ethnic discrimination and depression risk, also can influence maternal cortisol and its metabolites levels [36,37], however this topic was not considered in our analysis.
3.5. Genetic: SNPs from Steroidogenesis Enzymes
Although genetic variants were not evaluated in the replication analysis because of more than 75% of missing data, it is necessary to mention that in the main analysis (BiSC cohort) we identified some SNPs associated with variation in steroid levels and enzymatic activities, most notably in ratios related with the activity of 11β-HSD1, CYP17A1, and CYP19A1 (aromatase), enzymes implicated in the synthesis of glucocorticoids and estrogens, respectively. Kallak et al. (2017) found that rs700518 (CYP19A1) was associated with testosterone [12].
3.6. Fetal Determinants: Sex
Fetal sex contributed to variation in maternal corticosteroid and progestogen metabolism. In both cohorts, pregnant women with female fetuses had higher 3β-HSD enzymatic activity and lower levels of the progesterone metabolite 5PD-20one-S. These findings reinforce the concept that fetal sex modulates maternal endocrine function. Maitre et al. (2016) found that steroid hormones was related with higher fetal growth, they identified 5β-pregnane-3α,20α-diol-3α-glucuronide in spot urine samples from 806 Spanish pregnant women in the first and third trimester of gestation from INMA Guipuzcoa and Sabadell using untargeted 1H NMR spectroscopy approach [38].
3.7. Strengths, Limitations, and Future Directions
This study has several notable strengths. First, the analysis was conducted in a large, well-characterized pregnancy cohort of 721 Spanish pregnant women in the third trimester, a critical window of hormonal adaptation with relevance for both maternal and fetal outcomes. Importantly, our findings were replicated in an independent cohort of 500 Spanish pregnant women, reinforcing the robustness and generalizability of the results. Replication analysis remains uncommon in studies of the maternal steroidome, where differences in sample handling, measurement protocols, and population characteristics often preclude direct comparison [39]. Second, we employed a high accuracy targeted metabolomic approach of SH metabolites in urine samples, a non-invasive and physiologically relevant matrix that reflects both endogenous production and excretion patterns. This approach allowed for the quantification of a wide panel of SH metabolites. Previous studies of maternal steroid biology have largely relied on serum or salivary assays, typically limited to a small subset of free hormones (e.g., cortisol, estradiol). Our urinary profiling approach captures a wide range of SH conjugated metabolites (sulfates, disulfates, glucuronides and sulfoglucuronide) and several metabolic indicators (S/G and product/precursor ratio from enzymatic activities), offering a non-invasive and temporally integrated assessment of steroid dynamics. Thus, we extend existing literature by including metabolite conjugation patterns and enzymatic activity indices, which are rarely assessed in pregnancy despite their physiological relevance. Third, our analysis considered a wide range of maternal determinants, including sociodemographic, clinical, nutritional, and genetic variables. Fourth, the replication of associations across two independent cohorts enhances the credibility of our findings. Finally, we characterised a general population of pregnant women, not case-control or women with serious complications, which makes this study more generalizable and the base for future clinically oriented studies. Taken together, our study is one of the most comprehensive research to date to characterize the maternal SH metabolome and its potential determinants during pregnancy.
Our study also has several limitations. Although a broad number of maternal determinants—ranging from sociodemographic characteristics and clinical parameters to lifestyle and common genetic variants—were incorporated into our models, approximately 80% of the variability in maternal SH remains unexplained. This persistent gap highlights the complexity of hormonal regulation during pregnancy and suggests the influence of biological and environmental factors not captured in current datasets. SH metabolism in pregnancy is shaped by a highly dynamic interplay between maternal and fetal systems, including the placenta. While factors such as smoking, BMI, diet, physical activity, fetuses’ sex and weight contribute to interindividual variability, they appear insufficient to fully explain observed differences. Environmental exposures such as air pollution, endocrine-disrupting chemicals, and heat temperature can influence endocrine pathways [40,41,42,43,44,45,46,47,48]. Likewise, circadian rhythms, which regulate hormonal secretion and enzymatic activity, may contribute to intra-day variability in steroid metabolite levels—variability that is not fully captured in single-timepoint measurements. In the BiSC cohort, circadian rhythm effect was minimized by analyzing weekly pooled urine samples, knowing that short-term temporal inter-individual variation is highly important in molecular epidemiology design [49]. However, in the replication cohort (INMA–Sabadell), only spot urine samples were available, which may introduce greater variability due to timing of collection relative to daily hormonal cycles. This methodological difference could partially explain cohort-specific differences. Statin medication is another tentative predictor that was not considered in our analysis, but according to Chatuphonprasert et al. (2018) is necessary taking into account in clinical trials during pregnancy due to its mechanism of action during pregnancy is poorly explored [1]. Another important variable that can predict SH metabolome and was not included in our study is the maternal microbiome, gut microbiota can produce neuroactive steroids from bile-produced glucocorticoids into progestins such as allopregnanolone [50]. Also, additional genetic variants not accounted for could play a role / or fetal genome.
To move beyond descriptive associations, future studies can consider multi-omics data including transcriptomics, microbiome, and high-resolution environmental exposure measures into unified analytical frameworks. Systems-level modeling and mediation analysis will be essential to untangle the complex web of inputs shaping maternal metabolism.
4. Materials and Methods
4.1. Study Participants and Study Overview
In this study, we included data from two Spanish cohorts. Primary analysis was performed in the Barcelona Life Study Cohort (BiSC), comprising 1080 pregnant women recruited during the first routine prenatal visit (11–15 weeks) at three hospitals in Barcelona, Spain. A detailed description of the recruitment process, follow-ups, and data collection are presented elsewhere (Dadvand et al., 2024) [51]. The replication study included data from INMA-Sabadell cohort, a cohort part of INMA project that recruited 657 pregnant women older than 16 years old, between July 2004 and July 2006, who visited the primary health center of Sabadell for an ultrasound in the 1st trimester, details from data collection are described elsewhere (Guxens et al., 2012) [52].
In both cohorts, participating women provided informed consent. Ethics approvals were obtained from the corresponding authorities in all the participating institutions and hospitals/medical health centers.
The current study included 721 pregnant women from BiSC (primary analysis) and 500 from INMA (replication analysis) at 32 weeks of gestation with available data of urinary steroid hormones and with more than 50% of available determinant data. The study flow diagram is represented in Figure 1.
4.2. Urine Collection and Steroid Targeted Metabolome Profiling
In the BiSC cohort, pregnant women were instructed on how to collect the urine samples on day 1, and field workers brought all the sample collection materials to their homes. Mothers collected their morning and bedtime urine samples from day 2 to day 7 and stored them in their home freezers (around -20ºC). On day 8, urine samples were then collected from the homes by the field workers and taken to ISGlobal-Campus Clínic (-20ºC). Total number of samples: 6x2=12 urine samples. 0.5mL pool urine samples with at least 10 voids were selected for the analysis. In the INMA-Sabadell cohort, urine samples were gathered during the morning interviews as spot samples. Each sample was collected in 100 mL polyethylene containers and promptly stored at -20 °C to maintain stability until the analysis.
SH metabolites were analysed using LC-MS/MS by Hospital del Mar Medical Research Institute - Applied Metabolomics Research Laboratory following a validated method described by Servin-Barthet, C. et at. (2025) [9]. On the day of analysis, urine samples were thawed and prepared for extraction of steroid phase II metabolites using solid-phase extraction. Each sample (1 mL) was spiked with 15 μL of internal standards and acidified with 1 mL of 4% aqueous phosphoric acid. SPE was conducted with Oasis HLB cartridges, conditioned with methanol, water, and 2% formic acid in water. Steroids were eluted in two stages using methanol and ammonia in methanol. The eluates were dried under nitrogen, reconstituted, combined, and evaporated. The residue was reconstituted in 100 μL of 10% acetonitrile in water for UHPLC-MS/MS analysis. Calibration curves and quality control (QC) samples were prepared for each injection batch.
Chromatographic separation was performed using an Acquity UPLC system with a CSH C18 column. The mobile phases included acetonitrile:water (9:1, v/v) and water, both with 25 mM ammonium formate. A gradient elution over 20 minutes was applied. Mass spectrometric analysis was conducted on a XEVO TQ-S micro mass spectrometer using negative ionization mode with selective reaction monitoring for quantification.
Data was processed with MassLynx and TargetLynx software. Analyte responses were calculated as ratios of analyte to internal standard areas. Concentrations of endogenous steroid metabolites were determined using calibration curves in stripped urine. Metabolites without quantitative standards were relatively quantified using structurally similar compounds. Quality control samples were included in each of four analytical batches. Limits of detection (LODs) ranged approximately from 1 to 200 ng/mL, with most androgens and estrogens falling below 10 ng/mL and higher LODs observed for some progestogens and precursors. Features with below limit of detection were log transformed and values below LOD were imputed using left-censored data [53]. Of the 57 steroid hormones (sexual steroids and corticosteroid metabolites) detected in urine, 7 with poor reproducibility (RSD > 35%) were excluded, resulting in 50 hormones included in the analyses (Table S1). Based on 50 individual SH metabolite concentrations, transformed into µmol/L, we estimated the sum of 13 steroid family or subfamilies, 9 sulfate/glucuronide (S/G) ratio, and 17 steroid hormone enzymatic activity markers. Enzymatic phase I activity was estimated using the ratios of molar concentration product/precursor. Product/precursor ratios can explain physiology implications of steroid hormones production [54,55]. A total of 89 steroidomic outcomes were analyzed, including individual SH and derived metabolic indicators. To standardize the SH metabolite data, urine specific gravity (SG) was measured in specimens using the Digital Urine Specific Gravity Refractometer (ATAGO CO., LTD) to correct for dilution using metabolite-specific regressions to remove SG dependency while preserving biological variation. All SH concentrations, including 50 individual SH and 14 sum of SH families, were corrected by SG and listed as µmol/L. Enzymatic ratios and sulfate/glucuronide ratios were estimated based on raw concentration of steroid hormones (µmol/L) without adjustment by specific gravity. Finally, SH metabolites were corrected by gestational age using the MoM multiples of normal median (MoM) approach based on quantile regression with the objective of measuring how far an individual test result deviates from the median of the same gestational age [15].
4.5. Determinants
- i.
- Sociodemographic and clinical parameters
For the BiSC cohort, sociodemographic data such as age, country of origin, and education levels were collected through the face-to-face interview during hospital visit [51]. Data on clinical and reproductive history including gynaecological conditions, fertility treatment, parity, contraceptive methods. The clinical data of pregnancy including clinical examinations and pregnancy complications (gestational diabetes, preeclampsia, abnormal amniotic liquid) were obtained from the hospital records and self- administered questionnaires. Anthropometric parameters as maternal weight and body mass index (BMI, kg/m2) were obtained by physical examination of mothers at the hospital visits in the first and third trimesters.
For INMA-Sabadell cohort sociodemographic (maternal age, education, ethnicity) and clinical parameters (obstetric complications, parity) were collected from self-reported questionnaires [56]. Maternal pre-pregnancy BMI was calculated from self-reported weight and height measured at the first trimester [56]. Gestational age was estimated based on the date of the last menstrual period.
- ii.
- Fetal growth
For the BiSC and INMA cohorts, foetal growth and sex was obtained by ultrasonographic measurements carried out by trained sonographers. Foetal weight for the first and 3rd trimester of gestation was estimated using the Hadlock formula [57]. Estimated foetal weight was standardised following the guideline by International Society of Ultrasound in Obstetrics and Gynecology (ISUOG) [57,58] for BiSC cohort and in the case of INMA-Sabadell cohort standardised foetal weight was estimated following the method described by Iñiguez et al. (2015) [59].
- iii.
- Genetic
In this study we only considered genetic information from the BiSC cohort, due to the INMA cohort having more than 70% of missing data. Maternal DNA was extracted randomly from peripheral blood collected in EDTA tubes during pregnancy (12 or 32 weeks) or at delivery. EDTA tubes were centrifuged at 2000g for 10 min and plasma, buffy coat and red cells were separated. DNA was extracted from 200 ul of buffy coat using the QIAsymphony platform and the QIAsymphony DSP DNA Mini Kit at the Hospital del Mar Research Institute (IMIN). Genome-wide genotyping was performed using the Infinium Global Screening Array v3.0 with Multi-Disease content (Illumina, 730,059 variants). DNA was quantified using the Quant-iT™ PicoGreen™ kit. Genotyping followed manufacturer protocols, with HapMap controls included on each plate. Genotype calling and clustering were performed using GenomeStudio Gen Train 3.0, and variants were annotated in b37 + strad using the GSAMD-24v3-0-EA_20034606_A1 manifest. In the genetic quality control data, variants with a call rate <97%, MAD <1%, or failing Hardy-Weinberg equilibrium (p < 1E-6) were excluded from the analysis. Relatedness was assessed using PI_HAT, and 54 second-degree relatives (PI_HAT > 0.25) were excluded. Principal components (PCs) were estimated on pruned SNPs, the first 20 PCs explained 72.2% of population variance and 35.4% in Europeans. Imputation was conducted using the HRC v1.1 reference panel via the Sanger Imputation Service, employing EAGLE2 for phasing and PBWT for imputation. Post-imputation filters included MAD >1%, HWE p> 1E-6, and INFO >0.8, resulting in approximately 5 million high-quality SNPs. From the imputed dataset, we selected SNPs previously associated with steroid hormone enzymatic pathways: CYP3A4 (rs2300701, rs806645), CYP1B1 (rs1056836), HSD3B1 (rs1264459), HSD17B2 (rs1937863), CYP17A1 (rs743572), and CYP19A1 (rs10046, rs28757184, rs700518, rs6493497) (12,60–62).
- iv.
- Mental health
Mental health determinants (stress and depression) were only available in the BiSC cohort and considered the data from the third trimester of gestation using validated questionnaires [51]. Edinburgh Postnatal Depression Scale was used to evaluate peripartum depression at 3rd trimester of gestation [63]. Maternal stress was evaluated using the 10-item Perceived Stress Scale (PSS-10) filled by the mothers [64,65].
- v.
- Lifestyle
Lifestyle determinants were collected in the first and/or third trimester in both cohorts.
From the BiSC cohort, physical activity data was obtained from the Pregnancy Physical Activity Questionnaire [66]. Physical activity with moderate and vigorous intensity was considered in the study and was categorized according to the physical activity WHO recommendation into more/less than 150 min/week [67]. Sleep-related variables were estimated between the difference in hours between self-reported bedtime and wake-up time, and the sleep quality score based on the Pittsburgh Sleep Quality Index [68]. Smoking and alcohol were obtained from self-administered validated questionnaires. Maternal diet data was collected using a validated food frequency questionnaire (FFQ) at the second trimester of pregnancy [69]. Based on the FFQ, the intakes of main dietary groups including dairy, meats, fish and seafood, eggs, vegetables, fruits, nuts, grains, potatoes, legumes ready-to-eat-food, oils and fats, sweets, sugary beverages, coffee, and sauces were estimated. Mediterranean diet score was not considered alcohol and was obtained from the FFQ data [69,70]. Nutrient intake was estimated from US and Spanish food composition tables [71,72], and was adjusted for energy intake following the energy-residual method described by Willet et al. [73].
Regarding INMA-Sabadell cohort, in this study we considered data of smoking and alcohol intake at first and third trimester by self-reported questionnaire, and dietary intake in the third trimester using a validated FFQ and the MD adherence by the relative Mediterranean diet score (rMED) (ref). Nutrient intake was estimated from the US and Spanish food composition tables [74,75]. Physical activity was measured using a validated questionnaire and the units were MET.
4.6. Statistical Analysis
Values for means, medians, standard deviation (SD) were calculated for continuous variables and frequencies were calculated for categorical variables. The descriptive analysis was performed using no imputed data.
4.6.1. Data Preparation
We performed data selection steps, from the initial selection of data to the filtering of strongly correlated and noisy data.
First, we used a wide selection of previously determinants associated with steroid hormones based on existing literature (Table 1). To reduce the amount of missingness in the data, we discarded records of individuals with more than 50% of missing data in all the variables (5 participants were discarded in BiSC and 0 in INMA) and variables with more than 50% missing data (all SNPs [10] were discarded in INMA). The percentage of participants with missing values of determinant was 0.68% for BiSC and 0% for INMA. Then, we further refined this selection by filtering among strongly correlated (r>0.9), discarding one variable (BMI at first trimester) from BiSC and 0 from INMA. For the statistical analysis, missing values were imputed using the missForest R package, a single interactive imputation algorithm that can handle both categorical and continuous variables and capture nonlinear relationships. The full description of the preselection steps is available in Table S2, and the detailed list of names of variables selected in both cohorts are available in Table S3.
4.6.2. ExWAS Analysis
Interquartile range (IQR) standardisation of the continuous predictors was applied to normalize data distributions and mitigate the influence of outliers. Prior to fitting the model, all outcomes were log2-transformed to approximate normality. ENT was applied to correct multiple comparisons P (PENT) [76]. PENT = 0.05 / (ENT metabolites*ENT determinants). Different ENT was applied by each group of outcome: SH metabolites, sum of SH, S/G ratios and phase I enzymatic activity. PENT for SH metabolites was 0.00006, sum was 0.0002, S/G ratio was 0.0003, phase I enzymatic activity was 0.0001.
4.6.3. Elastic Net Regression Analysis to Determinant Selection
Elastic Net (ENET) regression was employed to identify the associations between a set of determinants and hormone levels in the BiSC cohort. ENET, a regularized regression technique that combines both Lasso (L1) and Ridge (L2) penalties, was selected due to its ability to handle multicollinearity and high-dimensional data while reducing overfitting [77]. ENET regularization parameter α was set to 0.5 to balance the contribution of Lasso and Ridge penalties. The optimal regularization parameter λ was determined through 10-fold cross-validation using the "mean squared error" as the performance metric. Specifically, we selected the minimum λ value corresponding to the highest penalty. Preprocessing of predictors involved standardizing continuous variables through IQR scaling to normalize data distributions and mitigate the influence of outliers. Categorical variables were converted to dummy variables to ensure proper inclusion in the model. Each outcome variable was modeled separately using a train-test split (80%-20%) to facilitate robust model evaluation and ensure that results could be validated against an independent dataset. ENET was applied to assess the relationships between the clinical, genetic, and environmental predictors and the hormone outcomes. A set of covariates (season of birth, hospital, and COVID-19 confinement status) was forced into the model by setting their penalty penalty factor to zero. Non-zero coefficients from the ENET model were interpreted as the key predictors of hormone levels. Additionally, to assess model stability, we performed 100 bootstrap replications of resampling. For each outcome, determinants that were selected in at least 80% of the replication of ENET analyses were considered stable. All analyses were conducted using R (version 4.4.1) and the following packages: glmnet for ENET regression, caret for model training and cross-validation.
4.6.4. Linear Regression Model and Variance Explained Estimation
To estimate the best prediction for each SH metabolome outcome a linear regression model was applied between all the predictors selected by ENET and each outcome, and adjusted by season of birth, hospital, and COVID-19 confinement status in the BiSC cohort and by season and time urine collection in INMA cohort. After selecting predictors with ENET, we fitted multiple linear regression models adjusted for hospital, season of birth, and COVID-19 confinement status in the BiSC cohort (and for season and time of urine collection in the INMA cohort). To quantify the contribution of each determinant to the explained variance of steroid metabolome outcomes, we used the relaimpo R package (v2.2.7). Specifically, we applied the lmg method in the calc.relimp function, which decomposes the total model R2 into the relative contributions of each predictor by averaging sequential sums of squares over all possible orderings of variables. This provides the percentage of variance explained attributable to each determinant [78].
5. Conclusions
This study provides a comprehensive and novel characterization of maternal SH metabolism during late pregnancy. By following mass spectrometry-based metabolomics, penalized regression models, and external replication, we identified that clinical, lifestyle, and sociodemographic determinants contribute to inter-individual variability in the SH metabolome. Our findings highlight the complexity of SH metabolism in later pregnancy and reveal consistent associations with modifiable exposures such as maternal BMI, parity, dietary fat intake, alcohol intake, smoking, physical activity, sleep, ethnicity, and sex of the fetuses. The integration of such metabolic phenotyping into maternal health research may help identify early biomarkers of pregnancy complications and developmental risk, and supports the case for including urinary SH profiling in future longitudinal and clinical studies.
Supplementary Materials
The following supporting information can be downloaded at the website of this paper posted on Preprints.org. Figure S1. Heatmap correlation between determinants from BiSC cohort (n=721); Figure S2. Raw SH concentration (50 metabolites μmol/L) from BiSC cohort (n=721) and INMA cohort (n=500); Figure S3. Urinary steroid hormone concentration proportion by family from BiSC cohort (n=721) and INMA-Sabadell cohort (n=500); Figure S4. Heatmap correlation between SH metabolome from BiSC cohort (n=721); Figure S5. Miami-plot from ExWAS Analysis of Main Determinants and the Steroid Metabolome in the BISC Cohort (n=721); Figure S6. Miami-plot from ExWAS Analysis of Main Determinants and the Sum of Steroid Metabolome in the BISC Cohort (n=721); Figure S7. Miami-plot from ExWAS Analysis of Main Determinants and the Sulfate-glucuronide Steroid Metabolome ratios in the BISC Cohort (n=721); Figure S8. Miami-plot from ExWAS Analysis of Main Determinants and the Phase I Steroid Metabolome enzymatic activity in the BISC Cohort (n=721); Figure S9: Proportion of significant ExWAS associations after multi testing correction in the BISC Cohort (n=721).; Figure S10: Proportion of concordant determinant-SSH metabolome pairs significantly associated in the BISC (n=721) and INMA-Sabadell (N=500) Cohorts; Table S1: Full steroid metabolome names, abbreviations, and LOD assessed in urine samples; Table S2: Data preparation steps to select determinants and participants for the statistical analysis; Table S3: List of determinants considering in the study; Table S4: Concentration of steroid hormones in participants from BiSC and INMA cohorts; Table S5: Concentration of total steroid hormones in participants from BiSC and INMA cohorts; Table S6: Sulfate/Glucuronide ratio of steroid hormones in participants from BiSC and INMA cohorts; Table S7: Enzymatic activity of steroid metabolites in participants from BiSC and INMA cohorts; Table S8: Sexual Steroid Hormones Pearson correlation from BiSC cohort (n=721), Table S9: ExWAS Analysis of Main Determinants and the Steroid Hormones Molecular Feautures in the BISC Cohort (n=721); Table S10:Elastic Net (ENET) Bootstrap Coefficients for Determinants of Hormone Levels in the BiSC Cohort (Training Set, n = 577); Table S11: Elastic net regression (ENET) tune parameters - BiSC cohort (Test set n= 144); Table S12: Linear regression association selected ENET determinants and SH molecular features from BiSC (n=721); Table S13: Linear regression association between selected ENET determinants and SH molecular features from INMA-Sabadell cohort (n=500). Table S14: Significant and concordant associations between determinants and steroid hormone (SH) molecular features in BiSC (n=721) and INMA-Sabadell (n=500) cohorts.
Author Contributions
Conceptualization, L.M.; methodology, L.M, O.P, E.P.L.-S.; software, E.P.L.-S., E.R.; validation, L.M..; formal analysis, E.P.L.-S.; investigation, L.M., E.P.L.-S.; resources, L.M.; data curation, E.R., E.P.L.-S.; writing—original draft preparation, E.P.L.-S. and L.M.; writing—review and editing, E.R., M.B., D.P., Z.G.R., M.R.R, M.C., E.L.-O., M.D.G.-R., N.H., O.P., P.D., M.V., and L.M. ; visualization, E.P.L.-S.; supervision, L.M.; project administration, L.M.; funding acquisition, L.M. All authors have read and agreed to the published version of the manuscript.
Funding
This work was supported by the FIS grant ISCIII-AES-2021/001814 (Instituto de Salud Carlos III), project code: FIS 2021 - IGRO PI21/01269. The BiSC cohort has received funding from the European Research Council (ERC) under the European Union’s Horizon 2020 research and innovation programme (785994 – AirNB project), from the Health Effects Institute (4959-RFA17-1/18-1 – FRONTIER project), from the European Union’s Horizon 2020 research and innovation programme-EU.3.1.2. (874583 - ATHLETE project) and H2020-EU.3.1.1. (GA964827 – AURORA project), from AXA Research Fund (MOOD-COVID project), from Agence nationale de sécurité sanitaire de l'alimentation, de l'environnement et du travail (ANSES) (2019/01/039 - HyPAXE project), from the AGAUR-Agència de Gestió d'Ajuts Universitaris de Recerca (2021 SGR 01570 - Population Neuroscience group), from the Centro de Investigación Biomédica en Red de Epidemiología y Salud Pública (CIBERESP) (CB06/02/0041), from the Instituto de Salud Carlos III (ISCIII) and the European Regional Development Fund (ERDF) - Maternal and Child Health and Development Network (SAMID) (RD16/0022/0014 and RD16/0022/0015), and from the Instituto de Salud Carlos III (ISCIII) and the European Union Next Generation EU - Primary Care Interventions to Prevent Maternal and Child Chronic Diseases of Perinatal and Developmental Origin Network (RICORS-SAMID) (RD21/0012/0001 and RD21/0012/0003). BiSC genome-wide genotyping data was funded by the Instituto de Salud Carlos III and co-funded by European Union (ERDF) "A way to make Europe" (PI20/01116 – ENTENTE project) and the Centro Nacional de Genotipado-CEGEN (PRB2-ISCIII). INMA-Sabadell was supported by grants from Instituto de Salud Carlos III (Red INMA G03/176), Generalitat de Catalunya-CIRIT 1999SGR 00241. We acknowledge support from the grant CEX2023-0001290-S funded by MCIN/AEI/ 10.13039/501100011033, and support from the Generalitat de Catalunya through the CERCA Program. Léa Maitre has received funding from the Ramon y Cajal Research Fellowship RYC2022-036475-I funded by MICIU/AEI/10.13039/501100011033. E.P.L-S is supported by the post-doctoral grant JDC2022-049842-I funded by MICIU/AEI/10.13039/501100011033 and by “European Union NextGeneration EU/PRTR”. ISGlobal acknowledges support from the grant This research was funded by the grant CEX2023-0001290-S funded by MCIN/AEI/ 10.13039/501100011033, and support from the Generalitat de Catalunya through the CERCA Program.
Institutional Review Board Statement
The study was conducted in accordance with the Declaration of Helsinki, and approved by the Clinical Research Ethics Committee of the Parc de Salut Mar (2018/8050/I), Medical Research Committee of the Fundació de GEstió Sanitària del Hospital de la Santa Creu i Sant Pau de Barcelona (EC/18/206/5272) and Ethics Committee of the Fundació Sant Joan de Déu (PIC-27-18). The ethical approval of BiSC cohort was signed on the 30th of July of 2021. For INMA-Sabadell, all pregnant women participants signed written informed consent forms, and the study was approved by the ethical committees of the Municipal Institute of Medical Research and the Hospital of Sabadell (2005/2106/I).
Informed Consent Statement
Informed consent, including for genetic studies, was obtained from all participants' parents or legal representatives before any procedures, with approval from the local Ethics Committee.
Data and code Availability: The participants data reported in this study cannot be deposited in a public repository due to participant confidentiality and privacy concerns. Therefore, data is available upon written request. According to standard controlled access procedure, applications to use the BiSC and INMA data will be reviewed by the Steering Committee, evaluation of the fit of the data for the proposed methodology, and verification that the proposed use meets the guidelines of the Ethic and Governance Framework and of the consent that was provided by the participants. To request BiSC data follow the instructions described in the website. All original analytical code has been deposited at Github and is publicly available as of the date of publication.
Acknowledgments
We acknowledge all participants and their families for their collaborations. We are also grateful to all the BISC and INMA team members for their contributions to these cohorts.
Conflicts of Interest
The authors declare no conflicts of interest.
Abbreviations
| A-S | 11-dehydrocorticosterone-Sulfate |
| AN-S | Androsterone-Sulfate |
| Andros-G | Androsterone-Glucuronide |
| B-S | Corticosterone-Sulfate |
| BMI | Body Mass Index |
| Cortolone-G_1 | 20a-Cortolone-Glucuronide |
| Cortolone-G_2 | 20b-Cortolone-Glucuronide |
| DHEA | Dehydroepiandrosterone |
| DHEA-S | DHEA-sulfate |
| E-S | Cortisone-Sulfate |
| E-G | Cortisone-Glucuronide |
| E2-S | Estradiol-Sulfate |
| E1-G | Estrone-Glucuronide |
| E1-S | Estrone-Sulfate |
| E3-G | Estriol-Glucuronide |
| E3-SG | Estriol-Sulfoglucoconjugated |
| E3-S | Estriol-Sulfate |
| E4-SG | Estetrol-Sulfoglucoconjugated |
| ExWAS | Exposome-Wide Analysis |
| ENT | Effective Number of Tests |
| ENET | Elastic Net regression |
| epiAN-S | epiandrosterone-Sulfate |
| Etio-S | Etiocholanolone-Sulfate |
| Etio-G | Etiocholanolone-Glucuronide |
| F-S | Cortisol-Sulfate |
| F-G | Cortisol-Glucuronide |
| FFQ | Food Frequency Questionnaire |
| IQR | Interquartile Range |
| LC-MS/MS | Liquid chromatography-tandem mass spectrometry |
| MEDAS | Mediterranean Diet Adherence Score |
| MVPA | Moderate-to-Vigorous Physical Activity |
| OC | Obstetric Complications |
| PCs | Principal components |
| PCOS | Polycystic Ovary Syndrome |
| rMED | relative Mediterranean Diet score |
| S/G | Sulfate/Glucuronide |
| SNPs | Single-Nucleotide Polymorphism |
| SSH | Sex steroid hormones |
| 5AD-diS_1 | 5-androsten-3b17b-diol-diSulfate |
| 5AD-diS_2 | 5-androsten-3a17b-diol-diSulfate |
| 16OHDHEA-diS_1 | 16b-hydroxy-DHEA-diSulfate |
| 16OHDHEA-diS_2 | 16a-hydroxy-DHEA-diSulfate |
| 16OH-DHEAS_1 | 16b-hydroxy-DHEA-Sulfate |
| 16OH-DHEAS_2 | 16a-hydroxy-DHEA-Sulfate |
| T-G | Testosterone-Glucuronide |
| T-S | Testosterone-Sulfate |
| 20DHE-G | 20dihydrocortisone-Glucuronide |
| 20aDHF-G | 20a-dihydrocortisol-Glucuronide |
| 20bDHF-G | 20b-dihydrocortisol-Glucuronide |
| THE-G | Tetrahydrocortisone-Glucuronide |
| 5PD-20one-S | 17-hydroxy-5-pregnenolone-3-sulfate |
| 5PD-diS | 5-Pregnendiol-DiSulfate |
| 21OH-5P-diS | 21-Hydroxypregnenolone-DiSulfate |
| 5PD-SG | 5-Pregnendiol-Sulfoglucoconjugated |
| 5PD-G | 5-Pregnendiol-Glucuronide |
| PD-diS_1 | 5a-Pregnan-3b,20a-diol-DiSulfate |
| PD_diS_2 | 5a-Pregnan-3a,20a-diol-DiSulfate |
| PD-diS_3 | 5b-Pregnan-3a,20a-diol-DiSulfate |
| PD-SG_1 | 5a-Pregnandiol-3b-sulfate-20a-Glucuronide |
| PD-SG_2 | Pregnandiol-sulfoglucoconjugate (unknown stereochemistry) |
| PD-SG_4 | Pregnandiol-sulfoglucoconjugate (unknown stereochemistry) |
| PD-SG_5 | Pregnandiol-sulfoglucoconjugate (unknown stereochemistry) |
| PD-S_1 | 5a-Pregnan-3b20a-diol-20-Sulfate |
| PD-S_2 | 5b-Pregnan-3a20a-diol-20-Sulfate |
| PD-G | Pregnandiol-Glucuronide |
| PT-diS | Pregnantriol-diSulfate |
| PT-G | Pregnantriol-Glucuronide |
References
- Chatuphonprasert, W.; Jarukamjorn, K.; Ellinger, I. Physiology and Pathophysiology of Steroid Biosynthesis, Transport and Metabolism in the Human Placenta. Front. Pharmacol. 2018, 9, 1027. [CrossRef]
- Christakoudi, S.; Cowan, D.A.; Christakudis, G.; Taylor, N.F. 21-Hydroxylase deficiency in the neonate – trends in steroid anabolism and catabolism during the first weeks of life. J. Steroid Biochem. Mol. Biol. 2013, 138, 334–347. [CrossRef]
- Miller, W.L. Steroid hormone synthesis in mitochondria. Mol. Cell. Endocrinol. 2013, 379, 62–73. [CrossRef]
- Miller WL. Steroidogenesis: Unanswered Questions. Trends Endocrinol Metab. 2017 Nov 1;28(11):771–93. [CrossRef]
- Miller WL, Bose HS. Early steps in steroidogenesis: intracellular cholesterol trafficking: Thematic Review Series: Genetics of Human Lipid Diseases. J Lipid Res. 2011 Dec 1;52(12):2111–35. [CrossRef]
- Miller, W.L.; Auchus, R.J. The Molecular Biology, Biochemistry, and Physiology of Human Steroidogenesis and Its Disorders. Endocr. Rev. 2011, 32, 81–151. [CrossRef]
- Pozo, O.J.; Marcos, J.; Khymenets, O.; Pranata, A.; Fitzgerald, C.C.; McLeod, M.D.; Shackleton, C. SULFATION PATHWAYS: Alternate steroid sulfation pathways targeted by LC–MS/MS analysis of disulfates: application to prenatal diagnosis of steroid synthesis disorders. J. Mol. Endocrinol. 2018, 61, M1–M12. [CrossRef]
- Fabregat, A.; Marcos, J.; Garrostas, L.; Segura, J.; Pozo, O.J.; Ventura, R. Evaluation of urinary excretion of androgens conjugated to cysteine in human pregnancy by mass spectrometry. J. Steroid Biochem. Mol. Biol. 2014, 139, 192–200. [CrossRef]
- Servin-Barthet, C.; Martínez-García, M.; Paternina-Die, M.; Marcos-Vidal, L.; de Blas, D.M.; Soler, A.; Khymenets, O.; Bergé, D.; Casals, G.; Prats, P.; et al. Pregnancy entails a U-shaped trajectory in human brain structure linked to hormones and maternal attachment. Nat. Commun. 2025, 16, 1–14. [CrossRef]
- Barrett, E.S.; Mbowe, O.; Thurston, S.W.; Butts, S.; Wang, C.; Nguyen, R.; Bush, N.; Redmon, J.B.; Sheshu, S.; Swan, S.H.; et al. Predictors of Steroid Hormone Concentrations in Early Pregnancy: Results from a Multi-Center Cohort. Matern. Child Heal. J. 2019, 23, 397–407. [CrossRef]
- Bíró, I.; Bufa, A.; Wilhelm, F.; Mánfai, Z.; Kilár, F.; Gocze, P.M. Urinary steroid profile in early pregnancy after in vitro fertilization. Acta Obstet. et Gynecol. Scand. 2012, 91, 625–629. [CrossRef]
- Kallak, T.K.; Hellgren, C.; Skalkidou, A.; Sandelin-Francke, L.; Ubhayasekhera, K.; Bergquist, J.; Axelsson, O.; Comasco, E.; E Campbell, R.; Poromaa, I.S. Maternal and female fetal testosterone levels are associated with maternal age and gestational weight gain. Eur. J. Endocrinol. 2017, 177, 379–388. [CrossRef]
- Crowley, S.K.; O’bUckley, T.K.; Schiller, C.E.; Stuebe, A.; Morrow, A.L.; Girdler, S.S. Blunted neuroactive steroid and HPA axis responses to stress are associated with reduced sleep quality and negative affect in pregnancy: a pilot study. Psychopharmacology 2016, 233, 1299–1310. [CrossRef]
- Deltourbe, L.G.; Sugrue, J.; Maloney, E.; Dubois, F.; Jaquaniello, A.; Bergstedt, J.; Patin, E.; Quintana-Murci, L.; Ingersoll, M.A.; Duffy, D.; et al. Steroid hormone levels vary with sex, aging, lifestyle, and genetics. Sci. Adv. 2025, 11, eadu6094. [CrossRef]
- Lobmaier, S.M.; Figueras, F.; Mercade, I.; Crovetto, F.; Peguero, A.; Parra-Saavedra, M.; Ortiz, J.U.; Crispi, F.; Gratacós, E. Levels of Maternal Serum Angiogenic Factors in Third-Trimester Normal Pregnancies: Reference Ranges, Influence of Maternal and Pregnancy Factors and Fetoplacental Doppler Indices. Fetal Diagn. Ther. 2014, 36, 38–43. [CrossRef]
- Karvaly, G.; Kovács, K.; Gyarmatig, M.; Gerszi, D.; Nagy, S.; Jalal, D.A.; Tóth, Z.; Vasarhelyi, B.; Gyarmati, B. Reference data on estrogen metabolome in healthy pregnancy. Mol. Cell. Probes 2024, 74, 101953. [CrossRef]
- Jäntti, S.E.; Hartonen, M.; Hilvo, M.; Nygren, H.; Hyötyläinen, T.; Ketola, R.A.; Kostiainen, R. Steroid and steroid glucuronide profiles in urine during pregnancy determined by liquid chromatography–electrospray ionization-tandem mass spectrometry. Anal. Chim. Acta 2013, 802, 56–66. [CrossRef]
- Jin, C.; Peng, Y.; Luo, X.; Zhu, Q.; Lin, L.; Yang, J.; Wang, P. Dynamic change of estrogen and progesterone metabolites in human urine during pregnancy. Sci. Rep. 2025, 15, 1–17. [CrossRef]
- Mistry, H.D.; Eisele, N.; Escher, G.; Dick, B.; Surbek, D.; Delles, C.; Currie, G.; Schlembach, D.; Mohaupt, M.G.; Gennari-Moser, C. Gestation-specific reference intervals for comprehensive spot urinary steroid hormone metabolite analysis in normal singleton pregnancy and 6 weeks postpartum. Reprod. Biol. Endocrinol. 2015, 13, 1–13. [CrossRef]
- Cao, J.; Wang, Y.; Wang, S.; Shen, Y.; Li, W.; Wei, Z.; Li, S.; Lin, Q.; Chang, Y. Expression of Key Steroidogenic Enzymes in Human Placenta and Associated Adverse Pregnancy Outcomes. Matern. Med. 2022, 5, 163–172. [CrossRef]
- Pasqualini JR. Enzymes involved in the formation and transformation of steroid hormones in the fetal and placental compartments. J Steroid Biochem Mol Biol. 2005 Dec 1;97(5):401–15.
- Maliqueo, M.; Cruz, G.; Espina, C.; Contreras, I.; García, M.; Echiburú, B.; Crisosto, N. Obesity during pregnancy affects sex steroid concentrations depending on fetal gender. Int. J. Obes. 2017, 41, 1636–1645. [CrossRef]
- Volqvartz T, Andersen HHB, Pedersen LH, Larsen A. Obesity in pregnancy—Long-term effects on offspring hypothalamic-pituitary-adrenal axis and associations with placental cortisol metabolism: A systematic review. Eur J Neurosci. 2023;58(11):4393–422. [CrossRef]
- Gillespie, S.L.; Mitchell, A.M.; Kowalsky, J.M.; Christian, L.M. Maternal parity and perinatal cortisol adaptation: The role of pregnancy-specific distress and implications for postpartum mood. Psychoneuroendocrinology 2018, 97, 86–93. [CrossRef]
- Marteinsdottir, I.; Sydsjö, G.; Faresjö, Å.; Theodorsson, E.; Josefsson, A. Parity-related variation in cortisol concentrations in hair during pregnancy. BJOG: Int. J. Obstet. Gynaecol. 2020, 128, 637–644. [CrossRef]
- Budnik-Przybylska, D.; Laskowski, R.; Pawlicka, P.; Anikiej-Wiczenbach, P.; Łada-Maśko, A.; Szumilewicz, A.; Makurat, F.; Przybylski, J.; Soya, H.; Kaźmierczak, M. Do Physical Activity and Personality Matter for Hair Cortisol Concentration and Self-Reported Stress in Pregnancy? A Pilot Cross-Sectional Study. Int. J. Environ. Res. Public Heal. 2020, 17, 8050. [CrossRef]
- Hernández-Pérez, J.G.; Taha, S.; Torres-Sánchez, L.E.; Villasante-Tezanos, A.; Milani, S.A.; Baillargeon, J.; Canfield, S.; Lopez, D.S. Association of sleep duration and quality with serum testosterone concentrations among men and women: NHANES 2011–2016. Andrology 2023, 12, 518–526. [CrossRef]
- Lopez, W.D.; Seng, J.S. Posttraumatic stress disorder, smoking, and cortisol in a community sample of pregnant women. Addict. Behav. 2014, 39, 1408–1413. [CrossRef]
- Varvarigou, A.A.; Petsali, M.; Vassilakos, P.; Beratis, N.G. Increased cortisol concentrations in the cord blood of newborns whose mothers smoked during pregnancy. jpme 2006, 34, 466–70. [CrossRef]
- Rizwan, S.; Manning, J.; Brabin, B. Maternal smoking during pregnancy and possible effects of in utero testosterone: Evidence from the 2D:4D finger length ratio. Early Hum. Dev. 2007, 83, 87–90. [CrossRef]
- Cajachagua-Torres, K.N.; Jaddoe, V.W.; de Rijke, Y.B.; Akker, E.L.v.D.; Reiss, I.K.; van Rossum, E.F.; El Marroun, H. Parental cannabis and tobacco use during pregnancy and childhood hair cortisol concentrations. Drug Alcohol Depend. 2021, 225, 108751. [CrossRef]
- Halmesmäki, E.; Autti, I.; Granström, M.-L.; Stenman, U.-H.; Ylikorkala, O. Estradiol, Estriol, Progesterone, Prolactin, and Human Chorionic Gonadotropin in Pregnant Women with Alcohol Abuse*. J. Clin. Endocrinol. Metab. 1987, 64, 153–156. [CrossRef]
- Lof M, Hilakivi-Clarke L, Sandin S S, de Assis S, Yu W, Weiderpass E. Dietary fat intake and gestational weight gain in relation to estradiol and progesterone plasma levels during pregnancy: a longitudinal study in Swedish women. BMC Womens Health. 2009 Apr 30;9(1):10. [CrossRef]
- Chonnak, U.; Pongsatha, S.; Luewan, S.; Sirilert, S.; Tongsong, T. Pregnancy outcomes among women near the end of reproductive age. BMC Pregnancy Childbirth 2025, 25, 1–9. [CrossRef]
- Glynn, L.M.; Schetter, C.D.; Chicz-DeMet, A.; Hobel, C.J.; Sandman, C.A. Ethnic differences in adrenocorticotropic hormone, cortisol and corticotropin-releasing hormone during pregnancy. Peptides 2007, 28, 1155–1161. [CrossRef]
- Thayer, Z.M.; Kuzawa, C.W. Ethnic discrimination predicts poor self-rated health and cortisol in pregnancy: Insights from New Zealand. Soc. Sci. Med. 2015, 128, 36–42. [CrossRef]
- Urizar, G.G.; Yim, I.S.; Kofman, Y.B.; Tilka, N.; Miller, K.; Freche, R.; Johnson, A. Ethnic differences in stress-induced cortisol responses:Increased risk for depression during pregnancy. Biol. Psychol. 2019, 147, 107630. [CrossRef]
- Maitre, L.; Villanueva, C.M.; Lewis, M.R.; Ibarluzea, J.; Santa-Marina, L.; Vrijheid, M.; Sunyer, J.; Coen, M.; Toledano, M.B. Maternal urinary metabolic signatures of fetal growth and associated clinical and environmental factors in the INMA study. BMC Med. 2016, 14, 1–12. [CrossRef]
- Maitre, L.; Jedynak, P.; Gallego, M.; Ciaran, L.; Audouze, K.; Casas, M.; Vrijheid, M. Integrating -omics approaches into population-based studies of endocrine disrupting chemicals: A scoping review. Environ. Res. 2023, 228, 115788. [CrossRef]
- Rivera-Núñez, Z.; Hansel, M.; Capurro, C.; Kozlosky, D.; Wang, C.; Doherty, C.L.; Buckley, B.; Ohman-Strickland, P.; Miller, R.K.; O’connor, T.G.; et al. Prenatal Cadmium Exposure and Maternal Sex Steroid Hormone Concentrations across Pregnancy. Toxics 2023, 11, 589. [CrossRef]
- Kolatorova, L.; Vitku, J.; Hampl, R.; Adamcova, K.; Skodova, T.; Simkova, M.; Parizek, A.; Starka, L.; Duskova, M. Exposure to bisphenols and parabens during pregnancy and relations to steroid changes. Environ. Res. 2018, 163, 115–122. [CrossRef]
- Ryva, B.A.; Pacyga, D.C.; Anderson, K.Y.; Calafat, A.M.; Whalen, J.; Aung, M.T.; Gardiner, J.C.; Braun, J.M.; Schantz, S.L.; Strakovsky, R.S. Associations of urinary non-persistent endocrine disrupting chemical biomarkers with early-to-mid pregnancy plasma sex-steroid and thyroid hormones. Environ. Int. 2024, 183, 108433–108433. [CrossRef]
- Pacyga, D.C.; Gardiner, J.C.; Flaws, J.A.; Li, Z.; Calafat, A.M.; Korrick, S.A.; Schantz, S.L.; Strakovsky, R.S. Maternal phthalate and phthalate alternative metabolites and urinary biomarkers of estrogens and testosterones across pregnancy. Environ. Int. 2021, 155, 106676. Erratum in Environ Int. 2021 Oct;155:106676. [CrossRef]
- Lu, C.-L.; Wen, H.-J.; Chen, M.-L.; Sun, C.-W.; Hsieh, C.-J.; Wu, M.-T.; Wang, S.-L.; TMICS study group Prenatal phthalate exposure and sex steroid hormones in newborns: Taiwan Maternal and Infant Cohort Study. PLOS ONE 2024, 19, e0297631. [CrossRef]
- Bedrak, E.; Brandes, O.; Fried, K. Profiles of steroids during third trimester of pregnancy in women: Effect of hot, dry desert environment. J. Therm. Biol. 1980, 5, 235–241. [CrossRef]
- Vähä-Eskeli, K.; Erkkola, R.; Irjala, K.; Uotila, P.; Poranen, A.-K.; Säteri, U. Responses of placental steroids, prostacyclin and thromboxane A2 to thermal stress during pregnancy. Eur. J. Obstet. Gynecol. Reprod. Biol. 1992, 43, 97–103. [CrossRef]
- Plusquin, M.; Wang, C.; Cosemans, C.; Roels, H.A.; Vangeneugden, M.; Lapauw, B.; Fiers, T.; T’sJoen, G.; Nawrot, T.S. The association between newborn cord blood steroids and ambient prenatal exposure to air pollution: findings from the ENVIRONAGE birth cohort. Environ. Heal. 2023, 22, 1–13. [CrossRef]
- Colicino, E.; Cowell, W.; Pedretti, N.F.; Joshi, A.; Youssef, O.; Just, A.C.; Kloog, I.; Petrick, L.; Niedzwiecki, M.; Wright, R.O.; et al. Maternal steroids during pregnancy and their associations with ambient air pollution and temperature during preconception and early gestational periods. Environ. Int. 2022, 165, 107320. [CrossRef]
- Maitre, L.; Lau, C.-H.E.; Vizcaino, E.; Robinson, O.; Casas, M.; Siskos, A.; Want, E.J.; Athersuch, T.; Slama, R.; Vrijheid, M.; et al. Assessment of metabolic phenotypic variability in children’s urine using 1H NMR spectroscopy. Sci. Rep. 2017, 7, srep46082. [CrossRef]
- Diviccaro S, Giatti S, Cioffi L, Chrostek G, Melcangi RC. The gut-microbiota-brain axis: Focus on gut steroids. J Neuroendocrinol. 2025;37(7):e13471. [CrossRef]
- Dadvand, P.; Gascon, M.; Bustamante, M.; Rivas, I.; Foraster, M.; Basagaña, X.; Cosín, M.; Eixarch, E.; Ferrer, M.; Gratacós, E.; et al. Cohort Profile: Barcelona Life Study Cohort (BiSC). Int J Epidemiol. 2024 Apr 11;53(3):dyae063. [CrossRef]
- Guxens, M.; Aguilera, I.; Ballester, F.; Estarlich, M.; Fernández-Somoano, A.; Lertxundi, A.; Lertxundi, N.; Mendez, M.A.; Tardón, A.; Vrijheid, M.; et al. Prenatal Exposure to Residential Air Pollution and Infant Mental Development: Modulation by Antioxidants and Detoxification Factors. Environ. Heal. Perspect. 2012, 120, 144–149. [CrossRef]
- Lubin JH, Colt JS, Camann D, Davis S, Cerhan JR, Severson RK, et al. Epidemiologic Evaluation of Measurement Data in the Presence of Detection Limits. Environ Health Perspect. 2004 Dec;112(17):1691–6.
- Magyar, B.P.; Santi, M.; Sommer, G.; Nuoffer, J.-M.; Leichtle, A.; Grössl, M.; E Fluck, C. Short-Term Fasting Attenuates Overall Steroid Hormone Biosynthesis in Healthy Young Women. J. Endocr. Soc. 2022, 6, bvac075. [CrossRef]
- Ondřejíková L, Pařízek A, Šimják P, Vejražková D, Velíková M, Anderlová K, et al. Altered Steroidome in Women with Gestational Diabetes Mellitus: Focus on Neuroactive and Immunomodulatory Steroids from the 24th Week of Pregnancy to Labor. Biomolecules. 2021 Dec;11(12):1746. [CrossRef]
- Guxens M, Ballester F, Espada M, Fernández MF, Grimalt JO, Ibarluzea J, et al. Cohort Profile: The INMA—INfancia y Medio Ambiente—(Environment and Childhood) Project. Int J Epidemiol. 2012 Aug 1;41(4):930–40. [CrossRef]
- Hadlock, F.P.; Harrist, R.B.; Sharman, R.S.; Deter, R.L.; Park, S.K. Estimation of fetal weight with the use of head, body, and femur measurements—A prospective study. Am. J. Obstet. Gynecol. 1985, 151, 333–337. [CrossRef]
- Salomon L j., Alfirevic Z, Da Silva Costa F, Deter R l., Figueras F, Ghi T, et al. ISUOG Practice Guidelines: ultrasound assessment of fetal biometry and growth. Ultrasound Obstet Gynecol. 2019;53(6):715–23.
- Iñiguez C, Esplugues A, Sunyer J, Basterrechea M, Fernández-Somoano A, Costa O, et al. Prenatal Exposure to NO2 and Ultrasound Measures of Fetal Growth in the Spanish INMA Cohort. Environ Health Perspect. 2016 Feb;124(2):235–42. [CrossRef]
- Mullen, J.; Gadot, Y.; Eklund, E.; Andersson, A.; Schulze, J.J.; Ericsson, M.; Hirschberg, A.L.; Rane, A.; Ekström, L. Pregnancy greatly affects the steroidal module of the Athlete Biological Passport. Drug Test. Anal. 2018, 10, 1070–1075. [CrossRef]
- Hellgren, C.; Comasco, E.; Skalkidou, A.; Sundström-Poromaa, I. Allopregnanolone levels and depressive symptoms during pregnancy in relation to single nucleotide polymorphisms in the allopregnanolone synthesis pathway. Horm. Behav. 2017, 94, 106–113. [CrossRef]
- Miodovnik, A.; Diplas, A.I.; Chen, J.; Zhu, C.; Engel, S.M.; Wolff, M.S. Polymorphisms in the maternal sex steroid pathway are associated with behavior problems in male offspring. Psychiatr. Genet. 2012, 22, 115–122. [CrossRef]
- Cox JL, Holden JM, Sagovsky R. Detection of Postnatal Depression: Development of the 10-item Edinburgh Postnatal Depression Scale. Br J Psychiatry. 1987 Jun;150(6):782–6.
- Remor, E. Psychometric Properties of a European Spanish Version of the Perceived Stress Scale (PSS). Span. J. Psychol. 2006, 9, 86–93. [CrossRef]
- Cohen, S.; Kamarck, T.; Mermelstein, R. A Global Measure of Perceived Stress. J. Heal. Soc. Behav. 1983, 24, 385–96. [CrossRef]
- Coll-Risco, I.; Camiletti-Moirón, D.; Acosta-Manzano, P.; Aparicio, V.A. Translation and cross-cultural adaptation of the Pregnancy Physical Activity Questionnaire (PPAQ) into Spanish. J. Matern. Neonatal Med. 2018, 32, 3954–3961. [CrossRef]
- WHO. WHO Guidelines on Physical Activity and Sedentary Behaviour. 1st ed. Geneva: World Health Organization; 2020. 1 p.
- Buysse, D.J.; Reynolds, C.F., III; Monk, T.H.; Berman, S.R.; Kupfer, D.J. The Pittsburgh sleep quality index: A new instrument for psychiatric practice and research. Psychiatry Res. 1989, 28, 193–213. [CrossRef]
- Vioque, J.; Navarrete-Muñoz, E.-M.; Gimenez-Monzó, D.; García-De-La-Hera, M.; Granado, F.; Young, I.S.; Ramón, R.; Ballester, F.; Murcia, M.; Rebagliato, M.; et al. Reproducibility and validity of a food frequency questionnaire among pregnant women in a Mediterranean area. Nutr. J. 2013, 12, 26. [CrossRef]
- Fung TT, McCullough ML, Newby P, Manson JE, Meigs JB, Rifai N, et al. Diet-quality scores and plasma concentrations of markers of inflammation and endothelial dysfunction2. Am J Clin Nutr. 2005 Jul 1;82(1):163–73. [CrossRef]
- SR28 - Page Reports : USDA ARS [Internet]. [cited 2025 Jul 24]. Available from: https://www.ars.usda.gov/northeast-area/beltsville-md-bhnrc/beltsville-human-nutrition-research-center/methods-and-application-of-food-composition-laboratory/mafcl-site-pages/sr28-page-reports/.
- Palma- Linares I, Farrán Codina A, Cervera Ral P. Tablas de composición de alimentos por medidas caseras de consumo habitual en España: = Taules de composició d’aliments per mesures casolanes de consum habitual a Espanya. 2005.
- Willett, W.C.; Howe, G.R.; Kushi, L.H. Adjustment for total energy intake in epidemiologic studies. Am. J. Clin. Nutr. 1997, 65 (Suppl. S4), 1220S–1228S. [CrossRef]
- Imma Palma Dra, Farran A, Pilar Cervera Sra. Tablas de composición de alimentos por medidas caseras de consumo habitual en España. Act Dietética. 2008 Dec 1;12(2):85.
- USDA National Nutrient Database for Standard Reference, Release 21.
- Li, M.-X.; Yeung, J.M.Y.; Cherny, S.S.; Sham, P.C. Evaluating the effective numbers of independent tests and significant p-value thresholds in commercial genotyping arrays and public imputation reference datasets. Hum. Genet. 2011, 131, 747–756. [CrossRef]
- Zou H, Hastie T. Regularization and Variable Selection Via the Elastic Net. J R Stat Soc Ser B Stat Methodol. 2005 Apr 1;67(2):301–20. [CrossRef]
- Groemping U. Relative Importance for Linear Regression in R: The Package relaimpo. J Stat Softw. 2007;17:1–27. [CrossRef]
Figure 1.
Schematic representation of the steroidogenesis pathways during pregnancy studied. DHEA-S, Dehydroepiandrosterone (DHEA)-sulfate; 5AD-diS_1, 5-androsten-3b17b-diol-diSulfate; 5AD-diS_2, 5-androsten-3a17b-diol-diSulfate; 16OHDHEA-diS_1, 16b-hydroxy-DHEA-diSulfate; 16OHDHEA-diS_2, 16a-hydroxy-DHEA-diSulfate; epiAN-S, epiandrosterone-Sulfate; 16OH-DHEAS_1, 16b-hydroxy-DHEA-Sulfate; 16OH-DHEAS_2, 16a-hydroxy-DHEA-Sulfate; T-G, Testosterone-Glucuronide; T-S, Testosterone-Sulfate; AN-S, Androsterone-Sulfate; Etio-S, Etiocholanolone-Sulfate; Andros-G, Androsterone-Glucuronide; Etio-G, Etiocholanolone-Glucuronide; B-S, Corticosterone-Sulfate; A-S, 11-dehydrocorticosterone-Sulfate; F-S, Cortisol-Sulfate; E-S, Cortisone-Sulfate; E-G, Cortisone-Glucuronide; F-G, Cortisol-Glucuronide; 20DHE-G, 20dihydrocortisone-Glucuronide; 20aDHF-G, 20a-dihydrocortisol-Glucuronide; 20bDHF-G, 20b-dihydrocortisol-Glucuronide; THE-G, Tetrahydrocortisone-Glucuronide; Cortolone-G_1, 20a-Cortolone-Glucuronide; Cortolone-G_2, 20b-Cortolone-Glucuronide; E2-S, Estradiol-Sulfate; E1-G, Estrone-Glucuronide; E1-S, Estrone-Sulfate; E3-G, Estriol-Glucuronide; E3-SG, Estriol-Sulfoglucoconjugated; E3-S, Estriol-Sulfate; E4-SG, Estetrol-Sulfoglucoconjugated; 5PD-20one-S, 17-hydroxy-5-pregnenolone-3-sulfate; PT-diS, Pregnantriol-diSulfate; PT-G, Pregnantriol-Glucuronide; 5PD-diS, 5-Pregnendiol-DiSulfate; 21OH-5P-diS, 21-Hydroxypregnenolone-DiSulfate; 5PD-SG, 5-Pregnendiol-Sulfoglucoconjugated; 5PD-G, 5-Pregnendiol-Glucuronide; PD-diS_1, 5a-Pregnan-3b,20a-diol-DiSulfate; PD_diS_2, 5a-Pregnan-3a,20a-diol-DiSulfate; PD-diS_3, 5b-Pregnan-3a,20a-diol-DiSulfate; PD-SG_1, 5a-Pregnandiol-3b-sulfate-20a-Glucuronide; PD-SG_2, Pregnandiol-sulfoglucoconjugate; PD-SG_4, Pregnandiol-sulfoglucoconjugate; PD-SG_5, Pregnandiol-sulfoglucoconjugate; PD-S_1, 5a-Pregnan-3b20a-diol-20-Sulfate; PD-S_2, 5b-Pregnan-3a20a-diol-20-Sulfate; PD-G, Pregnandiol-Glucuronide.
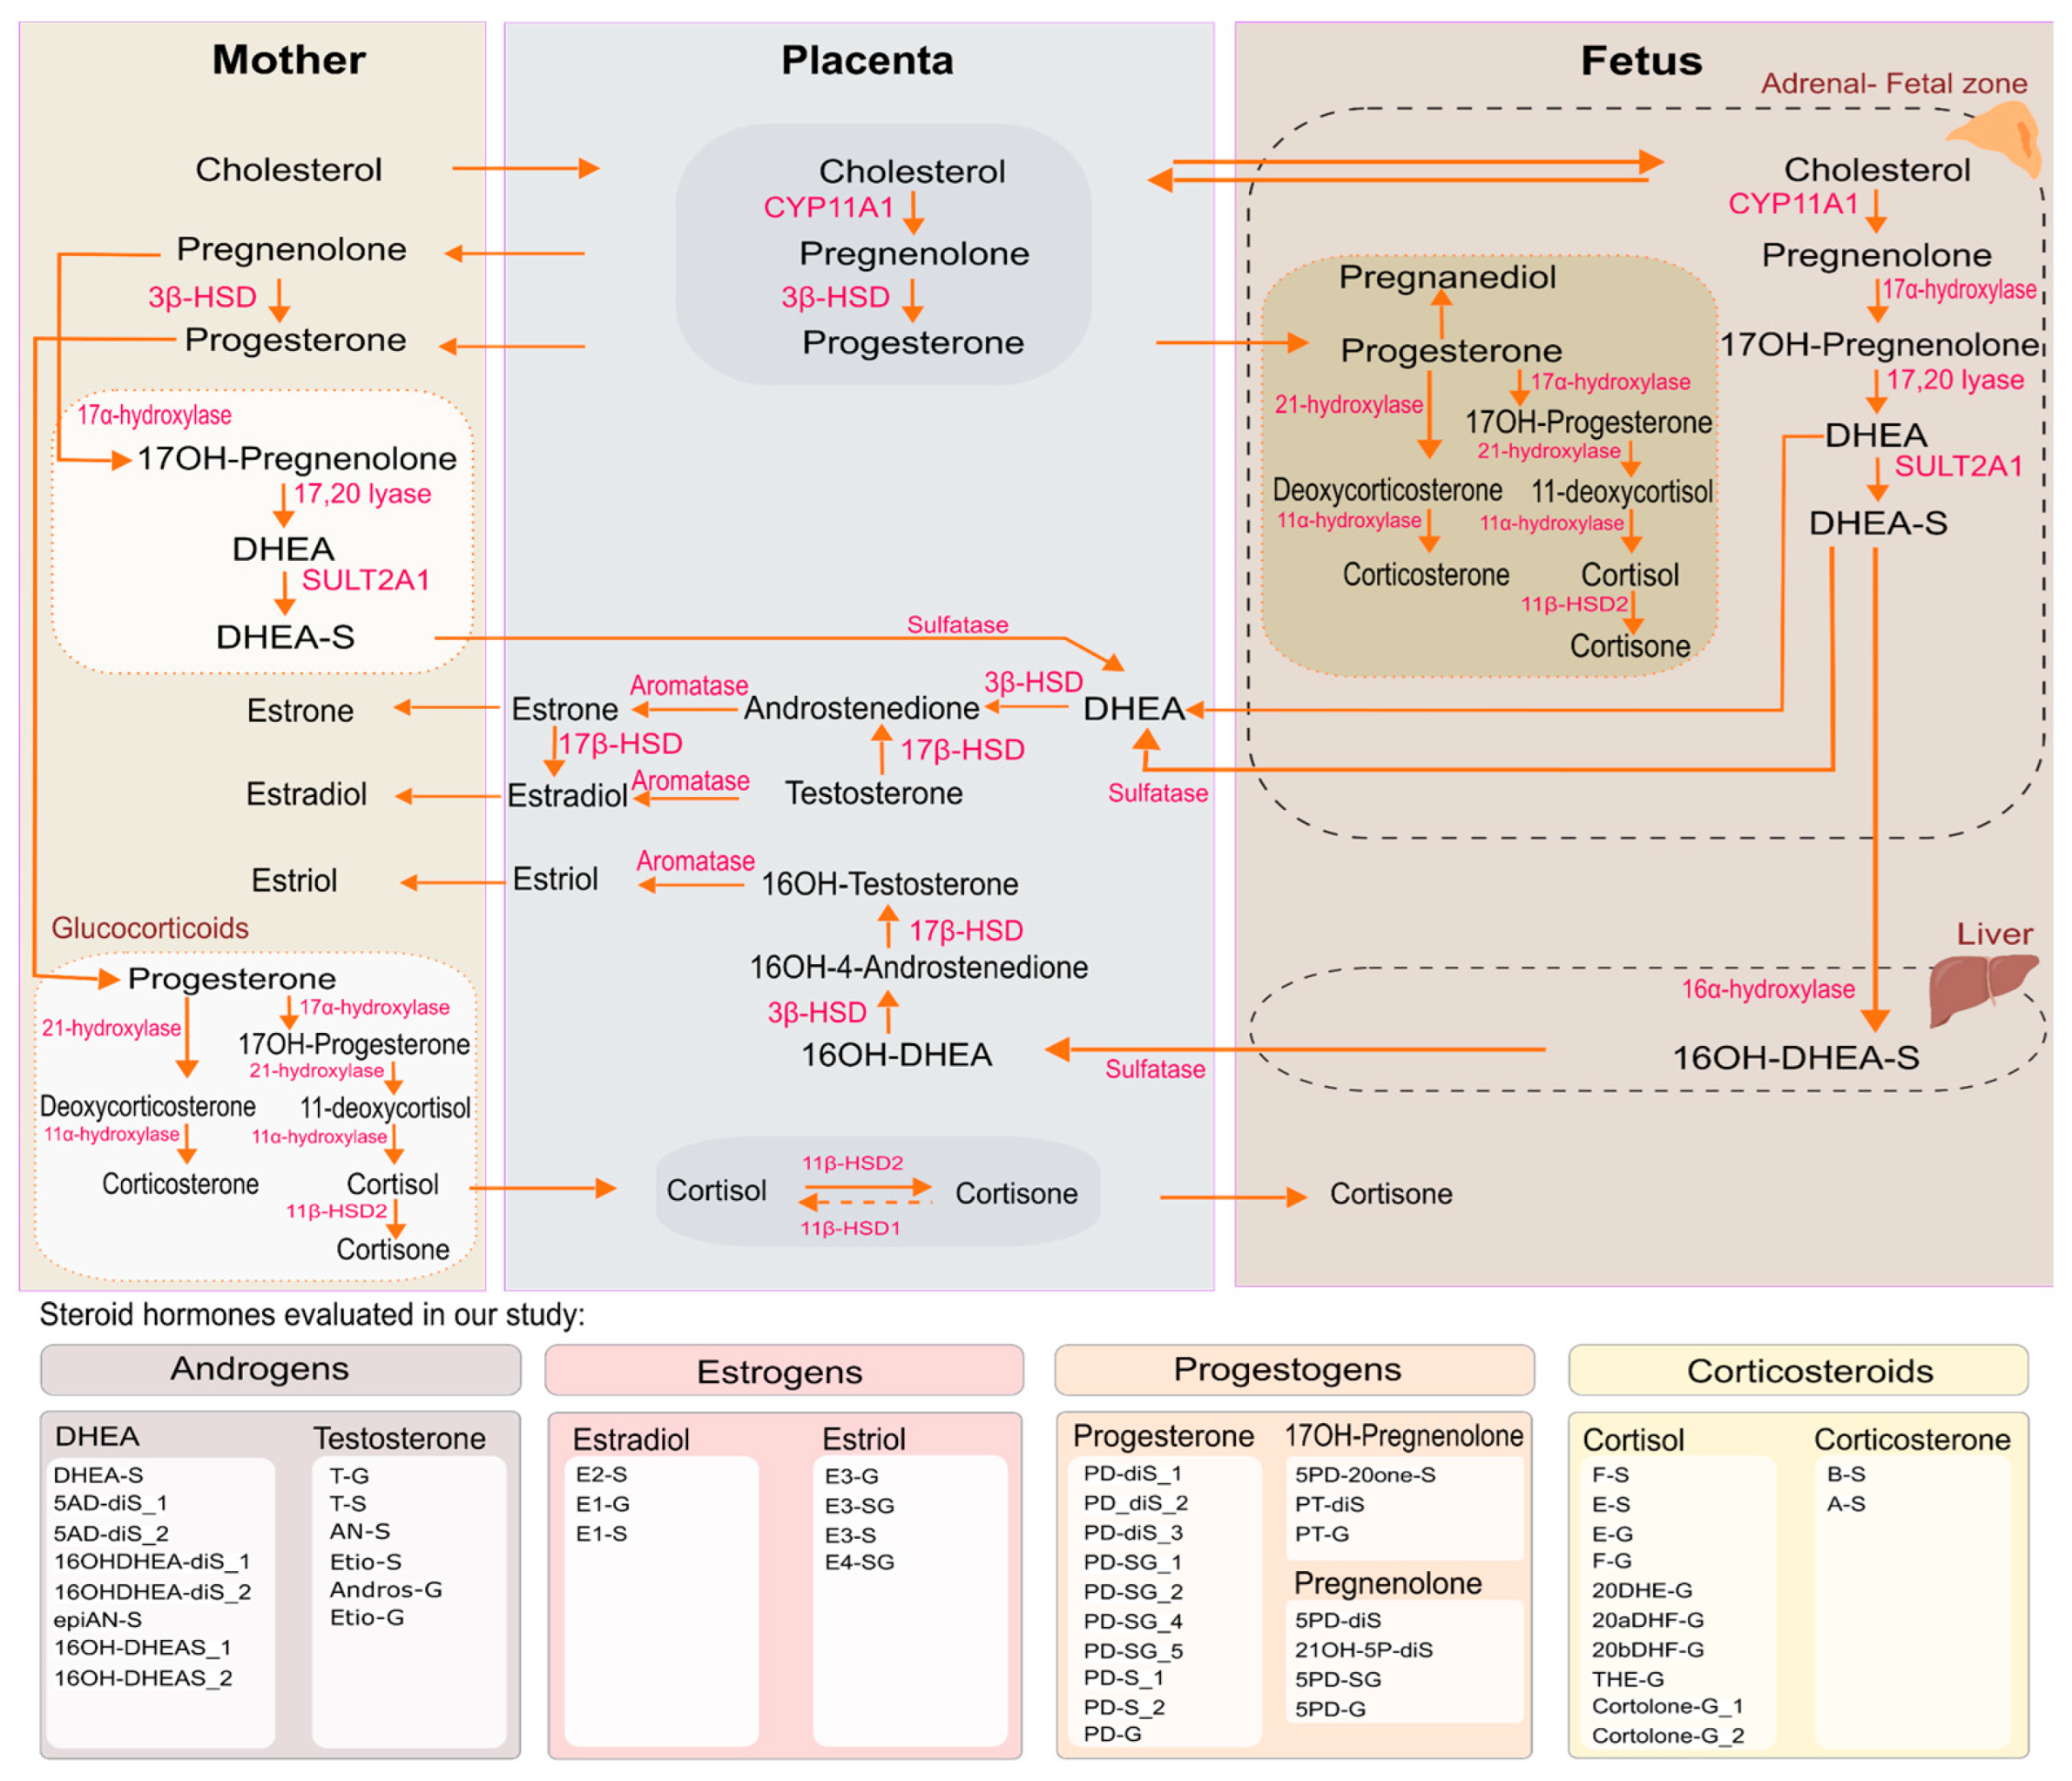
Figure 2.
Flow diagram.
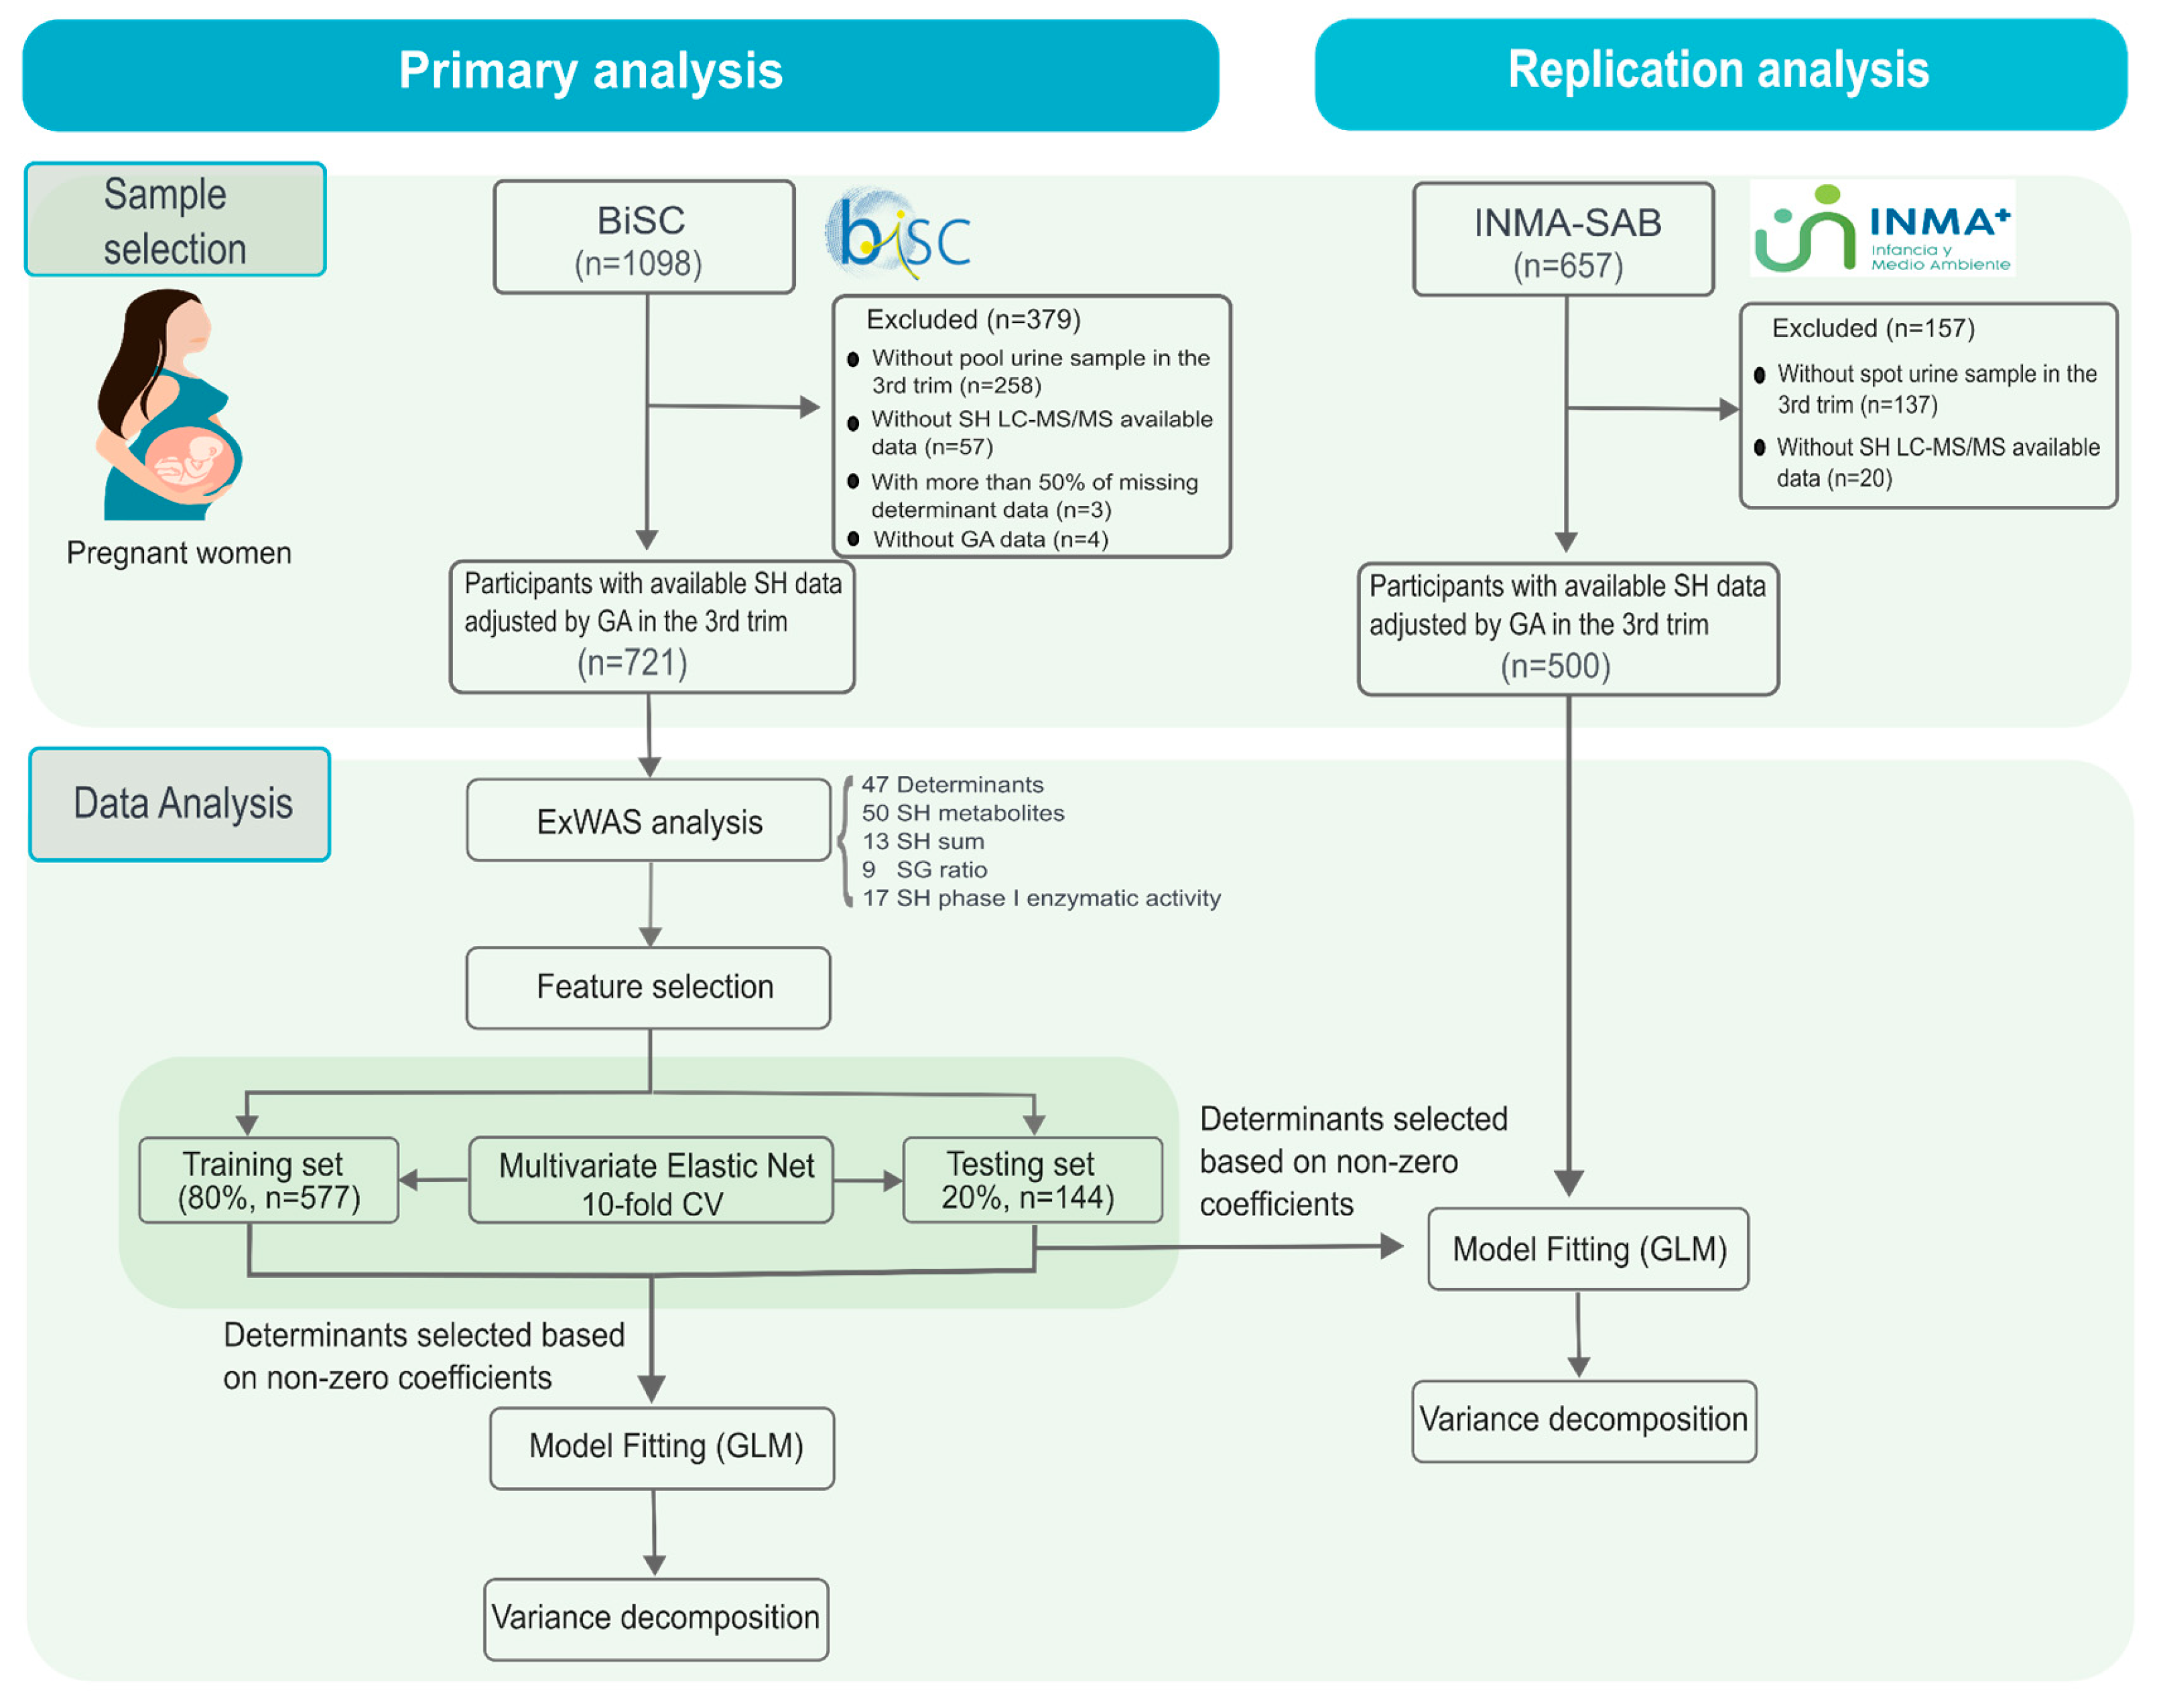
Figure 3.
Determinants considered analysed in BiSC (n=719) and INMA-Sabadell (n=500) cohorts. OC obstetric complication; PCOS, Polycystic Ovary Syndrome.
Figure 3.
Determinants considered analysed in BiSC (n=719) and INMA-Sabadell (n=500) cohorts. OC obstetric complication; PCOS, Polycystic Ovary Syndrome.
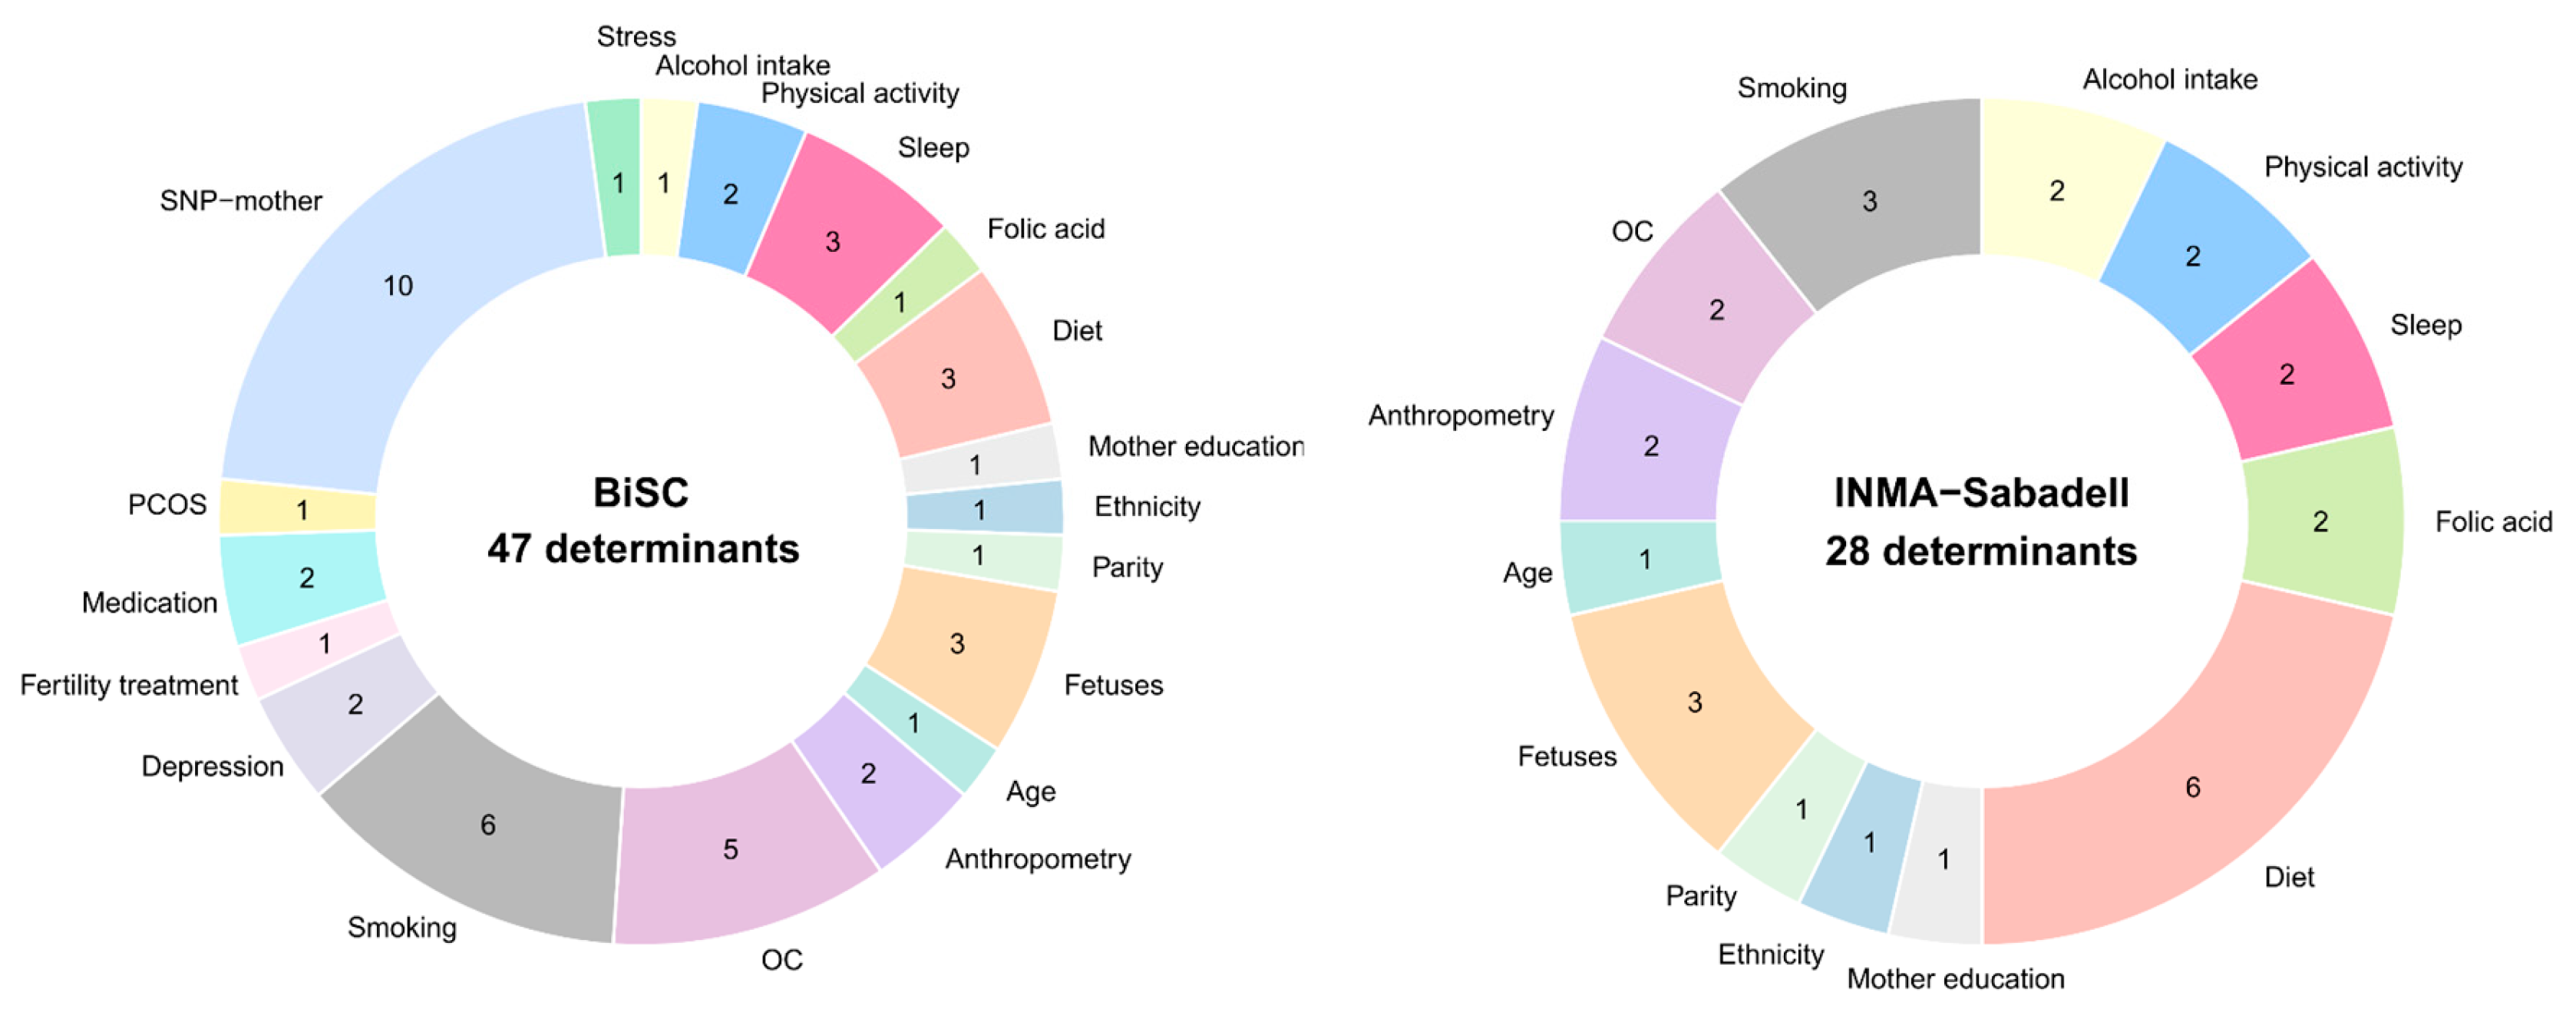
Figure 4.
Network of significant associations between SH metabolome and main determinants in the BiSC Cohort (n=721). Network of significant associations between key determinants and the steroid metabolome.The main determinants include physiological factors (mother and fetus), sociodemographic variables, genetics (polymorphism of steroid hormones enzymes), medical history, stress, depression, and lifestyle factors (alcohol intake, smoking, dietary intake, physical activity, and sleep pattern). IQR normalization of determinants was applied. The steroid metabolome was log2 transformed. All associations were adjusted for potential confounding variables, including hospital in the 3rd trimester or at birth, COVID-19 exposure period, and season of birth. The steroid metabolome included individual hormones, hormone groups, and enzymatic activities. P values below 0.05 are significant. Edge weight indicates the weight of -log10(p.value) meaning that high edge has more significant association.
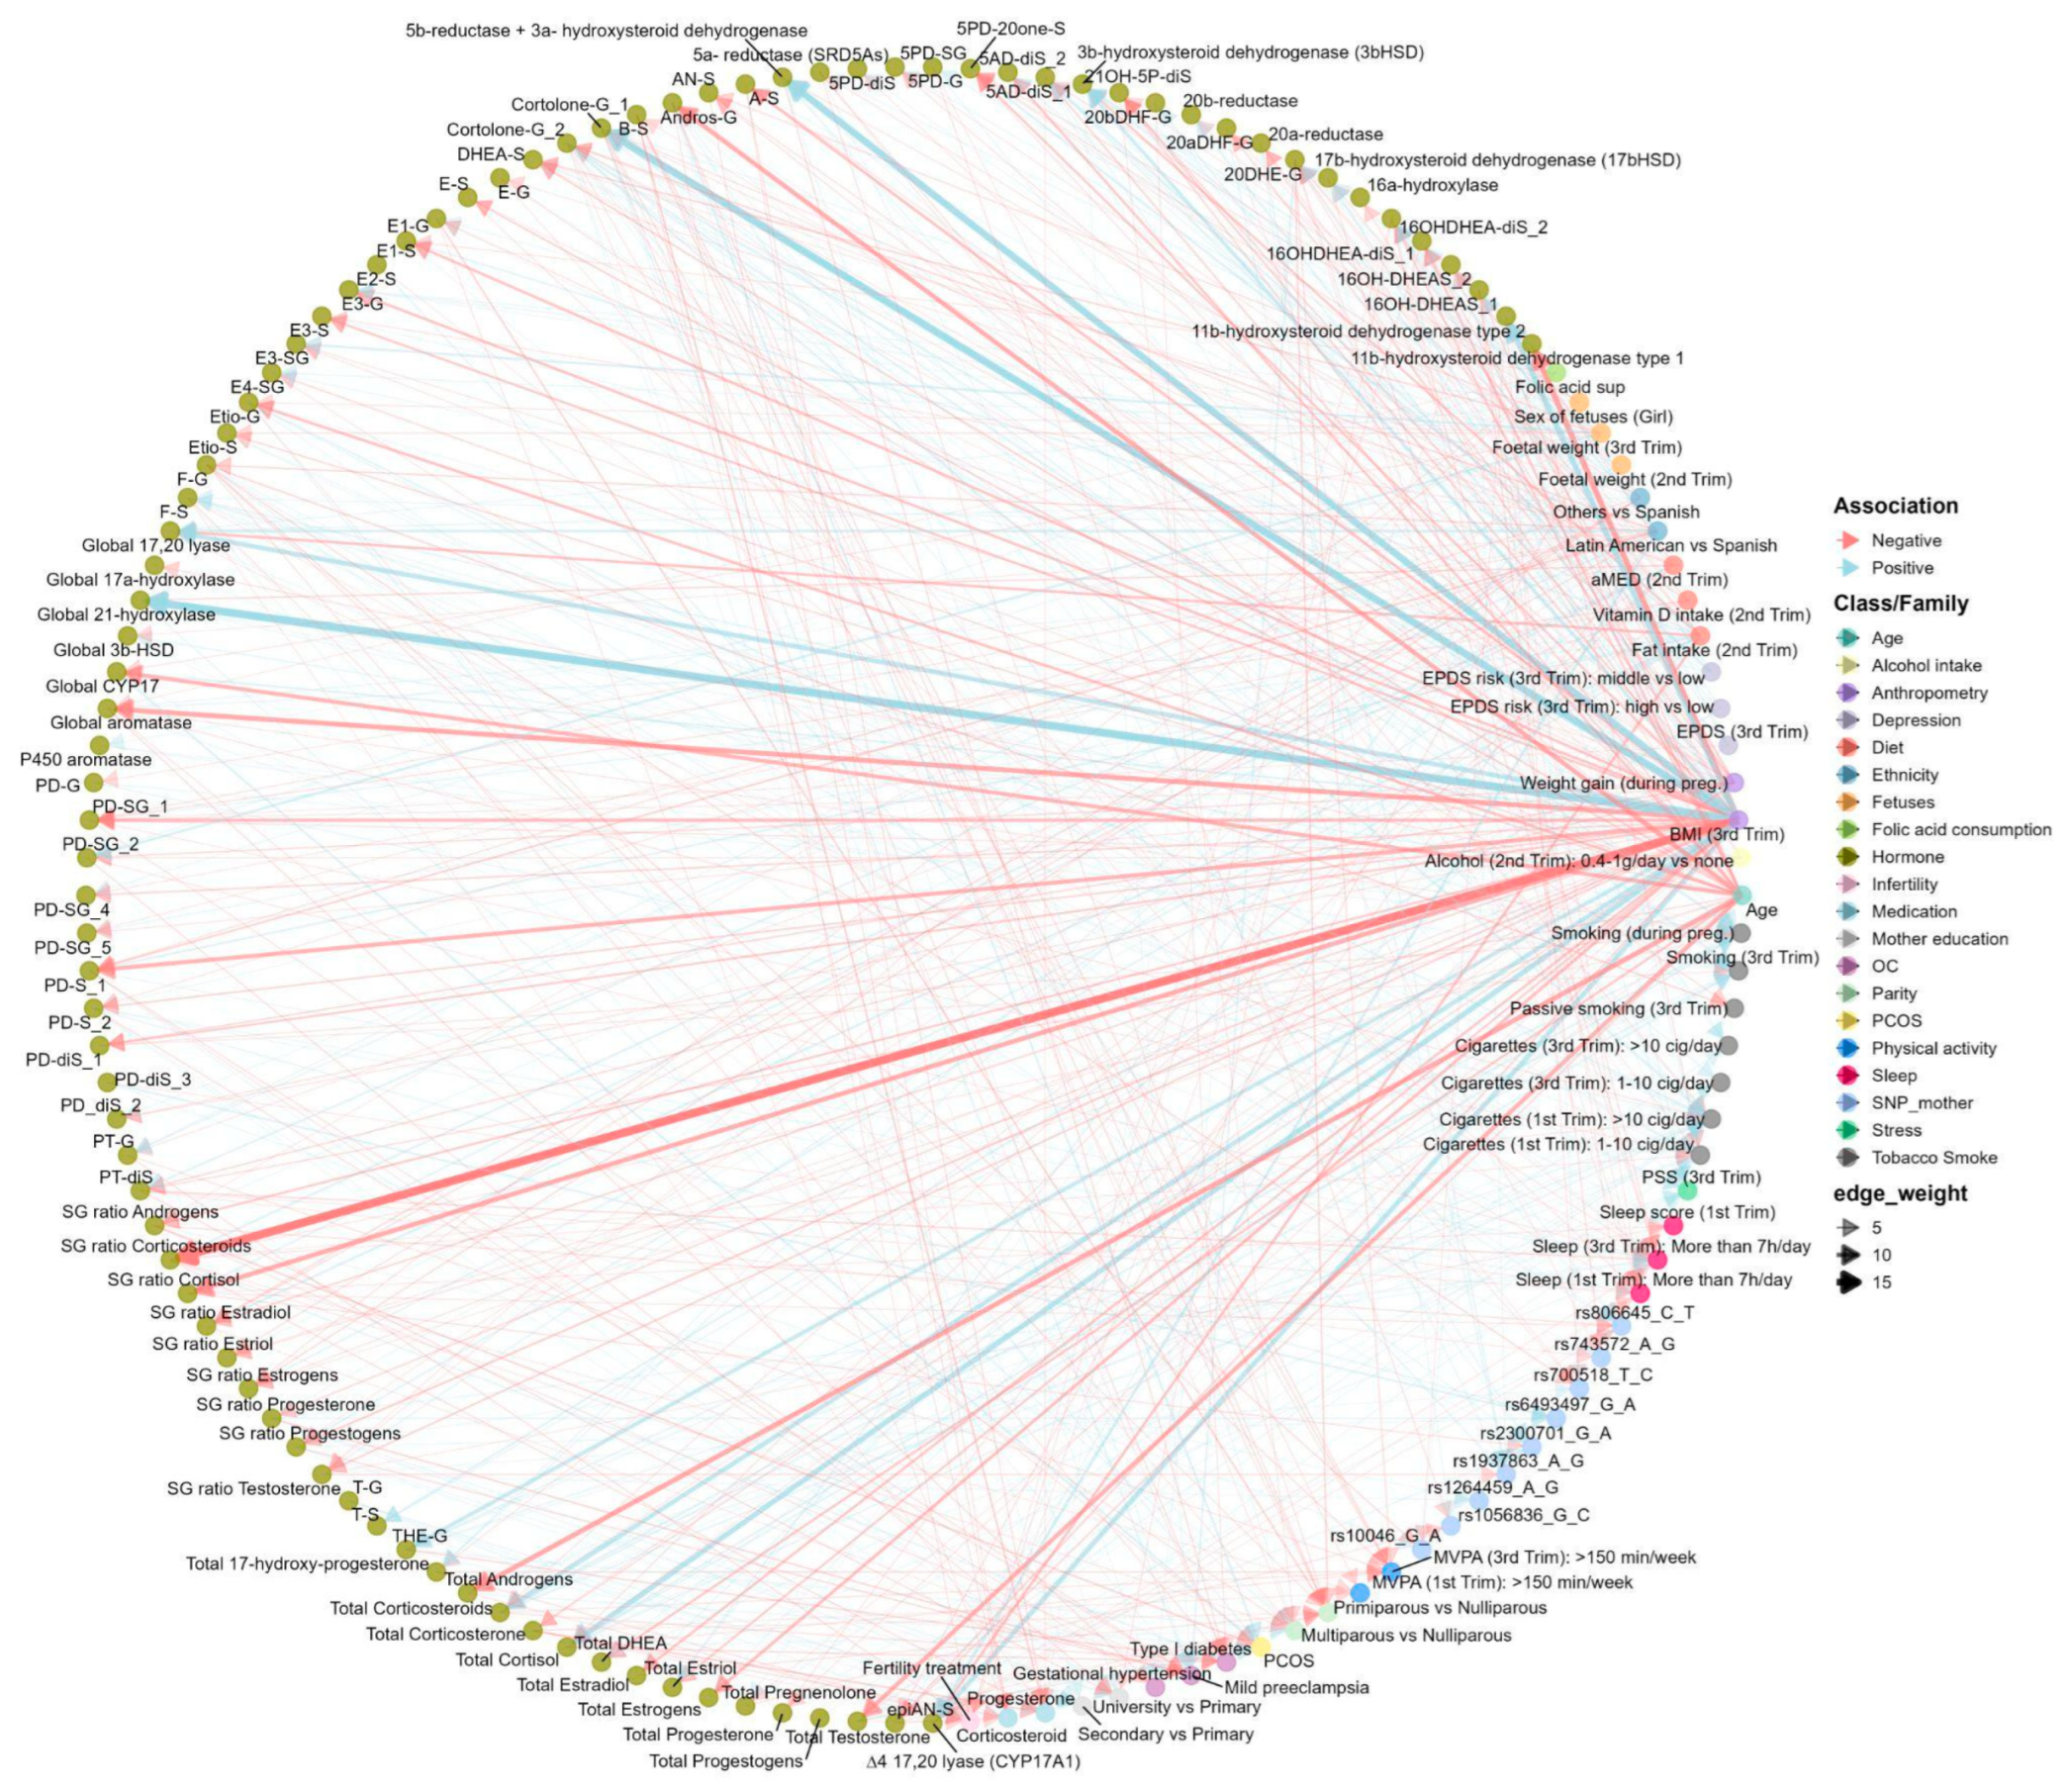
Figure 5.
Variable Selection in Elastic Net Regression for SH metabolome from BiSC cohort. Heatmap illustrating the selection of variables in ENET regression for steroid hormone metabolites from the BiSC cohort.. Rows correspond to determinants grouped by family categories, and columns correspond to SH metabolites grouped into Androgens, Corticosteroids, Estrogens, Progestogens, S/G ratio, and Phase I enzymatic activity. Tile color shows coefficient direction (positive: soft orange; negative: soft blue), while very light gray indicates variables selected in less than 80% of 100 bootstrap replications.
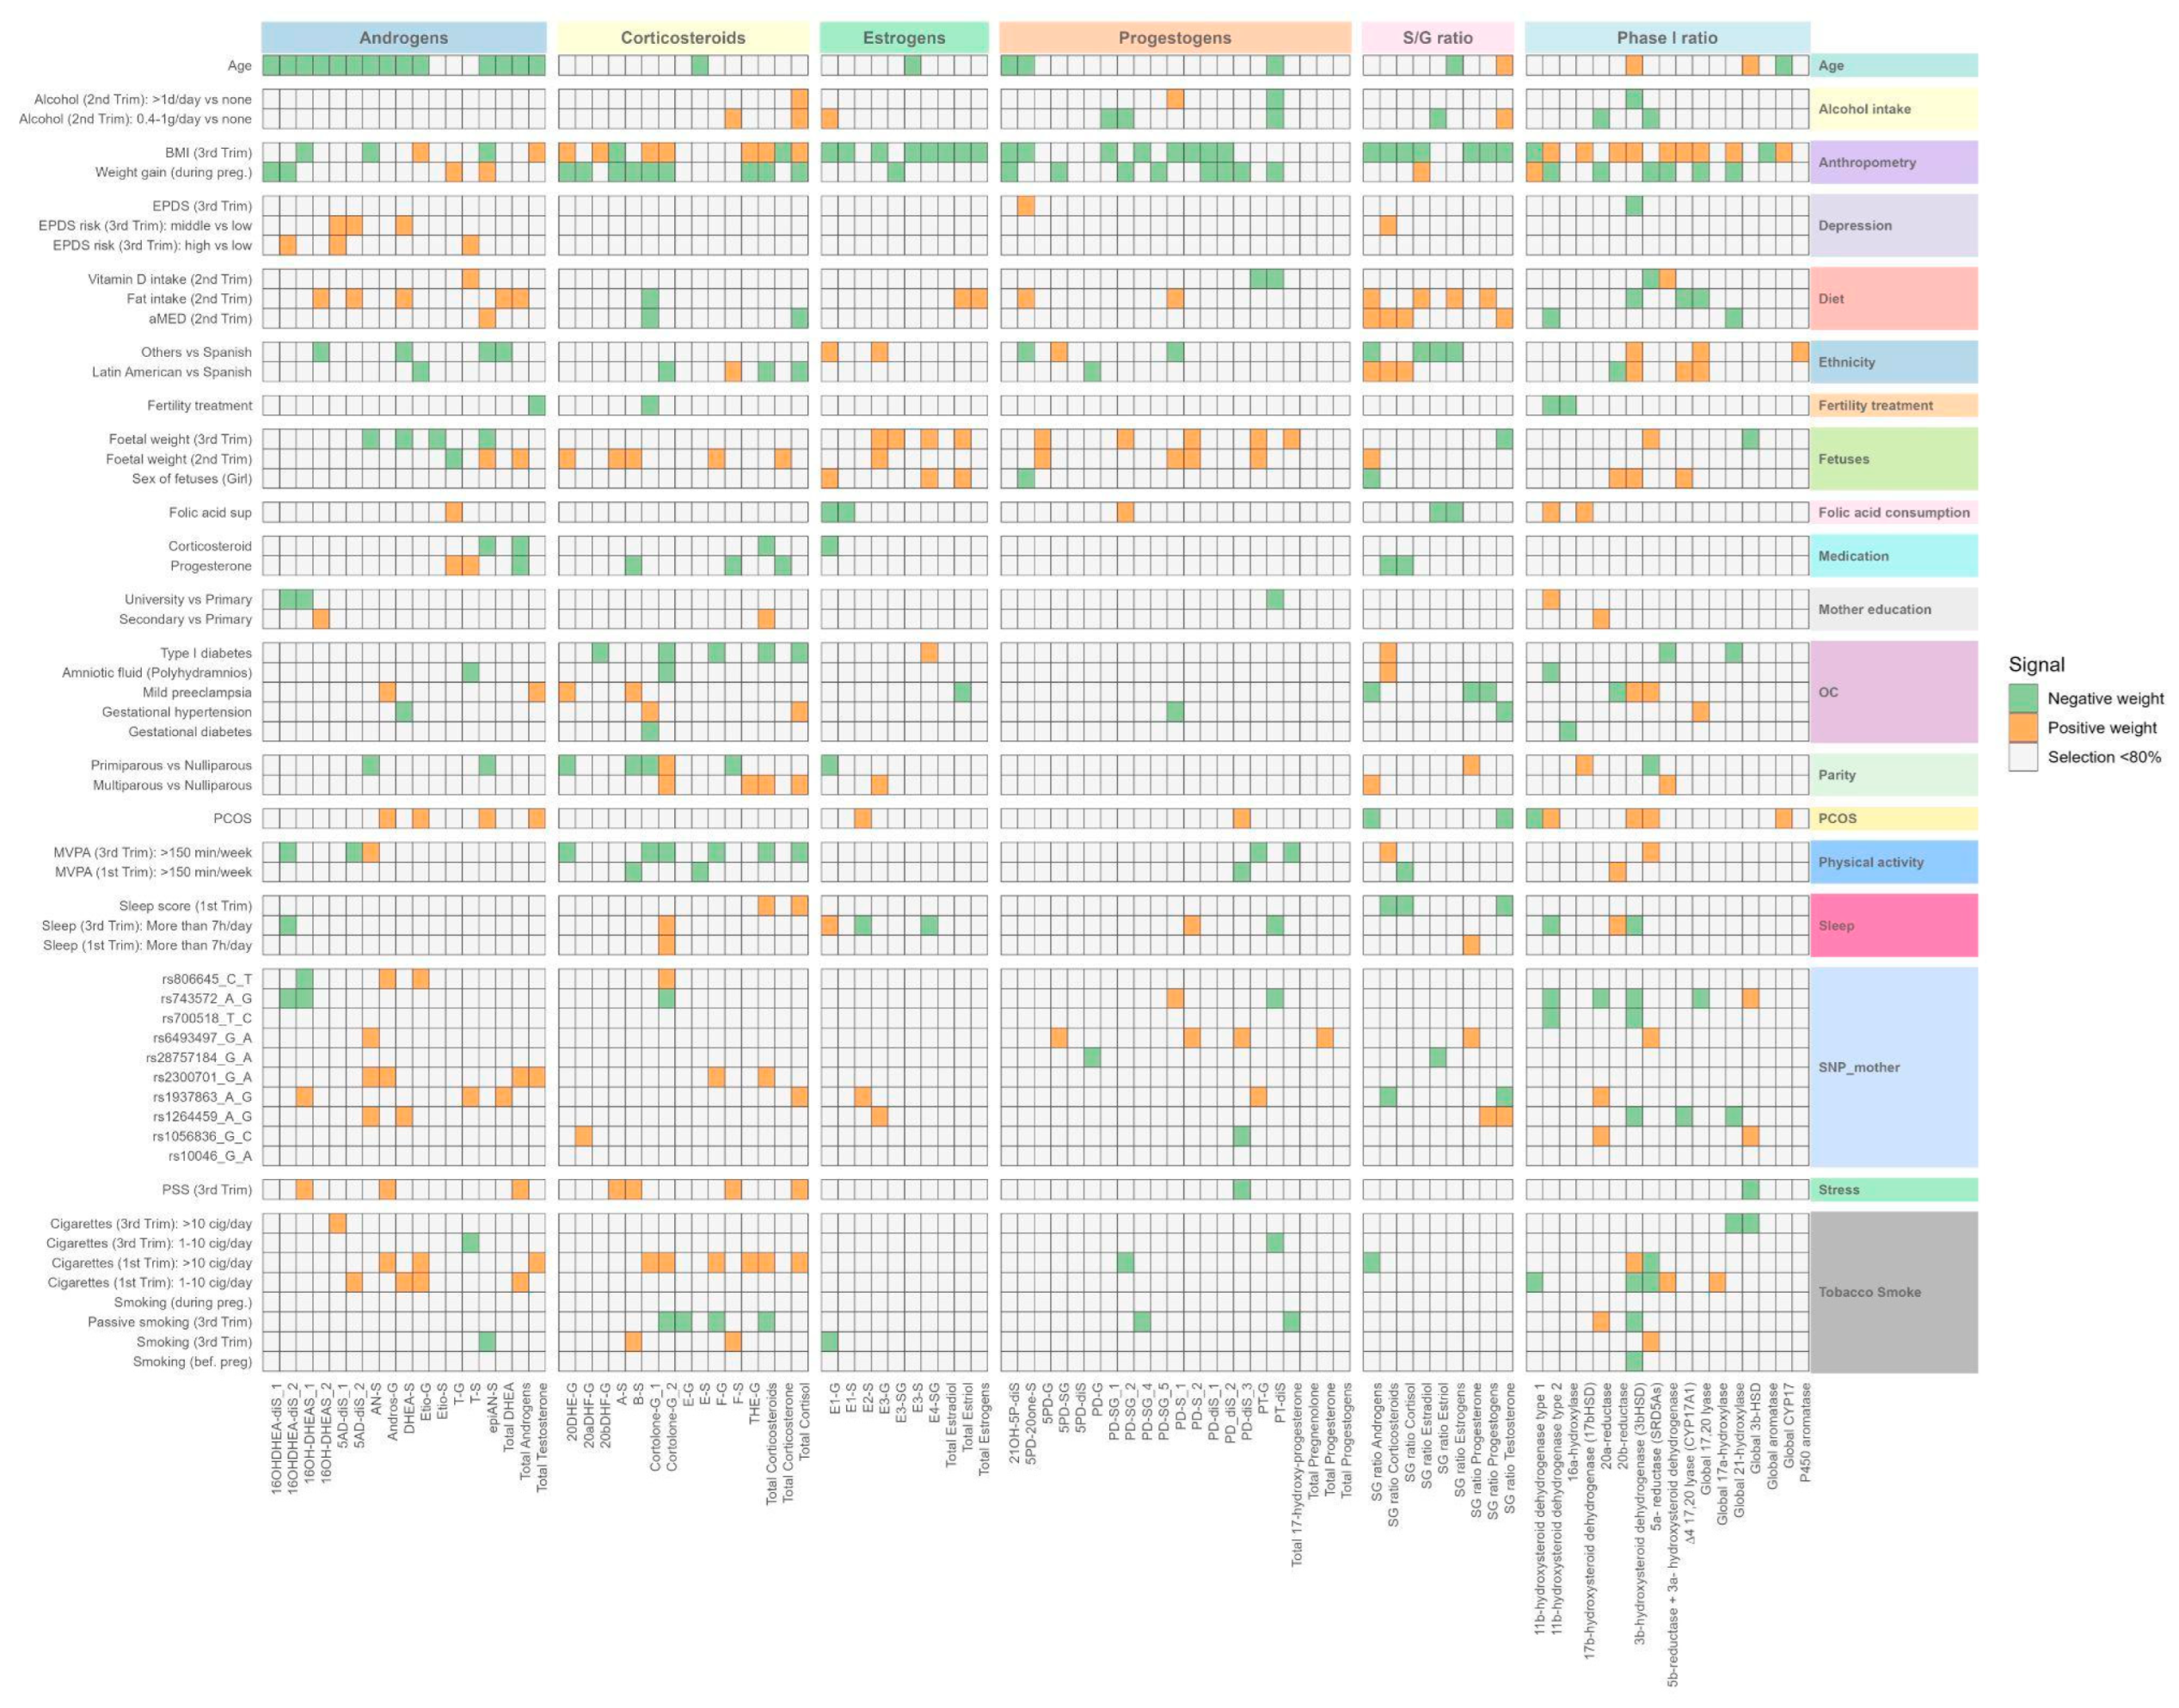
Figure 6.
Variance explained between main determinants selected by ENET and Steroid Hormone Metabolome from BiSC cohort (n=721). Panels: (A) Individual steroid hormone metabolites [49], (B) Sum of steroid hormones [11], (C) Sulfate-to-Glucuronide ratio [9], (D) Enzymatic Activity (product-to-precursor ratio) [17]. Variance explained (R²) estimated from linear regression models with enet-selected determinants, adjusted for hospital at third trimester or birth, COVID-19 exposure period, and season. OC, obstetric complication; PCOS, Polycystic Ovary Syndrome. Anthropometry variables included weight gain during pregnancy (from 1st trimester to 3rd trimester) and body mass index in the 3rd trimester. OC included diabetes, preeclampsia, hypertension and abnormal amniotic fluid. SNIP included rs1056836, rs1264459, rs1937863, rs2300701, rs28757184, rs6493497, rs700518, rs743572, rs806645.
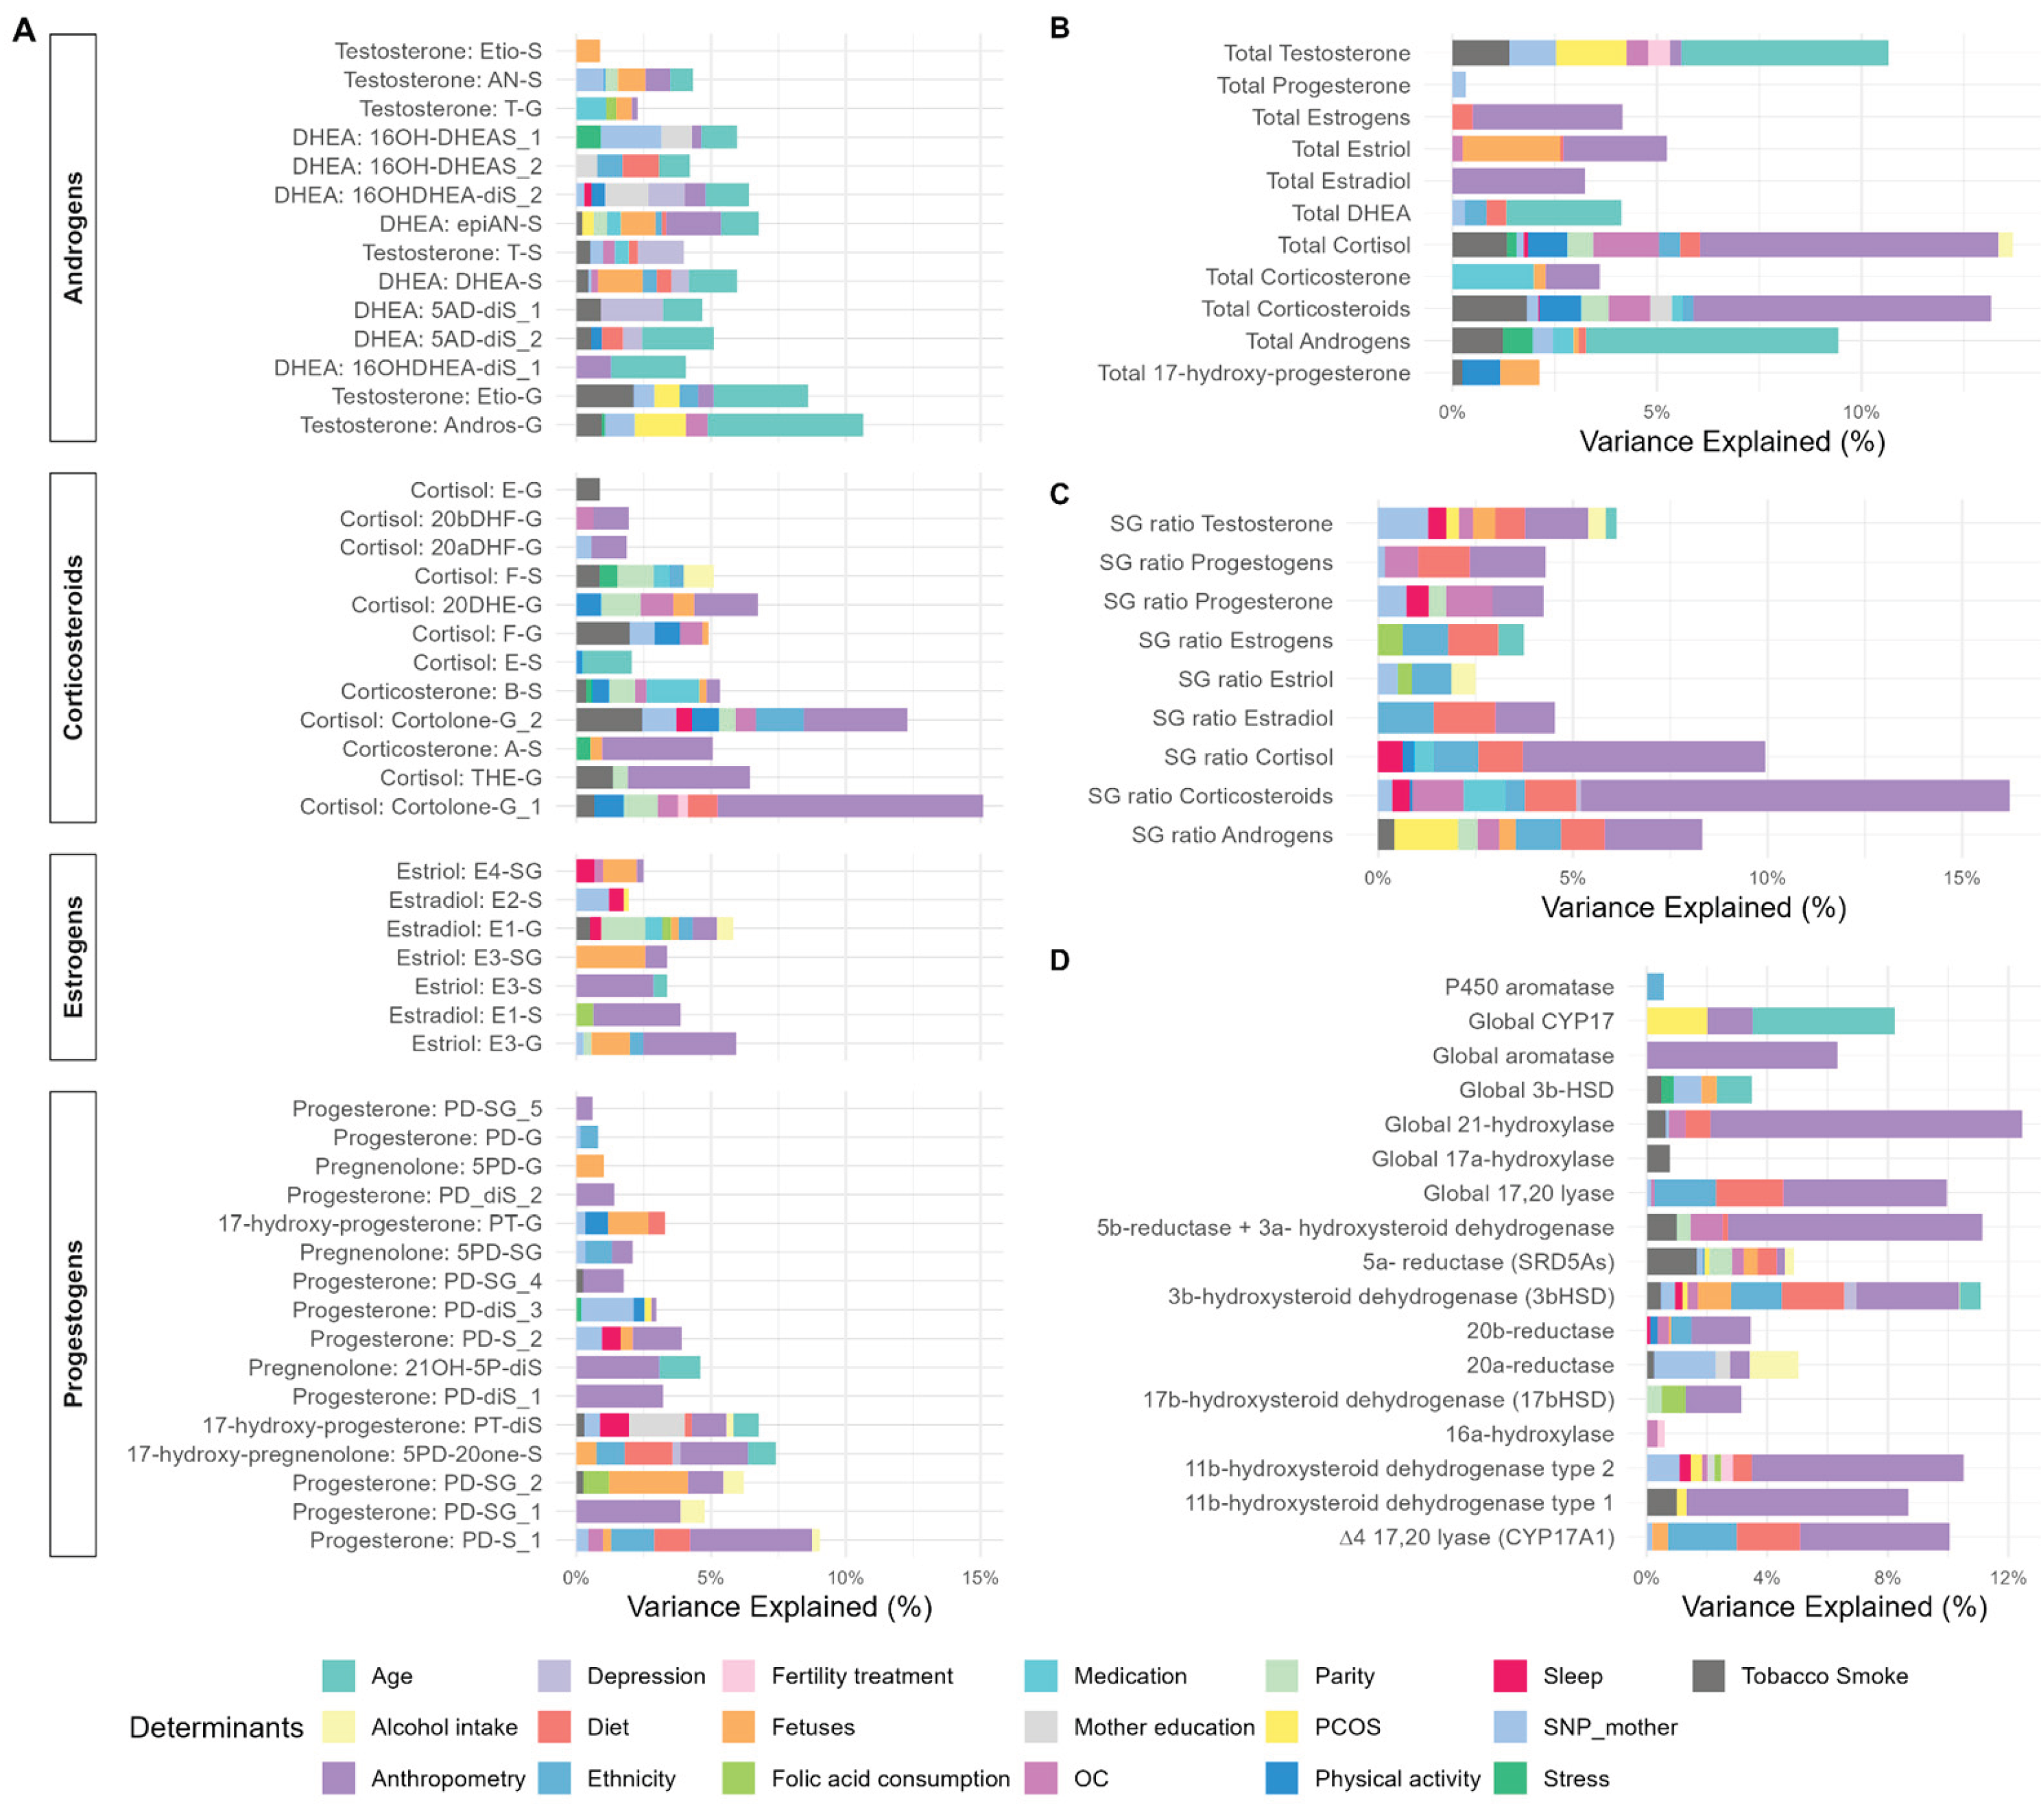

Table 1.
Determinants associated with steroid metabolism during pregnancy described in the literature.
Table 1.
Determinants associated with steroid metabolism during pregnancy described in the literature.
| Domain | Variable | Gestational Weeks | Hormonal Class Affected | Main Findings | Reference |
|---|---|---|---|---|---|
| Clinical parameters | Gestational age | 5–40 (incl. 12, 22, 32) | Progestogens, Estrogens, Corticosteroids | Hormone levels increased across pregnancy; DHEAS decreased. Later gestational age is linked to higher estradiol and testosterone. | Soldin et al. (2005); Thompson et al. (2013); Liang et al. (2020); Chen et al. (2022) |
| Preeclampsia | 8–38, 15 | Androgens, Estrogens | Preeclampsia is associated with lower estrogens, higher testosterone, and altered estrogen metabolism. | Lan et al. (2020); Cantonwine et al. (2019) | |
| Pre-pregnancy BMI | 12, 35–39 | Androgens, Estrogens | Higher BMI correlated with lower estrogens and higher androgens. | Kallak et al. (2017); Barrett et al. (2019) | |
| Weight gain during pregnancy | 12, 25, 26–31, 33, 35–39 | Progestogens, Estrogens, Androgens | Positive associations with progesterone, estrogens, and testosterone levels. | Lof et al. (2009); Petridou et al. (1992); Kallak et al. (2017) | |
| In vitro fertilization | 3 | Progestogens, Androgens | Higher levels of multiple progestogens and androgens after embryo transfer. | Biró et al. (2012) | |
| Parity | 12, 25, 33, 35–39 | Estrogens, Androgens | Nulliparous women had higher estradiol; primiparous women had higher testosterone. | Lof et al. (2009); Kallak et al. (2017) | |
| PCOS | 34, 39 | Androgens, Estrogens, Progestogens | PCOS is associated with elevated testosterone, androstenedione, and progesterone levels. | Maliqueo et al. (2013); Piltonen et al. (2019); Liu et al. (2018) | |
| Fetuses | Sex of the fetus | Birth | Androgens | Higher cord serum testosterone in males; different androgen profiles in hair and cord blood by fetal sex. | Koskivouri et al. (2023) |
| Genetic | Maternal SNPs | 12, 35–39 | Androgens, Estrogens | rs700518 and UGT2B17 are associated with altered testosterone and estrogen ratios. | Kallak et al. (2017); Mullen et al. (2018); Farhan et al. (2020) |
| Lifestyle | Smoking | 37–42 | Progestogens, Estrogens | Lower progesterone and estradiol concentrations in cord blood of active smokers. | Piasek et al. (2023) |
| Vitamin A | 26–31 | Estrogens | Negative association between vitamin A levels and estradiol/total estrogens. | Petridou et al. (1992) | |
| Vitamin D | - | Androgens | Lower 25(OH)D levels associated with reduced testosterone, androstenedione, and DHEAS. | Chu et al. (2021) | |
| Fat intake | 12, 25, 33 | Estrogens | No association between dietary fat intake (n-3/n-6 PUFA) and plasma estradiol levels. | Lof et al. (2009) | |
| Physical activity | - | Progestogens, Estrogens | Estriol levels increased acutely after exercise; progesterone and estradiol slightly declined post-exercise. | Rauramo et al. (1982) | |
| Sleep | 22–24 | Corticosteroids | Poor sleep quality associated with lower cortisol. | Crowley et al. (2016) | |
| Alcohol | 4–40, 12 | Progestogens, Estrogens | Lower estradiol, estriol, and progesterone levels observed in fetal alcohol syndrome cases | Halmesmäki et al. (1987) | |
| Mental health | Depression | 35–39 | Androgens | Positive correlation between depression scores and testosterone levels. | Kallak et al. (2017) |
| Stress | <14, 22–24 | Androgens, Progestogens, Corticosteroids | Stress (neighborhood disorder) linked to higher testosterone in male fetus carriers; cortisol and progesterone associated with emotional resilience. | Hansel et al. (2023); Crowley et al. (2016) | |
| Sociodemographic | Maternal age before pregnancy | 12, 35–39 | Androgens, Estrogens | Older mothers had lower testosterone and estrogen levels. | Kallak et al. (2017); Barrett et al. (2019) |
| Ethnicity | 12 | Androgens | Higher androgen levels (18–30%) among Black women. | Barrett et al. (2019) |
Table 2.
Baseline characteristics of participants.
| BiSC (n=721) |
INMA Sabadell (n=500) | |
|---|---|---|
| Maternal age (year) | 34.4 (4.4); 34.8 [18.4, 45.7] 1 |
31.2 (4.3); 31.2 [17.7, 42.5]1 |
| Missing | 0 | 1 |
| Gestational age at sampling collection | 34.7 (1.5); 34.7 [28.9, 39.0]1 |
34.3 (1.6); 34.14 [28.3, 40.6]1 |
| BMI * (kg/m2) | 24.1 (4.4); 23.2 [15.9, 51.8] 1 |
23.9 (4.6); 22.7 [17.0, 53.8] 1 |
| Underweight (<18.5 kg/m2), n (%) | 22 (4) | 25 (5) |
| Normal weight (18.5 – 25 kg/m2) n (%) | 434 (64) | 331 (66) |
| Overweight (25 – 30 kg/m2), n (%) | 155 (23) | 102 (20) |
| Obese (>30 kg/m2), n (%) | 63 (9) | 42 (8) |
| Missing | 47 | 0 |
| Mother country of birth, n (%) | ||
| Spain | 498 (69) | 446 (89) |
| Latin America | 165 (23) | 36 (7) |
| Others | 57 (8) | 18 (4) |
| Missing | 1 | 0 |
| Maternal education, n (%) | ||
| Primary or without education | 27 (4) | 4 (1) |
| Secondary | 175 (24) | 132 (27) |
| Technical or University | 519 (72) | 362 (73) |
| Missing | 1 | 2 |
| Parity, n (%) | ||
| Nulliparous | 443 (61) | 282 (57) |
| Primiparous | 229 (32) | 185 (37) |
| Multiparous | 49 (7) | 31 (6) |
| Missing | 0 | 2 |
| Alcohol during pregnancy (daily intake), n (%) | ||
| 0.4-1g/day | 18 (3) | 33 (7) |
| 1g/day or more | 13 (2) | 36 (7) |
| None | 593 (95) | 429 (86) |
| Missing | 97 | 2 |
| Smoking at the beginning of pregnancy, n (%) | ||
| between 1 and 10 cig/day | 10 (2) | 48 (10) |
| more than 10 cig/day | 15 (2) | 19 (4) |
| No smoking | 684 (96) | 427 (86) |
| Missing | 12 | 6 |
| Season, n (%) | ||
| Autumn | 179 (25) | 139 (28) |
| Spring | 175 (24) | 139 (28) |
| Summer | 214 (30) | 107 (22) |
| Winter | 153 (21) | 111 (22) |
| Missing | - | 4 |
| Covid confinement, n (%) | - | |
| Yes | 194 (27) | - |
1Mean (SD); Median (Min, Max); n (%). Maternal body mass index (BMI) in INMA was related to pre-pregnancy BMI and in BiSC was BMI at 1st trimester. Alcohol during pregnancy in INMA was at 1st Trimester and in BiSC at 2nd Trimester.
Disclaimer/Publisher’s Note: The statements, opinions and data contained in all publications are solely those of the individual author(s) and contributor(s) and not of MDPI and/or the editor(s). MDPI and/or the editor(s) disclaim responsibility for any injury to people or property resulting from any ideas, methods, instructions or products referred to in the content. |
© 2025 by the authors. Licensee MDPI, Basel, Switzerland. This article is an open access article distributed under the terms and conditions of the Creative Commons Attribution (CC BY) license (http://creativecommons.org/licenses/by/4.0/).
Copyright: This open access article is published under a Creative Commons CC BY 4.0 license, which permit the free download, distribution, and reuse, provided that the author and preprint are cited in any reuse.


