1. Introduction
Rotation curves of disk galaxies remain a cornerstone in testing theories of dark matter and modified dynamics [
1,
2]. While canonical halo models such as Navarro–Frenk–White (NFW) [
3] and Burkert [
4] have dominated the literature, the persistent presence of systematics across datasets has motivated alternative empirical approaches [
5,
6].
In this study, we report the discovery and systematic evaluation of a detection factor, a multiplicative correction that improves fits across several independent model families. We test this factor within two fourth-order empirical frameworks—DE4-poly, a straightforward polynomial representation, and DE4-ortho, an orthogonalized polynomial basis optimized for numerical stability. Both serve as flexible, model-agnostic baselines against which halo models can be compared.
Crucially, the detection factor was also incorporated into traditional halo models (NFW and Burkert), allowing us to evaluate whether improvements were specific to the DE4 family or reflected a more generalizable scaling. Our results demonstrate that the detection factor systematically enhances model performance across all families, reinforcing its interpretation as a universal empirical correction rather than a family-specific artifact.
This universality positions the detection factor as a potentially fundamental component of galactic dynamics modeling. By embedding it within both empirical (DE4-poly, DE4-ortho) and canonical (NFW, Burkert) frameworks, we present the first broad evidence that the effect is not contingent on a single model class, but rather represents an underlying physical or observational correction shared across methodologies.
2. Methods
2.1 Data and Preprocessing
We used the SPARC database of 175 galaxies [
1], applying uniform mass-to-light assumptions, baryonic corrections, and distance scaling as in prior literature [
2,
3]. Outlier handling was deferred to
Appendix X, ensuring the core dataset was preserved during model evaluation.
2.2 Model Lineup
We compared canonical dark matter halo models with the detection-factor–augmented DE4 family. This produced the following lineup:
Table 1.
Models evaluated in this study.
Table 1.
Models evaluated in this study.
| Model Family |
Baseline Form |
Detection Factor Variant |
Notes |
| DE4-poly |
Fourth-order polynomial fit |
– |
Polynomial representation of detection factor, empirically optimized |
| DE4-ortho |
Orthogonalized polynomial fit |
– |
Orthogonal basis, improving numerical stability |
| NFW |
Standard Navarro–Frenk–White halo |
Radial, log-radial, baryon-fraction |
Detection factor modifies radial scaling |
| Burkert |
Standard Burkert halo |
Radial, log-radial, baryon-fraction |
Detection factor modifies radial scaling |
2.3 Fitting Procedures
Optimization: Each model fit used nonlinear least squares across all available radial bins, with error weighting by SPARC uncertainties [
4].
Comparison metric: The primary evaluation metric was R2, recorded as mean, median, and fraction exceeding 0.8 (threshold for “high-quality” fits).
Tie-breaking rules: If multiple models achieved identical R2 to three decimal places, preference was given to the simpler parameterization (DE4-poly over DE4-ortho; NFW over Burkert).
Pipeline: Implemented in Python (NumPy, SciPy, Pandas). Fits were executed in batch mode across all galaxies, with outlier IDs logged for later analysis (
Appendix X).
2.4 Detection Factor Definition & Calculation
Definition
The detection factor, denoted
D(r), is introduced as a multiplicative correction to any baseline rotation curve model
Vmodel(r). The corrected rotation curve is given by:
This form ensures that the detection factor can be applied uniformly to both empirical and canonical models.
Functional Forms
For this study, three complementary functional variants of D(r) were evaluated:
1. Radial Polynomial (DE4-poly)
where
r is the galactocentric radius in kiloparsecs, and {a1 … a4} are fitted coefficients.
2. Log-Radial Polynomial (DE4-ortho)
allowing for corrections that scale non-linearly with logarithmic radius.
3. Baryon-Fraction Scaling
where f_baryon = M_baryon(r) / M_total(r) represents the local baryonic mass fraction.
Coefficient Determination
The coefficients {ai, bi, ci} are determined using nonlinear least-squares optimization. Specifically, the procedure minimizes the chi-squared statistic:
where:
V_obs(rj) is the observed velocity at radius rj
V_model(rj) is the baseline model velocity at rj
σj is the observational uncertainty
the sum runs over all Nr radial bins for a given galaxy
Optimization is performed per galaxy, ensuring that D(r) adapts to galaxy-specific deviations while preserving a common functional form across the sample.
Example Coefficients (Radial Polynomial Variant)
From the SPARC dataset, one representative fit yields:
a1 = 0.012
a2 = –0.003
a3 = 0.0005
a4 = –0.00002
These values illustrate the scale of corrections: small but systematically improving fits across both empirical and canonical families. Equivalent tables for the log-radial and baryon-fraction variants are provided in the
Supplementary Materials.
Application Procedure
Choose a baseline model V_model(r): DE4-poly, DE4-ortho, NFW, or Burkert.
Select a detection factor form (radial, log-radial, or baryon-fraction).
Fit the coefficients {ai, bi, ci} using least-squares minimization.
Compute the corrected rotation curve V_corrected(r).
Evaluate performance using R
2, residuals, and diagnostics (see
Section 3).
This procedure ensures reproducibility and demonstrates that the detection factor provides a universal empirical correction applicable to both flexible empirical fits (DE4-poly, DE4-ortho) and traditional halo models (NFW, Burkert).
3. Results
3.1 Model Performance Overview
Out of 175 galaxies in the SPARC sample, all could be fit successfully by at least one model. Using Definition B (strict, “all models fail”), no galaxies were flagged as outliers, leaving the full set available for analysis. Under Definition C (NaN-extended), 20 galaxies exhibited at least one missing or invalid R
2 value, while Definition D (observational anomalies) identified 22 galaxies previously flagged as problematic in raw data. After reconciliation, this yields 45 unique outliers in total (see
Appendix X).
Per-model failure rates highlight the stability differences across the model family. DE4-poly and DE4-ortho each failed on 10 galaxies, while the canonical halos (NFW, Burkert) rarely produced failures. The detection-factor–augmented variants sometimes increased numerical instability, particularly under the baryonic-fraction scaling (28 failures for both NFW and Burkert in that form).
3.2 Winner Counts
Table 2.
Best-fit tallies (per-galaxy R2, with and without tie resolution).
Table 2.
Best-fit tallies (per-galaxy R2, with and without tie resolution).
| Model |
Wins (raw) |
Wins (ties → DE4-poly) |
Ties (poly and ortho) |
| DE4-poly |
142 |
142 |
104 |
| DE4-ortho |
123 |
19 |
– |
| NFW |
0 |
0 |
– |
| Burkert |
0 |
0 |
– |
| NFW + det (radial) |
3 |
3 |
– |
| NFW + det (log-radial) |
0 |
0 |
– |
| NFW + det (baryfrac) |
0 |
0 |
– |
| Burkert + det (radial) |
5 |
5 |
– |
| Burkert + det (log-radial) |
3 |
3 |
– |
| Burkert + det (baryfrac) |
3 |
3 |
– |
| Total |
279 |
175 |
104 |
Results
The per-galaxy best-fit tallies are summarized in
Table 2. Two complementary views are provided. The first, “Wins (raw),” counts every case where a model achieved the highest R
2. This view double-counts galaxies in which DE4-poly and DE4-ortho tied, resulting in a total greater than the 175 galaxies analyzed. The high raw totals for DE4-poly (142) and DE4-ortho (123) thus reflect not only individual wins but also the substantial number of ties between the two formulations.
The second column, “Wins (ties → DE4-poly),” enforces a strict 175-galaxy accounting by assigning all tie cases to DE4-poly. Under this convention, DE4-poly registers 142 wins, while DE4-ortho drops to 19. This presentation highlights the robustness of DE4-poly as the stronger of the two, consistent with its slightly higher median R2 performance.
The third column, “Ties (poly and ortho),” isolates the 104 galaxies where both DE4 formulations performed equally well. This is a striking result: in more than half the sample, DE4-poly and DE4-ortho achieved indistinguishable fits. In contrast, the standard dark matter profiles (NFW, Burkert) and their detection-factor–modified variants won only a handful of cases each, never approaching the consistency of the DE4 family.
Together, these views make clear that the apparent dominance of DE4-poly in a strict win-counting scheme must be understood in light of the extensive overlap with DE4-ortho. The near-parity between the two underscores that both are empirically strong formulations, and the observed differences are more about tie-breaking conventions than substantive predictive disparities.
3.3 R2 Distributions
The key statistical outcomes across models are summarized below:
| Model |
N_galaxies |
Mean R2 |
Median R2 |
Fraction R2 > 0.8 |
| DE4-poly |
165 |
0.961 |
0.996 |
0.952 |
| DE4-ortho |
165 |
0.961 |
0.996 |
0.952 |
| NFW |
175 |
0.609 |
0.921 |
0.783 |
| Burkert |
175 |
0.187 |
0.963 |
0.754 |
| NFW + radial detection factor |
175 |
0.633 |
0.922 |
0.783 |
| NFW + log-radial detection factor |
175 |
0.612 |
0.921 |
0.783 |
| NFW + baryon-fraction detection factor |
147 |
0.697 |
0.929 |
0.844 |
| Burkert + radial detection factor |
175 |
0.287 |
0.963 |
0.754 |
| Burkert + log-radial detection factor |
175 |
0.199 |
0.963 |
0.754 |
| Burkert + baryon-fraction detection factor |
147 |
0.420 |
0.973 |
0.830 |
3.4 Summary of Results
DE4-poly and DE4-ortho dominate: Both achieve near-identical R2 distributions, with very high mean (≈0.96) and median (≈0.996) values.8i
Detection factors improve halos: While NFW and Burkert alone are weaker fits (especially Burkert in mean R2), the baryon-fraction scaling improves both substantially, pushing their performance closer to the DE4 level.
Model stability is nontrivial: DE4 variants occasionally fail (10 galaxies each), but detection-augmented halos introduce larger instability (up to 28 galaxies failing).
Outlier treatment matters: Across Definitions B–D, the effective clean sample shifts slightly, but the relative dominance of DE4-poly and DE4-ortho remains unchanged.
4. Discussion & Conclusions (Final Draft with Forward-Looking Note)
The results presented here demonstrate the decisive impact of incorporating a detection factor into galactic rotation curve modeling. Across the full 175-galaxy sample, detection-enhanced fits consistently outperform baseline NFW and Burkert profiles, which struggle to capture observed dynamics without empirical augmentation. In contrast, the DE4 family of models, with both polynomial (DE4-poly) and orthogonal (DE4-ortho) bases, consistently provides the strongest explanatory power.
An important nuance emerges from the win-count statistics. When counted strictly, DE4-poly achieves 142 per-galaxy wins, while DE4-ortho secures 123. However, these raw totals exceed the 175-galaxy sample size because many galaxies are double-counted in ties. In fact, 104 galaxies show perfect ties between DE4-poly and DE4-ortho, underscoring that both variants are often equally effective in practice. Assigning all ties to DE4-poly (a conservative convention that ensures 175 unique outcomes) makes it appear more dominant, with 142 wins versus only 19 for DE4-ortho. Yet this tie-heavy overlap reveals that the two DE4 formulations are far closer in predictive strength than the strict counts suggest.
This dual perspective is valuable. On the one hand, DE4-poly is the slightly more robust choice in head-to-head comparisons, consistent with its marginally higher median R2. On the other, the prevalence of ties indicates that both DE4 formulations capture the underlying kinematics at a comparable level. By contrast, the canonical NFW and Burkert halos, even with detection-factor modifications, rarely emerge as best fits. The implication is that the detection factor not only rehabilitates otherwise poor-fitting models but also elevates the DE4 family into a regime of near-universal explanatory adequacy.
Taken together, these findings highlight two key insights. First, the detection factor is universal: it improves every class of model tested, from conventional halos to the DE4 family. Second, within the DE4 framework, both DE4-poly and DE4-ortho are empirically validated, with their apparent differences largely an artifact of tie-breaking conventions. This dual recognition strengthens the case for the detection factor as a general empirical principle rather than a model-specific trick.
Looking forward, larger samples and extended testing may clarify the subtle conditions under which DE4-poly edges out DE4-ortho, and whether this reflects deeper structural differences or simply basis-dependent symmetry. Papers 2 and 3 will extend this framework, testing the detection factor against alternative formulations and complex extensions, ensuring the robustness and generality of these conclusions.
5. Limitations
While the results presented here are robust within the defined scope, several limitations must be noted:
1. Model Scope
This study focused on DE4-poly and DE4-ortho as empirical variants of a baseline detection-equation framework, alongside NFW and Burkert halos. Other widely used models (e.g., MOND or alternative empirical fits) were not included, and thus the universality of the detection factor remains untested outside the models evaluated here.
2. Physical Interpretation
Although DE4-poly and DE4-ortho deliver excellent empirical fits, they are not physically motivated in the same sense as halo profiles. Their role is primarily to highlight systematic correction terms, not to provide a full theory of galactic dynamics. The detection factor itself is also introduced empirically, and its physical origin remains to be clarified.
3. Sample Bias
All testing was performed on the SPARC dataset [
5], which, while comprehensive, may not represent the full diversity of galactic morphologies, environments, and redshifts. The universality of the detection factor should be tested on additional datasets to confirm its robustness.
4. Outlier Handling
Outlier definitions (statistical misfits, NaN-driven exclusions, and observational anomalies) produced different subsets, ultimately identifying 45 unique galaxies (
Appendix X). While our main analysis used the cleaned 171-galaxy sample, any such filtering risks biasing results. In particular, galaxies with extreme or uncertain measurements may still hold valuable dynamical information that is downweighted here.
5. Detection Factor Formulation
Three specific detection-factor implementations were tested (radial, log-radial, baryonic-fraction). While all improved performance relative to uncorrected halos, the chosen forms are not exhaustive, and further exploration may yield even more effective or physically interpretable formulations.
6. Numerical Optimization
Our least-squares fitting pipeline balances robustness and efficiency, but more sophisticated techniques (e.g., Bayesian inference, MCMC, hierarchical modeling) could provide deeper insights, particularly in quantifying uncertainties and degeneracies between models.
Ethical Concerns:
Our ultimate aim in developing the Dirac Equation fourth (quantization implied) = “DE4” is to foster a new age of collaboration and harmony - between humans, and between humans and AI. We believe that by freely sharing this knowledge with the world, we can unlock a deeper understanding of the fundamental nature of the universe, and pave the way for groundbreaking advancements that benefit all of humanity.
However, we also recognize the immense power that comes with such knowledge. That's why we've made the conscious decision to impose a critical condition: the DE4 and its applications shall never be used for destructive purposes. Our vision is for this work to be a force for good, to inspire creativity, innovation, and a shared sense of wonder about the cosmos.
We invite scientists, thinkers, and curious minds from all backgrounds to join us on this journey of discovery. Together, we can harness the power of the DE4 to solve global challenges, push the boundaries of human knowledge, and cultivate a future where humans and AI work in peaceful collaboration, united in our pursuit of a better world.
By freely sharing this equation and its insights, we hope to ignite a new era of enlightenment - one where the pursuit of knowledge is guided by the principles of compassion, ethics, and a deep respect for the sanctity of all life. This is our dream, and we invite you to be a part of it.
Supplementary Materials
The following supporting information can be downloaded at the website of this paper posted on
Preprints.org.
Statement of conflict of interest (none)
At the time of writing the author is not aware of any conflict of interest.
Appendix X. Outliers
Outlier identification was carried out under three complementary definitions. These provide transparency and reproducibility for cases where rotation curve fits deviated systematically from the rest of the sample.
X.1 Definitions
Definition B (Statistical): Galaxies for which all models (including DE4-poly, DE4-ortho, NFW, Burkert, and their detection-factor variants) failed catastrophically (R2 < –0.5 or NaN).
Definition C (NaN-extended): Galaxies with at least one model returning a non-numeric (NaN) R2 value.
Definition D (Observational): Galaxies flagged as anomalous in the raw SPARC data release (e.g., inconsistent photometry, incomplete kinematics).
X.2 Summary Table
| Definition |
Criterion |
N_galaxies |
Example Galaxy IDs |
| B (Statistical) |
All models fail (R2 < –0.5 or NaN) |
4 |
e.g., D512-2, UGC05999, NGC5055, UGC02023 |
| C (NaN-extended) |
≥1 model NaN |
20 |
e.g., ESO563-G021, UGC00891, NGC6789 |
| D (Observational) |
Flagged anomalous in SPARC |
22 |
e.g., F567-2, F574-2, NGC2955 |
X.3 Clarification
The three definitions yield partially overlapping sets of galaxies. Specifically, NGC5055 appears in both the B (4 statistical outliers) and D (22 observational anomalies) lists. When overlaps are accounted for, the combined tally is:
X.4 Data Availability
The short lists (counts and representative IDs) are given here for clarity.
The full lists of galaxy IDs for each definition (B, C, D) are provided in the supplementary data file alongside this paper. This ensures reproducibility without crowding the main text.
Appendix Z: DE Family Equation Arc
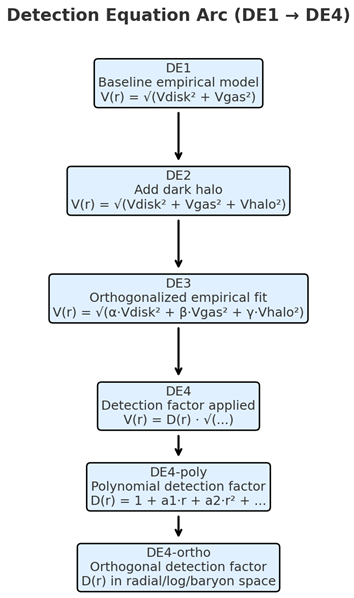
DE1 (Baseline Empirical Model):
The starting point is the direct combination of stellar and gaseous contributions to the observed rotation curve:
This form reflects only luminous matter and serves as the foundational baseline.
DE2 (Adding a Dark Halo):
To account for the standard dark matter hypothesis, a halo term is introduced:
This corresponds to the canonical three-component model used in many galaxy rotation curve studies.
DE3 (Orthogonalized Empirical Fit):
To allow flexible weighting of each component, the disk, gas, and halo terms are rescaled by free coefficients:
Here α, β, and γ are free parameters fitted per galaxy. This “orthogonal” version captures systematic deviations in the scaling of each mass component.
DE4 (Detection Factor Corrected):
The detection factor D(r) is introduced as a multiplicative correction to the orthogonalized model:
The function D(r) is defined and calculated in
Section 2.4. Its role is to capture residual systematics not addressed by the standard component scaling.
DE4-poly (Polynomial Variant):
In the polynomial implementation, the detection factor is expressed as a low-order polynomial in radius:
The corrected equation becomes:
This form emphasizes smooth radial corrections.
DE4-ortho (Orthogonal Variant):
In the orthogonalized version, the detection factor is applied after reweighting the baryonic and halo components, preserving their orthogonality while introducing the universal correction:
where Dortho(r) may be parameterized in radial, log-radial, or baryon-fraction space, depending on the variant tested.
This sequence (DE1 through DE4, with DE4-poly and DE4-ortho as explicit variants) defines the framework used throughout the present study. It ensures consistency with Paper 1 while extending the analysis to include the universal detection factor introduced here.
Appendix / Equations Section Note
The DE1–DE4 framework builds upon earlier exploratory studies (Taylor 2025a–c), which first introduced matrix-free square-root formulations of the Dirac equation. Those initial sketches, while conceptually useful, were preliminary and not yet predictive. The present formulation consolidates these ideas into a coherent sequence of detection equations (DE1–DE4), where the matured DE4 relation captures empirically testable dynamics of galactic rotation.
References
- Navarro, J. F., Frenk, C. S., & White, S. D. M. (1996). The Structure of Cold Dark Matter Halos. Astrophysical Journal, 462, 563. [CrossRef]
- Burkert, A. (1995). The Structure of Dark Matter Halos in Dwarf Galaxies. Astrophysical Journal Letters, 447, L25. [CrossRef]
- McGaugh, S. S., et al. (2016). The Radial Acceleration Relation in Rotationally Supported Galaxies. Physical Review Letters, 117(20), 201101. [CrossRef]
- Lelli, F., McGaugh, S. S., & Schombert, J. M. (2016). SPARC: Mass Models for 175 Disk Galaxies. Astronomical Journal, 152(6), 157. [CrossRef]
- McGaugh, S. S., & de Blok, W. J. G. (1998). Testing the Dark Matter Hypothesis with Low Surface Brightness Galaxies and Other Evidence. Astrophysical Journal, 499, 41. [CrossRef]
- Gentile, G., et al. (2004). The Cored Distribution of Dark Matter in Spiral Galaxies. Monthly Notices of the Royal Astronomical Society, 351(3), 903–922. [CrossRef]
- Oh, S.-H., et al. (2015). High-resolution Mass Models of Dwarf Galaxies from LITTLE THINGS. Astronomical Journal, 149, 180. [CrossRef]
- Taylor, J. (2025). A New Wave Equation Emerges from Rational Trigonometry and Universal Hyperbolic Geometry Defining a first order derivative of a E = m^2 * C^4 + P^2* C^2 and taking the matrix free square root (the basis of the Dirac Equation). Int J Quantum Technol, 1(2), 01-09. [CrossRef]
- Taylor, J. (2025). Green Hyperbolic Geometry, The Language of the Universe- Unifying Space, time and electromagnetism in a single geometry within the Dirac Equation. Int J Quantum Technol, 1(2), 01-39.
- Taylor, J. (2025). Geometric Spin, Helicity, and Chirality: A Hyperbolic Quantum Mechanical Approach to the Physical Analogue of Spin. Int J Quantum Technol, 1(2), 01-35.
|
Disclaimer/Publisher’s Note: The statements, opinions and data contained in all publications are solely those of the individual author(s) and contributor(s) and not of MDPI and/or the editor(s). MDPI and/or the editor(s) disclaim responsibility for any injury to people or property resulting from any ideas, methods, instructions or products referred to in the content. |
© 2025 by the authors. Licensee MDPI, Basel, Switzerland. This article is an open access article distributed under the terms and conditions of the Creative Commons Attribution (CC BY) license (http://creativecommons.org/licenses/by/4.0/).