Submitted:
23 September 2025
Posted:
24 September 2025
You are already at the latest version
Abstract
Background/Objectives:
This study investigates the immunomodulatory effects of a well-characterized CBD-rich cannabis extract, CAN296, on CD4⁺ helper and CD8⁺ cytotoxic T cells by examining T cell activation, cytokine secretion, and cytotoxic molecule expression, compared to the conventional treatments Dexamethasone (DEX) and Tacrolimus (TAC). It addresses key processes in forming premalignant immune-mediated lesions, such as those seen in oral lichen planus (OLP) and oral manifestations of graft-versus-host disease (oGVHD).
Methods:
CD4⁺ and CD8⁺ T cells were isolated from healthy donors and assessed in vitro for T cell activation via CD69 expression, secreted TNF-α and IFN-γ levels according to ELISA, and cytotoxic molecule expression (Granzyme B, Perforin, Fas-L) quantified by flow cytometry. Cells were treated with different doses of CAN296 (2, 4, 8 µg/mL), DEX (0.4, 4, 40 µg/mL), or TAC (0.1, 1, 10 ng/mL), and all parameters were compared to untreated controls.
Results:
CAN296 significantly inhibited T cell activation, reducing CD69 expression in CD4⁺ T cells to 2–11% and in CD8⁺ T cells to 5–17%. It also markedly suppressed TNF-α secretion in CD4⁺ T cells at all concentrations (p < 0.0001). In CD8⁺ T cells, CAN296 led to a near-complete reduction in TNF-α and IFN-γ, leaving both cytokines barely detectable at all tested doses (p < 0.0001). Effect cell inhibition was significantly more pronounced than that observed with DEX or TAC, displaying dose-dependent reductions. TAC inconsistently lowered TNF-α while paradoxically increasing IFN-γ at lower concentrations. Additionally, CAN296 consistently suppressed cytotoxic molecule expression, reducing Granzyme B by 81–82%, Perforin by 40–53%, and Fas-L by 40–44%. DEX showed variable effects on cytotoxic molecule expression. At the same time, TAC demonstrated inconsistent modulation of Perforin and Granzyme B. Overall, CAN296 outperformed DEX and TAC, demonstrating more potent and consistent immunomodulatory effects.
Conclusion:
CBD-rich cannabis extract, CAN296, exhibits potent immunomodulatory properties by effectively inhibiting T cell activation, lowering pro-inflammatory cytokines, and suppressing cytotoxic molecule expression. Its efficacy surpasses conventional therapies like DEX and TAC, offering a promising novel treatment modality for T cell-mediated disorders, including OLP and oGVHD. These findings support further development of CAN296 formulations to optimize dosing and delivery, followed by clinical trials to validate its therapeutic potential.
Keywords:
cannabidiol (CBD)
; cannabis
; immunomodulation
; oral lichen planus (OLP)
; graft-versus-host disease (GVHD)
1. Introduction
Oral lichen planus (OLP) is a chronic immune-mediated disorder affecting the oral mucosa, characterized by T cell-mediated destruction of basal keratinocytes[1]. While the etiology of OLP remains uncertain, an imbalance in cellular immunity is recognized as a key factor in disease onset and progression[2]. Clinically, OLP presents with reticular, atrophic, erosive, or ulcerative lesions that can cause significant morbidity[3]. While OLP is primarily an inflammatory condition, it is also classified as an oral potentially malignant disorder (OPMD) due to its association with an increased risk of malignant transformation ranging from 0.5% to 4% into oral squamous cell carcinoma (SCC)[4,5,6].
Similarly, graft-versus-host disease (GVHD) is a major complication of allogeneic hematopoietic stem cell transplantation (HSCT), where donor T cells mount an alloimmune response against host tissues. GVHD affects multiple organ systems and is associated with significant morbidity and mortality[7,8]. Oral manifestation of GVHD (oGVHD) is a considerable concern, presenting with lichenoid lesions that are clinically and histologically similar to OLP. Like OLP, oGVHD is associated with an increased risk of malignant transformation, further complicating disease management and prognosis[9,10].
In OLP and oGVHD, malignant transformation is driven by chronic inflammation, which promotes oxidative stress, DNA damage, and epithelial dysplasia[11]. Persistent immune activation increases the production of pro-inflammatory cytokines, including TNF-α and IFN-γ, leading to keratinocyte apoptosis and epithelial barrier disruption[12]. Additionally, the epithelium is directly attacked by Granzyme B and Perforin secreted by cytotoxic T lymphocytes[13], further exacerbating tissue destruction and contributing to disease progression. These processes foster a tumor-friendly microenvironment, increasing the likelihood of malignant progression[14,15].
The current standard of care for OLP and oGVHD consists of topical and systemic immunosuppressive agents, including corticosteroids such as dexamethasone (DEX)[16] and calcineurin inhibitors such as Tacrolimus (TAC)[17]. Corticosteroids exert their effects by binding to glucocorticoid receptors, suppressing pro-inflammatory cytokines such as TNF-α and IL-1β, inhibiting T cell proliferation, and inducing apoptosis in inflammatory cells[18,19]. Calcineurin inhibitors prevent T-cell activation by blocking the dephosphorylation of activated T-cells (NFAT) nuclear factor, thereby reducing IL-2 production and subsequent T-cell proliferation[20]. Given the chronic inflammatory nature and T-cell-driven pathology of OLP and oGVHD, the current treatments provide symptom relief rather than addressing the underlying mechanisms of immune dysregulation[21,22,23,24]. Moreover, their long-term use is associated with significant side effects, including mucosal atrophy, metabolic disturbances, increased infection risk, systemic toxicity, immunosuppression, and increased cancer risk [22,25]. Given these limitations, alternative treatments such as retinoids, PDT, and LLLT have been explored; however, their efficacy remains inconsistent, and side effects limit their clinical use[26,27,28]. In contrast, cannabis-derived compounds offer a more targeted immunomodulatory effect without the broad immunosuppressive consequences of conventional therapies[29,30]. In particular, CBD-rich cannabis extracts offer a more targeted immunomodulatory approach, selectively modulating T-cell activity and cytokine secretion while preserving immune homeostasis.
Although the immune-driven pathology of OLP and oGVHD is well-established, a major barrier to developing effective therapies is the lack of in vitro models that accurately replicate the immune-epithelial interface characteristic of these diseases. Existing systems, primarily based on oral keratinocyte monocultures, fail to capture the complex interactions between immune cells and epithelial tissue. As a result, many potential treatments cannot be adequately evaluated for disease-specific mechanisms. To address this gap, our study focuses directly on key lymphocyte-mediated processes, including CD4⁺ and CD8⁺ T cell activation, TNF-α and IFN-γ secretion, and the expression of cytotoxic mediators such as Perforin and Granzyme B. These core immune markers are relevant to both OLP and oGVHD. This approach provides a targeted and mechanistically relevant assessment of immunomodulation in the absence of reliable disease models.
CBD-rich cannabis extracts provide a targeted immunomodulatory approach[31,32], selectively altering T-cell activation, cytokine secretion, and cytotoxic pathways while maintaining overall immune homeostasis[33,34,35]. Cannabis extracts and cannabis-derived compounds, particularly cannabidiol (CBD), have demonstrated significant immunomodulatory[36,37,38] and anticancer properties[39,40], making them promising therapeutic candidates for immune-mediated oral diseases[41,42]. CBD exerts its effects through interactions with the endocannabinoid system (ECS)[43], primarily by modulating CB2 receptor signaling, transient receptor potential (TRP) channels, and peroxisome proliferator-activated receptors (PPARs) [44,45,46]. These pathways regulate immune cell function, cytokine secretion, and cellular survival, which are highly relevant in OLP and oGVHD pathophysiology[47,48,49,50]. Preclinical studies have shown that CBD suppresses T cell activation, reduces pro-inflammatory cytokines such as TNF-α and IFN-γ, and downregulates cytotoxic molecule expression, supporting its potential role in mitigating T cell-driven tissue damage[47,51,52]. Additionally, CBD has demonstrated selective cytotoxicity against cancerous cells while sparing normal tissues[39], further underscoring its therapeutic potential in immune-mediated oral diseases.
Given the shared immune dysregulation, chronic inflammation, and oncogenic risk in OLP and oGVHD, novel therapeutic strategies are required to address both disease progression and malignant transformation risk. Both OLP and oGVHD immunopathology are marked by chronic inflammation and T-cell dysregulation. Cannabis-derived compounds offer a promising therapeutic approach. CBD's immunomodulatory effects may mitigate T cell-mediated tissue damage by reducing cytokine secretion and suppressing cytotoxic molecule expression. Its interaction with the ECS and other immune-regulatory pathways[34,43] could help control inflammation and prevent malignant transformation. Additionally, cannabinoids' ability to induce apoptosis in dysregulated immune cells[31,33] suggests the potential to restore immune homeostasis without broadly suppressing immune function.
This study explored the immunomodulatory effects of CBD-rich cannabis extract compared to conventional therapies, focusing on key immune mechanisms such as T-cell activation, cytokine secretion, and cytotoxic molecule expression. By investigating CBD's ability to regulate immune responses without broadly suppressing immunity, this research aims to provide critical insights into its therapeutic potential in OLP and oGVHD and explore whether CBD-based therapies could represent a safer, more targeted alternative to current immunosuppressive treatments.
2. Materials and Methods
2.1. Immunosuppressive Agents Preparation
TAC and DEX were obtained from MedChemExpress (Monmouth Junction, NJ, USA) and prepared as stock solutions in dimethyl sulfoxide (DMSO; Sigma-Aldrich, St. Louis, MO, USA), then stored at −20°C. For working concentrations, agents were diluted in PBMC Medium. TAC was diluted to final concentrations of 0.1, 1, and 10 ng/mL. These concentrations were chosen to represent a wide therapeutic window, encompassing sub-therapeutic, therapeutic, and supra-therapeutic levels, as the IC₅₀ for NFAT dephosphorylation and T cell inhibition is approximately 1–3 ng/mL[20]. DEX was diluted to final concentrations of 0.4, 4, and 40 µg/mL. These doses correspond to the range used in previous studies for evaluating dexamethasone's impact on T cell activation and cytokine suppression, spanning concentrations below, near, and above the reported IC₅₀ of approximately 4 µg/mL for inhibiting T cell proliferation and cytokine secretion [53].
2.2. Phytocannabinoid Extraction and Sample Preparation
Air-dried Type III high-CBD cannabis inflorescences were obtained from an Israeli medical cannabis distributor. The inflorescences were extracted with ethanol and heat-decarboxylated at 130°C (CAN296)[54]. CBD and CBC were kindly provided by Prof. Rafael Mechoulam (Institute for Drug Research, Medical Faculty, Hebrew University, Jerusalem, Israel) and mixed in a 2:1 weight ratio. The compounds were dissolved in DMSO (Sigma-Aldrich, St. Louis, MO, USA) and stored at -20°C. For phytocannabinoid profiling, extracts were analyzed using a Thermo Scientific ultra-high-performance liquid chromatography (UHPLC) system coupled with a Q Exactive™ Focus Hybrid Quadrupole-Orbitrap mass spectrometer (Thermo Scientific, Bremen, Germany), as previously described[39]. Phytocannabinoid identification and absolute quantification were performed using analytical phytocannabinoid standards (Thermo Scientific, Bremen, Germany) and external calibrations, as previously described [55]. For working concentrations, extracts were diluted in PBMC Medium to achieve final concentrations of 2, 4, and 8 µg/mL. The final DMSO concentration in cell culture experiments did not exceed 0.1% to avoid cytotoxicity.
2.3. PBMC Isolation and CD4⁺/CD8⁺ Enrichment
Peripheral blood mononuclear cells (PBMCs) were isolated from venous blood collected from healthy donors at Sheba Tel Hashomer University Hospital using 6 mL EDTA anticoagulant tubes (BD Vacutainer®, BD Biosciences, Franklin Lakes, NJ, USA). Blood samples were diluted 1:1 with sterile phosphate-buffered saline (PBS; Gibco, Thermo Fisher Scientific, Waltham, MA, USA) and separated at room temperature by density gradient centrifugation using Ficoll-Paque PLUS (Cytiva, Marlborough, MA, USA; formerly GE Healthcare Life Sciences). The buffy coat layer containing PBMCs was carefully collected and washed twice with PBS.
For lymphocyte enrichment, PBMCs were incubated with either RosetteSep™ Human CD4⁺ or CD8⁺ T Cell Enrichment Cocktail (StemCell Technologies, Vancouver, BC, Canada) following the manufacturer's instructions. Enriched CD4⁺ and CD8⁺ T cells were resuspended in PBMC Medium at 1 × 10⁶ cells/mL.
PBMCs were maintained in RPMI-1640 medium (Gibco, Thermo Fisher Scientific, Waltham, MA, USA) supplemented with 10% fetal bovine serum (FBS; heat-inactivated, Gibco, Thermo Fisher Scientific, Waltham, MA, USA), 1% penicillin-streptomycin (100 U/mL penicillin, 100 µg/mL streptomycin; Gibco, Thermo Fisher Scientific, Waltham, MA, USA), and 2 mM L-glutamine (Gibco, Thermo Fisher Scientific, Waltham, MA, USA).
2.4. T Cell Activation
CD4⁺ and CD8⁺ T cells were activated using anti-CD3 and anti-CD28 antibodies (BioLegend, San Diego, CA, USA), coated onto flat-bottom 96-well plates at final concentrations of 5 µg/mL and 2 µg/mL, respectively. Plates were incubated at 4°C for 1 hour to allow antibody adhesion, then washed before adding isolated T cells resuspended in PBMC Medium at 1 × 10⁵ cells per well. Cells were incubated at 37°C with 5% CO₂ for 24-48 hours in a humidified incubator. Following incubation, supernatants were collected for cytokine analysis by ELISA, and cells were harvested for flow cytometry analysis of activation markers.
2.5. CD69, Granzyme B, Perforin, and Fas-L Staining
The CD69 activation marker was assessed on CD4⁺ and CD8⁺ T cells following 24-hour activation, while Granzyme B, Perforin, and Fas-L were evaluated in CD8⁺ T cells after 48 hours. For surface staining, cells were incubated with APC-conjugated anti-human CD69 or APC-conjugated anti-human Fas-L antibodies (BioLegend, San Diego, CA, USA) or respective isotype controls for 30 minutes at 4°C in the dark. For intracellular staining, cells were fixed with 4% paraformaldehyde (PFA) at room temperature for 15 minutes, washed with PBS, and permeabilized using BD Perm/Wash™ Buffer (BD Biosciences, Franklin Lakes, NJ, USA) following the manufacturer's instructions. Permeabilized cells were incubated with FITC-conjugated anti-human/mouse Granzyme B and Brilliant Violet 421™-conjugated anti-human Perforin antibodies (BioLegend, San Diego, CA, USA) for 30 minutes at 4°C in the dark. FITC- and BV421-conjugated isotype controls were included. Stained cells were washed with PBS containing 2% FBS, resuspended in PBS, and analyzed by flow cytometry.
2.6. Flow Cytometry Analysis
Stained cells were analyzed using a BD LSRFortessa™ flow cytometer (BD Biosciences, Franklin Lakes, NJ, USA). Data acquisition included 10,000 events per sample, with compensation performed using single stained controls for each fluorochrome. Fluorescence-minus-one (FMO) and isotype controls were included to establish gating thresholds and assess non-specific binding. Data processing was performed using FlowJo software (version 10.8.1; Tree Star, Inc., Ashland, OR, USA). Lymphocytes were gated based on the properties of forward scatter (FSC) and side scatter (SSC). Geometric mean fluorescence intensity (MFI), median fluorescence intensity, and the percentage of positive cells were calculated for each marker. Results were expressed as the percentage of positive cells within the CD8⁺ T cell population and MFI values where applicable.
2.7. TNF-α and IFN-γ Secretion Analysis by ELISA
TNF-α and IFN-γ levels were quantified using BioSource ELISA Kits (Thermo Fisher Scientific, Waltham, MA, USA). Supernatants were collected from CD4⁺ or CD8⁺ T cells after 24-hour treatment. Standards were serially diluted to generate calibration curves, and blanks containing assay diluent were included in the 96-well plate. Plates were incubated with 50 µL of biotin-conjugated detection antibody at room temperature (2 hours for TNF-α; 1.5 hours for IFN-γ), washed, and then incubated with 100 µL of streptavidin-HRP conjugate for 30-45 minutes in the dark. The substrate reaction was initiated by adding 100 µL of TMB for 30 minutes, followed by 100 µL of stop solution. Absorbance was measured at 450 nm using a microplate reader (BioTek, Agilent Technologies, Santa Clara, CA, USA). Cytokine concentrations were determined by interpolating absorbance values against the standard curve, which was confirmed linear. All samples were run in duplicate to ensure reproducibility.
2.8. Statistical Analysis
Statistical analyses were performed using GraphPad Prism (version 9.3.1; GraphPad Software, LLC, Boston, MA, USA). Results were expressed as the mean ± SEM from at least three independent experiments. In some analyses, data were normalized and presented as a percentage of the control. Comparisons between multiple groups were conducted using one-way or two-way ANOVA, followed by Bonferroni's, Šidák's, or Dunnett's multiple comparisons tests, as indicated. Statistical significance was set at p ≤ 0.05 for all analyses.
2.9. Study Approval
The research protocols, including donor recruitment, sample collection, and data handling, were reviewed and approved by the Institutional Ethics Committee of the Technion–Israel Institute of Technology (Haifa, Israel). Magen David Adom (MDA; Israeli National Blood Bank, Tel Aviv, Israel) randomly collected and provided human peripheral blood samples with written informed consent obtained from all donors. Donor identities remained anonymous throughout the study.
3. Results
3.1. CAN296 and CBD:CBC (2:1) Combination Significantly Inhibited TNF-α and IFN-γ Secretion by CD8⁺ T Cells
Our previous study demonstrated the anti-proliferative and pro-apoptotic effects of the CAN296 extract and the CBD:CBC combination on head and neck squamous cell carcinoma cells[39]. In the current work, we aim to explore the immunomodulatory potential of CAN296 extract and the CBD:CBC combination on these cancerous cells. We first evaluated their ability to modulate the secretion of the pro-inflammatory cytokines TNF-α and IFN-γ by CD8⁺ T cells, as these play key roles in T cell-mediated immune responses. CD8⁺ T cells were treated with CAN296 or CBD:CBC at 4 µg/mL and 8 µg/mL, and cytokine secretion was quantified.
Baseline secretion levels in the control group averaged 1434.5 pg/mL for TNF-α and 897.2 pg/mL for IFN-γ. For TNF-α secretion (Figure 1A), treatment with CAN296 led to a dose-dependent reduction, with a 51% and 80% decrease at 4 µg/mL and 8 µg/mL, respectively, relative to the control. Similarly, the CBD:CBC combination reduced TNF-α secretion by 27% at 4 µg/mL and 76% at 8 µg/mL. For IFN-γ secretion (Figure 1B), CAN296 reduced secretion by 58% at 4 µg/mL and 97% at 8 µg/mL, while the CBD:CBC combination led to reductions of 21% at 4 µg/mL and 91% at 8 µg/mL.
Given that both CAN296 and the CBD:CBC combination effectively suppressed cytokine secretion, we chose to focus on CAN296 for the remainder of the study due to its consistent effects and its status as a whole extract already approved for medical use, whereas the CBD:CBC formulation would require additional testing and regulatory approval before clinical application. This decision aligned with our prior work, demonstrating CAN296's efficacy in head and neck squamous cell carcinoma models. Thus, subsequent experiments compared CAN296 to conventional immunosuppressants (DEX and TAC).
3.2. CAN296 Suppresses CD69 Expression on CD4⁺ and CD8⁺ T Cells, Outperforms Dexamethasone and Tacrolimus
To evaluate the effects of CAN296 on T cell activation in both CD4⁺ helper and CD8⁺ cytotoxic subsets, we compared its efficacy to DEX and TAC, using concentrations reported in previous studies[20,53]. The following concentrations were used: CAN296 at 2, 4, and 8 µg/mL, DEX at 0.4, 4, and 40 µg/mL, and TAC at 0.1, 1, and 10 ng/mL. CD4⁺ and CD8⁺ T cell activation was assessed by measuring CD69 expression 24 hours post-treatment.
Flow cytometry analysis (Figure 2A–C), normalized to 100% in untreated controls, revealed that CAN296 significantly reduced CD69 expression in CD8⁺ T cells in a dose-dependent manner (p < 0.01). At low, medium, and high doses, CAN296-treated cells showed 17%, 5%, and 5% CD69+ cells, respectively, whereas TAC yielded 124%, 84%, and 52%, and DEX resulted in 71%, 74%, and 55%. A similar pattern was observed in CD4⁺ T cells (Figure 2D–F). With untreated cells set to 100%, CAN296 lowered CD69 expression to 11%, 2%, and 2% at its low, medium, and high doses, while TAC led to 99%, 49%, and 42%, and DEX produced 140%, 139%, and 50%. Two-way ANOVA (Figure 2G) confirmed a significant effect of treatment type (p < 0.0001), with no notable difference between CD4⁺ and CD8⁺ T cells (p = 0.5205) and no interaction effects (p = 0.0937). These findings demonstrate that CAN296 effectively reduces T cell activation in both subsets, whereas DEX and TAC exhibit more variable outcomes.
3.3. CAN296 Inhibits TNF-α and IFN-γ Secretion by CD4⁺ and CD8⁺ T Cells, Outperforming Dexamethasone and Tacrolimus
To assess the effects of CAN296, TAC, and DEX on pro-inflammatory cytokine secretion, TNF-α and IFN-γ levels in the supernatants of treated CD4⁺ and CD8⁺ T cells were measured by ELISA after 24 hours of treatment.
In CD4⁺ T cells, CAN296 significantly reduced TNF-α secretion at all concentrations (p < 0.0001). TAC and DEX significantly reduced TNF-α secretion at medium and high concentrations (p < 0.0001). In contrast, at the low concentration, both showed a paradoxical slight increase in cytokine secretion compared to control (Figure 3A). Similar trends were observed for IFN-γ in CD4⁺ T cells across all treatments and doses; however, these changes did not reach statistical significance (Figure 3B). Two-way ANOVA confirmed that treatment type and dose significantly influenced TNF-α secretion (p < 0.0001), whereas IFN-γ levels remained unaffected.
In CD8⁺ T cells, CAN296 was highly effective, resulting in significant reductions in TNF-α and IFN-γ secretion at all concentrations (p < 0.0001) (Figure 3C, D). DEX also significantly reduced TNF-α at low and medium-high concentrations (p = 0.001, p < 0.0001), while IFN-γ was decreased only at the high concentration (p < 0.0001). TAC significantly reduced TNF-α at medium and high concentrations (p < 0.0001) and IFN-γ at medium and high concentrations (p = 0.01, p < 0.001) (Figure 3C, D). When comparing the percentage decrease across different concentrations within each treatment group, CAN296's efficacy remained consistently high, whereas DEX and TAC showed more pronounced concentration-dependent effects. For TNF-α, TAC exhibited significant differences between low vs. medium/high (p < 0.0001) and between medium vs. high (p = 0.0007). At the same time, DEX showed substantial differences between low vs. medium (p = 0.0130) and between low/medium vs. high (p < 0.0001) (Figure 3E). For IFN-γ, TAC displayed significant differences between low vs. medium/high (p < 0.0001), and DEX showed significant changes between low vs. medium (p = 0.0002) and low/medium vs. high (p < 0.0001) (Figure 3F). Two-way ANOVA revealed significant effects of interaction (p < 0.0001), row factor (p < 0.0001), and column factor (p < 0.0001) for both cytokines in CD8⁺ T cells, indicating that treatment type and concentration collectively influenced TNF-α and IFN-γ secretion.
3.4. CAN296 Reduces Fas-L Expression in CD8⁺ T Cells, Outperforming Dexamethasone and Tacrolimus
To evaluate the effects of CAN296 on Fas-L mediated T cell cytotoxicity and compare it to DEX and TAC, Fas-L expression in activated CD8⁺ T cells was examined after 24 hours of treatment.
Flow cytometry analysis (Figure 4A–C) showed that Fas-L expression levels decreased in response to CAN296 and DEX across all concentrations, whereas TAC treatment elevated Fas-L levels at higher doses. Two-way ANOVA confirmed that treatment type and concentration significantly influenced Fas-L expression (***p < 0.0001).
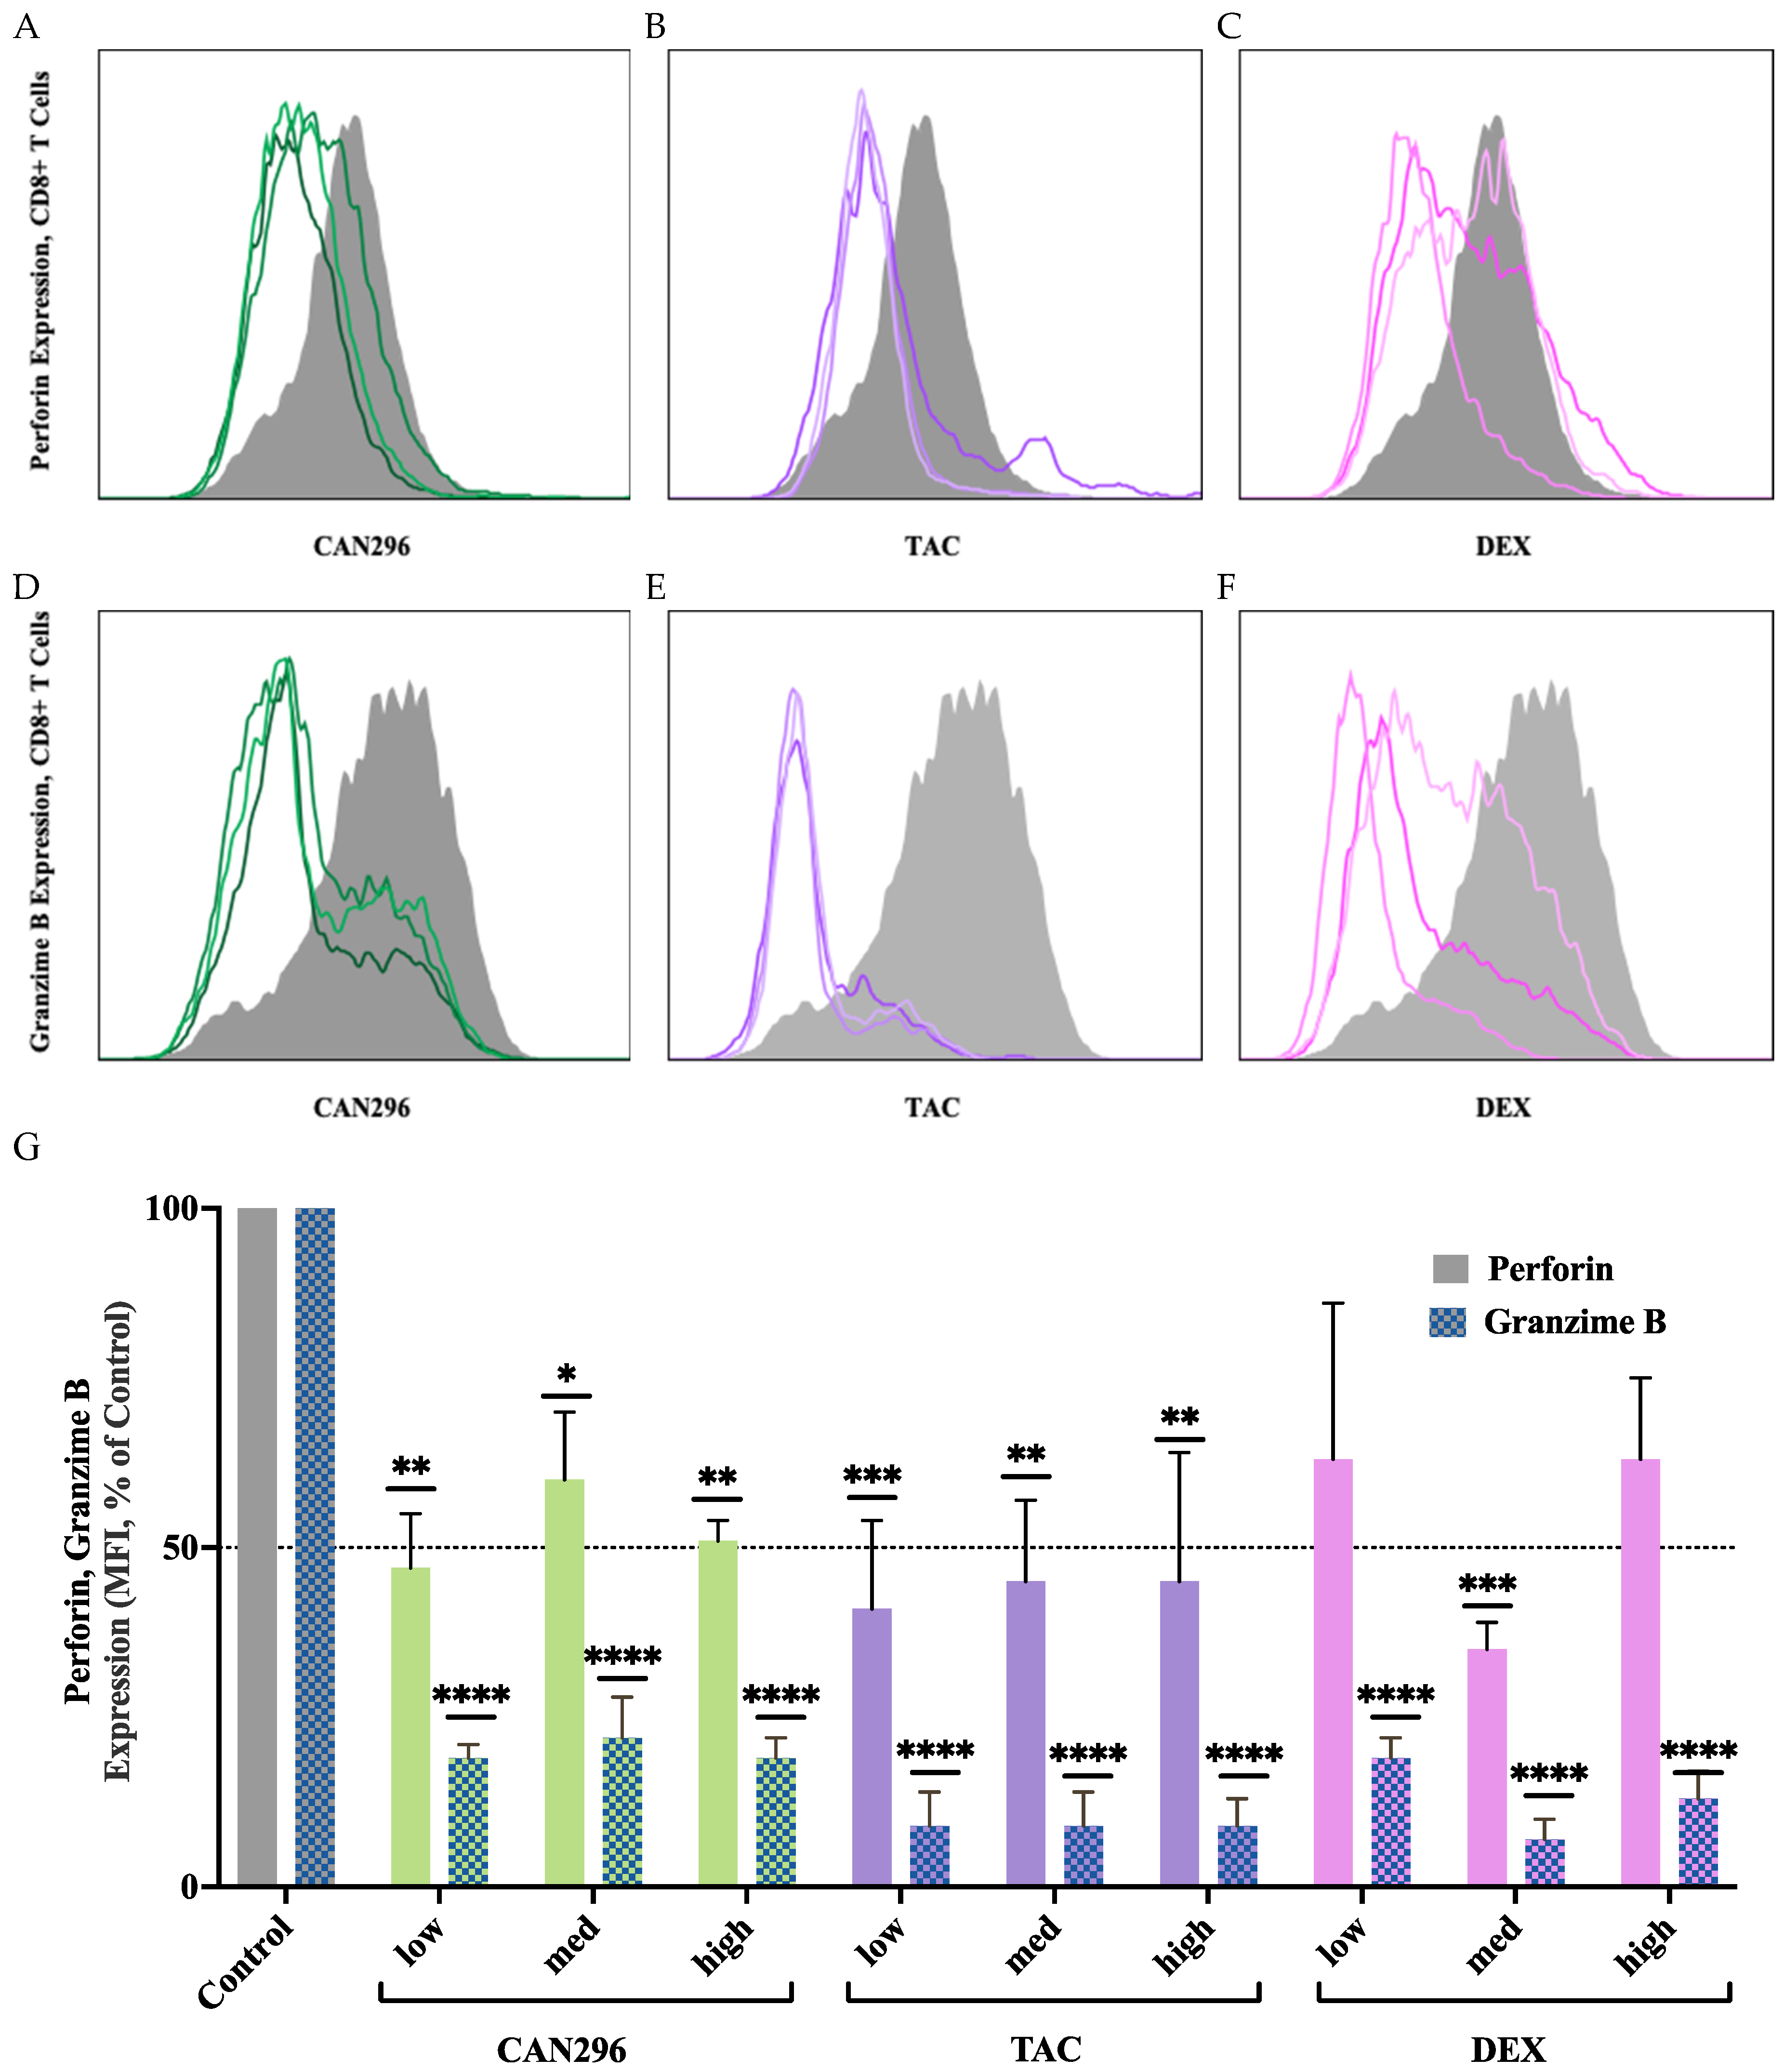
3.5. CAN296 Inhibits Granzyme B and Perforin Expression in CD8⁺ T Cells, Comparable to Dexamethasone and Tacrolimus
To evaluate the effects of CAN296 on CD8⁺ T cell cytotoxicity, we measured the expression of Granzyme B and Perforin, two key mediators of T cell-induced apoptosis. We compared the results to those of DEX and TAC.
CD8⁺ T cells were treated for 48 hours with each agent, and protein expression was analyzed by flow cytometry (Figure 5A–F). CAN296 significantly reduced Perforin expression, lowering levels to 47%, 60%, and 51% at low, medium, and high doses, respectively (equating to 40–53% reductions vs. control) (Figure 5G). Granzyme B was markedly reduced to 19%, 22%, and 19% at the same doses, representing 78–81% decreases. TAC showed similar suppression of Perforin, lowering it to 41% at low dose and 45% at medium/high, while Granzyme B was consistently reduced to 9% across all TAC doses (~91% decrease). DEX displayed a more variable response: Perforin dropped to 63%, 35%, and 63% at low, medium, and high doses, respectively, whereas Granzyme B levels fell to 19%, 7%, and 13%, representing 81–93% reductions. Two-way ANOVA revealed significant effects of treatment type and concentration (****p < 0.0001), confirming that all three agents modulated Perforin and Granzyme B expression. Overall, these findings indicate that CAN296 effectively suppresses key cytotoxic markers in CD8⁺ T cells—on par with TAC and DEX—and remains consistently potent even at lower doses, supporting its potential therapeutic application in immune-mediated diseases such as OLP and oGVHD.
4. Discussion
This study is our team's second publication on the High CBD strain CAN296. While our previous research demonstrated its cytotoxic effects against head and neck squamous cell carcinoma (HNSCC) cells, the present study highlights CAN296's potential as a novel and more effective treatment for immune-mediated oral disorders, particularly oral lichen planus (OLP) and oral manifestations of graft-versus-host disease (oGVHD).
The study aims to evaluate the immunomodulatory effects of CAN296, and a CBD:CBC combination (2:1), as used in our earlier study[39]. The goal was to assess their ability to modulate the secretion of pro-inflammatory cytokines (TNF-α and IFN-γ) by CD8⁺ T cells, which play key roles in cell-mediated immune responses in premalignant lesions such as OLP and oGVHD. After confirming that both CAN296, and CBD:CBC treatments significantly reduced cytokine secretion, we further investigated the effects of CAN296 due to its robust and consistent effects, as well as its status as a whole cannabis extract, which is already approved for medical use. Since CAN296 previously showed cytotoxic efficacy in HNSCC cell models, we aimed to evaluate whether it also comprises effects on the immune system compared with conventional immunosuppressants, DEX, and TAC.
Although the immune-driven pathology of OLP and oGVHD is well-characterized, a significant barrier to developing effective treatments lies in the absence of reliable in vitro models that accurately replicate the immune-epithelial dynamics of these diseases. Most current systems rely on oral keratinocyte monocultures and fail to capture the complex bidirectional signaling between immune cells and epithelial tissue. This limitation hampers the ability to evaluate immune-modulating therapies in a disease-relevant context. To overcome this, our study focused directly on the immune component by assessing CD4⁺ and CD8⁺ T cell activation, TNF-α and IFN-γ secretion, and expression of cytotoxic molecules such as Perforin and Granzyme B. These immune markers are central to the pathogenesis of both OLP and oGVHD and provide a targeted framework for assessing the immunomodulatory potential of candidate therapies like CAN296.
Cannabis extracts have been reported to possess immunosuppressive properties[33,35,56]; however, no research has directly compared their efficacy to commonly used immunosuppressants. This study addresses this gap by examining the effects of cannabis extract on key mechanisms underlying premalignant immune-mediated lesions, including T-cell activation, cytokine secretion, and cytotoxic molecule expression. These processes are central to immune-mediated lesions such as OLP and oGVHD, which are associated with an increased risk of malignant transformation to HNSCC.
CAN296 demonstrated substantial suppression of T cell activation, as evidenced by reduced CD69 expression in both arms of the T lymphocyte response, immune modulation (CD4⁺), and cytotoxicity (CD8⁺). CAN296 treatment reduced CD69 expression in CD4⁺ T consistently at all doses. In comparison, DEX decreased CD69 expression only at high concentrations, whereas TAC showed a dose-dependent but inconsistent reduction. The observed reduction aligns with previous studies reporting that CBD, the main ingredient in CAN296, can modulate T cell function[43,57].
While CAN296 significantly suppressed TNF-α secretion in CD4⁺ T cells, its effects on IFN-γ were insignificant, which can be attributed to donor-to-donor variability and the limited sample size in this study. Larger-scale studies will be necessary to determine whether CAN296 consistently modulates IFN-γ secretion in CD4⁺ T cells under more controlled and reproducible conditions.
Beyond T cell activation, CAN296 significantly reduced pro-inflammatory cytokine secretion, with TNF-α and IFN-γ levels decreasing by up to 96% in CD8⁺ T cells. In CD4⁺ T cells, CAN296 reduced TNF-α secretion across all concentrations but did not significantly alter IFN-γ levels. Previous research indicates that CBD inhibits NF-κB signaling and suppresses pro-inflammatory cytokines[42,58], and our findings here reinforce its potential role as an immunomodulator in immune-mediated diseases. In contrast, DEX and TAC only exhibited significant cytokine secretion suppression at higher concentrations, with TAC paradoxically increasing TNF-α at lower concentrations and DEX showing minimal reduction at lower doses. Such paradoxical effects at low doses have been reported under specific conditions[59], but this phenomenon is not the focus of our research and has not been further pursued. This variability suggests that CAN296 provides a stable and effective approach to modulating cytokine responses in CD4⁺ and CD8⁺ T cells. These cytokines are central to the pathogenesis and progression of immune-mediated lesions, driving immune cell recruitment, activation, cytotoxicity, barrier disruption, inflammation, tissue damage, and malignant transformation in conditions such as OLP and oGVHD lesion development[1,60].
In addition to its effects on cytokine secretion, CAN296 demonstrated robust suppression of key cytotoxic mediators associated with T cell-induced epithelial damage. Specifically, it effectively reduced the expression of Perforin and Granzyme B in CD8⁺ T cells—proteins directly involved in apoptotic signaling and tissue injury in immune-mediated lesions. Notably, CAN296 lowered Fas-L expression, a critical component of the extrinsic apoptotic pathway implicated in keratinocyte apoptosis in OLP and oGVHD. While conventional immunosuppressants like DEX and TAC showed similar reductions in Granzyme B and Perforin, they were less consistent in modulating Fas-L expression, with TAC paradoxically increasing it at higher doses—a phenomenon previously observed in immune cells treated with calcineurin inhibitors[60]. The ability of CAN296 to broadly suppress both intracellular cytotoxic molecules and Fas-L underscores its therapeutic potential in reducing T cell-mediated epithelial injury in immune-driven oral diseases.
These cytotoxic pathways play a central role in T cell-mediated epithelial damage in immune-mediated lesions like OLP and oGVHD. CD8⁺ T cells release Perforin to create membrane pores in target keratinocytes, allowing Granzyme B to enter and activate caspases, leading to apoptosis. Fas-L binding to Fas (CD95) on keratinocytes also triggers the extrinsic apoptotic pathway, further driving cell death. These mechanisms contribute to keratinocyte apoptosis, epithelial barrier disruption, and lesion formation. The ability of CAN296 to consistently suppress these cytotoxic mediators, in contrast to the variable effects observed with DEX and TAC, highlights its potential to mitigate T cell-mediated tissue damage in immune-mediated diseases like OLP and oGVHD more effectively than conventional therapies[21,22]. This suppression is attributed to CAN296's interaction with multiple immune-modulating pathways[44,45], with CBD, the main active component in CAN296, shown to induce apoptosis in activated immune cells while sparing healthy tissues, which could explain its efficacy in chronic inflammatory conditions[31,33].
While these findings are based on in vitro experiments with a limited number of donors, the well-documented therapeutic applications of cannabis extracts in conditions such as chronic pain, epilepsy, and multiple sclerosis provide a strong foundation for further exploring the potential of CAN296 in treating immune-mediated diseases like OLP and oGVHD. As CAN296 is an already approved cannabis extract for medical use, further research should focus on optimizing its application for these conditions. Future studies should develop standardized formulations of CAN296 and determine optimal dosing strategies. Once these parameters are established, human in vivo trials should be conducted to evaluate efficacy, safety, and tolerability, particularly for chronic and relapsing conditions such as OLP and oGVHD. The promising immunomodulatory properties of CAN296, combined with the growing body of evidence supporting cannabis-based therapies, highlight its potential as a compelling candidate for future therapeutic development.
5. Conclusion
This study demonstrates that the CBD-rich cannabis extract CAN296 effectively suppresses CD4⁺ helper and CD8⁺ cytotoxic T cells by reducing activation, pro-inflammatory cytokine secretion, and cytotoxic molecule expression. By modulating both arms of the immune response, key drivers of immune-mediated lesions such as OLP and oGVHD, CAN296 outperformed conventional therapies like DEX and TAC, even at low concentrations. These findings position CAN296 as a promising targeted immunomodulatory agent with the potential to reduce tissue damage and prevent lesion formation and premalignant progression. Future research should focus on developing optimized oral formulations to enhance bioavailability, stability, and localized delivery in the oral cavity.
Funding
This study was not supported by external funding.
Declaration of generative AI and AI-assisted technologies in the writing process
During the preparation of this work, the author(s) used ChatGPT in order to improve language and readability. After using this tool, the author(s) reviewed and edited the content as needed and take(s) full responsibility for the content of the publication.
Acknowledgments
The authors would like to thank Ohad Guberman for the extraction and sample preparation of the cannabis extract and synthetic cannabinoids.
References
- Payeras, M.R.; et al. Oral lichen planus: focus on etiopathogenesis. Arch Oral Biol 2013, 58, 1057–1069. [Google Scholar] [CrossRef]
- Sugerman, P.B.; et al. The pathogenesis of oral lichen planus. Crit Rev Oral Biol Med 2002, 13, 350–365. [Google Scholar] [CrossRef] [PubMed]
- Gorouhi, F.; Davari, P.; Fazel, N. Cutaneous and mucosal lichen planus: a comprehensive review of clinical subtypes, risk factors, diagnosis, and prognosis. ScientificWorldJournal 2014, 2014, 742826. [Google Scholar] [CrossRef] [PubMed]
- Gonzalez-Moles, M.A.; Scully, C.; Gil-Montoya, J.A. Oral lichen planus: controversies surrounding malignant transformation. Oral Dis 2008, 14, 229–243. [Google Scholar] [CrossRef]
- Aghbari, S.M.H.; et al. Malignant transformation of oral lichen planus and oral lichenoid lesions: A meta-analysis of 20095 patient data. Oral Oncol 2017, 68, 92–102. [Google Scholar] [CrossRef]
- Idrees, M.; et al. Oral lichen planus has a very low malignant transformation rate: A systematic review and meta-analysis using strict diagnostic and inclusion criteria. J Oral Pathol Med 2021, 50, 287–298. [Google Scholar] [CrossRef]
- Filipovich, A.H.; et al. National Institutes of Health consensus development project on criteria for clinical trials in chronic graft-versus-host disease: I. Diagnosis and staging working group report. Biol Blood Marrow Transplant 2005, 11, 945–956. [Google Scholar] [CrossRef] [PubMed]
- Filipovich, A.H. Diagnosis and manifestations of chronic graft-versus-host disease. Best Pract Res Clin Haematol 2008, 21, 251–257. [Google Scholar] [CrossRef]
- Rizzo, J.D.; et al. Solid cancers after allogeneic hematopoietic cell transplantation. Blood 2009, 113, 1175–1183. [Google Scholar] [CrossRef]
- Atsuta, Y.; et al. Continuing increased risk of oral/esophageal cancer after allogeneic hematopoietic stem cell transplantation in adults in association with chronic graft-versus-host disease. Ann Oncol 2014, 25, 435–441. [Google Scholar] [CrossRef]
- Mantovani, A.; et al. Cancer-related inflammation. Nature 2008, 454, 436–444. [Google Scholar] [CrossRef]
- El-Howati, A.; et al. Immune mechanisms in oral lichen planus. Oral Dis 2023, 29, 1400–1415. [Google Scholar] [CrossRef]
- Pimentel, V.N.; et al. Perforin and granzyme B involvement in oral lesions of lichen planus and chronic GVHD. J Oral Pathol Med 2010, 39, 741–746. [Google Scholar] [CrossRef] [PubMed]
- Coussens, L.M.; Werb, Z. Inflammation and cancer. Nature 2002, 420, 860–867. [Google Scholar] [CrossRef] [PubMed]
- Billi, M.; et al. DNA damage and cell death in human oral squamous cell carcinoma cells: The potential biological effects of cannabidiol. Arch Oral Biol 2025, 169, 106110. [Google Scholar] [CrossRef] [PubMed]
- Didona, D.; et al. Therapeutic strategies for oral lichen planus: State of the art and new insights. Front Med (Lausanne) 2022, 9, 997190. [Google Scholar] [CrossRef]
- Bachier, C.R.; et al. Epidemiology and Treatment of Chronic Graft-versus-Host Disease Post-Allogeneic Hematopoietic Cell Transplantation: A US Claims Analysis. Transplant Cell Ther 2021, 27, 504.e1–504.e6. [Google Scholar] [CrossRef]
- Taves, M.D.; Ashwell, J.D. Glucocorticoids in T cell development, differentiation and function. Nat Rev Immunol 2021, 21, 233–243. [Google Scholar] [CrossRef]
- Cain, D.W. and J.A. Cidlowski, Immune regulation by glucocorticoids. Nature Reviews Immunology 2017, 17, 233–247. [Google Scholar] [CrossRef]
- Noceti, O.M.; et al. Tacrolimus pharmacodynamics and pharmacogenetics along the calcineurin pathway in human lymphocytes. Clin Chem 2014, 60, 1336–1345. [Google Scholar] [CrossRef]
- Thongprasom, K.; et al. Interventions for treating oral lichen planus. Cochrane Database Syst Rev 2011, Cd001168. [Google Scholar] [CrossRef]
- Lodi, G.; et al. Interventions for treating oral lichen planus: a systematic review. Br J Dermatol 2012, 166, 938–947. [Google Scholar] [CrossRef] [PubMed]
- Kahan, B.D. Cyclosporine: a revolution in transplantation. Transplant Proc 1999, 31, 14s–15s. [Google Scholar] [CrossRef] [PubMed]
- Spencer, C.M.; Goa, K.L.; Gillis, J.C. Tacrolimus. An update of its pharmacology and clinical efficacy in the management of organ transplantation. Drugs 1997, 54, 925–975. [Google Scholar] [CrossRef]
- Nash, R.A.; et al. Phase 3 study comparing methotrexate and tacrolimus with methotrexate and cyclosporine for prophylaxis of acute graft-versus-host disease after marrow transplantation from unrelated donors. Blood 2000, 96, 2062–2068. [Google Scholar]
- Kvaal, S.I.; Angell-Petersen, E.; Warloe, T. Photodynamic treatment of oral lichen planus. Oral Surg Oral Med Oral Pathol Oral Radiol 2013, 115, 62–70. [Google Scholar] [CrossRef] [PubMed]
- Agha-Hosseini, F.; N. M. Pour, Photodynamic treatment of oral lichen planus. Oral Surg Oral Med Oral Pathol Oral Radiol 2014, 117, 257. [Google Scholar] [CrossRef]
- Akram, Z.; et al. Efficacy of low-level laser therapy compared to steroid therapy in the treatment of oral lichen planus: A systematic review. J Oral Pathol Med 2018, 47, 11–17. [Google Scholar] [CrossRef]
- Russo, E.B. Taming THC: potential cannabis synergy and phytocannabinoid-terpenoid entourage effects. Br J Pharmacol 2011, 163, 1344–1364. [Google Scholar] [CrossRef]
- Aziz, A.I.; et al. Cannabinoids as Immune System Modulators: Cannabidiol Potential Therapeutic Approaches and Limitations. Cannabis Cannabinoid Res 2023, 8, 254–269. [Google Scholar] [CrossRef]
- Vuolo, F.; et al. Cannabidiol reduces airway inflammation and fibrosis in experimental allergic asthma. Eur J Pharmacol 2019, 843, 251–259. [Google Scholar] [CrossRef]
- Malfait, A.M.; et al. The nonpsychoactive cannabis constituent cannabidiol is an oral anti-arthritic therapeutic in murine collagen-induced arthritis. Proc Natl Acad Sci U S A 2000, 97, 9561–9566. [Google Scholar] [CrossRef]
- Rieder, S.A.; et al. Cannabinoid-induced apoptosis in immune cells as a pathway to immunosuppression. Immunobiology 2010, 215, 598–605. [Google Scholar] [CrossRef] [PubMed]
- McPartland, J.M.; et al. Are cannabidiol and Δ(9) -tetrahydrocannabivarin negative modulators of the endocannabinoid system? A systematic review. Br J Pharmacol 2015, 172, 737–753. [Google Scholar] [CrossRef]
- Nichols, J.M.; B. L.F. Kaplan, Immune Responses Regulated by Cannabidiol. Cannabis Cannabinoid Res 2020, 5, 12–31. [Google Scholar] [CrossRef] [PubMed]
- Devi, S.; et al. Immunosuppressive activity of non-psychoactive Cannabis sativa L. extract on the function of human T lymphocytes. Int Immunopharmacol 2022, 103, 108448. [Google Scholar] [CrossRef]
- Aswad, M.; et al. High-CBD Extract (CBD-X) Downregulates Cytokine Storm Systemically and Locally in Inflamed Lungs. Front Immunol 2022, 13, 875546. [Google Scholar] [CrossRef] [PubMed]
- Furgiuele, A.; et al. Immunomodulatory Potential of Cannabidiol in Multiple Sclerosis: a Systematic Review. J Neuroimmune Pharmacol 2021, 16, 251–269. [Google Scholar] [CrossRef]
- Blal, K.; et al. The Effect of Cannabis Plant Extracts on Head and Neck Squamous Cell Carcinoma and the Quest for Cannabis-Based Personalized Therapy. Cancers (Basel) 2023, 15. [Google Scholar] [CrossRef]
- Massi, P.; et al. Cannabidiol as potential anticancer drug. Br J Clin Pharmacol 2013, 75, 303–312. [Google Scholar] [CrossRef]
- Pisanti, S.; et al. Cannabidiol: State of the art and new challenges for therapeutic applications. Pharmacol Ther 2017, 175, 133–150. [Google Scholar] [CrossRef] [PubMed]
- Burstein, S. Cannabidiol (CBD) and its analogs: a review of their effects on inflammation. Bioorg Med Chem 2015, 23, 1377–1385. [Google Scholar] [CrossRef] [PubMed]
- Pertwee, R.G. The diverse CB1 and CB2 receptor pharmacology of three plant cannabinoids: delta9-tetrahydrocannabinol, cannabidiol and delta9-tetrahydrocannabivarin. Br J Pharmacol 2008, 153, 199–215. [Google Scholar] [CrossRef]
- De Petrocellis, L.; et al. Effects of cannabinoids and cannabinoid-enriched Cannabis extracts on TRP channels and endocannabinoid metabolic enzymes. Br J Pharmacol 2011, 163, 1479–1494. [Google Scholar] [CrossRef]
- O'Sullivan, S.E. An update on PPAR activation by cannabinoids. Br J Pharmacol 2016, 173, 1899–1910. [Google Scholar] [CrossRef]
- Besser, E.; et al. Cannabinoid combination targets NOTCH1-mutated T-cell acute lymphoblastic leukemia through the integrated stress response pathway. Elife 2024, 12. [Google Scholar] [CrossRef]
- Qi, X.; et al. CBD Promotes Oral Ulcer Healing via Inhibiting CMPK2-Mediated Inflammasome. J Dent Res 2022, 101, 206–215. [Google Scholar] [CrossRef]
- Klein, M.; et al. Cannabidiol As A Novel Therapeutic Strategy For Oral Inflammatory Diseases: A Review Of Current Knowledge And Future Perspectives. Altern Ther Health Med 2020, 26, 12–16. [Google Scholar]
- Yeshurun, M.; et al. Cannabidiol for the Prevention of Graft-versus-Host-Disease after Allogeneic Hematopoietic Cell Transplantation: Results of a Phase II Study. Biol Blood Marrow Transplant 2015, 21, 1770–1775. [Google Scholar] [CrossRef]
- Berg, B.B.; et al. Cannabidiol Enhances Intestinal Cannabinoid Receptor Type 2 Receptor Expression and Activation Increasing Regulatory T Cells and Reduces Murine Acute Graft-versus-Host Disease without Interfering with the Graft-versus-Leukemia Response. J Pharmacol Exp Ther 2021, 377, 273–283. [Google Scholar] [CrossRef] [PubMed]
- Russo, E.B. The Case for the Entourage Effect and Conventional Breeding of Clinical Cannabis: No "Strain," No Gain. Front Plant Sci 2018, 9, 1969. [Google Scholar] [CrossRef] [PubMed]
- Russo, E.B. Beyond Cannabis: Plants and the Endocannabinoid System. Trends Pharmacol Sci 2016, 37, 594–605. [Google Scholar] [CrossRef] [PubMed]
- Brandl, C.; et al. The effect of dexamethasone on polyclonal T cell activation and redirected target cell lysis as induced by a CD19/CD3-bispecific single-chain antibody construct. Cancer Immunol Immunother 2007, 56, 1551–1563. [Google Scholar] [CrossRef]
- Baram, L.; et al. The heterogeneity and complexity of Cannabis extracts as antitumor agents. Oncotarget 2019, 10, 4091–4106. [Google Scholar] [CrossRef] [PubMed]
- Berman, P.; et al. A new ESI-LC/MS approach for comprehensive metabolic profiling of phytocannabinoids in Cannabis. Sci Rep 2018, 8, 14280. [Google Scholar] [CrossRef]
- Wyrobnik, I.; et al. Decreased melanoma CSF-1 secretion by Cannabigerol treatment reprograms regulatory myeloid cells and reduces tumor progression. Oncoimmunology 2023, 12, 2219164. [Google Scholar] [CrossRef]
- Kozela, E.; et al. Cannabidiol inhibits pathogenic T cells, decreases spinal microglial activation and ameliorates multiple sclerosis-like disease in C57BL/6 mice. Br J Pharmacol 2011, 163, 1507–1519. [Google Scholar] [CrossRef]
- Ribeiro, A.; et al. Cannabidiol improves lung function and inflammation in mice submitted to LPS-induced acute lung injury. Immunopharmacol Immunotoxicol 2015, 37, 35–41. [Google Scholar] [CrossRef]
- Morgan, D.J.; Davis, D.M. Distinct Effects of Dexamethasone on Human Natural Killer Cell Responses Dependent on Cytokines. Front Immunol 2017, 8, 432. [Google Scholar] [CrossRef]
- Zeiser, R.; Blazar, B.R. Pathophysiology of Chronic Graft-versus-Host Disease and Therapeutic Targets. N Engl J Med 2017, 377, 2565–2579. [Google Scholar] [CrossRef]
Figure 1.
Effects of CAN296 and CBD:CBC (2:1) on TNF-α and IFN-γ secretion by CD8⁺ T cells. CD8⁺ T cells from n = 3 donors (TNF-α) and n = 4 donors (IFN-γ) were treated with CAN296 (4 µg/mL and 8 µg/mL) or CBD:CBC (2:1 ratio; 4 µg/mL and 8 µg/mL) for 24 h, with untreated cells as the control. (A) TNF-α secretion was measured and expressed as a percentage change relative to the control. (B) IFN-γ secretion was measured and expressed as a percentage change relative to the control. Data are presented as mean ± SE. Statistical significance was analyzed using two-way ANOVA followed by Dunnett’s multiple comparisons test, with asterisks indicating significant differences compared to the control group (****p < 0.0001, **p < 0.01, *p < 0.05).
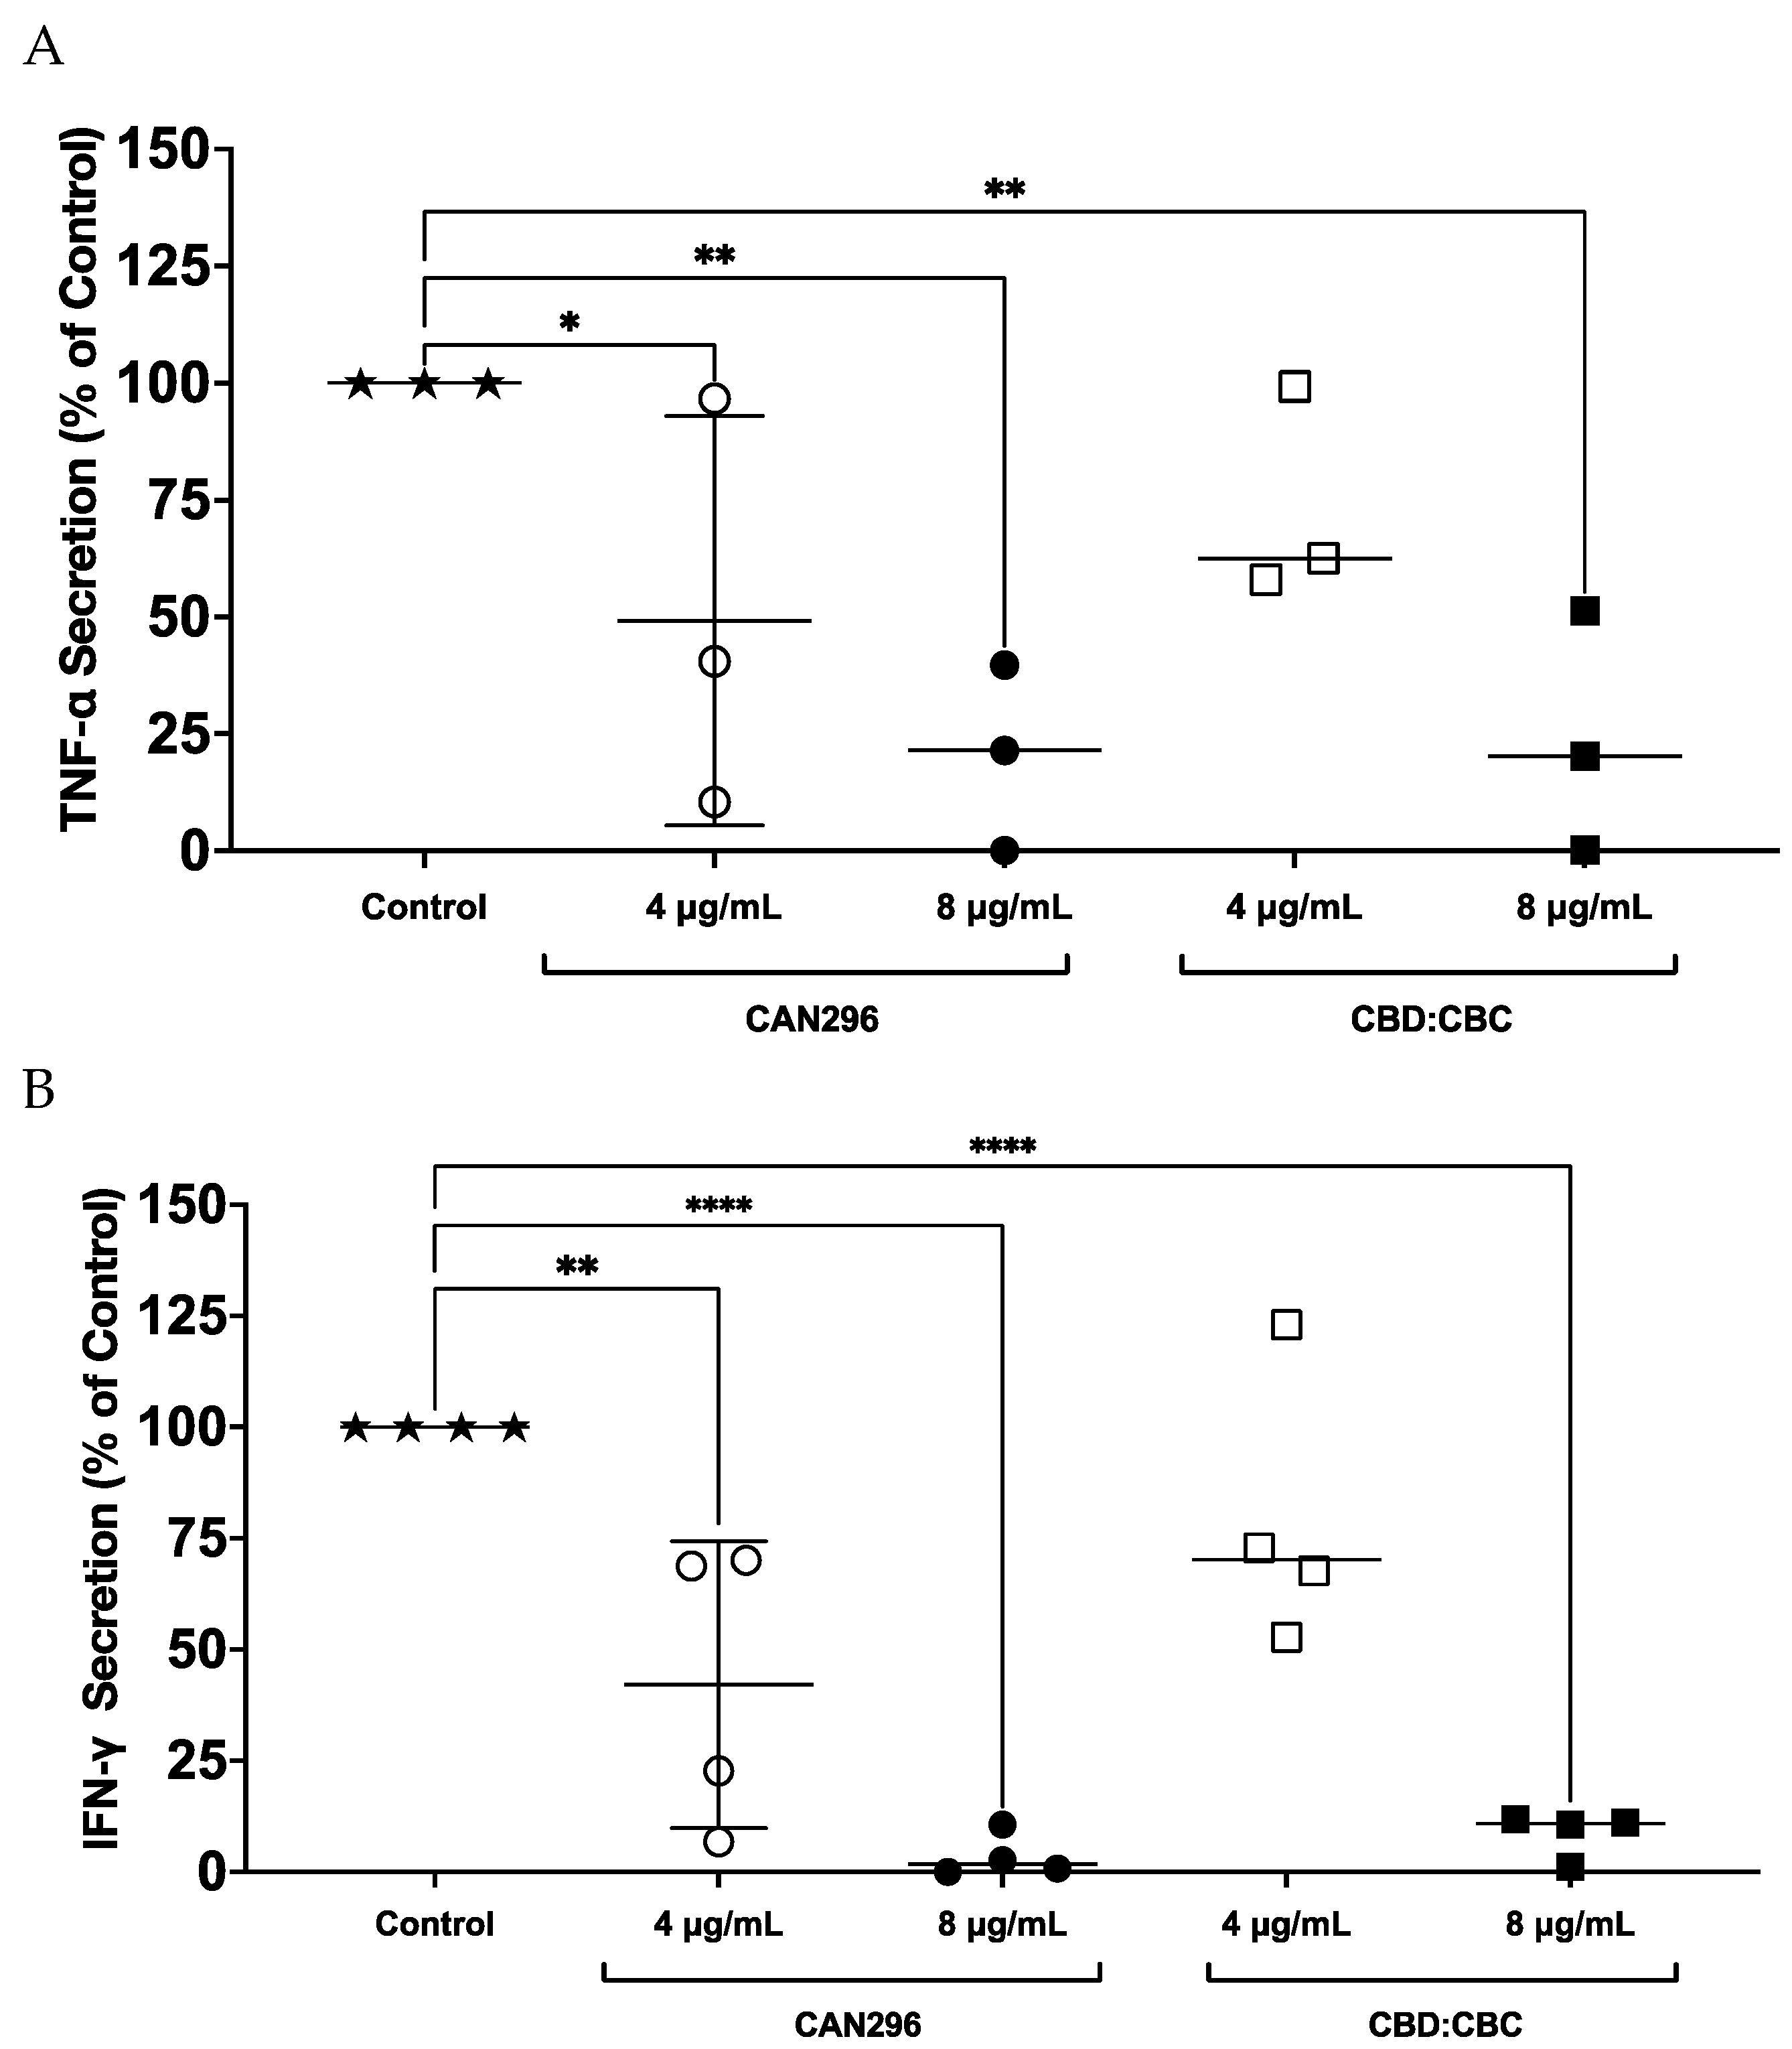
Figure 2.
Effects of CAN296, TAC, and DEX on CD69 expression in CD4⁺ and CD8⁺ T cells. Representative histograms of CD69 expression profiles in CD8⁺ (A–C) and CD4⁺ (D–F) T cells (n = 2 donors) after 24 hours of treatment with CAN296 (2, 4, 8 µg/mL), TAC (0.1, 1, 10 ng/mL), or DEX (0.4, 4, 40 µg/mL). Panels A, D (green) show CAN296, B, E (purple) show TAC, and C, F (red) show DEX, with darker shades indicating higher concentrations. The gray line denotes the positive control (Control⁺: stimulated, untreated cells), and the pink line represents the negative control (unstimulated cells). (G) CD69 expression levels (mean fluorescence intensity, MFI) are a percentage of control (Control⁺: stimulated, untreated cells). Data are presented as medians with 95% confidence intervals, statistically analyzed with two-way ANOVA with significant differences from the control indicated by asterisks (*p < 0.05, **p < 0.01).
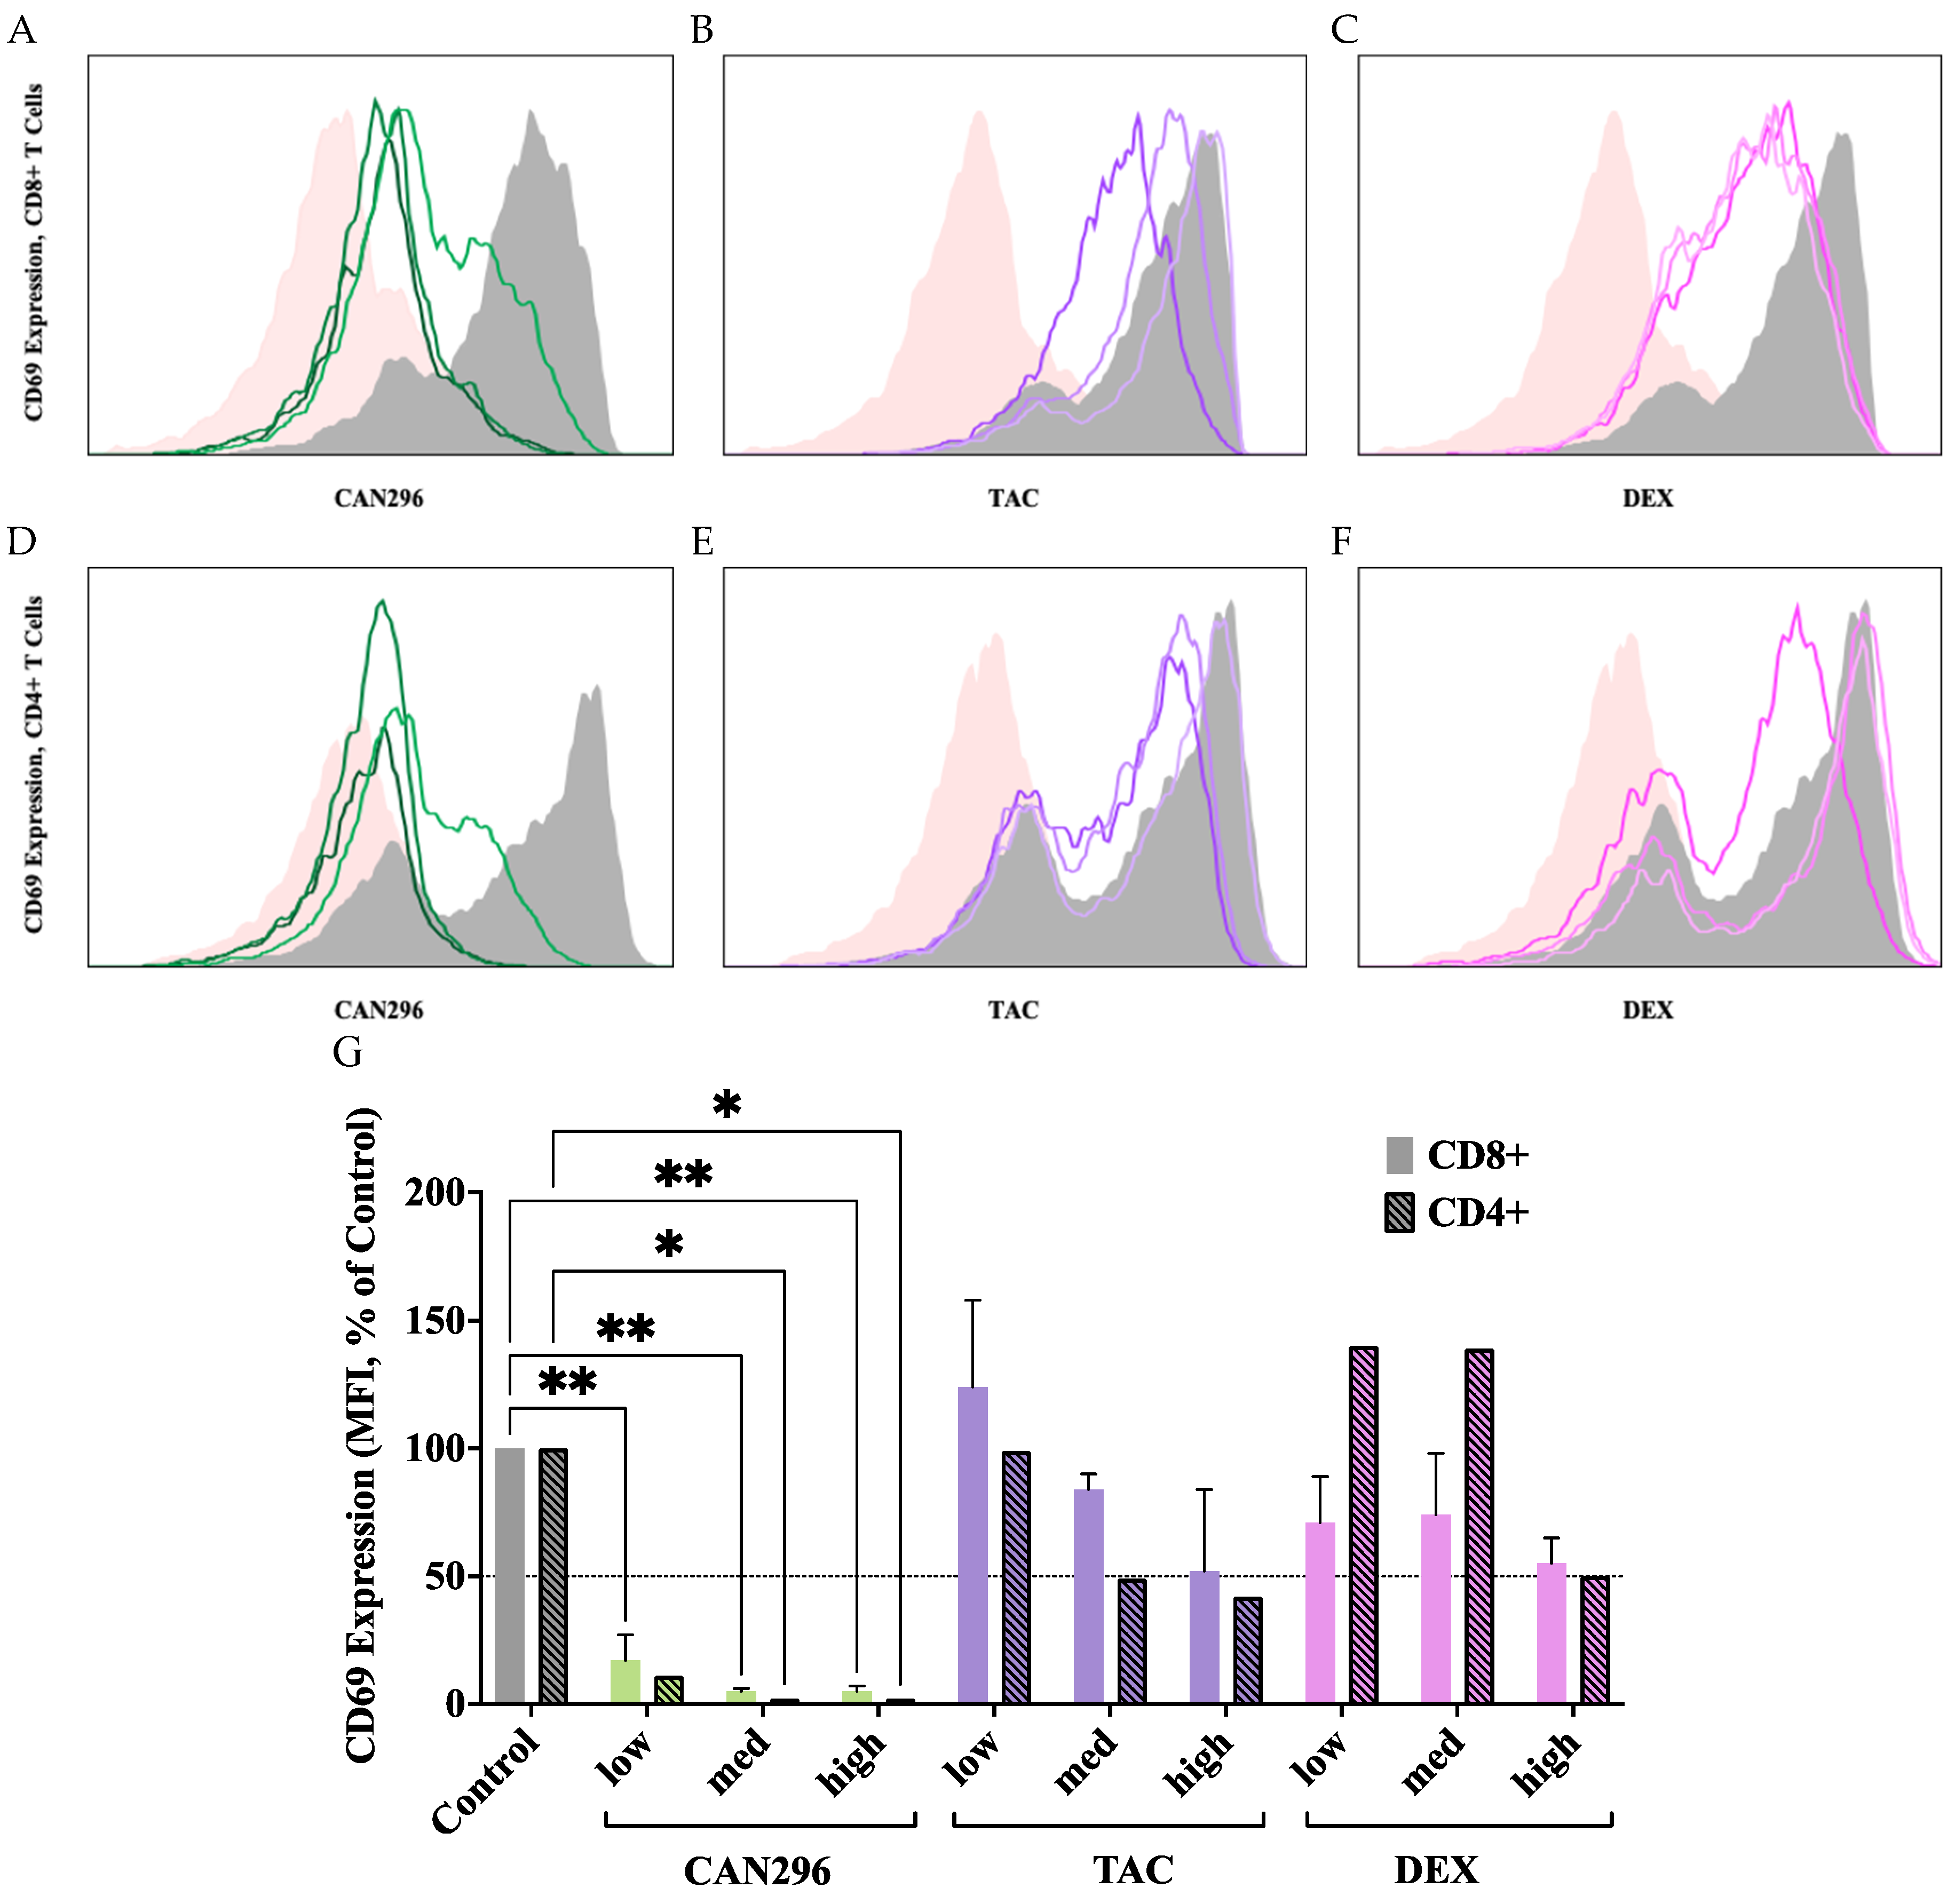
Figure 3.
Effects of CAN296, DEX, and TAC on TNF-α and IFN-γ secretion by CD4⁺ and CD8⁺ T cells. T cells were treated with CAN296 (2, 4, 8 µg/mL), DEX (0.4, 4, 40 µg/mL), and TAC (0.1, 1, 10 ng/mL) for 24 hours (n = 2 donors). (A) TNF-α and (B) IFN-γ levels (pg/mL) in CD4⁺ T cells; (C) TNF-α and (D) IFN-γ levels (pg/mL) in CD8⁺ T cells. Percentage decrease in (E) TNF-α and (F) IFN-γ, respectively, relative to untreated controls. Data are presented as mean ± SD, with asterisks indicating significant differences compared to the control group, as determined by Dunnett's multiple comparisons test.
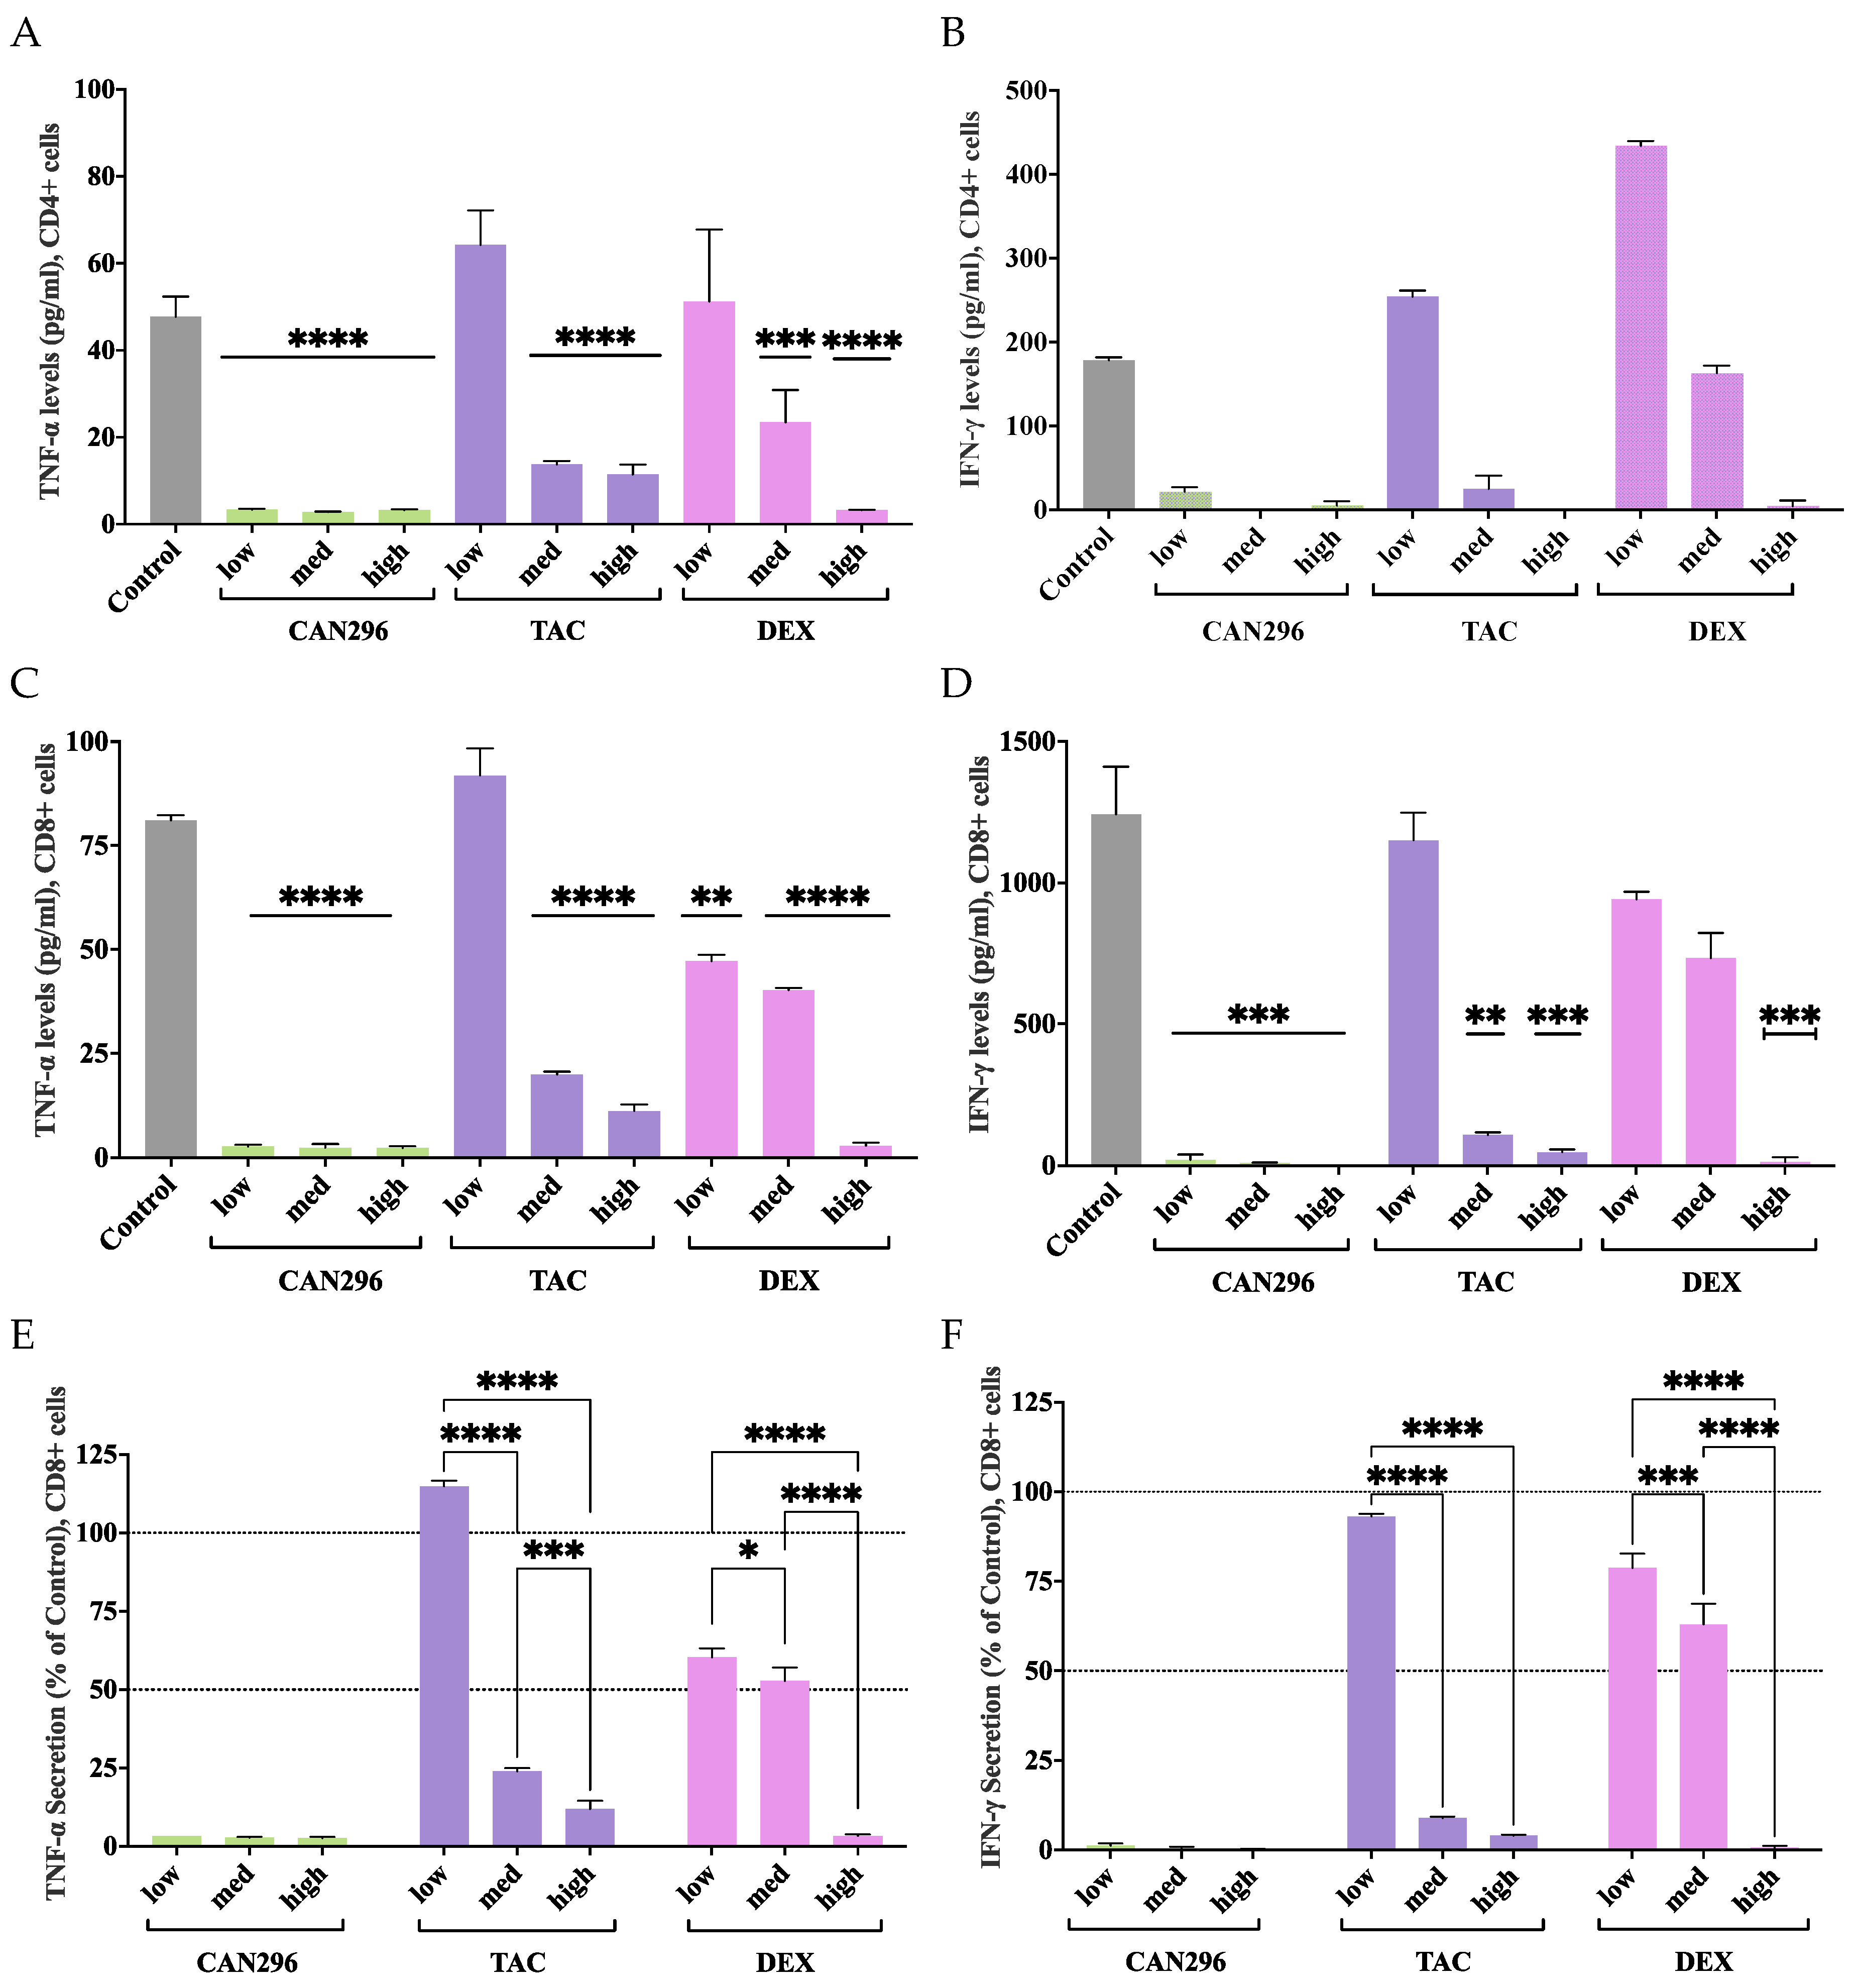
Figure 4.
CAN296 significantly reduced Fas-L expression in CD8⁺ T cells, while TAC increased expression at higher doses. (A–C) Representative histograms depict Fas-L expression profiles in CD8⁺ T cells (n = 2 donors) after 24 hours of treatment with (A) CAN296 (2, 4, 8 µg/mL), (B) TAC (0.1, 1, 10 ng/mL), or (C) DEX (0.4, 4, 40 µg/mL). Darker shades indicate higher concentrations of each treatment. The gray solid line represents the positive control (Control⁺: stimulated, untreated cells). (D) Fas-L expression levels (median fluorescence intensity, MFI, % of control). CAN296 reduced Fas-L expression by 40–44% and DEX by 40–55%, while TAC elevated Fas-L expression at higher doses. Data are presented as medians with 95% confidence intervals. Asterisks denote significant differences from the control group, as determined by Šidák's multiple comparisons test (*p < 0.05, **p < 0.01).
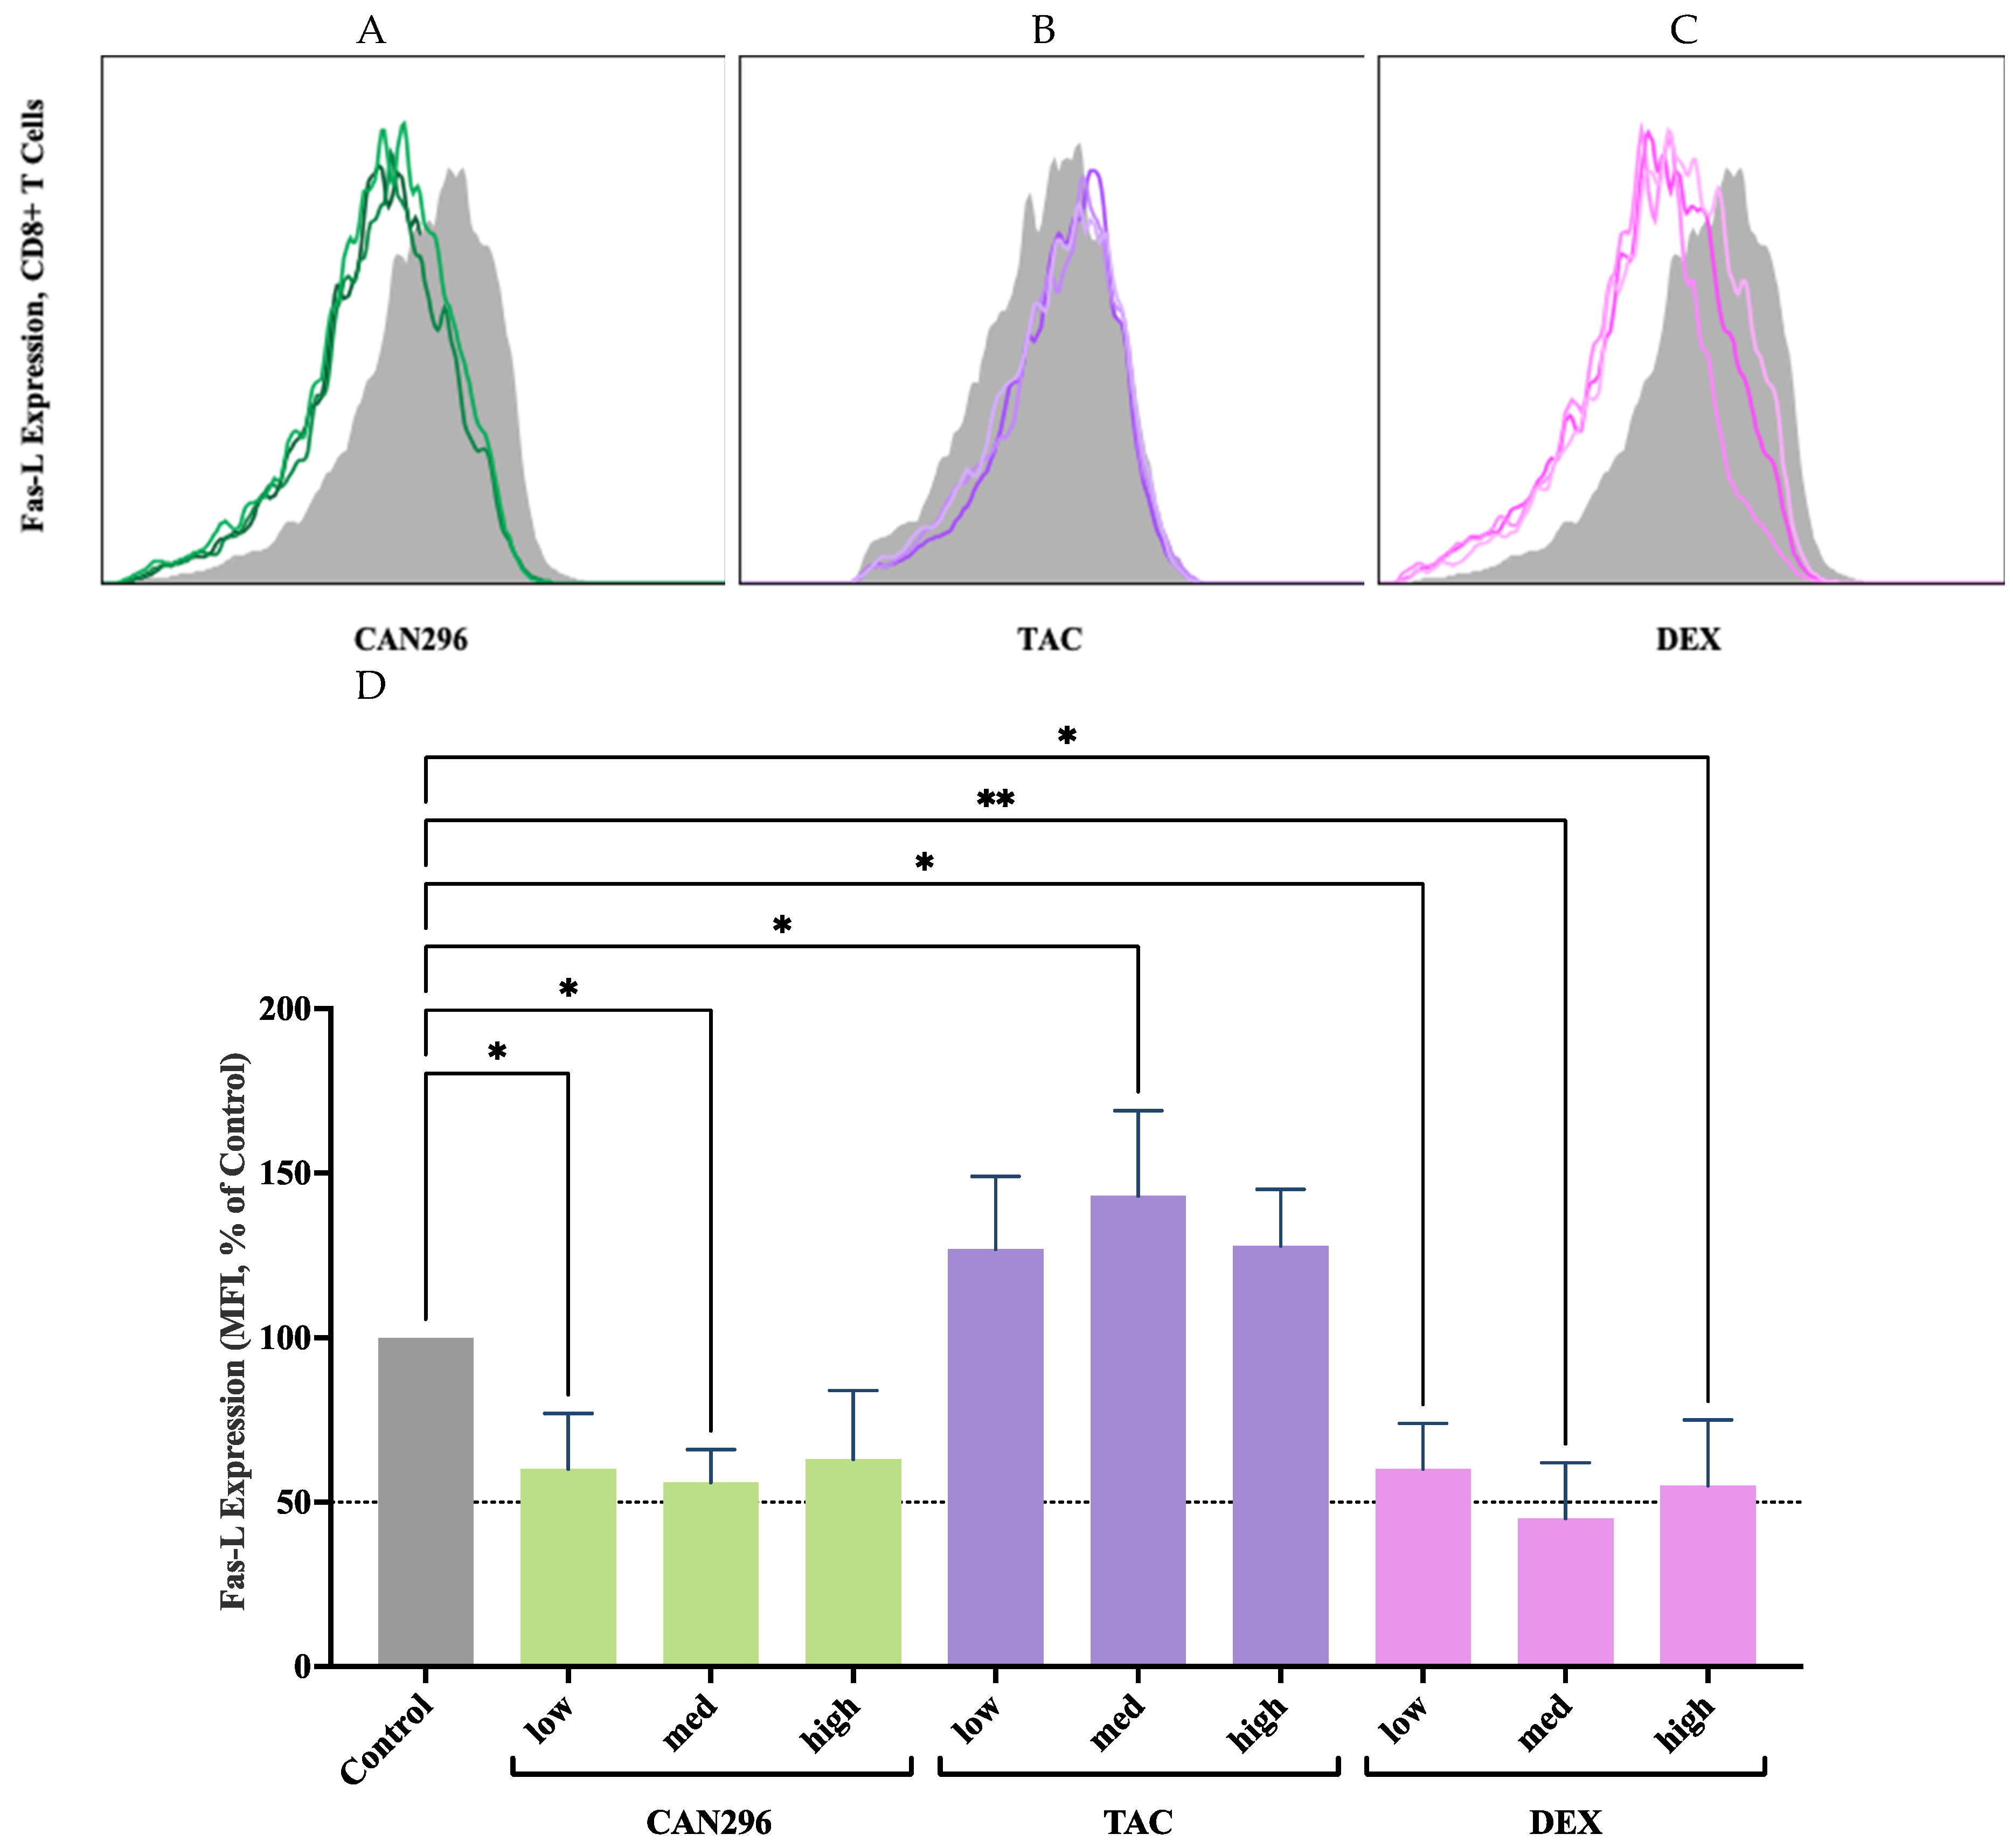
Figure 5.
Effects of CAN296, TAC, and DEX on Perforin and Granzyme B expression in CD8⁺ T cells. (A–C) Representative histograms depicting Perforin and (D–F) Granzyme B expression profiles in CD8⁺ T cells (n = 2 donors) treated with CAN296 (2, 4, 8 µg/mL), TAC (0.1, 1, 10 ng/mL), or DEX (0.4, 4, 40 µg/mL). Darker shades indicate higher concentrations of each treatment. The gray solid line represents the positive control (Control⁺: stimulated, untreated cells). (G) Quantified Perforin and Granzyme B expression levels (median fluorescence intensity, MFI, % of control). Data are presented as medians with 95% confidence intervals, and asterisks indicate significant differences compared to the control group, as determined by Šidák's multiple comparisons test (*p < 0.05, **p < 0.01, ***p < 0.001, ****p < 0.0001).
Disclaimer/Publisher’s Note: The statements, opinions and data contained in all publications are solely those of the individual author(s) and contributor(s) and not of MDPI and/or the editor(s). MDPI and/or the editor(s) disclaim responsibility for any injury to people or property resulting from any ideas, methods, instructions or products referred to in the content. |
© 2025 by the authors. Licensee MDPI, Basel, Switzerland. This article is an open access article distributed under the terms and conditions of the Creative Commons Attribution (CC BY) license (http://creativecommons.org/licenses/by/4.0/).
Copyright: This open access article is published under a Creative Commons CC BY 4.0 license, which permit the free download, distribution, and reuse, provided that the author and preprint are cited in any reuse.


