
Submitted:
23 September 2025
Posted:
23 September 2025
You are already at the latest version
Abstract
Chronic kidney disease (CKD) accelerates vascular dysfunction and cardiovascular disease, partly through accumulation of the uraemic toxin indoxyl sulphate (IS). Thrombospondin-1 (TSP1) and its receptor CD47 have been implicated in vascular pa-thology, but their role in CKD-associated vascular remodelling is unknown. We inves-tigated the contribution of TSP1–CD47 signalling to vascular smooth muscle cell (VSMC) dysfunction in CKD. Human aortic VSMCs (hVSMCs) were exposed to IS, TSP1, or plasma from patients with CKD. CKD was induced in wild-type (WT) and CD47-deficient (CD47KO) mice using 5/6 nephrectomy. Vascular changes were assessed by histology, immunohistochemistry, and molecular analyses.
IS, TSP1, and CKD plasma increased TSP1 expression in hVSMCs, reduced proliferation, elevated β-galactosidase activity, and activated phosphorylated ERK1/2 and cytoplasmic aryl hydrocarbon receptor. These effects were attenuated by CD47 blockade. CKD plasma further enhanced IS- and TSP1-induced senescence. In vivo, 5/6 nephrectomy induced aortic wall thickening and fibrosis in WT but not CD47KO mice. Aortic pERK1/2 was reduced in CD47KO mice despite persistent TSP1 upregulation. IS and TSP1 pro-mote VSMC senescence through CD47-dependent ERK1/2 and AhR signalling. CD47 deletion protects against CKD-induced vascular remodelling, suggesting that CD47 blockade may represent a novel therapeutic strategy to mitigate vascular complications in CKD.
Keywords:
Chronic kidney disease
; Vascular smooth muscle cells
; Uremia
; Senescence
; Thrombospondin 1
; CD47
1. Introduction
Chronic kidney disease (CKD) is associated with vascular pathology including atherosclerosis, arteriosclerosis, heterotopic medial calcification and arterial stiffness, which contributes to the progression of cardiovascular disease (CVD) and increased mortality [1,2]. Such changes are due to long-term exposure of uraemic toxins, in addition to traditional risk factors like hypertension and hyperlipidaemia [3]. Concentrations of the highly protein-bound uraemic toxin indoxyl sulphate (IS) progressively increases with stage of CKD and is associated with major adverse cardiovascular events (MACE) and overall mortality [4]. IS demonstrates direct cytotoxic effects, altering vascular smooth muscle cell (VSMC) proliferation [5,6], senescence [7], migration [8] and apoptosis [9].
Thrombospondin-1 (TSP1) is a secreted matricellular glycoprotein that can interact with numerous cell-surface receptors on various cell types to modulate biological processes such as proliferation, migration, adhesion and inflammation [10]. Plasma TSP1 expression is upregulated in CKD patients [11] and high levels are predictive of both cardiovascular and all-cause mortality in end-stage kidney disease (ESKD) [12]. Vascular expression of TSP1 is upregulated in response to injury [13], shear stress [14], and disease states including ischemia [15] and diabetes [16]. We have previously shown that TSP1 is also increased in IS-treated VSMC [17].
The high affinity receptor for TSP1 in VSMC is CD47 [18,19], with activation at picomolar concentrations. The importance of the TSP1-CD47 signalling axis has been identified in systemic vascular dysfunction [20] as well as pulmonary arterial hypertension [21,22]. However, its role in uraemia-induced vascular pathology has yet to be investigated. Here we report that TSP1 and IS drive vascular proliferation and senescence via CD47-mediated activation of AhR and pERK1/2 pathways in isolated hVSMCs. CD47 deletion protects against CKD-induced vascular remodelling, despite persistent TSP1 upregulation in mice aorta.
2. Results
2.1. Exogenous TSP1, Indoxyl Sulfate and CKD Patient Plasma Promote Endogenous TSP1 Expression in VSMC
Circulating levels of thrombospondin-1 (TSP1) [11] and indoxyl sulfate (IS) increase with CKD severity [26] and we have previously demonstrated that IS induces expression of TSP1 in cardiomyocytes to drive cardiac remodelling [17]. We now demonstrate this effect is not cell specific. hVSMCs were treated for 24h with TSP1 (0.2 to 10nM) (Figure 1A), IS (1-500µM) (Figure 1B) at concentrations consistent with those observed in CKD patients [4,26], or plasma from patients with CKD (Figure 1C). Both exogenous TSP1 and IS upregulated endogenous TSP1 expression in hVSMCs. Similarly, exposure to plasma from CKD patients consistently increased endogenous TSP1 expression.
2.2. TSP1 and Indoxyl Sulfate Changes VSMC Proliferation and Senescence via CD47
TSP1 and IS are known to affect hVSMC proliferation in a time- and dose-dependent manner [27]. TSP1 at 2.2 nM (and at higher concentrations) inhibited hVMSC proliferation (Figure 2A) and this was mitigated by anti-CD47 antibody (Figure 2B). A similar trend was seen with IS (Figure 2C), particularly at higher concentrations, which was also reversed by blocking CD47 (Figure 2D).
Cellular senescence contributes to vascular pathology through oxidative stress, inflammation and mitochondrial dysfunction, which is attributed—in part—to the retention of uremic toxins [28]. IS appeared to have a biphasic effect on hVSMC senescence (Figure 3A), although β-galactosidase activity at lower concentrations was reduced by pre-treatment with αCD47Ab (Figure 3B,E). TSP1 (at 2.2 nM) also increased senescence in hVSMCs (Figure 3C) which was reduced by blocking CD47 signalling (Figure 3D,E).
2.3. TSP1 Activates AhR in VSMC via CD47
IS activates the aryl hydrocarbon receptor (AhR) [29,30], driving transcriptional programs that exacerbate systemic oxidative stress and inflammation, which are all elevated in CKD. We reported previously that AhR and TSP1 are associated with cardiorenal syndrome [17], and CKD through IS and TSP1 induces AhR myocardial expression. AhR expression in hVSMCs in response to exogenous IS was biphasic (Figure 4A). Plasma from either healthy controls or CKD patients were unable to stimulate AhR expression in hVSMCs (Figure 4B). TSP1 activated both cytoplasmic and nuclear AhR expression in hVSMCs (Figure 4C), and pre-treatment with αCD47Ab reduced TSP1-induced cytoplasmic AhR expression (Figure 4D).
2.4. Establishing Equivalent CKD in WT and CD47KO Mice
CD47KO mice are known to be protected from exogenous stressors leading to reduced susceptibility to ischemia-reperfusion injury [31], therefore an acute-on-chronic insult model would be difficult to achieve parity of injury compared to wild-type (WT) mice. We established a 5/6Nx model of CKD in C57BL/6 mice [23,24], which was successfully recapitulated in CD47KO mice. Equivalent proportion of kidney mass was excised in WT and CD47KO 5/6Nx groups (Figure 5A). All 5/6Nx mice (regardless of genotype) demonstrated reduced body weight gain over 12 weeks compared to sham-operated controls (Figure 5B). The development of CKD was confirmed by significantly increased plasma urea and creatinine in 5/6Nx groups, which was equivalent between WT and CD47KO mice (Figure 5C). Polyuria, and reduced urine-to-plasma creatinine ratios were also observed in 5/6Nx groups (Figure 5D), consistent with our previous reports [23,24]. Urine protein to creatinine ratios were unchanged (Figure 5D). Kidney histology at 12 weeks following 5/6Nx demonstrated equivalent tubular atrophy, interstitial fibrosis and perivascular fibrosis in both genotypes (Figure 5E).
2.5. Development of CRS Upregulates Aortic TSP1 Expression
We have previously demonstrated that our pre-clinical CRS model elevates plasma IS [17], consistent with human CKD, which is strongly linked with cardiovascular pathology. We then investigated morphological changes in the thoracic aorta to determine the impact of uremia and disrupted CD47 signalling. As shown previously [17], the 5/6Nx model does not significantly change blood pressure or heart rate (Figure S1) excluding the contribution of increased afterload to vascular changes. CKD, regardless of genotype, significantly enhanced TSP1 expression (Figure 6A,B), with a trend towards increased total aorta thickness (Figure 6C, panel (i), Figure 6D). Adventitial thickness was significantly increased only in WT 5/6Nx mice (Figure 6E), and there were no differences in medial thickness (Figure 6F). Picrosirius red-stained sections (Figure 6C, panel (ii)) demonstrated increased medial (Figure 6G) and adventitial fibrosis in the CD47KO 5/6Nx group only. There was no significant difference in elastin or intimal thickening (Figure 6C, panel (iii)), and no vascular calcification detected across all experimental groups (Figure 6C, panel (iv)).
2.6. MAPK ERK Signalling is Activated by TSP1 and IS via CD47
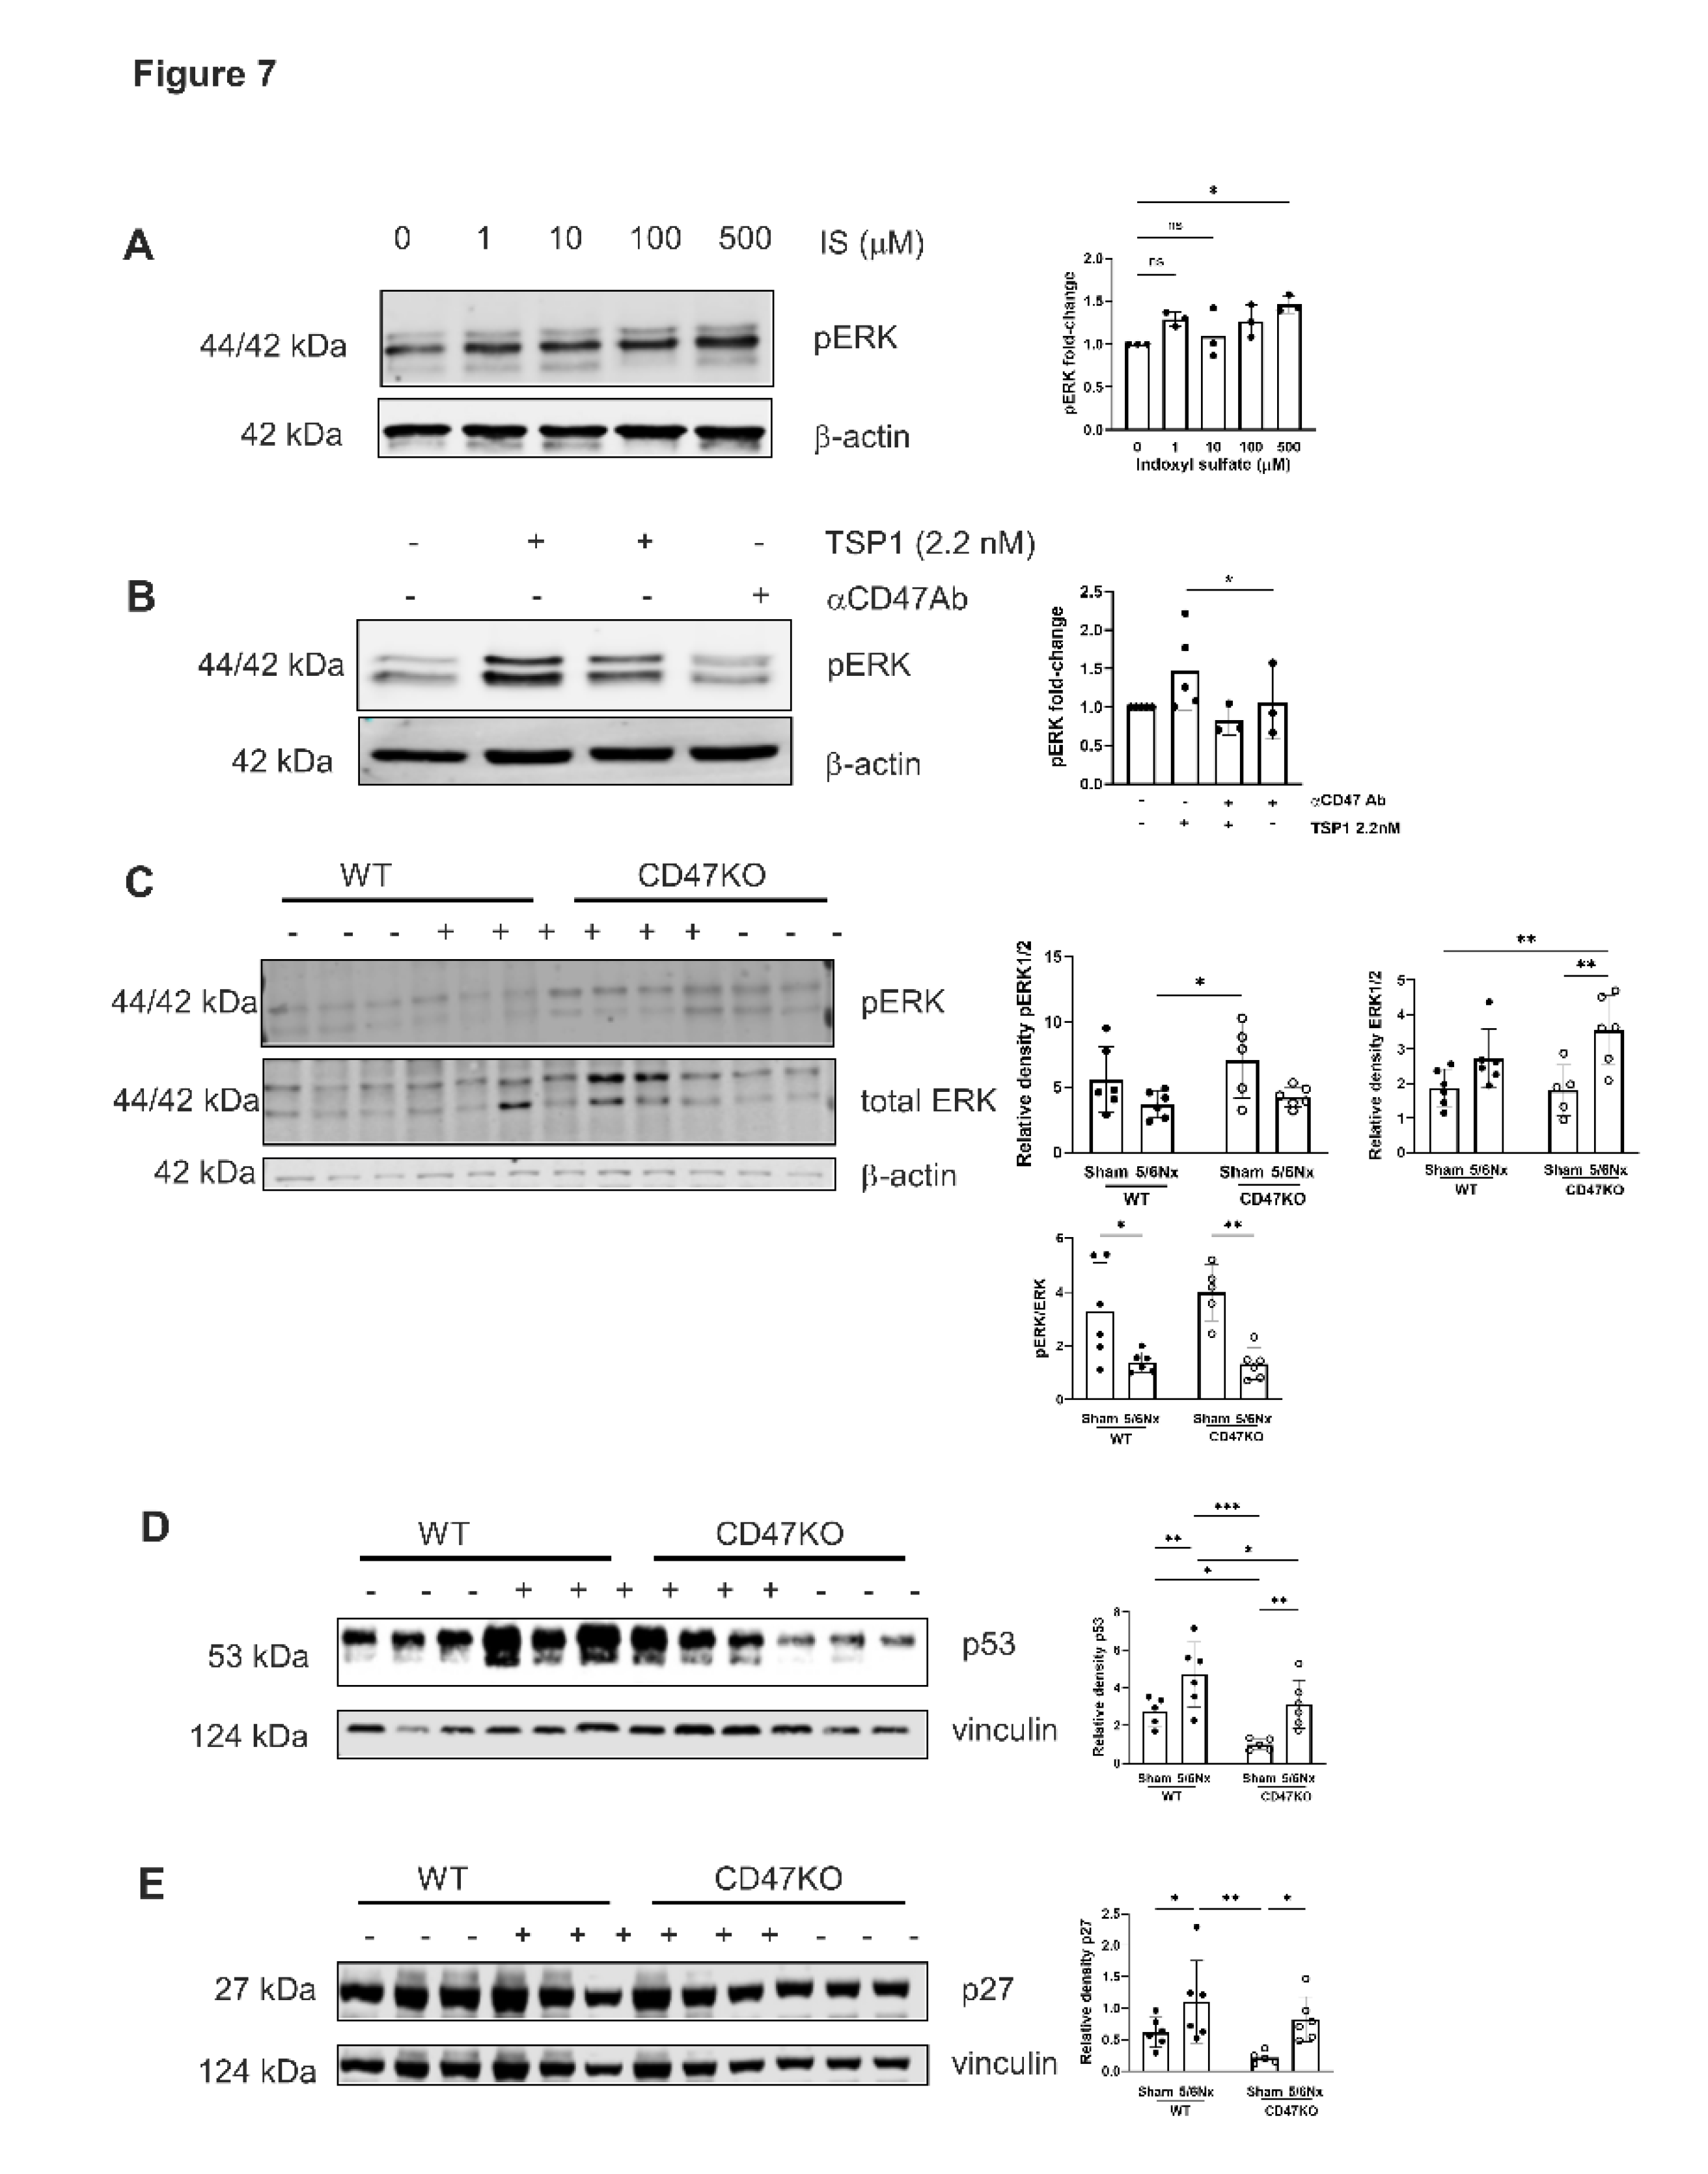
AhR regulates TSP1 gene promoter activity [32], and mitogen-activated protein kinase (MAPK) activation has also been shown to facilitate AhR activity [33]. We have previously shown that TSP1 induces AhR and MAPK expression suggesting multi-directional potentiation of signalling [17]. The MAPK extracellular signal-regulated kinase (ERK) plays an important role in VSMC proliferation [34,35,36]. Treatment of hVSMCs with IS upregulated pERK expression (Figure 7A). TSP1 also upregulated pERK expression which was mitigated by anti-CD47 antibody (Figure 7B). The in vitro effect was not recapitulated in vivo, as expression of pERK1/2 was reduced in thoracic aortae of both genotypes following 5/6Nx (Figure 7C), although total ERK was generally increased.
2.7. CRS Mice Demonstrate Increased Vascular Senescence via CD47
In CKD, oxidative stress, dysregulated calcium and phosphate levels, and uremic toxins (including IS) promote DNA damage and cellular dysfunction that culminates in premature senescence. Aortae from WT 5/6Nx mice also showed amplified expression of senescence markers p53 and p27, which was significantly lower in CD47KO 5/6Nx mice (Figure 7D).
3. Discussion
CKD is strongly associated with vascular dysfunction and premature vascular ageing [37,38] but the molecular mediators remain incompletely defined. In this study, we have identified TSP1 as a key regulator of uremic vascular changes. We demonstrate that both TSP1 and the uremic toxin IS consistently reduced VSMC proliferation and induced senescence. TSP1 expression in VSMCs was also induced by IS, as well as by plasma from patients with CKD, putatively containing both IS and TSP1. Our mechanistic studies revealed that both IS and TSP1 increased AhR expression and ERK1/2 phosphorylation in VMSC. The biphasic effect of IS—possibly due to altered nuclear/cytoplasmic trafficking of AhR—remains to be determined. Blockade of CD47—the high affinity TSP1 receptor—attenuated senescence and ERK activation, supporting the notion of CD47 as a critical mediator. These findings highlight TSP1 as a driver of uremic signalling and a key therapeutic target.
Although ERK is classically associated with mitogenic signalling [39], sustained activation can instead trigger cell-cycle arrest and/or senescence [40]. The amplitude and duration of ERK signalling are key determinants: moderate activation promotes cell-cycle entry, whereas strong or prolonged signalling induces p53, p21 and p27 expression, as well as growth arrest in different cell types [40,41]. Our finding that TSP1- and IS-induced ERK activation reduced proliferation and increased senescence in VMSCs is in keeping with these findings.
Our 5/6Nx model yielded divergent vascular responses. In thoracic aortae, CKD increased total ERK1/2 expression but decreased activation (phospho-ERK) in both WT and CD47KO mice. This may reflect nuclear translocation of ERK1/2 [42,43] or the influence of additional vascular wall intercellular signalling. We observed a biphasic response in cytoplasmic AhR expression in VSMC, but no corresponding activation of ERK1/2 expression. The effect of IS on ERK1/2 activation is variable and context-dependent, with some studies showing it enhances or has no effect and others demonstrating inhibition of ERK1/2 phosphorylation, depending on the cell type and cell culture conditions, requiring additional pro-inflammatory cytokines [44] or variable IS concentrations [45]. IS has been shown to activate ERK1/2 in renal proximal tubular cells [46] and VSMCs [47], while inhibiting it at higher concentrations in osteoblast-like cells [48]. These discrepancies highlight the complexity of uremic signalling in the intact vascular wall, where gradients of toxins (IS), matrix proteins (TSP1), and receptor expression influence responses.
3.1. Study Limitations
Several limitations should be acknowledged. First, our in vitro experiments were performed in isolated hVSMCs, which may not fully capture the multicellular interactions that occur within the vessel wall. Endothelial cells, fibroblasts, and infiltrating immune cells are likely to influence TSP1 signalling and senescence. Second, the concentrations of IS and TSP1 used in vitro may not precisely reflect the in vivo milieu, where toxin accumulation and spatial gradients are dynamic and patient-dependent. Third, we used global CD47-deficient mice, and cell-type–specific roles of CD47 remain to be defined. Fourth, ERK1/2 activation was measured in bulk vascular tissue, which may obscure cell-specific differences in signalling. Finally, the demographic characteristics of patients and their serum concentrations of IS and TSP1 are unknown, which may account for the variability in cytoplasmic AhR expression induced by serum in hVSMCs.
3.2. Clinical Perspectives
Despite these limitations, our findings provide novel insights with direct clinical implications. By linking IS to increased TSP1 expression and identifying a CD47–AhR–ERK signalling pathway that drives VSMC senescence, we propose a potential mechanism underlying vascular remodelling and premature vascular aging in CKD. Consistent with this, we observed overexpression of p27 and p53 in CKD aortae. Senescent VSMCs lose contractile function, secrete extracellular matrix, and promote fibrosis, collectively contributing to heightened cardiovascular risk.
Currently, therapies targeting vascular aging in CKD are limited. Our results suggest that blocking TSP1 or CD47-dependent signalling could mitigate vascular senescence and remodelling. Given the availability of experimental CD47-blocking antibodies and the development of small-molecule inhibitors, translational opportunities are emerging. Furthermore, circulating TSP1 may serve as a biomarker of CKD [11], and perhaps also vascular risk, complementing existing markers of uremic toxicity. Thus, targeting TSP1-driven signalling may represent a novel strategy to reduce the burden of cardiovascular disease in CKD patients.
4. Materials and Methods
4.1. Animals
CD47KO (B6.129S7-Cd47tm1Fpl/J) mice on a C57BL/6J background (back-crossed for 15 generations) were purchased from the Jackson Laboratory, then bred and housed at Australian Bioresources (ABR, Sydney, Australia). Age-matched (6-8 weeks old) male littermate control (wild-type, WT) mice purchased from ABR and homozygous CD47KO mice were transferred to the Westmead Institute for Medical Research and allowed to acclimatise for 2 weeks prior to study commencement. Mice were housed in the biological facility under 12-hour light/dark cycle with free access to standard chow and water. Animal studies were performed under approved protocols (Western Sydney Local Health District #4304, #4281 and University of Sydney #1594, #2022/2028) and in accordance with the Australian code for the care and use of animals for scientific purposes (National Health and Medical Research Council).
4.2. CKD Model
Age-matched (8-10 weeks old) mice were randomly assigned to sham and 5/6 nephrectomy groups (5/6Nx). The 5/6Nx model was performed as previously described [23,24]. Briefly, mice were anaesthetised with isoflurane and oxygen. In the 5/6Nx group, a left 2/3 nephrectomy was firstly performed by cutting the upper and lower pole of the left kidney with iris scissors, followed by a total right nephrectomy 7 days later. The sham groups were similarly anaesthetised and kidneys exposed but not resected. All mice were assessed weekly for body weight and blood pressure using tail-cuff plethysmography (CODA machine, Kent Scientific Corporation, Connecticut, USA). Metabolic caging was performed at week 10 and mice were euthanised at week 12. Organs, plasma and urine were collected and stored at -80°C. The percentage of kidney excised was calculated by the following formula: % of removed kidney = weight of excised kidney (left excised kidney + right kidney) *100/ total weight (left excised kidney + left remnant kidney + right kidney).
4.3. Measurement of Renal Function
Plasma urea and creatinine, as well as urinary protein and creatinine were measured using the Siemens Atellica System (Institute of Clinical Pathology and Medical Research, Westmead Hospital, New South Wales, Australia).
4.4. Aorta and Kidney Histopathology
Formalin-fixed kidney and thoracic aorta were embedded in paraffin and cut into 4 μm sections for histology. Slides were deparaffinized in xylene and rehydrated in ethanol prior to staining. Following staining, slides were rehydrated in ethanol, cleared in xylene, cover slipped with mounting media and left to dry overnight prior to imaging.
Haematoxylin and eosin staining: slides were stained with Mayer’s haematoxylin for 3 minutes, Scott’s solution for 1 minute and counterstained with eosin for 2 minutes.
Picrosirius red staining (for collagen): slides were incubated in picrosirius red staining solution for 1 hour and washed in acidified water.
Verhoeff-Van Gieson staining (for elastic fibres): slides were incubated with Verhoeff staining solution for 25 minutes, rinsed in water then differentiated with 2% aqueous ferric chloride and counterstained with Van Gieson solution (POCD Scientific, Australia).
Von Kossa staining (for calcification): slides were incubated with 1% silver nitrate under UV light for 30 minutes, followed by 5% sodium thiosulfate for 5 minutes prior to counterstaining with nuclear fast red solution for 5 minutes.
4.5. Immunohistochemistry
Four (4) μm sections of formalin-fixed paraffin-embedded mouse thoracic aorta were incubated with rabbit anti-TSP1 antibody (15ug/ml, ab85762, Abcam). EnVision+ System-HRP Labelled Polymer anti-Rabbit secondary antibody (K4003, Dako) and ImmPACT NovaRED® Substrate Kit Peroxidase (HRP) (SK-4805, Dako) were used for immunodetection. Slides were counterstained with Mayer’s haematoxylin and Scott’s Blue solution.
4.6. Immunofluorescence
Cells were grown on glass bottom dishes (MatTek, Ashland, MA) and TSP1 (2.2 nM) was added for 24 hours [11]. Permeabilization was performed with PBS/10% BSA/0.1% Triton-X100 for 10 minutes at room temperature followed by blocking with 1% goat serum (Sigma-Aldrich) for 30 minutes. Cells were incubated in primary antibody (1:100 dilution) in blocking buffer in a humidified chamber at 4°C overnight. Cells were washed then incubated with AF488 secondary antibody (1:400 dilution, Invitrogen) for 1 hour. Nuclei were stained with DAPI. Cells were coverslipped with Gelvatol mounting media. Images were captured with an Olympus Fluoview 1000 confocal microscope (Olympus, Tokyo, Japan), and results calculated as the percentage of area stained using ImageJ (National Institutes for Health).
4.7. Slide Imaging and Analysis
Slides were scanned under brightfield conditions using Nanozoomer Slide scanner (Hamamatsu, Japan) and viewed on NDP.view2 (Hamamatsu, Japan). Image analysis was conducted using ImageJ. Medial, adventitial and total wall thickness was measured at 5 randomly selected locations and the average calculated. The percentage of medial and adventitial fibrosis was assessed by taking the average of picrosirius red staining of collagen in 5 randomly selected high-power fields at 80X magnification per specimen as per previously published methods [25].
4.8. Human Plasma Collection
Human plasma collection and study was performed under protocols approved by the Human Research Ethics Committee of Western Sydney Local Health District [LNR/12/WMEAD114 and LNRSSA/12/WMEAD/117(3503)]. Patients without intercurrent illness or acute kidney injury were recruited from outpatient clinics and provided written consent. Plasma samples were obtained from patients with estimated glomerular filtration rate (eGFR) >90ml/min/1.73m2 (control) and those with stage 5 CKD (eGFR <15ml/min). Blood was collected in EDTA tubes using a 23-guage needle and without a tourniquet. Tubes were placed immediately on ice then centrifuged at 2500 rpm for 15 minutes at 4°C without brake to generate platelet-poor plasma, which was stored at -80°C until use.
4.9. Cell Culture
Human aortic smooth muscle cells (hVSMCs) (CC-2571, Clonetics, Lonza) were cultured in SmBM™ basal medium (CC-3181, Lonza) supplemented with SmGM™-2 SingleQuots growth supplements (CC-4149, Lonza). Cells were subcultured according to manufacturer instructions. Cells were used at passages 3-6 when at ~70% confluency in 6-well plates. Serum-starved cells were treated with recombinant human TSP1 (0.2-10nM, Athens Research and Technology), IS (1-500 μM, I3875, Sigma Aldrich) or 5% human plasma for 24 hours. In some experiments, cells were pre-treated with anti-CD47 antibody (B6H12) (#14-0479-82, Thermo Fisher Scientific) for 30 minutes.
4.10. Cell Proliferation and Senescence Assays
Cells were seeded into a 96-well microplate (104 cells/well). Serum-starved cells were treated with human plasma, TSP1 or IS for 24 or 48 hours as indicated. In some experiments, cells were pre-treated with anti-CD47 antibody for 30 minutes. Cell proliferation and senescence were measured using XTT Cell Viability Kit (#9095, Cell Signaling) and Mammalian β-Galactosidase Assay Kit (75707, Thermo Fisher Scientific), respectively. Absorbance was measured using SpectraMax iD5 Plate Reader (Molecular Devices) at 450nm for cell proliferation and 405nm for cell senescence [23]. In additional experiments, cells were seeded onto 4-well glass slides (104 cells/slide) and stained using a senescence β-galactosidase staining kit (#9680, Cell Signalling Technology) as per manufacturer instructions. Mouse IgG1 kappa isotype control (17-4714-42, eBioscience) was used. Cells were examined under a bright-field microscope (Olympus CKX53, Evidence Scientific, Tokyo, Japan) and five random images were captured per slide for β-galactosidase-positive (blue) cells.
4.11. Western Blotting
Mouse thoracic aortic tissue or human aortic smooth muscle cells were homogenised in RIPA buffer (#9806, Cell Signaling) containing protease inhibitor cocktail (cOmpleteTM ULTRA Tablets 5892970001, Roche) and phosphatase inhibitor cocktail (PhosSTOPTM 4906845001, Roche). Protein concentration was measured using DC protein assay (Biorad) then resolved by sodium dodecyl sulfate polyacrylamide gel electrophoresis and transferred onto nitrocellulose membranes by Trans-Blot Turbo Transfer System (Biorad). Membranes were blocked with Intercept® Blocking Buffer (927-60001, LICORbio) and probed at 4°C overnight with the following primary antibodies: phospho-p44/42 MAPK (pERK1/2, #4370), p44/42 MAPK (ERK1/2, #9107), β-actin (#4970), vinculin (#13901), AhR (#83200), tumor protein p53 (p53) (#2524) and p27Kip1 (#3698) from Cell Signaling and TSP1 (ab85762) from Abcam. IRDye 800CW and 680RD secondary antibodies (LI-COR) were used and protein was visualised using Odyssey CLx Imaging System (LICORbio). Protein band intensity was measured using ImageJ and expressed relative to loading controls, vinculin or β-actin.
4.12. Statistical Analysis
Statistical analysis was performed using GraphPad Prism Version 10.2.3 (GraphPad Software Inc). Data are presented as mean ± SD. Unpaired t-test (2 comparator groups) or one-way or two-way analysis of variance with Tukey’s and Holm-Sidak post hoc test or Fishers Least Significant Difference test (>2 comparator groups) was used. A P-value less than 0.05 was considered statistically significant.
Supplementary Materials
The following supporting information can be downloaded at the website of this paper posted on Preprints.org. Figure S1. Effects of 5/6-Nx on blood pressure, mean arterial pressure and heart rate.
Author Contributions
SMJ and NMR conceived, designed and supervised the study. KT drafted the manuscript and figures. KT, SMJ and NMR wrote the manuscript. All authors take part in the experiments, data collection and formal data analysis. All authors revised and approved the manuscript.
Funding
This work was supported by National Health Medical Research Council grant (GNT2007991) to NMR, National Heart Foundation Vanguard Grant (#106035) to NMR/SMJ, and Westmead Medical Research Foundation grant to SMJ.
Institutional Review Board Statement
Animal studies were performed under approved protocols (Western Sydney Local Health District #4304, #4281 and University of Sydney #1594, #2022/2028) and in accordance with the Australian code for the care and use of animals for scientific purposes (National Health and Medical Research Council).
Informed Consent Statement
Human plasma collection and study was performed under protocols approved by the Human Research Ethics Committee of Western Sydney Local Health District [LNR/12/WMEAD114 and LNRSSA/12/WMEAD/117(3503)]. Patients without intercurrent illness or acute kidney injury were recruited from outpatient clinics and provided written consent.
Data Availability Statement
All data associated with this study are present in the paper or online supplemental materials. Data supporting the findings of this study are available from the corresponding authors on reasonable request.
Acknowledgments
We appreciate the facilities, resources and professional assistance provided by the Westmead Institute for Medical Research Histology and Cell Imaging Facilities. We thank Jessica Zhang (Summer Scholar) and Harris Jabbour (Honours Student) (Westmead Institute for Medical Research) for taking part in the experiments.
Conflicts of Interest
The authors declare no conflict of interest.
Abbreviations
The following abbreviations are used in this manuscript:
| ⍺CD47 | Anti-CD47 antibody |
| Hvsmc | Human Aortic Vascular Smooth Muscle Cells |
| IS | Indoxyl Sulfate |
| TSP1 | Thrombospondin 1 |
| CKD | Chronic Kidney Disease |
| AhR | Aryl Hydrocarbon Receptor |
| 5/6Nx | 5/6-Nephrectomy; |
| Cr | Creatinine |
| PCR | Protein to Creatinine Ratio |
| WT | Wild-Type |
| pERK | Phosphorylated Extracellular Regulated Kinase |
References
- Tyralla, K.; Amann, K. Morphology of the heart and arteries in renal failure. Kidney Int. 2003, 63, S80–S83. [Google Scholar] [CrossRef] [PubMed]
- Brunet, P.; Gondouin, B.; Duval-Sabatier, A.; Dou, L.; Cerini, C.; Dignat-George, F.; Jourde-Chiche, N.; Argiles, A.; Burtey, S. Does Uremia Cause Vascular Dysfunction. Kidney Blood Press. Res. 2011, 34, 284–290. [Google Scholar] [CrossRef]
- Cheung, A.K.; Sarnak, M.J.; Yan, G.; Dwyer, J.T.; Heyka, R.J.; Rocco, M.V.; Teehan, B.P.; Levey, A.S. Atherosclerotic cardiovascular disease risks in chronic hemodialysis patients. Kidney Int. 2000, 58, 353–362. [Google Scholar] [CrossRef] [PubMed]
- Barreto, F.C.; Barreto, D.V.; Liabeuf, S.; Meert, N.; Glorieux, G.; Temmar, M.; Choukroun, G.; Vanholder, R.; Massy, Z.A.; European Uremic Toxin Work Group (EUTox). Serum indoxyl sulfate is associated with vascular disease and mortality in chronic kidney disease patients. Clin. J. Am. Soc. Nephrol. 2009, 4, 1551–1558. [Google Scholar] [CrossRef]
- Muteliefu, G.; Enomoto, A.; Niwa, T. Indoxyl Sulfate Promotes Proliferation of Human Aortic Smooth Muscle Cells by Inducing Oxidative Stress. J. Ren. Nutr. 2009, 19, 29–32. [Google Scholar] [CrossRef] [PubMed]
- Mozar, A.; Louvet, L.; Morlière, P.; Godin, C.; Boudot, C.; Kamel, S.; Drüeke, T.B.; A Massy, Z. Uremic Toxin Indoxyl Sulfate Inhibits Human Vascular Smooth Muscle Cell Proliferation. Ther. Apher. Dial. 2011, 15, 135–139. [Google Scholar] [CrossRef]
- Muteliefu, G.; Shimizu, H.; Enomoto, A.; Nishijima, F.; Takahashi, M.; Niwa, T. Indoxyl sulfate promotes vascular smooth muscle cell senescence with upregulation of p53, p21, and prelamin A through oxidative stress. Am. J. Physiol. Physiol. 2012, 303, C126–C134. [Google Scholar] [CrossRef]
- Shimizu, H.; Hirose, Y.; Goto, S.; Nishijima, F.; Zrelli, H.; Zghonda, N.; Niwa, T.; Miyazaki, H. Indoxyl sulfate enhances angiotensin II signaling through upregulation of epidermal growth factor receptor expression in vascular smooth muscle cells. Life Sci. 2012, 91, 172–177. [Google Scholar] [CrossRef]
- Li, X.; Lu, Z.; Zhou, F.; Jin, W.; Yang, Y.; Chen, S.; Xie, Z.; Zhao, Y. Indoxyl sulfate promotes the atherosclerosis through up-regulating the miR-34a expression in endothelial cells and vascular smooth muscle cells in vitro. Vasc. Pharmacol. 2020, 131, 106763. [Google Scholar] [CrossRef]
- Rogers, N.M.; Sharifi-Sanjani, M.; Csányi, G.; Pagano, P.J.; Isenberg, J.S. Thrombospondin-1 and CD47 regulation of cardiac, pulmonary and vascular responses in health and disease. Matrix Biol. 2014, 37, 92–101. [Google Scholar] [CrossRef]
- Julovi, S.M.; Sanganeria, B.; Minhas, N.; Ghimire, K.; Nankivell, B.; Rogers, N.M. Blocking thrombospondin-1 signaling via CD47 mitigates renal interstitial fibrosis. Mod. Pathol. 2020, 100, 1184–1196. [Google Scholar] [CrossRef]
- Huang, C.-L.; Jong, Y.-S.; Wu, Y.-W.; Wang, W.-J.; Hsieh, A.-R.; Chao, C.-L.; Chen, W.-J.; Yang, W.-S. Association of Plasma Thrombospondin-1 Level with Cardiovascular Disease and Mortality in Hemodialysis Patients. 2015, 31, 113–119. [CrossRef]
- RAUGI, G.; MULLEN, J.; BARK, D.; OKADA, T.; MAYBERG, M. THROMBOSPONDIN DEPOSITION IN RAT CAROTID-ARTERY INJURY. 1990, 137, 179–185.
- Kim, C.W.; Pokutta-Paskaleva, A.; Kumar, S.; Timmins, L.H.; Morris, A.D.; Kang, D.-W.; Dalal, S.; Chadid, T.; Kuo, K.M.; Raykin, J.; et al. Disturbed Flow Promotes Arterial Stiffening Through Thrombospondin-1. Circulation 2017, 136, 1217–1232. [Google Scholar] [CrossRef]
- Favier, J.; Germain, S.; Emmerich, J.; Corvol, P.; Gasc, J.-M. Critical overexpression of thrombospondin 1 in chronic leg ischaemia. J. Pathol. 2005, 207, 358–366. [Google Scholar] [CrossRef]
- Stenina, O.I.; Krukovets, I.; Wang, K.; Zhou, Z.; Forudi, F.; Penn, M.S.; Topol, E.J.; Plow, E.F. Increased Expression of Thrombospondin-1 in Vessel Wall of Diabetic Zucker Rat. Circulation 2003, 107, 3209–3215. [Google Scholar] [CrossRef] [PubMed]
- Julovi, S.M.; Trinh, K.; Robertson, H.; Xu, C.; Minhas, N.; Viswanathan, S.; Patrick, E.; Horowitz, J.D.; Meijles, D.N.; Rogers, N.M. Thrombospondin-1 Drives Cardiac Remodeling in Chronic Kidney Disease. JACC: Basic Transl. Sci. 2024, 9, 607–627. [Google Scholar] [CrossRef]
- Roberts, D.D.; Miller, T.W.; Rogers, N.M.; Yao, M.; Isenberg, J.S. The matricellular protein thrombospondin-1 globally regulates cardiovascular function and responses to stress via CD47. Matrix Biol. 2012, 31, 162–169. [Google Scholar] [CrossRef]
- Kale, A.; Rogers, N.M.; Ghimire, K. Thrombospondin-1 CD47 Signalling: From Mechanisms to Medicine. Int. J. Mol. Sci. 2021, 22, 4062. [Google Scholar] [CrossRef]
- Csányi, G.; Yao, M.; Rodríguez, A.I.; Al Ghouleh, I.; Sharifi-Sanjani, M.; Frazziano, G.; Huang, X.; Kelley, E.E.; Isenberg, J.S.; Pagano, P.J. Thrombospondin-1 Regulates Blood Flow via CD47 Receptor–Mediated Activation of NADPH Oxidase 1. Arter. Thromb. Vasc. Biol. 2012, 32, 2966–2973. [Google Scholar] [CrossRef]
- Rogers, N.M.; Sharifi-Sanjani, M.; Yao, M.; Ghimire, K.; Bienes-Martinez, R.; Mutchler, S.M.; Knupp, H.E.; Baust, J.; Novelli, E.M.; Ross, M.; et al. TSP1–CD47 signaling is upregulated in clinical pulmonary hypertension and contributes to pulmonary arterial vasculopathy and dysfunction. Cardiovasc. Res. 2017, 113, 15–29. [Google Scholar] [CrossRef] [PubMed]
- Bauer, P.M.; Bauer, E.M.; Rogers, N.M.; Yao, M.; Feijoo-Cuaresma, M.; Pilewski, J.M.; Champion, H.C.; Zuckerbraun, B.S.; Calzada, M.J.; Isenberg, J.S. Activated CD47 promotes pulmonary arterial hypertension through targeting caveolin-1. Cardiovasc. Res. 2012, 93, 682–693. [Google Scholar] [CrossRef] [PubMed]
- Julovi, S.M.; Trinh, K.; Robertson, H.; Xu, C.; Minhas, N.; Viswanathan, S.; Patrick, E.; Horowitz, J.D.; Meijles, D.N.; Rogers, N.M. Thrombospondin-1 Drives Cardiac Remodeling in Chronic Kidney Disease. JACC: Basic Transl. Sci. 2024, 9, 607–627. [Google Scholar] [CrossRef]
- Julovi, S.M.; Dao, A.; Trinh, K.; O’dOnohue, A.K.; Shu, C.; Smith, S.; Shingde, M.; Schindeler, A.; Rogers, N.M.; Little, C.B. Disease-modifying interactions between chronic kidney disease and osteoarthritis: a new comorbid mouse model. RMD Open 2023, 9, e003109. [Google Scholar] [CrossRef]
- Jensen, E.C. Quantitative Analysis of Histological Staining and Fluorescence Using ImageJ. Anat. Rec. Adv. Integr. Anat. Evol. Biol. 2013, 296, 378–381. [Google Scholar] [CrossRef]
- Lin, C.-J.; Chen, H.-H.; Pan, C.-F.; Chuang, C.-K.; Wang, T.-J.; Sun, F.-J.; Wu, C.-J. p-cresylsulfate and indoxyl sulfate level at different stages of chronic kidney disease. J. Clin. Lab. Anal. 2011, 25, 191–197. [Google Scholar] [CrossRef]
- Foudi, N.; Palayer, M.; Briet, M.; Garnier, A.-S. Arterial Remodelling in Chronic Kidney Disease: Impact of Uraemic Toxins and New Pharmacological Approaches. J. Clin. Med. 2021, 10, 3803. [Google Scholar] [CrossRef]
- Chi, C.; Li, D.-J.; Jiang, Y.-J.; Tong, J.; Fu, H.; Wu, Y.-H.; Shen, F.-M. Vascular smooth muscle cell senescence and age-related diseases: State of the art. Biochim. et Biophys. Acta (BBA) - Mol. Basis Dis. 2019, 1865, 1810–1821. [Google Scholar] [CrossRef]
- Nguyen, C.; Edgley, A.J.; Kelly, D.J.; Kompa, A.R. Aryl Hydrocarbon Receptor Inhibition Restores Indoxyl Sulfate-Mediated Endothelial Dysfunction in Rat Aortic Rings. Toxins 2022, 14, 100. [Google Scholar] [CrossRef] [PubMed]
- Sallée, M.; Dou, L.; Cerini, C.; Poitevin, S.; Brunet, P.; Burtey, S. The Aryl Hydrocarbon Receptor-Activating Effect of Uremic Toxins from Tryptophan Metabolism: A New Concept to Understand Cardiovascular Complications of Chronic Kidney Disease. Toxins 2014, 6, 934–949. [Google Scholar] [CrossRef] [PubMed]
- Rogers, N.M.; Thomson, A.W.; Isenberg, J.S. Activation of Parenchymal CD47 Promotes Renal Ischemia-Reperfusion Injury. J. Am. Soc. Nephrol. 2012, 23, 1538–1550. [Google Scholar] [CrossRef]
- Dabir, P.; Marinic, T. E.; Krukovets, I.; Stenina, O. I. , Aryl hydrocarbon receptor is activated by glucose and regulates the thrombospondin-1 gene promoter in endothelial cells. Circ Res 2008, 102, (12), 1558–1565. [Google Scholar] [CrossRef] [PubMed]
- Tan, Z.; Chang, X.; Puga, A.; Xia, Y. Activation of mitogen-activated protein kinases (MAPKs) by aromatic hydrocarbons: role in the regulation of aryl hydrocarbon receptor (AHR) function. Biochem. Pharmacol. 2002, 64, 771–780. [Google Scholar] [CrossRef]
- Zhang, W.; Liu, H.T. MAPK signal pathways in the regulation of cell proliferation in mammalian cells. Cell Res. 2002, 12, 9–18. [Google Scholar] [CrossRef]
- Gennaro, G.; MénArd, C.; Michaud, S.-E.; Deblois, D.; Rivard, A. Inhibition of Vascular Smooth Muscle Cell Proliferation and Neointimal Formation in Injured Arteries by a Novel, Oral Mitogen-Activated Protein Kinase/Extracellular Signal–Regulated Kinase Inhibitor. Circulation 2004, 110, 3367–3371. [Google Scholar] [CrossRef] [PubMed]
- Suwanabol, P.A.; Seedial, S.M.; Shi, X.; Zhang, F.; Yamanouchi, D.; Roenneburg, D.; Liu, B.; Kent, K.C. Transforming growth factor-β increases vascular smooth muscle cell proliferation through the Smad3 and extracellular signal-regulated kinase mitogen-activated protein kinases pathways. J. Vasc. Surg. 2012, 56, 446–454.e1. [Google Scholar] [CrossRef]
- Tanriover, C.; Copur, S.; Mutlu, A.; Peltek, I.B.; Galassi, A.; Ciceri, P.; Cozzolino, M.; Kanbay, M. Early aging and premature vascular aging in chronic kidney disease. Clin. Kidney J. 2023, 16, 1751–1765. [Google Scholar] [CrossRef]
- Herzog, M.J.; Müller, P.; Lechner, K.; Stiebler, M.; Arndt, P.; Kunz, M.; Ahrens, D.; Schmeißer, A.; Schreiber, S.; Braun-Dullaeus, R.C. Arterial stiffness and vascular aging: mechanisms, prevention, and therapy. Signal Transduct. Target. Ther. 2025, 10, 1–33. [Google Scholar] [CrossRef] [PubMed]
- E Sweeney, S.; Firestein, G.S. Mitogen activated protein kinase inhibitors: where are we now and where are we going? Ann. Rheum. Dis. 2006, 65, iii83–iii88. [Google Scholar] [CrossRef] [PubMed]
- Woods, D.; Parry, D.; Cherwinski, H.; Bosch, E.; Lees, E.; McMahon, M. Raf-Induced Proliferation or Cell Cycle Arrest Is Determined by the Level of Raf Activity with Arrest Mediated by p21Cip1. Mol. Cell. Biol. 1997, 17, 5598–5611. [Google Scholar] [CrossRef]
- Julovi, S.M.; Shen, K.; McKelvey, K.; Minhas, N.; March, L.; Jackson, C.J. Activated Protein C Inhibits Proliferation and Tumor Necrosis Factor α-Stimulated Activation of p38, c-Jun NH2-Terminal Kinase (JNK) and Akt in Rheumatoid Synovial Fibroblasts. Mol. Med. 2013, 19, 324–331. [Google Scholar] [CrossRef]
- Lev-Ran, A.H.; Seger, R. Retention of ERK in the cytoplasm mediates the pluripotency of embryonic stem cells. Stem Cell Rep. 2022, 18, 305–318. [Google Scholar] [CrossRef]
- Plotnikov, A.; Chuderland, D.; Karamansha, Y.; Livnah, O.; Seger, R. Nuclear ERK Translocation is Mediated by Protein Kinase CK2 and Accelerated by Autophosphorylation. Cell. Physiol. Biochem. 2019, 53, 366–387. [Google Scholar] [CrossRef]
- Ito, S.; Osaka, M.; Higuchi, Y.; Nishijima, F.; Ishii, H.; Yoshida, M. Indoxyl Sulfate Induces Leukocyte-Endothelial Interactions through Up-regulation of E-selectin. J. Biol. Chem. 2010, 285, 38869–38875. [Google Scholar] [CrossRef]
- Wakamatsu, T.; Yamamoto, S.; Ito, T.; Sato, Y.; Matsuo, K.; Takahashi, Y.; Kaneko, Y.; Goto, S.; Kazama, J.J.; Gejyo, F.; et al. Indoxyl Sulfate Promotes Macrophage IL-1β Production by Activating Aryl Hydrocarbon Receptor/NF-κ/MAPK Cascades, but the NLRP3 inflammasome Was Not Activated. Toxins 2018, 10, 124. [Google Scholar] [CrossRef] [PubMed]
- Shimizu, H.; Bolati, D.; Higashiyama, Y.; Nishijima, F.; Shimizu, K.; Niwa, T. Indoxyl sulfate upregulates renal expression of MCP-1 via production of ROS and activation of NF-κB, p53, ERK, and JNK in proximal tubular cells. Life Sci. 2012, 90, 525–530. [Google Scholar] [CrossRef] [PubMed]
- Yamamoto, H.; Tsuruoka, S.; Ioka, T.; Ando, H.; Ito, C.; Akimoto, T.; Fujimura, A.; Asano, Y.; Kusano, E. Indoxyl sulfate stimulates proliferation of rat vascular smooth muscle cells. Kidney Int. 2006, 69, 1780–1785. [Google Scholar] [CrossRef]
- Liu, W.-C.; Shyu, J.-F.; Lin, Y.-F.; Chiu, H.-W.; Lim, P.S.; Lu, C.-L.; Zheng, C.-M.; Hou, Y.-C.; Chen, P.-H.; Lu, K.-C. Resveratrol Rescue Indoxyl Sulfate-Induced Deterioration of Osteoblastogenesis via the Aryl Hydrocarbon Receptor /MAPK Pathway. Int. J. Mol. Sci. 2020, 21, 7483. [Google Scholar] [CrossRef] [PubMed]
Figure 1.
Exogenous TSP1, indoxyl sulfate and CKD patient plasma promote endogenous TSP1 expression in VSMC. hVSMC were treated with (A) TSP1 (0, 0.2, 2.2, 5 and 10nM) (n=3-4), (B) IS (0, 1, 10, 100 and 500µM) (n=3) or (C) 5% human plasma from patients with or without CKD (n=3-5) for 24h. Whole cell lysates were probed for TSP1. All data shown are mean ± SD. Representative Western blots and combined densitometry relative to β-actin or vinculin are shown. *P<0.05 and **P<0.01 by one-way analysis of variance with Sidak’s post-hoc test (A), Fishers Least Significant Difference Test (B) or Tukey’s post-hoc test (C). Abbreviations: CKD, chronic kidney disease; CTL, control; hVSMC, human aortic vascular smooth muscle cells; IS, indoxyl sulfate; TSP1, thrombospondin 1.
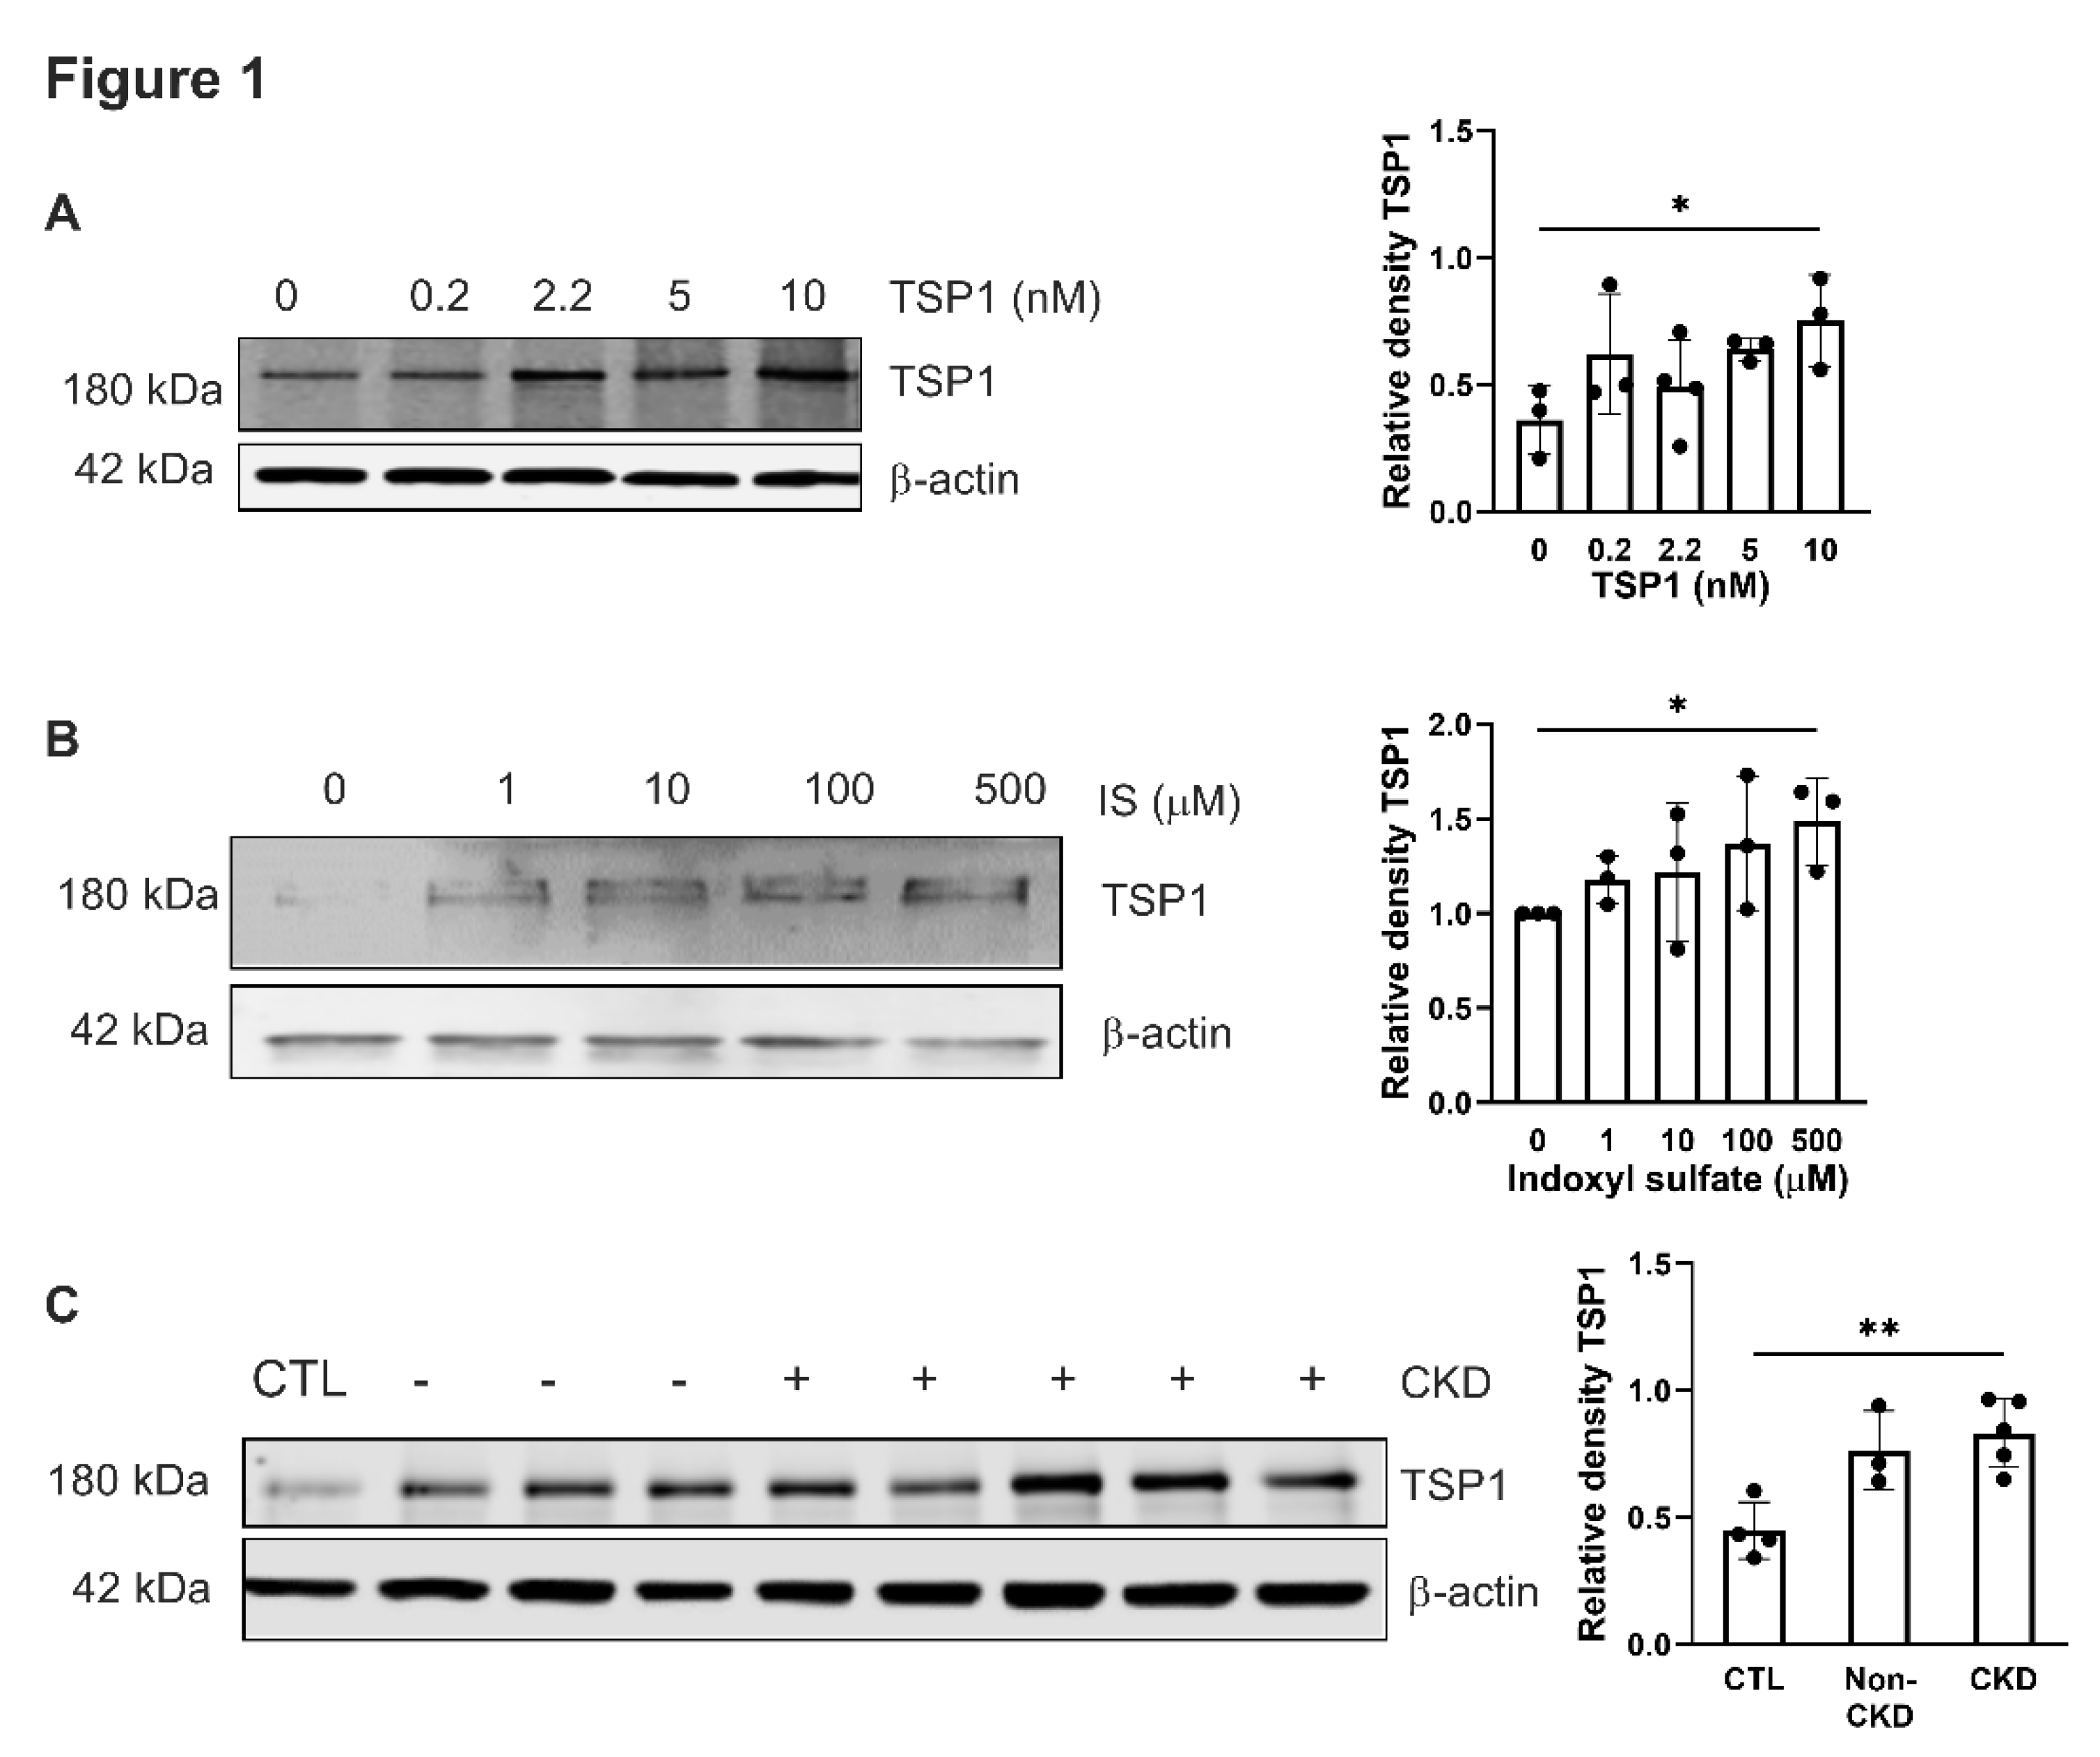
Figure 2.
TSP1and indoxyl sulfate limits VSMC proliferation via CD47. hVSMC cell viability was measured by assessing reduction of tetrazolium salt sodium 3’- [1- [(phenylamino)-carbonyl]-3,4-tetrazolium]-bis(4-methoxy-6- nitro)benzene-sulfonic acid hydrate (XTT) and measuring absorbance at 450nm in cells after 48h treatment with (A) TSP1 (0, 0.2, 2.2, 5, 10nM) (n=4), (B) TSP1 2.2nM ± pre-treatment with anti-CD47 antibody for 30 minutes (n=6), (C) IS (0, 1, 10, 100, 500µM) (n=4) or (D) IS (100, 500µM) ± pre-treatment with anti-CD47 antibody for 30 minutes (n=4-8) (D). All data shown are mean ± SD. *P<0.05, **P<0.01 and ****P<0.0001 by one-way analysis of variance with Tukey’s post-hoc test (A, C) or Fishers Least Significant Difference test (B, D). Abbreviations: ⍺CD47, anti-CD47 antibody; hVSMC, human aortic vascular smooth muscle cells; IS, indoxyl sulfate; TSP1, thrombospondin 1.
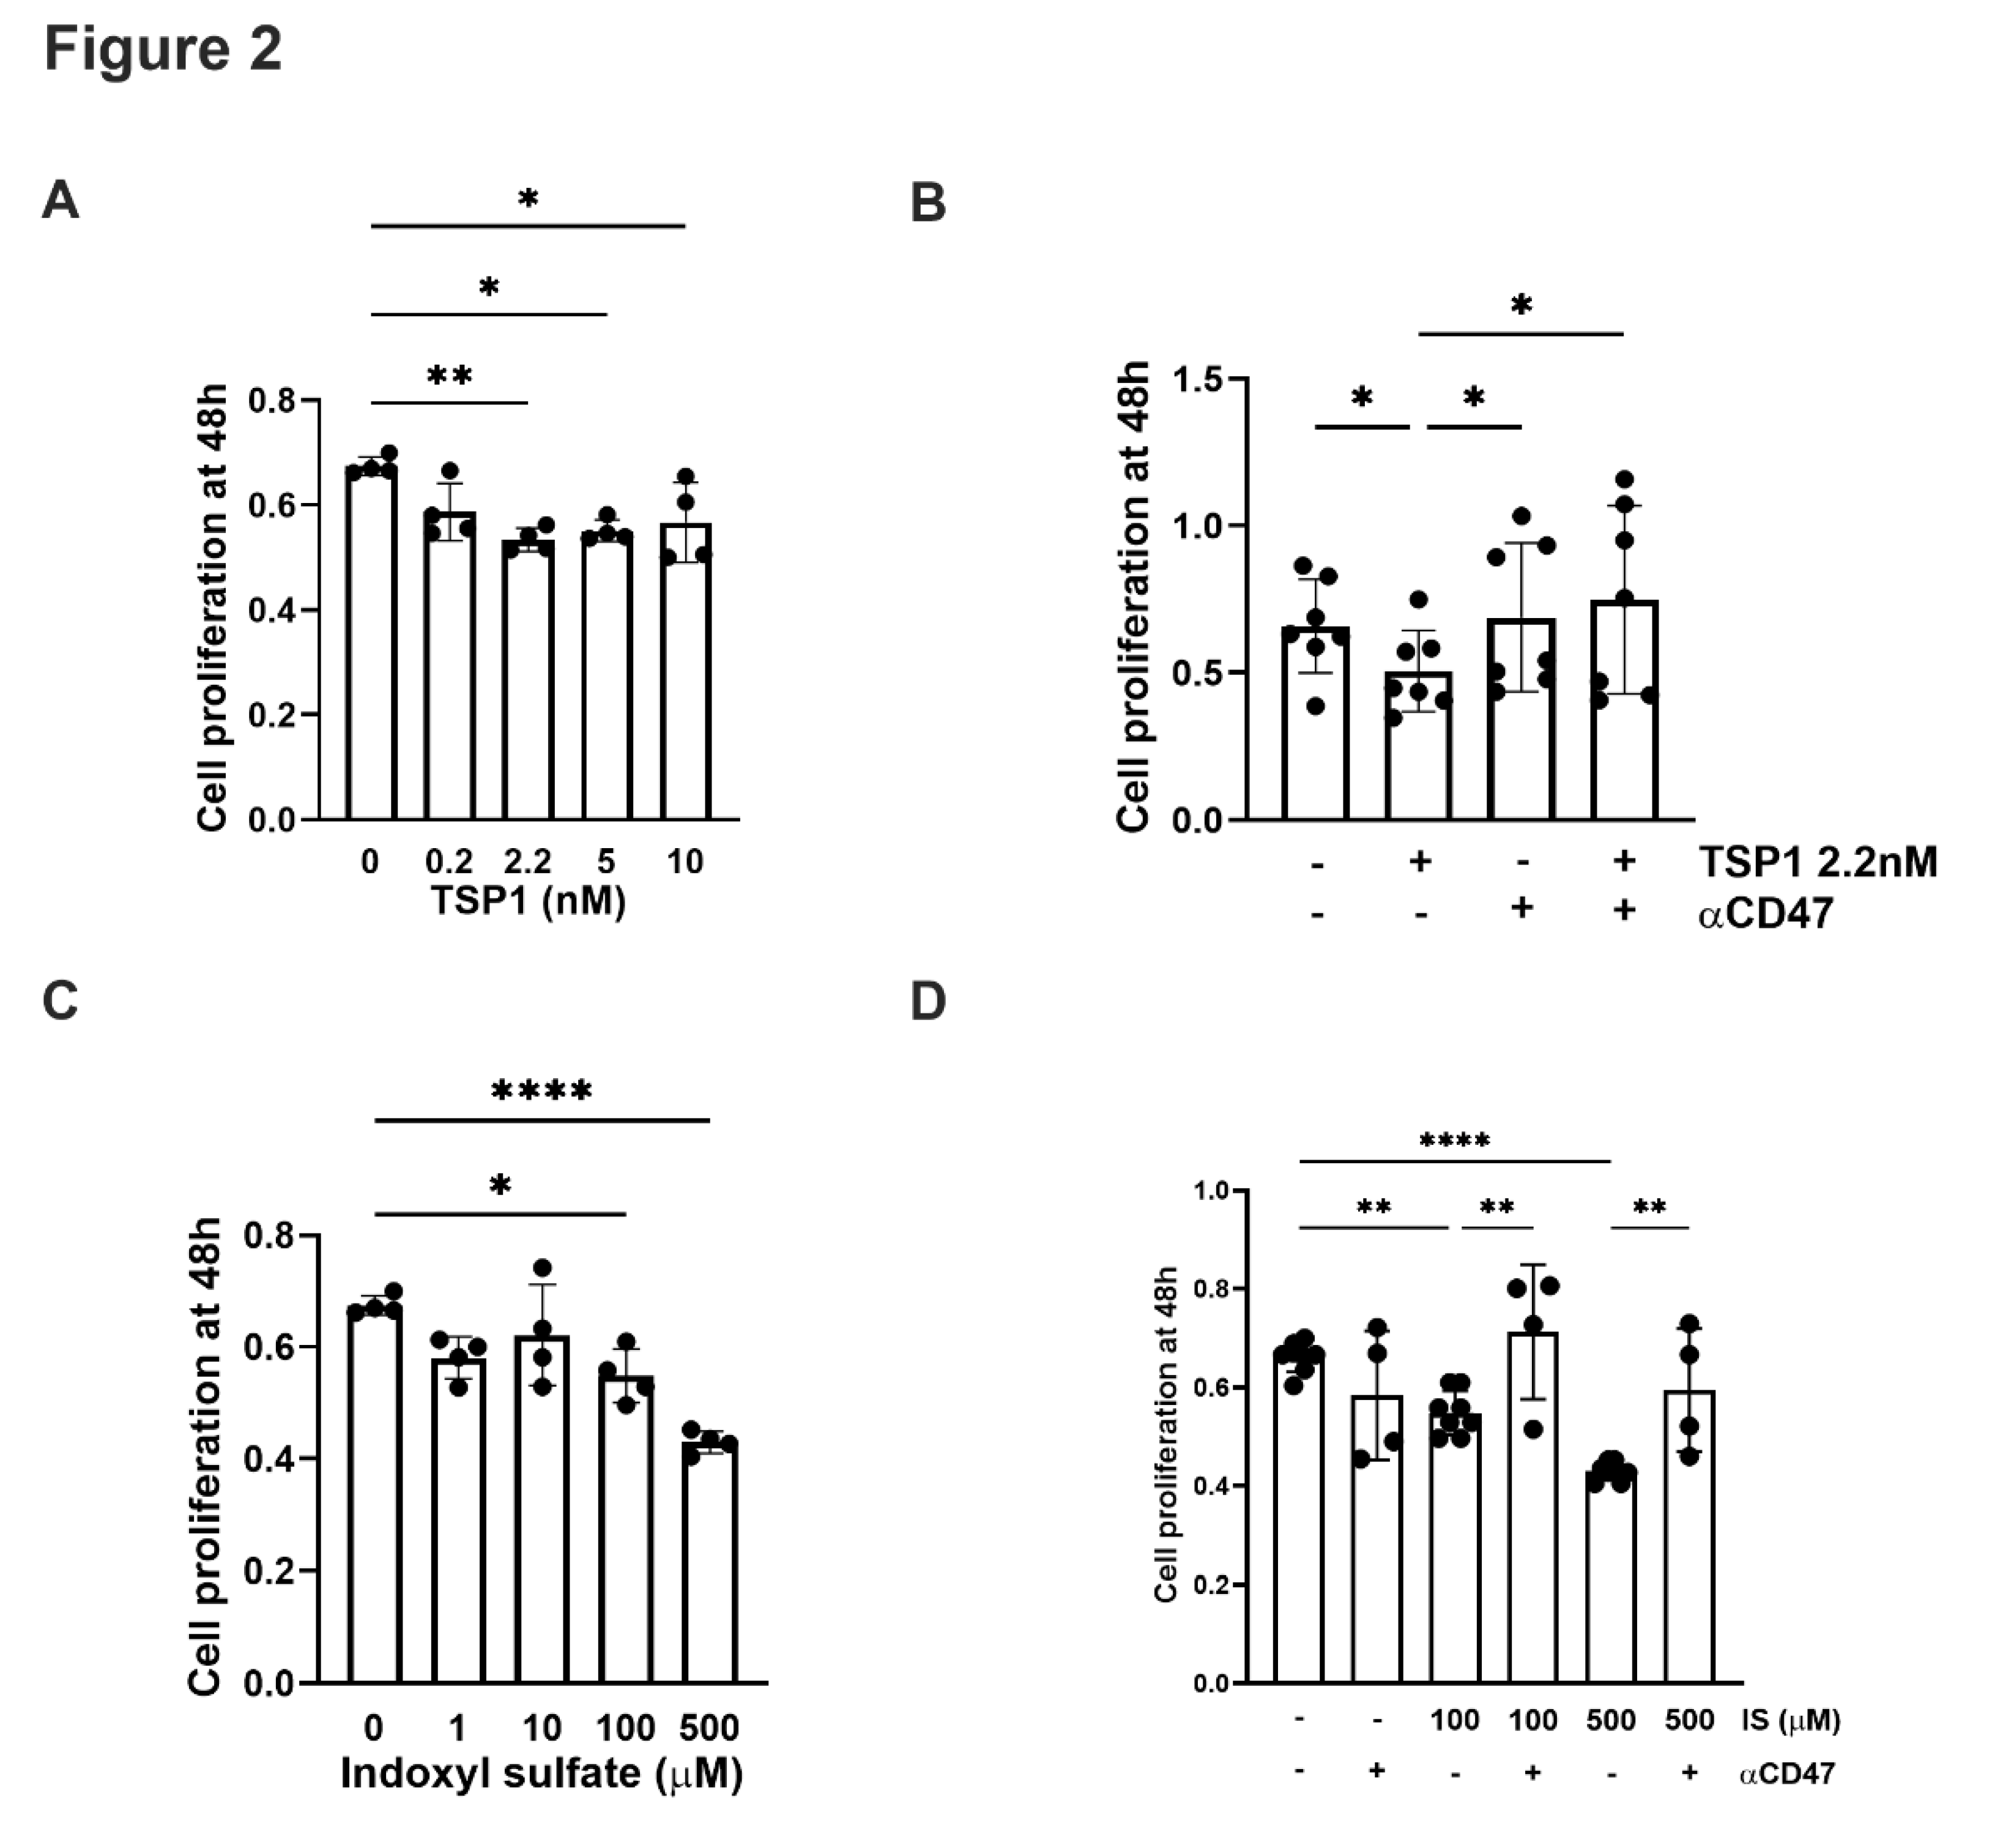
Figure 3.
TSP1 and indoxyl sulfate changes VSMC senescence via CD47. hVSMC senescence-associated β-galactosidase activity after 48h treatment with (A) IS (0, 1, 10, 100, 500µM) (n=4), (B) IS (10, 100µM) ± pre-treatment with anti-CD47 antibody for 30 minutes, (C) TSP1 (0, 0.2, 2.2, 5, 10nM) (n=4-7), or (D) TSP1 2.2nM ± pre-treatment with anti-CD47 antibody for 30 minutes (n=4). Senescence-associated β-galactosidase staining of hVSMC following incubation with basal media (CTL), IS 10µM (± pre-treatment with anti-CD47 antibody for 30 minutes), TSP1 2.2nM (± pre-treatment with anti-CD47 antibody for 30 minutes) and IgG isotype control antibody (n=3). All data shown are mean ± SD. *P<0.05, and **P<0.01 by one-way analysis of variance with Fishers Least Significant Difference test (A, C, E), Sidak’s post-hoc test (B) or Dunn’s post-hoc test (D). Abbreviations: ⍺CD47Ab, anti-CD47 antibody; CTL, control; hVSMC, human aortic vascular smooth muscle cells; IS, indoxyl sulfate; TSP1, thrombospondin 1.
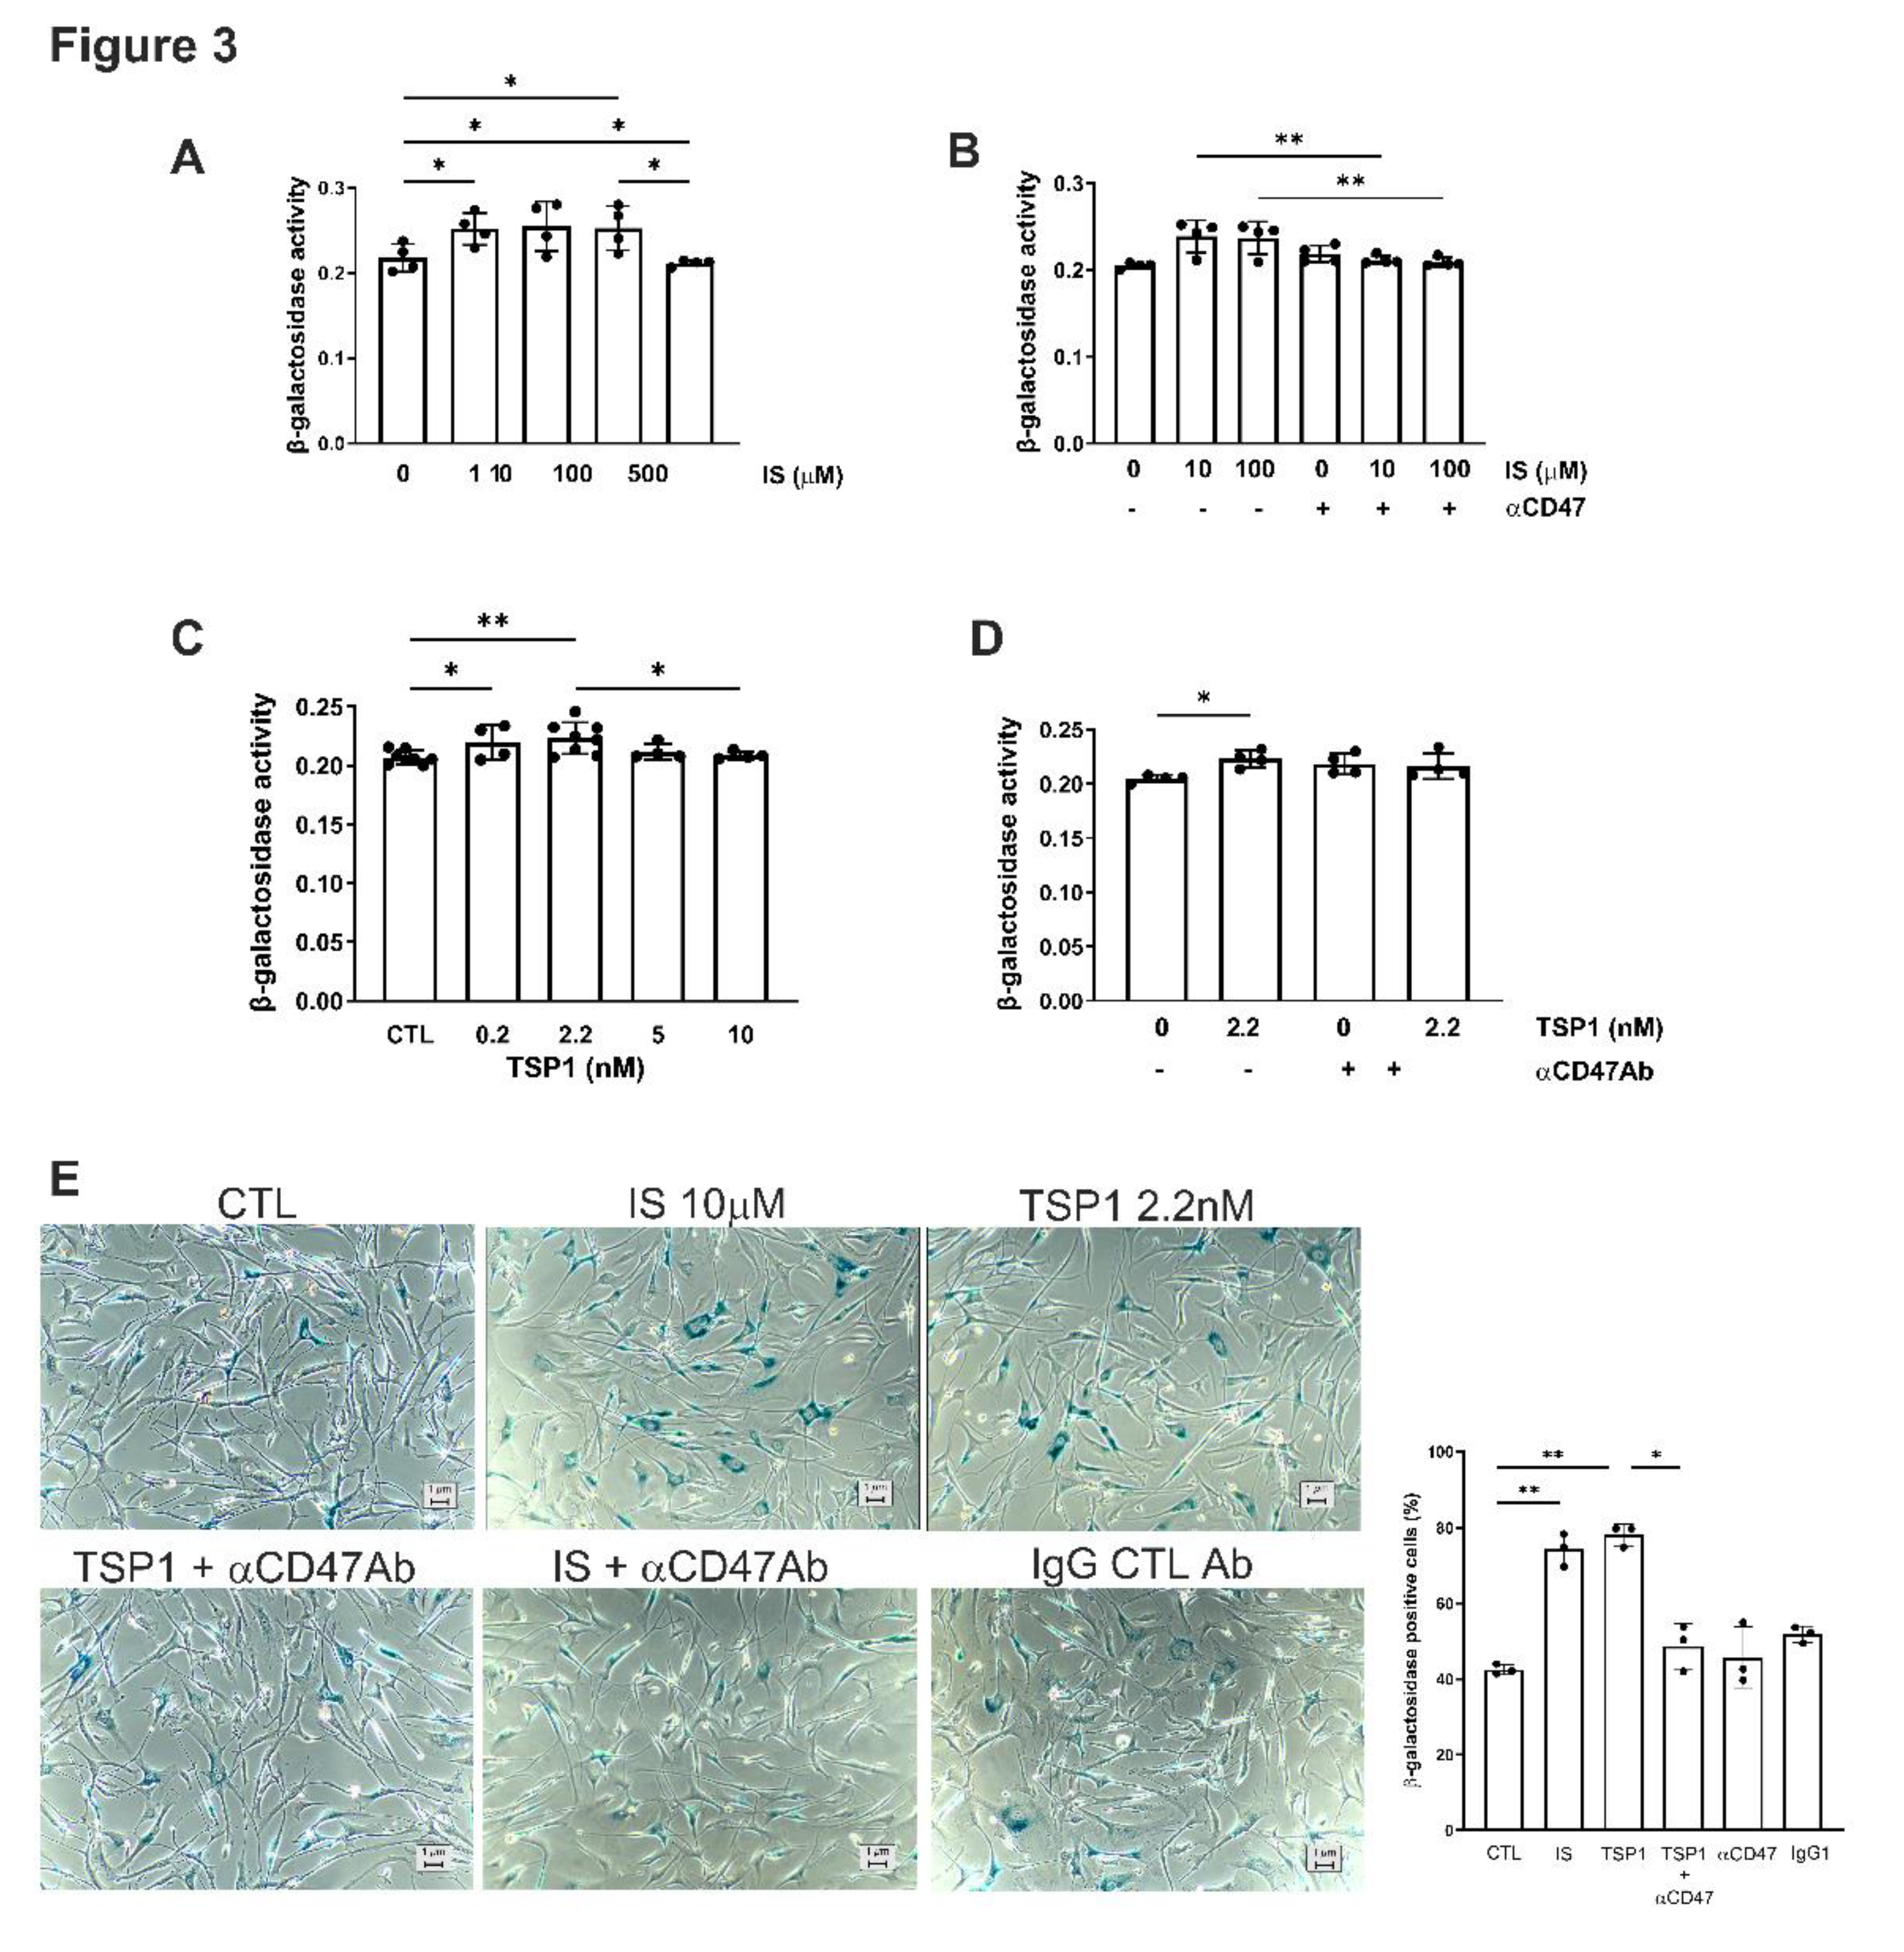
Figure 4.
TSP1 activates AhR in VSMC via CD47. hVSMC were treated with (A) IS (0, 1, 10, 100, 500µM) (n=3-4) or (B) 5% human plasma from patients with or without CKD (n=3-5) for 24h. Whole cell lysates were probed for AhR. Representative Western blots and combined densitometry relative to β-actin or vinculin are shown. (C) hVSMC treated with TSP1 2.2nM were stained for AhR (green) and 4’,6-diamidino-2-phenylindole (blue) (Magnification=40x, Scale bar=80 pixels). Percentage and intensity of cytoplasmic and nuclear staining was measured (n=7-8). All data shown are mean ± SD. *P<0.05 and **P<0.01 by one-way analysis of variance with Tukey’s post-hoc test (A, B) or Fishers Least Significant Test (D) and unpaired Student’s t-test (C). Abbreviations: AhR, aryl hydrocarbon receptor; CKD, chronic kidney disease; hVSMC, human aortic vascular smooth muscle cells; IS, indoxyl sulfate; TSP1, thrombospondin-1.
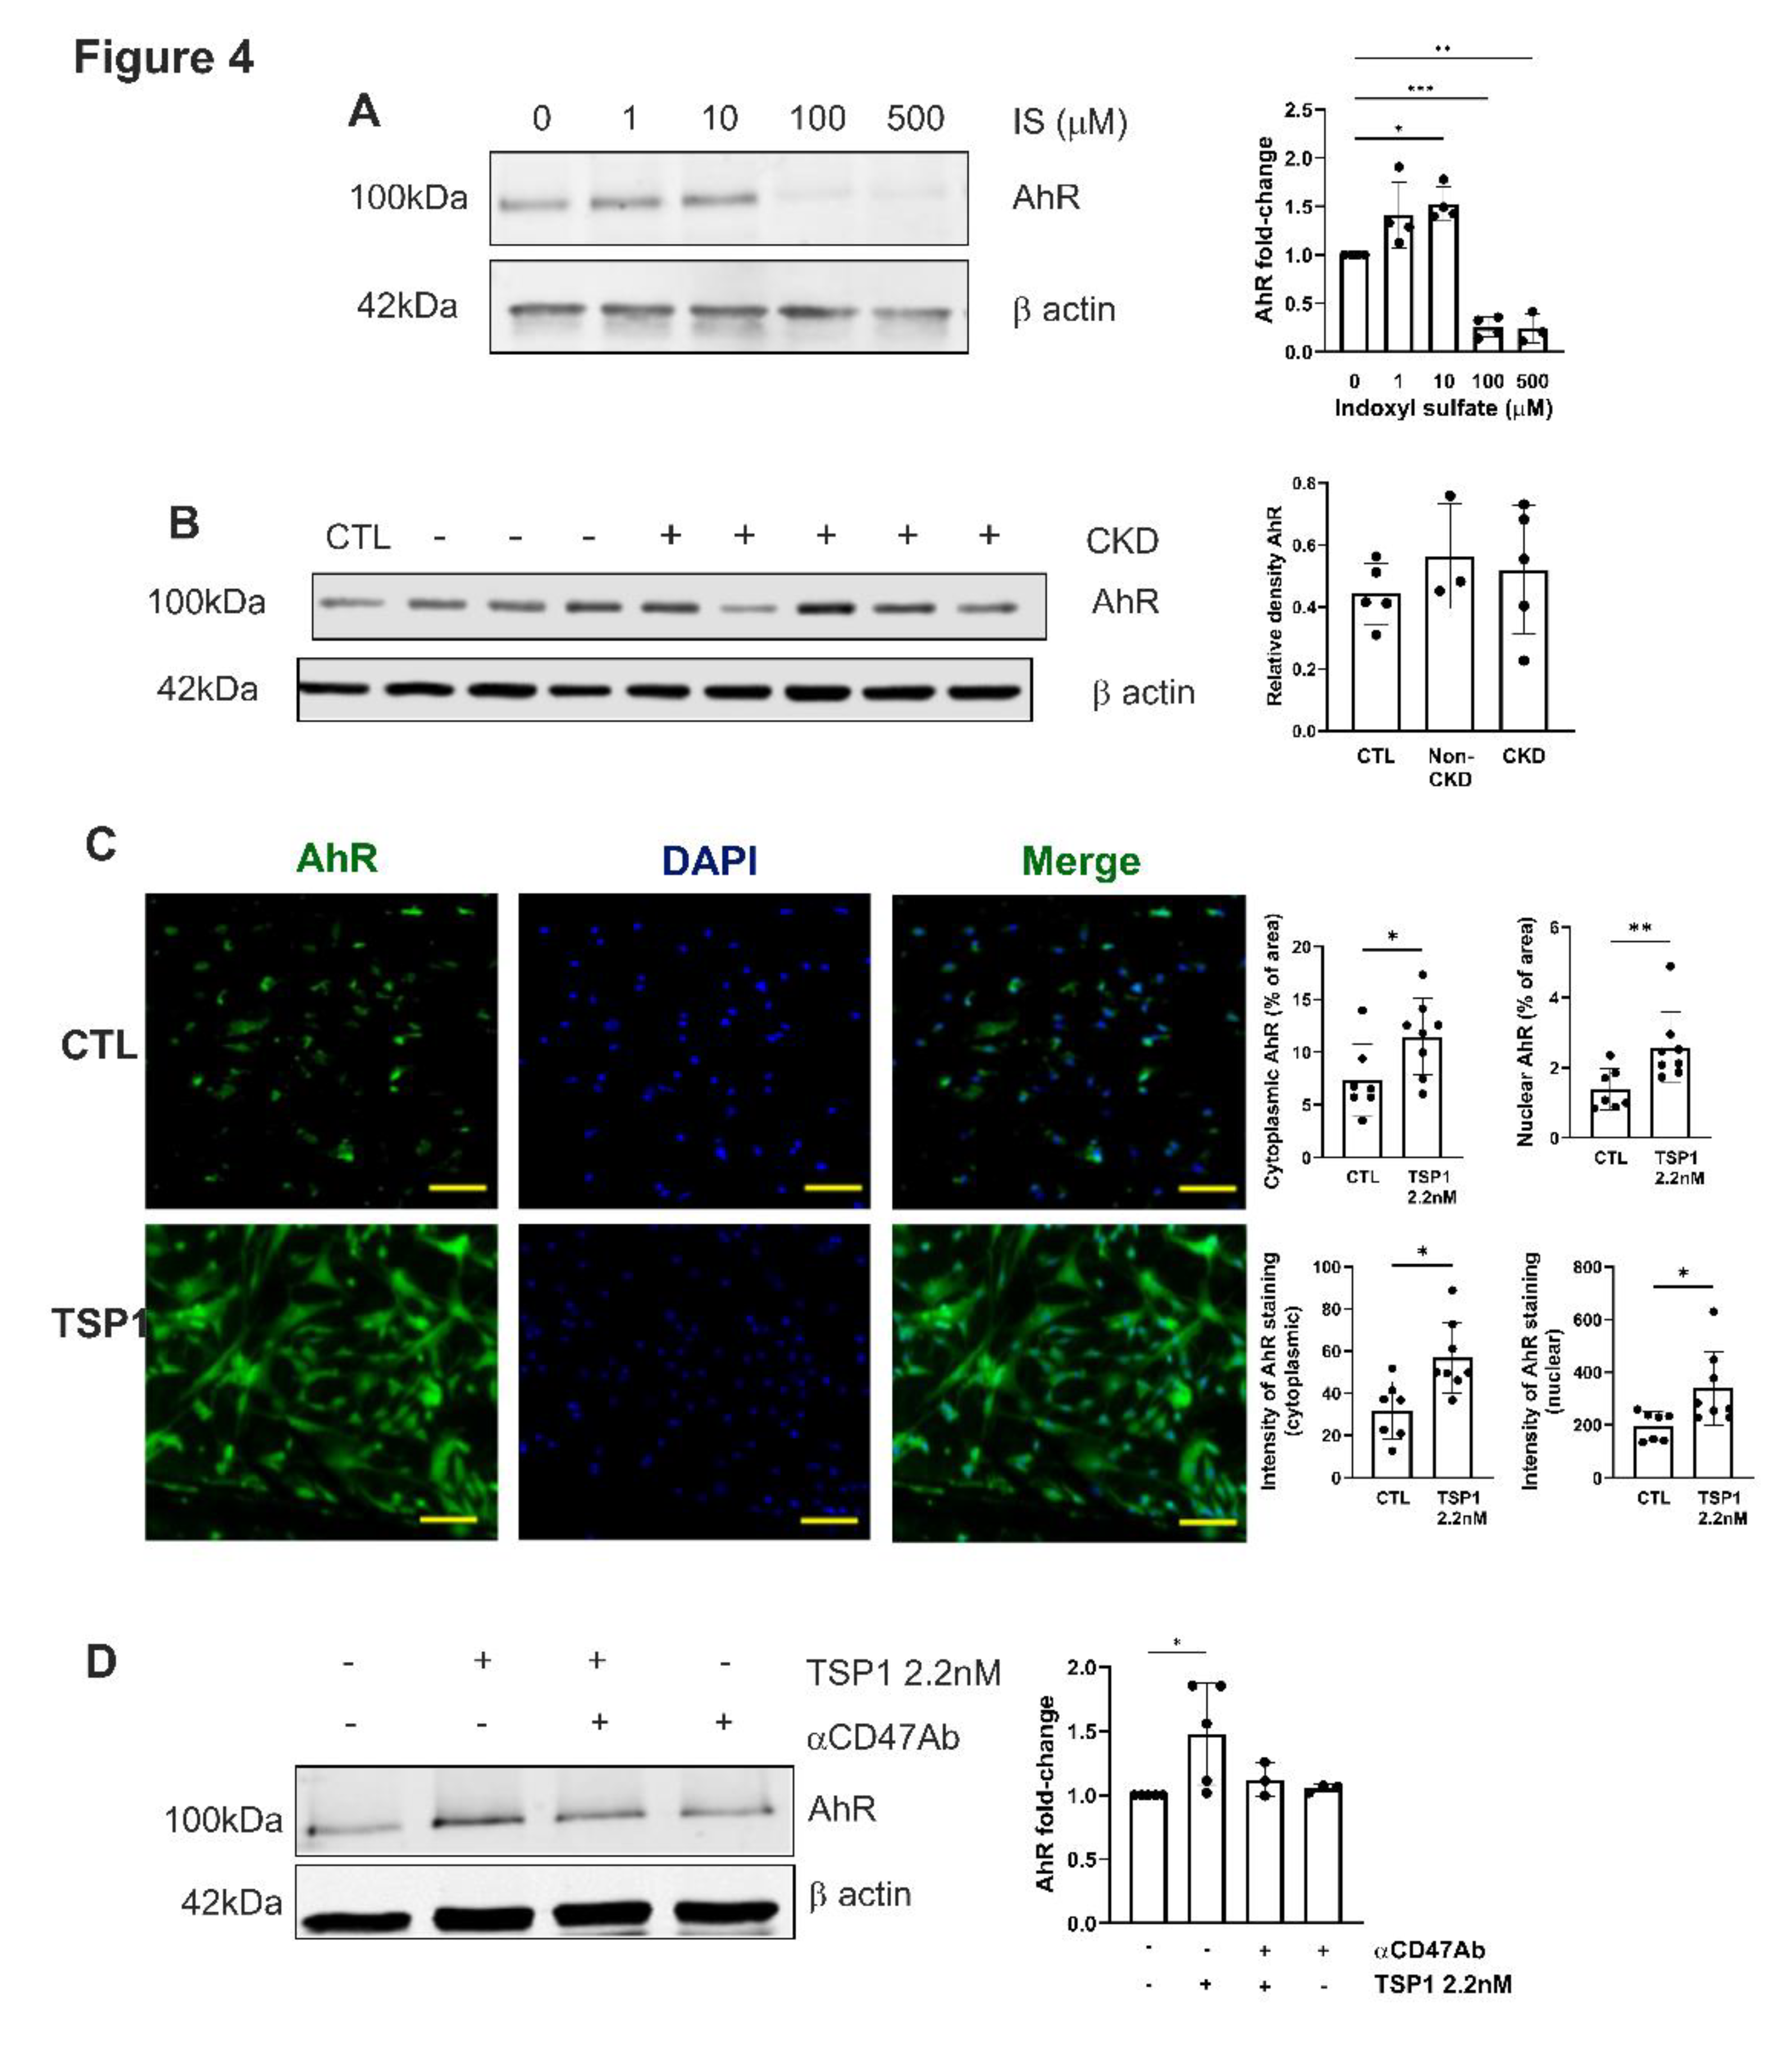
Figure 5.
Establishing equivalent CDK in WT and CD47KO mice. WT and CD47KO mice were subjected to 5/6Nx or sham surgery. (A) Percentage of kidney excised following 5/6Nx (n=4-5). (B) Fold-change in body weight over 12 weeks (n=3-5). (C) Serum urea and creatinine at 12 weeks post-surgery (n=4-5). (D) Urine volume, urine creatinine to plasma creatinine ratio and urine protein to creatinine ratio at 12 weeks (n=3-5). (E) Representative haematoxylin and eosin-stained sections of formalin-fixed paraffin embedded kidney excised at 12 weeks following 5/6Nx or sham surgery (bar=100µM). All data shown are mean ± SD. *P<0.05, **P<0.01 and ***P<0.001 by unpaired Student’s t-test (A) or 2-way analysis of variance with Tukey’s post hoc test (B to D). Abbreviations: 5/6Nx, 5/6-nephrectomy; AUC, area under the curve; CD47KO, CD47 knockout; Cr, creatinine; PCR, protein to creatinine ratio; WT, wild-type.
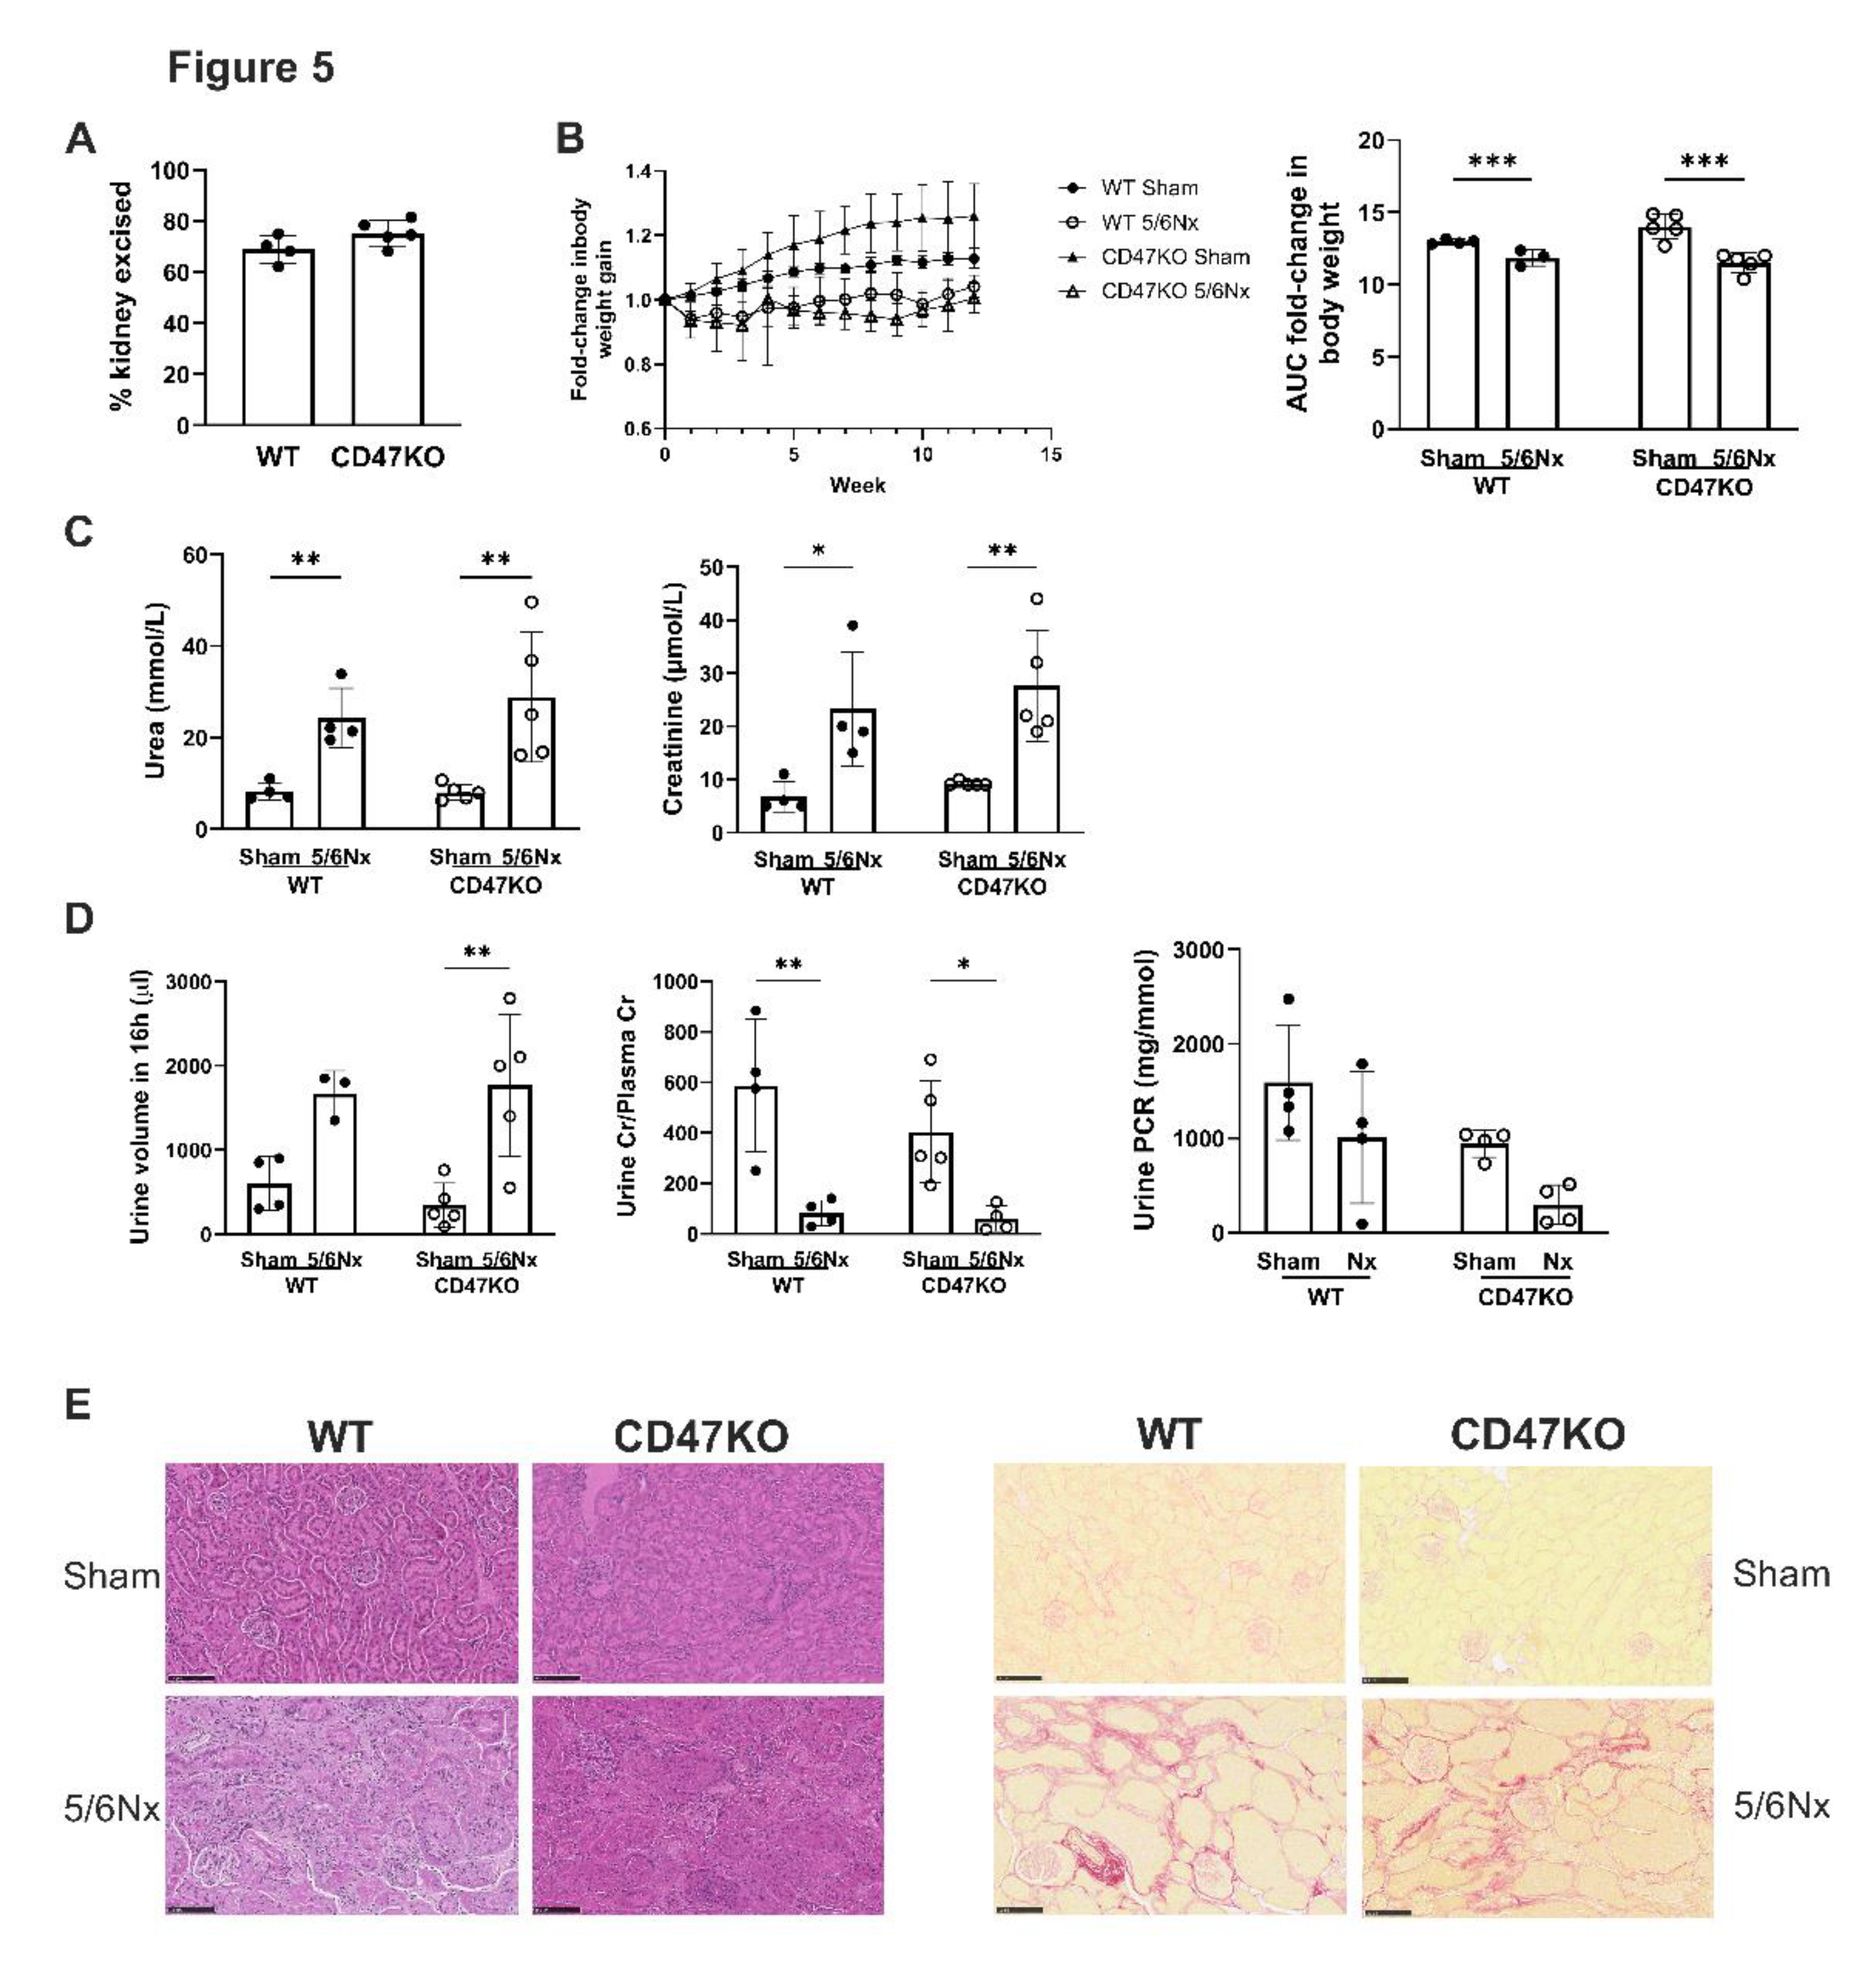
Figure 6.
Development of CRS in mice upregulates aortic TSP1 expression. (A) Representative images of immunohistochemical staining for TSP1 in formalin-fixed paraffin embedded mouse thoracic aorta. Scale bar = 50µm. (B) Mouse thoracic aorta homogenates obtained at 12 weeks following 5/6Nx or sham-surgery were analysed by Western Blotting for expression of TSP1 (n=5-6 per group). Representative Western blots and combined densitometry relative to vinculin are shown. (C) Representative images of formalin-fixed paraffin embedded mouse thoracic aorta 12 weeks following 5/6Nx or sham surgery with (i) haematoxylin-eosin, (ii) picrosirius red, (iii) Verhoeff-van Gieson and (iv) von Kossa staining. Calcified human carotid atheromatous plaque was used as a positive control. Scale bar = 50µm. Total aorta thickness (D), adventitia thickness (E) media thickness (F) was measured at 5 randomly selected areas per mouse and averaged (n=4/group). (G) Collagen deposition in the aortic adventitia and media was quantified from 5 randomly selected areas per mouse and averaged (n=4/group) in picrosirius-red stained sections. All data shown are mean ± SD. *P<0.05 and **P<0.01 by 2-way analysis of variance with Fisher’s Least SignificantTest (A) or Tukey’s post hoc test (D-H). Abbreviations: 5/6Nx, 5/6 nephrectomy.
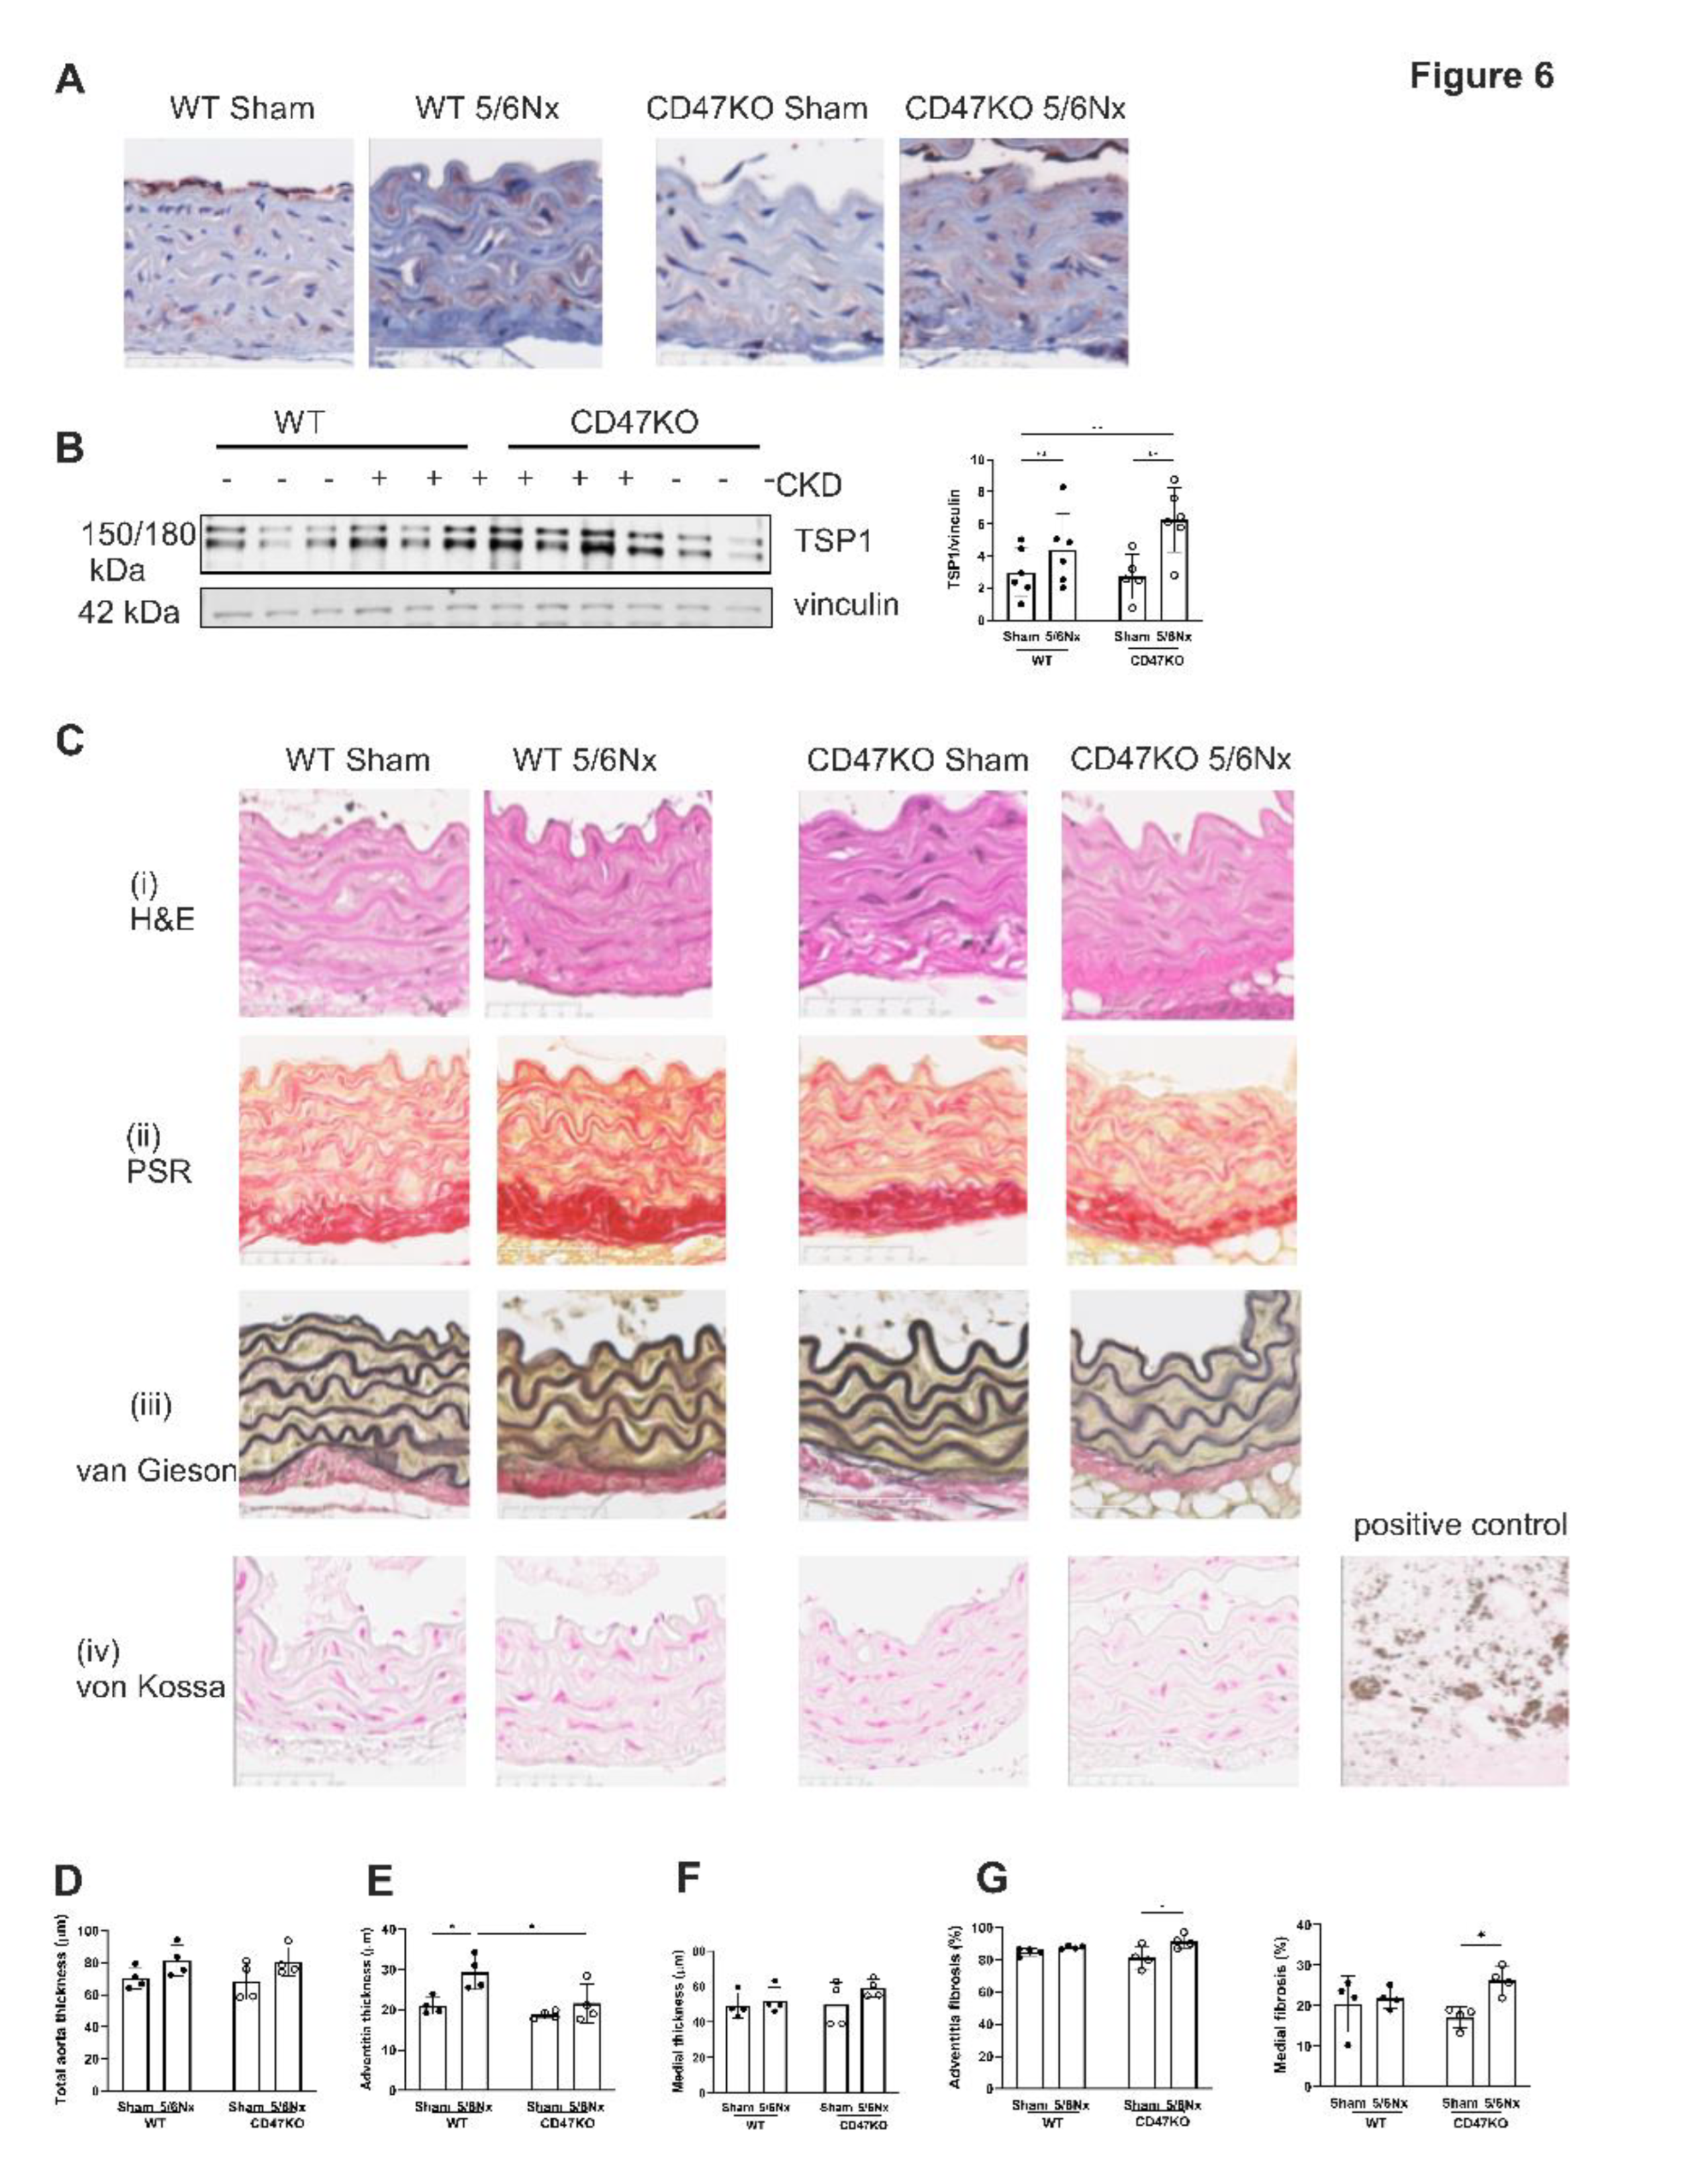
Figure 7.
MAPK ERK signalling is activated by TSP1 and IS via CD47. hVSMC were treated for 24h with (A) IS (0, 1, 10, 100 and 500µM) (n=3) or (B) TSP1 2.2nM ± pre-treatment with anti-CD47 antibody for 30 minutes (n=3-5). Whole cell lysates were probed for pERK. Mouse thoracic aorta homogenates obtained at 12 weeks following 5/6Nx or sham-surgery were analysed by Western Blotting for expression of pERK (C), p53 (D) and p27 (E) (n=5-6/group). All data shown are mean ± SD. Representative Western blots and combined densitometry relative to β-actin or vinculin are shown. *P<0.05, **P<0.01 and ***P<0.001 by one-way analysis of variance with Tukey’s post-hoc test (A) or Sidak’s post-hoc test (B) and 2-way analysis of variance with Tukey’s post-hoc test (B, C, D) or Holm-Sidak’s post-hoc test (E). Abbreviations: ⍺CD47Ab, anti-CD47 antibody; CD47KO, CD47 knockout; hVSMC, human aortic vascular smooth muscle cells; IS, indoxyl sulfate; pERK, phosphorylated extracellular regulated kinase; TSP1, thrombospondin-1; WT, wild-type.
Disclaimer/Publisher’s Note: The statements, opinions and data contained in all publications are solely those of the individual author(s) and contributor(s) and not of MDPI and/or the editor(s). MDPI and/or the editor(s) disclaim responsibility for any injury to people or property resulting from any ideas, methods, instructions or products referred to in the content. |
© 2025 by the authors. Licensee MDPI, Basel, Switzerland. This article is an open access article distributed under the terms and conditions of the Creative Commons Attribution (CC BY) license (http://creativecommons.org/licenses/by/4.0/).
Copyright: This open access article is published under a Creative Commons CC BY 4.0 license, which permit the free download, distribution, and reuse, provided that the author and preprint are cited in any reuse.


