Submitted:
17 September 2025
Posted:
19 September 2025
You are already at the latest version
Abstract
Background: Drug-drug interactions (DDIs) represent a critical challenge in pharmacoepidemiology. There are frequent instances of patients being prescribed multiple medications concurrently. Certain combinations of two or more drugs can be contraindicated owing to their potential to lead to adverse clinical outcomes. This leads to backfiring of the well-intentioned prescription. Moreover, prediction tasks associated with DDI outcomes continue to represent a field with a strong potential for improvements, largely because of the absence of efficient modernistic approaches as well as reliable, comprehensive datasets. Objective: This study aims to explore a forward-looking paradigm, based on artificial intelligence, for predicting the outcomes of DDIs. Towards this aim, we use cutting-edge advances in natural language processing and graph-based learning architectures to render a capable model. Conceptual Design: The proposed framework employs an unsupervised learning approach that integrates both cross-attention and self-attention mechanisms. The system first represents drug entities as embeddings, aggregates them using attention-based pooling, and models their interactions through graph attention networks. Cross-attention is then incorporated to refine pairwise representations before outcome classification. The architectural paradigm presents a welcome opportunity for validation after rigorous experimentation which simulates its efficacy for the intended task. Contribution: This paper presents a proof-of-concept study for unsupervised prediction of drug–drug interaction impacts. It integrates cross-attention with self-attention and suggests a novel direction for improving the classification of interaction severity in the absence of large-scale labeled datasets. Conclusion: The work introduces a methodological innovation that demonstrates potential for improving DDI outcome prediction. It highlights a promising avenue for future research and simulation while advancing the reliability of AI-driven systems in pharmacoepidemiology.
Keywords:
graph attention networks
; cross attention
; large language models
; aggregational pooling
; drug-drug interactions
Introduction
With the aging global population, the prevalence of chronic conditions such as hypertension, diabetes, and cardiovascular disease has surged [1]. Such matters exceedingly necessitate long-term, multi-drug regimens for patients [2]. The pharmaceutical landscape has expanded, where novel small molecules, biologics, and combination therapies have been introduced. Many of such molecules interact in manners such that the interaction profiles are not yet fully understood. Adverse drug reactions related to DDIs have taken the centerstage as a leading cause of hospital admissions and healthcare costs [3]. This showcases the need for predictive frameworks in this area. Inter-individual variability, which is driven by genetic polymorphisms, organ function, lifestyle factors, and concomitant therapies, complicates the clinical picture. This demonstrates that DDI evaluation has to move beyond population averages [4]. The integration of real-world evidence from electronic health records, pharmacovigilance databases, and post-marketing surveillance has therefore become key in complementing established pharmacoepidemiological methods [5]. This demands both innovative analytical techniques and comprehensive datasets capable of capturing the multifaceted nature of DDIs before any discussion of computational modeling or graph-based learning approaches.
Drug-Drug Interactions—Importance of Study in Pharmacology
The concurrent use of multiple medications has become an unavoidable reality in modern healthcare. We are witnessing a rise in polypharmacy, where patients are prescribed multiple drugs at a time to manage more than one chronic or acute conditions simultaneously [6]. In such a backdrop, the likelihood of DDIs increases substantially [7]. For drug developers and prescribers, understanding DDIs is critical because such interactions can directly influence clinical efficacy and safety, and therefore patients’ health and lives [8]. Investigating and predicting these interactions helps ensure that therapeutic regimens remain both effective and safe for the patient population.
DDIs occur when the pharmacological activity (pharmacokinetics) of one drug in the human body is altered by the presence of another. If present, these alterations can either enhance or diminish the clinical effect. They can also increase the risk of toxicity [9,10]. The mechanism of DDIs frequently involves interference with enzymes and transporters that regulate drug absorption, metabolism, and excretion [11]. Changes in systemic drug concentrations occur when metabolic pathways are inhibited or induced. Inhibition slows drug breakdown and raises concentration while induction accelerates metabolism and lowers concentrations. Since most investigational drugs are characterized by a defined therapeutic window, minor shifts in systemic concentration can push a drug outside its range effectivity and safety [12]. This makes the study of DDIs indispensable in both drug development and clinical practice.
DDIs are broadly categorized into pharmacokinetic and pharmacodynamic interactions [13]. Pharmacokinetic DDIs occur when one drug alters the concentration of another by affecting absorption, distribution, metabolism, or excretion of another drug [14]. For example, inhibition of cytochrome P450 enzymes can elevate plasma levels of co-administered drugs and increase toxicity risk, as seen when ketoconazole inhibits CYP3A4 and raises statin concentrations, predisposing patients to muscle toxicity. Conversely, induction of enzymes may lower drug concentrations and reduce efficacy, as occurs when rifampin induces CYP3A4 and accelerates metabolism of oral contraceptives, leading to contraceptive failure.
Pharmacodynamic drug–drug interactions arise when two drugs act on the same or related targets, producing synergistic, antagonistic, additive, or potentiating effects. Such interactions can heighten therapeutic outcomes or amplify adverse effects [10]. For instance, if SSRIs like fluoxetine and sertraline are taken with NSAIDs like ibuprofen and naproxen, it impairs platelet function and raises the risk of gastrointestinal bleeding since both are anticoagulants, although prescribed for different purposes. Both forms of interactions underline why DDIs must be evaluated thoroughly.
Pharmacoepidemiologists must aim to better predict and manage DDIs. To do so, they classify drugs as objects (substrates) and precipitants (perpetrators). Substrates are affected by other drugs, while precipitants influence the behavior of co-administered drugs through inhibition and induction mechanisms. The strength of inhibition or induction is categorized as weak, moderate, or strong. Such studies ease the determination of the clinical consequences of DDIs [15]. Importantly, a single drug may simultaneously act as both object and precipitant depending on the metabolic and transporter systems involved [16]. This intricacy begs a comprehensive assessment framework for DDIs throughout drug development.
The evaluation of DDIs begins in the nonclinical phase. Early investigations can reveal the interaction potential of drug metabolites that may act as precipitants. Detection of metabolic and transporter-based liabilities early helps researchers anticipate risks before clinical testing [17]. Clinical DDI studies help confirm the extent and significance of DDIs within the human body. Prospective studies may be conducted as standalone trials in healthy volunteers or nested within patient studies. Clinical studies can be used to investigate interactions with commonly co-administered medications to reflect real-world therapeutic use. With the growing use of biologics, therapeutic proteins must also be assessed for interaction risks. This is in consideration of their unique clearance pathways and common use in polytherapy settings. These expanded considerations highlight the breadth of DDI evaluation required for comprehensive pharmacological safety [18].
Physiologically-based pharmacokinetic (PBPK) modeling uses physiological and pharmacokinetic data to predict drug–drug interactions in virtual populations, guiding dose adjustments, informing trial design, and sometimes reducing the need for clinical studies [19]. Computational modeling represents a major advancement in reducing trial burden while improving predictive accuracy. The need is to characterize DDIs thoroughly. This helps developers and clinicians safeguard the therapeutic promise of new drugs as well as the wellbeing of patients relying on compound medication regimens [20].
The application of advanced computational and modeling techniques to DDI datasets is decidedly critical in modern pharmacology. In the modern landscape, tools such as machine learning and large-scale pharmacoepidemiologic analyses must be used by researchers to identify and predict interactions more accurately and efficiently than traditional methods alone. This aids in exploring multi-drug regimens and accounting for patient-specific factors. It also helps in simulating virtual populations that include vulnerable groups. The application of such techniques enhances our ability to anticipate clinically significant DDIs and optimize dosing strategies. This lowers our reliance on extensive clinical trials and improves patient safety and therapeutic outcomes when polypharmacy is on an upward trend [21].
Many-to-Many Associations: Issues and Solutions
Many-to-many datasets are datasets in which entities in one set can be associated with multiple entities in another set, and vice versa [22]. Formally, if we have two sets, A and B, a many-to-many relationship exists when:
In such datasets, an item can appear multiple times in one column as paired with different items in the other column. In contrast, in one-to-one datasets, each item in one column corresponds to exactly one item in the other column [Jackson, D.; Wang, M. Modeling the Many-to-Many Relationship Using Multi-Valued Foreign Keys. Issues Inf. Syst. 2005, 6.]. Moreover, in one-to-many datasets, an item in one set can relate to multiple items in the other, but not vice versa. In such cases, standard supervised learning techniques like regression combined with appropriate feature encoding, such as one-hot encoding for categorical variables, can yield excellent results [23].
In this paper, we discuss working with many-to-many associations (such as a dataset of students and the classes they take) in the backdrop of one-to-one associations. These two represent the simplest and most complex extremes of data relationships [24]. Here, we try to highlight how the two contrast in complexity, methodological requirements, and challenges. We omit the case of one-to-many relationships, which conceptually falls between the two and may complicate and obscure the clarity of the analysis.
Applying predictive analytics on datasets where the mapping between elements is many-to-many, rather than one-to-one, is comparatively complex. There is an inherent ambiguity of relationships in such datasets. A single entity is connected to multiple counterparts, each with different meanings and effects [25]. In DDI datasets, one drug may interact with dozens of others, but the severity, mechanism, and clinical relevance of those interactions varies widely. In social networks, a single user may follow many others. However, the depth and quality of each connection differ a lot. Thus, it becomes difficult for models to decide which relationships are most important for a given prediction [26]. This, in turn, increases the risk of over-generalization [27].
Redundancy and imbalance are two phenomena which may also occur in such datasets where entities appear in multiple records [28]. The dataset can potentially contain repeated information. Moreover, a few entities dominate data distribution [29]. In DDI datasets, commonly prescribed drugs such as aspirin shows the possibility to exist in thousands of interaction records. However, a rare cancer drug appears in only a handful of records [30,31]. In transportation networks, large cities like New York appear in countless shortest-path calculations. On the contrary, small towns show up far less often [32]. It skews the model toward learning frequent cases well, albeit weakening its performance on rare, but equally important, entities. It becomes essential to balance the contribution of frequent and rare entities. This avoids biased outcomes [33].
Context dependence implies the shift in the meaning of an entity depending on which counterpart it is paired with [34]. A city node in a shortest-path dataset has different roles depending on which two endpoints are chosen for a path, as an intermediate hub for one route, or as a destination in another. Similarly, a patient in a healthcare dataset may have different clinical significance that depends on the comorbidities they are paired with in an analysis. A model must generate contextualized embeddings that adapt dynamically to specific pairings rather than relying on static representations [35]. There is complexity in representation as well. Just concatenating two feature vectors cannot absolutely capture the information resident in many-to-many interactions. Advanced methods like attention mechanisms, pooling strategies, and graph neural networks (GNNs), have to be used to aggregate information over multiple relationships [36].
Many-to-many datasets can grow combinatorially large. If there are n entities in such a dataset, the number of possible pairs is . This is true even though only a small fraction of those combinations might be observed in practice [37]. For example, in e-commerce recommendation systems, millions of users and products create billions of potential user-item interactions. However, only a small portion is recorded. This leads to computational and storage challenges. It burdens the model when it endeavors to infer unseen relationships from limited training examples.
As stated previously, many-to-many datasets are by nature incomplete. Not all possible combinations appear in the training set. A robust model must therefore be able to perform zero-shot generalization. It should predict interactions between entities that have never co-occurred [38]. For instance, in transportation planning, predicting the shortest path between cities not yet directly observed in historical travel data is essential. Predicting protein–protein interactions between proteins never studied previously needs a good capacity for generalization.
In datasets like tweet-image pairs, each text corresponds to exactly one image, and vice versa. In such cases, classification is a relatively straightforward process. We fuse the vector representations of corresponding elements where each element has a unique counterpart [39]. We can use multifarious methodologies such as cross attention, concatenation, and projection, which can be performed pairwise. There is no ambiguity that arises in matching embeddings [40].
However, in a dataset consisting of distances between two points, for example, we have columns like (Pointi, Pointj, Distanceij). In such a dataset, a point can appear in multiple rows in either column. A single Pointi may have multiple distances to different Pointj points. Similarly, a single Pointj may be linked to multiple Pointi points. This creates a one-to-many or many-to-many relationship. Fusion is not trivial because embeddings from one column cannot be directly paired with a single embedding from the other [41].
In such cases, aggregation is needed. Multiple embeddings need to be aggregated as they correspond to the same entity before fusion [42]. For example, suppose Point A appears in three distances (A→B, A→C, A→D). We can compute embeddings for each pair and then aggregate embeddings for A (mean, sum, attention-weighted sum) to represent Point A’s relational context. This is similar to node embeddings in graphs, where each node’s embedding is influenced by its neighbors [43].
Not just graph-based mechanisms, but attention-based approaches are naturally suited for this. We begin by treating each entity as a query (Q). We then consider all entities connected to it as keys (K) and values (V) [44]. We may then compute contextualized embeddings for each entity based on all its occurrences, as shown in the following equation:
This allows dynamic weighting of each occurrence, rather than naive averaging.
Furthermore, such data is best represented in the form of graphs. In our example, nodes can be points and edges can be the distances between the points. This is called graph-based learning. GNNs are constructed to naturally aggregate information from multiple neighbors. Node embeddings can be produced and then pairwise distances and shortest paths can be computed. Hence, other downstream tasks can be performed with relative ease. In this context, Table 1 encapsulates the key differences between one-to-one and many-to-many data mappings.
As a DDI dataset is a strong example of many-to-many datasets, analyzing it using advanced computational methods requires capturing context-dependent relationships accurately. Approaches such as attention mechanisms, graph-based embeddings, and physiologically informed modeling, allow for contextualized representations and robust predictions even in sparse and unseen combinations. Applying such techniques can provide a framework for addressing the unique issues present in many-to-many interactions in various areas.
Why Graph Attention Networks?
Graph Attention Networks (GATs) are a type of GNN that improve upon standard graph learning through the assignment of dynamic and learnable weights to edges during message passing. They are unique because unlike traditional GNNs and plain aggregation methods, GATs do not treat all neighbors equally. They allow each node to selectively attend to its neighbors. This enables the model to emphasize more relevant connections while down-weighting less significant ones. This process vastly improves node representation efficiency [45].
In case of DDI datasets, GATs help assign different attention weights to each interaction. This encapsulates the relative importance of each drug-drug pair in context. It enables the network to handle complex interaction patterns that static embedding and naive concatenation methods struggle to model effectively [46]. GATs are able to generate context-dependent representations. The clinical impact of a DDI often depends on patient comorbidities, dosage, co-administered medications, etc [47]. GATs dynamically compute embeddings based on neighboring nodes. GATs produce contextualized representations that effectively reflect these dependencies without treating all interactions uniformly are conventional methods do.
DDI datasets are also often sparse. They may also contain many rare and unseen drug pairs. GATs use the graph structure to propagate information from well-connected nodes to less-connected ones. This advances the ability to generalize to new and unfamiliar interactions. The attention mechanism in GATs provides the scope for interpretability. The attention coefficients specify which interactions contribute most to predictions. GATs combine expressive power with contextualized, weighted aggregation. This makes them well-suited for modeling the heterogeneous relationships in DDI datasets [48].
Literature Review
In case of predicting DDIs, traditional rule-based decision support mechanisms in medicine have performed mediocrely in terms of scalability, specificity, and context sensitivity [49]. In this regard, there has been a wave of intelligent computational techniques applied in this area. Many of these approaches seek to predict interactions, to classify their polarity, to explain underlying mechanisms, and to incorporate real-world patient data into decision support. An examination of recent research gives us an insight into how newfangled architectures and domain-adapted strategies are reshaping DDI detection and risk management.
Transformer-based models have been at the forefront of DDI classification. Gheorghita et al. (2025) fine-tuned BiomedBERT with low-rank adaptation (LoRA) and incorporated pseudo-labeling to build a lightweight classifier capable of distinguishing synergistic from antagonistic interactions. Their approach highlights how polarity-aware predictions in case of DDIs can better inform clinical decision support system (CDSS) deployment [50,51]. Hakim and Ngom (2025) introduced PolyLLM [52]. PolyLLM uses large language model (LLM) encoders such as ChemBERTa and GPT to process SMILES representations of drugs [53]. They pair these embeddings separately with a GNN and a multilayer perceptron (MLP) model. PolyLLM achieved competitive performance in predicting polypharmacy-related side effects. The studies illustrate how large-scale language models can be used to find fine-grained insights in drug interaction mechanisms.
Das et al. (2025) developed GAINET [54]. GAINET is an attention-enhanced GNN that integrates molecular graph structures and highlights informative substructures. According to the authors, it achieves high discriminative power with AUC values reaching nearly 0.95. Deng et al. (2025) introduced MAVGAE [55]. It is a multimodal variational graph autoencoder framework that specifically captures asymmetric interactions where the order of drug administration influences outcomes. This framework fuses heterogeneous biomedical data to improve predictive accuracy in large-scale datasets. Tan et al. (2023) proposed HAG-DDI [56]. It is a graph attention network that treats interactions as nodes and uses semantic-level attention to depict mechanism-specific features and mitigate data sparsity (particularly for novel drugs). These studies reinforce the hypothesis that graph architectures, accentuated with attention. can help not only with binary interaction prediction but also with mechanism-aware and direction-sensitive modeling.
Nguyen et al. (2025) proposed a reinforcement learning approach that operates over knowledge graphs. They called their approach Hetionet. Their framework enables a learning agent to traverse multi-hop biomedical relationships. It produces path-based explanations for predicted DDIs [57]. Dou et al. (2024) developed the Shennong-Agent [58]. It is a multi-agent LLM framework for pharmaceutical care tasks that includes DDI risk analysis. Their system exemplifies how LLM-based agents can autonomously handle complex medication safety scenarios.
Bischof et al. (2025) assessed ChatGPT against established CDSSs in thirty polypharmacy cases. The general-purpose LLM frequently missed clinically important DDIs, particularly QTc-prolonging combinations, and displayed inconsistency. This finding highlights the gap between raw generative AI and domain-tuned systems. It stresses the necessity of domain adaptation and structured knowledge integration which is better achieved through graph-based architectures in case of DDIs [59].
Xiao et al. (2025) proposed a model in area of diabetes treatment and termed DUMS (Diabetes Universal Medication Schedule) system [60]. It is a CDSS that encodes more than 12,000 DDI rules alongside personalized scheduling and self-management functions for diabetes patients. Evaluations showed DUMS outperforming GPT-4 in accuracy and safety, with pharmacist refinements yielding the most reliable outputs. Yılmaz et al. (2023) and Akyon et al. (2023) developed similar systems for geriatric and nursing home populations. In a series of papers, they incorporated potentially inappropriate medication (PIM) criteria with drug–drug and drug–disease interactions. These tools achieved dramatic reductions in detection time (over sixty-fold faster than manual review) and facilitated safer prescribing at the point of care [61,62]. Shirazibeheshti et al. (2023) added an unsupervised learning dimension to DDI modeling. They combined weighted DDI risk scores with mean-shift clustering. This was done to stratify high-risk patient groups over large EHR datasets. Such strategies outrival others in the spheres of immediate deployability and population-level monitoring [63].
Lagumdzija-Kulenovic and Kulenovic (2022) proposed PM-TOM. This is an optimization framework integrating various drug databases. The paper aims to minimize drug and gene interactions when augmenting polypharmacy regimens with COVID-19 therapies. The authors’ findings showcased the necessity of systematic optimization before adding high-risk antivirals [64]. Silva et al. (2021) demonstrated pharmacogenomics-aware platforms that integrate approximately ninety single nucleotide polymorphisms, CYP2D6 copy-number variation, and pharmacokinetic data with AI-based monitoring of DDIs. This proof-of-concept highlights the potential of combining weak clinical signals with genetic data to predict interaction risks in chronic disease management [65].

Table 2.
Literature Review Table.
| Year | Title | Authors | Brief summary |
|---|---|---|---|
| 2025 | Fine-Tuning BiomedBERT with LoRA and Pseudo-Labeling for Accurate Drug–Drug Interactions Classification | Gheorghita I-F; Bocanet V-I; Iantovics LB | Lightweight, polarity-aware DDI classifier (synergistic vs antagonistic) designed for efficient CDSS deployment with robust logging. |
| 2025 | GAINET: Enhancing drug–drug interaction predictions through graph neural networks and attention mechanisms | Das B; Dagdogen HA; Kaya MO; Akgul MS; Das R; et al. | Attention-enhanced GNN predicts DDIs with strong metrics (AUC ~0.95) and interpretable substructure highlights. |
| 2025 | Chat GPT vs. Clinical Decision Support Systems in the Analysis of Drug–Drug Interactions | Bischof T; al Jalali V; Zeitlinger M; Stemer G; Schoergenhofer C; et al. | In 30 polypharmacy cases, ChatGPT missed many clinically relevant pDDIs (esp. QTc risks) and was inconsistent vs established CDSSs. |
| 2025 | Towards Explainable Polypharmacy Risk Warnings Using Reinforcement Learning on Knowledge Graphs | Nguyen T-G-B; Le M-C; Nguyen V-K; Can D-C; Le H-Q; et al. | RL agent navigates a biomedical KG to predict DDIs with path-based explanations; promising ablations, needs clinical validation. |
| 2025 | MAVGAE: a multimodal framework for predicting asymmetric drug–drug interactions based on variational graph autoencoder | Deng Z; Xu J; Feng Y; Dong L; Zhang Y | Predicts asymmetric (order-dependent) DDIs by fusing heterogeneous data; shows high accuracy on large datasets. |
| 2025 | PolyLLM: polypharmacy side effect prediction via LLM-based SMILES encodings | Hakim S; Ngom A | Encodes drug SMILES with LLMs (e.g., ChemBERTa, GPT) and combines pair embeddings for side-effect prediction using MLP/GNN. ChemBERTa + GNN performs best. Demonstrates structure-only inputs can be highly effective when other entities (proteins, cell lines) aren’t available. |
| 2025 | Smart Pharmaceutical Monitoring System With Personalized Medication Schedules and Self-Management Programs for Patients With Diabetes (DUMS) | Xiao J; Li M; Cai R; …; Zhang J; Cheng S | Cloud-based system with 475 diabetes meds, 684 constraints, and 12,351 DDI rules generates personalized schedules and self-management plans. Expert ratings show DUMS > GPT-4 for accuracy/safety; pharmacist-refined outputs were best. Supports dosing times, education, diet, and lifestyle guidance. |
| 2024 | Autonomous Pharmaceutical Care with Large Language Models (Shennong-Agent) | Dou Y; Deng Z; Xing T; Xiao J; Peng S | Multi-agent LLM framework with multimodal inputs that segments and executes pharmacy-care tasks via reasoning, retrieval, and web tools. Expert evaluations indicate performance surpasses baseline LLMs; capabilities further improved with RLHF. Targets med safety issues like polypharmacy-related risks. |
| 2023 | Enhancing Primary Care for Nursing Home Patients with an AI-Aided Rational Drug Use Web Assistant | Yılmaz T; Ceyhan Ş; Akyön ŞH; Yılmaz TE | Evaluated nursing home regimens with a rational drug-use assistant: 89.9% had risky DDIs; 20.2% had contraindicated DDIs. The assistant reduced polypharmacy and projected a 9.1% monthly cost reduction; interaction detection time dropped from 2278 s to 33.8 s (~60× faster). |
| 2023 | Automated Detection of Patients at High Risk of Polypharmacy including Anticholinergic and Sedative Medications | Shirazibeheshti A; Ettefaghian A; Khanizadeh F; …; Radwan T; Luca C | On 300,000 records, computed weighted anticholinergic and DDI risk scores, then used mean-shift clustering to flag high-risk groups. Found scores are largely uncorrelated and outliers often high on only one metric—both should be considered to avoid misses. Integrated into a live management system. |
| 2023 | AI-supported web application for reducing polypharmacy side effects and supporting rational drug use in geriatric patients | Akyon SH; Akyon FC; Yılmaz TE | Built a comprehensive tool covering 430 common geriatric drugs, integrating six PIM criteria plus drug–drug and drug–disease interactions. Achieved 75.3% PIM coverage and cut detection time from 2278 s to 33.8 s (~60×). Publicly available (fastrational.com) to support rational prescribing. |
| 2023 | A novel drug–drug interactions prediction method based on a graph attention network (HAG-DDI) | Tan X; Fan S; Duan K; …; Sun P; Ma Z | Treats interactions as nodes and connects them if they share a drug; trains on small subnetworks with semantic-level attention to capture mechanism differences. Achieves F1 = 0.952 and mitigates data sparsity/bias for new drugs. Code released for reproducibility. |
| 2022 | Minimization of the Drug and Gene Interactions in Polypharmacy Therapies Augmented with COVID-19 Medications | Lagumdzija-Kulenovic A; Kulenovic A | Uses PM-TOM to optimize polypharmacy regimens when adding dexamethasone, remdesivir, or colchicine. On Harvard PGP EMR + DrugBank/CTD, adding these drugs markedly increases drug/gene interactions in partially optimized regimens, but far less in fully optimized ones. Recommends rigorous optimization before adding high-interaction COVID meds. |
| 2021 | Implementation of pharmacogenomics and artificial intelligence tools for chronic disease management in primary care setting | Silva P; Jacobs D; Kriak J; …; Neal G; Ramos K | Describes a primary care platform combining weak clinical signals with PGx (~90 SNPs + CYP2D6 CNV) and PK to monitor drug–gene and drug–drug interactions. Validated via a virtual patient case; proposes a regional outcomes registry. Demonstrates feasibility of PGx-informed, proactive medication management CDS. |
Reviewing these studies enabled us to propose a methodology that classifies DDIs by combining graph-based methods, attention, and unsupervised learning. This integrated approach amalgamates the structural advantages provided by graph representations, the feature-weighting capability of attention, the pattern discovery strength of unsupervised clustering, and the predictive robustness of representation learning. These elements create a framework that is both scalable and adaptable to various biomedical datasets pertaining to DDIs.
Methods
Our methodology for classification of DDIs can be broken into a series of steps. The proposed pipeline is fully label-free and maps any drug pair (di, dj) to (a) calibrated probabilities over an ordinal four-way partition {no interaction noted or unknown interaction, minor, moderate, contraindicated} and (b) a continuous severity score rij. It combines intra-drug refinement, pairwise cross-attention, an edge-aware graph attention network (EGAT), multiple self-supervised objectives, a data-driven scalar severity proxy (rij), ordered mixture modeling, and unsupervised calibration.
Notation and setup
Augmentations
We use three label-free augmentations:
- (i)
- random channel dropout/masking,
- (ii)
- noise/perturbation in latent space, and
- (iii)
- paired-latent interpolation (PLI), an interaction-preserving interpolation between two augmented views of the same pair’s latent representations.
Steps
1. Intra-drug self-attention (structure refinement)
For each drug, we obtain frozen encoder outputs and refine them. If token-level embeddings are available (such as atoms or substructures), we apply a lightweight Transformer block and pool to a fixed-size vector. We begin with initial encoding:
In equation 1, a frozen drug encoder , such as a pretrained molecular, or a text embedding model, maps the drug to its initial embedding vector .
Then we undertake attention refinement:
In equation 2, we take the initial embedding, normalize it using LayerNorm, pass it through multi-head self-attention (MSA), then add a residual connection back to the original . This lets the embedding capture contextual dependencies while keeping stability.
Next, we undertake feedforward refinement:
In this way, the refined embedding goes through a feedforward network (MLP) after normalization, again with a residual connection. This step increases representational capacity and non-linearity.
Then, we undertake pooling:
In this manner, we pool the token-level representation into a single self-refined drug vector xi. This is the vector that represents drug for the downstream task.
We perform the same operations for the other drug in the pair. If only flat vectors are available, we use a channel-mixer:
The mixer re-weights and transforms the channels (dimensions) of each flat drug vector. It lets the model reshape, rescale, and nonlinearly transform each drug vector.
where W1,W2 are weight matrices, b1, b2 are biases, and σ is a non-linear activation such as ReLU.
2. Pairwise cross-attention (partner conditioning)
Here, we condition each drug on its partner via bidirectional cross-attention and aggregate symmetrically to ensure pair-order invariance:
Equation 5 establishes bidirectional cross-attention. In this, each drug representation is updated using information from the other drug.
Next, we undertake symmetric refinement:
In symmetric refinement, each drug’s embedding is combined with its cross-attention-refined version. The factor of averages and keeps the scale stable and prevents one part (original or refined) from dominating. The resulting vectors and are context-aware drug embeddings that are enriched with mutual influence.
Before this step, each drug had its own independent representation (xi and xj). After this step, each drug embedding explicitly incorporates information from the other drug. This makes them sensitive to potential DDIs.
3. Edge initialization
This helps initialize a symmetric edge (pair) descriptor that encapsulates additive, interactional, and difference terms between the context-aware drug embeddings.
4. Graph construction
We construct a graph G = (V, E) over drugs, with nodes V carrying features xi and edges E for observed drug pairs. We add a sparse set of virtual kNN edges for connectivity. These virtual edges are masked from positive sets during contrastive training.
We then run L layers of edge-aware multi-head graph attention. Attention logits depend jointly on node and edge states:
In equation 8, hi is the node embedding inside the GAT. When xi is fed into the graph module, it gets linearly transformed to node embeddings and participates in message passing and attention over neighbors. W is a learnable linear transformation applied to the nodes. eij is the edge (pairwise) embedding between drug i and j. Ue is a learnable linear transformation applied to the edge features. Using concatenation, combines both node features and edge features into a single vector for attention computation. applies a learnable weight vector a to the concatenated features. LeakyReLU (⋅) introduces non-linearity and enables small gradients for negative values. The sum guarantees that the attention coefficients are normalized. This is usually done through a softmax function. implies that only nodes connected to i are considered.
Now, the following operation is performed to update every node:
In equation 9, denotes concatenation over multiple attention heads, while the sum aggregates messages from all neighbors weighted by attention coefficients combining neighbor node features and edge features. is the message passed from node j to node i. It combines node j’s features with the features of the edge connecting i and j.
Each drug’s embedding is updated with the information from all its neighbors (interacting drugs). It is weighted by relevance and enriched with edge information. Therefore, each drug embedding now becomes context-aware and reflects the drug as well as its interactions with its neighbors.
For edges, the following operation is performed:
Here, γ is a small residual weight. It is also termed as a scaling factor which controls the update magnitude. This step residually updates the edge embedding eij by incorporating the current node embeddings hi and hj and the previous edge features. The concatenation signifies a combined representation of the interaction between two nodes and their connecting edge
In this way, we can now form the symmetric pair embedding sij. This embedding is invariant to swapping i and j, and is given by:
This equation defines how the final pair embedding sij is constructed by combining multiple relational signals between two drugs i and j. First, the node representations hi and hj are aggregated through three complementary operations. These operations include their elementwise sum hi + hj, their elementwise product hi ⊙ hj, and their absolute difference ∣hi − hj∣. These encapsulate additive similarity, multiplicative interactions, and dissimilarity, respectively. This provides a richer representation of how the two drugs relate. The learned edge embedding eij, which encodes prior relational information and graph-level refinements, is concatenated with these three components, to further contextualize the embedding. The concatenated vector is then passed through an MLP. This MLP nonlinearly combines and compresses the features into a single embedding sij.
5. Label-free training
We employ three complementary self-supervised losses on mini-batches of augmented views produced by masking, dropout, noise, and PLI.
5.1. Pairwise contrastive (InfoNCE) loss [66]
For each observed pair, let (sij, ) be two views of the same pair; negatives are other pairs in-batch and a memory bank. Using cosine-normalized embeddings and temperature τ:
This equation defines a contrastive learning objective for DDI pair embeddings. For each observed drug pair (i,j), we consider two views of it: and . These come from different augmentations. The goal is to make their embeddings close to each other. Other drug pairs () in the batch serve as negative samples. The model should push away from these samples. Sim is a function to calculate similarity, which usually is cosine similarity. Temperature is a scaling function that smooths the softmax distribution. Smaller the temperature, more the model focuses on the highest similarity pairs. The numerator measures the similarity of the positive pair . The denominator normalizes this against the similarities with all other pairs . Taking the log and summing over all observed pairs encourages the model to maximize similarity for true positives while minimizing it for negatives.
5.2. Masked prediction (denoising)
We randomly mask channels of xi, xj, and eij and reconstruct masked channels from graph context and the partner using the following equation:
This is a masked reconstruction loss applied to DDI embeddings. From the embeddings xi and xj, (drug-level) and eij (edge-level), some channels (features) are randomly masked. The model is then asked to reconstruct the missing values. This forces it to learn redundancy and contextual dependencies in lieu of memorizing direct values. is the true concatenated vector of drug i, drug j, and their interaction embedding. is the model’s reconstruction of that vector after masking. are Bernoulli gates, the model’s predicted mask distribution (which channels are masked/unmasked). is a Bernoulli prior with masking probability . The loss compares reconstructed vs. ground truth on the masked channels only, using squared error. This causes the model to fill in missing information using graph context (neighbors, relationships) and the partner drug representation. The KL divergence is aimed to guarantee that the model’s masking behavior does not drift away from the intended random distribution. The weight controls how much importance this regularization has relative to reconstruction.
5.3. Graph mutual information [67]
Through equation 14, we maximize mutual information between global graph summaries and local node/edge embeddings using corrupted graphs as negatives:
The purpose of this loss is to align local embeddings of drug pairs with a global summary of the graph , while contrasting them with corrupted (or negative) samples. Applying this, the model aims to learn representations that capture both local interactions and the overall structure of the drug–drug interaction graph. are the local embeddings (pairwise embeddings) for each drug pair. are negative local embeddings which come from a corrupted version of the graph, such as shuffled edges or perturbed nodes. They serve as negative samples. is a readout vector that represents the entire graph and is obtained by pooling node and edge embeddings. and are functions of learnable projections. They map local and global embeddings into a shared space where their mutual information can be estimated. (sigmoid) converts similarity scores to probabilities between 0 and 1. The equation encourages positive pairs (true local embeddings and global summary) to have high similarity while pushing corrupted pairs apart from them. The sum over all pairs (i,j) is applied so that local embeddings are informative about the global graph structure. This improves the model’s understanding of DDIs in context. Such a loss function helps the model encapsulate dependency patterns across the graph, which includes similar drugs interacting with similar partners. The model becomes robust to noise and better distinguishes true DDIs from spurious associations. Corrupted embeddings aid the model in avoiding trivial solutions.
Table 3 summarizes the self-supervised losses.
6. Label-free severity score
We compute a scalar severity proxy rij for each drug–drug pair (i,j) without using labels. Its components are as follows:
6.1. Cross-attention intensity (uij):
The cross-attention intensity between drugs i and j is calculated as one-half times the sum of the Frobenius norms of the attention map from drug i to drug j and the attention map from drug j to drug i. It measures the strength of mutual attention between the two drugs across the attention heads. A high value would indicate that the model focuses strongly on this pair.
6.2. Edge-aware Graph Attention Network (EGAT) edge salience ():
EGAT edge salience between drugs i and j is calculated as the average attention weight assigned to the edge across all attention heads in a given layer. It highlights the edges that are consistently important in the graph.
6.3. Interaction nonlinearity (bij):
The interaction nonlinearity between drugs i and j is obtained by taking the pair-specific embedding of the two drugs and subtracting the additive baseline predicted by a multilayer perceptron applied to the concatenation of their individual embeddings. It condenses in itself the non-additive effect of the pair beyond the simple combination of individual node embeddings. Large deviations indicate a strong, specific interaction effect.
6.4. Graph anomaly (qij):
The graph anomaly score between drugs i and j is computed by taking the edge representation of their connection and subtracting the average edge representation of all neighboring connections around drug i and drug j. It measures how much the edge embedding deviates from neighboring edges in the graph. It highlights unusual and exceptional interactions in the local graph context.
6.5. Aggregation
In equation 15, the final severity score for a drug–drug pair is obtained. The equation combines the four features that have been discussed: cross-attention intensity, EGAT edge salience, interaction nonlinearity, and graph anomaly. Each of these features is first scaled into the range between zero and one using median/interquartile range normalization (that is also called robust scaling). This enables the model to be resilient against outliers. Then, non-negative weights are assigned to the four features and summed together. These weights are learned automatically, without requiring any labeled data. The weighted sum, after normalization, becomes the final severity score.
7. Ordinal 4-component clustering on the severity axis
7.1. We fit a 1D four-component Gaussian mixture on rij with ordered means to induce the ordinal partition. Let k ∈ {1,2,3,4} denote clusters or classes. The mixture is:
We fit a one-dimensional Gaussian mixture model with four components on the set of severity scores. The means of these Gaussian components are ordered so that they can be mapped to ordinal categories of interaction severity. Each component corresponds to one of the classes, no interaction or unknown interaction, minor interaction, moderate interaction, and contraindicated interaction. This way, the continuous severity scores are translated into clinically meaningful categories through the probabilistic mixture model.
7.2. The ordered means are reinforced by reparameterization as follows:
Reparameterization is used to enforce an ordering of the Gaussian mixture component means. We define each subsequent mean as the previous mean plus a positive offset. Therefore, the means increase monotonically. This lets the Gaussian components correspond naturally to increasing levels of severity, that is, no interaction, minor, moderate, and contraindicated. Hence, the ordinal structure of the categories is preserved in the model.
7.3. Responsibilities (soft assignments) are:
The responsibilities portray soft assignments of a drug–drug pair’s severity score to each Gaussian component. For a given component, its responsibility is the probability that the score belongs to that component. It is computed as the component’s weighted Gaussian density divided by the sum of all four weighted Gaussian densities. This produces a normalized set of probabilities across the four clusters for each pair.
We map the ordered means to classes: μ1 = no interaction noted or unknown interaction, μ2 = minor, μ3 = moderate, μ4 = contraindicated.
8. Calibrated four-class outputs
We apply temperature scaling to the responsibilities in the following manner:
Equation 19 depicts temperature scaling applied to the soft assignments of each drug pair to different clusters. First, the initial probability that a drug pair belongs to a specific cluster is taken. Then, this probability is converted to a logarithmic scale and multiplied by the reciprocal of a temperature factor T. When the temperature is greater than one, the resulting probabilities become more uniform, which in turn spreads confidence across clusters. When the temperature is less than one, the probabilities become sharper, which aims to emphasize the most likely cluster. Finally, the scaled values are normalized so that they form a valid probability distribution across all clusters. This procedure improves consistency of the assignments across different augmented views of the same drug pair. It allows the model to manage uncertainty without using explicit labels.
We now select T by minimizing augmentation disagreement:
In equation 20, p and are probabilities from two augmented views of the same pair. The equation tells us how the optimal temperature is selected for scaling the soft assignments. We aim to find the temperature value that minimizes the disagreement between two augmented views of the same drug pair. For each candidate temperature, the model seeks to measure the difference between the probability distributions produced by the two views. It then sums these differences in both directions. This guarantees symmetry. The temperature that results in the smallest disagreement is chosen as the optimal value.
The final hard label is given by:
Through equation 21, the model selects the cluster with the highest probability as the definitive label. It picks the most likely interaction severity category among four possible classes as it converts the soft probabilities into a single and concrete classification for the drug pair.
The flowchart of the process is provided in Figure 1.
Discussion
The proposed methodology outlines a framework for label-free, graph- and attention-based prediction of DDI severity. While experimental validation remains a future step, the design choices show the potential for several advantages. Potential advantages include the seamless ability to encapsulate local as well as global relational patterns between drugs and the capacity to smoothly integrate heterogeneous sources of information, and the promise of providing interpretable outputs.
The suggested model relies on intrinsic, label-free signals. This should make it adaptable to datasets where annotated interactions are sparse or incomplete. The use of augmentation and mutual information maximization encourages robustness against input variability. This insinuates that the model could maintain consistency across different representations of the same drug pairs. The ordered Gaussian mixture approach targets to render an innate manner for translating continuous severity scores into ordinal risk categories. This aligns computational outputs with clinical decision-making needs. Such design elements portray a versatile and scalable approach that may inform wide research applications in drug safety.
Further suggestions are described here. The training should alternate between two main steps, similar in spirit to Expectation-Maximization (EM) algorithm. In the first step, analogous to the E-step, the model should focus on updating the encoders and computing severity scores. Mini-batches of drug pairs should be sampled, and for each pair, two augmented versions should be generated using techniques such as masking, dropout, and perturbation-based inputs. These augmented inputs should be fed through the encoder. This should be followed by application of cross-attention. The output here should be sent to edge-aware graph attention layers, producing intermediate node and edge representations. From these representations, four intrinsic, label-free signals, vis-à-vis cross-attention intensity, edge salience, interaction nonlinearity, and graph anomaly, should be computed. These can be combined into a scalar severity score for each pair. The model parameters should then be updated through gradient descent to minimize an unsupervised contrastive loss. The model should simultaneously adjust the weights assigned to each intrinsic signal. This it should do by maximizing the mutual information between the severity scores of the original and augmented views. A regularization can be applied to prevent trivial solutions.
In the second step, analogous to the M-step, the focus should shift to calibrating the severity scores. The scalar scores from the first step can be used to fit a Gaussian mixture model with four ordered components. These signify four levels of drug–drug interaction severity. The mixture fitting should encourage the clusters to be consistently ordered from lowest to highest severity. Once the mixture is fit, the soft cluster probabilities should be computed for each drug pair. Temperature scaling should be applied to calibrate these probabilities across augmentations. This step should ensure probabilistic consistency. It should convert the continuous severity scores into well-calibrated and interpretable probability distributions over the four severity categories. The model should gradually learn meaningful embeddings, severity scores, and calibrated interaction labels without requiring any explicit supervised labels [68,69].
The proposed model can be extended to other types of DDI classifications, such as interaction mechanism, interaction directionality, therapeutic outcome impact, and so on. This can be done by adapting its label space, embeddings, and graph structure. More than just ordinal severity categories, it can be allowed to accommodate multi-class or multi-label outputs which reflect different interaction types. These include synergistic, antagonistic, and metabolic. Embeddings could be enriched with pharmacokinetic, pharmacodynamic, and drug–protein network information. This can help them encapsulate functional and mechanistic relationships.
Graph construction should be task-specific. Edges can represent relevant biochemical and clinical relationships. This will ensure the attention and EGAT layers focus on pertinent interactions. Appropriate loss functions, including multi-class, binary, and contrastive objectives, can be incorporated depending on the classification goal. Label-free pretraining should be retained for capturing relational patterns. This is particularly true for situations when labeled data are limited. Temporal and contextual factors, such as dosing order and genetic variants, may be integrated for context-dependent interactions. Explainability mechanisms like attention weights, edge salience, and pair embeddings should be adapted to highlight task-relevant features.
Conclusion
We present a versatile label-free framework for DDI prediction. It uses graph-based representations, attention mechanisms, and unsupervised learning. It incorporates multiple intrinsic signals and derives a severity score without relying on labeled data. The architecture demonstrates a strong potential for generalization across diverse datasets. The framework is inherently adaptable. This makes it suitable not only for ordinal severity classification but also for richer categorizations. These include interaction mechanisms, clinical outcomes, and temporal and dose-dependent effects.
The model opens numerous avenues for rigorous research. Its architecture can be systematically evaluated across large-scale pharmacological datasets and combined with pharmacogenomic and real-world electronic health record data. It can then be benchmarked against existing CDSSs [70]. The approach invites extension into multi-label, hierarchical, and probabilistic classification tasks. It allows researchers to explore subtle drug interaction patterns that are clinically useful. Consequently, our methodology provides a state-of-the-art, scalable, interpretable, and data-efficient pathway toward more intelligent, generalizable, customizable, and reliable DDI prediction in research as well as clinical settings.
References
- Sun, X.; Li, X. Editorial: Aging and Chronic Disease: Public Health Challenge and Education Reform. Front. Public Health 2023, 11, 1175898. [Google Scholar] [CrossRef]
- Boye, K.S.; Mody, R.; Lage, M.J.; Douglas, S.; Patel, H. Chronic Medication Burden and Complexity for US Patients with Type 2 Diabetes Treated with Glucose-Lowering Agents. Diabetes Ther. 2020, 11, 1513–1525. [Google Scholar] [CrossRef] [PubMed]
- Hughes, J.E.; Moriarty, F.; Bennett, K.E.; Cahir, C. Drug–Drug Interactions and the Risk of Adverse Drug Reaction-Related Hospital Admissions in the Older Population. Br. J. Clin. Pharmacol. 2024, 90, 959–975. [Google Scholar] [CrossRef]
- Peng, Y.; Cheng, Z.; Xie, F. Evaluation of Pharmacokinetic Drug-Drug Interactions: A Review of the Mechanisms, In Vitro and In Silico Approaches. Metabolites 2021, 11, 75. [Google Scholar] [CrossRef]
- Hernandez, R.K.; Critchlow, C.W.; Dreyer, N.; Lash, T.L.; Reynolds, R.F.; Sørensen, H.T.; Lange, J.L.; Gatto, N.M.; Sobel, R.E.; Lai, E.C.; Schoonen, M.; Brown, J.S.; Christian, J.B.; Brookhart, M.A.; Bradbury, B.D. Advancing Principled Pharmacoepidemiologic Research to Support Regulatory and Healthcare Decision Making: The Era of Real-World Evidence. Clin. Pharmacol. Ther. 2025, 117, 927–937. [Google Scholar] [CrossRef]
- Varghese, D.; Ishida, C.; Patel, P.; et al. Polypharmacy. In StatPearls [Internet]; StatPearls Publishing: Treasure Island, FL, USA, 2025; Available online: https://www.ncbi.nlm.nih.gov/books/NBK532953/ (accessed on 5 September 2025).
- Alhumaidi, R.M.; Bamagous, G.A.; Alsanosi, S.M.; Alqashqari, H.S.; Qadhi, R.S.; Alhindi, Y.Z.; Ayoub, N.; Falemban, A.H. Risk of Polypharmacy and Its Outcome in Terms of Drug Interaction in an Elderly Population: A Retrospective Cross-Sectional Study. J. Clin. Med. 2023, 12, 3960. [Google Scholar] [CrossRef]
- Hammar, T.; Hamqvist, S.; Zetterholm, M.; Jokela, P.; Ferati, M. Current Knowledge about Providing Drug-Drug Interaction Services for Patients—A Scoping Review. Pharm. 2021, 9, 69. [Google Scholar] [CrossRef] [PubMed]
- Saxena, R.R.; Khan, A. Assessing the Practicality of Designing a Comprehensive Intelligent Conversation Agent to Assist in Dementia Care. In Proceedings of the 18th International Joint Conference on Biomedical Engineering Systems and Technologies—HEALTHINF, Rome, Italy, 18–20 February 2025; SciTePress: Setúbal, Portugal, 2025; pp. 655–663, ISBN 978-989-758-731-3. [Google Scholar] [CrossRef]
- Niu, J.; Straubinger, R.M.; Mager, D.E. Pharmacodynamic Drug-Drug Interactions. Clin. Pharmacol. Ther. 2019, 105, 1395–1406. [Google Scholar] [CrossRef] [PubMed]
- Palleria, C.; Di Paolo, A.; Giofrè, C.; Caglioti, C.; Leuzzi, G.; Siniscalchi, A.; De Sarro, G.; Gallelli, L. Pharmacokinetic Drug-Drug Interaction and Their Implication in Clinical Management. J. Res. Med. Sci. 2013, 18, 601–610. [Google Scholar]
- Choi, Y.H. Interpretation of Drug Interaction Using Systemic and Local Tissue Exposure Changes. Pharmaceutics 2020, 12, 417. [Google Scholar] [CrossRef] [PubMed]
- Sun, L.; Mi, K.; Hou, Y.; Hui, T.; Zhang, L.; Tao, Y.; Liu, Z.; Huang, L. Pharmacokinetic and Pharmacodynamic Drug-Drug Interactions: Research Methods and Applications. Metabolites 2023, 13, 897. [Google Scholar] [CrossRef]
- Kennedy, C.; Brewer, L.; Williams, D. Drug Interactions. Med. 2016, 44, 422–426. [Google Scholar] [CrossRef]
- Deodhar, M.; Al Rihani, S.B.; Arwood, M.J.; Darakjian, L.; Dow, P.; Turgeon, J.; Michaud, V. Mechanisms of CYP450 Inhibition: Understanding Drug-Drug Interactions Due to Mechanism-Based Inhibition in Clinical Practice. Pharmaceutics 2020, 12, 846. [Google Scholar] [CrossRef] [PubMed]
- Radu, A.-F.; Radu, A.; Tit, D.M.; Bungau, G.; Negru, P.A. Mapping the Global Research on Drug–Drug Interactions: A Multidecadal Evolution Through AI-Driven Terminology Standardization. Bioengineering 2025, 12, 783. [Google Scholar] [CrossRef]
- Prueksaritanont, T.; Chu, X.; Gibson, C.; Cui, D.; Yee, K.L.; Ballard, J.; Cabalu, T.; Hochman, J. Drug-Drug Interaction Studies: Regulatory Guidance and an Industry Perspective. AAPS J. 2013, 15, 629–645. [Google Scholar] [CrossRef]
- Kraynov, E.; Martin, S.W.; Hurst, S.; Fahmi, O.A.; Dowty, M.; Cronenberger, C.; Loi, C.M.; Kuang, B.; Fields, O.; Fountain, S.; Awwad, M.; Wang, D. How Current Understanding of Clearance Mechanisms and Pharmacodynamics of Therapeutic Proteins Can Be Applied for Evaluation of Their Drug-Drug Interaction Potential. Drug Metab. Dispos. 2011, 39, 1779–1783. [Google Scholar] [CrossRef]
- Sager, J.E.; Yu, J.; Ragueneau-Majlessi, I.; Isoherranen, N. Physiologically Based Pharmacokinetic (PBPK) Modeling and Simulation Approaches: A Systematic Review of Published Models, Applications, and Model Verification. Drug Metab. Dispos. 2015, 43, 1823–1837. [Google Scholar] [CrossRef]
- Fillinger, L.; Walter, S.; Ley, M.; Kęska-Izworska, K.; Ghasemi Dehkordi, L.; Kratochwill, K.; Perco, P. Computational Modeling Approaches and Regulatory Pathways for Drug Combinations. Drug Discov. Today 2025, 30, 104345. [Google Scholar] [CrossRef]
- Singh, S.; Kumar, R.; Payra, S.; Singh, S.K. Artificial Intelligence and Machine Learning in Pharmacological Research: Bridging the Gap Between Data and Drug Discovery. Cureus 2023, 15, e44359. [Google Scholar] [CrossRef]
- Microsoft. Many-to-Many Relationships. Microsoft Learn. Available online: https://learn.microsoft.com/en-us/ef/core/modeling/relationships/many-to-many (accessed on 6 September 2025).
- Zantvoort, K.; Hentati Isacsson, N.; Funk, B.; Kaldo, V. Dataset Size versus Homogeneity: A Machine Learning Study on Pooling Intervention Data in E-Mental Health Dropout Predictions. Digit. Health 2024, 10, 20552076241248920. [Google Scholar] [CrossRef]
- Borsboom, D.; Deserno, M.K.; Rhemtulla, M.; Epskamp, S.; Fried, E.I.; McNally, R.J.; Robinaugh, D.J.; Perugini, M.; Dalege, J.; Costantini, G.; Isvoranu, A.-M.; Wysocki, A.C.; van Borkulo, C.D.; van Bork, R.; Waldorp, L.J. Network Analysis of Multivariate Data in Psychological Science. Nat. Rev. Methods Primers 2021, 1, 58. [Google Scholar] [CrossRef]
- Choudhary, K.; DeCost, B.; Chen, C.; et al. Recent Advances and Applications of Deep Learning Methods in Materials Science. NPJ Comput. Mater. 2022, 8, 59. [Google Scholar] [CrossRef]
- Osl, M.; Dreiseitl, S.; Kim, J.; Patel, K.; Baumgartner, C.; Ohno-Machado, L. Effect of Data Combination on Predictive Modeling: A Study Using Gene Expression Data. In Proceedings of the AMIA Annual Symposium; 2010; pp. 567–571. [Google Scholar]
- Bailly, A.; Blanc, C.; Francis, É.; Guillotin, T.; Jamal, F.; Wakim, B.; Roy, P. Effects of Dataset Size and Interactions on the Prediction Performance of Logistic Regression and Deep Learning Models. Comput. Methods Programs Biomed. 2022, 213, 106504. [Google Scholar] [CrossRef] [PubMed]
- Fernández-Torras, A.; Duran-Frigola, M.; Bertoni, M.; Locatelli, M.; Aloy, P. Integrating and Formatting Biomedical Data as Pre-Calculated Knowledge Graph Embeddings in the Bioteque. Nat. Commun. 2022, 13, 5304. [Google Scholar] [CrossRef]
- Chang, C.; Hwang, J.; Shi, Y.; Wang, H.; Peng, W.-C.; Chen, T.-F.; Wang, W. Time-IMM: A Dataset and Benchmark for Irregular Multimodal Multivariate Time Series. arXiv 2025. [Google Scholar] [CrossRef]
- Nyamabo, A.K.; Yu, H.; Liu, Z.; Shi, J.-Y. Drug–Drug Interaction Prediction with Learnable Size-Adaptive Molecular Substructures. Brief. Bioinform. 2022, 23, bbab441. [Google Scholar] [CrossRef]
- Jang, H.Y.; Song, J.; Kim, J.H.; Lee, H.; Kim, I.-W.; Moon, B.; Oh, J.M. Machine Learning-Based Quantitative Prediction of Drug Exposure in Drug-Drug Interactions Using Drug Label Information. NPJ Digit. Med. 2022, 5, 88. [Google Scholar] [CrossRef]
- Constantinou, C.; Ellinas, G.; Panayiotou, C.; Polycarpou, M. Shortest Path Routing in Transportation Networks with Time-Dependent Road Speeds. In Proceedings of the 2016 International Conference on Computational Logistics; 2016; pp. 91–98. [Google Scholar] [CrossRef]
- Albattah, W.; Khan, R.U. Impact of Imbalanced Features on Large Datasets. Front. Big Data 2025, 8, 1455442. [Google Scholar] [CrossRef]
- Gabasova, E.; Reid, J.; Wernisch, L. Clusternomics: Integrative Context-Dependent Clustering for Heterogeneous Datasets. PLoS Comput. Biol. 2017, 13, e1005781. [Google Scholar] [CrossRef]
- Morris, J.X.; Rush, A.M. Contextual Document Embeddings. arXiv 2024. [Google Scholar] [CrossRef]
- Shen, J.; Ain, Q.T.; Liu, Y.; Liang, B.; Qiang, X.; Kou, Z. GTAT: Empowering Graph Neural Networks with Cross Attention. Sci. Rep. 2025, 15, 4760. [Google Scholar] [CrossRef]
- Zhang, X.; He, C.; He, Y.; Peng, J.; Fu, D.; Tan, T.-P. ESNERA: Empirical and Semantic Named Entity Alignment for Named Entity Dataset Merging. arXiv 2025. [CrossRef]
- Zeighami, S.; Seshadri, R.; Shahabi, C. A Neural Database for Answering Aggregate Queries on Incomplete Relational Data. IEEE Trans. Knowl. Data Eng. 2024, 36, 2790–2802. [Google Scholar] [CrossRef]
- Chen, T.; Lu, D.; Kan, M.-Y.; Cui, P. Understanding and Classifying Image Tweets. In Proceedings of the 2013 ACM Multimedia Conference, Barcelona, Spain; 2013; pp. 781–784. [Google Scholar] [CrossRef]
- Edelman, B. Combinatorial Tasks as Model Systems of Deep Learning. Doctoral dissertation, Harvard University Graduate School of Arts and Sciences, 2024. Available online: https://nrs.harvard.edu/URN-3:HUL.INSTREPOS:37379085.
- Mahler, B.I. Contagion Dynamics for Manifold Learning. Front. Big Data 2022, 5, 668356. [Google Scholar] [CrossRef] [PubMed]
- Gerritse, E.J.; Hasibi, F.; de Vries, A.P. Graph-Embedding Empowered Entity Retrieval. arXiv 2025. [CrossRef]
- Zhou, Y.; Huo, H.; Hou, Z.; Bu, L.; Mao, J.; Wang, Y.; Lv, X.; Bu, F. Co-Embedding of Edges and Nodes with Deep Graph Convolutional Neural Networks. Sci. Rep. 2023, 13, 16966. [Google Scholar] [CrossRef]
- Javeed, A. A Hybrid Attention Mechanism for Multi-Target Entity Relation Extraction Using Graph Neural Networks. Mach. Learn. Appl. 2023, 11, 100444. [Google Scholar] [CrossRef]
- Vrahatis, A.G.; Lazaros, K.; Kotsiantis, S. Graph Attention Networks: A Comprehensive Review of Methods and Applications. Future Internet 2024, 16, 318. [Google Scholar] [CrossRef]
- Nejati, M.; Lakizadeh, A. GADNN: A Graph Attention-Based Method for Drug-Drug Association Prediction Considering the Contribution Rate of Different Types of Drug-Related Features. Inform. Med. Unlocked 2024, 44, 101429. [Google Scholar] [CrossRef]
- Sánchez-Valle, J.; Correia, R.B.; Camacho-Artacho, M.; Lepore, R.; Mattos, M.M.; Rocha, L.M.; Valencia, A. Prevalence and Differences in the Co-Administration of Drugs Known to Interact: An Analysis of Three Distinct and Large Populations. BMC Med. 2024, 22, 166. [Google Scholar] [CrossRef]
- Chen, Y.; Wang, J.; Zou, Q.; Niu, M.; Ding, Y.; Song, J.; Wang, Y. DrugDAGT: A Dual-Attention Graph Transformer with Contrastive Learning Improves Drug-Drug Interaction Prediction. BMC Biol. 2024, 22, 233. [Google Scholar] [CrossRef]
- Noor, A.; Assiri, A. A Rule-Based Inference Framework to Explore and Explain the Biological Related Mechanisms of Potential Drug-Drug Interactions. Comput. Math. Methods Med. 2022, 2022, 9093262. [Google Scholar] [CrossRef]
- Gheorghita, I.-F.; Bocanet, V.-I.; Iantovics, L.B. Fine-Tuning BiomedBERT with LoRA and Pseudo-Labeling for Accurate Drug–Drug Interactions Classification. Appl. Sci. 2025, 15, 8653. [Google Scholar] [CrossRef]
- Chakraborty, S.; Bisong, E.; Bhatt, S.; Wagner, T.; Elliott, R.; Mosconi, F. BioMedBERT: A Pre-Trained Biomedical Language Model for QA and IR. In Proceedings of the 28th International Conference on Computational Linguistics, Barcelona, Spain (Online), 2020; pp. 669–679. [Google Scholar]
- Hakim, S.; Ngom, A. PolyLLM: Polypharmacy Side Effect Prediction via LLM-Based SMILES Encodings. Front. Pharmacol. 2025, 16, 1617142. [Google Scholar] [CrossRef]
- Chithrananda, S.; Grand, G.; Ramsundar, B. ChemBERTa: Large-Scale Self-Supervised Pretraining for Molecular Property Prediction. arXiv 2020. [CrossRef]
- Das, B.; Dagdogen, H.A.; Kaya, M.O.; Tuncel, O.; Akgul, M.S.; Das, R. GAINET: Enhancing Drug–Drug Interaction Predictions through Graph Neural Networks and Attention Mechanisms. Chemom. Intell. Lab. Syst. 2025, 259, 105337. [Google Scholar] [CrossRef]
- Deng, Z.; Xu, J.; Feng, Y.; Dong, L.; Zhang, Y. MAVGAE: A Multimodal Framework for Predicting Asymmetric Drug-Drug Interactions Based on Variational Graph Autoencoder. Comput. Methods Biomech. Biomed. Engin. 2025, 28, 1098–1110. [Google Scholar] [CrossRef] [PubMed]
- Tan, X.; Fan, S.; Duan, K.; Xu, M.; Zhang, J.; Sun, P.; Ma, Z. A Novel Drug-Drug Interactions Prediction Method Based on a Graph Attention Network. Electron. Res. Arch. 2023, 31, 5632–5648. [Google Scholar] [CrossRef]
- Nguyen, T.G.B.; Le, M.-C.; Nguyen, V.-K.; Nguyen, H.-S.; Nguyen, C.-V.T.; Le, D.-T.; Can, D.-C.; Le, H.-Q. Towards Explainable Polypharmacy Risk Warnings Using Reinforcement Learning on Knowledge Graphs. In Proceedings of the 10th International Conference on the Development of Biomedical Engineering in Vietnam, BME 2024; Vo, V.T., Nguyen, T.H., Vong, B.L., Pham, T.T.H., Doan, N.H., Eds. Springer: Cham, Switzerland, 2025; Volume 122, pp. 473–480. [Google Scholar] [CrossRef]
- Dou, Y.; Deng, Z.; Xing, T.; Xiao, J.; Peng, S. Autonomous Pharmaceutical Care with Large Language Models. Preprint 2024. [Google Scholar] [CrossRef]
- Bischof, T.; Al Jalali, V.; Zeitlinger, M.; Jorda, A.; Hana, M.; Singeorzan, K.N.; Riesenhuber, N.; Stemer, G.; Schoergenhofer, C. Chat GPT vs. Clinical Decision Support Systems in the Analysis of Drug-Drug Interactions. Clin. Pharmacol. Ther. 2025, 117, 1142–1147. [Google Scholar] [CrossRef]
- Xiao, J.; Li, M.; Cai, R.; Huang, H.; Yu, H.; Huang, L.; Li, J.; Yu, T.; Zhang, J.; Cheng, S. Smart Pharmaceutical Monitoring System with Personalized Medication Schedules and Self-Management Programs for Patients with Diabetes: Development and Evaluation Study. J. Med. Internet Res. 2025, 27, e56737. [Google Scholar] [CrossRef]
- Yılmaz, T.; Ceyhan, Ş.; Akyön, Ş.H.; Yılmaz, T.E. Enhancing Primary Care for Nursing Home Patients with an Artificial Intelligence-Aided Rational Drug Use Web Assistant. J. Clin. Med. 2023, 12, 6549. [Google Scholar] [CrossRef]
- Akyon, Ş.H.; Akyon, F.C.; Yılmaz, T.E. Artificial Intelligence-Supported Web Application Design and Development for Reducing Polypharmacy Side Effects and Supporting Rational Drug Use in Geriatric Patients. Front. Med. 2023, 10, 1029198. [Google Scholar] [CrossRef]
- Shirazibeheshti, A.; Ettefaghian, A.; Khanizadeh, F.; Wilson, G.; Radwan, T.; Luca, C. Automated Detection of Patients at High Risk of Polypharmacy Including Anticholinergic and Sedative Medications. Int. J. Environ. Res. Public Health 2023, 20, 6178. [Google Scholar] [CrossRef] [PubMed]
- Lagumdzija-Kulenovic, A.; Kulenovic, A. Minimization of the Drug and Gene Interactions in Polypharmacy Therapies Augmented with COVID-19 Medications. Stud. Health Technol. Inform. 2022, 289, 114–117. [Google Scholar] [CrossRef]
- Silva, P.; Jacobs, D.; Kriak, J.; Abu-Baker, A.; Udeani, G.; Neal, G.; Ramos, K. Implementation of Pharmacogenomics and Artificial Intelligence Tools for Chronic Disease Management in Primary Care Setting. J. Pers. Med. 2021, 11, 443. [Google Scholar] [CrossRef]
- Rusak, E.; Reizinger, P.; Juhos, A.; Bringmann, O.; Zimmermann, R.S.; Brendel, W. InfoNCE: Identifying the Gap Between Theory and Practice. arXiv 2024. [Google Scholar] [CrossRef]
- Peng, Z.; Huang, W.; Luo, M.; Zheng, Q.; Rong, Y.; Xu, T.; Huang, J. Graph Representation Learning via Graphical Mutual Information Maximization. arXiv 2020, arXiv:2002.01169. [Google Scholar] [CrossRef]
- Raja, R.; Vats, A.; Vats, A.; Majumder, A. A Comprehensive Review on Harnessing Large Language Models to Overcome Recommender System Challenges. arXiv 2025, arXiv:2507.21117. [Google Scholar] [CrossRef]
- Saxena, R.R.; Khan, A. Modernizing Medicine Through a Proof of Concept that Studies the Intersection of Robotic Exoskeletons, Computational Capacities and Dementia Care. In Health Informatics and Medical Systems and Biomedical Engineering, CSCE 2024, Communications in Computer and Information Science, vol. 2259; Alsadoon, A., Shenavarmasouleh, F., Amirian, S., Ghareh Mohammadi, F., Arabnia, H.R., Deligiannidis, L., Eds.; Springer: Cham, Switzerland, 2025. [Google Scholar] [CrossRef]
- Saxena, R.R.; Khan, A. Machine Learning-Based Clinical Decision Support Systems in Dementia Care. In Proceedings of the 18th International Joint Conference on Biomedical Engineering Systems and Technologies—HEALTHINF.; SciTePress: Setúbal, Portugal, 2025; pp. 664–671. [Google Scholar] [CrossRef]
Figure 1.
Overview of the proposed framework for drug–drug interaction prediction.
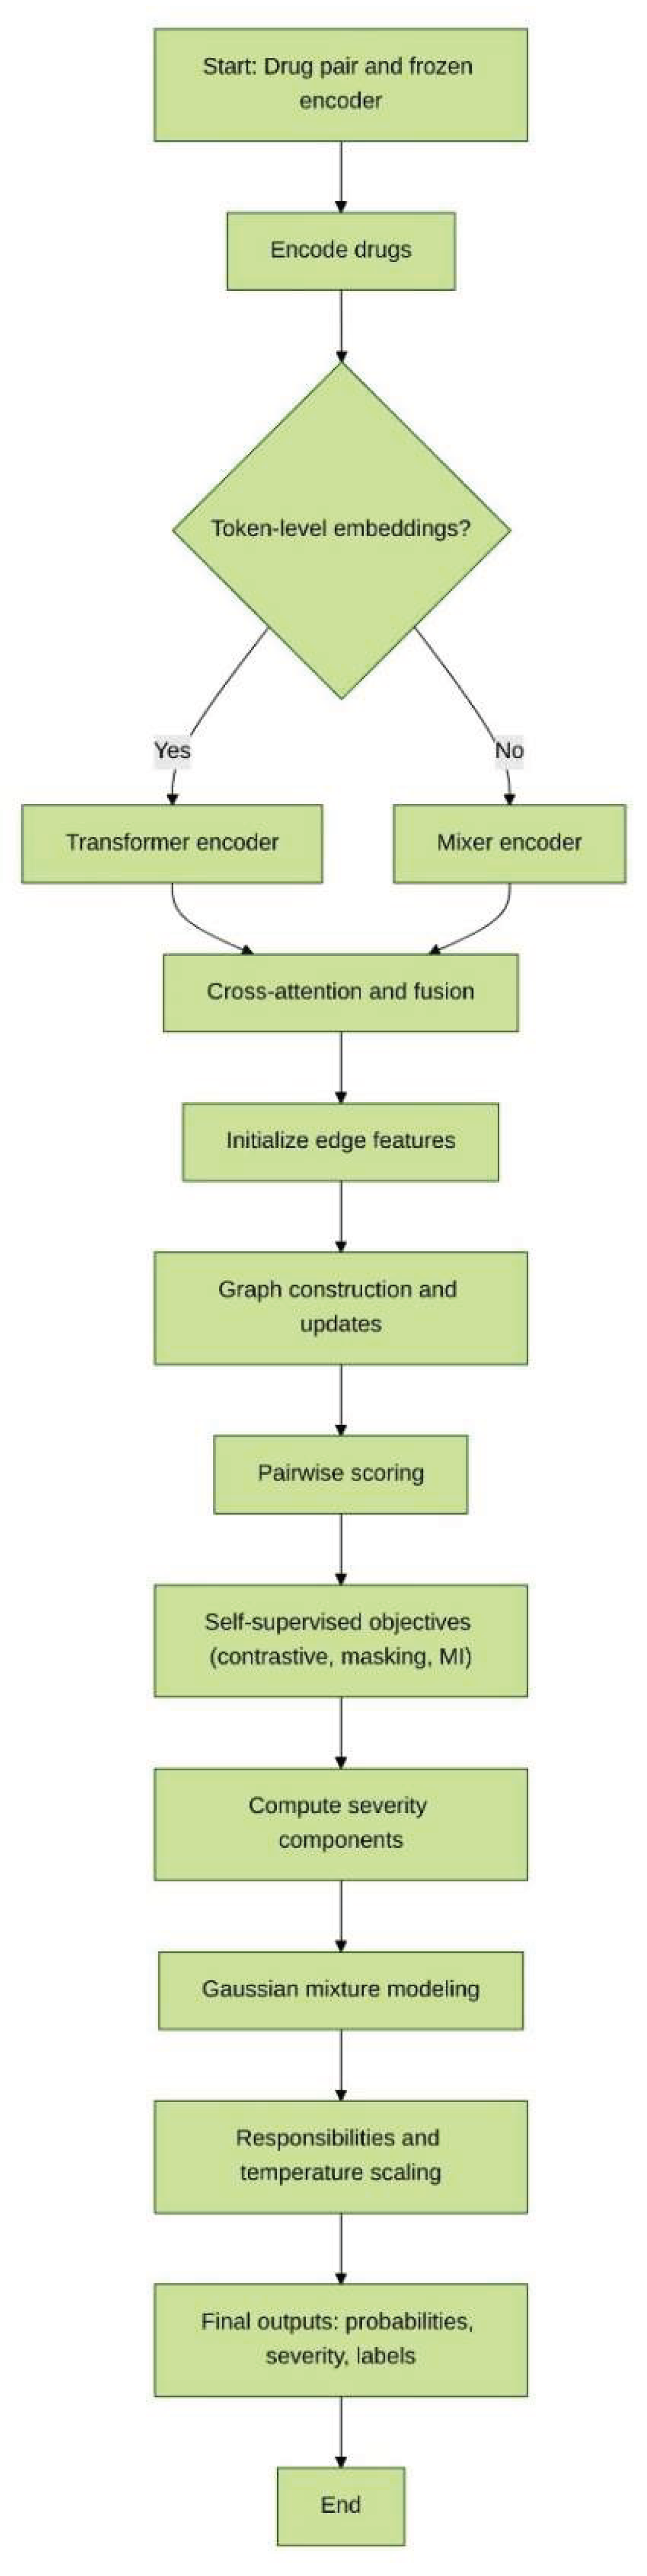
Table 1.
Comparison of One-to-One and Many-to-Many Data Mappings Across Fusion Complexity, Aggregation Needs, Suitable Methods, and Ambiguity.
Table 1.
Comparison of One-to-One and Many-to-Many Data Mappings Across Fusion Complexity, Aggregation Needs, Suitable Methods, and Ambiguity.
| Feature | One-to-One Mapping | Many-to-Many Mapping |
|---|---|---|
| Fusion Complexity | Low | High |
| Need for Aggregation | No | Yes |
| Suitable Methods | Pairwise concatenation /attention | Attention over neighbors, graph embeddings |
| Ambiguity | None | Present (multiple matches per entity) |
Table 3.
Summary of the self-supervised objectives in the proposed framework.
| Loss | Niche (Where it fits) | Function (What it enforces) |
|---|---|---|
| Contrastive loss | Applied to drug pair embeddings after encoding and fusion. | Encourages consistent representations of positive (true) pairs while pushing apart negatives. |
| Masked prediction loss | Applied to hidden node/edge attributes within the graph. | Trains the model to reconstruct masked features, improving robustness and capturing local detail. |
| Mutual information loss | Applied between local pair representations and global graph summary. | Maximizes shared information, ensuring that pair embeddings remain aligned with global context. |
Disclaimer/Publisher’s Note: The statements, opinions and data contained in all publications are solely those of the individual author(s) and contributor(s) and not of MDPI and/or the editor(s). MDPI and/or the editor(s) disclaim responsibility for any injury to people or property resulting from any ideas, methods, instructions or products referred to in the content. |
© 2025 by the authors. Licensee MDPI, Basel, Switzerland. This article is an open access article distributed under the terms and conditions of the Creative Commons Attribution (CC BY) license (http://creativecommons.org/licenses/by/4.0/).
Copyright: This open access article is published under a Creative Commons CC BY 4.0 license, which permit the free download, distribution, and reuse, provided that the author and preprint are cited in any reuse.


