
Submitted:
13 September 2025
Posted:
15 September 2025
You are already at the latest version
Abstract
This study examines the financial behavior of university students in Economics, Business Administration, and Accounting in Tegucigalpa, Honduras, using the FB–13 instrument. Exploratory and confirmatory factor analyses validate a three-dimensional structure: (1) financial planning and control, (2) savings and financial preparation, and (3) fulfillment of obligations, with high internal consistency (α = 0.915), supporting its psychometric robustness in Latin American academic contexts. Based on a sample of 714 students with variation in gender, age, work experience, and parental status, the findings reveal significant correlations between financial behavior and experiential variables such as work experience and parenthood, while traditional sociodemographic attributes show limited association. These results highlight the relevance of lived experiences in shaping financial practices and address a notable gap in culturally grounded validation of financial behavior instruments. The study acknowledges limitations related to cross-sectional design, non-probabilistic sampling, and self-reported data, yet these do not diminish its contributions. By validating the FB–13 in Honduras, the research offers comparative evidence and promotes cultural diversity in financial behavior literature. Future research should pursue longitudinal and qualitative approaches, assess the role of digital financial tools, and inform educational and institutional strategies that integrate family and work contexts to strengthen financial literacy and resilience among university students.
Keywords:
financial behavior
; saving behavior
; financial planning
; budgeting
; psychometric validation
; work experience
; parenthood
; higher education
; university students
; Latin America
1. Introduction
Financial behavior is a key area for understanding how individuals, households, couples, and businesses manage their economic resources to achieve financial well-being, optimize investments, and assess risks. This theoretical construct goes beyond simple spending or saving decisions, involving a complex web of cognitive, psychological, social, educational, technological, and institutional factors. Although recent studies have emphasized the multidimensional nature of financial behavior, integrating decisions, habits, and strategies shaped by individual characteristics and external influences, there remains a notable gap in empirical validation of measurement instruments across culturally diverse populations (Li & Liu, 2025; Faturohman et al., 2024; Pham & Le, 2023; Patrisia et al., 2023; Fernández-Guadaño, 2015).
At the individual level, financial behavior acts as a mediator between personal factors and economic well-being. Constructs such as financial self-efficacy, literacy, and locus of control influence how individuals engage with digital tools and social media to optimize decisions (Faturohman et al., 2024). Early financial education, particularly among young women, has shown positive effects on understanding interest rates, portfolio diversification, and savings habits (Bae et al., 2022; Abril-Teatin et al., 2022). However, knowledge alone does not guarantee responsible financial practices, highlighting the need to translate theoretical understanding into sustainable actions (Bhatia & Singh, 2024; Cwynar, 2021). Despite these insights, few studies have examined whether such behavioral constructs retain their validity in underrepresented cultural contexts, such as Central America.
Family and social factors also shape financial behavior. Financial socialization, through family and close surroundings, plays a decisive role in forming habits and attitudes. Studies in Indonesia and Malaysia have shown that family communication and religious financial education during the COVID-19 pandemic influence risk tolerance and economic well-being (Patrisia et al., 2023; Sabri et al., 2024). Observing parental and peer practices reinforces autonomy and self-efficacy (Vijaykumar, 2022; Kreiner et al., 2020). Yet, the intergenerational transmission of financial habits has not been sufficiently explored in Latin American contexts, where cultural and institutional dynamics may differ significantly.
From a psychological and biological perspective, factors such as self-control, emotions, optimism, hormones, and neurotransmitters modulate decision-making and risk perception (Ghazali et al., 2025; Beytollahi, 2020; Viktorovna & Mikhailovna, 2020). These findings challenge the notion of purely rational financial behavior and underscore the importance of affective and cognitive processes. In socially vulnerable populations, such as individuals undergoing reintegration, biographical factors like detention length and perceived control influence financial intentions (Mielitz & MacDonald, 2021). However, the extent to which these psychological dimensions interact with sociodemographic variables in Latin American youth remains underexplored.
In the corporate sphere, financial behavior reflects strategic decisions influenced by expectations, sustainability policies, and social responsibility standards. Research shows that sustainable practices can enhance resilience and investor confidence (Fernández-Guadaño, 2015), while innovation-driven firms adjust debt levels based on profitability and credit constraints (Bartoloni, 2013; Fidrmuc & Horky, 2023). Although parallels exist between individual and corporate decision-making, the contextual specificity of these mechanisms calls for localized empirical validation.
A critical and understudied dimension is the relationship between financial behavior and sociodemographic variables. Age, gender, education, and income shape behavioral patterns, but these effects vary across cultural and institutional settings (Long & Tue, 2024; dos Santos & Barros, 2011; Xiao & Meng, 2024; Cwynar, 2021). For instance, while older adults and women often exhibit structured financial habits, younger individuals with high literacy engage more actively in investment and savings. Yet, such trends are not universal, and comparative evidence from Central America is scarce.
Time horizons also mediate financial behavior, with short- and long-term decisions differing by age and knowledge levels (Pham & Le, 2023). This challenges the effectiveness of uniform financial education policies. In Vietnam and peri-urban communities, integrated approaches combining family socialization and technology have proven more effective than purely theoretical instruction (Kumar et al., 2024; Pham & Le, 2023). Whether similar strategies apply in Honduras remains an open question.
The digital context adds further complexity. Online platforms reshape the relationship between trust, knowledge, and behavior. Vulnerable populations are particularly affected by perceived security, privacy, and data transparency (Xiong et al., 2022; Rahman et al., 2021). These findings suggest that technological and regulatory factors mediate financial behavior beyond sociodemographic attributes.
Evidence on formal education and literacy programs remains mixed. While early and family-centered interventions promote autonomy and gender equity, traditional programs often fail to capture behavioral complexity (Kislitsyn, 2020; Bae et al., 2022). This underscores the need for culturally sensitive strategies that integrate psychological, technological, and sociodemographic dimensions.
Finally, financial behavior evolves with institutional and economic changes. Corporate financialization, credit access, and market fluctuations reflect the interplay between individual and collective decisions (Van Gunten & Navot, 2018; Davis, 2016; Clayton et al., 2007). Heuristics and emotions further modulate rationality, producing variations by gender, age, and income (dos Santos & Barros, 2011). Thus, a multidimensional approach is essential—one that incorporates cultural diversity, emerging technologies, and institutional structures.
In summary, although financial behavior has been widely studied, significant gaps persist in validating its measurement and correlates across culturally diverse populations. This study addresses these gaps by examining the factorial structure and sociodemographic correlations of the FB–13 scale in undergraduate students in Tegucigalpa, Honduras. By doing so, it contributes original evidence to the literature, offering a comparative perspective and enriching the understanding of financial behavior through the lens of cultural diversity (Xiao & Porto, 2022; Warchlewska, 2024; Patrisia et al., 2023).
2. Materials and Methods
2.1. Participants
The study was conducted in Tegucigalpa, the capital of Honduras, with the aim of describing and analyzing the financial behavior of the undergraduate population studying economics, administrative sciences, and accounting. A total of 714 undergraduate students from the National Autonomous University of Honduras (UNAH) participated (37% men and 63% women), aged between 16 and 45, residing in rural (19%) and urban (81%) areas.
The students were in their first to fifth year of their bachelor's degree and were selected using non-probabilistic convenience sampling, ensuring representation by age, gender, and residence. The inclusion criteria considered current undergraduate enrollment at UNAH in economics, administrative sciences, and accounting, and the absence of cognitive or physical conditions that would hinder comprehension or application of the instruments.
2.2. Context
Honduras is classified as a lower-middle-income country by the World Bank and has a population of around 9.6 million. Its age structure is markedly young, with almost 28% under the age of 15, just 6% over the age of 65, and a median age of 25.3, which represents a potential demographic dividend but also significant challenges in terms of employment, education, and migration. Although nearly 60% of the population lives in urban areas, mainly in Tegucigalpa, the political and administrative capital, and in San Pedro Sula and Choloma, industrial hubs, there is still a large rural population characterized by poverty, informality, and limited access to services. This urban concentration, together with territorial inequalities, violence, and climate vulnerability, drives both internal migration to cities and international emigration, especially to the United States. (Central Intelligence Agency, 2025).
2.3. Instruments
A validated instrument was used to collect information on financial behavior consisting of 13 items (FB–13, see Appendix A). Each item is answered using a 5-point Likert scale: never, rarely, sometimes, often, and always. This questionnaire was self-administered in digital format, after obtaining informed consent from each student, and without collecting identifiable information. The instrument was created in Spanish in Ecuador and validated in university students, demonstrating high reliability (α = 0.857) and adequate psychometric validity (Méndez-Prado et al., 2022).
2.4. Data Analysis and Processing Procedures
The research aim established in the previous section has been accompanied by two types of hypotheses, which are detailed below.
Hypothesis of the factors:
H1:
The FB-13 scale has a factorial structure composed of single factor that fits the theoretical model well, showing acceptable fit indices in both exploratory and confirmatory factor analysis in undergraduate in Tegucigalpa, Honduras.
H01:
The factor structure of the FB-13 scale does not fit the theoretical model of single factor, showing significant differences in factor configuration or inadequate fit indices in exploratory and/or confirmatory factor analysis in undergraduate in Tegucigalpa, Honduras.
Hypothesis of the correlations:
H2:
(Alternative hypothesis): There is a significant correlation between the sociodemographic variable and FB-13 scale, such that FB-13 scores would vary as individuals’ sociodemographic variables vary, in undergraduate in Tegucigalpa, Honduras.
H02:
(Null hypothesis): There is no significant correlation between the sociodemographic variable, and the FB-13 scale, in undergraduate in Tegucigalpa, Honduras.
Using SPSS version 23 software (IBM, New York, NY, USA), the 13 items of the FB–13 were analyzed by evaluating their psychometric properties (Méndez-Prado et al., 2022, Hughes, 2018). First, a univariate descriptive statistical analysis was executed, focusing on variance (>0), skewness (|≤1|), and kurtosis (|≤1|) (Ferrando et al., 2022). We find it necessary to give a slack of decimal points over 1, especially to the kurtosis in which we will allow a maximum of 1.8 (Ho & Yu, 2015).
To measure confidence levels, the authors applied the measurement of sampling adequacy (MSA) by anti-image correlation matrix (Kaiser, 1979), and Kaiser–Meyer–Olkin (KMO) measure of sampling adequacy. Furthermore, the authors used Bartlett’s test of sphericity to identify items that belonged to factors within the scale as a form of exploratory factor analysis (EFA) with extraction method unweighted least squares (ULS), and rotation method Oblimin with Kaiser normalization (Lloret-Segura et al., 2014), identifying through EFA the underlying structure of the data at the factor level, as a preliminary step to conducting a more structured analysis.
The authors then analyzed the exploratory factors using confirmatory factor analysis (CFA) developed with FACTOR version 12.01.02 software (Rovira i Virgili University, Tarragona, Spain) (Ferrando & Lorenzo-Seva, 2017), with polychoric correlation using Hull’s method and Robust Unweighted Least Squares (RULS) (Yang-Wallentin et al., 2010) and Rotation Normalized Direct Oblimin, revising the Measure of Sampling Adequacy (MSA) (Lorenzo-Seva & Ferrando, 2021), and choosing a set of factors that feature high communalities, strong factor loadings relative to the sample size, and a minimal number of items per factor (MIF) (Velicer & Fava, 1998, Lorenzo-Seva et al., 2011, Kyriazos, 2018, Sun, 2005). Reporting the indicators detailed in Table 1 (Schermelleh-Engel et al., 2003): Chi-square ratio/degree of freedom (χ2/df), root mean square error of approximation (RMSEA), adjusted goodness-of-fit index (AGFI), goodness-of-fit index (GFI), comparative fit index (CFI), non-normed fit index (NNFI), and root mean square root of residuals (RMSR) (Kalkan & Kelecioğlu, 2016). Thus, the CFA, based on the results of the EFA, makes it possible to confirm whether a theoretical factor structure fits the data well, verifying whether the proposed theoretical model of factors has empirical validity.
In addition, the internal reliability of the resulting instrument will be validated by calculating Cronbach’s Alpha using SPSS 23 software (Bonett & Wright, 2015).
Finally, once the empirical validity of the factors has been proven by the CFA, the resulting score of the FB–13 questionnaire will be obtained, to be analyzed in contrast with some relevant sample characteristics, identifying possible differences that affect socially responsible behavior results. Thus, the weighted financial behavior levels, given the latent factors, resulting from the evaluation of the students, will be analyzed by means of cross-tabulations between financial behavior and the variables: Gender (GEN), Age (AGE), Residential area (RSD), Marital status (MAS), Parental status (PAS), Work experience (WEP), Employed (EMP), Undergraduate level (UGL), using Chi-Square tests between these variables (Williams, 1950, Albrecht, 1980, Wuensch, 2025).
2.5. Ethical Procedures
The study was carried out in accordance with the ethical principles outlined in the Declaration of Helsinki for research involving human subjects. Written informed consent was obtained from the participating students (see Informed Consent Statement).
As this was a non-interventional observational study based on anonymous and non-invasive questionnaires, approval by a formal ethics committee, in accordance with the institutional regulations in force at the time of data collection.
3. Results
3.1. Sample Characterization
The financial behavior scale (FB – 13) (Méndez-Prado et al., 2022) was applied in the first academic semester 2025 to a set of 714 effective participants (≥200, overcoming small sample sizes for factorial analysis) (Wolf et al., 2013). The 714 participants are characterized as shown in Table 2.
3.2. Validation by Exploratory and Confirmatory Factor Analysis
First, the possible prevalence single factor identified by Méndez-Prado et al. (2022) in Ecuador was investigated. When performing the univariate descriptive statistical analysis, none of the ordinal variables showed a variance of zero, indicating that they all contribute to the common variance. And the variables present adequate skewness and kurtosis, as detailed in Table 3.
Therefore, 13 reported items can be considered for exploratory factor analysis (EFA) of the FB–13 questionnaire (Méndez-Prado et al., 2022). No items were lost due to having a factor loading below 0.40, see the scree plot in Figure 1. The presence of three factors within FB–13 is valid exclusively for this research and does not correspond to a version officially standardized by the original authors.
Table 4 shows the result of the exploratory factor analysis preserving 13 variables (items) with Cronbach´s Alpha 0.915 (>0.8) and determining with SPSS 23 a KMO of 0.917 and Bartlett’s test with a Chi-square of 5247.199 with 78 degrees of freedom and a significance level of 0.000 for the three factors of the FB–13 instrument. We obtained 59.715% of the variance explained. It should also be noted that all factors meet the minimum suggested number of items per factor (≥3) (Velicer, Fava, 1998, Wolf et al., 2013, Kyriazos, 2018). (See Anti-image correlation matrix in Table A1, Appendix A).
The authors also performed a confirmatory factor analysis (CFA) on the data set composed of 13 variables, using FACTOR software. The Measure of Sampling Adequacy (MSA) (Lorenzo-Seva, Ferrando, 2021) does not suggest eliminating items with confidence intervals at 90% and minimum values of more than 0.5.
Then, the CFA applied for a sample of 714 obtained a good KMO (Kaiser–Meyer–Olkin) equal to 0.91567 (>0.8) and Bartlett’s test of sphericity equal to 6726.4 with 190 degrees of freedom and a significance level of 0.000010. Those results are significant and good enough to present the adequacy of the polychoric correlation matrix (see Table 5). The authors then reduced the FB–13 questionnaire in terms of its latent variables into three factors (see Table 5), using the Hull method, implemented by performing an adequacy of the polychoric correlation matrix.
Table 6 sets out the proposed model results for the χ2/df, RMSEA, AGFI, GFI, CFI, NNFI (TLI), and RMSR indicators by FACTOR software with a good fit.
Finally, Table 7 shows the instrument’s internal reliability by SPSS 23 software, with a total Cronbach’s Alpha of 91.5% for the set of 13 items (See details in Table 7), and Figure 2 presents a histogram of the resulting scales.
Consequently, it is possible to assert that the proposed theoretical model of the factors has empirical validity:
- F1: “I take notes and keep track of my expenses (e.g., spreadsheet of expenses and income)” (FB1), “Before buying something, I compare prices of similar products” (FB2), “I have a spending plan or budget” (FB4), and “I am very competent in managing my finances” (FB5). Thus F1 → Financial Planning and Control.
- F2: “I save part of the money I receive to cover future needs” (FB3), “I save at least a minimum percentage of my income every month” (FB7), “I save regularly to achieve long-term financial goals” (FB10), “I save more when I receive a pay raise” (FB11), “I have a financial reserve of at least three times my monthly income, which I can use in unexpected circumstances” (FB12), and “In the last 12 months, I have been able to save money” (FB13). Thus F2 → Saving and Financial Preparation.
- F3: “I pay my bills without delay” (FB6), “I analyze my financial situation before making a major purchase” (FB8), and “I always pay my debts on time to avoid extra charges” (FB9). Thus F3 → Compliance Financial Obligations.
3.3. Resulting Scale Analysis
The confirmed scale with 13 items (FB–13) is analyzed using means of cross-tables with the variables: Gender (GEN), Age (AGE), Residential area (RSD), Marital status (MAS), Parental status (PAS), Work experience (WEP), Employed (EMP), Undergraduate level (UGL), using the Pearson Chi-Square Tests are reported (see Table 8).
Considering the valid tests, it can be concluded that there is an acceptable correlation between the factor “Saving and financial preparation” (F2) and the parental status (PAS). There is also a good correlation between work experience (WEP) and the factors “Financial planning and control” (F1) and “Financial behavior” (FT). These three results are reinforced by the set of Figure 3 showing the association between these pairs of variables. (see Figure 3).
To conclude Section 3, statistical analyses allowed us to test the proposed hypotheses. Regarding the factor structure, the null hypothesis (H01), which proposed that the FB–13 did not fit the theoretical unidimensional model, was accepted, while the alternative hypothesis (H1) was rejected. Exploratory and confirmatory analyses showed adequate fit indices and high internal reliability, for a model with 3 factors (Financial Planning and Control, Saving and Financial Preparation, and Compliance Financial Obligations) for the study population.
In relation to the correlation hypotheses, statistically significant associations were identified between the FB–13 and certain sociodemographic variables, specifically parental status and work experience. Conversely, no statistically significant relationships were observed between the FB–13 and the variables gender, age, residential area, marital status, employment status, or undergraduate level.
4. Discussion
The finding that conceptualizes financial behavior as a latent structure composed of financial planning and control, saving and preparation, and compliance with obligations is reflected in a fragmented but significant way in the studies reviewed. Ramli et al. (2023) identify budgeting, debt repayment, and emergency preparedness as key behavioral indicators among millennials, aligning with the dimensions of planning and saving. Herrador-Alcaide et al. (2021), from a structural perspective, link financial behavior with literacy, retirement goals, and risk tolerance, showing how financial management and resource availability shape long-term planning. Hallsworth et al. (2024), from a behavioral lens, demonstrate that framing inaction as an active decision increases tax compliance, empirically validating the dimension of financial obligations. Although these studies approach the construct from sociocultural, structural, and behavioral angles, they collectively reinforce the conceptual triangulation that supports the proposed model. However, most of this evidence stems from non-Latin American contexts, leaving a gap in understanding how these dimensions manifest in culturally distinct populations.
The correlation between savings and financial preparation (F2) and parental status (PAS) reveals how parenting reshapes household financial strategies. West et al. (2017) show that family composition influences financial priorities: single-parent households often focus on immediate needs, while dual-parent households with higher incomes can plan for long-term goals. Garrison et al. (2022) highlight the heightened financial stress experienced by families with children during the pandemic, while Collins et al. (2023) document how low-income parents adopt alternative strategies to navigate institutional barriers. These findings suggest that parenthood not only affects access to resources but also transforms motivations and adaptive behaviors. By validating this relationship in Honduran university students, this study contributes original evidence to the literature, offering a culturally grounded perspective on how parental status influences financial preparation in transitional life stages.
Work experience (WEP) also emerges as a key variable in shaping financial behavior. Johan et al. (2021) show that young people with work experience demonstrate greater financial knowledge and responsible habits, such as saving and planning. Rabadan (2025) complements this by noting that teachers with more professional experience manage their finances more effectively, particularly in debt repayment and expense prioritization. Rahman et al. (2021) further emphasize that financial behavior—especially saving and budgeting—is a stronger predictor of financial well-being than income alone, particularly among vulnerable populations. These findings support the theory of financial socialization (Gudmunson & Danes, 2011), which posits that experiential learning in dynamic contexts surpasses theoretical instruction. By examining this relationship in a Honduran academic population, the present study addresses a gap in the literature, offering comparative insights into how work experience fosters financial resilience in culturally specific settings.
Álvarez-Padilla et al. (2025) add a valuable dimension by showing that financial conversations within families, especially between parents and adolescents, reinforce the impact of work experience. Exposure to open discussions about money not only transfers practical knowledge but also builds confidence in financial management. This intergenerational dialogue complements workplace learning, suggesting that financial education should be understood as a multidimensional process rooted in both familial and professional contexts.
It is important to note that this study was conducted among graduate students in Economics, Administration, and Accounting Sciences, a population that combines academic training with varying degrees of parental and professional experience. This context enriches the interpretation of the findings, as it reflects the intersection between theoretical knowledge and lived financial realities. Moreover, by validating the FB–13 scale in Honduras, the study contributes to the international literature by incorporating culturally diverse evidence and expanding the comparative scope of financial behavior research.
Taken together, these findings invite a rethinking of financial education strategies. Rather than relying solely on formal instruction, they suggest integrating work environments and family interactions as key spaces for developing sound and sustainable financial habits. In doing so, this study not only addresses methodological gaps but also advances the inclusion of Latin American perspectives in the global understanding of financial behavior.
5. Conclusions
This study provides empirical evidence on the validity of the FB–13 instrument for assessing financial behavior in university students in Economics, Business Administration, and Accounting. The identification of a three-dimensional structure: (1) financial planning and control, (2) saving and financial preparation, and (3) fulfillment of obligations, not only deepens the understanding of everyday financial practices among young people but also reinforces the theoretical coherence of the scale in a Latin American context. By validating the FB–13 in Tegucigalpa, Honduras, this research contributes original and culturally grounded evidence to the international literature, expanding the comparative scope of financial behavior studies and addressing a notable gap in psychometric validation across diverse populations.
The observed influence of work experience and parental status on financial behavior highlights the importance of lived experiences in shaping economic decisions. These findings suggest that personal and professional trajectories may exert a stronger impact than traditional sociodemographic variables, underscoring the need to reconsider how financial education programs conceptualize behavioral determinants. In particular, the Honduran context offers a valuable lens through which to examine how financial habits are formed and adapted in transitional life stages, especially among young adults navigating academic and professional demands.
As with any research, this study has limitations. The use of a non-probability sample restricted to a single city calls for cautious interpretation of the results. Moreover, the cross-sectional design does not allow for causal inferences. It is also important to acknowledge that behind each response lies a unique story, questionnaires capture general patterns but may not fully reflect the emotional and contextual richness of financial decision-making. Recognizing these limitations frames the study transparently and opens space for future exploration.
Based on these findings, several avenues for further research and policy development emerge. Longitudinal studies could track the evolution of financial behavior over time, particularly during the transition to working life. Incorporating qualitative methodologies would allow for a deeper understanding of how family dynamics, emotional factors, and personal aspirations influence financial management. Additionally, the growing digitization of personal finances calls for an examination of how technological tools, such as budgeting apps, mobile banking, and financial education platforms, shape responsible habits among youth.
From a policy perspective, the results underscore the need for more inclusive and context-sensitive financial education strategies. Programs should integrate experiential learning, recognizing the role of work environments and family interactions as formative spaces for financial socialization. Likewise, institutional efforts must consider the heterogeneity of young populations, adapting interventions to their cultural, technological, and socioeconomic realities. In this regard, the Honduran validation of the FB–13 offers a foundation for designing regionally relevant tools and policies that promote financial resilience, equity, and autonomy.
Supplementary Materials
The following supporting information can be downloaded at the website of this paper posted on Preprints.org, Table S1: FB.csv.
Author Contributions
Conceptualization, I.M.-A. and A.V.-M.; methodology, A.V.-M.; validation, G.S.-S., D.C. and N.C.-B.; formal analysis, I.M.-A. and A.V.-M.; investigation, I.M.-A.; data curation, A.V.-M.; writing—original draft preparation, D.C., G.S-.S., I.M.-A., N.C-B., and A.V.-M.; writing—review and editing, I.M.-A. and A.V.-M.; visualization, A.V.-M.; supervision, A.V.-M.; project administration, I.M.-A.; funding acquisition, A.V.-M., and D.C. All authors have read and agreed to the published version of the manuscript.
Funding
Please add: This research was funded by Agencia Nacional de Investigación y Desarrollo (ANID – Chile), grant number Fondecyt Regular 1221063.
Institutional Review Board Statement
The study was conducted in accordance with the Declaration of Helsinki, approved by the Ethics Committee of the Doctoral Program in Business Management of POSFACE—UNAH (protocol code N. 100311, on 5 March 2025). All respondents have signed an informed consent form, and the data presented are completely anonymized.
Informed Consent Statement
Informed consent was obtained from all subjects involved in the study.
Data Availability Statement
Data are available in the Supplementary Materials.
Acknowledgments
We would like to thank the Graduate Unit of the Facultad de Ciencias Económicas, Administrativas y Contables (POSFACE), Universidad Nacional Autónoma de Honduras (UNAH).
Conflicts of Interest
The authors declare no conflicts of interest.
Appendix A

Table A1.
Anti-image correlation matrix.
| FB1 | FB2 | FB3 | FB4 | FB5 | FB6 | FB7 | FB8 | FB9 | FB10 | FB11 | FB12 | FB13 | |
|---|---|---|---|---|---|---|---|---|---|---|---|---|---|
| FB1 | 0.912* | -0.110 | 0.070 | -0.307 | -0.135 | -0.018 | -0.036 | 0.056 | 0.013 | -0.008 | -0.034 | -0.088 | -0.003 |
| FB2 | -0.110 | 0.918* | -0.188 | -0.091 | -0.081 | -0.057 | -0.006 | -0.258 | 0.001 | 0.105 | -0.094 | 0.099 | 0.007 |
| FB3 | 0.070 | -0.188 | 0.944* | -0.132 | -0.076 | 0.097 | -0.220 | -0.105 | -0.064 | -0.155 | 0.019 | -0.014 | -0.166 |
| FB4 | -0.307 | -0.091 | -0.132 | 0.904* | -0.323 | -0.003 | -0.015 | -0.069 | 0.021 | 0.068 | -0.127 | -0.143 | 0.068 |
| FB5 | -0.135 | -0.081 | -0.076 | -0.323 | 0.942* | -0.079 | -0.041 | -0.172 | -0.036 | -0.095 | 0.051 | -0.045 | -0.012 |
| FB6 | -0.018 | -0.057 | 0.097 | -0.003 | -0.079 | 0.834* | -0.130 | -0.040 | -0.588 | 0.030 | 0.064 | -0.011 | -0.037 |
| FB7 | -0.036 | -0.006 | -0.220 | -0.015 | -0.041 | -0.130 | 0.931* | -0.043 | 0.067 | -0.329 | -0.056 | -0.040 | -0.271 |
| FB8 | 0.056 | -0.258 | -0.105 | -0.069 | -0.172 | -0.040 | -0.043 | 0.932* | -0.251 | -0.101 | -0.092 | 0.092 | 0.031 |
| FB9 | 0.013 | 0.001 | -0.064 | 0.021 | -0.036 | -0.588 | 0.067 | -0.251 | 0.848* | -0.081 | -0.056 | 0.012 | -0.030 |
| FB10 | -0.008 | 0.105 | -0.155 | 0.068 | -0.095 | 0.030 | -0.329 | -0.101 | -0.081 | 0.925* | -0.269 | -0.099 | -0.161 |
| FB11 | -0.034 | -0.094 | 0.019 | -0.127 | 0.051 | 0.064 | -0.056 | -0.092 | -0.056 | -0.269 | 0.947* | -0.162 | -0.081 |
| FB12 | -0.088 | 0.099 | -0.014 | -0.143 | -0.045 | -0.011 | -0.040 | 0.092 | 0.012 | -0.099 | -0.162 | 0.926* | -0.303 |
| FB13 | -0.003 | 0.007 | -0.166 | 0.068 | -0.012 | -0.037 | -0.271 | 0.031 | -0.030 | -0.161 | -0.081 | -0.303 | 0.929* |
* Measures of Sampling Adequacy (MSA).
Table A2.
Financial Behavior FB–13 scale.
| Items ID | Items (in Spanish) | Items (in English) |
|---|---|---|
| FB1 | Tomo notas y controlo mis gastos (por ejemplo, hoja de cálculo de gastos e ingresos). | I take notes and keep track of my expenses (e.g., spreadsheet of expenses and income). |
| FB2 | Antes de comprar algo, comparo precios de productos similares. | Before buying something, I compare prices of similar products. |
| FB3 | Guardo/Ahorro parte del dinero que recibo para cubrir necesidades futuras. | I save part of the money I receive to cover future needs. |
| FB4 | Tengo un plan de gastos o presupuesto. | I have a spending plan or budget. |
| FB5 | Soy muy competente en el manejo de mis finanzas. | I am very competent in managing my finances. |
| FB6 | Pago mis facturas sin demora. | I pay my bills without delay. |
| FB7 | Ahorro mensualmente al menos un porcentaje mínimo de mis ingresos. | I save at least a minimum percentage of my income every month. |
| FB8 | Analizo mi situación financiera antes de una compra importante. | I analyze my financial situation before making a major purchase. |
| FB9 | Siempre pago mis deudas a tiempo para evitar cargos extras. | I always pay my debts on time to avoid extra charges. |
| FB10 | Ahorro regularmente para lograr objetivos financieros a largo plazo. | I save regularly to achieve long-term financial goals. |
| FB11 | Ahorro más cuando recibo un aumento de sueldo. | I save more when I receive a pay raise. |
| FB12 | Tengo una reserva financiera de al menos tres veces mis ingresos mensuales, que puedo utilizar en circunstancias inesperadas. | I have a financial reserve of at least three times my monthly income, which I can use in unexpected circumstances. |
| FB13 | En los últimos 12 meses he podido ahorrar dinero. | In the last 12 months, I have been able to save money. |
References
- Abril-Teatin, A.J., Saavedra-Najar, R., Blanco-Mesa, F., & Romero, J.M. (2022). Financial education knowledge assessment index. Cuadernos del Cimbage, 24(2), 1–16.
- Albrecht, P. (1980). On the correct use of the chi-square goodness-of-fit test. Scandinavian Actuarial Journal, 1980(3), 149–160. [CrossRef]
- Álvarez-Padilla, Y. , Loibl, C., & Boone, B. (2025). Money talks: Testing a series of financial literacy modules to encourage financial conversations in middle school families. Journal of Family and Economic Issues, 46, 1–20. [CrossRef]
- Bae, K., Jang, G.Y., Kang, H.G., & Tan, P. (2022). Early Financial Education, Financial Literacy, and Gender Equity in Finance. Asia-Pacific Journal of Financial Studies, 51(3), 372–400. [CrossRef]
- Bartoloni, E. (2013). Capital structure and innovation: causality and determinants. Empirica, 40(1), 111–151. [CrossRef]
- Beytollahi, A. (2020). Chemistry of financial behaviors: a mini review of hormones effect on financial behaviors (2010-2019). Eurasian Chemical Communications, 2(8), 916–937. [CrossRef]
- Bhatia, S., & Singh, S. (2024). Exploring financial well-being of working professionals in the Indian context. Journal of Financial Services Marketing, 29(2), 474–487. [CrossRef]
- Bonett, D.G. , & Wright T.A. (2015) Cronbach's alpha reliability: Interval estimation, hypothesis testing, and sample size planning, Journal of Organizational Behavior, 36(1), 3–15. [CrossRef]
- Central Intelligence Agency (2025). The World Factbook: Honduras. Available online: https://www.cia.gov/the-world-factbook/countries/honduras/ (accessed on 2 September 2025).
- Clayton, J., Gordon, J., Fabozzi, F., Giliberto, S.M., Liang, Y., & Hudson-Wilson, S. (2007). Real estate comes of age. Journal of Portfolio Management, 15+.
- Collins, J.M., Halpern-Meekin, S., Harvey, M., & Hoiting, J. (2023). “I Don’t Like All Those Fees” Pragmatism About Financial Services Among Low-Income Parents. Journal of Family and Economic Issues, 44, 807–820. [CrossRef]
- Cwynar, A. (2021). Do women behave financially worse than men? Evidence from married and cohabiting couples. Central European Business Review, 10(5), 81–98. [CrossRef]
- Davis, L.E. (2016). Identifying the financialization of the nonfinancial corporation in the US economy: A decomposition of firm-level balance sheets. Journal of Post Keynesian Economics, 39(1), 115–141. [CrossRef]
- dos Santos, J.O., & Barros, C.A.S. (2011). What Determines the Financial Decision-Making: reason or emotion?. RBGN-Revista Brasileira De Gestao De Negocios, 13(38), 7–20.
- Faturohman, T. , Megananda, T.B., & Ginting, H. (2024). Improving financial wellbeing in Indonesia: the role of social media as a mediating factor in financial behavior. Cogent Social Sciences, 10. [CrossRef]
- Fernández-Guadaño, J. (2015). Measuring the economic performance of socially responsible companies. Zbornik Radova Ekonomskog Fakulteta U Rijeci-Proceedings of Rijeka Faculty of Economics, 33(2), 207–233.
- Ferrando, P.J., & Lorenzo-Seva, U. (2017). Program FACTOR at 10: Origins, development and future directions. Psicothema, 29(2), 236–240. [CrossRef]
- Ferrando, P.J., & Lorenzo-Seva, U. (2022). Hernández-Dorado, A.; Muñiz, J. Decalogue for the Factor Analysis of Test Items. Psicothema, 34(1), 7–17. [CrossRef]
- Fidrmuc, J., & Horky, F. (2023). Experience and Firms' Financing Behavior: A Behavioral Perspective. German Economic Review, 24(3), 233–269. [CrossRef]
- Garrison, S. T. , Rampold, S. D., Vasquez, K., Gillen, M., & Baker, L. M. (2022). Parents' employment, income, and finances before and during the COVID-19 pandemic. Journal of Consumer Affairs, 56(1), 276–291. [CrossRef]
- Ghazali, M.S., Idris, N.H., Alwi, S.F.S., Osman, I., & Mansor, F. (2025). Exploring financial well-being among emerging adults in the Malaysian workforce: a family resource management perspective. Journal of Nusantara Studies-Jonus, 10(2), 273–299. [CrossRef]
- Gudmunson, C.G. , & Danes, S.M. (2011). Family financial socialization: Theory and critical review. Journal of Family and Economic Issues, 32(4), 644–667. [CrossRef]
- Hallsworth, M. , List, J. A., Metcalfe, R. D., Rotaru, K., & Vlaev, I. (2024). The making of Homo Honoratus: From omission to commission. Journal of Consumer Psychology, 34(4), 588–600. [CrossRef]
- Herrador-Alcaide, T. C., Hernández-Solís, M., & Topa, G. (2021). A model for personal financial planning towards retirement. Journal of Business Economics and Management, 22(2), 482–502. [CrossRef]
- Ho, A.D., & Yu, C.C. (2015). Descriptive Statistics for Modern Test Score Distributions: Skewness, Kurtosis, Discreteness, and Ceiling Effects. Educational and Psychological Measurement, 75(3), 365–388. [CrossRef]
- Hughes, D.J. (2018). Psychometric Validity. In P. Irwing, T. Booth, D.J. Hughes (Eds.) The Wiley Handbook of Psychometric Testing (pp. 751–779). Wiley: Chichester, UK. [CrossRef]
- Johan, I., Rowlingson, K. & Appleyard, L. (2021). The Effect of Personal Finance Education on The Financial Knowledge, Attitudes and Behaviour of University Students in Indonesia. J Fam Econ Iss, 42, 351–367. [CrossRef]
- Kaiser, H.F., & Cerny, B.A. (1979). Factor Analysis of the Image Correlation Matrix. Educational and Psychological Measurement, 39(4), 711–714. [CrossRef]
- Kalkan, Ö.K., & Kelecioğlu, H. (2016). The effect of sample size on parametric and nonparametric factor analytical methods. Educational Sciences: Theory & Practice, 16(1), 153–171. [CrossRef]
- Kislitsyn, D.V. (2020). Financial literacy training programs and financial behaviour: Why people do not become financially literate?. Voprosy Ekonomiki, 9,80–93. [CrossRef]
- Kreiner, C.T., Leth-Petersen, S., & Willerslev-Olsen, L.C. (2020). Financial trouble across generations: evidence from the universe of personal loans in Denmark. Economic Journal, 130(625), 233–262. [CrossRef]
- Kumar, P., Ahlawat, P., Deveshwar, A., & Yadav, M. (2024). Do Villagers' Financial Socialization, Financial Literacy, Financial Attitude, and Financial Behavior Predict Their Financial Well-Being? Evidence from an Emerging India. Journal of Family and Economic Issues. [CrossRef]
- Kyriazos, T.A. (2018). Applied Psychometrics: Sample Size and Sample Power Considerations in Factor Analysis (EFA, CFA) and SEM in General. Psychology, 9(8), 2207–2230. [CrossRef]
- Li, B., & Liu, Y.P. (2025). Household aging, commercial insurance participation, and risky asset allocation. International Review of Financial Analysis, 104, 104291. [CrossRef]
- Lloret-Segura, S., Ferreres-Traver, A., Hernández-Baeza, A., & Tomás-Marco, I. (2014). Exploratory Item Factor Analysis: A practical guide revised and updated. Annals of Psychology, 30(3), 1151–1169. [CrossRef]
- Long, T.Q., & Tue, N.D. (2024). Financial Knowledge and Short- and Long-Term Financial Behavior Across Gender and Generations: Evidence from Japan. Sage Open, 14(4), 21582440241295846. [CrossRef]
- Lorenzo-Seva, U., & Ferrando, P.J. (2021). MSA: The forgotten index for identifying inappropriate items before computing exploratory item factor analysis. Methodology, 17(4), 296–306. [CrossRef]
- Lorenzo-Seva, U., Timmerman, M.E., & Kiers, H.A.L. (2011). The Hull method for selecting the number of common factors. Multivariate Behavioral Research, 46(2), 340–364. [CrossRef]
- Méndez-Prado, S.M., Chiluiza, K., Everaert, P., & Valcke, M. (2022). Design and evaluation among young adults of a financial literacy scale focused on key financial decisions. Education Sciences, 12(7), 460. [CrossRef]
- Mielitz, K., & MacDonald, M. (2021). Post-Release Financial Behavioral Intentions of Transitional Center Participants. Journal of Financial Counseling and Planning, 32(1), 173–186. [CrossRef]
- Patrisia, D., Abror, A., Dastgir, S., & Rahayu, R. (2023). Generation Z's financial behaviour: the role of Islamic financial literacy. Isra International Journal of Islamic Finance, 15(2), 20–37. [CrossRef]
- Pham, K.D., & Le, V.L.T. (2023). Nexus between financial education, literacy, and financial behavior: insights from Vietnamese young generations. Sustainability, 15(20), 14854. [CrossRef]
- Rabadan, E.J.G. (2025). Assessment on financial practices among teachers in the District of Bacuag, Division of Surigao Del Norte: Bases for Intervention. International Journal of Science and Research Archive, 16(02), 808-825. [CrossRef]
- Rahman, M., Isa, C.R., Masud, M.M., Sarker, M., & Chowdhury, N.T. (2021). The role of financial behaviour, financial literacy, and financial stress in explaining the financial well-being of B40 group in Malaysia. Future Business Journal, 7(1), 52. [CrossRef]
- Ramli, Z. , Muhamad Yusof, N., Md. Sum, S., & Awang, A. H. (2023). Hubungan pengetahuan dan tingkah laku kewangan dengan perancangan kewangan persaraan dalam kalangan generasi milenial. Akademika, 93(1), 373–387. [CrossRef]
- Sabri, M.F., Anthony, M., Law, S.H., Rahim, H.A., Burhan, N.A.S., & Ithnin, M. (2024). Impact of financial behaviour on financial well-being: evidence among young adults in Malaysia. Journal of Financial Services Marketing, 29(3), 788–807. [CrossRef]
- Schermelleh-Engel, K., Moosbrugger, H., & Müller, H. (2003). Evaluating the Fit of Structural Equation Models: Tests of Significance and Descriptive Goodness-of-Fit Measures. Methods of Psychological Research, 8(2), 23–74. [CrossRef]
- Sun, J. (2005). Assessing goodness of fit in confirmatory factor analysis. Measurement and Evaluation in Counseling and Development, 37(4), 240–256. [CrossRef]
- Van Gunten, T., & Navot, E. (2018). Varieties of indebtedness: financialization and mortgage market institutions in Europe. Social Science Research, 70, 90–106. [CrossRef]
- Velicer, W.F., & Fava, J.L. (1998). Affects of variable and subject sampling on factor pattern recovery. Psychological Methods, 3(2), 231–251. [CrossRef]
- Vijaykumar, J.H. (2022). The association of financial socialization with financial self-efficacy and autonomy: a study of young students in India. Journal of Family and Economic Issues, 43(2), 397–414. [CrossRef]
- Viktorovna, B.T., & Mikhailovna, Z.E. (2020). Field dependence / field independence as a factor of financial decision making with varying degrees of risk among students. International Journal of Cognitive Research in Science Engineering and Education-IJCRSEE, 8, 113–120. [CrossRef]
- West, S. Banerjee, M., Phipps, B., & Friedline, T. (2017). Coming Up Short: Family Composition, Income, and Household Savings. Journal of the Society for Social Work and Research, 8(3), 355-377. [CrossRef]
- Williams, C. A. (1950). The choice of the number and width of classes for the chi-square test of goodness of fit. Journal of the American Statistical Association, 45(249), 77–86. [CrossRef]
- Wolf, E.J., Harrington, K.M., Clark, S.L., & Miller, M.W. (2013). Sample Size Requirements for Structural Equation Models: An Evaluation of Power, Bias, and Solution Propriety. Educational and Psychological Measurement, 73(6), 913–934. [CrossRef]
- Wuensch, K.L. (2025). Chi-Square Tests. In M. Lovric (Ed) International Encyclopedia of Statistical Science (pp. 466–468). Springer, Berlin, Heidelberg. [CrossRef]
- Xiao, J.J., & Meng, K.X. (2024). Financial capability and financial anxiety: comparison before and during the COVID-19 pandemic. International Journal of Bank Marketing, 42(6), 1348–1369. [CrossRef]
- Xiao, J.J., & Porto, N . (2022). Financial capability and wellbeing of vulnerable consumers. Journal of Consumer Affairs, 56(2), 1004–1018. [CrossRef]
- Xiong, T.L., Ma, Z.S., Li, Z.Z., & Dai, J.Q.Y. (2022). The analysis of influence mechanism for internet financial fraud identification and user behavior based on machine learning approaches. International Journal of System Assurance Engineering and Management, 13(SUPPL 3), 996–1007. [CrossRef]
- Yang-Wallentin, F., Jöreskog, K.G., & Luo, H. (2010). Confirmatory Factor Analysis of Ordinal Variables with Misspecified Models. Structural Equation Modeling: A Multidisciplinary Journal. 2010, 17(3), 392–423. [CrossRef]
Figure 1.
Scree plot.
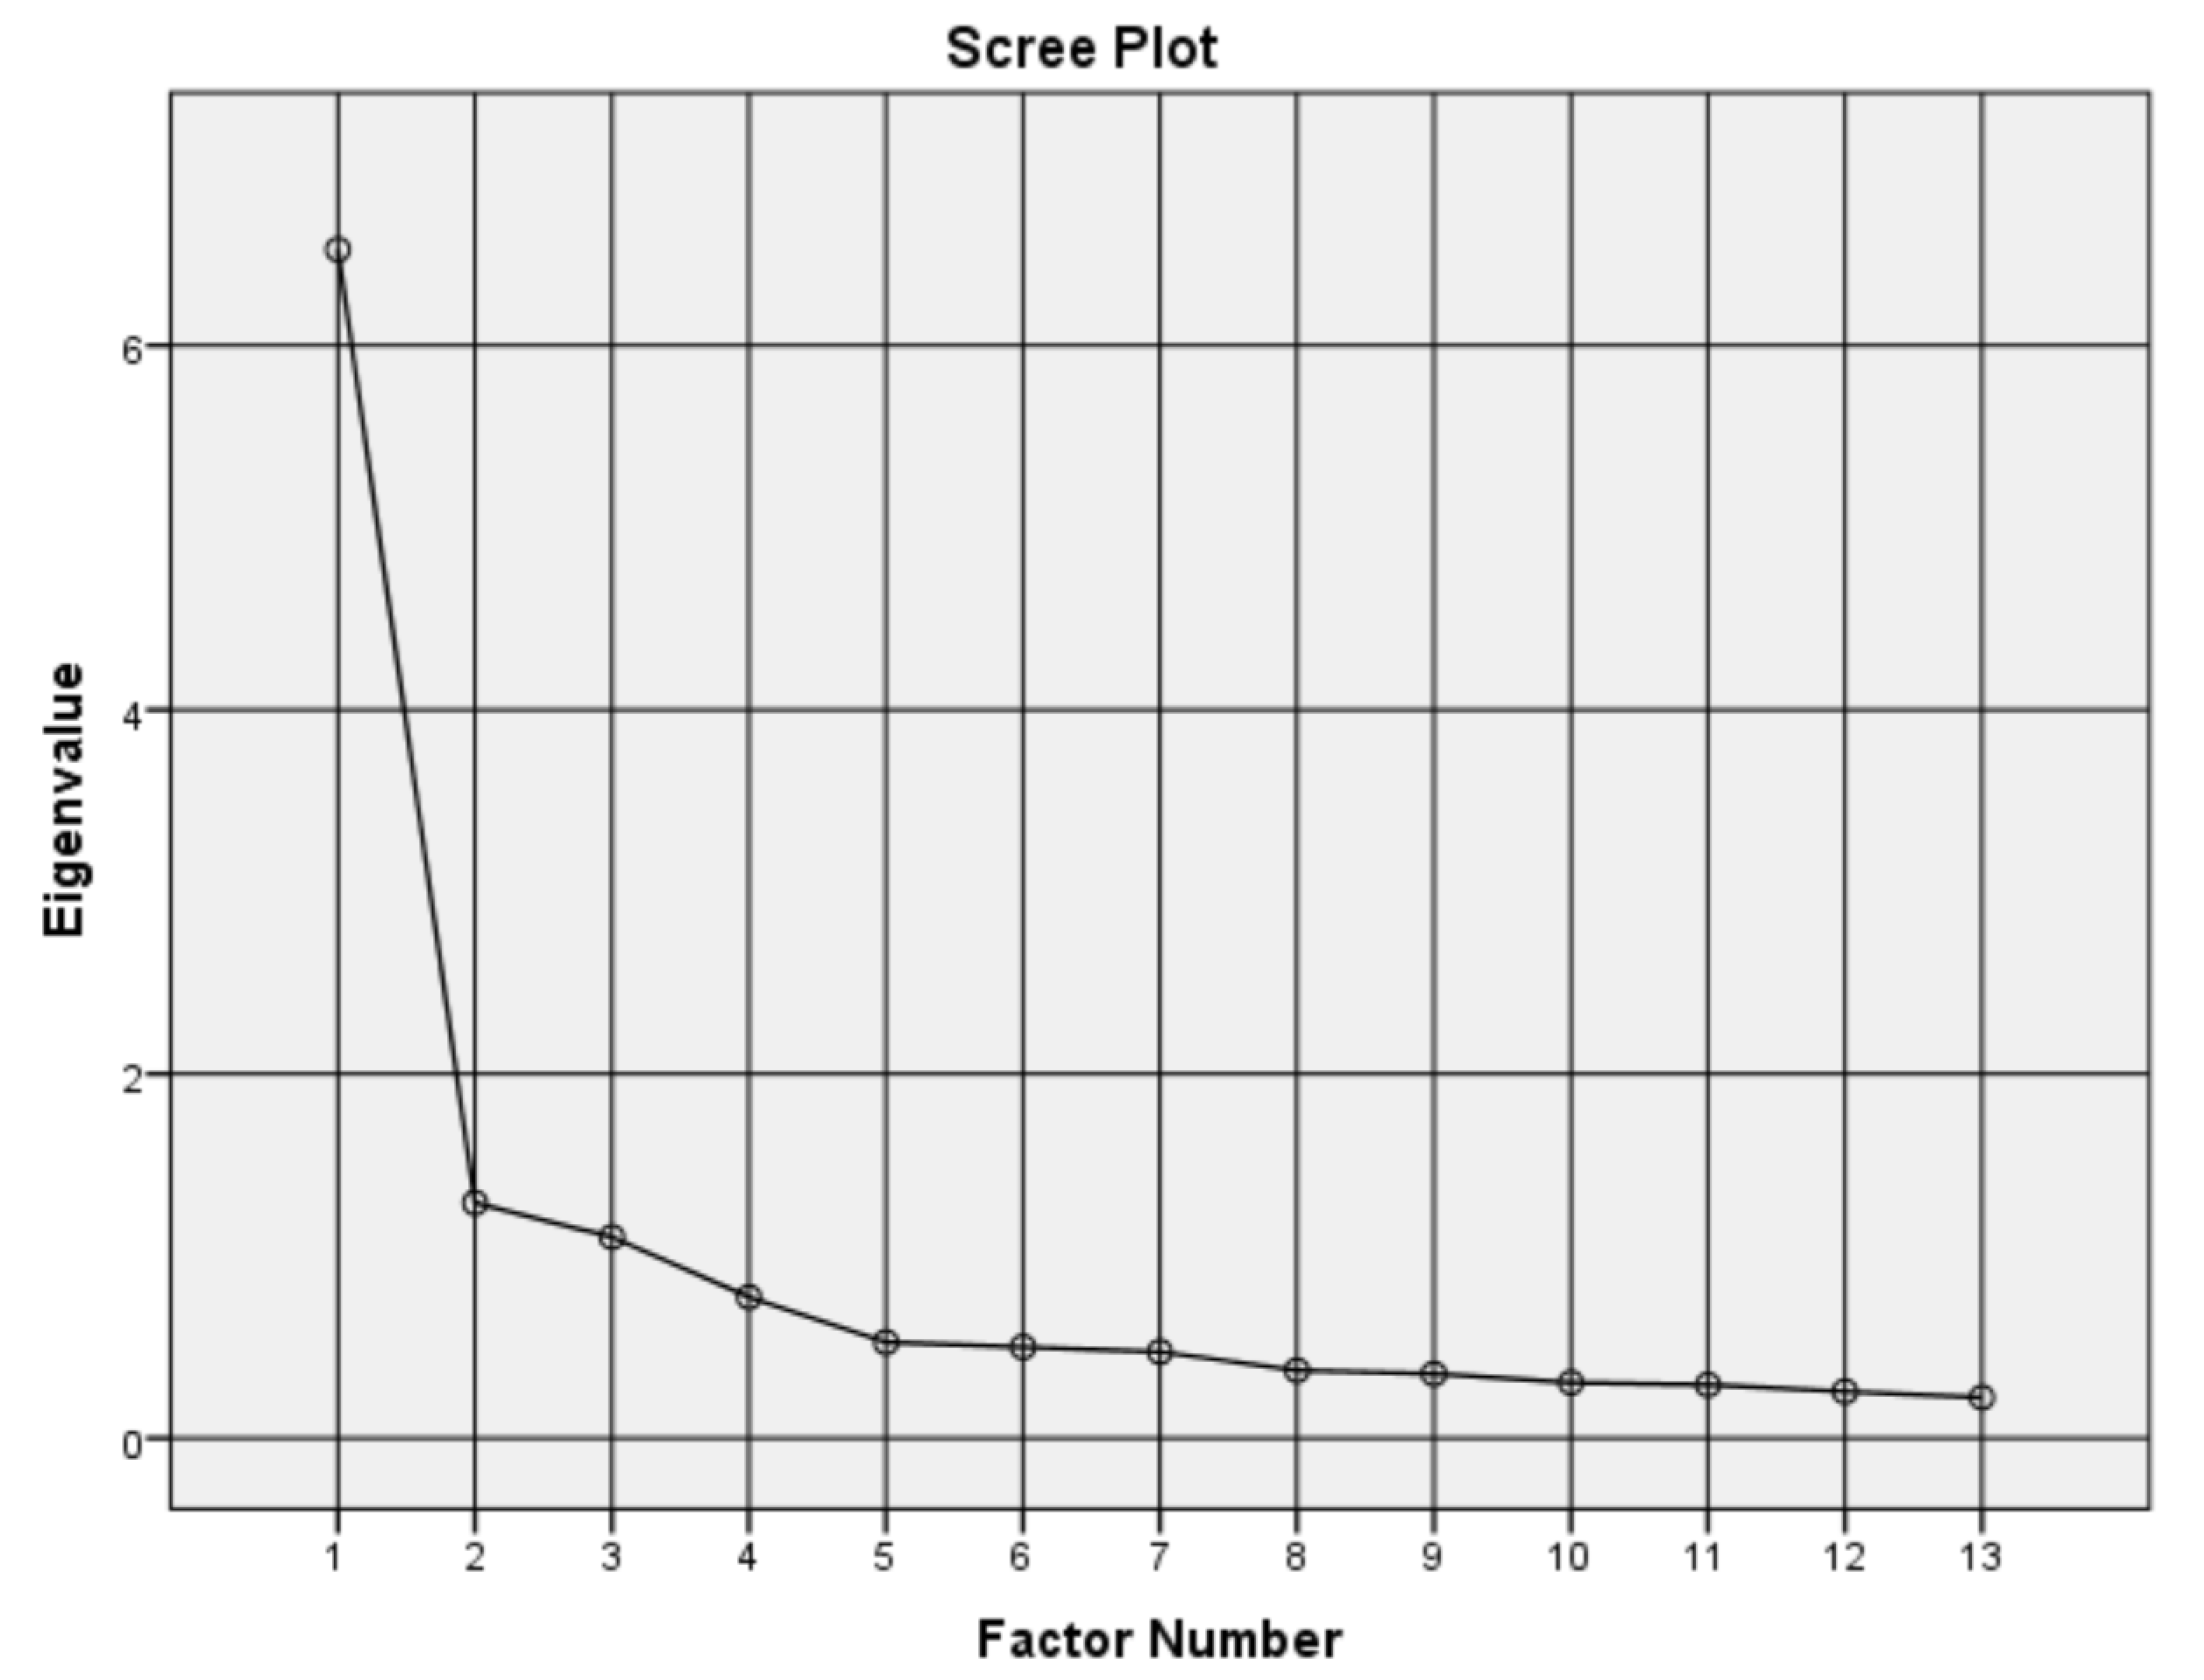
Figure 2.
Histogram of factors in FB–13 scale. (2a) F1, (2b) F2, (2c) F3, and (2d) F4.
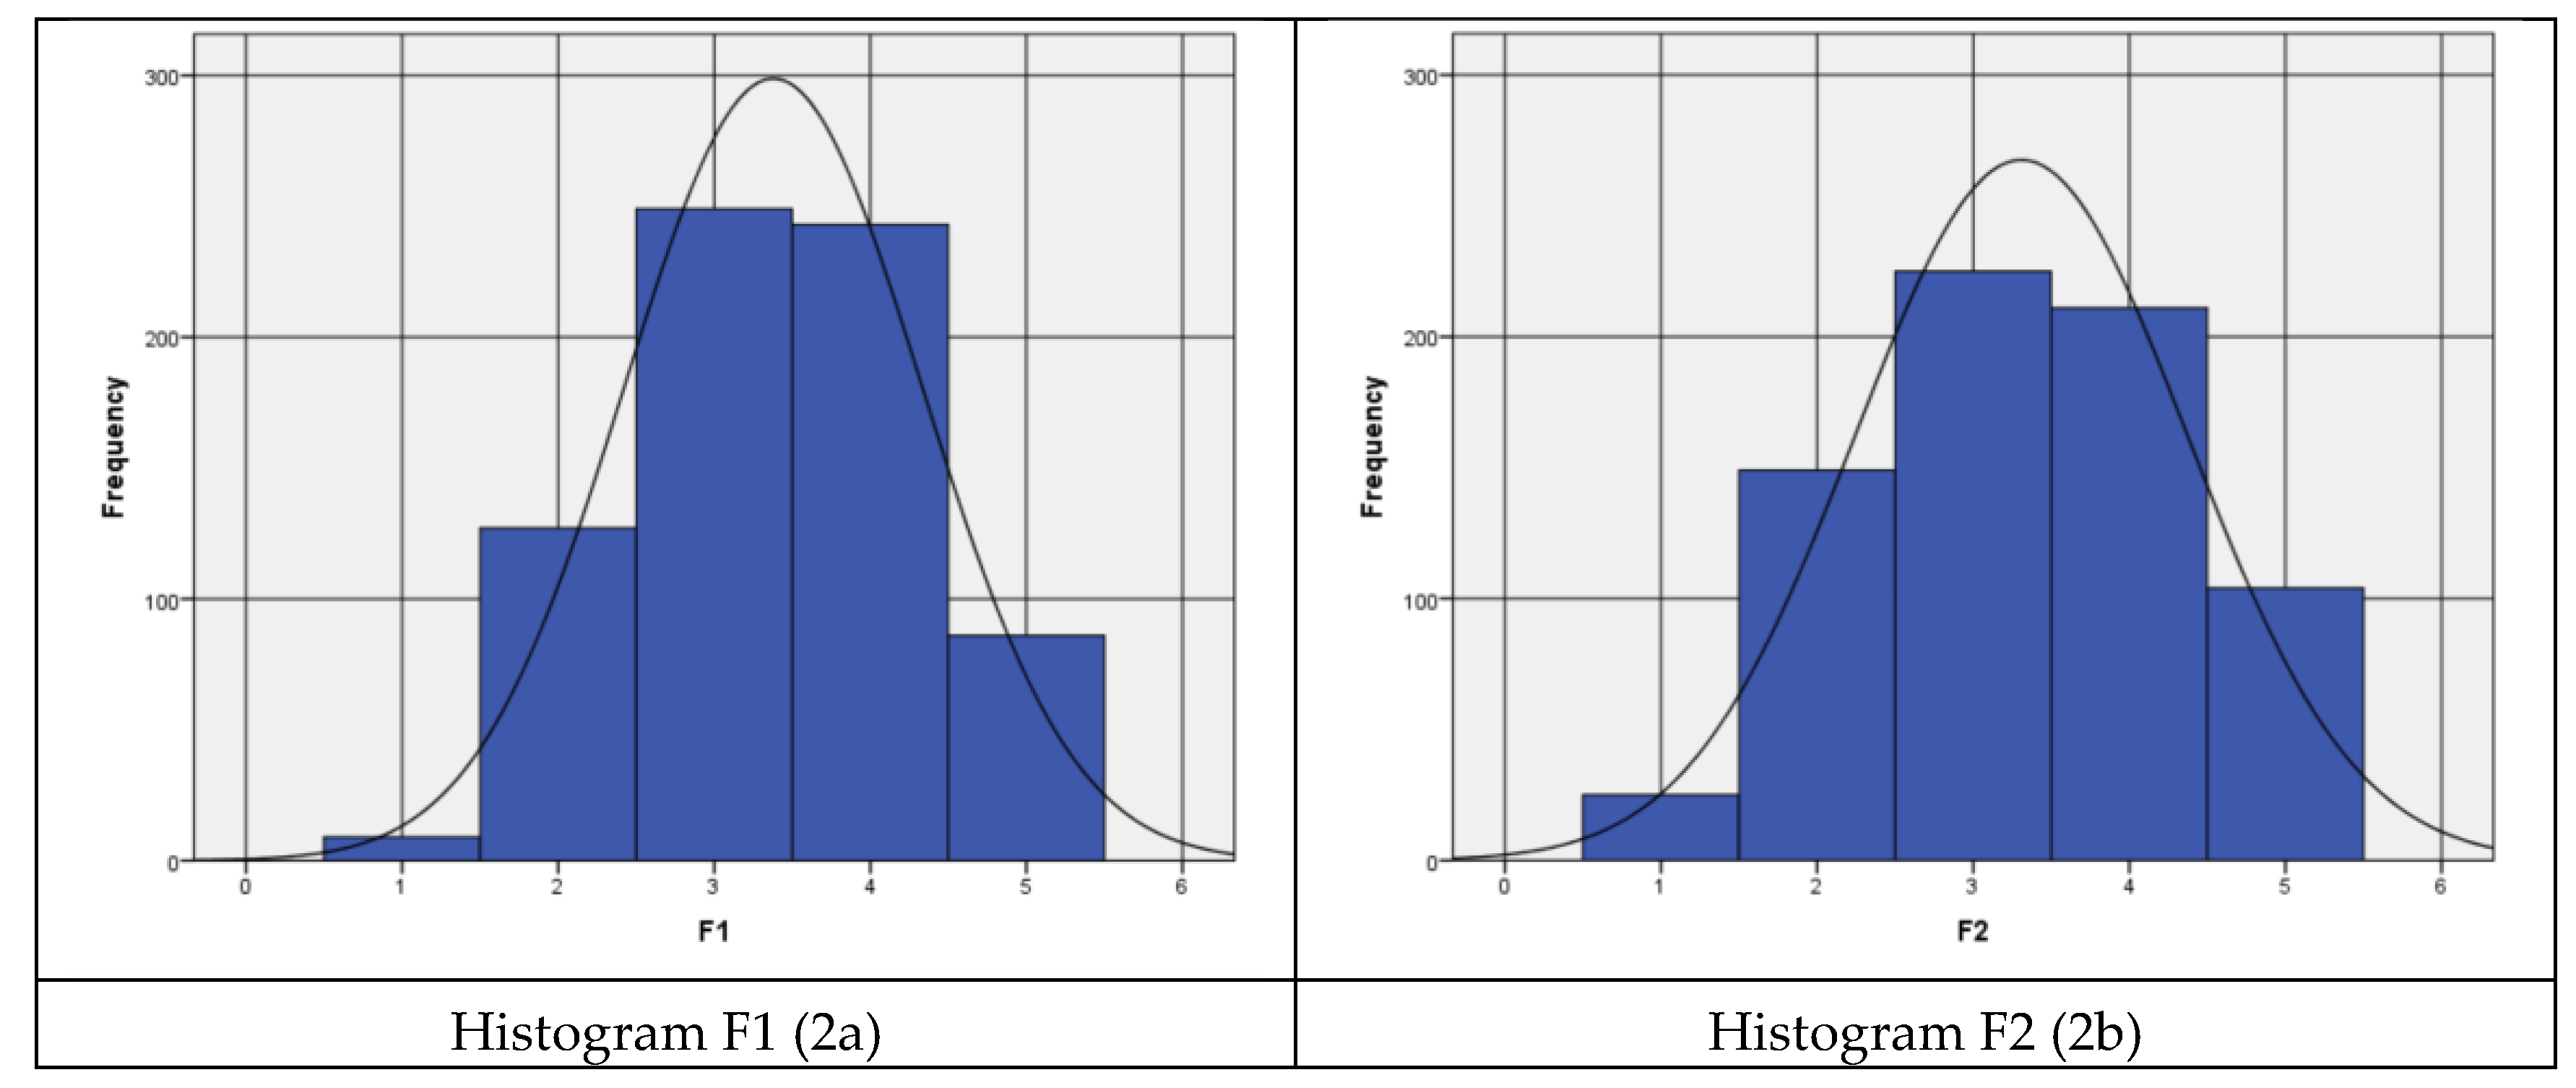
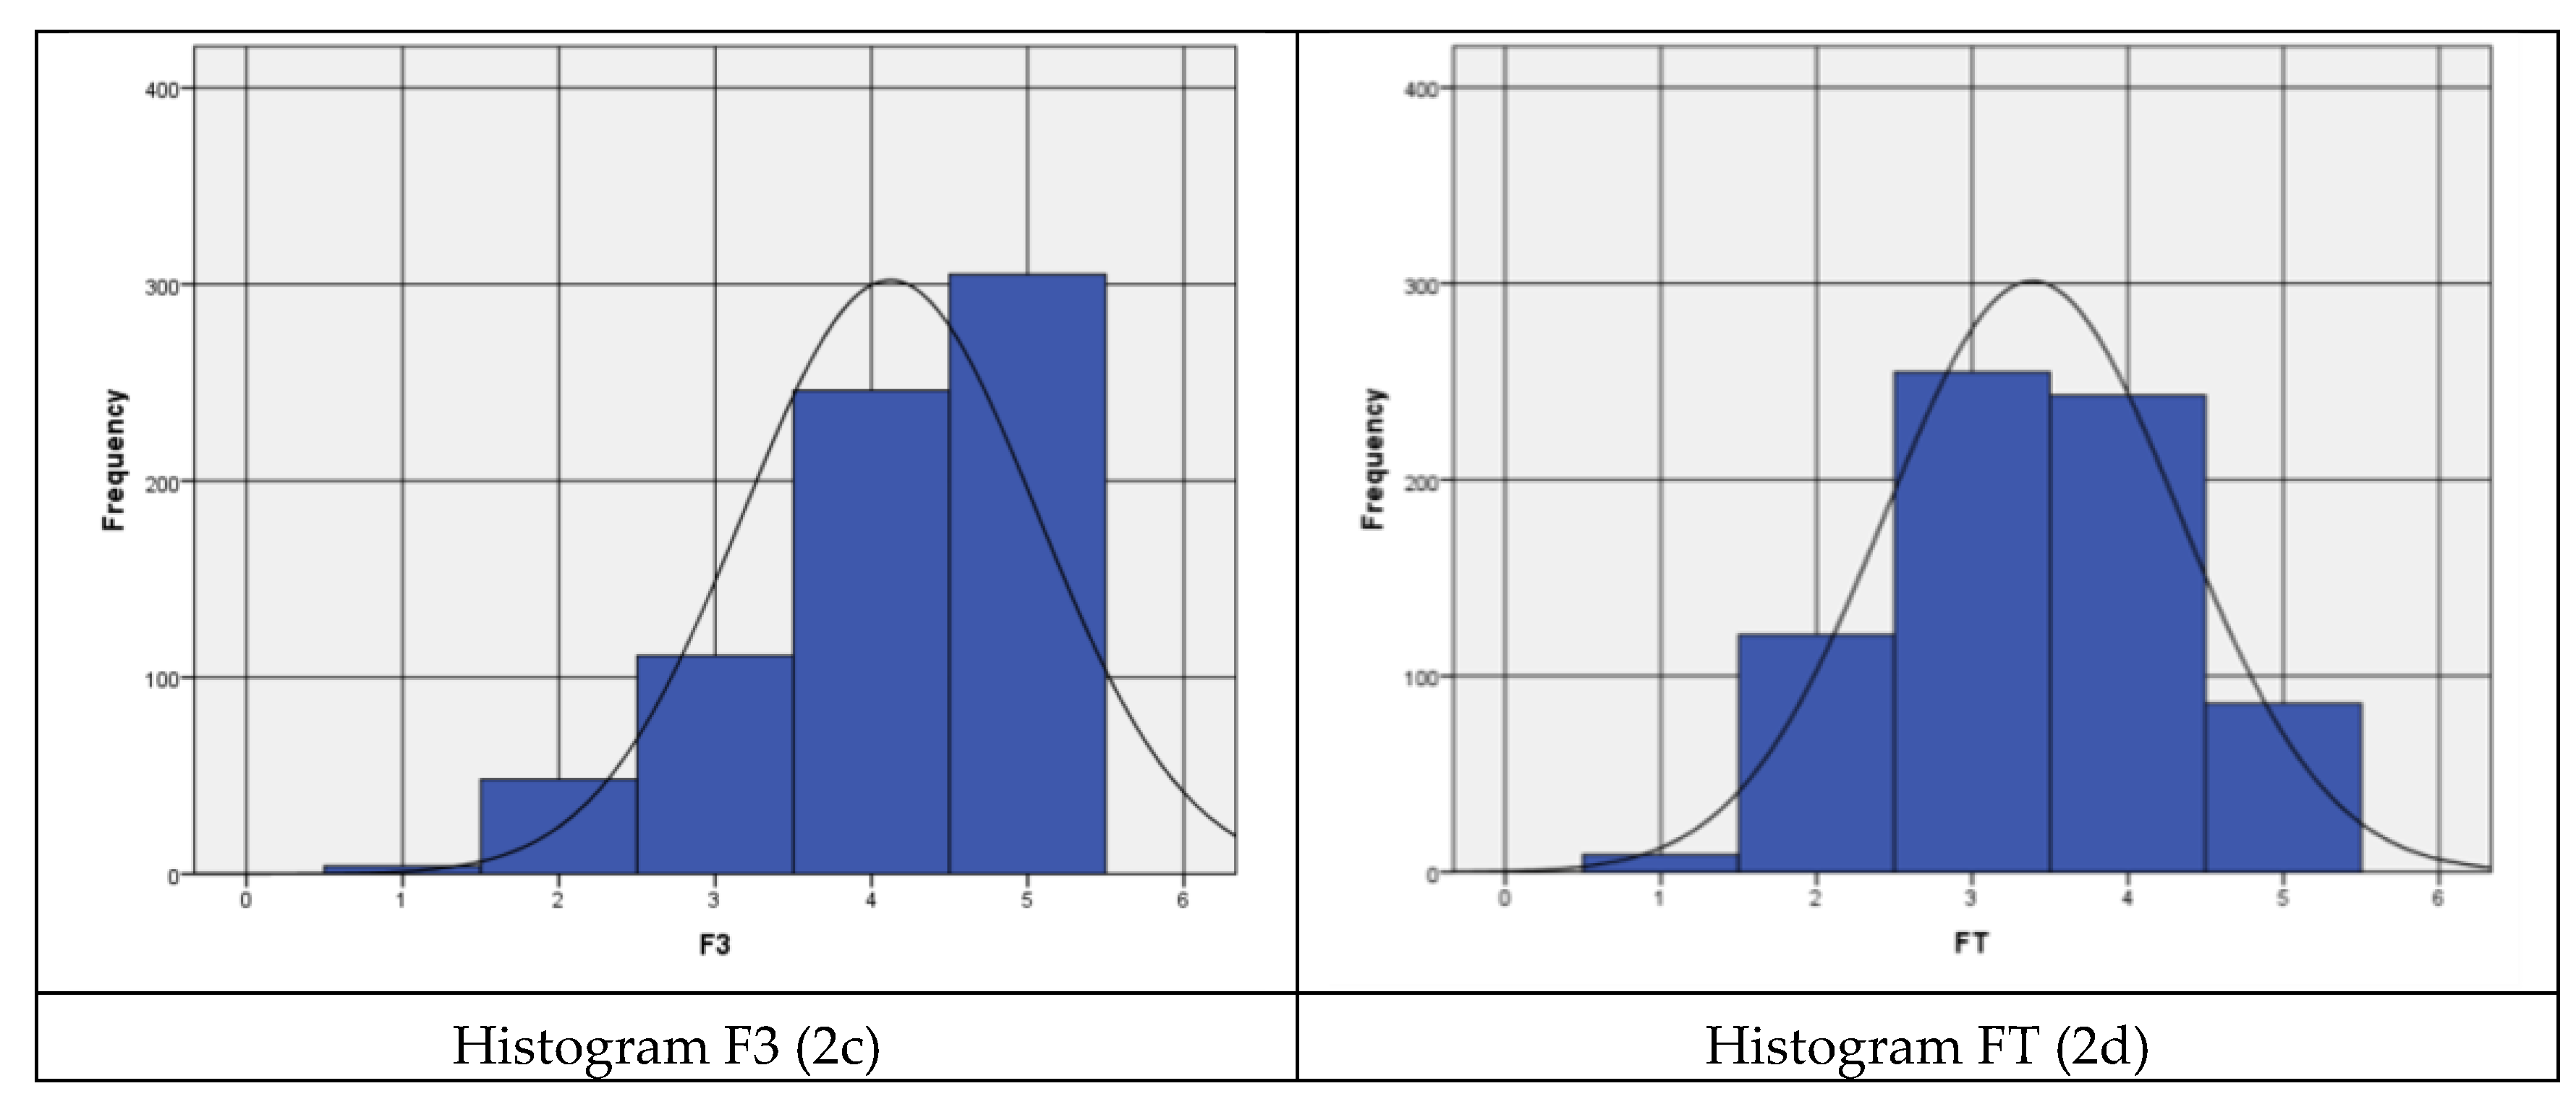
Figure 3.
Correlations between (3a) F1 – WEP, (3b) FT – WEP, and (3c) F2 – PAS.
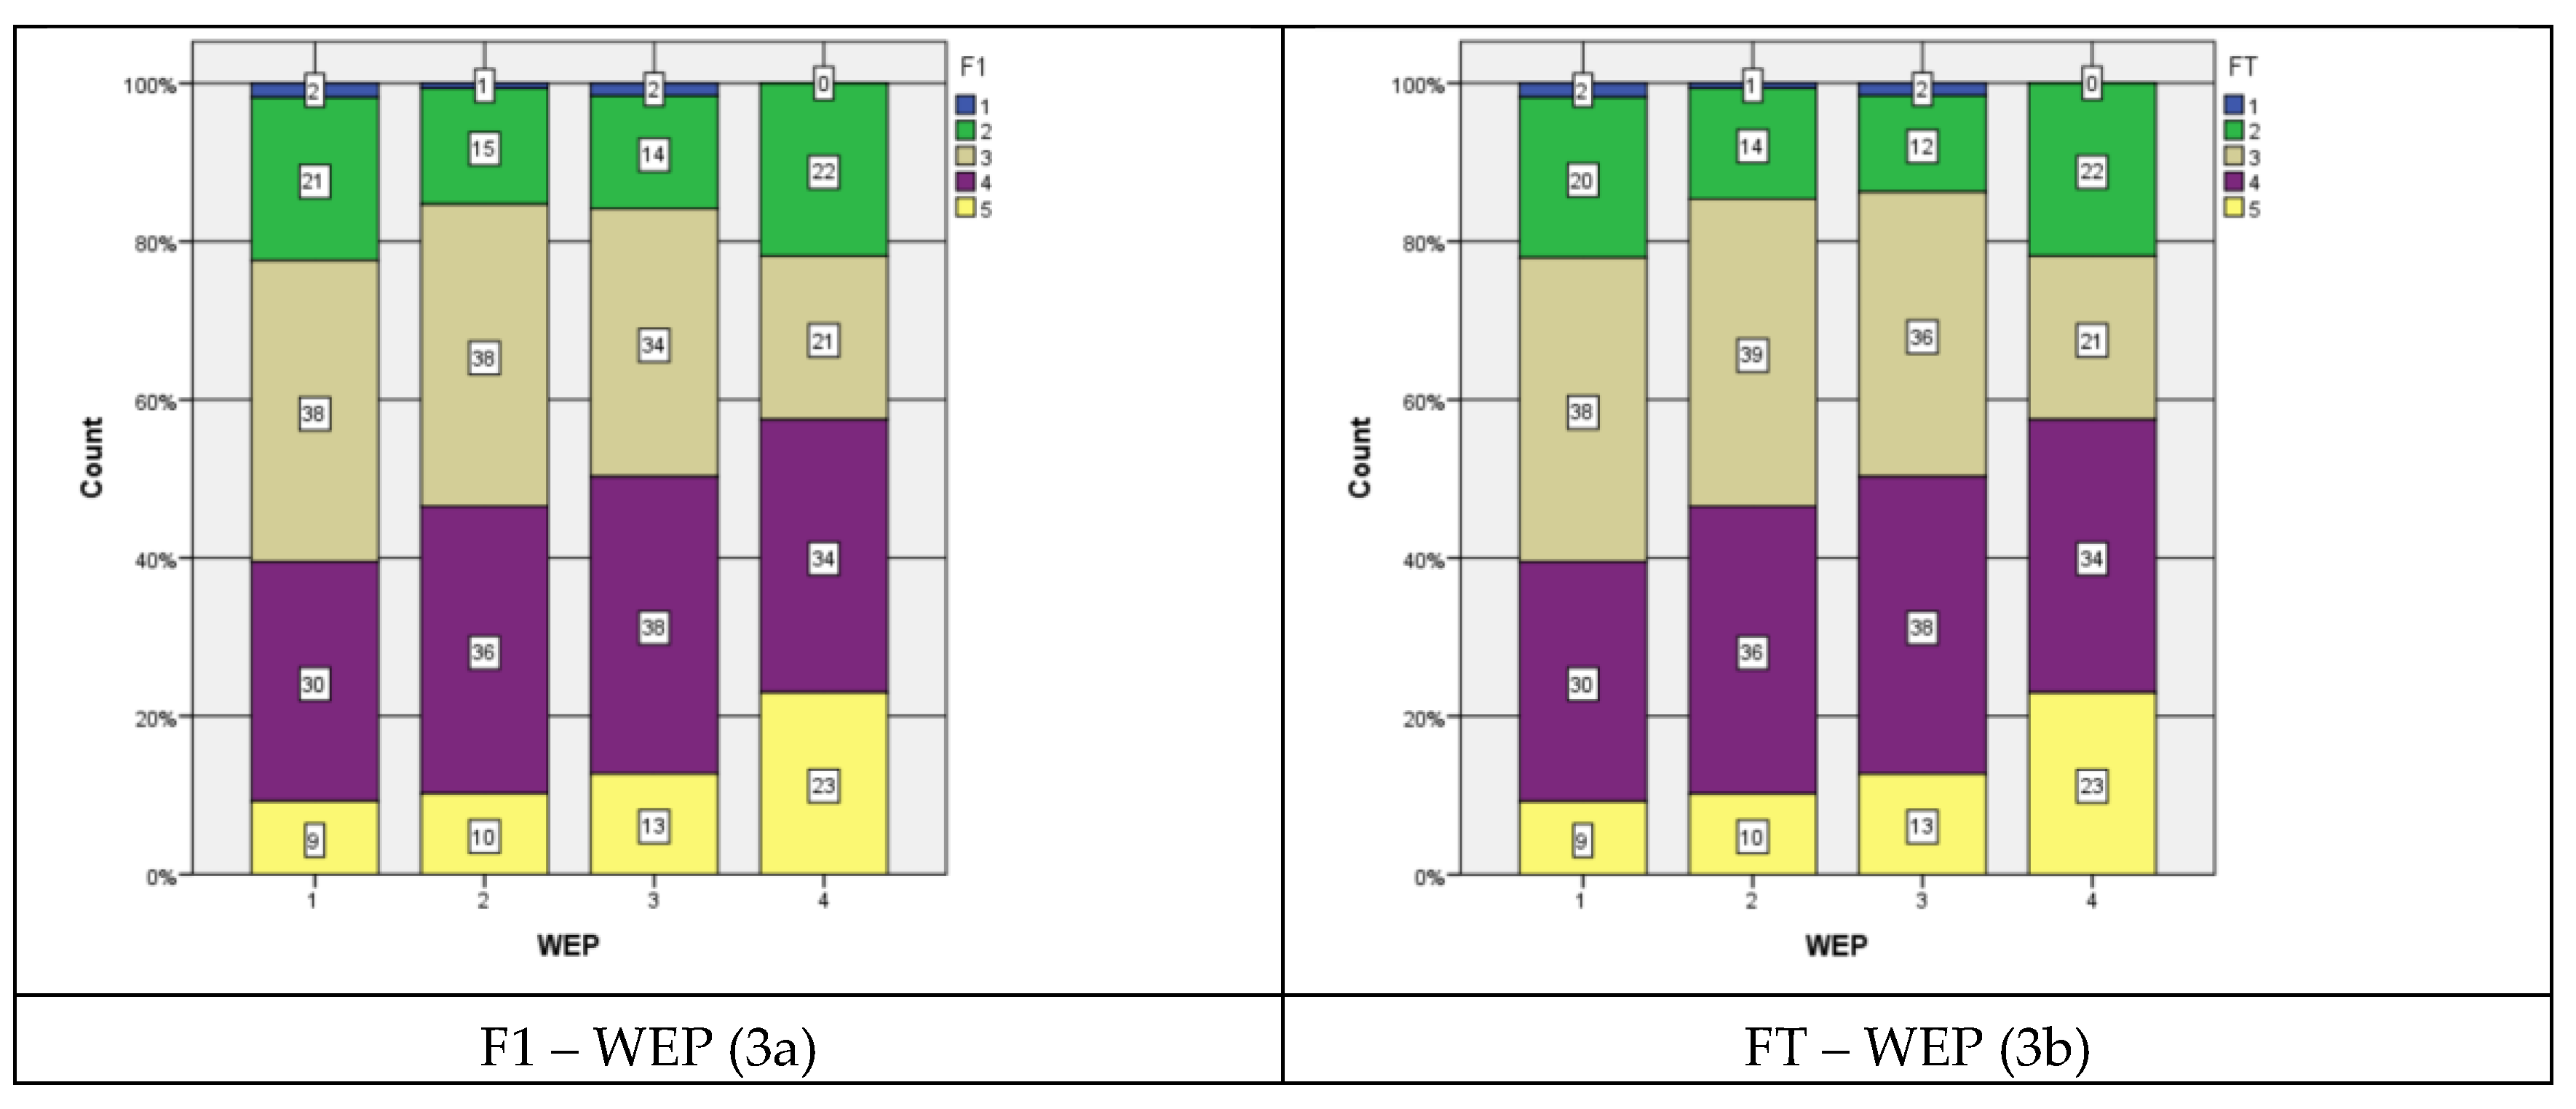
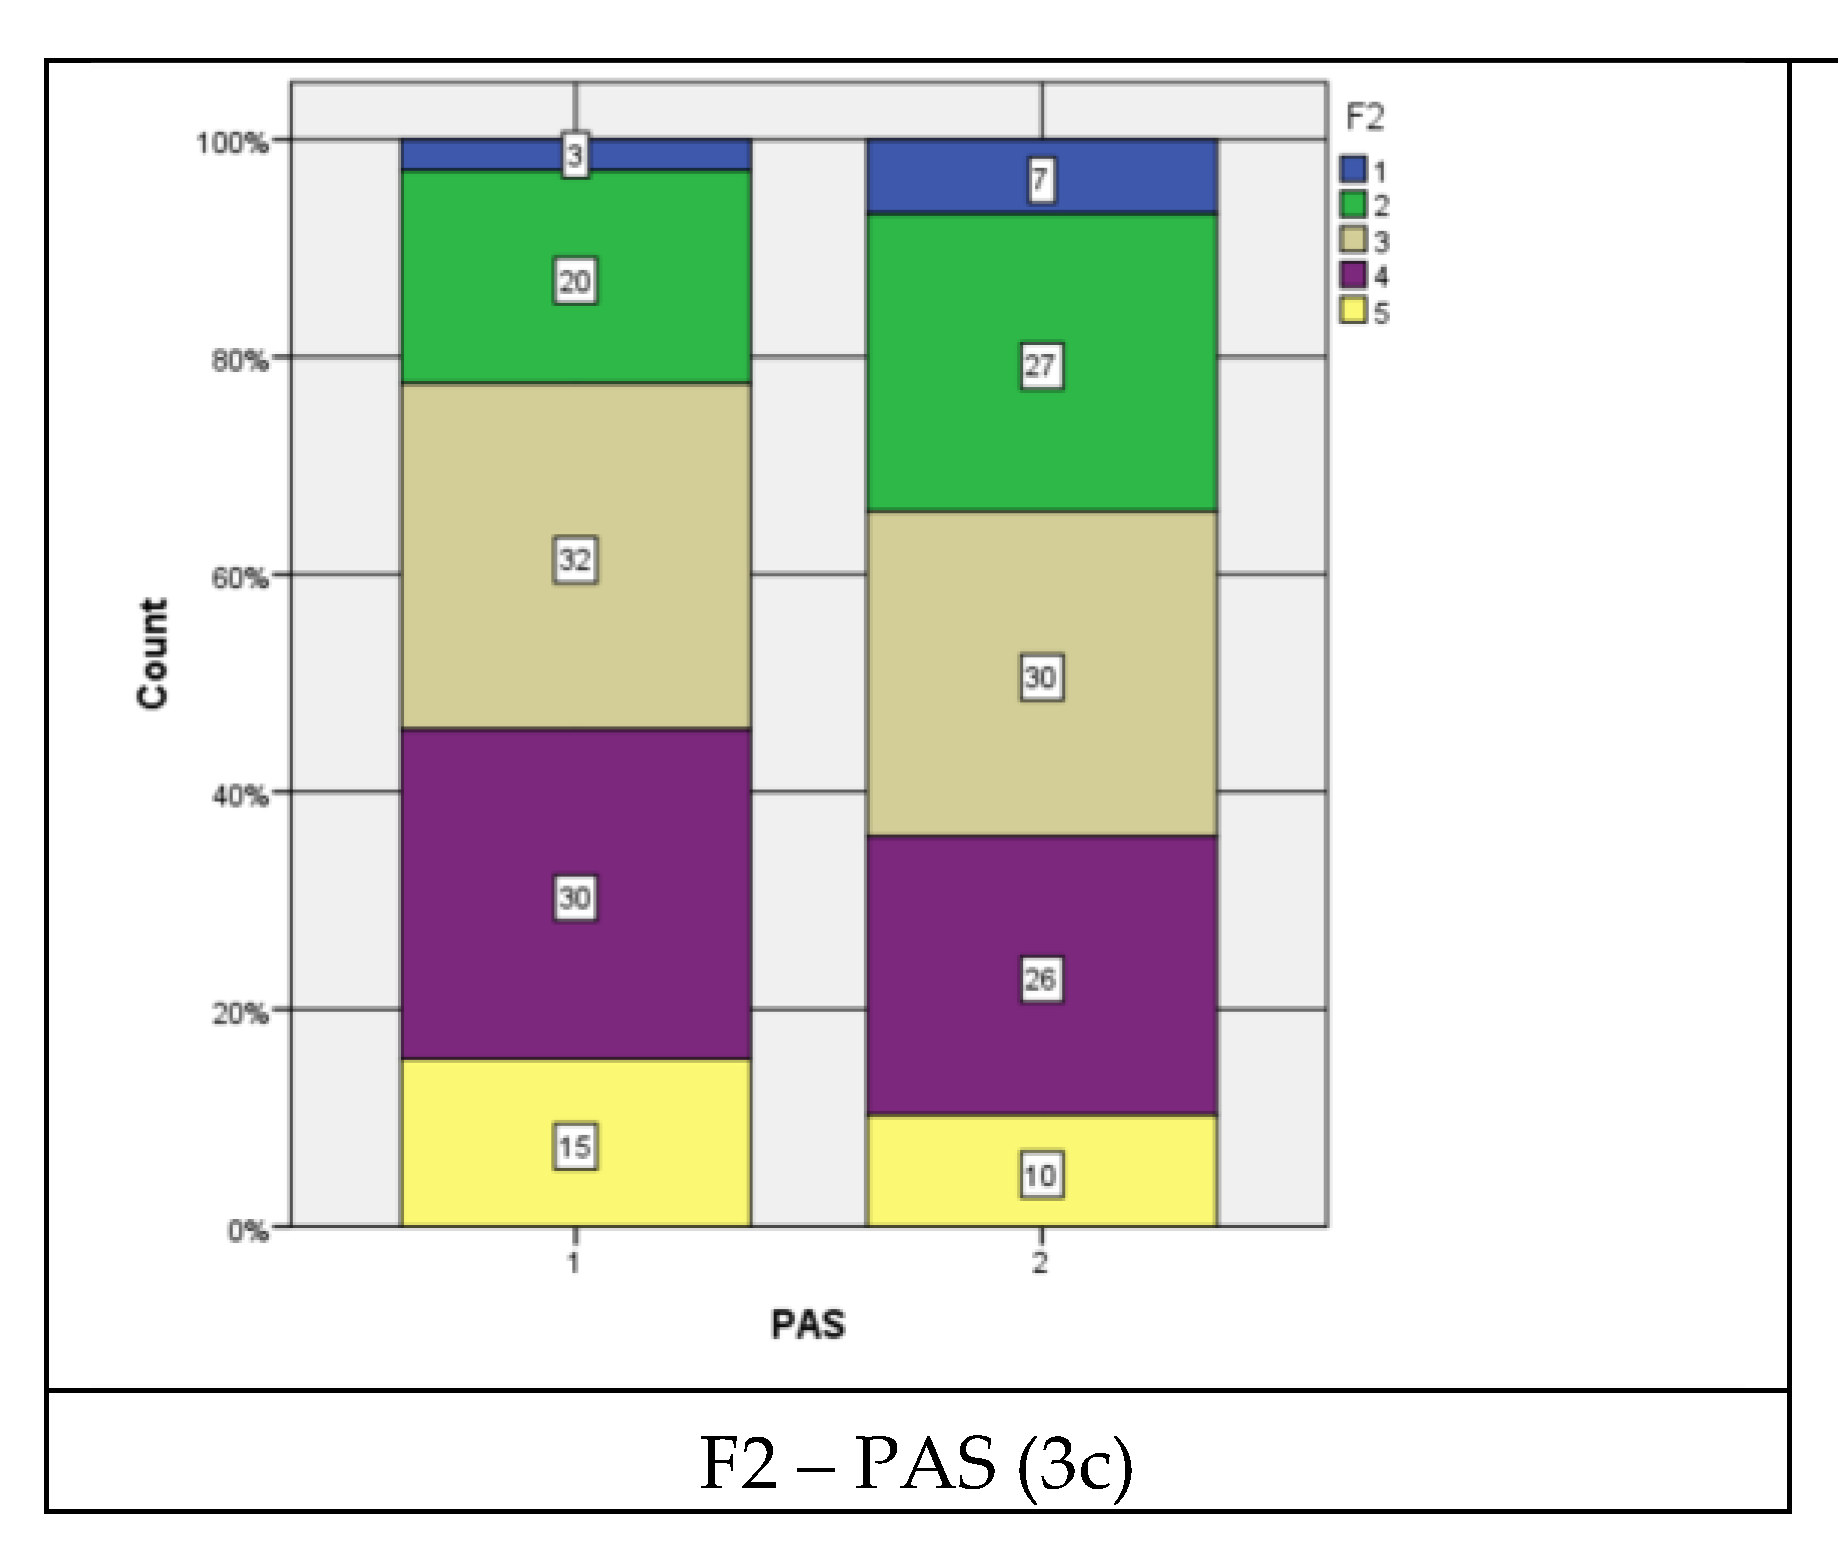
Table 1.
Validation and reliability parameters.
| Sample | Level | Cronbach´s alpha | MIF | χ2/df | RMSEA | AGFI | GFI | CFI | NNFI | RMSR |
|---|---|---|---|---|---|---|---|---|---|---|
| ≥200 | Good fit | [0.70, 0.80) | NR | [0, 2] | [0.00, 0.05] | [0.90, 1.00] | [0.95, 1.00] | [0.97, 1.00] | [0.97,1.00] | [0.00,0.05) ++ |
| Acceptable fit | [0.80, 0.95) | ≥3 | (2, 3] | (0.05, 0.08] | [0.85, 0.90) | [0.90, 0.95) | [0.95, 0.97) | [0.95,0.97) | [0.05,0.08] ++ |
NR: not reported. ++ indicated in Kalkan & Kelecioğlu, 2016.
Table 2.
Students sample characterization.
| Sociodemographic variables | Level | n | n% |
|---|---|---|---|
| Gender | Female (1) | 448 | 63% |
| Male (2) | 266 | 37% | |
| Age (years old) | 16 – 24 (1) | 470 | 66% |
| 25 – 34 (2) | 169 | 24% | |
| 35 – 44 (3) | 58 | 8% | |
| 45 or more (4) | 17 | 2% | |
| Residential area (RSD) | Urban (1) | 578 | 81% |
| Rural (2) | 136 | 19% | |
| Marital status (MAS) | Single (1) | 608 | 85% |
| Not single (2) | 106 | 15% | |
| Parental status (PAS) | With children (1) | 117 | 16% |
| Without children (2) | 597 | 84% | |
| Work experience (WEP) | None (1) | 281 | 39% |
| Less than one year (2) | 157 | 22% | |
| 1 to 10 years (3) | 189 | 27% | |
| More than 10 years (4) | 87 | 12% | |
| Employed (EMP) | Unemployed (1) | 459 | 64% |
| Employed (2) | 255 | 36% | |
| Undergraduate level (UGL) | 1° | 86 | 12% |
| 2° | 170 | 24% | |
| 3° | 180 | 25% | |
| 4° | 142 | 20% | |
| 5° | 136 | 19% |
Table 3.
Univariate descriptive statistical analysis.
| Variables | N | Mean | Variance | Skewness | Kurtosis | ||
|---|---|---|---|---|---|---|---|
| Statistic | Statistic | Statistic | Statistic | Std. Error | Statistic | Std. Error | |
| FB1* | 714 | 2.75 | 1.450* | 0.190* | 0.091 | -0.852* | 0.183 |
| FB2* | 714 | 3.84 | 1.130* | -0.628* | 0.091 | -0.368* | 0.183 |
| FB3* | 714 | 3.61 | 1.298* | -0.380* | 0.091 | -0.753* | 0.183 |
| FB4* | 714 | 3.08 | 1.592* | -0.103* | 0.091 | -0.967* | 0.183 |
| FB5* | 714 | 3.33 | 1.244* | -0.189* | 0.091 | -0.626* | 0.183 |
| FB6* | 714 | 4.07 | 1.220* | -1.101* | 0.091 | 0.442* | 0.183 |
| FB7* | 714 | 3.37 | 1.569* | -0.287* | 0.091 | -0.949* | 0.183 |
| FB8* | 714 | 3.99 | 1.143* | -0.849* | 0.091 | -0.087* | 0.183 |
| FB9* | 714 | 4.19 | 1.001* | -1.189* | 0.091 | 0.798* | 0.183 |
| FB10* | 714 | 3.44 | 1.445* | -0.298* | 0.091 | -0.825* | 0.183 |
| FB11* | 714 | 3.28 | 1.685* | -0.336* | 0.091 | -0.935* | 0.183 |
| FB12* | 714 | 2.58 | 1.769* | 0.371* | 0.091 | -1.025* | 0.183 |
| FB13* | 714 | 3.14 | 1.828* | -0.089* | 0.091 | -1.202* | 0.183 |
| Valid N (listwise) | 714 | ||||||
* Variables that satisfy the pre-established parameters of standard deviation, skewness, and kurtosis.
Table 4.
Exploratory factor analysis for three factors.
| KMO and Bartlett’s Test | ||||||
|---|---|---|---|---|---|---|
| Kaiser–Meyer–Olkin Measure of Sampling Adequacy. | 0.917 | |||||
| Bartlett’s Test of Sphericity | Approx. Chi-Square | 5247.199 | ||||
| Degree of freedom | 78 | |||||
| Significance | 0.000 | |||||
| Pattern Matrix a | ||||||
| ID | Factor 1 | Factor 2 | Factor 3 | |||
| FB1 | 0.607 | |||||
| FB2 | 0.486 | |||||
| FB3 | 0.549 | |||||
| FB4 | 0.834 | |||||
| FB5 | 0.584 | |||||
| FB6 | 0.732 | |||||
| FB7 | 0.798 | |||||
| FB8 | 0.464 | |||||
| FB9 | 0.873 | |||||
| FB10 | 0.845 | |||||
| FB11 | 0.591 | |||||
| FB12 | 0.693 | |||||
| FB13 | 0.899 | |||||
| Eigenvalue | 6.145 | 0.919 | 0.700 | |||
| % of Variance | 47.267 | 7.067 | 5.381 | |||
| Cumulative % | 47.267 | 54.334 | 59.715 | |||
| Factor Correlation Matrix b | ||||||
| Factor | 1 | 2 | 3 | |||
| 1 | 1.000 | 0.515 | 0.643 | |||
| 2 | 0.515 | 1.000 | 0.481 | |||
| 3 | 0.643 | 0.481 | 1.000 | |||
a Extraction Method: Unweighted Least Squares. Rotation Method: Oblimin with Kaiser Normalization. Rotation converged in 7 iterations. b Extraction Method: Unweighted Least Squares. Rotation Method: Oblimin with Kaiser Normalization.
Table 5.
Confirmatory factor analysis for three factors.
| KMO and Bartlett’s Test | ||||
|---|---|---|---|---|
| Kaiser–Meyer–Olkin Measure of Sampling Adequacy. (confidence interval 90%) | 0.916 (0.890; 0.917) | |||
| Bartlett’s Test of Sphericity | Approx. Chi-Square | 6726.4 | ||
| Degree of freedom | 78 | |||
| Significance | 0.000010 | |||
| Rotated Loading Matrix | ||||
| Variable (Item) | Factor 1 (F1) | Factor 2 (F2) | Factor 3 (F3) | |
| Factor Name | Financial Planning and Control |
Saving and Financial Preparation |
Compliance Financial Obligations |
|
| FB1 | 0.637 | |||
| FB2 | 0.500 | |||
| FB3 | 0.574 | |||
| FB4 | 0.860 | |||
| FB5 | 0.586 | |||
| FB6 | 0.769 | |||
| FB7 | 0.810 | |||
| FB8 | 0.508 | |||
| FB9 | 0.908 | |||
| FB10 | 0.874 | |||
| FB11 | 0.630 | |||
| FB12 | 0.760 | |||
| FB13 | 0.925 | |||
| Explained Variance | 0.556 | 0.100 | 0.082 | |
| Cumulative Variance | 0.556 | 0.655 | 0.737 | |
| Eigenvalue | 7.224 | 1.293 | 1.072 | |
| % Eigenvalue | 75.336% | 13.484% | 11.179% | |
| Inter Factor Correlation Matrix | ||||
| Factor | F1 | F2 | F3 | |
| F1 | 1.000 | |||
| F2 | 0.640 | 1.000 | ||
| F3 | 0.502 | 0.534 | 1.000 | |
Table 6.
Validation and reliability versus parameters (Schermelleh-Engel et al. 2003).
| Sample | Level | Cronbach´s alpha | MIF | χ2/df | RMSEA | AGFI | GFI | CFI | NNFI | RMSR |
|---|---|---|---|---|---|---|---|---|---|---|
| 714 | - | 0.915 ** | 3 | 1.35 **,+ | 0.067 * ci (0.047 0.077) |
0.995 ** ci (0.994 0.997) |
0.997 ** ci (0.997 0.998) |
0.991 ** ci (0,988 0.995) |
0.984 ** ci (0.978 0.991) |
0.032 ** ci (0.025 0.035) |
| ≥200 | ** | [0.80, 0.95) | NR | [0, 2] | [0.00, 0.05] | [0.90, 1.00] | [0.95, 1.00] | [0.97, 1.00] | [0.97,1.00] | [0.00,0.05) ++ |
| * | [0.70, 0.80) | ≥3 | (2, 3] | (0.05, 0.08] | [0.85, 0.90) | [0.90, 0.95) | [0.95, 0.97) | [0.95,0.97) | [0.05,0.08] ++ |
NR: not reported. ** Good fit; * Acceptable fit. + Minimum Fit Function Chi Square. ++ indicated in Kalkan et al. 2016.
Table 7.
Reliability statistics.
| Scale | Variance | Skewness | Kurtosis | Valid cases | Number of Items | Cronbach’s Alpha |
|---|---|---|---|---|---|---|
| Factor 1 | 0.909 | -0.068 | -0.645 | 714 | 4 | 0.789* |
| Factor 2 | 1.134 | -0.086 | -0.758 | 714 | 6 | 0.899** |
| Factor 3 | 0.889 | -0.887 | 0.045 | 714 | 3 | 0.814** |
| Factor Total | 0.894 | -0.070 | -0.601 | 714 | 13 | 0.915** |
* Cronbach’s Alpha >0.7, ** Cronbach’s Alpha >0.8.
Table 8.
Pearson Chi-Square Tests.
| Variable 1 | Variable 2 | N of valid cases |
Expected counts less than 5 (%). | Test validity |
Value | df | Asymp. Sig. (2-sided) |
Correlation evidence |
|---|---|---|---|---|---|---|---|---|
| F1 | GND | 714 | 10% | Yes | 2.282 | 4 | 0.684 | No |
| F1 | AGE | 714 | 25% | No | 24.291 | 12 | 0.019* | No |
| F1 | RSD | 714 | 10% | Yes | 2.369 | 4 | 0.668 | No |
| F1 | MAS | 714 | 10% | Yes | 7.472 | 4 | 0.113 | No |
| F1 | PAS | 714 | 10% | Yes | 7.634 | 4 | 0.106 | No |
| F1 | WEP | 714 | 20% | Yes | 26.110 | 12 | 0.010* | Yes |
| F1 | EMP | 714 | 10% | Yes | 4.849 | 4 | 0.303 | No |
| F1 | UGL | 714 | 20% | Yes | 18.146 | 16 | 0.315 | No |
| F2 | GND | 714 | 0% | Yes | 7.969 | 4 | 0.093 | No |
| F2 | AGE | 714 | 20% | Yes | 17.628 | 12 | 0.127 | No |
| F2 | RSD | 714 | 10% | Yes | 6.044 | 4 | 0.196 | No |
| F2 | MAS | 714 | 10% | Yes | 7.496 | 4 | 0.112 | No |
| F2 | PAS | 714 | 10% | Yes | 9.887 | 4 | 0.042* | Yes |
| F2 | WEP | 714 | 5% | Yes | 12.408 | 12 | 0.413 | No |
| F2 | EMP | 714 | 0% | Yes | 9.426 | 4 | 0.051 | No |
| F2 | UGL | 714 | 12% | Yes | 18.651 | 16 | 0.287 | No |
| F3 | GND | 714 | 20% | Yes | 3.875 | 4 | 0.423 | No |
| F3 | AGE | 714 | 35% | No | 11.113 | 12 | 0.519 | No |
| F3 | RSD | 714 | 20% | Yes | 6.593 | 4 | 0.159 | No |
| F3 | MAS | 714 | 20% | Yes | 3.369 | 4 | 0.498 | No |
| F3 | PAS | 714 | 20% | Yes | 7.252 | 4 | 0.123 | No |
| F3 | WEP | 714 | 20% | Yes | 13.108 | 12 | 0.361 | No |
| F3 | EMP | 714 | 20% | Yes | 1.731 | 4 | 0.785 | No |
| F3 | UGL | 714 | 20% | Yes | 13.434 | 16 | 0.641 | No |
| FT | GND | 714 | 10% | Yes | 1.833 | 4 | 0.766 | No |
| FT | AGE | 714 | 25% | No | 23.491 | 12 | 0.024* | No |
| FT | RSD | 714 | 10% | Yes | 3.000 | 4 | 0.558 | No |
| FT | MAS | 714 | 10% | Yes | 7.317 | 4 | 0.120 | No |
| FT | PAS | 714 | 10% | Yes | 7.581 | 4 | 0.108 | No |
| FT | WEP | 714 | 20% | Yes | 28.382 | 12 | 0.005** | Yes |
| FT | EMP | 714 | 10% | Yes | 4.644 | 4 | 0.326 | No |
| FT | UGL | 714 | 20% | Yes | 17.746 | 16 | 0.339 | No |
* % Expected counts less than 5 ≤ 20%, ** p-value < 0.05, *** p-value < 0.01.
Disclaimer/Publisher’s Note: The statements, opinions and data contained in all publications are solely those of the individual author(s) and contributor(s) and not of MDPI and/or the editor(s). MDPI and/or the editor(s) disclaim responsibility for any injury to people or property resulting from any ideas, methods, instructions or products referred to in the content. |
© 2025 by the authors. Licensee MDPI, Basel, Switzerland. This article is an open access article distributed under the terms and conditions of the Creative Commons Attribution (CC BY) license (http://creativecommons.org/licenses/by/4.0/).
Copyright: This open access article is published under a Creative Commons CC BY 4.0 license, which permit the free download, distribution, and reuse, provided that the author and preprint are cited in any reuse.


