
Submitted:
10 September 2025
Posted:
12 September 2025
You are already at the latest version
Abstract
Liquefied natural gas (LNG) as a marine fuel is already widespread in the ship-7 ping industry, but its application in the cruise sector, particularly in large cruise ships, is 8 still relatively new. By the end of 2024, twenty-four LNG-powered cruise ships will be in 9 operation, each capable of carrying thousands of passengers. The high passenger capacity 10 and frequent port calls require a rigorous safety assessment as the risks are higher than 11 those of conventional cargo ships. In this study, the safety of LNG-powered cruise ships 12 is assessed using the Formal Safety Assessment (FSA) method prescribed by the Interna-13 tional Maritime Organization (IMO). The assessment is divided into hazard identification 14 (HAZID), risk analysis, risk control options, cost-benefit assessment, and recommenda-15 tions for decision-making. Considering the limited operational data available for LNG-16 powered cruise ships, the study constructs event trees based on LNG tanker incidents, 17 modified to account for passenger-related risks and cruise ship-specific operating condi-18 tions. In addition, a statistical overview of marine casualties involving cruise ships and 19 LNG carriers with a gross tonnage of 20,000 or more over the last 35 years is provided. To 20 ensure compliance, this study examines the class and regulatory frameworks, focusing on 21 risk assessments required for the design of LNG-powered ships, bunker operations, and 22 emergency preparedness. These risk assessments, which are conducted at multiple levels 23 — including component-specific, ship-wide, and procedural risk assessments — are es-24 sential for safety validation and regulatory approval. This study provides a comprehen-25 sive framework for assessing LNG safety in the cruise industry by synthesising existing 26 safety data, regulatory standards, and probabilistic risk models. The results contribute to 27 the ongoing discourse on alternative marine fuels and support decision-making by ship 28 operators, regulators, and industry stakeholders.
Keywords:
LNG
; cruise ships
; accident analysis
; risk assessment
; safety
; event trees
1. Introduction
Liquefied natural gas (LNG) as a marine fuel is becoming increasingly important in the cruise industry. While LNG propulsion is not a new concept - it has been used on liquefied natural gas carriers (LNGCs) powered by boil-off gas (BOG) since the early 1960s — its expansion to other types of vessels, particularly large cruise ships, represents a significant technological and regulatory shift. Key drivers of this change include stricter environmental regulations, increasing fuel efficiency requirements, and the need to reduce greenhouse gas emissions. Despite the environmental and economic benefits, introducing LNG as a fuel comes with significant challenges, particularly regarding safety. Operational risks associated with LNG include potential leaks, methane slip, cryogenic hazards, and explosion risks. In addition, the safe integration of LNG systems into cruise ships requires adjustments to ship design, fuel storage, and bunker operation. It must be ensured that cruise ships with LNG propulsion achieve at least the same level of safety as ships with conventional propulsion, especially given the high passenger capacity and frequent operation in densely populated port areas. However, the lack of comprehensive industry data on LNG-related incidents, operational challenges, and long-term safety performance remains a critical gap in current maritime research. A comprehensive assessment of LNG safety in the cruise industry will contribute to informed decision-making for ship designers, operators, and policymakers through accident data analysis, risk assessment methods, and regulatory evaluation. In particular, this paper examines the accident history of LNG carriers and cruise ships over the past 35 years, focusing on incidents involving LNG-powered cruise ships since the first such ship was launched in 2018. By comparing accident data between LNG and distillate-powered cruise ships, the aim is to assess whether LNG propulsion meets or exceeds current safety standards. As cruise ships carry the most valuable cargo — human life — establishing the equivalence of LNG safety is paramount. To structure the analysis, this paper is divided into five main sections. First, the accident analysis examines historical incidents involving cruise ships and LNG carriers to identify relevant safety trends. Next, safety features are compared, and the LNG-powered cruise ships’ design and operational safety measures are evaluated compared to their oil-powered counterparts. The study then applies the IMO-recognized Formal Safety Assessment (FSA) methodology to assess risks and mitigation strategies systematically. The results and discussion section presents the key findings on the safety of LNG in the cruise industry. At the same time, the conclusions summarise the overall findings and their implications for the future adoption of LNG in the cruise industry.
1.1. Literature Review
Despite the increasing presence of LNG-powered cruise ships, research addressing their safety and operational risks is still limited. While extensive studies have examined LNG safety in maritime transportation and general safety in the cruise industry, an integrated scientific approach to LNG propulsion in the cruise sector is lacking. Previous risk assessments, mainly conducted by ship classification societies and shipping companies, have been largely theoretical and have relied on findings from LNG tanker operations rather than empirical data from LNG-fuelled cruise ships. Given the increasing number of LNG-powered cruise ships, 24 with a gross tonnage of 15,000 to 180,000 GT in 2024 [1] - this provides an excellent opportunity to assess whether their safety matches or exceeds that of conventionally powered cruise ships. The general passenger ship safety landscape must be examined to comprehensively understand LNG risks in the cruise industry. Previous safety analyses show that passenger ships have the highest accident frequency among ship types (5.18E-02), closely followed by RoPax ships (4.39E-02) [2]. Eliopoulou et al. (2023) [3] have also shown that the number of fatalities on passenger ships increased between 2011 and 2021, while a decrease was recorded for ro-pax ships. These results indicate that the general safety of passenger ships has not improved significantly in recent years despite technical advances. Given the high frequency of cruise ships’ use, they often call at ports several times a week - nautical risks are a critical issue, especially in congested ports. Studies show that most accidents involving passenger ships occur in inland waterways or port areas [4], where the proximity to other ships and infrastructure increases the risk of collision. Vidmar et al. [5] analysed cruise ship accidents between 1990 and 2014 and used event trees to assess the risks associated with port entry. Similarly, Perkovič et al. [6] investigated nautical risks associated with LNG, especially in the port of Koper, and showed collision scenarios between LNG tankers and other ships. In addition to the safety of shipping, bunkering LNG poses additional operational challenges. The cryogenic nature of LNG, its high flammability, and the complexity of the bunkering process - especially ship-to-ship and shore-to-ship refuelling - require stringent safety measures. Iannaccone et al. [9] demonstrated that bunkering LNG poses higher risks than conventional fuel, with critical failure points related to equipment reliability and transhipment operations. Although the risks associated with LNG bunkering are within the ALARP (As Low As Reasonably Practicable) threshold, they require systematic mitigation strategies in ship design and operational protocols. In addition, introducing LNG bunkering in ports requires an improved safety infrastructure. TGE Gas Engineering [7] reports that LNG operations require advances in waterway maintenance, traffic control, and port technology to mitigate risks. However, a few studies assess the risks to port populations during LNG bunkering [8], indicating a research gap that should be investigated further.
Ship design and automation are crucial in mitigating the risks associated with LNG propulsion. As human error remains the leading cause of accidents at sea [4], modern LNG-powered cruise ships have advanced automation systems that increase safety and operational reliability. Ahola et al. [10] emphasise that ship designers must integrate safety-oriented features to ensure effective emergency response and intuitive navigation in high-risk situations. Increased automation in LNG facilities reduces human intervention in critical operations [15,16,17,18], thus lowering the likelihood of accidents. The exceptional safety record of LNG carriers supports this argument. Vanem et al. [11] emphasised that LNG carriers benefit from superior design standards, strict maintenance protocols, and well-trained crews, contributing to their relatively low accident rates. Eliopoulou et al. [2] also find that LNG ships under 20 have lower accident rates, while older LNG ships have significantly higher risks. Notably, in contrast to crude oil tankers, LNG carriers have suffered minimal ship losses in recent decades, which underlines their good safety profile.
The LNG shipping industry generally has an exemplary safety record. According to SIGTTO [12], LNG carriers have transported over 100,000 cargoes in 55 years of commercial operation without losing cargo or fatality directly attributable to LNG. SEA-LNG [13] further reports that LNG shipments have travelled over 130 million miles without a major safety incident, which is a testament to the industry’s rigorous safety standards, extensive crew training, and advanced vessel design. The global LNG tanker fleet, comprising around 683 vessels [1], is expected to transport 404 million tons of LNG annually by 2023 [14]. Although the safety record of LNG in maritime transportation is impressive, the associated hazards — cryogenic exposure, risk of asphyxiation and explosion potential - need to be carefully managed, especially when dealing with high-capacity passenger vessels [19]. In contrast to LNG-only transportation vessels, LNG-powered cruise ships bring new safety considerations as they must accommodate thousands of passengers in a highly dynamic operating environment. System failures in LNG infrastructure — especially under the stresses of ocean shipping — may have different failure rates than those documented for land-based systems [19,20]. Applying quantitative risk assessment methods, including event trees and fault trees, as used by Aneziris et al. [31] and Vidmar et al. [32], provides a structured approach to evaluating potential failure scenarios.
Apart from the LNG-specific concerns, the general transition to alternative marine fuels brings additional safety challenges. Davies [24] points out that while alternative fuels offer environmental benefits, they often require larger storage volumes, which increases the potential for hazards. The inherently hazardous properties of alternative fuels require enhanced safety precautions, more sophisticated equipment and highly specialised crew training to maintain safety standards. As the shipping industry accelerates its efforts to decarbonise, it is imperative that safety remains a top priority [22,23,25,26].
1.2. Methodology Used
To assess the safety of LNG-powered cruise ships, this study applies the Formal Safety Assessment (FSA) methodology, a structured risk assessment framework widely used in maritime safety research and endorsed by the International Maritime Organization (IMO). The FSA approach consists of five main components: Hazard Identification (HAZID), Risk Analysis, Evaluation of Risk Control Options, Cost-Benefit Analysis, and Decision Recommendations. This method has been used extensively in previous studies to assess the safety of LNG carriers, container ships, crude oil tankers, cruise ships, and RoPax ships [27]. The data for this study were taken from the S&P Maritime Portal (Sea-web) [1], a comprehensive database of worldwide shipping accidents. The analysis examines historical incidents involving LNG carriers and passenger cruise ships, focusing on identifying critical risk areas for passengers, crew and ship operations.
The study applies the event tree method, a probabilistic risk assessment tool commonly used in IMO safety assessments [28,29,30]. This approach models accident scenarios for LNG-powered cruise ships, including contact, collision, fire/explosion, and grounding. Given the limited data set available for LNG cruise ship incidents — it has only been operational since December 2018 — the LNG tanker accident trees will serve as a frame of reference, with modifications to account for passenger-specific risk factors. The current data (2018–2024) shows one contact incident, two fires/explosions, 42 illness/death/injury incidents, and six cases of going overboard for LNG cruise ships [1]. By integrating accident data analysis with event tree modelling, this study aims to determine whether LNG technology meets the stringent safety requirements for large passenger cruise ships. The results will provide valuable insights to regulators, classification societies, and industry stakeholders in deciding whether to introduce LNG to the cruise industry. In this study, the term “fleet exposure” is introduced instead of “ship exposure” to represent the cumulative operating time of the entire cruise fleet more accurately than the contributions of individual ships. While ship exposure usually refers to the operating time of an individual ship in ship years, fleet exposure aggregates this measure across all ships in the fleet over a given period. This approach provides a holistic view of risk and accident probability as it considers the entire fleet rather than isolating the performance of individual vessels.
2. Accident History of Cruise Ships and LNG Tankers
The introduction of LNG as a marine fuel for cruise ships is a relatively recent development, so there is little comprehensive statistical data on LNG-related accidents in this sector. Given this limitation, safety trends in the LNG tanker industry — where LNG transportation has been established for over six decades — can serve as a basis for a comparative risk assessment. By examining accident statistics from both LNG carriers and conventional cruise ships, it is possible to derive safety implications for LNG-powered cruise ships. This section analyses the history of accidents in LNG transportation and the cruise industry, providing insights into operational risks, accident frequency, and general safety trends.
2.1. Safety Status of LNG Transport and the Cruise Industry
Liquefied natural gas is critical in global energy security and supply diversification. Like all hydrocarbon fuels, LNG must be handled under strict safety precautions. However, LNG transportation has an exceptional safety record, as there has never been a major cargo loss on an LNG tanker. Since the first shipment of LNG in 1959, the industry has travelled more than 130 million nautical miles — the equivalent of 5,000 circumnavigations of the globe — without a single major accident involving the loss of an LNG cargo [13]. Today, the global LNG tanker fleet comprises more than 680 vessels with an unparalleled safety record. While there have been minor incidents, these have not resulted in catastrophic consequences or environmental hazards. Notable historical cases include the El Paso Paul Kayser in 1979, which ran aground at 19 knots, and the LNG Taurus in 1980, which ran aground off Tobata, Japan, in heavy weather. In both cases, the structural integrity of the LNG containment system remained intact, and no cargo loss was reported [33]. In addition, minor spills have occurred during LNG port operations but did not result in ignition or large-scale safety failure.
While LNG transportation has an excellent safety record, industrial accidents involving LNG onshore have highlighted the potential hazards associated with the handling and storage of LNG. Serious accidents include the Cleveland disaster of 1944 with 128 casualties and the 2004 explosion at the Skikda plant in Algeria, in which 27 workers lost their lives [33,34]. However, these accidents occurred at fixed LNG processing facilities and not at sea, emphasising the importance of strict safety protocols for the handling [21] and storing of LNG fuel on board ships. In contrast, while highly regulated, the cruise industry has seen notable accidents over the past three decades, often involving structural failure, fire hazards, and navigational errors. Cruise ships make up less than 1% of the global merchant fleet but carry more than 32 million passengers annually [35] and have a market value of 138 billion dollars, as reported by the Cruise Lines International Association (CLIA) [36]. Given this high risk, ensuring passenger safety is paramount, and cruise ships are subject to the strict requirements of the International Safety Management (ISM) Code, the SOLAS Convention, and the International Ship and Port Facility Security (ISPS) Code. Cruise ships operating out of US ports are additionally inspected by the US Coast Guard (USCG), which conducted 292 safety inspections of cruise ships in 2017 and detained only one ship for non-compliance [37]. Despite regulatory oversight, several high-profile cruise ship accidents have occurred, many of which have generated significant media coverage. Some of the most notable incidents include [38]:
- Costa Concordia (2012) – Capsized after grounding off the Isola del Giglio, resulting in 32 fatalities.
- Carnival Triumph (2013) – After a fire in the engine room, the ship was without propulsion for four days, severely affecting passenger conditions.
- Orient Queen (2020) – was severely damaged in the ammonium nitrate explosion in Beirut, later capsized and killed two people.
- Star Princess (2006) – A fire broke out on deck, reportedly caused by an unattended cigarette, resulting in one death and 13 injuries from smoke inhalation.
- Royal Pacific (1992) – Collision with a Taiwanese fishing trawler in the Straits of Malacca, resulting in 30 deaths and 70 injuries, exacerbated by a faulty emergency response system.
These incidents make it clear that fire hazards, loss of propulsion, and navigational errors are among the most important safety problems in the cruise industry. LNG is inherently flammable, so a thorough risk assessment of fire and explosion hazards is critical, especially for LNG-powered cruise ships. The following sections analyse the accident history and accident frequency analysis of the cruise fleet and the LNG tanker fleet over the past 35 years.
2.2. Cruise Ship Exposure and Accident Trends
This study uses the results of the IMO’s Formal Safety Assessment (FSA) for the systematic assessment of accident risks for LNG-powered cruise ships [39,40]. This assessment categorises cruise ships according to size and operational risk exposure. As LNG-powered cruise ships are relatively new to the industry, comparative safety assessments are based on historical accident trends in the conventional and LNG tanker fleets.
For analytical consistency, four ship size ranges were selected to encompass the current global cruise fleet, including the first large LNG-fueled cruise ship, AIDAnova (183,858 GT). The same methodology was applied to the LNG tanker fleet to obtain a comparable data set. The accident frequency was determined for the most important hazardous events: Collision, contact, fire/explosion, hull/machinery damage, illness/fatality/injury and stranding (grounding). The accident frequency (AF) is a standardised measure for the occurrence of accidents that enables a comparative risk assessment across different ship categories and operating periods. It is calculated by dividing the total number of recorded accidents (N) within a given period by the total exposure (E) of the ship or fleet in ship years during the same period:
The expansion of the global cruise fleet over the last three decades has led to a corresponding increase in the absolute number of reported accidents. A proportional increase in accidents can also be expected with increasing fleet size. However, it is important to analyse the frequency of accidents rather than the absolute number to assess safety trends accurately. Figure 1 shows the fleet risk (left axis) for cruise ships over 20,000 GT since 1989 and the annual number of reported accidents (right axis, ceiling diagram). The strongest growth has been in the 90,000 GT and above segment, particularly in the last decade as the number of large cruise ships increased. By the end of 2024, the global cruise fleet will comprise 294 ships.
To ensure coherence with previous studies and consistency with IMO ship categorisation, only ships over 20,000 GT were included in the core frequency analysis. This lower threshold excludes smaller ships, which are, on average, older and not representative of the modern or future cruise fleet, nor of the ship types mainly considered in this assessment. Maintaining the 20,000 GT threshold also ensures comparability with previous accident statistics and safety performance assessments. Given the recent emergence of LNG-powered cruise ships in the smaller segment, ships between 15,000 and 20,000 GT will also be analysed in the following sections, where appropriate, to consider new technological developments and emerging operational trends. The fleet was divided into four size classes to enable a differentiated analysis: 20.000 – 60,000 GT, 60,000 – 90,000 GT, 90,000 – 180,000 GT, and>180,000 GT. During the reporting period, the exposure of the fleet in these categories amounted to 3,037 fleet years (46.1%), 1,627 fleet years (24.7%), 1,816 fleet years (27.6%), and 107 fleet years (1.6%), respectively, for a total of 6,587 ship years. These exposure values serve as the basis for calculating the accident frequency per ship year, a standard indicator for assessing safety trends in the cruise industry. The segment of ships with more than 180,000 GT is the least at risk, as these ships have only been in commercial operation since 2009. As shown in the figures, the distribution of accidents across the four size categories reveals that the accident rate per ship year remains relatively uniform across all segments despite variations in fleet size. A notable increase in accidents over the last ten years is linked to a significant increase in the number of large cruise ships on the market.
The data set compiled for further analysis comprises 537 registered accidents between 1989 and 2024, categorised by accident type (Table 1), based on information from the S&P Sea-Web Maritime Portal. The most common accident category is damage to hull and machinery (240 incidents), which is the predominant form of technical failure. This is followed by fire and explosion incidents with 106 cases, which emphasises the great importance of fire safety on board passenger ships. Collision accidents account for 67, and illustrate the risks associated with navigational errors, particularly on congested waterways. Contact accidents, which are usually structural collisions with harbour infrastructure or other ships, account for 82 incidents. Groundings or strandings, which are often due to human error or unfavourable environmental conditions, accounted for 41 incidents. Cases relating to illness, death, and injury were excluded from the analysis, as these are primarily medical emergencies not directly related to ship operations. One ship was reported as sunk; this was not the Costa Concordia, which is categorised in the database as a contact accident.
Figure 1 shows a graphical representation of fleet exposure by gross tonnage and the distribution of accidents within each class. As expected, most accidents are concentrated in the smaller ship classes, where fleet exposure is also highest. Conversely, the largest ship class has the lowest number of accidents, which is primarily due to the relatively recent emergence of cruise ships of more than 180,000 GT, which only entered service from 2008 onwards. To compare the safety performance in the different size segments, a relative risk ratio was calculated by dividing the accident rate by the exposure rate (shown in the lower section of Table 1, representing the total number of accidents within each ship size category). Interestingly, and perhaps unexpectedly, the results show a high degree of consistency between the size segments.
The 90,000–180,000 GT segment deviates slightly with a relative risk value of 1.13, suggesting that the ratio between accident frequency and exposure is slightly higher than expected. The lowest ratio, 0.92, was observed in the largest ship class. The table also shows the calculated accident frequencies and the normalised proportion of accident frequency in the individual classes. The calculated accident frequency (Figure 2) per ship year (blue bars) shows a slightly increasing trend in the period 1989–2024, as shown by the linear regression line (dashed). While short-term fluctuations can be observed, the long-term trend indicates a gradual increase in accident frequency. Recently, however, there have been signs of stabilisation, possibly due to the effects of improved ship design, regulatory measures, automation, and risk management systems. Continuous monitoring and analysis remain crucial to determine whether the safety measures introduced are effectively mitigating the risks of the growing cruise fleet.
To further facilitate interpretation, the concept of return period (RP) is introduced. Expressed in ship years per accident, the RP represents a standardised measure of the expected interval between accident events. It intuitively reflects the frequency of accidents within a given fleet size and operating period: a higher RP means a lower probability of occurrence, while a lower RP represents a higher probability. Mathematically, the return period is defined as the reciprocal of the accident frequency.
2.3. LNG Tankers’ Exposure and Accident Trends
Like the previous analysis of cruise ship accidents and accident frequency trends, data on LNG carriers will be collected and analysed to determine the accident frequency and return periods to allow a comparative assessment of the safety performance of both types of ships. LNG carriers and LNG terminals are widely regarded as the benchmark for safety in the industry due to their advanced safety systems, robust structural integrity and rigorous operating protocols. These factors contribute to an exceptionally low accident rate, significantly reducing the likelihood of incidents and cargo losses [41]. Despite the steady growth of the LNG fleet over the last 35 years, historical data confirms that LNG carriers have one of the highest safety standards in commercial shipping. Figure 3 illustrates the growth of the LNG tanker fleet, which is expected to comprise 699 vessels by 2024 [1]. The expansion has been driven primarily by ships in the 90,000–180,000 GT category, which now account for 83% of the total fleet. In contrast to other tanker segments, no LNG tankers of more than 180,000 GT have yet been built. As most LNG carriers operate in this size range, it is unsurprising that 62.9% of all documented accidents involving LNG carriers have occurred in this segment (Figure 3, upper orange line). However, a notable anomaly is the 60,000–90,000 GT category, which accounts for 25% of all LNG carrier accidents despite comprising only nine vessels that remain active in 2024. From 1989 to 2024, 114 accidents were recorded in the LNG tanker sector, a figure well below that of the cruise industry. Although the absolute number of accidents has increased in recent years, this is due to the expansion of the fleet rather than a deterioration in safety performance. Since 2006, accident frequency has decreased and is consistently below the historical average, supporting the assertion that LNG shipping has shown continuous safety improvements over time (Figure 4). The cumulative fleet risk for LNG carriers across all size classes is 9,312 ship years (spread over 740, 808, 7,764, and 0 in the respective segments). This exposure figure serves as the basis for calculating the accident frequency, ensures an objective risk assessment, and provides a standardised basis for evaluating safety performance.
Table 2 shows the distribution of accidents by accident type over the last 36 years (1889-2024). The most common category of accidents is hull/engine damage (60 incidents, 52.6%), which shows that technical failure is the main risk factor in LNG carrier operations. Other notable categories are collisions (26 incidents, 22.8%), which indicate hazards to navigation. The number of fire/explosion incidents (11 incidents, 9.5%) remains significantly lower than for other ship types, while contact (8 incidents, 7%) has a low impact on port infrastructure.
Groundings/strandings (9 incidents, 7.9%) underline the cautious driving style typical of LNG tankers. Despite the increase in fleet size, the safety of LNG carriers remains exceptionally high, and the frequency of accidents has decreased over the last two decades. The low frequency of fires and explosions distinguishes LNG carriers from other fuel transportation vessels, which is due to the multi-layered safety systems. Compared to the cruise industry, LNG carriers have better risk control measures due to stringent design standards, well-trained crews, and LNG containment’s inherent safety.
However, applying LNG safety principles to passenger cruise ships brings new challenges, particularly concerning passenger evacuation, bunker operations and risk perception on board. These factors require a tailored risk assessment to ensure that the LNG propulsion system meets the industry’s stringent safety requirements.
3. Safety Features of Large LNG-Fuelled Cruise Ships Compared to Conventional Oil-Fuelled Cruise Ships
The safety assessment of LNG-powered cruise ships is challenging due to the limited operational experience and lack of comprehensive accident data. Unlike conventional ships powered by heavy fuel oil (HFO) and marine gas oil (MGO), LNG cruise ships represent a relatively new application of this fuel in the passenger sector, with the first ship, AIDAnova, entering service in 2018. Given the small number of LNG-powered cruise ships and the lack of a statistically representative accident data set, this study evaluates various safety vectors to assess the feasibility and risks associated with LNG as a marine fuel for passenger ships.
3.1. Hazards of LNG as Marine Fuel
LNG is a cryogenic fuel with a boiling point of approximately −161°C, which poses risks associated with extreme cold, rapid expansion during vaporisation, and flammability [42]. In its liquid state, LNG is neither explosive nor flammable; however, during vaporisation, methane-air mixtures with a concentration between 5 and 15 % become flammable [43]. In contrast to conventional marine fuels, special conditions are required for the ignition of LNG, including sufficient gas dispersion and an ignition source. At 580 °C, the auto-ignition temperature of methane is significantly higher than that of HFO or MGO, which makes accidental ignition in engine rooms less likely [43,44]. However, the minimum ignition energy of methane (0.30 mJ) is almost 100 times lower than that of marine distillate fuels, which means that even small, imperceptible sparks can ignite a methane-air mixture. Possible fire and explosion scenarios include flashovers, confined space explosions, flashovers and boiling, expanding vapour explosions (BLEVE), mainly occurring in pressurised LNG storage tanks [43]. Unlike conventional marine fuels, LNG is not associated with fires in pools or the risk of toxic smoke inhalation, as is the case with HFO and MGO fires. However, LNG poses unique risks such as cryogenic burns, structural embrittlement, rapid phase transitions, and flashover phenomena, which require special safety measures in ship design and operating procedures.
The bunkering of liquefied natural gas (LNG) poses special safety requirements that differ from those for conventional marine fuels, as it is cryogenic and flammable and changes phase rapidly when released. While LNG has an established safety record in the shipping industry, its use as a bunker fuel for cruise ships brings additional complexity regarding passenger presence, port operations, and simultaneous activities (SIMOPS). The bunkering process requires strict adherence to risk management protocols to avoid incidents that could lead to fires, explosions, structural damage, or environmental pollution. Industry organisations such as the Society for Gas as a Marine Fuel (SGMF) and the International Association of Ports and Harbors (IAPH) have developed comprehensive guidelines for LNG bunkering that focus on risk-based safety measures [45]. In addition, the ISO 20519:2021 standard specifies standards for hardware, procedures, record-keeping, and personnel training to ensure safe LNG handling operations [46]. However, given the complexity of LNG handling, standardisation alone cannot eliminate risk, so continuous assessment of bunkering-related hazards, procedural safety precautions, and technological advancement is required.
Mitigating the risks associated with LNG requires a multi-layered approach to safety that includes engineering controls, operational procedures, and contingency planning. According to IEC 60079-14, risk mitigation follows three main principles [47]: Substitution – elimination or replacement of hazardous substances (does not apply to LNG). Control – handling of flammable substances, preventing gas accumulation, eliminating ignition sources, and demarcating hazardous areas. Mitigation – use of fire and gas detection systems, explosion protection, and structural reinforcement. To reduce the likelihood of gas accumulation, LNG bunkering uses forced ventilation, demarcation of hazardous areas, and vapor barrier techniques. Other safety precautions include double-walled pipelines, inert gas atmospheres (e.g., nitrogen blanketing), and automatic leak detection systems. In the event of a confirmed gas release, automatic emergency shutdown (ESD) and breakaway couplings (BRC) ensure that the LNG transfer is stopped immediately, minimising the amount of gas released [48]. Bunkering in port environments additionally poses a particular risk factor due to the proximity to shore-side infrastructure, other vessels, and passenger activities. In contrast to LNG transport ships, whose crews are fully trained in cargo handling and emergency procedures, non-specialized staff and passengers are also included in the risk equation for cruise ships. This requires special risk assessments and increases operational monitoring before LNG transfers are approved. Key safety considerations include Compatibility checks – ensuring that the receiving vessel, bunkering facility, and delivery vessel meet interoperability and safety standards. Safety Zones – establishing safety zones enforced by port authorities to minimise risks to surrounding operations.
Simultaneous Risk Assessment (SIMOPS) – Assessment of whether loading and unloading of cargo, passenger movements, and other port activities can be carried out safely during bunkering. Emergency Response Planning (ERP) – Coordinated shutdown procedures involving ship crews, port authorities, and terminal operators to respond to potential LNG leaks, spills, or fires. While SIMOPS are often permitted under strict safety protocols, they introduce additional variables into the risk assessment of the LNG bunker. The International Safety Management (ISM) Code requires ships receiving LNG to include effective emergency response measures in their Safety Management System (SMS) to manage potential LNG-related hazards [48]. A unique safety aspect of LNG-powered ships, unlike conventional marine fuels, is the need to handle boil-off gas (BOG), which continuously vaporizes due to heat ingress. In type C pressure tanks, which are designed for a pressure of up to 10 bar, this process leads to increased gas volume and pressure. Venting is not possible under normal conditions due to the flammability of methane and the environmental impact, so the BOG must be efficiently managed by reusing it in engines or boilers. In emergency scenarios, safety valves can release excess pressure, creating flammable vapor clouds that require strict control measures. In addition, when bunkering LNG, the BOG can be returned to the supplier’s facility via vapour return lines to reduce pressure build-up and ensure operational safety [48].
3.2. LNG as Marine Fuel: Regulation, Adoption, and Cruise Sector Integration
The adoption of LNG as a marine fuel has accelerated over the past decade, evolving from a niche application in LNG carriers to a mainstream alternative in several shipping segments, including container ships, tankers, bulk carriers, car carriers, and cruise ships. The environmental benefits of LNG, in particular the reduction of SOx, NOx, CO2, and particulate emissions, have made LNG the predominant alternative fuel in the maritime sector. According to DNV, 469 LNG-powered ships (excluding LNG carriers) were in operation in December 2023, and 537 more were on order. Over 1,000 LNG-powered ships are forecast to be in operation by 2027, compared to 36 LNG-powered ships ten years ago [49]. Despite their growing market share, LNG-powered ships still comprise a small proportion of the global fleet. According to the IMO Future Fuels and Technology Report and the DNV Alternative Fuels Insight (AFI) platform, 99.16% of ships are still powered by conventional fuels, and only 0.62% use LNG. However, LNG is the leading alternative fuel, accounting for 10.16% of new ship orders, and forecasts predict 1,262 LNG-powered ships by 2033 [50,51]. This expansion is supported by the development of LNG bunkering infrastructure with 88 bunkering facilities and 17 LNG storage terminals worldwide. Europe is the leader in LNG fuel infrastructure (43.75%), followed by Asia (33.04%), with Norway and China being the most developed LNG bunkering hubs [49].
The use of LNG as a primary fuel for large cruise ships falls under the International Code for the Safety of Ships Using Gases or Other Low Flashpoint Fuels (IGF Code), which prescribes a targeted safety approach, mandatory risk assessments, and more stringent operational requirements than for conventional fuels. On the other hand, the International Gas Carrier (IGC) Code applies to LNG carriers, which primarily regulate the transportation of liquefied gases and focus on prescriptive regulations. The IGF Code, which has been in force since 2017, was developed to ensure the safe design, operation, and maintenance of ships powered by LNG. It covers the entire fuel system, from storage tanks to combustion systems, and addresses risks associated with fires, explosions, cryogenic hazards, and fuel tank failure. The introduction of LNG in the cruise sector represents a paradigm shift, with AIDAnova becoming the first LNG-powered cruise ship in 2018. While LNG offers significant benefits in reducing emissions, its integration into the passenger shipping industry presents some operational and economic challenges. Introducing LNG-powered cruise ships requires higher capital and operating costs, as special systems are needed to store, transport, and burn the fuel. In addition, the limited global bunkering capacity requires a significant expansion of infrastructure to supply the growing LNG-powered fleet. Furthermore, the safe operation of LNG-powered vessels requires specialised crew training in LNG handling, emergency procedures, and risk mitigation, further complicating widespread adoption in the cruise industry.
3.3. Safety Risks of LNG Storage, Bunkering, and Passenger Exposure
From an operational perspective, LNG-powered cruise ships remain a minority. In 2023, less than 0.16 million tonnes of LNG will be consumed on cruise ships, compared to over 6 million tonnes of conventional fuel [52]. The long-term viability of LNG in cruise operations depends on its safety compared to conventional fuels. While LNG has proven safe in cargo shipping, its risks on passenger ships must be further analysed, especially regarding bunkering accidents, fuel handling safety, and emergency protocols.
Building on the previous discussion, this study examines accident trends on LNG-powered cruise ships from 2018 to 2024. It compares them with HFO- and MGO-powered ships to assess whether LNG is a safer alternative for the cruise industry, focusing on the frequency and severity of accidents.
Let’s first look at the trend towards building cruise ships that run on liquefied natural gas. Smaller ships have also appeared in recent years, so the lower size category in Table 3 has been adjusted to include ships with a gross tonnage of 15,000 to 60,000 GT. It is also important to emphasise that from 2025 onwards, most planned cruise ships will be built with a gross tonnage of 90,000 GT and above. This clearly shows how the cruise industry is moving – towards ever larger ships.
Based on the data collected by S&P Sea-Web, Figure 5 shows the distribution of cruise ship accidents by fuel type and accident severity. The analysis refers to LNG and two conventional fuels: residual fuel (heavy fuel oil – HFO) and distillate fuel (marine gas oil – MGO, marine diesel oil – MDO). These fuels differ considerably in their composition, refining process and operating characteristics. HFO, which is obtained from heavy crude oil fractions, is highly viscous, contains sulphur and must be preheated before combustion. Despite its low cost, it causes higher SOx, NOx and particulate emissions and has traditionally been used in large, low-speed engines of ocean-going vessels. In contrast, MGO/MDO, which is refined from lighter fractions, has a lower viscosity and lower sulphur content, allowing cleaner combustion without preheating. The IMO’s sulphur cap for 2020 has accelerated the decline in the use of HFO in passenger shipping, a trend that can be clearly seen in Figure 5.
The accident statistics show that most accidents occurred on distillate-powered propulsion, particularly in the 90,000–180,000 GT category. However, this distribution must be viewed against the background of the fleet composition: 266 ships fuelled by conventional fuel compared to only 24 units powered by LNG. Between 2018 and 2024, 84% of accidents on cruise ships were classified as non-serious, while only 5% involved LNG-powered ships. Of the 16% of accidents classified as serious, only 1% were due to LNG as a fuel source. Further analysis shows that 7% of all accidents occurred in harbours or docks, while the location of most non-serious accidents (89%) and 88 serious accidents was not specified. Only 9% of serious accidents were confirmed to have occurred at sea or in a harbour. This lack of reliable information on accident location highlights the need to improve reporting in order to improve both general and fuel-specific safety assessments.
Most accidents involved illness, death, or injury, which is to be expected given the large passenger capacity of cruise ships. For ships fuelled by LNG, 51 accidents were recorded, of which only three were not related to passenger health or safety - one contact and two fire/explosion incidents. This represents 6% of LNG-related accidents and only 0.4% of all accidents on cruise ships.

Table 4.
Location of Cruise ship accidents 2018-2024 by seriousness.
| Seriousness of the accident by location | 15-60 kGT | 60-90 kGT | 90-180 kGT | > 180 kGT | Total |
|---|---|---|---|---|---|
| Non-Serious | 77 | 138 | 435 | 69 | 719 |
| At Sea | 3 | 3 | 13 | 19 | |
| Estuary/River | 2 | 2 | |||
| In Port/Harbour/Dock | 11 | 13 | 22 | 6 | 52 |
| Restricted Waters | 1 | 1 | 1 | 3 | |
| Shipyard/Dry Dock | 1 | 1 | |||
| Not known | 62 | 119 | 398 | 63 | 642 |
| Serious | 18 | 22 | 80 | 20 | 140 |
| At Sea | 3 | 1 | 2 | 6 | |
| Canal | 1 | 1 | |||
| In Port/Harbour/Dock | 3 | 2 | 1 | 6 | |
| Restricted Waters | 2 | 1 | 3 | ||
| Shipyard/Dry Dock | 1 | 1 | |||
| Not known | 10 | 18 | 76 | 19 | 123 |
| Total | 95 | 160 | 515 | 89 | 859 |
In contrast to Figure 5, which includes all accident types, Figure 6 focuses exclusively on operational accidents related to ship management, excluding incidents involving injuries to crew and passengers, falls overboard or other health-related incidents. For distillate-fuelled vessels, 11% of all recorded accidents fell into this category, including 15 collisions, 22 contacts, 22 fires/explosions, 26 cases of hull or machinery damage, and three strandings. In comparison, LNG-fuelled cruise ships recorded only three such incidents - one contact and two fires/explosions - while ships powered by residual fuels reported one collision and one case of hull or machinery damage. This comparison clearly shows that the number of operational accidents on LNG-fuelled cruise ships is significantly lower. However, given the relatively small LNG fleet and the limited number of accidents, the results should be interpreted with caution, emphasising the need for continuous monitoring and long-term analysis.
4. Formal Safety Assessment (FSA): Methodology and Limitations
To conduct a detailed safety analysis of LNG-powered cruise ships, this study applies the Formal Safety Assessment (FSA) methodology, a standardised risk-based framework introduced by the IMO. The FSA provides a structured approach to identify, assess and mitigate risks and enables a systematic assessment of LNG as a marine fuel in the cruise industry. By integrating cost-benefit analysis, individual and societal risk criteria and regulatory considerations, the FSA enables an objective comparison of LNG-fueled ships with conventional HFO and MGO-powered vessels and ensures that the proposed safety measures meet maritime safety standards and industry feasibility. The Formal Safety Assessment (FSA) is a structured, risk-based decision support tool developed to assess the risks for specific vessel types and provide input for new or revised maritime regulations. It is a highly technical and complex methodology that emphasises cost-benefit analysis and societal risk criteria as well as critical social, economic and ethical considerations, such as:
- The financial capacity of ship owners/operators to implement risk mitigation measures.
- The economic valuation of human life in the context of regulatory decision-making.
- The relationship between a ship’s economic activities and the associated social risk acceptance criteria.
Given this complexity, the FSA is generally not appropriate for risk assessments applied to the design assessment of individual ships, particularly alternative design proposals. Instead, the FSA serves as a comparative tool for evaluating existing and proposed regulatory frameworks to ensure that regulatory changes at the IMO level are cost-effective, equitable and justified. The FSA provides objective analysis to support policy development and facilitates regulatory change through consensus-based decision-making. It is based on widely accepted individual risk criteria, but its societal risk criteria are unique to the FSA and tailored to specific ship types. These criteria, which relate potential fatalities to economic activity and the monetary valuation of life, remain controversial due to their subjective nature and lack of adoption by governments and other industries. The inherent difficulty of reconciling economic, ethical and social dimensions of risk assessment has led some to argue that economic factors should not be embedded in mathematical risk criteria but should be considered alongside broader social and safety objectives [53].
4.1. Individual and Societal Risk Assessment of LNG-Fuelled Passenger Ships
The introduction of LNG as a marine fuel brings various individual and societal risks that must be carefully assessed against evolving maritime safety criteria. The individual risk relates to the likelihood of passenger and crew deaths due to operational hazards, including cryogenic exposure, rapid phase transitions, explosion risks, and asphyxiation hazards in enclosed spaces. While LNG reduces environmental and air pollution problems, it requires specific risk controls, such as advanced safety systems, automatic gas detection, and enhanced crew training to ensure that risk levels remain within the ALARP (As Low as Reasonably Practicable) threshold. As the existing IMO safety frameworks are tailored to conventional fuels, a revision of the Formal Safety Assessment (FSA) methods may be required to capture the LNG-specific hazards adequately.
Aside from individual hazards, societal risk includes large-scale LNG incidents affecting passengers, crew, port infrastructure, and maritime operations. In contrast to oil spills, LNG-related failures can lead to vapour cloud explosions, loss of structural integrity due to thermal shocks, or the spread of hazardous gases. Acceptance of the risk depends on effective mitigation strategies, including segregated bunkering zones, improved emergency response, and strict regulatory oversight.
As LNG becomes more widespread, risk assessment models must dynamically integrate new accident data and technological advances. The Formal Safety Assessment (FSA) method remains an important tool for quantifying potential loss of life (PLL) and balancing risk acceptability with passenger capacity and operational risk. The PLL calculation is carried out as follows:
where represents the average acceptable Potential Loss of Life, typically determined based on the economic value of the activity and the associated risk to individuals involved. denotes the upper limit of potential fatalities in a single accident, which varies depending on the reference ship category. represents the frequency of accidents resulting in N fatalities. The Potential loss of life for a passenger is further defined as:
where r represents the fatality rate, calculated as the number of deaths from cruise operations divided by the cruise industry’s contribution to Gross National Product (GNP), expressed as r=fatalities/$GNP. EV denotes the industry’s economic value, which, in this context, is represented by a reference cruise ship and is derived from cruise industry revenues. Furthermore, the calculation of societal risk criteria is based on the methodology outlined by (IMO, 2018) [53], incorporating risk acceptance thresholds established in the EMSA report [54]
where F1 represents the frequency of incidents resulting in one or more fatalities, and N denotes the number of individuals on board per ship. The calculated tolerable risk for 2024 is 4.28×10⁻² fatalities per year. According to [40], the upper tolerable limit is determined by multiplying this value by 10, while the lower limit is obtained by dividing it by 10. However, as discussed in the introduction, only the lower boundary can be considered a reliable reference. In contrast, the upper limit is subject to further reduction based on company-specific safety policies. In risk assessment practice, the calculated risk value is generally regarded as an upper boundary that should not be exceeded. Annual statistical variations influence the upper threshold of the ALARP region; a notable shift in fatality frequency trends occurred following the Costa Concordia disaster in 2012, which elevated risk levels in subsequent years, maintaining a higher baseline compared to pre-incident levels.
4.2. Event Tree Analysis for LNG-Fuelled Cruise Ships
The formal safety assessment introduced a systematic approach to address the safety of ships. The event tree analysis (ETA) methodology is taken from an industrial processor and sequentially addresses events that lead to different accident outcomes. The use of ETA is mostly appreciated as the probability of the individual event is calculated from past event data or estimated by experts.
The event tree method is a probabilistic risk assessment tool used to model the progression of incidents starting from a triggering event and complements fault tree analysis (FTA) [39,40,55,56]. An event tree starts with a specific initiating event (e.g., fire or explosion, as shown in Figure 7) and branches out based on binary decisions that define possible escalation paths (e.g., ignition: yes/no). For LNG-powered cruise ships, the main causes of accidents, as for most other ships, can be divided into five general categories: Collision, grounding, contact, fire/explosion, and incidents during bunkering of LNG at the terminal. Of these, the risk of collision was identified as the greatest hazard. Figure 7 shows a part of the actual event tree for a fire/explosion on an LNG-fuelled cruise ship and illustrates the consequence pathways and key contributing factors. The triggering event is a fire or explosion that occurs somewhere on the vessel. The probability of escalation is modelled using historical data and more detailed FTA-based assessments where appropriate. The configuration of the event tree is based on a combination of the event tree from the FSA for cruise ships [40] and the FSA for LNG tankers [56]. The reason is that the LNG cruise ships represent the combination of the exploitation properties of cruisers and the technology and safety features of LNG carriers. Each branch of the event tree quantifies the likelihood of the event progressing, following the standard convention that “yes” branches upwards and “no” branches downwards. The overall probability across all branches must equal 1, with non-applicable branches represented as straight paths being assigned the value 1. In this scenario, the potential impacts range from 0 to 1,660 fatalities, assuming an LNG cruise ship with 8,300 passengers and crew.
The frequency of each impact is calculated as the product of all conditional probabilities along the event tree branches. The worst case leading to 1,660 deaths corresponds to a risk level of 2.25 × 10⁻⁸ deaths per year. The event tree clearly illustrates the paths of risk escalation and shows intervention points where risk reduction measures can influence the results. Similar event tree models have been developed for collision and grounding scenarios and provide a comprehensive probabilistic framework for the risk assessment of LNG-fuelled cruise ships.
The MSC’s FSA [40,56] reports contain risk assessments for passenger ships and LNG tankers. As LNG-fuelled cruise ships are a hybrid of these vessel types, a combination of event trees was developed to model different accident scenarios and their consequences. The expected number of fatalities serves as a key variable for assessing accident severity, with predefined fatality ranges ensuring consistency and comparability of the impact assessment. As set out in MSC 85/INF.2 [40], these ranges were initially defined for a reference vessel of 110,000 GRT and approximately 4,000 persons. The framework comprises ten ranges representing the severity of an accident, from minor incidents to catastrophic events with a high number of fatalities. Fatality estimates have also been calculated for 180.000 GRT, 75.000 GRT, and 40.000 GT ships to improve accuracy and applicability to the modern cruise fleet. These mortality rates apply exclusively to the relevant reference vessels to ensure reliable risk quantification. Each definitive event within the event tree is assigned a fatality estimate based on one of ten predefined ranges derived from probabilistic assessments and developed in collaboration with hazard identification experts (HAZID). The range of fatalities is based on a percentage of all passengers, depending on the severity of the event as follows: 0.05%, 0.13%, 0.5%, 2.5%, 7.5%, 20%, 40%, 60% and 80%. The highest figures are usually not applicable due to the high safety standards in maritime transport and the ability to evacuate passengers and crew in any accident situation. The event tree methodology integrates detailed consequence assessments and provides a robust framework for estimating potential fatalities in different accident scenarios. Figure 8 shows an excerpt from the event tree analysis specifically for collision scenarios and illustrates the probabilistic progression of events and the associated fatality risks.
As the results in the event tree show, the proportion of total passengers affected in the scenarios analysed for LNG-fuelled cruise ships. Levels 3 and above are of particular concern as they represent the leakage of LNG and the potential escalation of incidents. Without effective containment measures, an uncontrolled gas release could spread to high-risk areas where the likelihood of ignition increases significantly. In the proposed event tree model, the fatality percentages for each scenario are qualitatively assessed based on expert judgment from the HAZID group, which consists of the authors and industry experts from shipping companies. These values will be further refined as more operational and casualty data becomes available.
5. Results and Discussion
The societal risk is determined by integrating the probability of death for each event over the specified population Nu, passengers and crew, which represents the number of fatalities caused by a given event based on the calculated individual risk frequencies. The following graphs show the risk curves for the three events analysed: collision, fire and grounding accidents. The F-N curves are calculated by summing up the risks from the event trees for each fatality band. Because of the large magnitude of values, the F-N (Frequency-Number) curves are presented in a log-log scale. All graphs include two different risk criteria limits determining the ALARP region. Dashed lines show the calculated risk limits according to Eq. 4 and statistical data on cruisers for the year 2024. As noted earlier, the risk limit is not just a calculated figure but also influenced by company and national policies. In addition, the EP 112 Risk criteria limits [57] are overlaid to see the difference between the calculated and regulated risk limits. Overall, the risk level for cruise ships falls within the ALARP region. The most significant factor is the influence of collision events, given their high occurrence rate, although their consequences for passengers remain relatively low. We can observe that for the largest ships, the risk of fatalities for collision exceeds the upper limit of EP112 risk criteria. A notable difference between the two risk criteria comes from the fact that the dashed limit lines were calculated and depend on the revenue of the cruise fleet. The higher the revenue, the higher the risk acceptance. Because the cruise industry has a high revenue and keeps a low number of accidents with fatalities, the ALARP region is kept higher. On the other hand, the EP 112 Risk criteria cover different activities and businesses with potentially lower revenue and even non-profitable activities like natural disaster prevention. It comes in line with the average individual risk acceptance, 10-3 fat/year, and negligible individual risk, 10-4 fat/year.
Figure 9, Figure 10 and Figure 11 present three sets of risk curves for most probable accidents: fire, collision, and grounding, compared to the calculated and standard risk criteria boundaries. All four reference ships are plotted on the same graph to observe the influence of the ship size on the risk; the larger the ship, the higher the risk because more passengers could be endangered during the accident. The initial frequency of the accidents is kept the same at the event tree for all ship sizes, mostly because the distribution of accidents among the first three reference ship sizes is almost even. This part could be improved with better statistics for ship accidents. The overall result for risk shows that more attention should be focused on resilience for collision accidents, especially the largest cruise ships. Analyzing the most contributive series of events in the event tree is from the potential damage of the LNG tank in the machinery spaces at sea. The mitigation of this series of events is directly related to navigation, safety and collision avoidance.
Among the three, collision represents the highest risk for accidents involving 100 to 800 passengers for the largest ships and up to 300 for the 100.000 GRT ships. The result is comparable to the cruise ship with classical diesel engines [5]. The LNG installation seems not to have overcome the navigation risks where collisions have the potentially worst outcome. Even comparing the risk of grounding with fire on an LNG cruiser, we can observe a similar level.
The F-N risk curve in Figure 12 illustrates the cumulative societal risk from collision, fire, and grounding incidents for LNG cruise ships. Different coloured solid lines represent the F-N curves for various reference ships, depicting how often accidents with a given number of fatalities occur. The risk curves for LNG cruise ships generally fall within or below the ALARP region, suggesting that while the risks are largely manageable, further monitoring and improvements may be necessary. Higher fatality incidents are rare, as indicated by the sharp decline in frequency towards the right side of the graph, whereas lower-fatality accidents occur more frequently. This suggests that while catastrophic events are uncommon, minor incidents require attention for continued risk mitigation. Overall, the societal risk level for LNG cruise ships remains within acceptable limits, but ongoing safety measures could enhance risk management, particularly for more frequent, lower-impact incidents.
6. Conclusions
Considering that conventional/traditional fuel will be depleted in the future and that IMO emission regulatory requirements will need to be met, LNG is proving to be one of the right choices as an alternative fuel today. LNG has already become a standard and has penetrated many shipping sectors, including cruise ships.
Based on data processed in this article, LNG tankers and LNG cruise ships have proven to be safe. We have conducted two separate analyses on accidents involving LNG tankers and cruise ships. The first is based on cruise ships and LNG tankers over the past 35 years, and the second is between distillate fuel and LNG fuel accidents from 2018 onwards, when the first large LNG cruise ship entered service. LNG as an alternative fuel has proven to be a very good alternative to distillate from a safety perspective.
Among the many accidents on passenger ships in 2018-2024, only a few were related to non-passengers, such as illness/fatality/injury. Therefore, it is important to emphasise that the safety of crew and passengers with the LNG fuel system is high.
LNG vessels have an excellent safety record, but it is standard to prepare for potential incidents and accidents involving any transport. The unusual properties of LNG increase the risk of damage to the vessel should a breakthrough occur, including rapid phase and/or flammable detonation, which can increase the size of the release. Accidents involving an external fire can result in tank failure and a possible BLEVE if the insulation is compromised. While methane, the main component of LNG, poses little toxicological concern, the increased intense thermal radiation from an LNG pool fire poses a greater hazard, but of a shorter duration, than conventional fuel oil fires [58]. While LNG fuel has been widely accepted as a fuel, it is natural to consider its potential dangers when used to fuel cruise ships. Maritime experience shows that with proper operations and systems, the risks associated with the handling and use of LNG can be managed and safety maintained.
Author Contributions
Conceptualization, E.C., P.V., and M.P.; methodology, E.C. and P.V.; software, E.C. and P.V.; validation, M.P.; data curation, E.C. and M.P.; writing—original draft preparation, E.C. and P.V.; writing review and editing, M.P.; visualization, E.C., P.V. and M.P.; supervision, M.P.; project administration, M.P.; funding acquisition, P.V. and M.P. All authors have read and agreed to the published version of the manuscript.
Funding
The publication of the paper is supported by the research group P2-0394 - Modelling and simulation in traffic and maritime engineering, and L7-60164 - A sustainable and digital framework for safety and security in ports, at the Faculty of Maritime Studies and Transport, financed by the Slovenian National Research Agency.
Abbreviations
The following abbreviations are used in this manuscript:
ALARP As Low As Reasonably Practicable
BLG Bulk Liquids and Gases (IMO Sub-committee)
BOG Boil Off Gas
CCC Carriage of Cargoes and Containers (IMO Sub-committee)
CLIA Cruise Line International Association
CO2 Carbon Dioxide
DNV Det Norske Veritas
DWT Deadweight Tonnage
EMSA European Maritime Safety Agency
ESD Emergency Shutdown
fcn collision damage factor
fl longitudinal factor in fcn
ft Transverse (inboard penetration) factor in fcn
fv Vertical factor in fcn
IGF Code International Code of Safety for Ships Using Gases or Other Low-flashpoint Fuels
IMO International Maritime Organization
IOGP International Association of Oil & Gas Producers
ISO International Organization for Standardization
ISPS International Ship and Port Facility Security
LEL Lower Explosion Limit
LFL Lower Flammability Limit
LNG Liquefied Natural Gas
MARVS Maximum Allowable Relief Valve Setting
MSC Maritime Safety Committee (IMO)
NOx Nitrogen Oxides
PRV Pressure Relief Valve
QCDC – Quick Connect Dry Coupling
SGMF – Society for Gas as a marine Fuel
SIGTTO Society of International Gas Tanker and Terminal Operators
SOLAS Safety of Life at Sea (IMO Convention)
SOx Sulphur Oxides
UEL Upper Explosion Limit
References
- S&P Maritime Portal Sea-Web Casualty & Events Database, Available online: https://maritime.ihs.com, accessed 27 December 2024, 7 June 2025, 19 June 2025.
- Eliopoulou E.; Papanikolaou A.; Voulgarellis M. Statistical analysis of ship accidents and review of safety level, Safety Science 2016, 85, 282−292. [CrossRef]
- Eliopoulou, E.; Alissafaki, A.; Papanikolaou, A. Statistical analysis of accidents and review of safety level on passenger ships. Journal of Marine Science and Marine Engineering 2023, 11(2), 410. [Google Scholar] [CrossRef]
- European Maritime Safety Agency (EMSA) (2024), Annual overview of marine casualties and incidents 2024, Available online: Publications - Annual Overview of Marine Casualties and Incidents 2024 - EMSA - European Maritime Safety Agency.
- Vidmar P.; Perkovic M. Methodological approach for safety assessment of cruise ship in port, Safety Science, 2015, 80, 189–200. [CrossRef]
- Perkovic, M.; Gucma, L.; Przywarty, M.; Gucma, M.; Petelin, S.; Vidmar, P. Nautical Risk Assessment for LNG Operations at the Port of Koper. Journal of Mechanical Engineering 2012, 58, 607–613. [Google Scholar] [CrossRef]
- TGE Gas Engineering GmbH, Podruznica Ljubljana. Sprejemni terminal utekočinjenega zemeljskega plina in plinsko-parna elektrarna, November 2007, Available online: http://frinko.mk/documents/doc_download/731-proekt-za-izgradba-plinska-centala-zastruja-tge-broura-final-.html.
- Aneziris, O.; Koromila, I.; Nivolianitou, Z. A systematic literature review on LNG safety at ports. Safety Science 2020, 124, 104595. [Google Scholar] [CrossRef]
- Iannaccone T.; Landucci G.; Scarponi E. G.; Bonvicini S.; Cozzani V. Inherent safety assessment of alternative technologies for LNG ships bunkering, Ocean Engineering 2019, 185, 100–114. [CrossRef]
- Ahola, M.; Murto, P.; Kujala, P.; Pitkänen, J. Perceiving safety in passenger ships – User studies in an authentic environment. Safety Science 2014, 70, 222–232. [Google Scholar] [CrossRef]
- Vanem E.; Antao P.; Østvik I.; Del Castillo de Comas F. Analyzing the risk of LNG carrier operations, Reliability Engineering and System Safety 2008, 9, 1328–1344. [CrossRef]
- Society of International Gas Tanker and Terminal Operators (SIGTTO) (2019), SIGTTO at 40 Years 1979–2019, A Commemorative SIGTTO Anniversary Publication 2019. Available online: https://www.sigtto.org/media/2903/sigtto-at-40-years.pdf.
- SEA-LNG, Available online: Safety - SEA-LNG.
- SHELL LNG Outlook 2024, Available online: LNG Outlook 2024 | Shell Global.
- Rundmo, T. Safety climate, attitudes and risk perception in Norsk Hydro. Safety Science 2000, 34, 47–59. [Google Scholar] [CrossRef]
- Siu O., L.; Phillips D., R.; Leung, T.-W. Safety climate and safety performance among construction workers in Hong Kong: the role of psychological strains as mediators. Accident Analysis & Prevention 2004, 36, 359–366. [Google Scholar] [CrossRef]
- Brave S.; Nass C. Emotion in human computer interaction. In: Jacko, J., Sears, A. (Eds.), Handbook of Human– Computer Interaction. Lawrence Erlbaum Associates, 2002, Mahwah, NJ, 251–271.
- Flin, R.; Mearns, K.; O’Connor, P.; Bryden, R. Measuring safety climate: identifying the common features. Safety Science 2000, 34, 177–192. [Google Scholar] [CrossRef]
- Davies P. A.; Fort E. LNG as a marine fuel: Likelihood of LNG releases, Journal of Marine Engineering & Technology 2013, 12:3, 3−10. [CrossRef]
- International Association of Oil & Gas Producers (IOGP). (2019). Risk assessment data directory - Process release frequencies, Report 434-01. Available online: https://www.iogp.org/bookstore/product/risk-assessment-data-directory-process-release-frequencies.
- Society for Gas as a Marine Fuel (SGMF), Formal Safety Notice, No.: FSN 22-02, date 04.07.2022 – Recommended actions to prevent LNG leakages from DD-CC hose bunkering/transfer system connections.
- Fu S.; Yan X.; Zhang D.; Li C.; Zio E. Framework for the quantitative assessment of the risk of leakage from LNG - fueled vessels by an event tree-CFD, Journal of Loss Prevention in the Process Industries 2016, 43, 42–52. [CrossRef]
- Kumar, S.; Kwon H., T.; Choi K., H.; Lim, W.; Cho, J.H.; Tak, K.; Moon, I. LNG: an eco-friendly cryogenic fuel for sustainable development. Applied Energy 2011, 88, 4264–4273. [Google Scholar] [CrossRef]
- Davies P.A.: Greener fuels may not make shipping safer – here’s why. The Conversation Academic rigor, journalistic flair. Published: May 17, 2018, 8:44am EDT.
- Lee S.; Seo S.; Chang D. Fire risk comparison of fuel gas supply systems for LNG fuelled ships, Journal of Natural Gas Science and Engineering 2015, 27, 1788-1795. [CrossRef]
- Li J.; Huang Z. Fire and explosion risk analysis and evaluation for LNG ships, International Symposium on Safety Science and Technology, Procedia Engineering 2012, 45, 70-76. [CrossRef]
- Lois P.; Wang J.; Wall A.; Ruxton T. Formal safety assessment of cruise ships, Tourism Management 2004, 25, 93–109. [CrossRef]
- Fowler T. G.; Sorgard E. Modeling ship transportation risk, Risk Analysis 2000. [CrossRef]
- Ronza A.; Felez S.; Darbra R.; Carol S.; Vilchez J.A.; Casal J. Predicting the frequency of accidents in port areas by developing event trees from historical analysis, Journal of Loss Prevention in the Process Industries 2003, 16, 551-560. [CrossRef]
- Vanem E.; Antão P.; Del Castillo de Comas F.; Skjong R. Formal Safety Assessment of LNG Tankers, 10th International Symposium on Practical Design of Ships and Other Floating Structures Houston, Texas, United States of America, 2007, American Bureau of Shipping, Available online: Formal_Safety_Assessment_of_LNG_tankers20210928-9258-1kl9tn3.pdf.
- Aneziris, O.; Papazoglou, I.A.; Konstantinidou, M.; Nivolianitou, Z. Integrated risk assessment for LNG terminals. J. Loss Prev. Process Ind. 2014, 28, 23–35. [Google Scholar] [CrossRef]
- Vidmar P.; Perkovic M.; Brcko T. Safety assessment for a cruise ship terminal, Scientific Journals Maritime University of Szczecin, 2013, 36 (108) z. 1 pp. 168–176 Available online: Safety assessment for a cruise ship terminal, Scientific... - Google Scholar.
- Woodward J.L.; Pitblado R.M. LNG Risk Based Safety: Modelling and Consequence Analysis, John Wiley & Sons, Inc. 2010; pp. 20-37 and 50-74. [CrossRef]
- Department of Energy; Final Environmental Impact Statement for the Port Delfin LNG Project Deepwater Port Application Appendix R - Major LNG Incidents, November 2016, Available online: Volume II of Final Environmental Impact Statement for the Port Delfin LNG Project Deepwater Port Application.
- Cruise Market Watch. Available online: Growth | Cruise Market Watch (accessed on 02.01.2025).
- CLIA - Cruise Lines International Association; State of the Cruise Industry Report, May 2024, Available online: 2024 State of the Cruise Industry Report | CLIA UK.
- U.S. Coast Guard. Cruise ship semi-annual newsletter of the USCG cruise ship national center of expertise (CSNCOE), Summer 2018, Issue 19, Available online: Microsoft Word - Issue #19 Summer 2018 Edition.
- Wikipedia, Available online: List of maritime disasters in the 21st century - Wikipedia, MS Empress of Australia - Wikipedia, Carnival Sunrise - Wikipedia, Pacific Encounter - Wikipedia.
- International Maritime Organization (IMO) (2008), Maritime Safety Committee 85th session MSC85/17/1 Formal Safety Assessment FSA – Cruise ships, (Submitted by Denmark), Available online: 17-1.doc.
- International Maritime Organization (IMO) (2008), Maritime Safety Committee 85th session MSC85/INF.2 Formal Safety Assessment FSA – Cruise ships, Details of the Formal Safety Assessment (Submitted by Denmark), Available online: http://martrans.org/documents/2011/fsa/MSC_85-INF-2.pdf.
- Society for Gas as a Marine Fuel (SGMF), LNG as a marine fuel - an introduction, FP-00-01-07 - Version 5.0, May 2023. Available online: Shop - SGMF.
- Chamberlain G.A.; Management of large LNG hazards, 23rd World Gas Conference, Amsterdam 2006, Available online:https://citeseerx.ist.psu.edu/document?repid=rep1&type=pdf&doi=3f560a5006c597a9b8bc5abb0108070063d932bf.
- Vanderbroek L.; Berghmans J. Safety aspects of the use of LNG for marine propulsion, International Symposium on Safety Science and Technology, Procedia Engineering 2012, 45, 21 – 26. [CrossRef]
- Wang S.; Notteboom T. The Adoption of Liquefied Natural Gas (LNG) as a Ship Fuel: A Systematic Review of Perspectives and Challenges, 2014. [CrossRef]
- International association of ports and harbors (IAPH). IAPH Clean Marine Fuels WG | IAPH.
- International Organization for Standardization (ISO). ISO 20519:2021 Ship and marine technology-Specification for bunkering of liquefied natural gas fuelled vessels. Available online: ISO - New ISO standard for the safe bunkering of LNG-fuelled ships.
- International Electrotechnical Commission (IEC) (2024). International Standard IEC 60079-14, Edition 6.0, Available online: IEC 60079-14:2024 | IEC.
- The North of England P&I Association Limited. LNG as a marine fuel, 2019 Available online: All Publications: A full list of all North’s wide ranging publications.
- SEA-LNG, A view from the bridge 2023 - 2024 LNG – Leading Maritime Decarbonization, Available online: 24-01-28_FINAL_A_View_From_The_Bridge_2024.pdf.
- International Maritime Organization (IMO), Future Fuels and Technology Project, Available online: http://futurefuels.imo.org.
- DNV Alternative Fuels Insight (AFI), Available online: Alternative Fuels Insight (AFI) for the shipping industry.
- International Maritime Organization (IMO) (2024), Marine Environment Protection Committee 82nd session MEPC 82/6/38 ENERGY EFFICIENCY OF SHIPS “Report of fuel oil consumption data submitted to the IMO Ship Fuel Oil Consumption Database in GISIS (Reporting year: 2023)” (Note by the Secretariat).
- International Maritime Organization (IMO) (2018). MSC-MEPC.2/Circ.12/Rev.2 Revised Guidelines for Formal Safety assessment (FSA) for use in the IMO rule-making process. Available online: Formal Safety Assessment.
- Spouge, J. Risk Acceptance Criteria and Risk Based Damage Stability. Final Report, part 1: Risk Acceptance Criteria. 2015-02-24, European Maritime Safety Agency (EMSA).
- International Maritime Organization (IMO) (2007), Maritime Safety Committee 83rd session MSC83/21/1 Formal Safety Assessment FSA – Liquefied Natural Gas (LNG) Carriers, (Submitted by Denmark), Available online: Microsoft Word - 21-1.doc.
- International Maritime Organization (IMO) (2007), Maritime Safety Committee 83rd session MSC83/INF.3 Formal Safety Assessment FSA – Liquefied Natural Gas (LNG) Carriers, Details of the Formal Safety Assessment (Submitted by Denmark), Available online: Microsoft Word - INF-3.doc.
- Duijm N.J.; Acceptance criteria in Denmark and the EU, Danish Ministry of the Environment 2009. Available online: https://www2.mst.dk/udgiv/publications/2009/978-87-7052-920-4/pdf/978-87-7052-921-1.pdf).
- Lehr, W.J.; Simecek-Beatty D. Comparative threat from LNG and fuel oil maritime accidents, International Oil Spill Conference Proceedings 2017, 01, 3151-3162. [CrossRef]
Figure 1.
Cruise fleet exposure and reported accidents from 1989 to 2024.
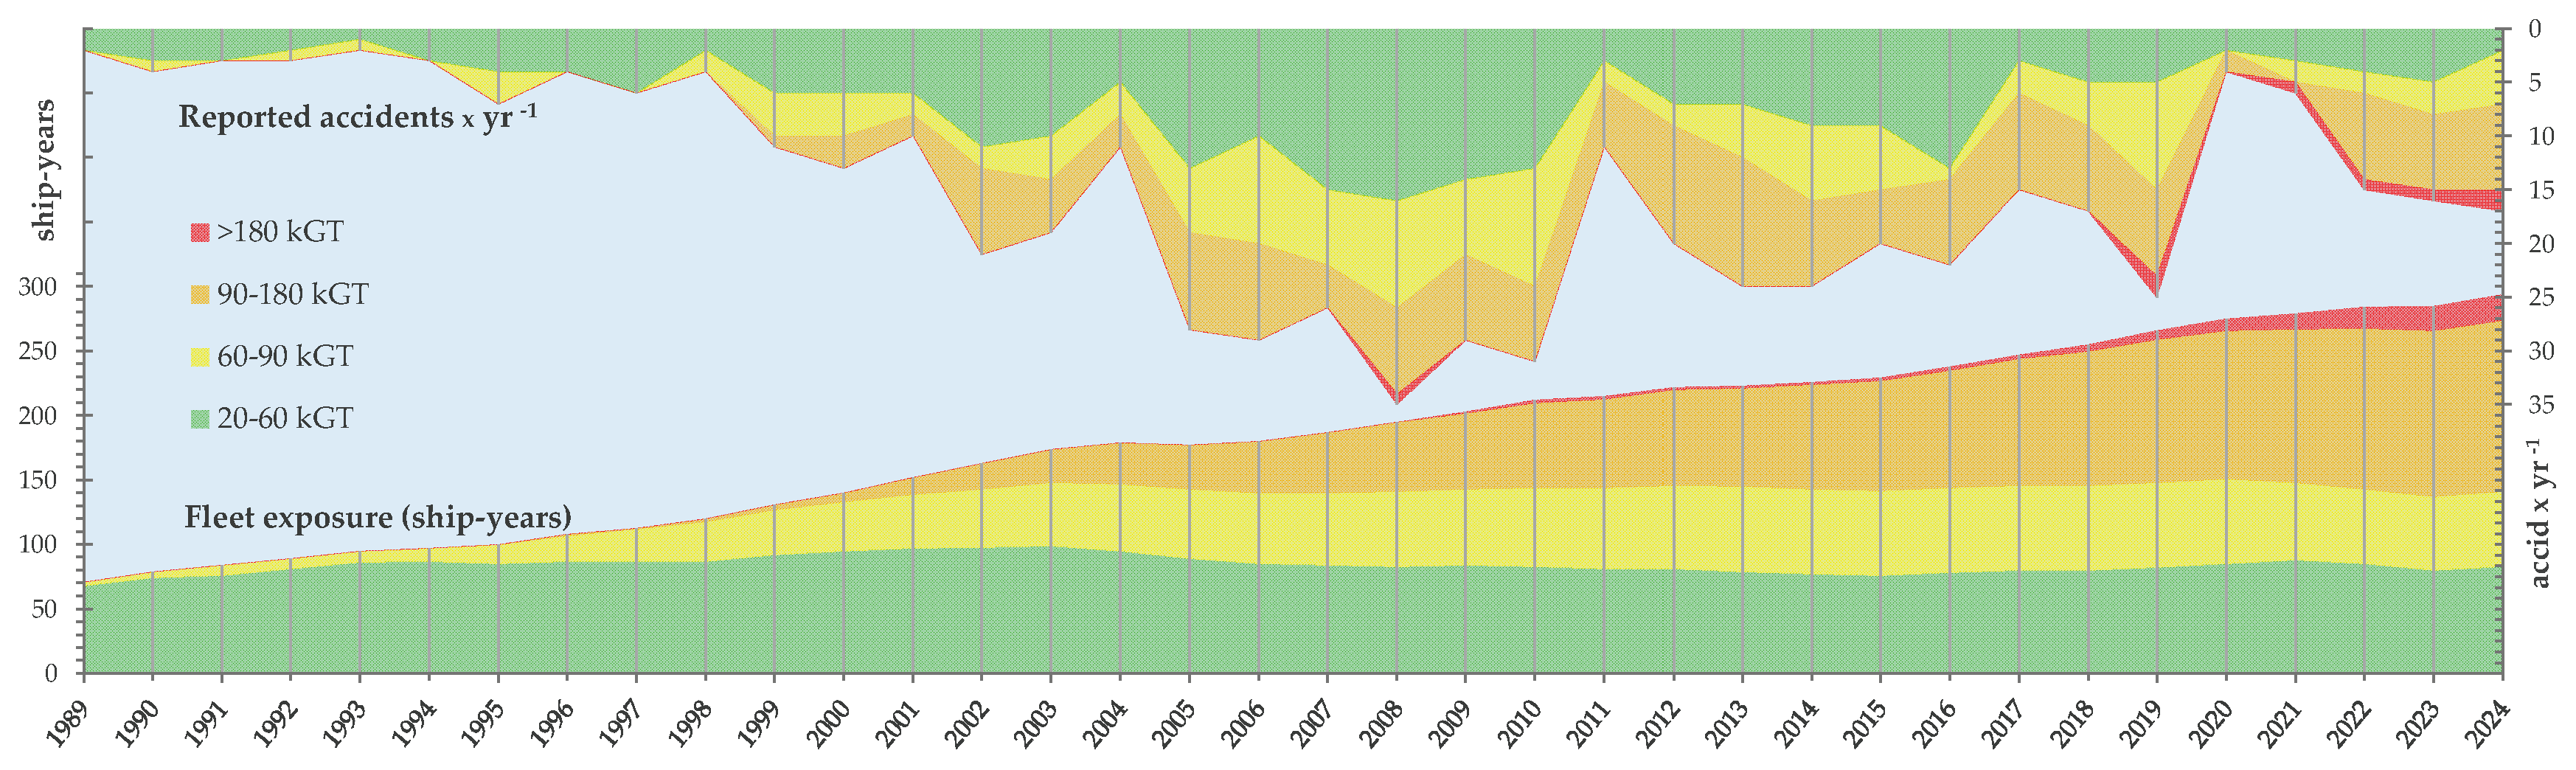
Figure 2.
Historic accident frequency, isolated year-by-year plot (per ship-year).
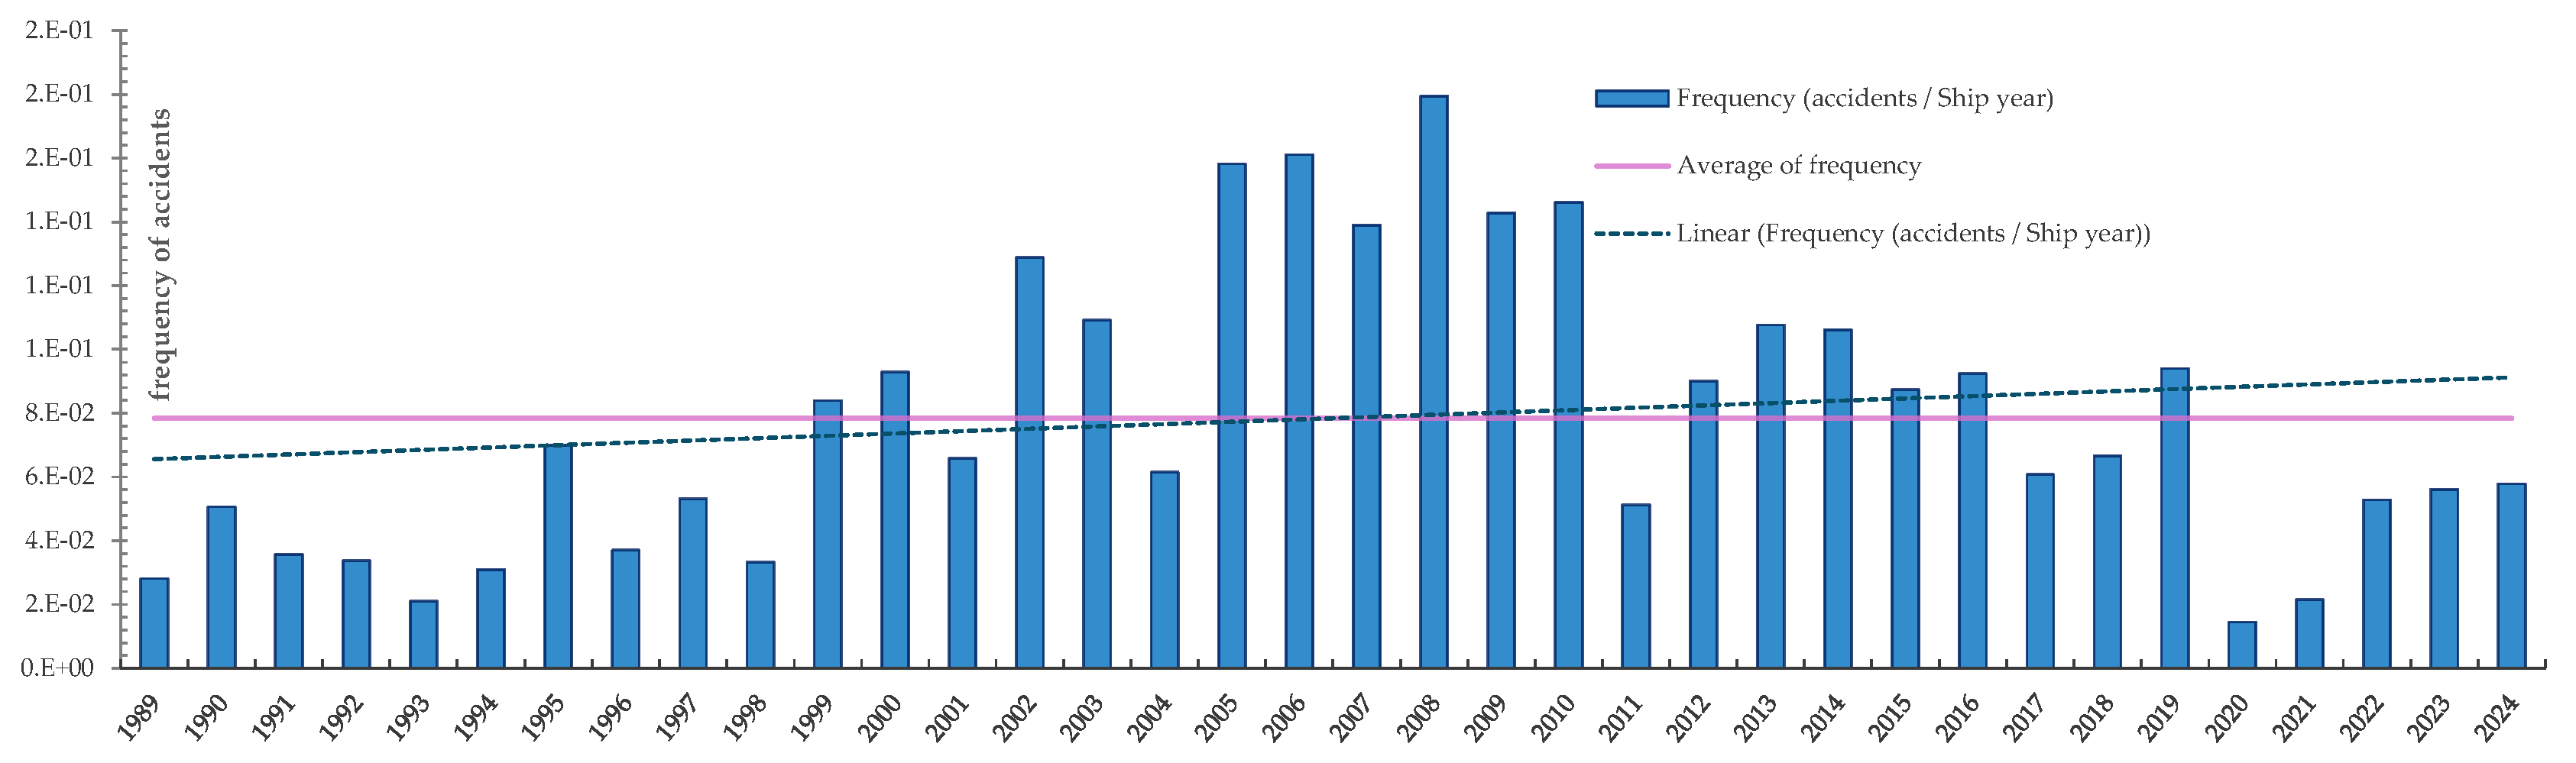
Figure 3.
LNG fleet exposure and reported accidents from 1989 to 2024.
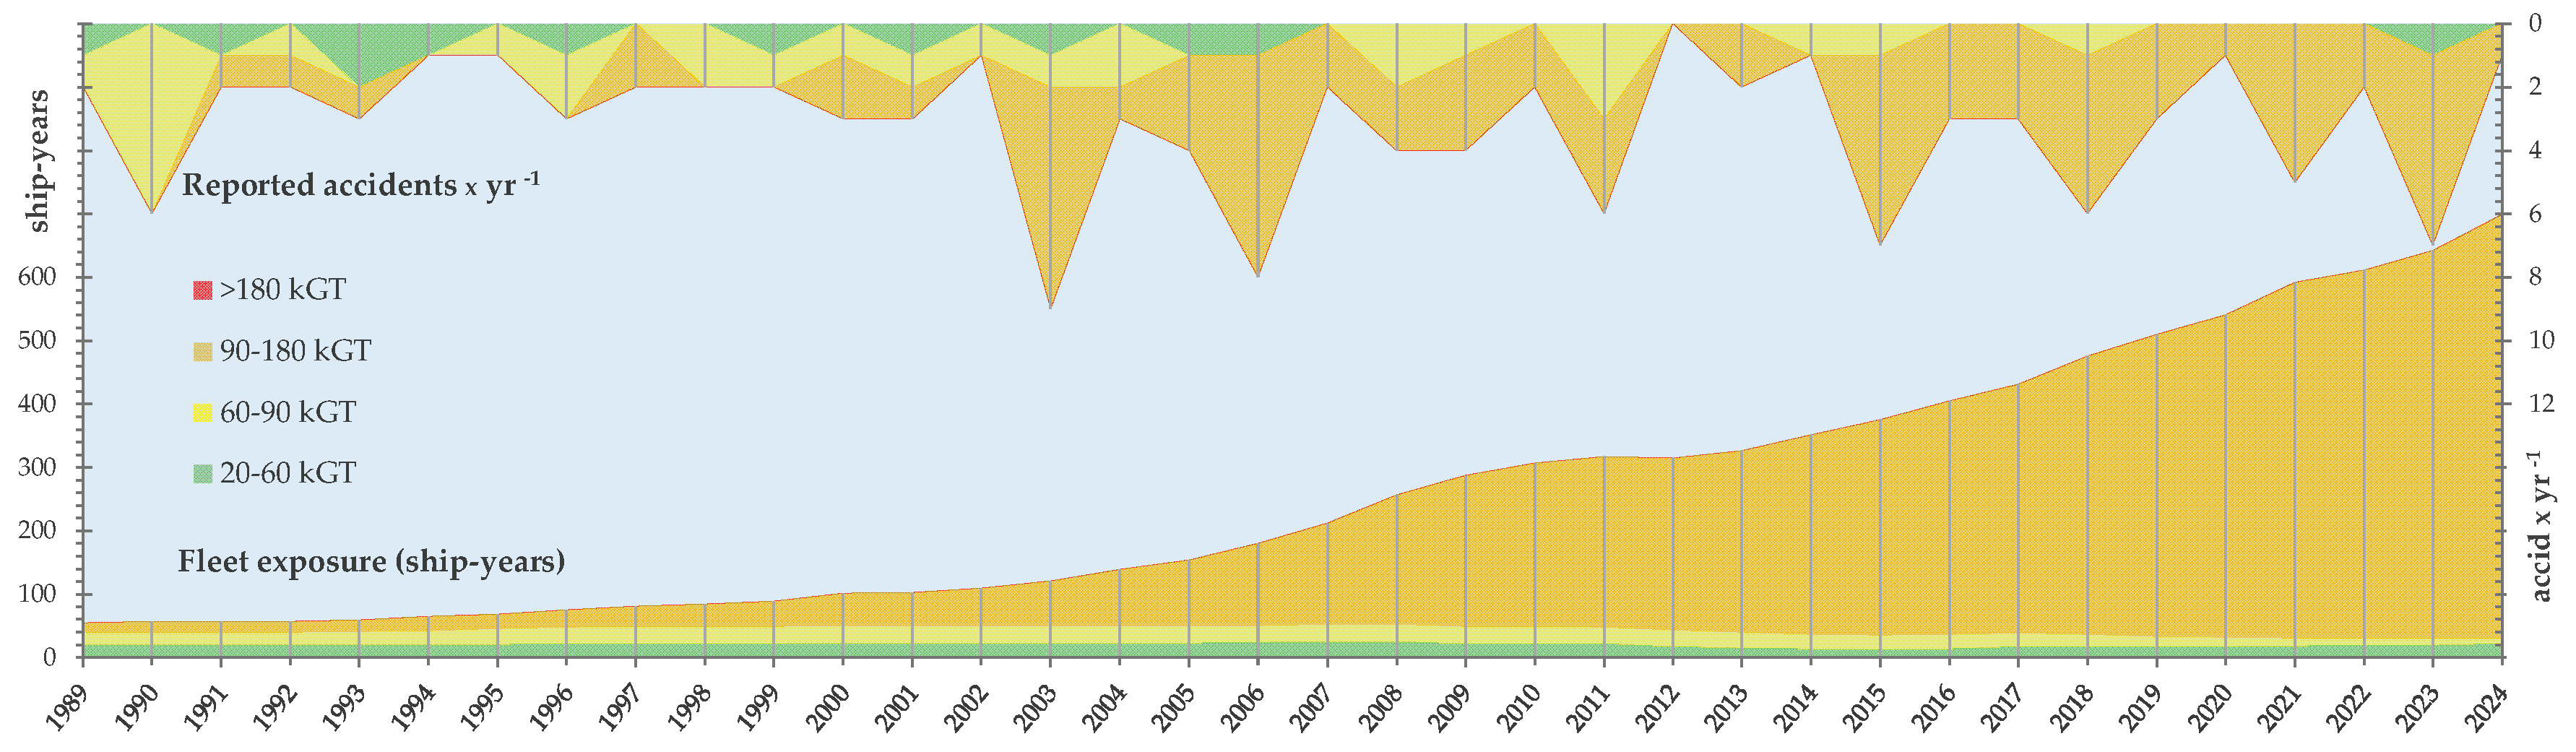
Figure 4.
Historic accident frequency, isolated year-by-year plot (per ship-year).
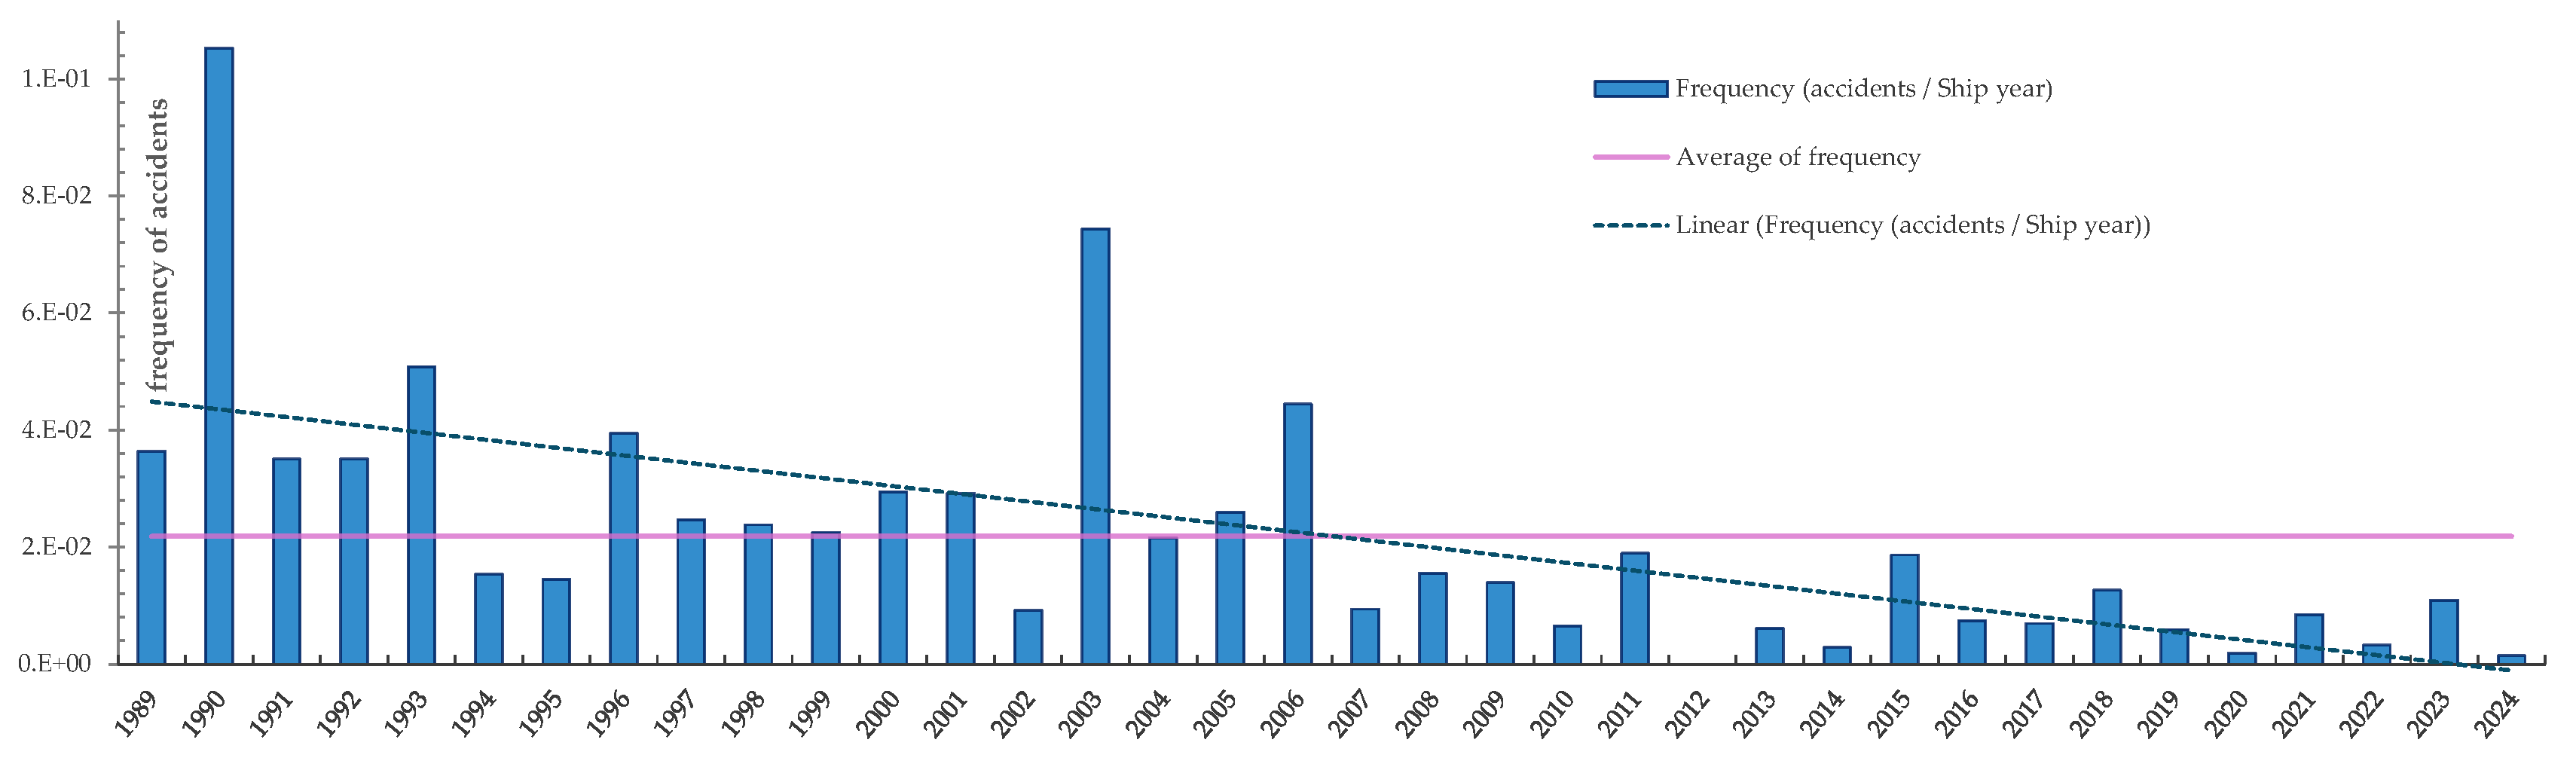
Figure 5.
No. of cruise ship accidents 2018 -2024 grouped by fuel type and seriousness.
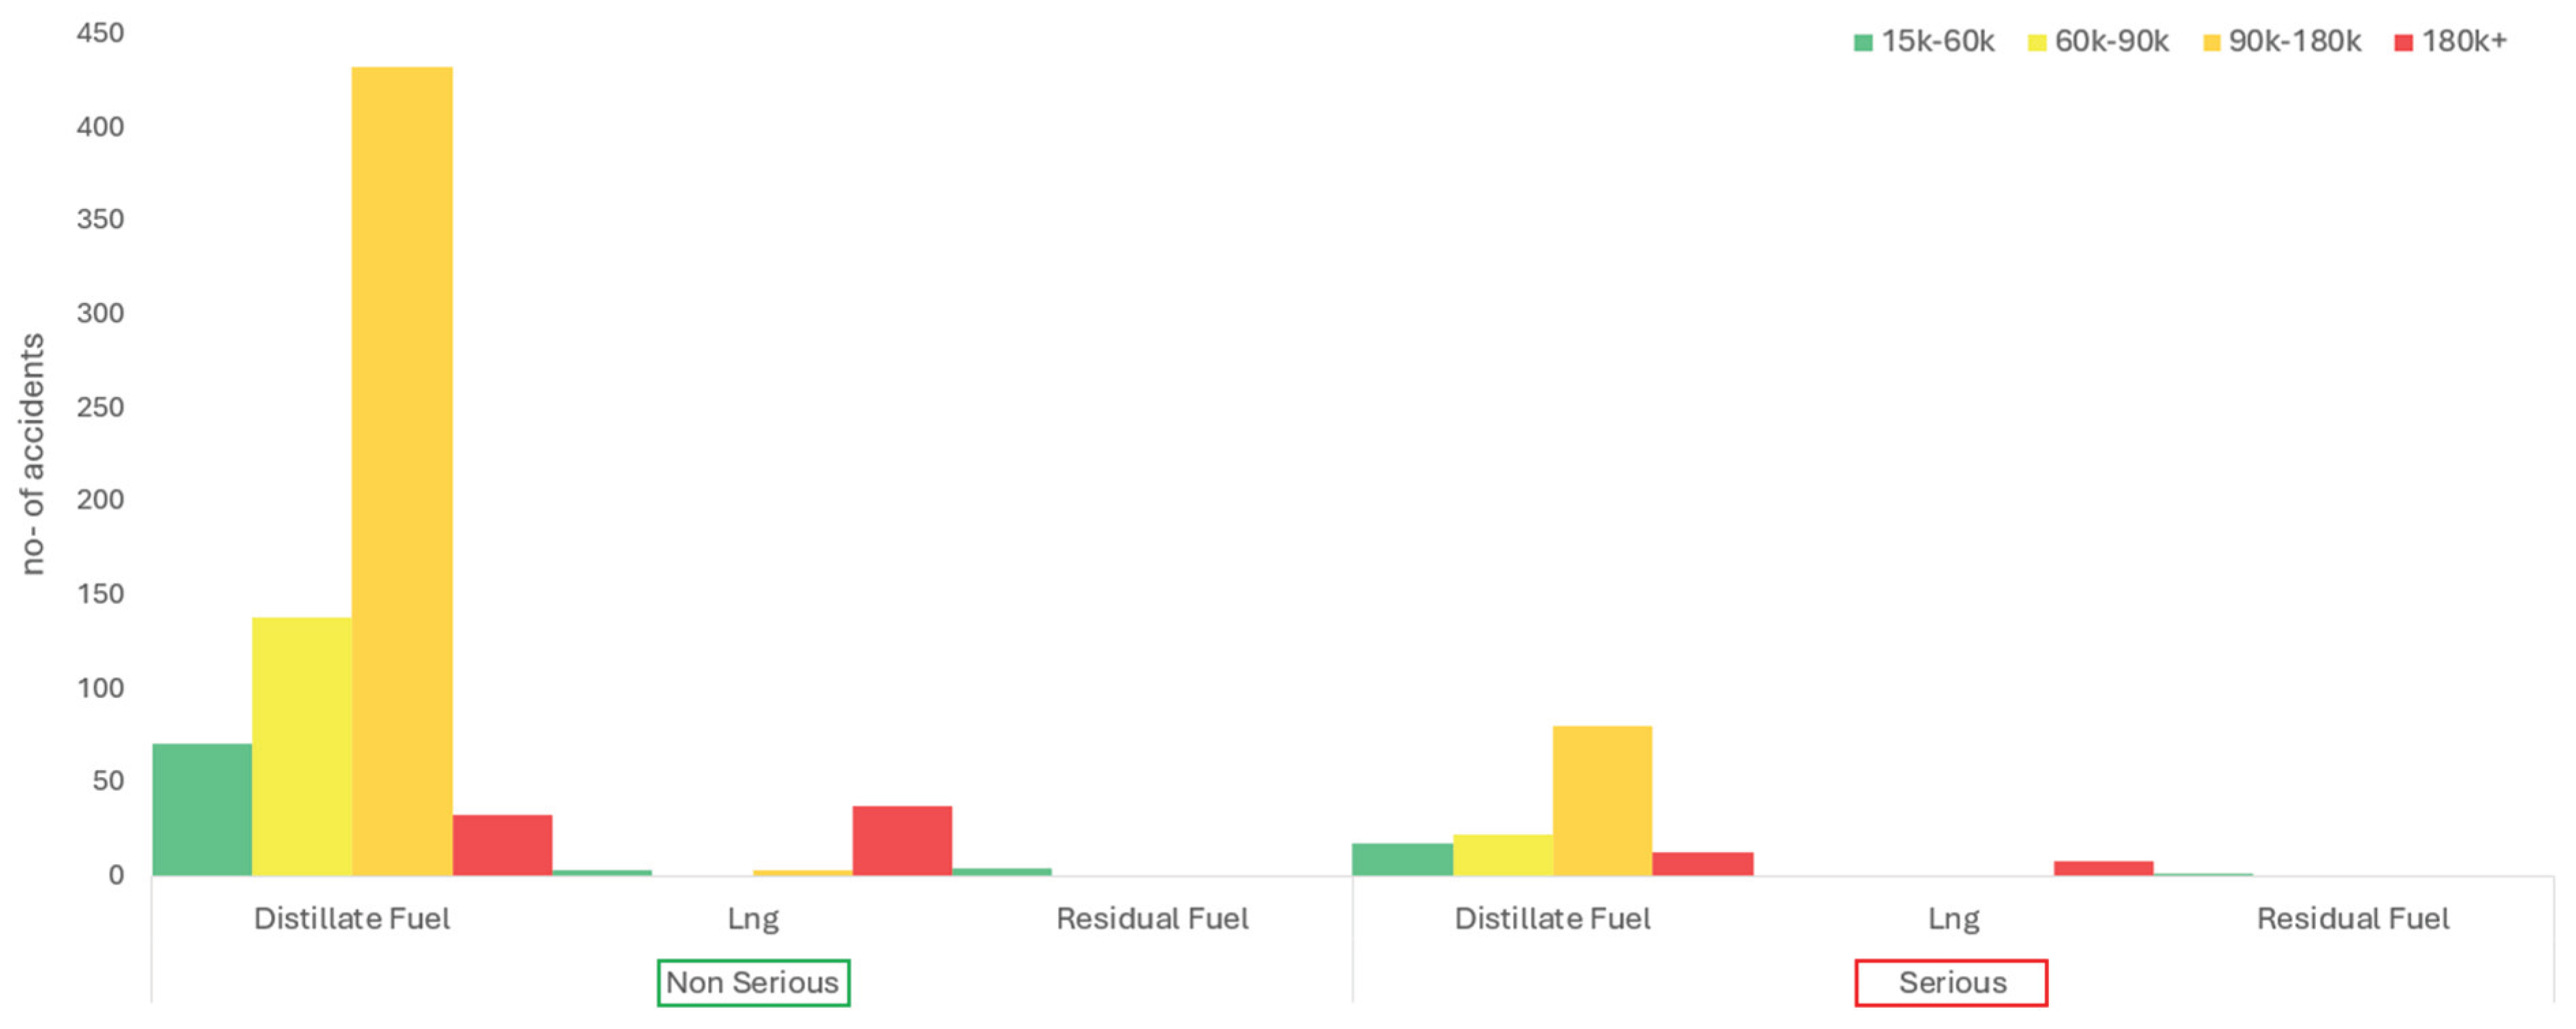
Figure 6.
Accidents by type and type of fuel for cruise ships 2018-2024.

Figure 7.
LNG cruise ship event tree for fire/explosion (top part).
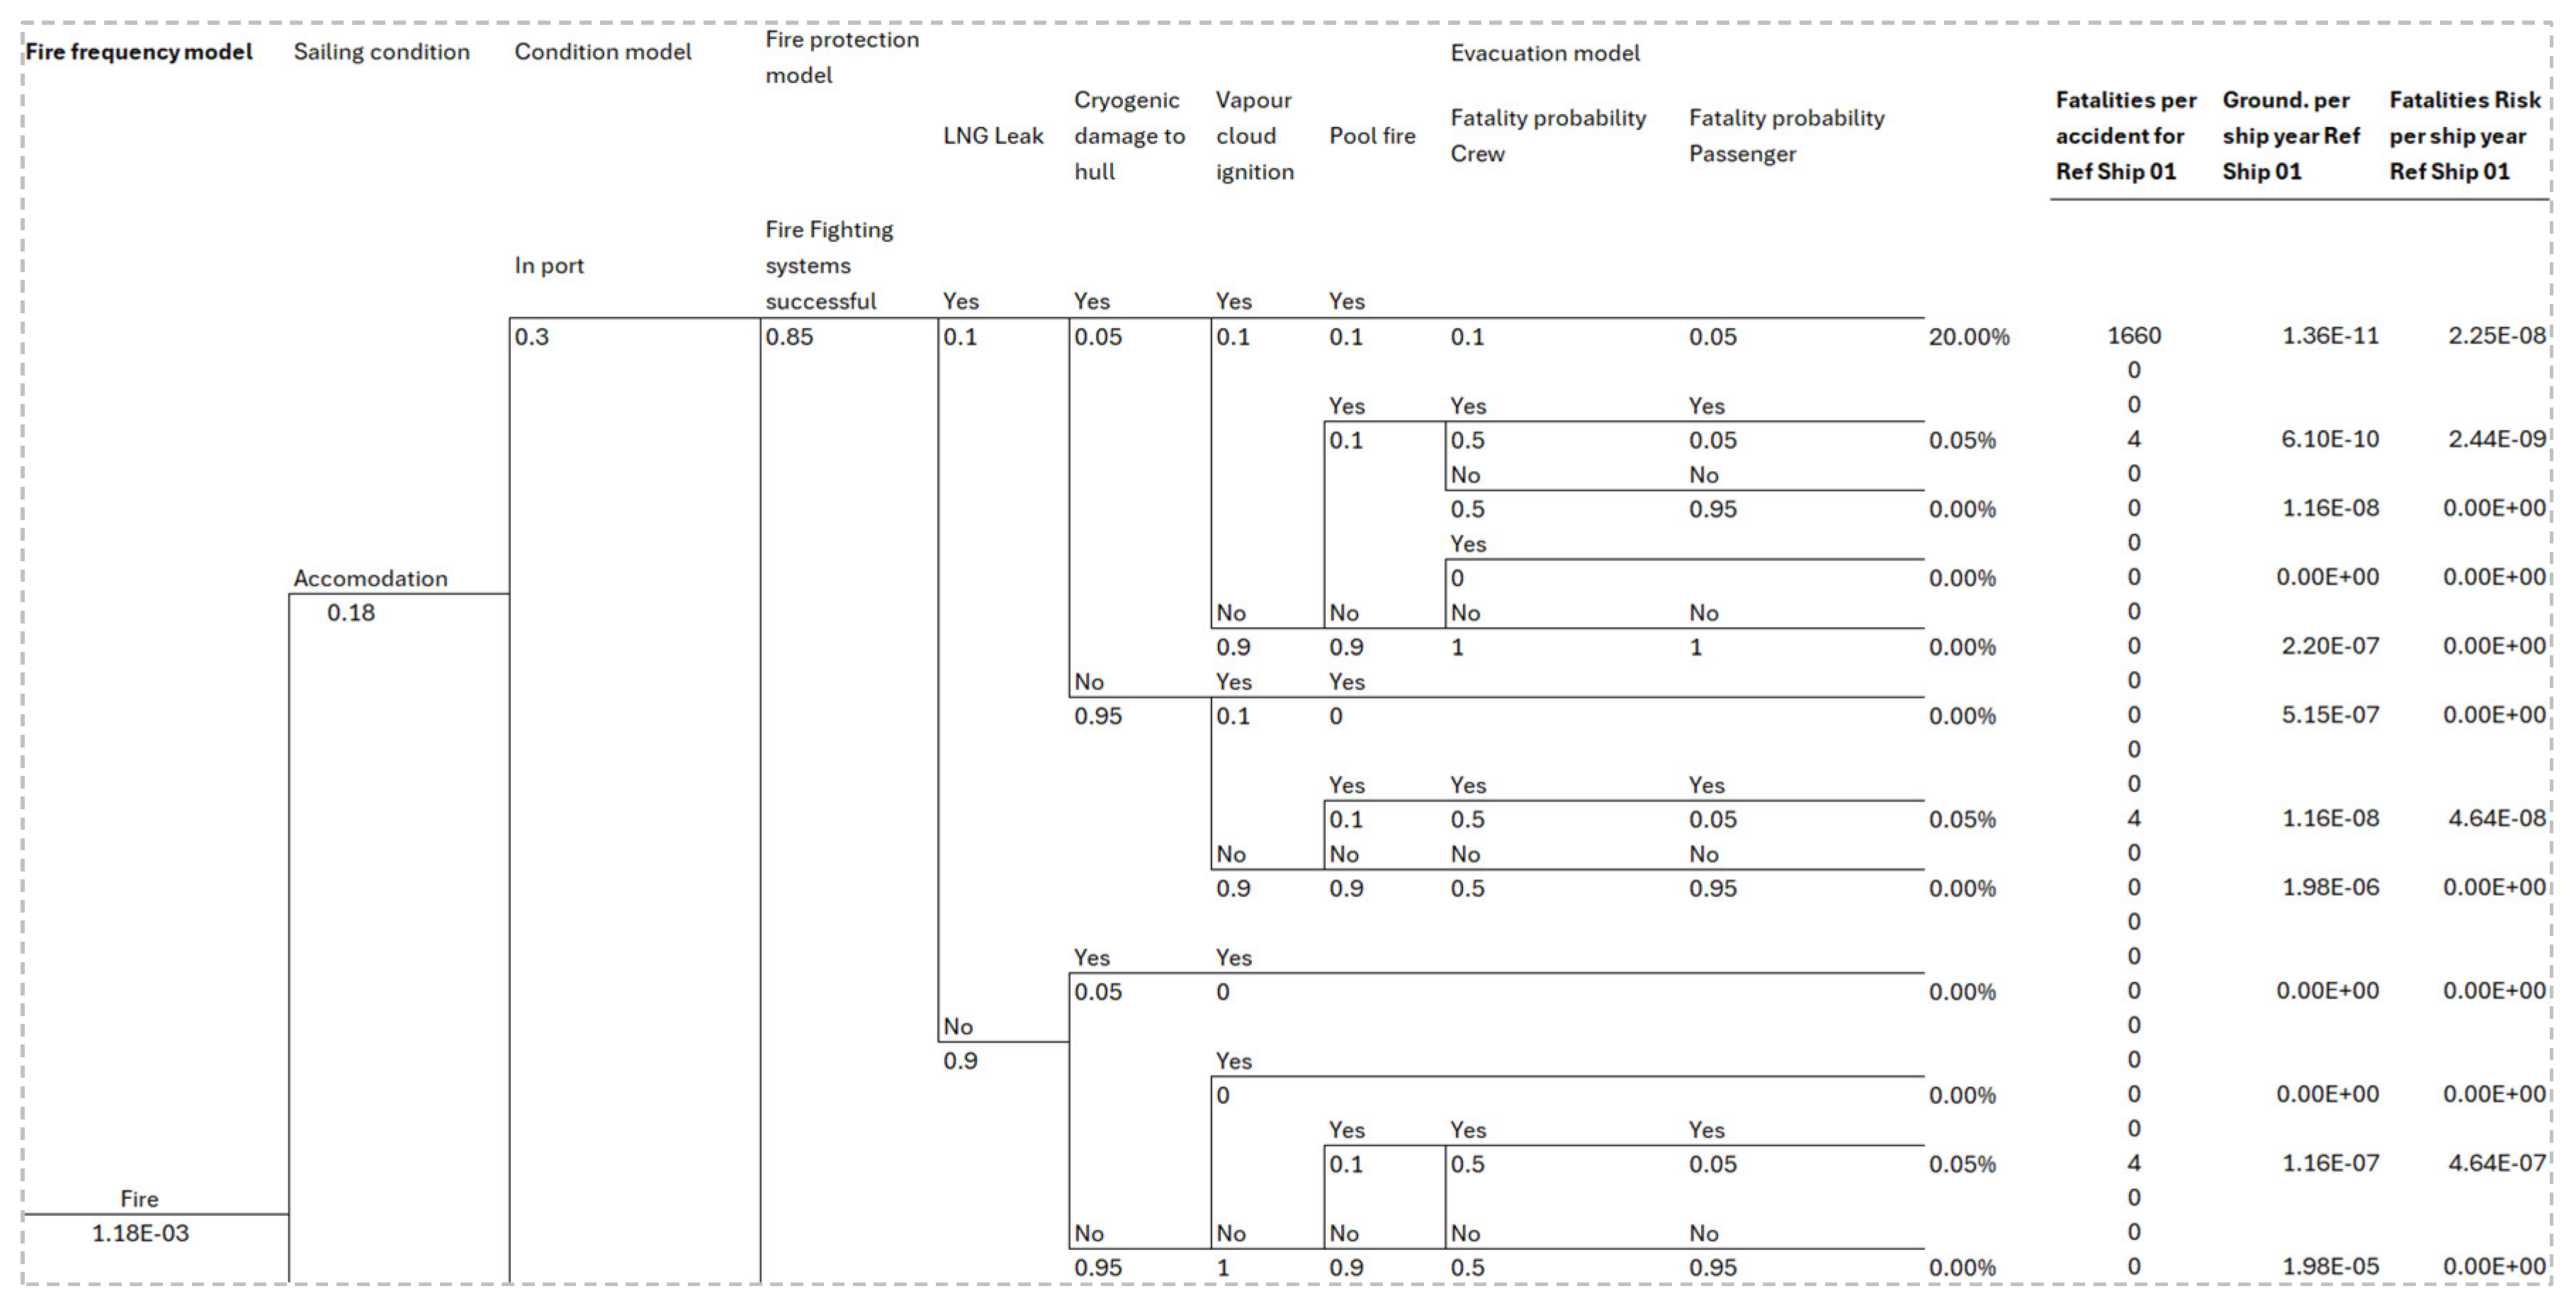
Figure 8.
LNG cruise ship event tree for collision event (top part).

Figure 9.
Societal Risk, LNG cruise ship F-N curve for Fire and Explosion.
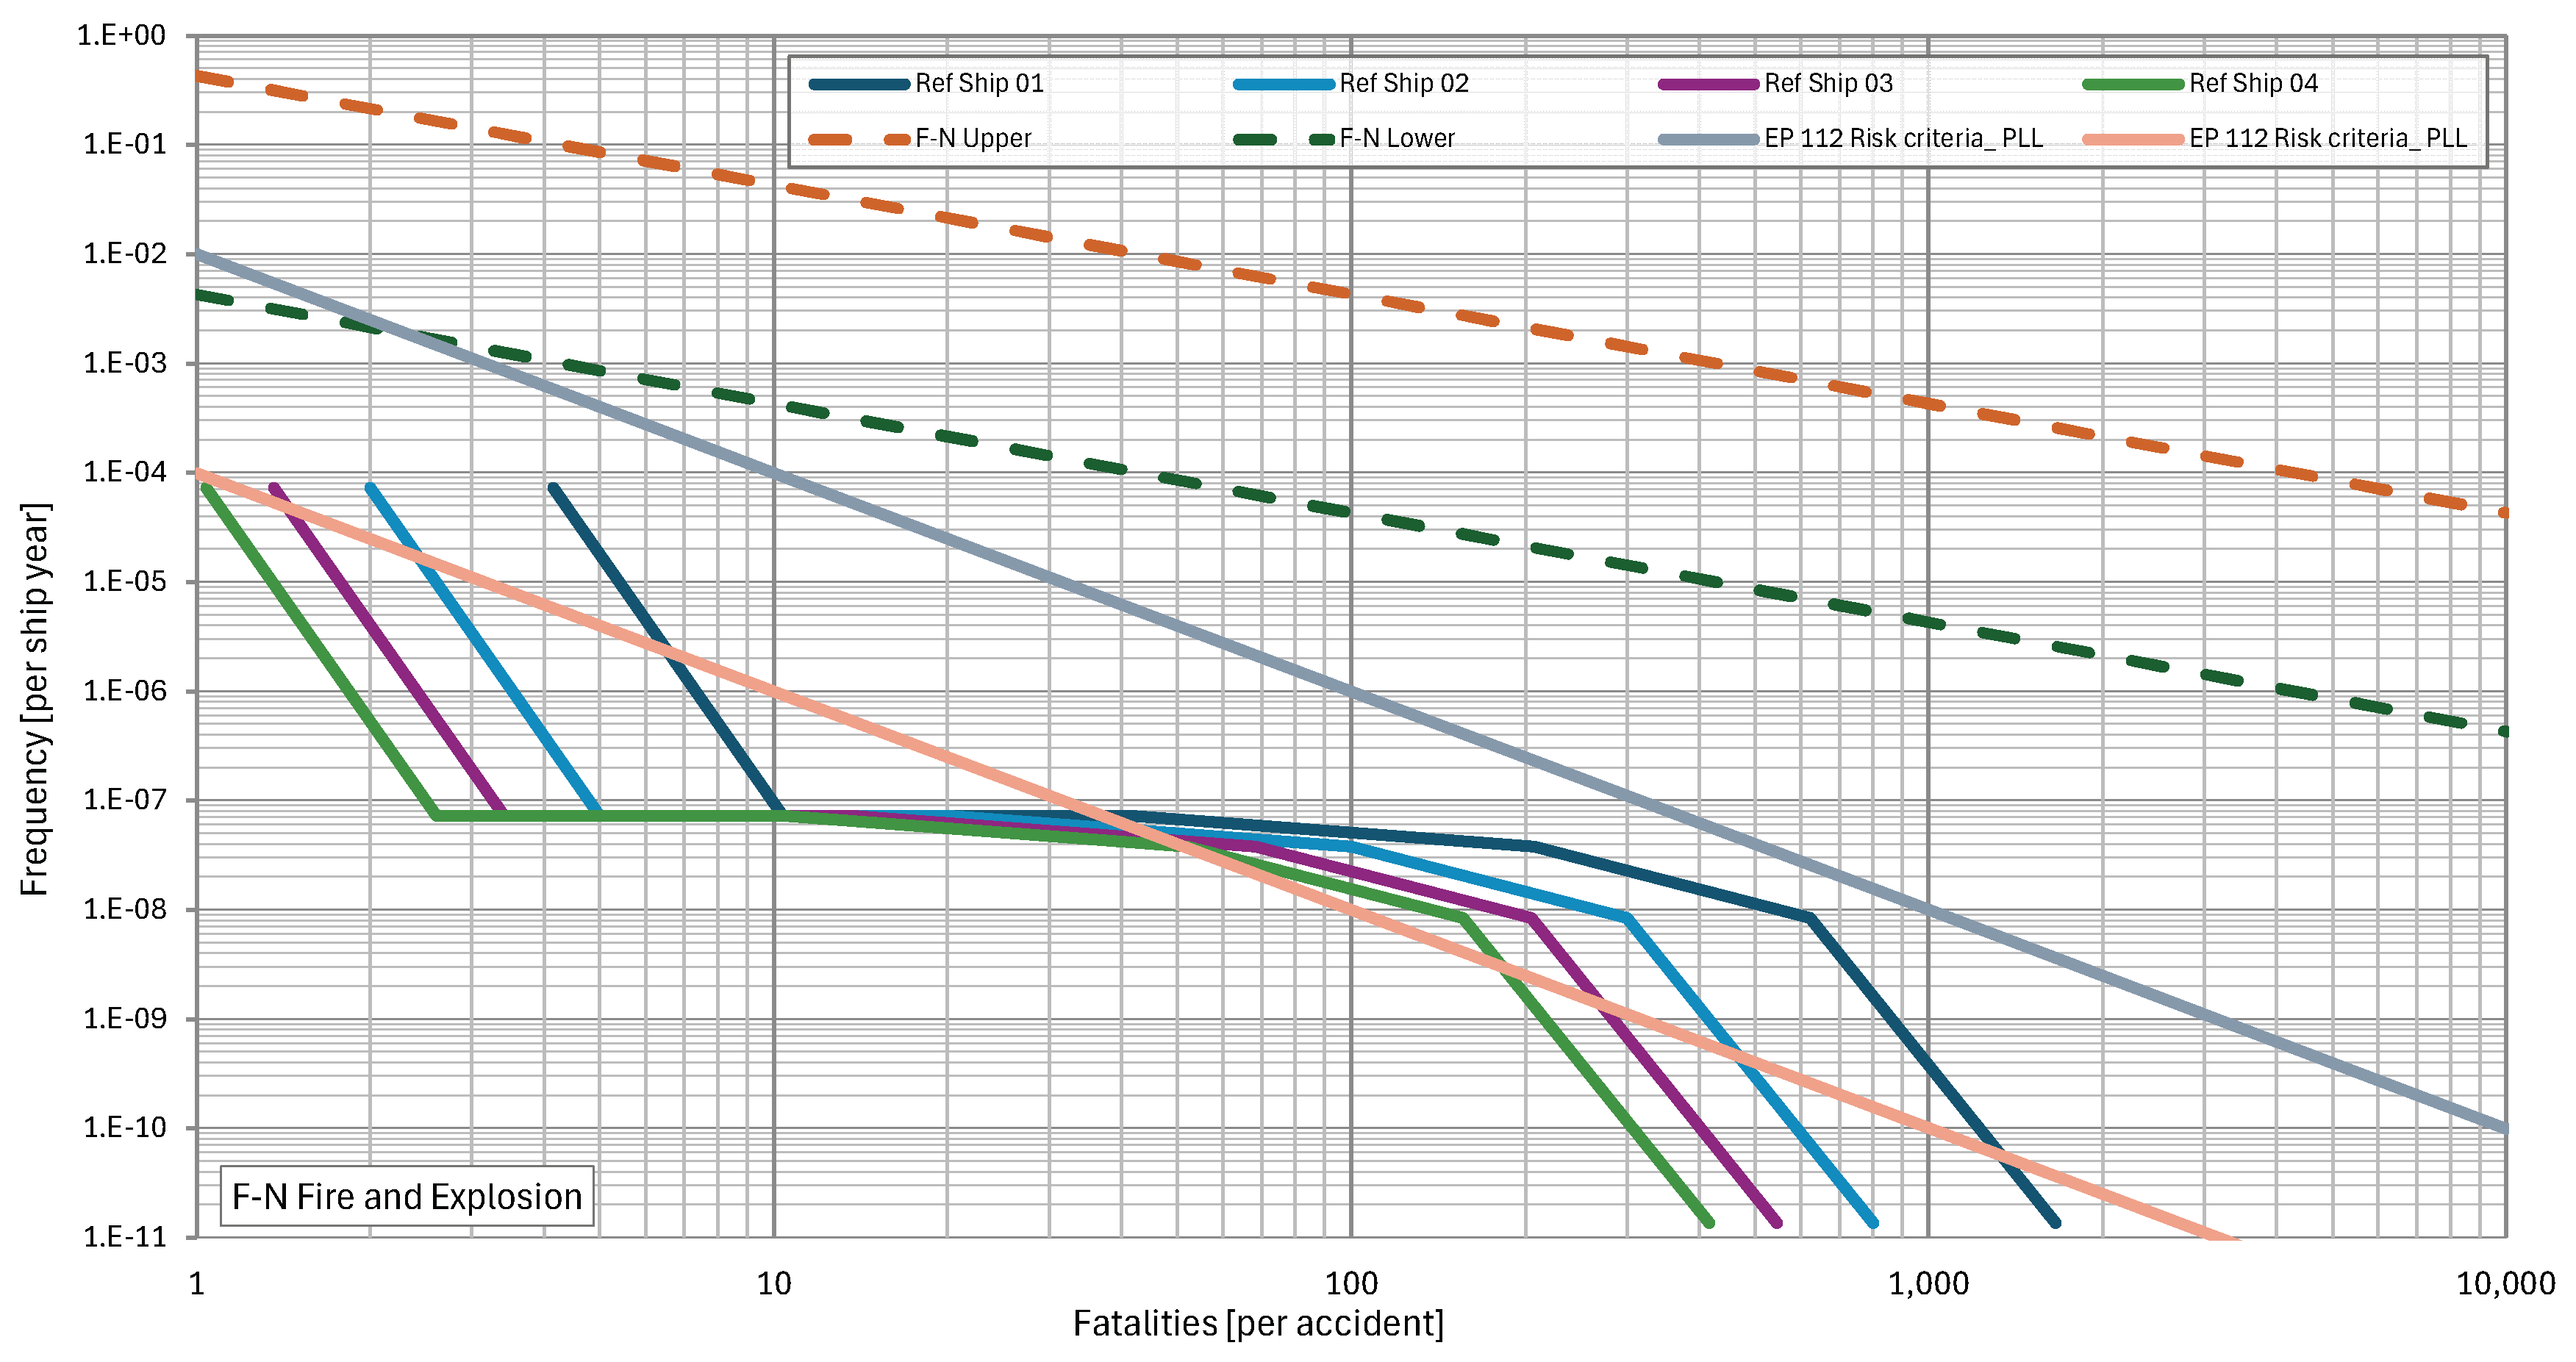
Figure 10.
Societal Risk, LNG cruise ship F-N curve for Collision.
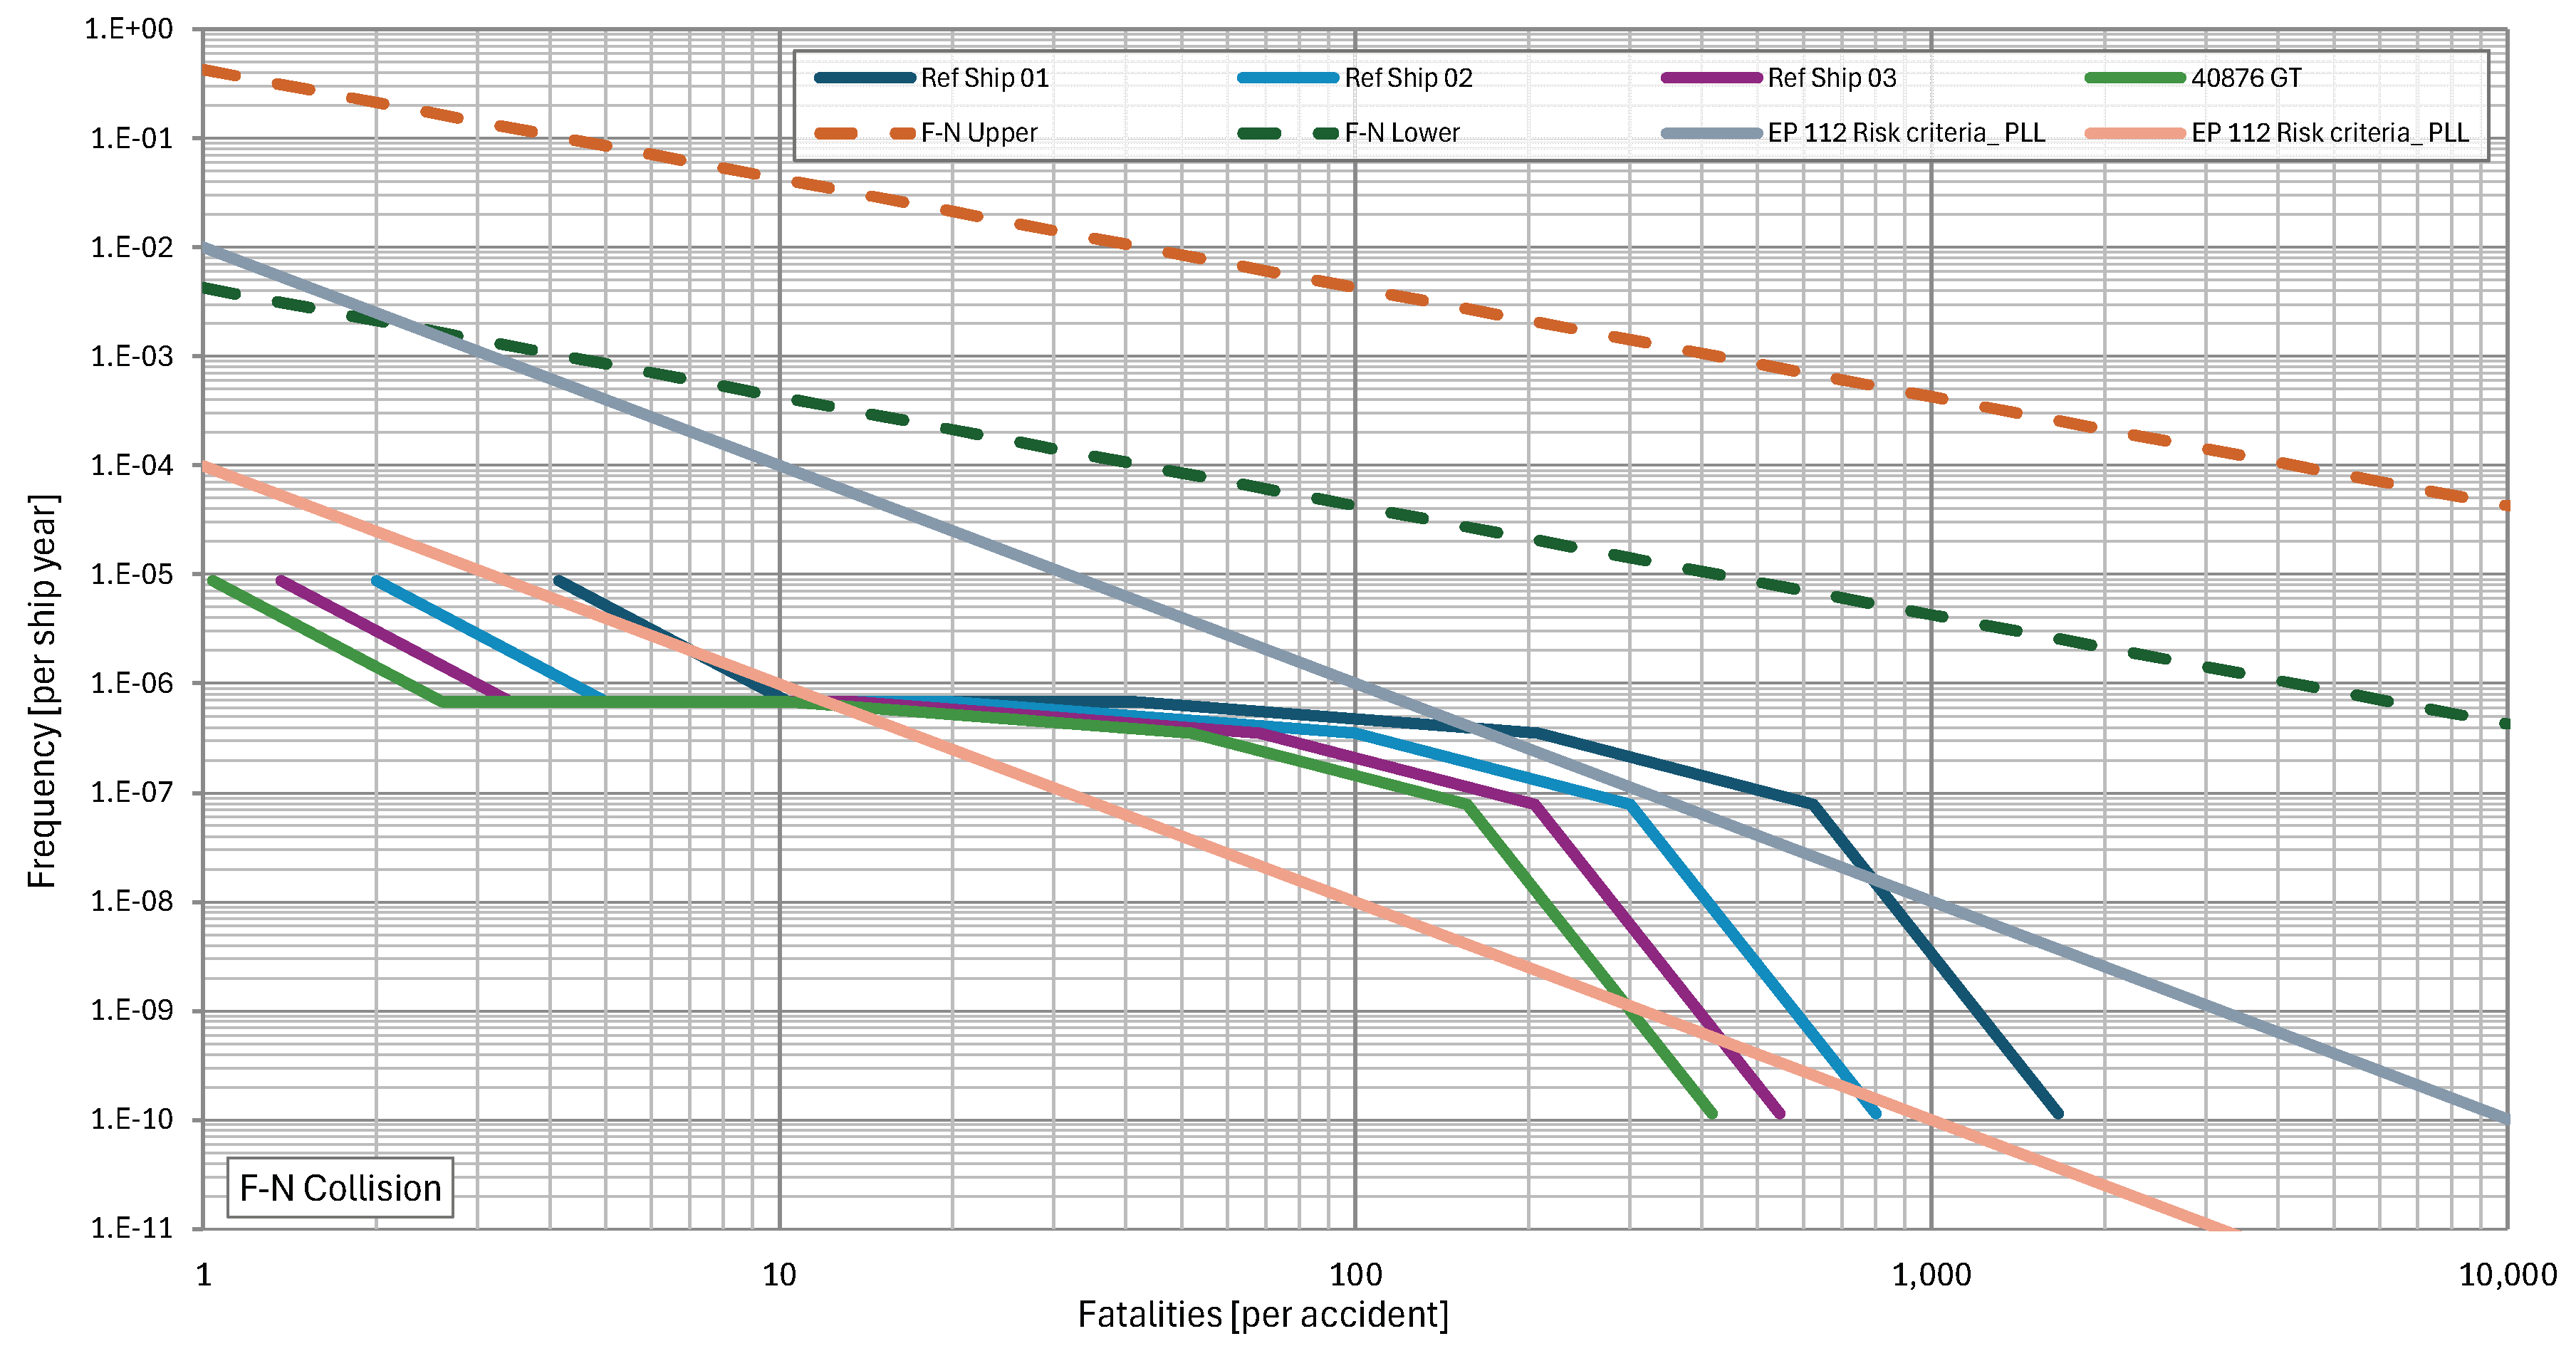
Figure 11.
Societal Risk, LNG cruise ship F-N curve for Grounding.
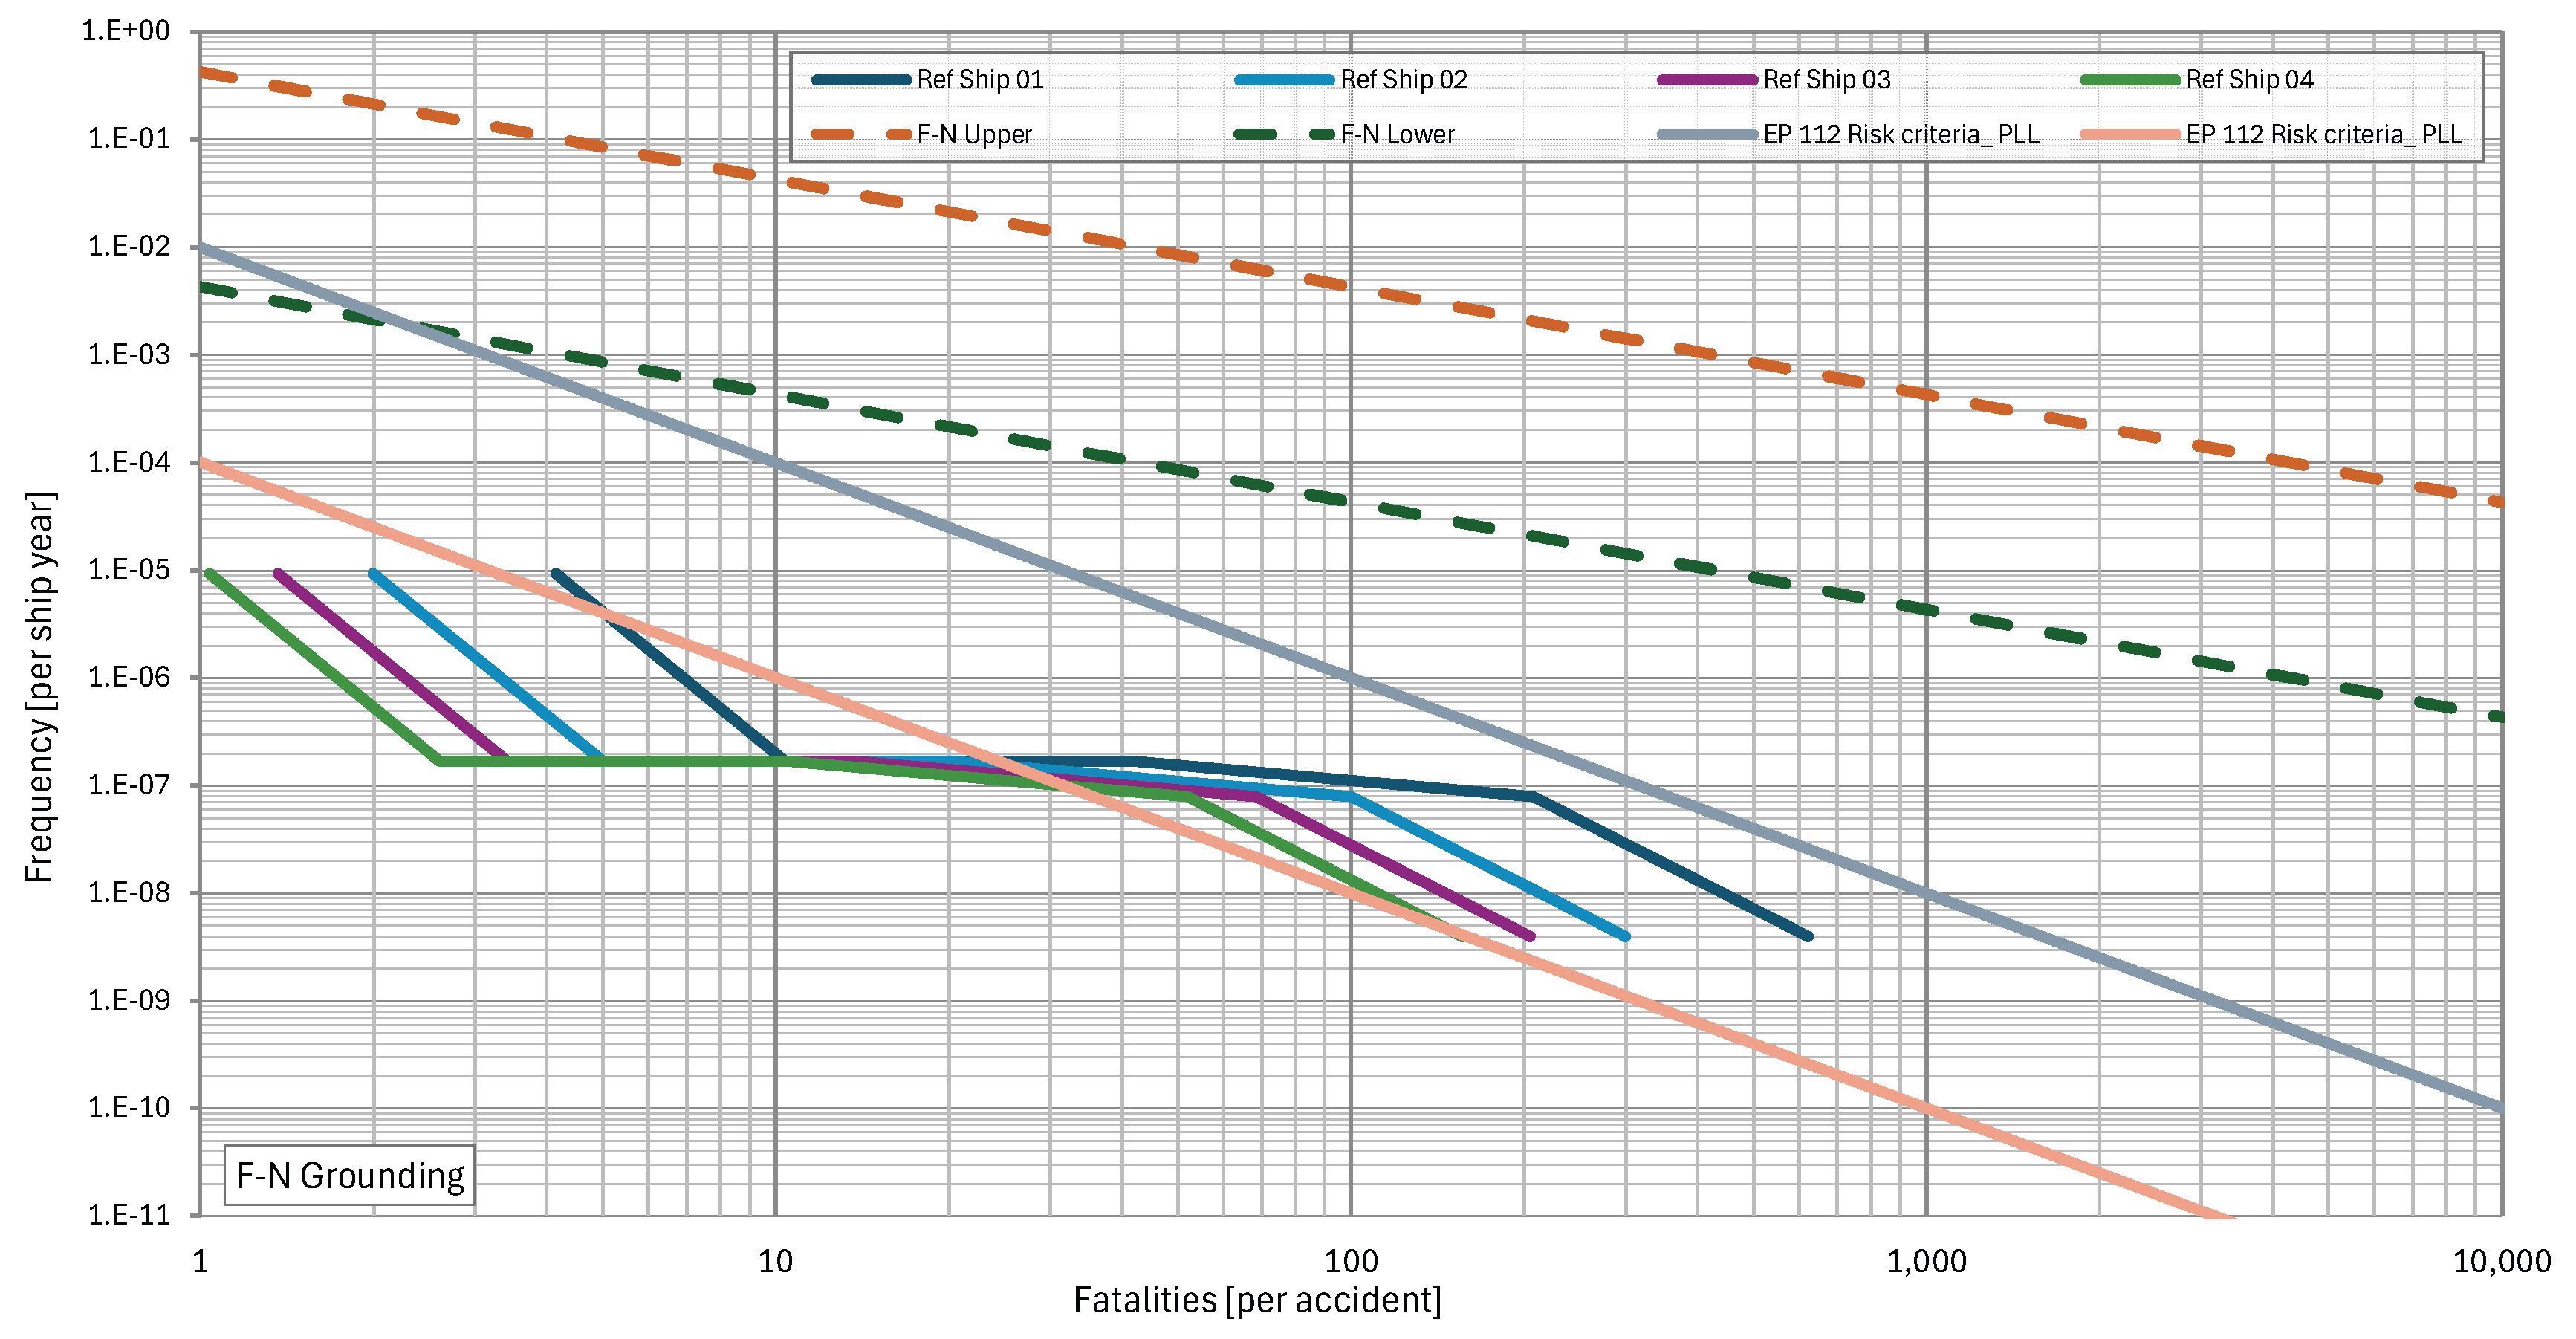
Figure 12.
Societal Risk, LNG cruise ship F-N SUM.
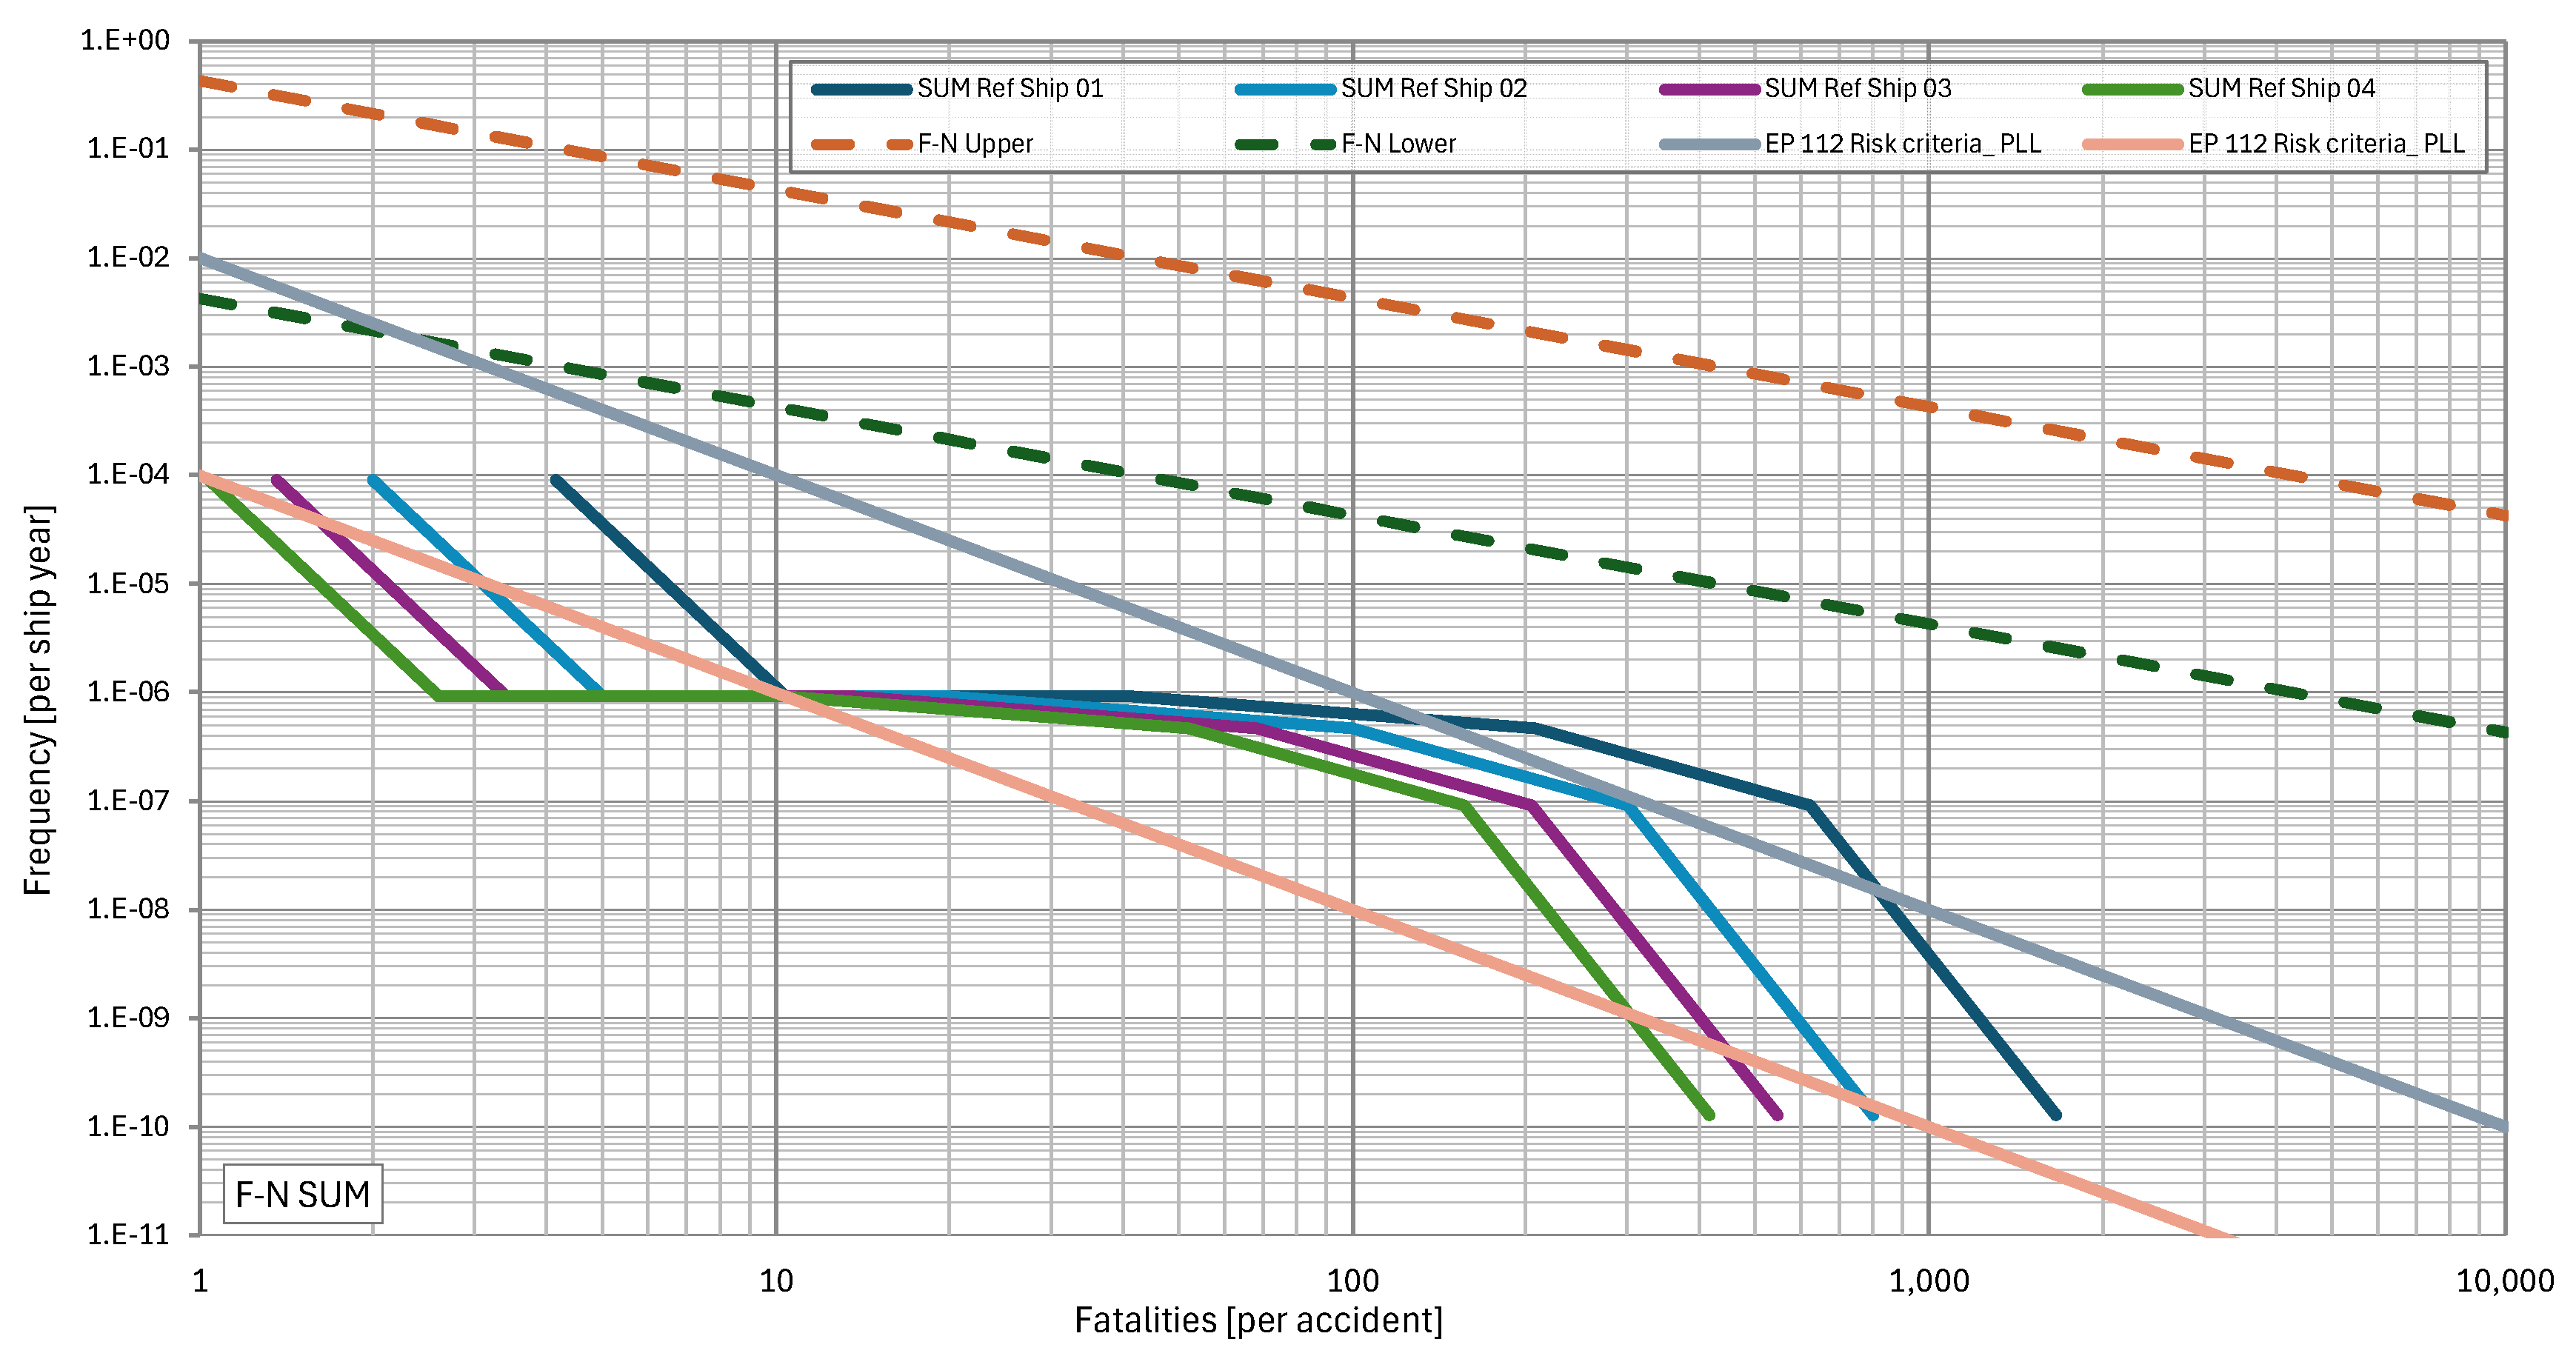
Table 1.
Classification of cruise ship accidents by type and size category (1989–2024).
| Accident type | 20-60 kGT |
60-90 kGT |
90-180 kGT |
180+ kGT |
Total N |
Share | AF N/E |
RP 1/AF |
| Collision | 30 | 16 | 20 | 1 | 67 | 12.5% | 1.02 10-2 | 98.3 |
| Contact | 30 | 23 | 25 | 4 | 82 | 15.3% | 1.24 10-2 | 80.3 |
| Fire/Explosion | 38 | 25 | 40 | 3 | 106 | 19.7% | 1.61 10-2 | 62.1 |
| Hull/Machinery Damage | 107 | 56 | 77 | 240 | 44.7% | 3.64 10-2 | 27.4 | |
| Foundered | 1 | 1 | 0.2% | 1.52 10-4 | 6578 | |||
| Stranded | 26 | 10 | 5 | 41 | 7.6% | 6.22 10-3 | 160.7 | |
| All accidents (N) | 232 | 130 | 167 | 8 | 537 | 100% | 8.15 10-2 | 12.3 |
| All accidents (N%) | 43.2% | 24.2% | 31.1% | 1.5% | 100% | 100% | ||
| Fleet exposure (E) | 3,037 | 1,627 | 1,816 | 107 | 6,587 | |||
| Fleet exposure (E%) | 46.1% | 24.7% | 27.6% | 1.6% | 100% | |||
| Accidents freq. (AF) | 7.64 10-2 | 7.99 10-2 | 9.20 10-2 | 7.48 10-2 | 8.15 10-2 | 3.25 10-1 | ||
| Relative risk (N% / E%) | 0.94 | 0.98 | 1.13 | 0.92 | ||||
| Normalized AF share | 23.6% | 24.7% | 28.5% | 23.1% | 100% | 100% | ||
| Return period RP (1/AF) | 13.1 | 12.5 | 10.9 | 13.4 | 12.3 |
Table 2.
Classification of LNG tanker accidents by type and size category (1989–2024).
| Accident type | 20-60 kGT |
60-90 kGT |
90-180 kGT |
>180 kGT |
Total N |
Share | AF N/E |
RP 1/AF |
| Collision | 1 | 2 | 23 | 26 | 22.8% | 2.79 10-3 | 358.2 | |
| Contact | 1 | 1 | 6 | 8 | 7.0% | 8.59 10-4 | 1164.0 | |
| Fire/Explosion | 3 | 3 | 5 | 11 | 9.6% | 1.18 10-3 | 846.5 | |
| Hull/Machinery Damage | 7 | 21 | 32 | 60 | 52.6% | 6.44 10-3 | 155.2 | |
| Foundered | ||||||||
| Stranded | 2 | 7 | 9 | 7.9% | 9.66 10-4 | 1034.7 | ||
| All accidents (N) | 12 | 29 | 73 | 114 | 100% | 1.22 10-2 | 81.7 | |
| All accidents (N%) | 10.5% | 25.4% | 64.0% | 100% | 100% | |||
| Fleet exposure (E) | 740 | 808 | 7,764 | 9,312 | ||||
| Fleet exposure (E%) | 7.9% | 8.7% | 83.4% | 100% | ||||
| Accidents freq. (AF) | 1.62 10-2 | 3.59 10-2 | 9.40 10-2 | 1.22 10-2 | 6.15 10-2 | |||
| Relative risk (N% / E%) | 1.32 | 2.93 | 0.77 | |||||
| Normalized AF share | 26.4% | 58.4% | 15.3% | 100% | 100% | |||
| Return period RP (1/AF) | 61.7 | 27.9 | 106.4 | 81.7 |
Table 3.
LNG fuelled cruise ships constructed or ordered by year and size class.
| Ship size | 2018 | 2019 | 2020 | 2021 | 2022 | 2023 | 2024 | 2025 | 2026 | 2027 | 2028 | 2029 | 2031 | 2033 | Total |
| 15-60 kGT | 2 | 1 | 3 | 2 | 2 | 1 | 1 | 12 | |||||||
| 60-90 kGT | 1 | 1 | 2 | ||||||||||||
| 90-180 kGT | 1 | 1 | 2 | 2 | 3 | 2 | 2 | 3 | 1 | 2 | 2 | 21 | |||
| > 180 kGT | 1 | 1 | 1 | 2 | 2 | 2 | 1 | 1 | 1 | 12 | |||||
| Total / yr | 1 | 1 | 2 | 4 | 5 | 6 | 5 | 7 | 4 | 6 | 3 | 1 | 1 | 1 | 47 |
Disclaimer/Publisher’s Note: The statements, opinions and data contained in all publications are solely those of the individual author(s) and contributor(s) and not of MDPI and/or the editor(s). MDPI and/or the editor(s) disclaim responsibility for any injury to people or property resulting from any ideas, methods, instructions or products referred to in the content. |
© 2025 by the authors. Licensee MDPI, Basel, Switzerland. This article is an open access article distributed under the terms and conditions of the Creative Commons Attribution (CC BY) license (http://creativecommons.org/licenses/by/4.0/).
Copyright: This open access article is published under a Creative Commons CC BY 4.0 license, which permit the free download, distribution, and reuse, provided that the author and preprint are cited in any reuse.


