
Submitted:
10 September 2025
Posted:
11 September 2025
You are already at the latest version
Abstract
Smart contracts empower many blockchain applications but are exposed to code-level
defects. Existing methods do not scale to the evolving code, do not represent complex
control and data flows, and lack granular and calibrated evidence. To address the above
concerns, we present a across-graph correspondering contract-graph method for vulnera
bility detection: abstract syntax, control flow, and data flow are fused into a typed, directed
contract graph whose nodes are enriched with pre-code embeddings (GraphCodeBERT
or CodeT5+). A Graph Matching Network with cross-graph attention compares contract
graphs, aligns homologous subgraphs associated with vulnerabilities, and supports the
interpretation of statements at the level of balance between a broad structural coverage
and a discriminative pairwise alignment. The evaluation follows a deployment-oriented
protocol with thresholds fixed for validation, multi-seed averaging and a conservative
estimate of sensitivity under low false-positive budgets. On SmartBugs Wild, the method
consistently and markedly exceeds strong rule-based and learning baselines and maintains
a higher sensitivity to matching false positive rates; ablations track the gains to multi-graph
fusion, pre-trained encoders and cross-graph matching, stable through seeds.
Keywords:
smart contracts
; blockchain security
; software vulnerability detection
; graph neural networks
; graph matching
1. Introduction
Smart contracts are the core element of the blockchain stack and face persistent security risks due to code-level weaknesses. Many vulnerabilities are related to Solidity features and suboptimal development practices [1]. High-impact incidents in 2023, including Lido DAO and Deus DAO with losses over million [2], and other events such as Euler Finance and CertiK [3], show that local design or implementation flaws can escalate to protocol-level failures. As decentralized finance and other critical applications are more dependent on chain execution [3], detection methods must balance accuracy, scalability and operational reliability.
Vulnerability detection has therefore become a central theme of blockchain security [4]. Traditional program analysis, including static analysis and formal verification, can provide strong guarantees for some bugs, but it is difficult to adapt to large heterogeneous code bases and rapidly changing attack surfaces. Data-driven methods reduce part of this gap. Earlier neural approaches treated code as token sequences or shallow characteristics and could not capture program structure or data dependencies [5]. Large language models improve context modeling, but are expensive and often underrepresent complex control and data flows [6]. Graph-based analysis addresses these limitations by modeling code as graphs, so that graph neural networks combine structural and semantic signals and reason over paths and dependencies. Many existing graph methods still rely on a single mode such as AST, CFG, or DFG, or operate only at the contract level, which limits the recognition of patterns that span structural views or recur across contracts. Many existing graph methods still rely on a single modality such as AST, CFG, or DFG, or operate only at the contract level, which limits recognition of patterns that span structural views or recur across contracts [5,7].
This work presents an across-graph matching contract graph method for intelligent contract vulnerability detection. Abstract syntax, control flow, and data flow are combined into a typed, directed contract graph. Nodes are enriched by contextual integrations from pre-defined encoders such as GraphCodeBERT and CodeT5+. A Graph Matching Network with cross-graph attention compares pairs of contract graphs and focuses inference on homologous subgraphs associated with vulnerabilities. The design balances broad structural coverage with discriminatory pairwise alignment, and supports interpretation at the statement level.
The study is empirical and takes into account deployment needs. First, a unified multi-graph representation combines AST, CFG, and DFG with encoded node features so that syntax, control, and data dependencies are modeled in a single space with better coverage of execution semantics. Secondly, an across-diagram alignment mechanism based on a Graph Matching Network with attention aligns related subgraphs and concentrates evidence on regions relevant to vulnerabilities, thereby supporting assertion-level clues and downstream localization. Thirdly, a deployment-oriented evaluation and calibration protocol is employed, with thresholds set on validation, multi-seed reporting, and a conservative estimate of the average normalized positive rate under low false positive budgets, calculated from standard detection statistics.
The model capacity and overhead are kept clear. The encoder uses 12 Transformer layers with hidden size of 768 and 12 attention heads. The matching network uses 100 dimensional node embeddings and four propagation layers. The evaluation is performed on SmartBugs Wild with 47,398 unique Solidity files and about 203,716 contracts. Sensitivity is summarized at the reference operating points to reflect strict audit budgets. The results show consistent gains over strong baselines in macro precision, recall and and higher sensitivity in low false positive regions. The ablation confirms complementary benefits of fusion, encoder features and cross-graph matching. The results are stable throughout the seeds. All claims are limited by the evaluated body and protocol.
The rest of the document is organized as follows. Section 2 examines the detection of vulnerability based on graphs and motivates multi-graph fusion with cross-graph alignment. Section 3 describes contract graph construction, encoder integration and matching architecture. Section 4 presents datasets, baselines, measures and results, including low false positive sensitivity and ablations. Section 5 concludes with the limitations and directions for the deployment of unified extensions.
2. Related Works
Recent studies model the program code as graphs to combine structural and semantic hints. Unique encoding (AST, CFG, or DFG only) often misses the interactions between control and data that trigger vulnerabilities. Multi-graph and heterogeneous formulations address this gap by coding syntax, control flow and data dependencies together, and report more stable detection and localization at the function and statement level [5,8,9]. In smart contracts, attention mechanisms further separate control signals from data signals and mitigate false correlations, improving trigger location through dual or heterogeneous attention [7,10]. The work on robustness and interpretation uses contextual graphic enhancement and assignment [11]. These results suggest that fusion benefits from explicit relationship separation and task-aware weighting, rather than naive concatenation.
Pre-trained code models provide contextual inserts that capture long-term semantics and lexical regularities. CodeT5+ is an example of code understanding and generation [12]. Hybrid pipelines incorporating sequence-level embedding with graph encoders show improvements in software vulnerability detection and just-in-time scenarios [5,8,13]. Graph-aware alignment and cross-graph message passing tend to overcome the heuristic stacking in ablations by selectively transmitting information through modalities and reducing graphical conflicts.
In the field of intelligent contracts, surveys synthesize the taxonomies of attacks, data sources, evaluation practices and deployment concerns, and emphasize compromises between cover, interpretability and operational costs [14,15,16,17,18]. The learner detectors customized to contracts extend coverage through transfer and multi-label learning [19]. Program analysis and measurement studies reveal risks that are rooted in contract-specific semantics and cross-contract interactions [20]. Public organizations such as SmartBugs Wild support reproducible evaluations and large-scale error analyses [21,22]. Throughout these studies, graph learning and pre-training embedding are complementary. Robust detection still requires modeling how syntax, control flow, and data flow interact at fine granularity. Our work follows this direction by combining AST, CFG and DFG under a spine with cross-graph alignment and attention, with the aim of precisely locating the triggers and presenting evidence-based reports at practical cost [14,17].
Figure 1.
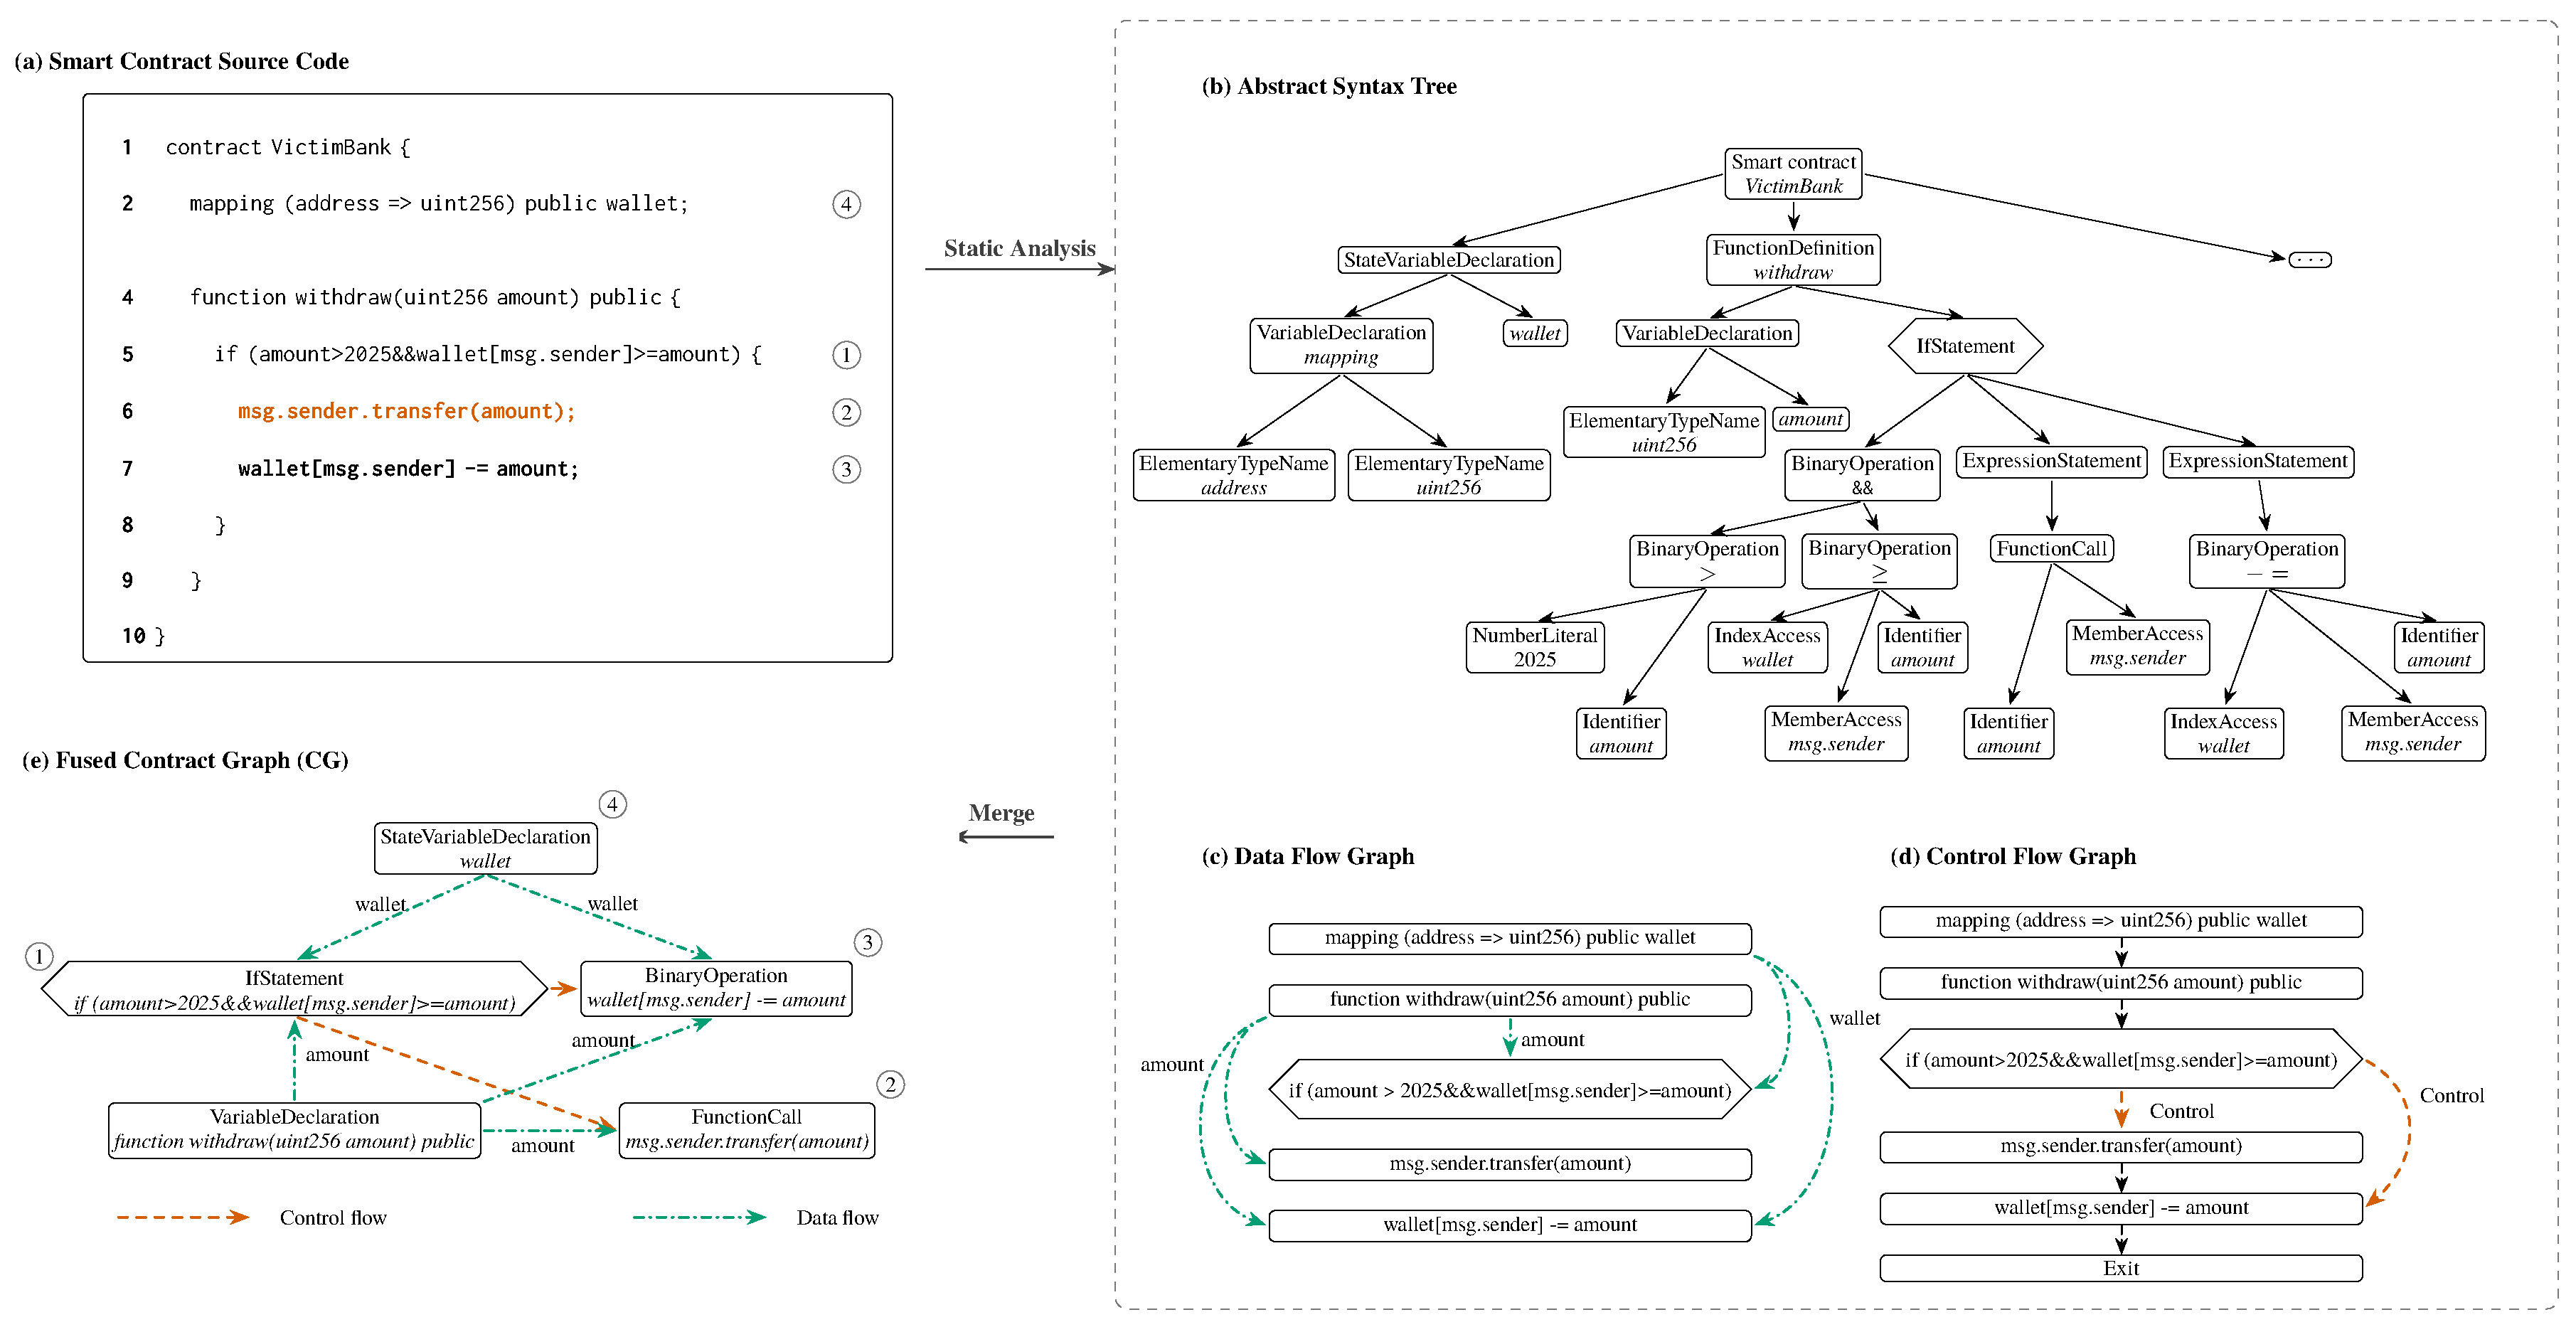
Contract-graph construction. (a) Source snippet (VictimBank) with transfer logic to avoid reentry. (b) Abstract syntax tree (AST), (c) data flow diagram (DFG), and (d) control flow diagram (CFG) of static analysis. (e) Fused Contract Graphic (CG), in which the statement nodes are connected by a type dependency: control (orange) and data (green). For readability, the AST leaves and syntax edges are cut and the virtual anchor nodes (functions and loops) are omitted in this rendering.
Figure 1.
Contract-graph construction. (a) Source snippet (VictimBank) with transfer logic to avoid reentry. (b) Abstract syntax tree (AST), (c) data flow diagram (DFG), and (d) control flow diagram (CFG) of static analysis. (e) Fused Contract Graphic (CG), in which the statement nodes are connected by a type dependency: control (orange) and data (green). For readability, the AST leaves and syntax edges are cut and the virtual anchor nodes (functions and loops) are omitted in this rendering.
3. Proposed Approach
3.1. Overview
The proposed framework detects smart contract weaknesses by measuring the similarity between contract diagrams, as shown in Figure 2. The training stage transforms contract pairs into graphs and learns a similarity function that places vulnerable contracts close to each other, while pushing secure contracts further away. The detection stage then incorporates a target contract and assigns a score using the learned Matcher. A threshold determined during validation is applied to the similarity point. The training process includes the creation of graphics from abstract syntax, control flow, and data flow representations, and the detection process applies the learning matching model to threshold-based similarity rule.
3.2. Contract Graph Construction
The contract S contains a statement set and a variable set . Static analysis produces an abstract syntax tree , a control flow graph and a data flow graph . Each statement aligns with a subtree through a parser map . The fused, typed multigraph is
constructed by replacing each control flow node for u with (redundantly pruned leaves), introducing virtual nodes and to preserve the function and cycle area, and maintaining type maps and . Here, denotes the node-feature matrix (e.g., contextual code embeddings and local structural descriptors), and T collects node/edge type tags consistent with and . A token alignment from graph nodes to source tokens is recorded for feature pooling. Once , , and are available, the construction is completed in time. Control flow and def-use metadata come from Slither [23]; ASTs with nodeType use solc-typed-ast [24]. Algorithm 1 summarizes the extraction and fusion pipeline, specifying the inputs (source code and analyzers), the token/statement alignments, and the typed-edge assembly on the input in the final contract graph.
| Algorithm 1 BuildContractGraph: extraction and fusion |
|
3.3. Pretrained Encoder and Node Features
The input sequence concatenates [CLS], code tokens, [SEP], and variable tokens (total length L). A multilayer transformer produces contex states with multi-head attention
where the mask accepts adjacent token pairs in text, connected by control flow or data flow, aligned by code-variable matches or marked as special tokens. Other entries receive . After encoding, node features pool over and concatenate type and Skip-gram annotations,
and edge features include type encodings and optional Skip-gram embeddings. Pre-training follows previous work on masked language modeling [25], data flow prediction, and code flow alignment
3.4. Cross-Graph Similarity with a Contract-Graph Matcher
Given and , initialize
In iteration t,
Here, and denote the hidden states of nodes i and j at iteration t. Functions and handle intra-graph aggregation, and node updates, respectively. Figure 3 illustrates the cross-graph attentino mechanism. After T iterations,
here, denote the graph aggregation function,with normalization before . Construction is ; the cost per layer encoder is ; the matcher is for intra-graph messages and for cross-graph attention.
3.5. Training and Detection
A contrastive loss of the margin trains the matcher on pair labeled with similarity :
where and . Let be a graph of vulnerable embeddings from the training data. For a target contract graph with encapsulation g,
and the decision is with a threshold fixed in validation. Algorithm 2 details the process from end to end, including graph construction, encoder pre-training and pooling, pair-wise optimization, assembling the reference embeddings and the maximum similarity inference rule.
| Algorithm 2 TrainAndDetect: compact training and inference |
|
4. Empirical Evaluation
The method is evaluated on three fronts. First, the end-to-end accuracy against the Rule-based and Learning-based baselines. Secondly, the benefit of fusing AST+CFG+DFG over single views. Thirdly, the ablations of the key modules. Sensitivity is also studied under low false positive budgets.
4.1. Datasets
SmartBugs Wild [26] is used as a public corpus of Solidity contracts. It contains unique .sol files (approximately contracts). Labels cover Reentrancy (RE), Timestamp Dependency (TD) and Integer Overflow/Underflow (IO), plus non-vulnerable files.
4.2. Baselines and Setup
1) Static analysis and graphs. ASTs are extracted with solc-typed-ast [24]. CFG/DFG and def-use metadata come from Slither [23]. These artifacts are merged into contract-level graphs (Section 3.2) using NetworkX [27].
2) Encoder and matcher. GraphCodeBERT [25] is used (12 layers, hidden size 768, 12 heads, Adam). The contract graphs matcher uses embedded size 100, four hidden layers, learning rate , and test time threshold . Training is for 85 iterations (Section 3.4).
3) Baselines. For transparency and comparability, the baselines are organized into two families under a uniform evaluation interface: Rule-based: sFuzz [28], SmartCheck [29], Osiris [30], Oyente [31], Mythril [32]; Learning-based: LineVul [33], GCN [34], TMP [35], AME [36], Peculiar [37], CBGRU [38], CGE [39]. All experiments follow the configurations specified in the original works.
4) Splits and protocol. A 60/20/20 train/validation/test split is used. The thresholds are chosen during validation and fixed during testing. Each experiment uses five random seeds; the means are reported.
5) Metrics. Precision, recall, and follow the standard definitions and are not repeated here. For completeness, and Fowlkes–Mallows (FM) are reported as deterministic functions of .
4.3. End-to-End Results
Table 1 reports per class and macro . The right block adds and FM calculated from . On a macro-average, the proposed method reaches Recall , Precision and , improving over CGE by , and points. Each class and FM show the same trend, with the highest gains in RE.
4.4. Low-FPR Sensitivity
1) Definition. Let denote the prevalence of positives, and let R and P denote recall (true positive rate, TPR) and precision at a fixed operating threshold. By standard confusion-matrix relations,
For a target false-positive budget , the low-FPR normalized sensitivity[40] is defined as the vertically normalized partial ROC area (pAUC), i.e., the average TPR on :
2) Attainable lower bound under ROCCH. Under the ROC convex-hull model (allowing randomized thresholds so that points on chords between ROC points are attainable), the least-favourable concave, nondecreasing ROC consistent with the origin and the observed point is the chord from to followed by the horizontal ray at level R. Substituting this piecewise-linear ROC into the definition of low-FPR normalized sensitivity yields the closed-form attainable lower bound
which is continuous at with value . Reported values are .
3) Evaluation protocol. Unless otherwise stated, the prevalence is fixed at for calculating the false positive rate. For each method and class, is determined using the relationship between , and is derived from the attainable lower bound definition at the budgets . This procedure requires only at the reported operating point and does not assume access to unobserved ROC segments.
Figure 4 plots versus the FPR budget . The vertical dashed lines mark . For , the Proposed method attains the highest low-FPR normalized sensitivity across all classes. At , the performance margin is relative to the strongest baseline,
On average across RE, TD, and IO, the gains span 11.82–54.91 at 1% poisoning, 4.97–40.09 at 5%, and 3.95–31.96 at 10%, with improvements decreasing as the poisoning ratio grows. The curve is monotone nondecreasing in and upper-bounded by R for each method and class, consistent with the attainable lower bound definition.
4.5. Visual Diagnostics
Figure 5 couples bars with empty recall and precise markers. The tight marker co-location near the bar tip indicates a well-calibrated threshold. The gaps reveal asymmetric errors. The proposed method is the rightmost in all classes and shows minimal gaps. CGE is close but loses recall on RE. Peculiar is precisely biased. CBGRU suppresses the recall. Rule-based tools trail.
4.6. Fusion and Ablations
The inputs and ablations of the single view are in Table 2. AST-only, CFG-only, and DFG-only are weaker than fusion. The removal of GraphCodeBERT affects RE and TD most. The removal the matcher damages all classes. Replacing the fused graph with DFG-only reduces the results. Fusion adds context. Semantics of the encoder help. The cross-graph matching focuses on evidence.
4.7. Uncertainty and Limits
Stratified bootstraps (1,000 resamples) are used for macro and low-FPR sensitivity, and pairs tests vs. CGE support statistical significance. The main threats include label noise, split leakage through shared libraries, and data distribution. The use of five random seeds and validation thresholds helps reduce bias, but external validity depends on future data. Overall, the results are consistent in tables and figures: multi-graph fusion, pre-trained encoder, and cross-graph matching provide complementary contributions, and the observed gains persist under limited false positive budgets.
5. Conclusion and Future Work
This work introduces a contract-graph vulnerability detection framework that combines Abstract Syntax Trees (AST), Control-Flow Graphs (CFG), and Data-Flow Graphs (DFG) into a typed, guided multigraph, couples a graphical-aware encoder with a cross-graph matcher, and applies a threshold decision rule fixed by validation. On SmartBugs Wild, the framework achieved a macro of 90.18% over reentry, timestamp dependency and integer overflow/underflow, surpassing strong Rule-based and Learning-based baselines. The deployment-aligned criteria, including Matthews correlation coefficient (MCC) for robustness under class imbalance, partial AUROC in low-FPR bands (pAUROC) for budgeted false positives, and calibration metrics (ECE/Brier) for probability reliability, show further improvements in discrimination and confidence alignment.
Two limitations suggest concrete next steps. First, potential temporal drift and label noise in public organizations may limit the availability of distributions; future evaluations should adopt rolling, time-sharing standards with labeled judgments and report MCC, pAUROC at low FPR, and calibration before and after adaptation. Second, a static, single-contract abstraction captures environment- and context-dependent uses; enriching the graph with inter-contract call structure and selective dynamic evidence (e.g., symbolic execution traces or fuzzing witnesses), aligning objectives to low-FPR operating points (e.g., partial AUC-based or cost-sensitive losses), and expanding graph retrieval by closest approximate neighbors with subgraph-level attribution constitute promising directions towards a more robust, interpretable, and deployable detector.
References
- Ivanov, N., C. Li, Q. Yan, Z. Sun, Z. Cao, and X. Luo. 2023. Security threat mitigation for smart contracts: A comprehensive survey. ACM Computing Surveys 55(14s): 326:1–326:37. [CrossRef]
- Tsai, C.-C., C.-C. Lin, and S.-W. Liao. 2023. Unveiling vulnerabilities in DAO: A comprehensive security analysis and protective framework. In Proceedings of the 2023 IEEE International Conference on Blockchain (Blockchain 2023), 151–158. IEEE. [CrossRef]
- Wu, H., Q. Yao, Z. Liu, B. Huang, Y. Zhuang, H. Tang, and E. Liu. 2024. Blockchain for finance: A survey. IET Blockchain 4(2): 101–123. [CrossRef]
- Li, S., Y. Zhou, J. Wu, Y. Li, X. Liu, J. Zhou, and Y. Zhang. 2023. Survey of vulnerability detection and defense for Ethereum smart contracts. IEEE Transactions on Network Science and Engineering 10(5): 2419–2437.
- Qiu, F.; Z. Liu; X. Hu; X. Xia; G. Chen; X. Wang. 2024. Vulnerability Detection via Multiple-Graph-Based Code Representation. IEEE Transactions on Software Engineering 50(8), 2178–2199. IEEE. [CrossRef]
- Ding, H., Y. Liu, X. Piao, H. Song, and Z. Ji. 2025. SmartGuard: An LLM-enhanced framework for smart contract vulnerability detection. Expert Systems with Applications 269: 126479. [CrossRef]
- Luo, F.; R. Luo; T. Chen; A. Qiao; Z. He; S. Song; Y. Jiang; S. Li. 2024. SCVHunter: Smart Contract Vulnerability Detection Based on Heterogeneous Graph Attention Network. In Proceedings of the 2024 IEEE/ACM 46th International Conference on Software Engineering (ICSE 2024), 170:1–170:13. ACM/IEEE. [CrossRef]
- Chen, D.; L. Feng; Y. Fan; S. Shang; Z. Wei. 2023. Smart contract vulnerability detection based on semantic graph and residual graph convolutional networks with edge attention. Journal of Systems and Software 202, 111705. Elsevier. [CrossRef]
- Cai, J.; B. Li; J. Zhang; X. Sun; B. Chen. 2023. Combine sliced joint graph with graph neural networks for smart contract vulnerability detection. Journal of Systems and Software 195, 111550. Elsevier. [CrossRef]
- Zhen, Z.; X. Zhao; J. Zhang; Y. Wang; H. Chen. 2024. DA-GNN: A smart contract vulnerability detection method based on Dual Attention Graph Neural Network. Computer Networks 242, 110238. Elsevier. [CrossRef]
- Cao, S.; X. Sun; X. Wu; D. Lo; L. Bo; B. Li; W. Liu. 2024. Coca: Improving and Explaining Graph Neural Network-Based Vulnerability Detection Systems. In Proceedings of the 2024 IEEE/ACM International Conference on Software Engineering (ICSE 2024), 155:1–155:13. ACM/IEEE. [CrossRef]
- Wang, Y.; H. Le; A. D. Gotmare; N. D. Q. Bui; J. Li; S. C. H. Hoi. 2023. CodeT5+: Open Code Large Language Models for Code Understanding and Generation. In Proceedings of the 2023 Conference on Empirical Methods in Natural Language Processing (EMNLP 2023), 1069–1088. Association for Computational Linguistics. [CrossRef]
- Hussain, S.; M. Nadeem; J. Baber; M. Hamdi; A. Rajab; M. S. Al Reshan; A. Shaikh. 2024. Vulnerability detection in Java source code using a quantum convolutional neural network with self-attentive pooling, deep sequence, and graph-based hybrid feature extraction. Scientific Reports 14, 7406. Springer Nature. [CrossRef]
- Jiao, T., Z. Xu, M. Qi, S. Wen, Y. Xiang, and G. Nan. 2024. A survey of Ethereum smart contract security: Attacks and detection. Distributed Ledger Technologies: Research and Practice 3(3): 1–28. [CrossRef]
- Chu, H., P. Zhang, H. Dong, Y. Xiao, S. Ji, and W. Li. 2023. A survey on smart contract vulnerabilities: Data sources, detection and repair. Information and Software Technology 159: 107221. [CrossRef]
- Wei, Z., J. Sun, Z. Zhang, X. Zhang, X. Yang, and L. Zhu. 2024. Survey on quality assurance of smart contracts. ACM Computing Surveys 57(2): Article 32. [CrossRef]
- Vidal, F. R., N. Ivaki, and N. Laranjeiro. 2024. Vulnerability detection techniques for smart contracts: A systematic literature review. Journal of Systems and Software 217: 112160. [CrossRef]
- Wu, G., H. Wang, X. Lai, M. Wang, D. He, and K.-K. R. Choo. 2024. A comprehensive survey of smart contract security: State of the art and research directions. Journal of Network and Computer Applications 226: 103882. [CrossRef]
- Sendner, C., L. Petzi, J. Stang, and A. Dmitrienko. 2023. Smarter Contracts: Detecting vulnerabilities in smart contracts with deep transfer learning (ESCORT). In Proceedings of the Network and Distributed System Security Symposium (NDSS 2023), 1–18. Internet Society.
- Ruaro, N., F. Gritti, R. McLaughlin, I. Grishchenko, C. Kruegel, and G. Vigna. 2024. Not your type! Detecting storage collision vulnerabilities in Ethereum smart contracts. In Proceedings of the Network and Distributed System Security Symposium (NDSS 2024), 1–16. Internet Society.
- Ferreira, J. F., and contributors. 2020–. SmartBugs Wild Dataset: 47,398 smart contracts from Ethereum. Dataset. Available at: https://github.com/smartbugs/smartbugs-wild.
- Huang, Q., Z. Zeng, and Y. Shang. 2024. An empirical study of integer overflow detection and false positive analysis in smart contracts. In Proceedings of the 8th International Conference on Big Data and Internet of Things (BDIOT 2024), 247–251. ACM. [CrossRef]
- Feist, J., G. Grieco, and A. Groce. 2019. Slither: A static analysis framework for smart contracts. In 2019 IEEE/ACM 2nd International Workshop on Emerging Trends in Software Engineering for Blockchain (WETSEB), 8–15. IEEE. [CrossRef]
- ConsenSys Diligence Docs. 2025. solc-typed-ast Documentation. Available at: https://consensys.github.io/solc-typed-ast. Accessed Aug 25, 2025.
- Guo, H., Y. Yu, and X. Li. 2020. ContractFuzzer: Fuzzing smart contracts for vulnerability detection. In Proceedings of the 2020 IEEE International Conference on Software Testing, Verification and Validation (ICST), 191–201. IEEE. [CrossRef]
- Durieux, T.; Ferreira, J. F.; Abreu, R.; Cruz, P. 2020. Empirical review of automated analysis tools on 47,587 Ethereum smart contracts. In Proceedings of the ACM/IEEE 42nd International Conference on Software Engineering (ICSE 2020), 530–541. ACM/IEEE. [CrossRef]
- Hasan, M., N. Kumar, A. Majeed, A. Ahmad, and S. Mukhtar. 2023. Protein–Protein Interaction Network Analysis Using NetworkX. In Protein–Protein Interactions: Methods and Protocols, 457–467. Springer. [CrossRef]
- Nguyen, T. D., L. H. Pham, J. Sun, Y. Lin, and Q. T. Minh. 2020. sFuzz: An efficient adaptive fuzzer for Solidity smart contracts. In Proceedings of the 42nd International Conference on Software Engineering (ICSE 2020), 778–788. ACM/IEEE. [CrossRef]
- Tikhomirov, S., E. Voskresenskaya, I. Ivanitskiy, R. Takhaviev, E. Marchenko, and Y. Alexandrov. 2018. SmartCheck: Static analysis of Ethereum smart contracts. In Proceedings of the 1st International Workshop on Emerging Trends in Software Engineering for Blockchain (WETSEB), 9–16. ACM. [CrossRef]
- Torres, C. F., J. Schütte, and R. State. 2018. Osiris: Hunting for Integer Bugs in Ethereum Smart Contracts. In Proceedings of the 2018 Annual Computer Security Applications Conference (ACSAC 2018), 664–676. ACM. [CrossRef]
- Luu, L., D.-H. Chu, H. Olickel, P. Saxena, and A. Hobor. 2016. Making smart contracts smarter. In Proceedings of the 2016 ACM SIGSAC Conference on Computer and Communications Security (CCS), 254–269. ACM. [CrossRef]
- Chee, C. Y. M., S. Pal, L. Pan, and R. Doss. 2023. An analysis of important factors affecting the success of blockchain smart contract security vulnerability scanning tools. In Proceedings of the 5th ACM International Symposium on Blockchain and Secure Critical Infrastructure (BSCI 2023), 105–113. ACM. [CrossRef]
- Fu, M., and C. Tantithamthavorn. 2022. LineVul: A transformer-based line-level vulnerability prediction. In Proceedings of the 19th International Conference on Mining Software Repositories (MSR 2022), 608–620. ACM/IEEE. [CrossRef]
- Zhang, H., G. Lu, M. Zhan, and B. Zhang. 2022. Semi-Supervised Classification of Graph Convolutional Networks with Laplacian Rank Constraints. Neural Processing Letters 54(4): 2645–2656. [CrossRef]
- Zhuang, Y., Z. Liu, P. Qian, Q. Liu, X. Wang, and Q. He. 2021. Smart contract vulnerability detection using graph neural networks. In Proceedings of the 29th International Joint Conference on Artificial Intelligence (IJCAI 2020), 3283–3290.
- Liu, Z., Q. Xu, H. Chen, and W. Zhang. 2021. Hybrid analysis of integer overflow vulnerabilities in Ethereum smart contracts. Future Generation Computer Systems 119: 91–100.
- Wu, H., Z. Zhang, S. Wang, Y. Lei, B. Lin, Y. Qin, H. Zhang, and X. Mao. 2021. Peculiar: Smart contract vulnerability detection based on crucial data flow graph and pre-training techniques. In Proceedings of the 32nd IEEE International Symposium on Software Reliability Engineering (ISSRE 2021), Wuhan, China, October 25-28, 2021, 378–389. IEEE. [CrossRef]
- Zhang, R., P. Wang, and L. Zhao. 2022. Machine learning-based detection of reentrancy vulnerabilities in smart contracts. Future Generation Computer Systems 127: 362–373.
- He, L., X. Zhao, and Y. Wang. 2023. GraphSA: Smart Contract Vulnerability Detection Combining Graph Neural Networks and Static Analysis. In ECAI 2023 (Frontiers in Artificial Intelligence and Applications), 1026–1036. IOS Press. [CrossRef]
- Arp, D., E. Quiring, F. Pendlebury, A. Warnecke, F. Pierazzi, C. Wressnegger, L. Cavallaro, and K. Rieck. 2024. Pitfalls in Machine Learning for Computer Security. Communications of the ACM 67(11): 104–112. [CrossRef]
Figure 2.
Overview of the contract-graph matching framework. The static analysis extracts the AST/CFG/DFG and constructs the fused contract graph (CG). The training stage learns cross-graph similarity with a contrastive loss in CG pairs. The training process integrates a CG target, calculates a similarity point with the matcher, and applies a decision threshold selected for validation and kept fixed in the test. Solid arrows indicate training; outlined arrows indicate detection.
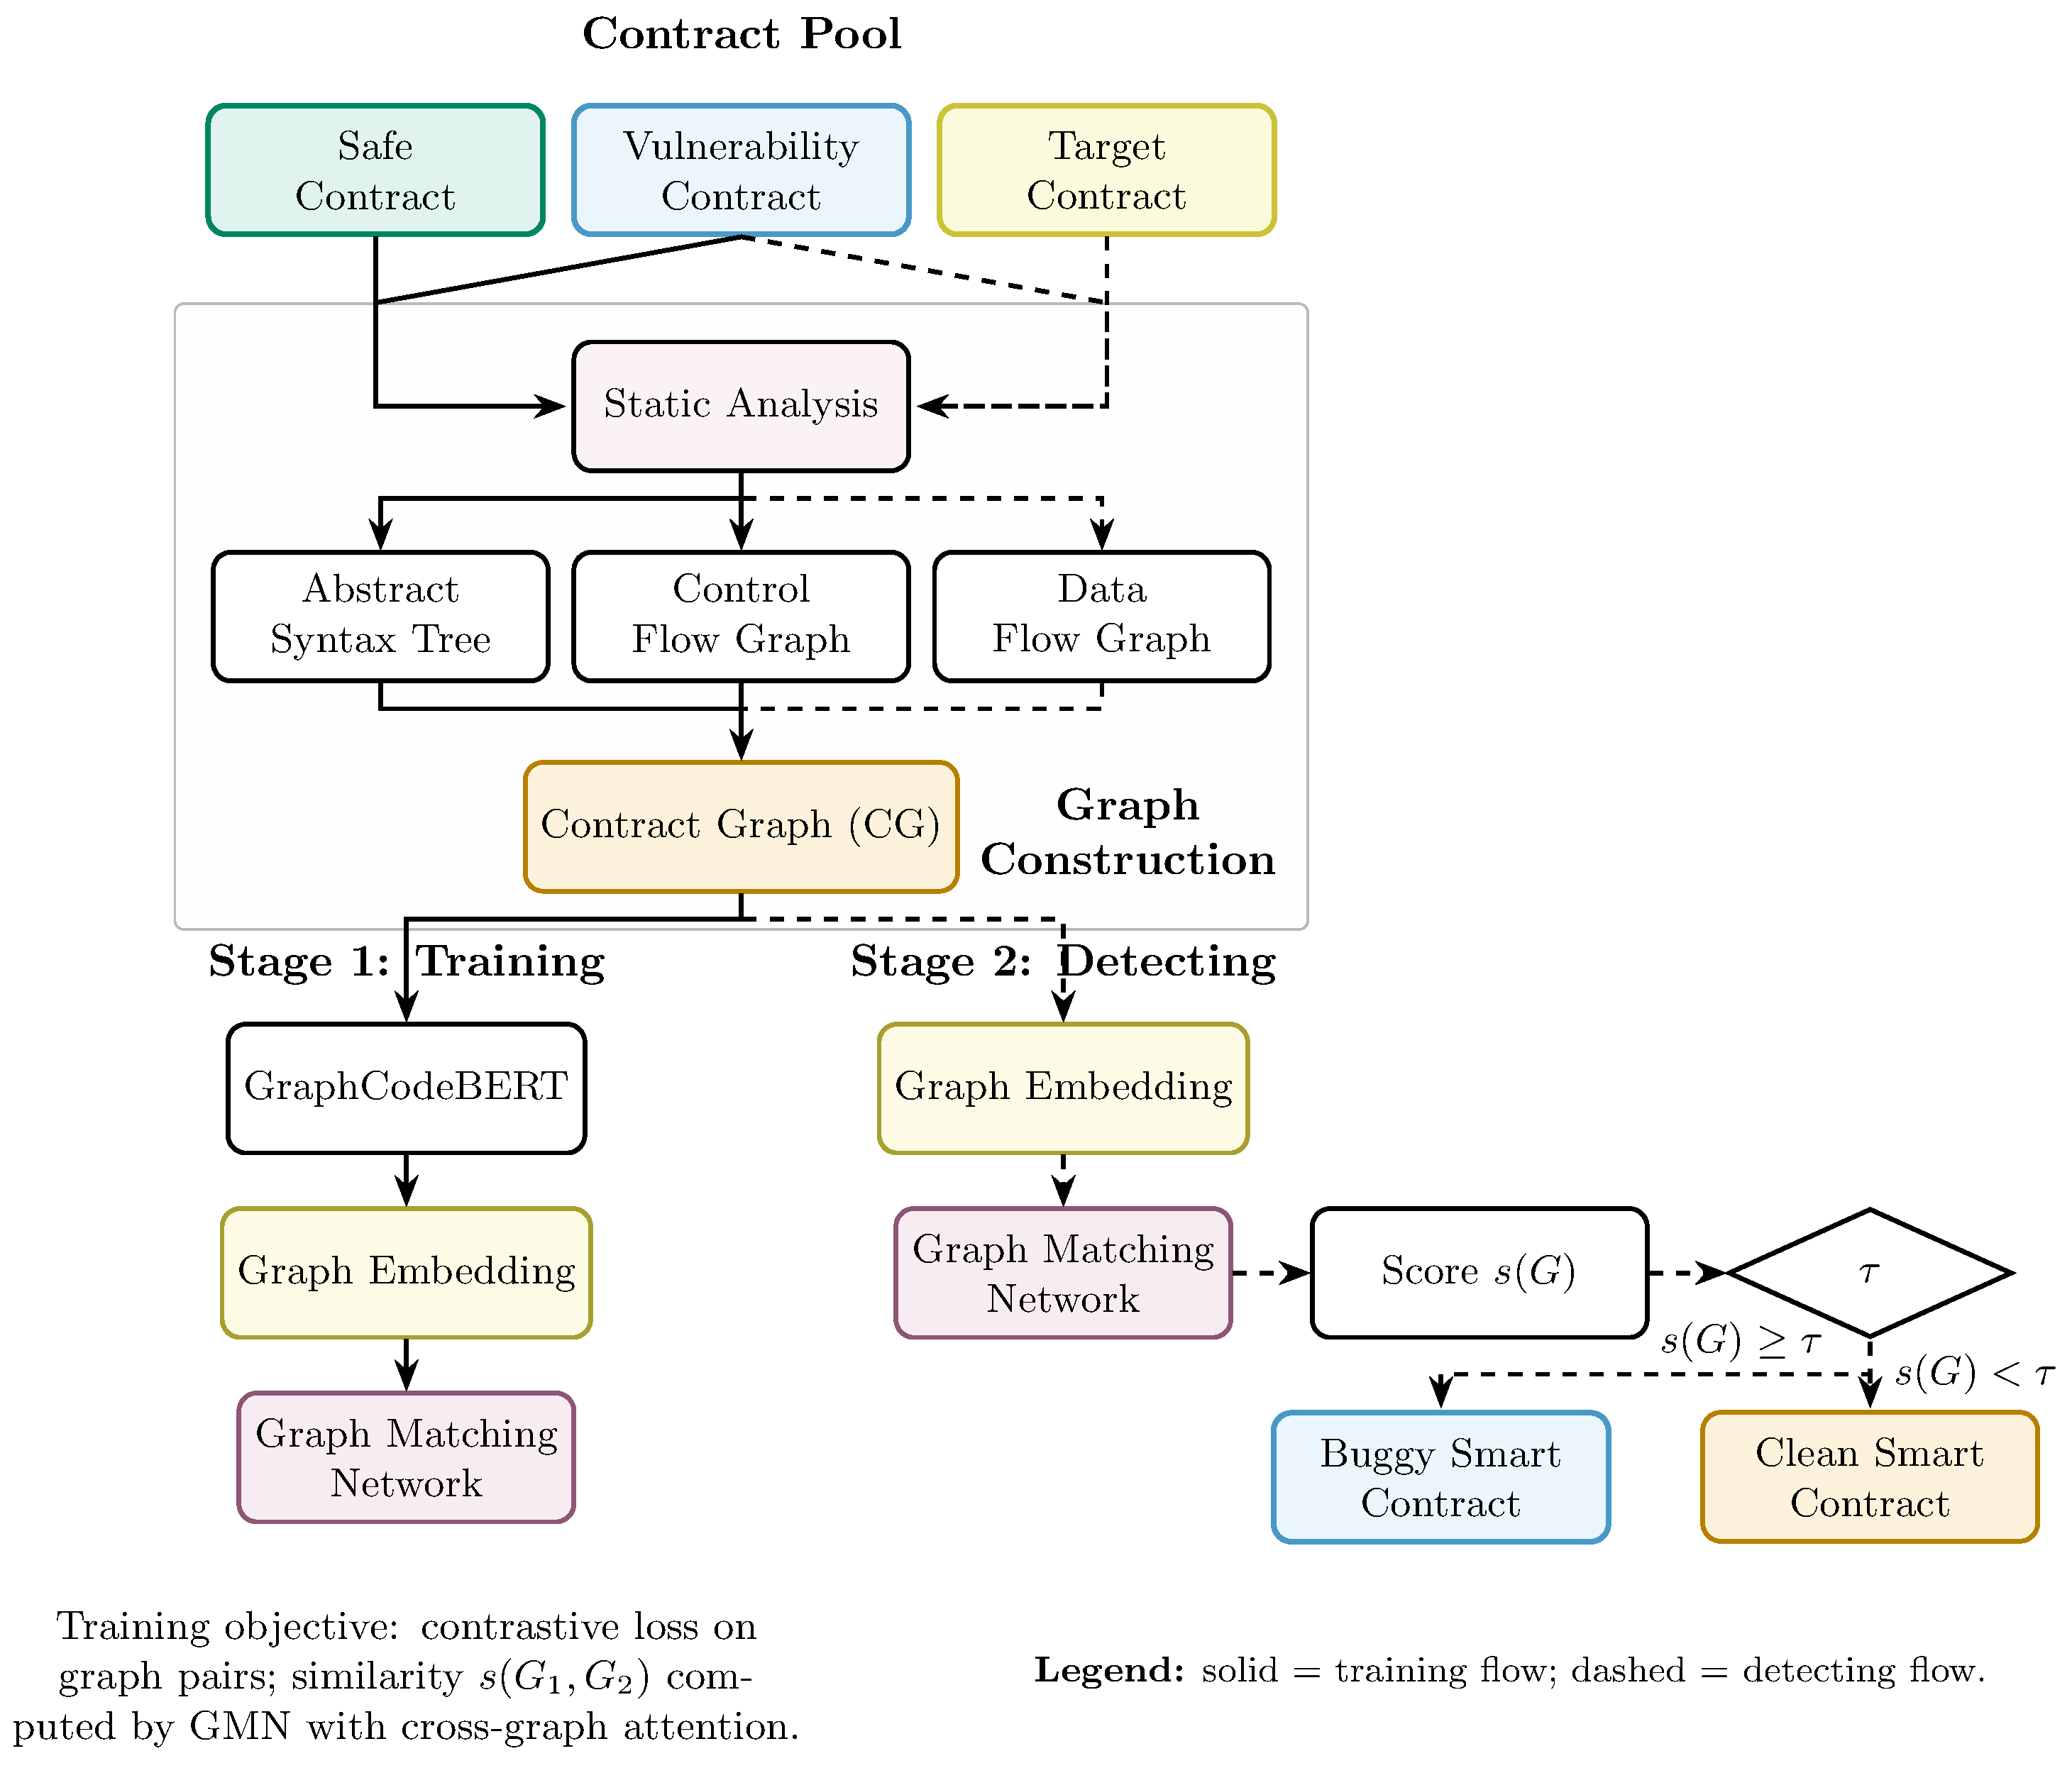
Figure 3.
Cross-graph attention in the contract-graph matcher. The blue nodes represent a subgraph with edges ; the red nodes represent a subgraph with edges . The drawn arrows from in to in indicate attention.
Figure 3.
Cross-graph attention in the contract-graph matcher. The blue nodes represent a subgraph with edges ; the red nodes represent a subgraph with edges . The drawn arrows from in to in indicate attention.
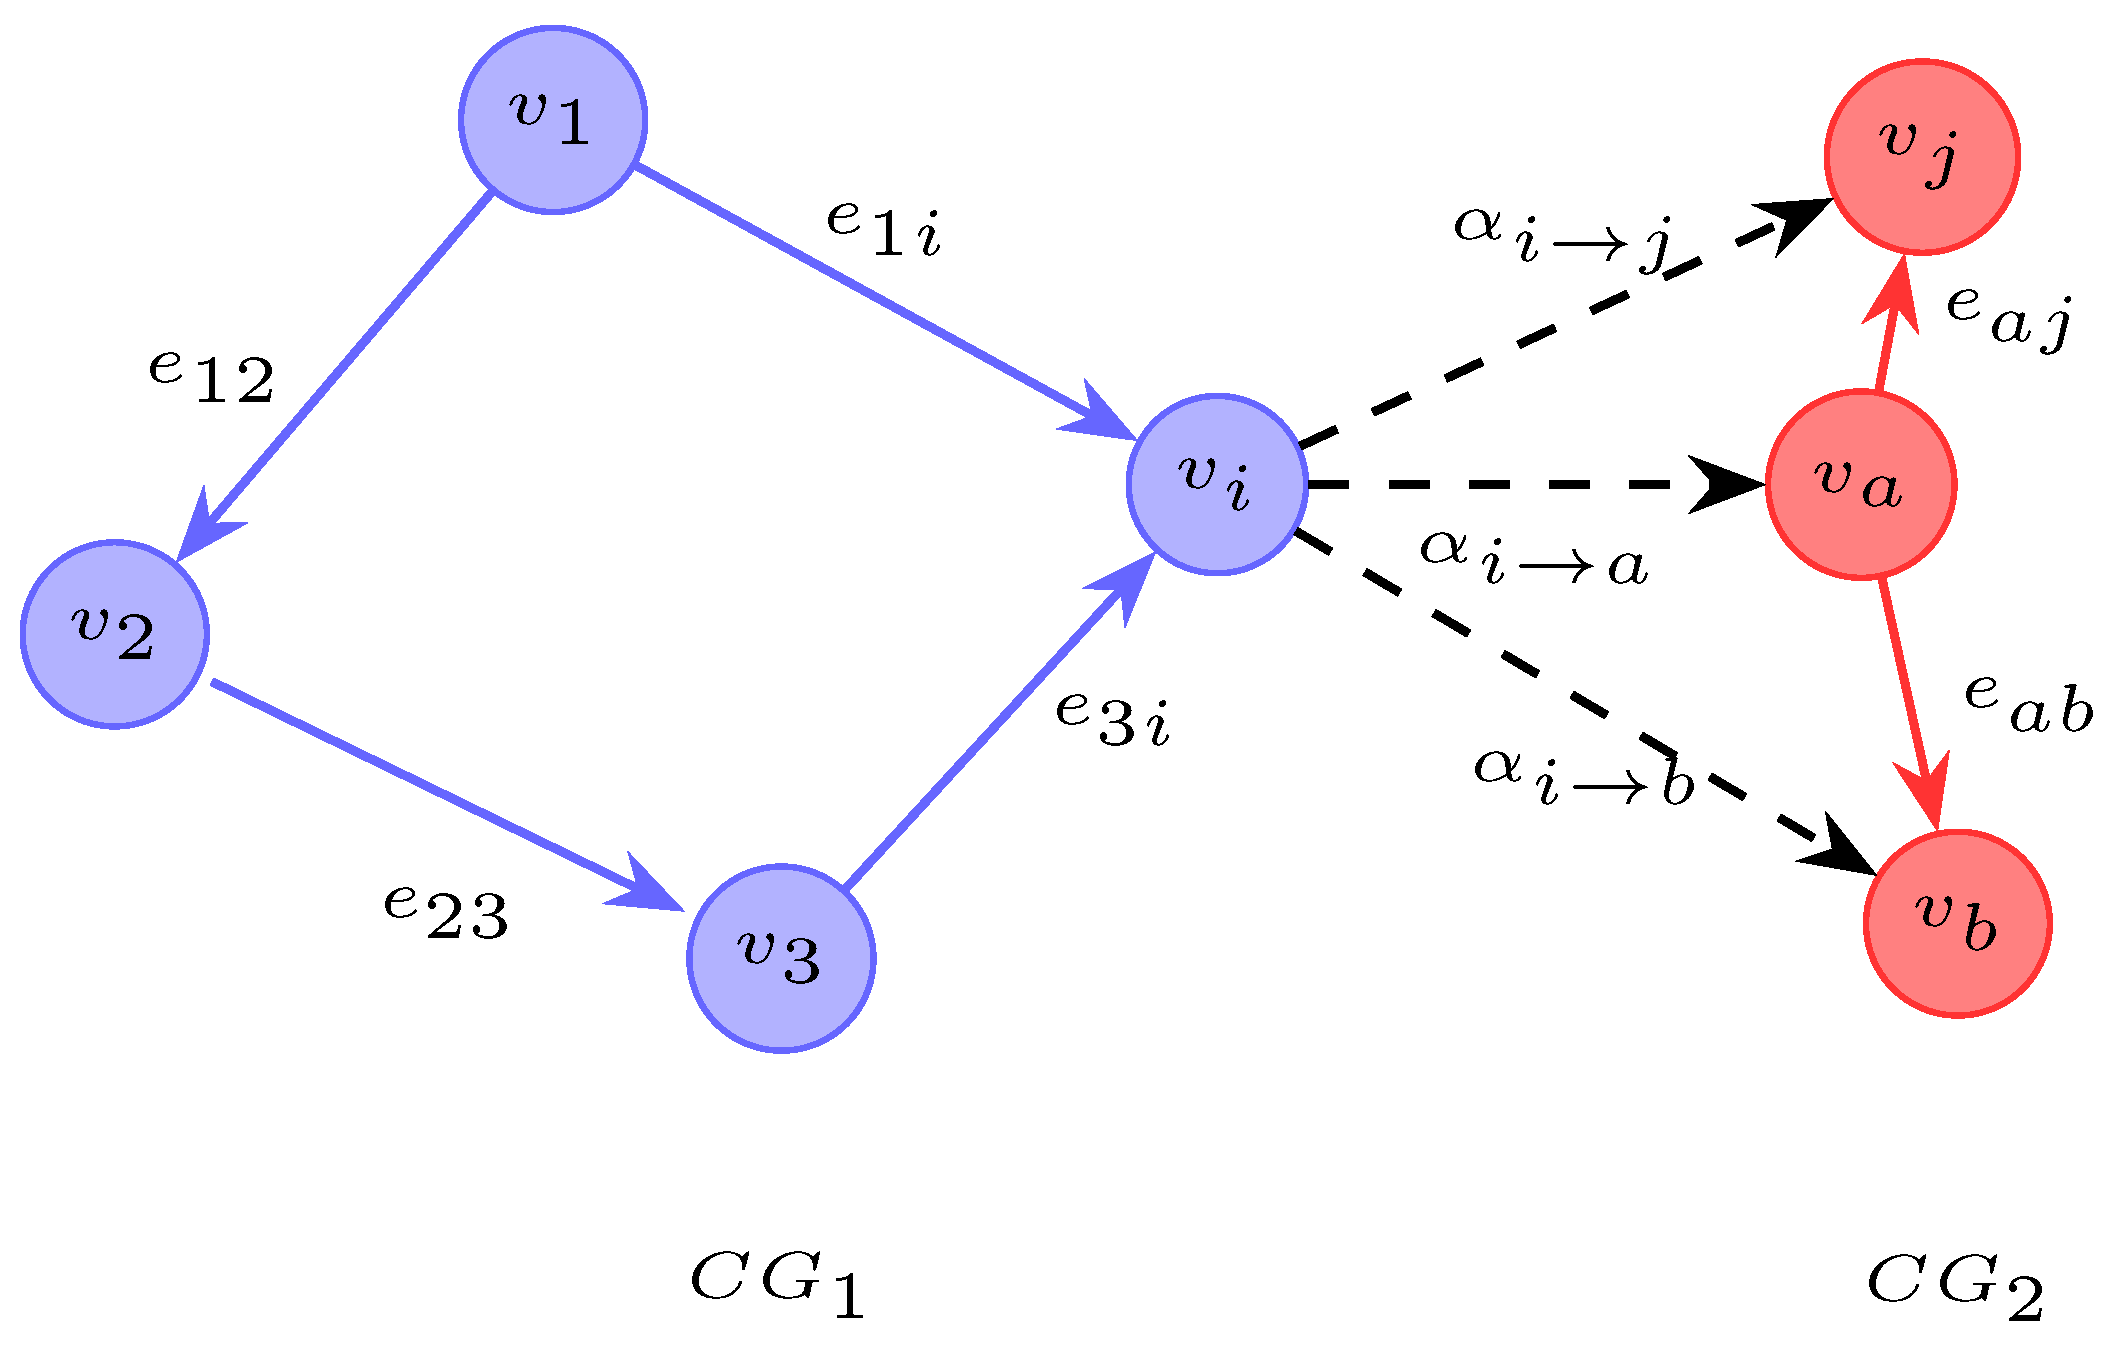
Figure 4.
Class-wise low FPR sensitivity (lower limit) at prevalence . The ordinate is the average normalized TPR (%) above . The vertical stripes mark .
Figure 4.
Class-wise low FPR sensitivity (lower limit) at prevalence . The ordinate is the average normalized TPR (%) above . The vertical stripes mark .
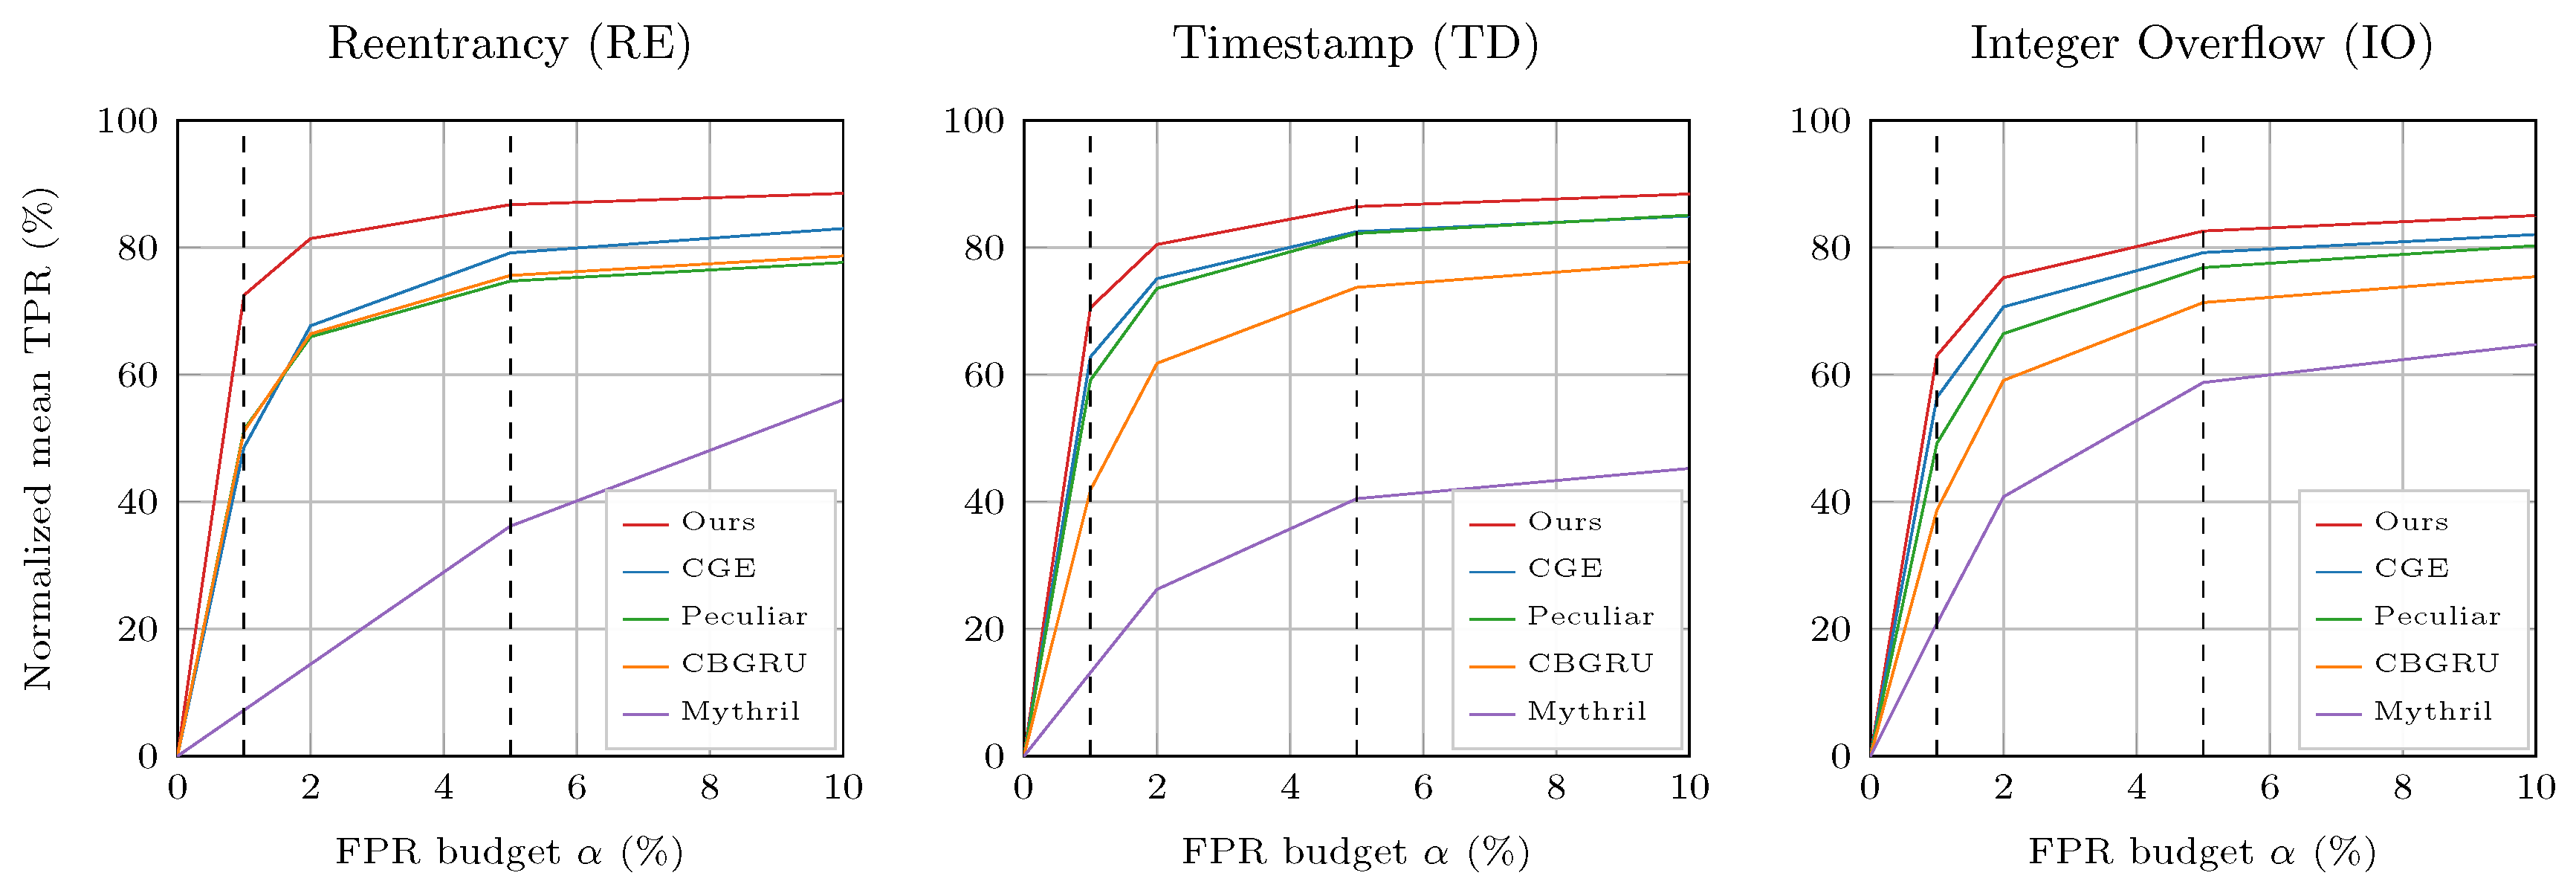
Figure 5.
Bars represent . Hollow circles and squares indicate recall and precision. The proposed method is consistently rightmost with aligned markers.
Figure 5.
Bars represent . Hollow circles and squares indicate recall and precision. The proposed method is consistently rightmost with aligned markers.
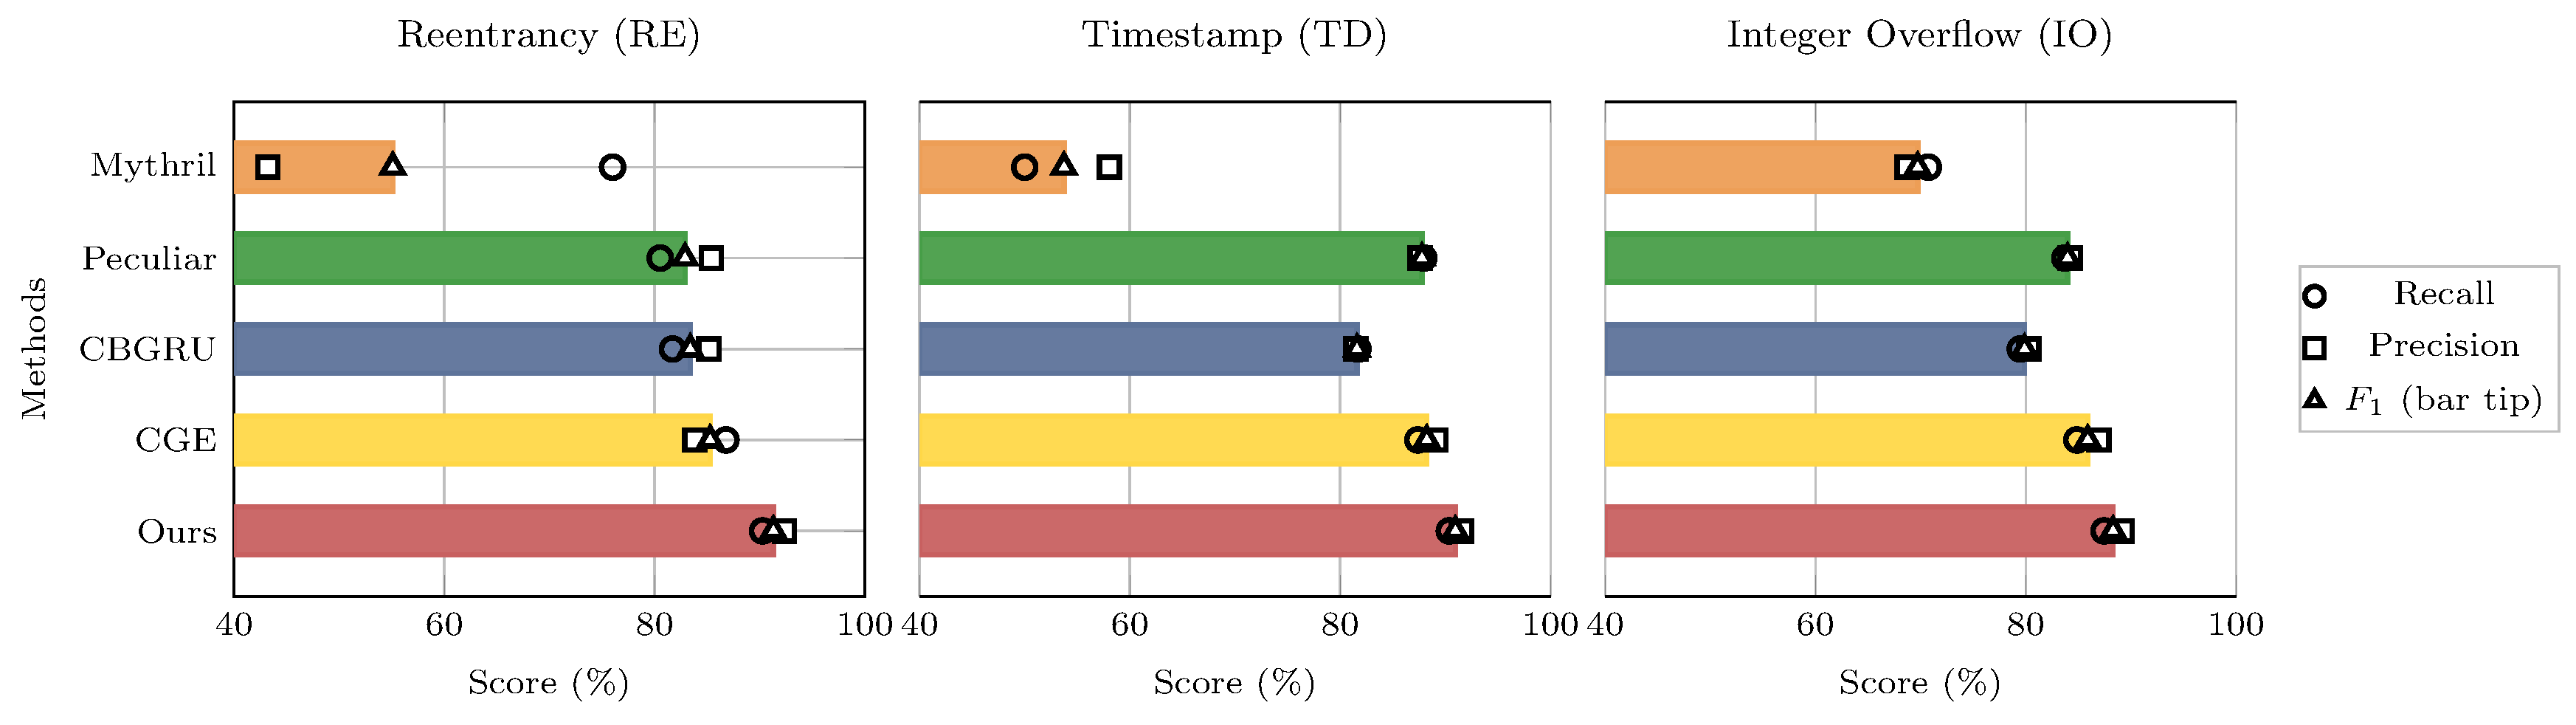

Table 1.
Detection results by method. Columns 2-13 report per-class recall (R), precision (P), and for Reentrancy, Timestamp, and Integer Overflow, with macro-averaged (cols. 11–13). The three right-hand columns show the /FM class calculated from .
Table 1.
Detection results by method. Columns 2-13 report per-class recall (R), precision (P), and for Reentrancy, Timestamp, and Integer Overflow, with macro-averaged (cols. 11–13). The three right-hand columns show the /FM class calculated from .
| Methods | Reentrancy | Timestamp | Integer Overflow | Macro Avg | /FM | ||||||||||||||
| R | P | R | P | R | P | R | P | RE | TD | IO | |||||||||
| sFuzz | 13.99 | 10.71 | 12.13 | 28.05 | 24.73 | 26.29 | 25.66 | 27.70 | 26.64 | 22.57 | 21.05 | 21.69 | 13.18/12.24 | 27.32/26.34 | 26.04/26.66 | ||||
| SmartCheck | 17.24 | 46.86 | 25.21 | 78.81 | 47.65 | 59.39 | 69.79 | 41.35 | 51.93 | 55.28 | 45.29 | 45.51 | 19.73/28.42 | 69.69/61.28 | 61.35/53.72 | ||||
| Osiris | 62.82 | 39.91 | 48.81 | 53.65 | 59.85 | 56.58 | 61.33 | 41.79 | 49.71 | 59.27 | 47.18 | 51.70 | 56.35/50.07 | 54.79/56.67 | 56.09/50.63 | ||||
| Oyente | 63.20 | 45.08 | 52.62 | 57.01 | 59.17 | 58.07 | 58.13 | 58.53 | 58.33 | 69.45 | 54.26 | 56.34 | 58.50/53.38 | 57.43/58.08 | 58.21/58.33 | ||||
| Mythril | 76.00 | 43.22 | 55.10 | 50.00 | 58.05 | 53.73 | 70.73 | 68.73 | 69.72 | 65.58 | 56.67 | 59.52 | 65.99/57.31 | 51.43/53.87 | 70.32/69.72 | ||||
| LineVul | 72.84 | 83.57 | 77.84 | 65.80 | 88.90 | 75.63 | 73.42 | 75.45 | 74.42 | 70.69 | 82.64 | 75.96 | 74.76/78.02 | 69.41/76.48 | 73.82/74.43 | ||||
| GCN | 74.37 | 73.70 | 74.03 | 79.25 | 74.03 | 76.55 | 71.02 | 68.61 | 69.79 | 74.88 | 72.11 | 73.46 | 74.24/74.03 | 78.15/76.60 | 70.52/69.80 | ||||
| TMP | 76.16 | 76.26 | 76.21 | 74.52 | 78.36 | 76.39 | 68.58 | 71.62 | 70.07 | 73.09 | 75.41 | 74.22 | 76.18/76.21 | 75.26/76.42 | 69.17/70.08 | ||||
| AME | 79.71 | 81.31 | 80.50 | 82.24 | 80.98 | 81.61 | 69.48 | 71.75 | 70.60 | 77.14 | 78.01 | 77.57 | 80.02/80.51 | 81.98/81.61 | 69.92/70.61 | ||||
| Peculiar | 80.53 | 85.39 | 82.89 | 87.94 | 87.60 | 87.77 | 83.72 | 84.23 | 83.97 | 84.06 | 85.74 | 84.88 | 81.46/82.92 | 87.87/87.77 | 83.82/83.97 | ||||
| CBGRU | 81.70 | 85.16 | 83.39 | 81.68 | 81.51 | 81.59 | 79.48 | 80.29 | 79.88 | 80.95 | 82.32 | 81.62 | 82.37/83.41 | 81.65/81.59 | 79.64/79.88 | ||||
| CGE | 86.78 | 83.83 | 85.28 | 87.39 | 89.09 | 88.23 | 84.86 | 86.95 | 85.89 | 86.34 | 86.62 | 86.47 | 86.17/85.29 | 87.72/88.24 | 85.27/85.90 | ||||
| Proposed | 90.27 | 92.34 | 91.29 | 90.38 | 91.54 | 90.95 | 87.45 | 89.17 | 88.30 | 89.37 | 91.02 | 90.18 | 90.68/91.30 | 90.61/90.96 | 87.79/88.31 | ||||
Table 2.
Single-view inputs and ablations on three vulnerabilities.
| Methods | Reentrancy | Timestamp | Integer Overflow | ||||||||
| R(%) | P(%) | (%) | R(%) | P(%) | (%) | R(%) | P(%) | (%) | |||
| AST-only | 82.19 | 86.23 | 84.16 | 82.47 | 85.68 | 84.04 | 80.34 | 83.75 | 82.00 | ||
| CFG-only | 83.45 | 86.78 | 85.08 | 83.19 | 85.27 | 84.22 | 81.27 | 83.53 | 82.39 | ||
| DFG-only | 84.56 | 88.34 | 86.41 | 84.34 | 87.12 | 85.71 | 82.14 | 85.22 | 83.65 | ||
| Proposed (DFG only) | 84.56 | 88.34 | 86.41 | 84.34 | 87.12 | 85.71 | 82.14 | 85.22 | 83.65 | ||
| Proposed (no pretrained encoder) | 80.58 | 85.12 | 82.78 | 81.22 | 85.89 | 83.49 | 79.34 | 83.62 | 81.42 | ||
| Proposed (no matcher) | 82.19 | 83.45 | 82.82 | 82.67 | 84.23 | 83.44 | 81.48 | 82.27 | 81.87 | ||
| Proposed (full) | 90.27 | 92.34 | 91.29 | 90.38 | 91.54 | 90.95 | 87.45 | 89.17 | 88.30 | ||
Notation: “no pretrained encoder” removes the pretrained code encoder; “no matcher” removes cross-graph matching.
Disclaimer/Publisher’s Note: The statements, opinions and data contained in all publications are solely those of the individual author(s) and contributor(s) and not of MDPI and/or the editor(s). MDPI and/or the editor(s) disclaim responsibility for any injury to people or property resulting from any ideas, methods, instructions or products referred to in the content. |
© 2025 by the authors. Licensee MDPI, Basel, Switzerland. This article is an open access article distributed under the terms and conditions of the Creative Commons Attribution (CC BY) license (http://creativecommons.org/licenses/by/4.0/).
Copyright: This open access article is published under a Creative Commons CC BY 4.0 license, which permit the free download, distribution, and reuse, provided that the author and preprint are cited in any reuse.


