
Submitted:
09 September 2025
Posted:
10 September 2025
You are already at the latest version
Abstract
Background: Multi-sensor fusion can improve daily stress monitoring. Methods: A wrist-worn device includes a system of the Galvanic Skin Response (GSR), PPG-derived Heart Rate Variability (HRV), skin temperature, and SpO₂, paired with self-reported questionnaires. The device streams data to a mobile app over Bluetooth Low Energy and updates the UI within 1-2 seconds. The physiological features are taken within a fixed window around each questionnaire time and performs a mid-level fusion; late fusion is also evaluated with self-reports. Results: Against a commercial reference device, AwareOne achieved a mean absolute error of 0.23 for SpO₂ and 4.94 for BPM in a one-day benchmark session. The system was validated through a technical evaluation using representative inputs and simulated survey labels. A Support Vector Machine algorithm reached a mean squared error of 0.08 on stress prediction. Temperature showed to have the strongest correlation with simulated stress levels at −0.43, followed by Heart Rate Variability (HRV) at 0.36, while SpO₂ had negligible correlation at 0.09 in the current dataset. Conclusion: The system integrates multi-sensing, on device preprocessing, BLE transmission, and a clear fusion workflow that creates a useful predictive performance of daily stress monitoring.
Keywords:
multi-sensor fusion
; galvanic skin response
; heart rate variability
; skin temperature
; SpO₂
; Bluetooth Low Energy
; time alignment
; questionnaires
; wearables
; stress monitoring
; late fusion
; mid-level fusion
1. Introduction & Background
Due to the many responsibilities and obligations placed upon students, university life can often be described as a time of great stress. Students face academic pressure from exams and assignments, along with grade maintenance. Some students face challenges with relocating and adapting to a new environment, adjusting to new social norms, and forming new connections. Lifestyle changes in food, exercise, sleep patterns, and time management can add strain. Additionally, financial pressures such as student loans, tuition costs, and part-time employment may be a significant burden. More than 80% of students have said that they experience stress during their academic careers [1]. There has been a 30% increase in mental health conditions such as anxiety and depression among university students over the past decade [2], and 25% of dropouts due to mental health were reported in 2022 [1].
Stress may affect various aspects of life which is why it is imperative to monitor and control it. Academic performance within university students may decline as cognitive function, memory, and decision-making are impaired [3]. Not only is mental health impacted, but stress has a substantial impact on physical health as well, including a weakened immune system, sleep disorders, and in severe cases cardiovascular problems [3]. Between negative academic and physical effects, stress diminishes overall well-being, often leading to burn-out, a lower quality of life, and ineffective coping mechanisms. Early detection of stress allows for better management which is essential to mitigate these harmful effects.
Traditional methods for monitoring stress involve self-report questionnaires and surveys. These techniques often fall short for accuracy as they rely on subjective input. Surveys such as the Perceived Stress Scale (PSS), Generalized Anxiety Disorder assessment (GAD-7), and Patient Health Questionnaire (PHQ-9) are commonly used, yet these surveys alone can underreport and are subject to bias.
Stress triggers many physiological responses as it activates the body’s fight or flight response. To address the limitations of self-report, this work combines standardized assessments with physiological data from a wrist-worn device that measures heart rate variability, Galvanic Skin Response (GSR), body temperature, and blood oxygen levels in a non-invasive and continuous manner to enable proactive monitoring and earlier management of stress.
2. Materials and Methods
2.0. Ethics Disclaimer
No identifiable human-subjects data was collected; the data collected was all simulated/self-test data for algorithm validation only. As such, Research Ethics Board (REB) approval was not required.
2.1. Device Hardware and Architecture
The wearable device sits comfortably on the wrist, consisting of a Galvanic Skin Response, PPG, body temperature, and blood oxygen sensor which measure the physiological biomarkers of stress in a non-invasive and continuous manner. The device is designed for comfort and long-term wear. The system includes a mobile platform application which data is streamed to with BLE and then processed and visualized.
Galvanic Skin Response (GSR) front end. Advances in biosensing have focused on leveraging and using gold and graphene as the sensing materials for Galvanic Skin Response (GSR) due to their superior electrical properties, biocompatibility, and mechanical properties. A gold and graphene mixture combined in a three-electrode electrochemical system with the working and counter electrode being the gold and graphene mixture, and the reference electrode being a silver or silver chloride [4]. The gold and graphene mixture is sensitive to changes in the skin’s moisture therefore it can detect minor electrochemical fluctuations due to ion concentration shifts [5]. The working electrode will detect these changes, the reference electrode provides a stable potential reference, and the counter electrode completes the circuit by accepting the current from the working electrode through the skin [5]. The potential between the working and reference electrode is held at a constant, and the current between the working and counter electrodes are monitored and measured, reflecting the skin’s conductance.
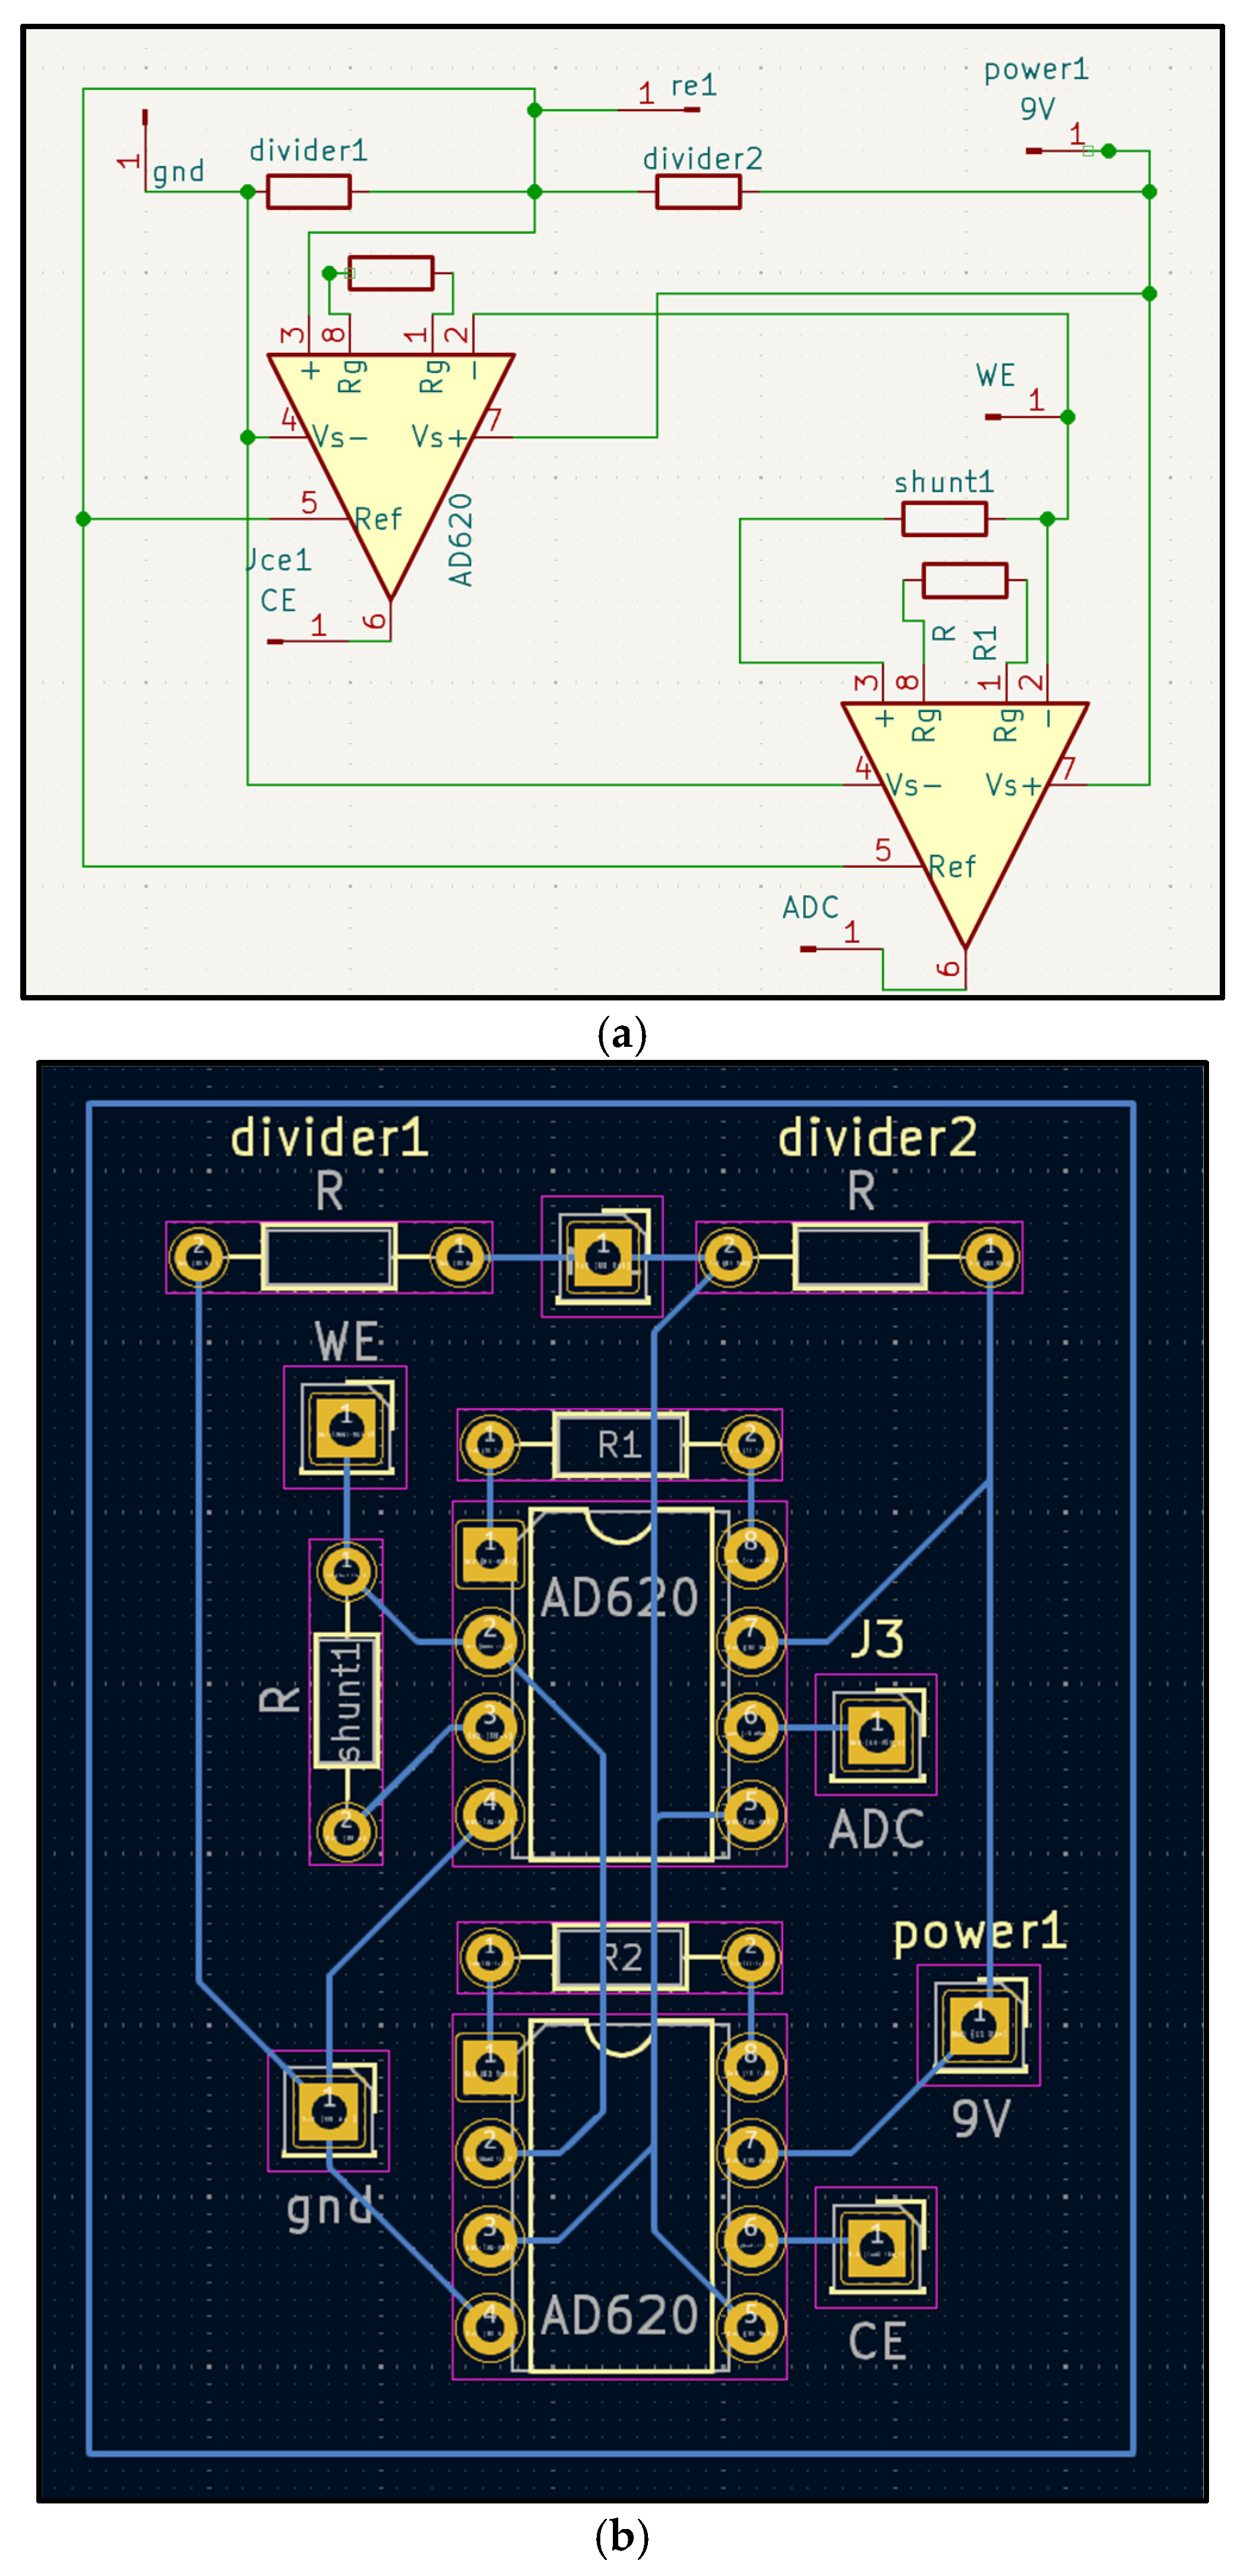
Figure 1.
a-b. Three-electrode Galvanic Skin Response (GRS) front-end. (a) Schematic showing working and counter electrodes (gold–graphene), and the reference electrode (Ag/AgCl). (b) One-layer PCB layout with component labels. The circuit holds a constant potential between working and reference electrodes and measures current through the counter electrode as a proxy for skin conductance.
PPG and SpO2 module. The Photoplethysmography (PPG) sensor on the wrist records green and infrared reflectance to estimate the inter-beat intervals for the Heart Rate Variability (HRV) and to compute the SpO2.
Skin-temperature module. A contact sensor was created using a thermo resistor to measure the wrist-surface temperature for slow-varying changes (Figure 2a,b).
All sensors are connected to the Analog-to-Digital Converters (ADC) on the MCU through their respective front ends (Figure 3). The MCU filters and buffers the data before streaming it over BLE. The MCU also manages the duty cycle and sampling rates to reduce power while preserving signal, and aligns the sensor windows with the self-reports for downstreaming analysis.
2.2. Sensor and Acquisition
Stress triggers many physiological responses as it activates the body’s fight or flight response. These physiological biomarkers such as Galvanic Skin Response, heart rate variability, body temperature, and blood oxygen levels can be objectively measured. The non-invasive measurement of these biomarkers allow for them to be monitored continuously and provide insights to the body’s response to stress.
2.2.1. Galvanic Skin Response
The Galvanic Skin Response, also referred to as the skin’s electrodermal activity, measures the changes in the skin’s electrical conductance [4]. The skin’s electrical conductance varies with the body’s sweat gland activity which is regulated by the sympathetic nervous system [6,7]. When the body and mind are under stress, typically the sympathetic nervous system is activated leading to increased sweating even in miniscule amounts, altering the skin’s conductance. Galvanic Skin Response (GSR) is a reliable, non-invasive biomarker for stress detection. Galvanic Skin Response (GSR) is often combined with heart rate and body temperature monitoring for enhanced accuracy and monitoring. Studies have shown under stressed scenarios, participants’ Galvanic Skin Response (GSR) increase by 100 to 400 percent [8,9]. Resting Galvanic Skin Response (GSR)s measured to be around 0.9 to 1.1 μS (microsiemens) and under cognitive stress tasks and timed math problems and audio interference, the participants’ Galvanic Skin Response (GSR)s increased to 3.2 μS average and 2.5 to 4 μS [8,9].
2.2.2. Heart Rate Variability
Heart Rate Variability (HRV) refers to the variations in time between consecutive heartbeats, measured by the R-R or N-N intervals, which are regulated by the autonomic nervous system. Heart Rate Variability (HRV) reflects the dynamic relationship between the parasympathetic rest and digest and sympathetic fight or flight systems [6]. When stress is induced on the body, the sympathetic nervous system activity increases, whereas the parasympathetic activity is suppressed, reducing Heart Rate Variability (HRV) [6]. In the time domain, Heart Rate Variability (HRV) can be measured using the standard deviation of NN intervals and the root mean square of successive differences]. Acute stress-induced scenarios can reduce an individual’s SDNN by 20 to 30 percent and RMSSD by up to 40 percent, whereas chronic stress can lead to consistent reductions exceeding 25 percent [10,11].
2.2.3. Skin Temperature
The body’s thermoregulation can be altered due to stress, causing it to increase subtly. Since stress activates the sympathetic nervous system, it influences vasodilation and metabolic heat production as well [12]. Though core temperature can rise slightly due to blood flow redistribution, peripheral skin temperature actually decreases during acute stress [8]. Vasoconstriction at the wrist during a stress event may lead to a drop of 1 to 3 °C [9]. The body prioritizes the thermal regulation of the core, which causes the decrease in peripheral temperature [8].
2.2.4. Blood Oxygen Saturation
An individual’s blood oxygen levels are determined by respiratory patterns. Stress may alter respiratory patterns due to hyperventilation or shallow breathing, which can be experienced during stressful events [13]. Hyperventilation and shallow breathing lead to reduced oxygen exchange efficiency, which then lowers blood oxygen saturation [13]. Changes in blood oxygen levels are evident in individuals who experience stress-induced anxiety or panic attacks [13].
2.3. Signal Processing Pipelines
The system implements a machine learning algorithm to successfully identify stress by processing and analyzing the physiological data and fusing it with the active data to improve accuracy. Raw signals are transformed into features suitable for modeling. For Heart Rate Variability (HRV) we use inter-beat intervals derived from the wrist PPG, and for Galvanic Skin Response (GSR), temperature, and SpO2 we use continuous time series collected on the wrist. Feature extraction and filtering steps are applied consistently across participants.
2.3.1. PPG Signal Filtration Process
DC Block Filter (High-Pass Filter). The first step in this filtering process is the DC block filter, also known as a high-pass filter. This filter is designed to remove the DC offset from the raw PPG signal. The DC component represents the steady part of light absorption, which comes from the constant tissue absorption, skin tone, or ambient light. It is not really used for heart rate or variability detection because it doesn’t carry pulsatile information. The filter uses a formula that subtracts the previous input and includes a weighted portion of the previous output, canceling out slow-changing values. the formula used is y[n] = x[n] - x[n-1] + a * y[n-1], where a is constant, 0.95, which controls how much of the previous output is retained. The result of this filter is a signal that contains the AC component, which is the actual heartbeat waveform.
Low-Pass Filter. After removing the DC offset, the signal still contains high-frequency noise, such as electrical interference, sensor jitter, or irrelevant signal fluctuations. The output of the DC block filter is passed through a low-pass filter, which smooths out the signal by averaging it over time. It retains slow, meaningful changes and discards rapid and irrelevant changes. The formula for this filter is y[n] = y[n-1] + a * (x[n] - y[n-1]), where a is constant, 0.1, that shows how responsive the smoothing is. A smaller one results in heavier smoothing. The output of this step is a clean, smooth waveform that shows the pulsatile signal with minimal noise.
Combined Filtering (filter_sample Function). Both filters are combined into a single method called filter_sample. When a raw sample is passed through the function, it first applies the DC block to remove the baseline drift, and then low-pass is applied to smooth the result. This two-step process makes sure that the output signal is both centered around zero (no DC) and free from jitter and high-frequency noise. The resulting filtered signal is ideal for detecting heartbeats accurately and consistently. This clean signal is used downstream for detecting peaks, calculating inter-beat intervals (IBIs), estimating heart rate (BPM), heart rate variability (Heart Rate Variability (HRV)), and even computing SpO2 based on the red and infrared signal components.
2.4. Firmware and BLE Protocol
The system includes a mobile platform application which serves as the user-interface. The application will prompt users to answer the mental health assessment surveys, displaying their real-time stress metrics, trends, and wellness scores. The device communicates sensor readings to the application for storage and visualization. The application links each survey response to the surrounding sensor data window for later analysis.
2.5. Data Fusion Strategy
Traditional methods for monitoring stress involve self-report questionnaires and surveys. These techniques often fall short for accuracy as they rely on subjective input. The system combines and incorporates data collected from the standardized mental health assessment with the physiological data captured from the wearable device, such as heart rate variability, Galvanic Skin Response, body temperature, and blood oxygen levels. The system implements a machine learning algorithm to successfully identify stress by processing and analyzing the physiological data and fusing it with the active data to improve accuracy. We use a time-aligned approach that pairs each self-report with the surrounding passive window. For each self-report questionnaire submitted at time , a systematic window is formed [] with minutes. For each window, the features for Heart Rate Variability (HRV), Galvanic Skin Response (GSR), skin temperature, and SpO2 are computed. The self-report at provides a label for that window. Mid-level fusion includes mapping each modality to a compact embedding, concatenate embeddings, and fit to a regressor. Late fusion uses the self-reports and combines them with the physiological prediction using a weighted equation: , where is the normalized survey score, is the physiological prediction, and is the weight selected through cross validation.
Physiological features are concatenated for mid-level fusion, and self-report scores are combined with physiology using a simple weight to improve accuracy.
2.6. Power and Resource Optimization
The device is optimized for high compliance as well as long-term usability and durability. At rest, the PPG and Galvanic Skin Response (GSR) run for 60 seconds every 5 minutes. During the completion of the self- report, the sensors run for 120 seconds. The skin temperature is sampled at 1 Hz continuously given its dynamics. The PPG is sampled at 25 Hz, and the Galvanic Skin Response (GSR) has a sampling rate of 10Hz. The Heart Rate Variability (HRV) is computed from the 60-120 second segments to stabilize the metrics.
The BLE uses notifications with a connection interval of 60 to 90 ms, a slave latency of 3 to 5, and a supervision timeout of 4 to 6 seconds. The sampled data is batched into compact packets before transmission, maintaining around 1 to 2 seconds phone UI latency with a low average current.
2.7. Questionnaires and Labeling
This work uses publicly available surveys frameworks, such as the Perceived Stress Scale (PSS), Generalized Anxiety Disorder Assessment (GAD-7), and Patient Health Questionnaire-9 (PHQ-9), to generate simulated labels for evaluating our algorithm’s performance. These frameworks are a standardized tool used by doctors and clinicians to evaluate the psychological state. They were adapted and implemented here for a technical proof-of-concept study to test the alignments between the device features and subjective rating, not for clinical diagnosis. Because of the stigma associated with mental health, these self-reporting frameworks are prone to underreporting as due to social stigma or subjective bias [14,15]. For this reason, this technical evaluation adapted the framework as a means of simulating a labeled dataset for algorithm development.
Perceived Stress Scale (PSS). The PSS scale measures stress by presenting 10 questions that need to be scored on a 5-point Likert scale. For the daily assessment of stress this was narrowed down to 3 questions to promote daily completion. The scale ranges from 0 never, 1 almost never, 2 sometimes, 3 fairly often, and 4 very often. The score is calculated by summing up the points for each question, with a scoring range of 0 to 15. For the purposes of this study, the levels have been divided into the following categories: Minimal Stress 0 to 4, Mild Stress 4 to 8, Moderate Stress 8 to 12, Severe Stress 12 to 15. The PSS assessment has sensitivity rates ranging from 70 percent to 90 percent, with specificity rates between 75 percent and 85 percent, demonstrating good construct validity. Although the assessment is effective for tracking perceived stress and evaluating the need for intervention, it is not a diagnostic tool. [16]
Generalized Anxiety Disorder Assessment (GAD-7). The GAD-7 assessment is used to assess the severity of generalized anxiety. The assessment consists of 7 questions that are to be answered on the 4 point scale. For the daily assessment of anxiety, this was narrowed down to 3 questions to promote daily completion, as well as altered to be answered on a 5 point scale for consistency with assessing stress. The total score is calculated by summing up all the points from the questionnaire and dividing up the score into four categories: Minimal Anxiety 0 to 4, Mild Anxiety 4 to 8, Moderate Anxiety 8 to 12, Severe Anxiety 12 to 15. The sensitivity range for the GAD-7 assessment ranges from 76 percent to 89 percent with specificity rates between 82 percent and 95 percent. Although the GAD-7 assessment is not a diagnostic tool, it is effective in identifying and evaluating the symptoms of generalized anxiety. [17]
Patient Health Questionnaire-9 (PHQ-9). PHQ-9 is an assessment tool used to measure the severity of depressive symptoms. The assessment consists of 9 questions scored on a 4 point scale. For the daily assessment of depression, this was narrowed down to 3 questions to promote daily completion, as well as altered to be answered on a 5 point scale for consistency with assessing stress and anxiety. The total score is summed up and categorized in one of the following: Minimal Depression 0 to 3, Mild Depression 3 to 6, Moderate Depression 6 to 9, Severe Depression 9 to 12. The PHQ-9 assessment has a sensitivity rate of 88 percent and a specificity rate of 85 percent. The assessment is a valuable tool for clinicians to monitor patients that suffer from depression, but it should not be used as a diagnostic tool. [18]
Label binding. Each simulated label generated from the adapted questionnaire framework is used as a data point for the corresponding time period. These labels are then linked to the surrounding passive data for analysis.
3. Results
3.1. Sensor Benchmarks and Signal Quality
Against a commercial reference device, AwareOne achieved mean absolute error 0.23 for SpO2 and 4.94 for BPM in a one-day benchmark session, supporting basic physiological accuracy (Figure 4a,b).
The complete system was worn for a day and the values of the biometrics were tracked. Time-aligned overlays show close tracking of heart rate and oxygen saturation under rest and during brief activity. The data represent segments that illustrate with cohesive patterns and peaks during activity and rest throughout the day (Figure 5).
3.2. Wearability and Data Yield
The AwareOne and Galvanic Skin Response (GSR) device recorded a full day of physiological signals, demonstrating a stable and responsive performance. The SpO2 levels remained consistent throughout the day, reflecting stability in the readings aside from a minor dip in the early morning with a reading of 99.7%. Heart Rate (BPM) had shown its ability to take a variety of readings, consistent with the circadian arousal and physical activity. The systems Heart Rate Variability (HRV) exhibit some expected fluctuations, peaking at around 190ms early in the morning and dipping below 100 ms in the evening-potentially correlating with increased stress or fatigue as the day progressed. The system’s skin temperature ranged between 34.88°C and 36.6°C which is a healthy thermoregulation pattern, with a minor dip around 6pm then followed by a rise later in the evening. The Galvanic Skin Response (Galvanic Skin Response (GSR)), which is measured via voltage changes, ranges from 1.2V to 1.6V with the lower the voltage indicating higher arousal/stress, and high voltage indication relaxation. Comparing the Heart Rate Variability (HRV) readings and Galvanic Skin Response (GSR), it can be seen that there are some points throughout the day where the Heart Rate Variability (HRV) and voltage are both low, which illustrates expected autonomic trends, for example at 8am, and between 14:00 pm-16:00pm. Day-level coverage showed sustained collection. Figure 5 illustrates typical signal stability across HR, SpO2, temperature, and Galvanic Skin Response (GSR) during rest and light activity.
3.3. Fusion vs. Single-Sensor Performance
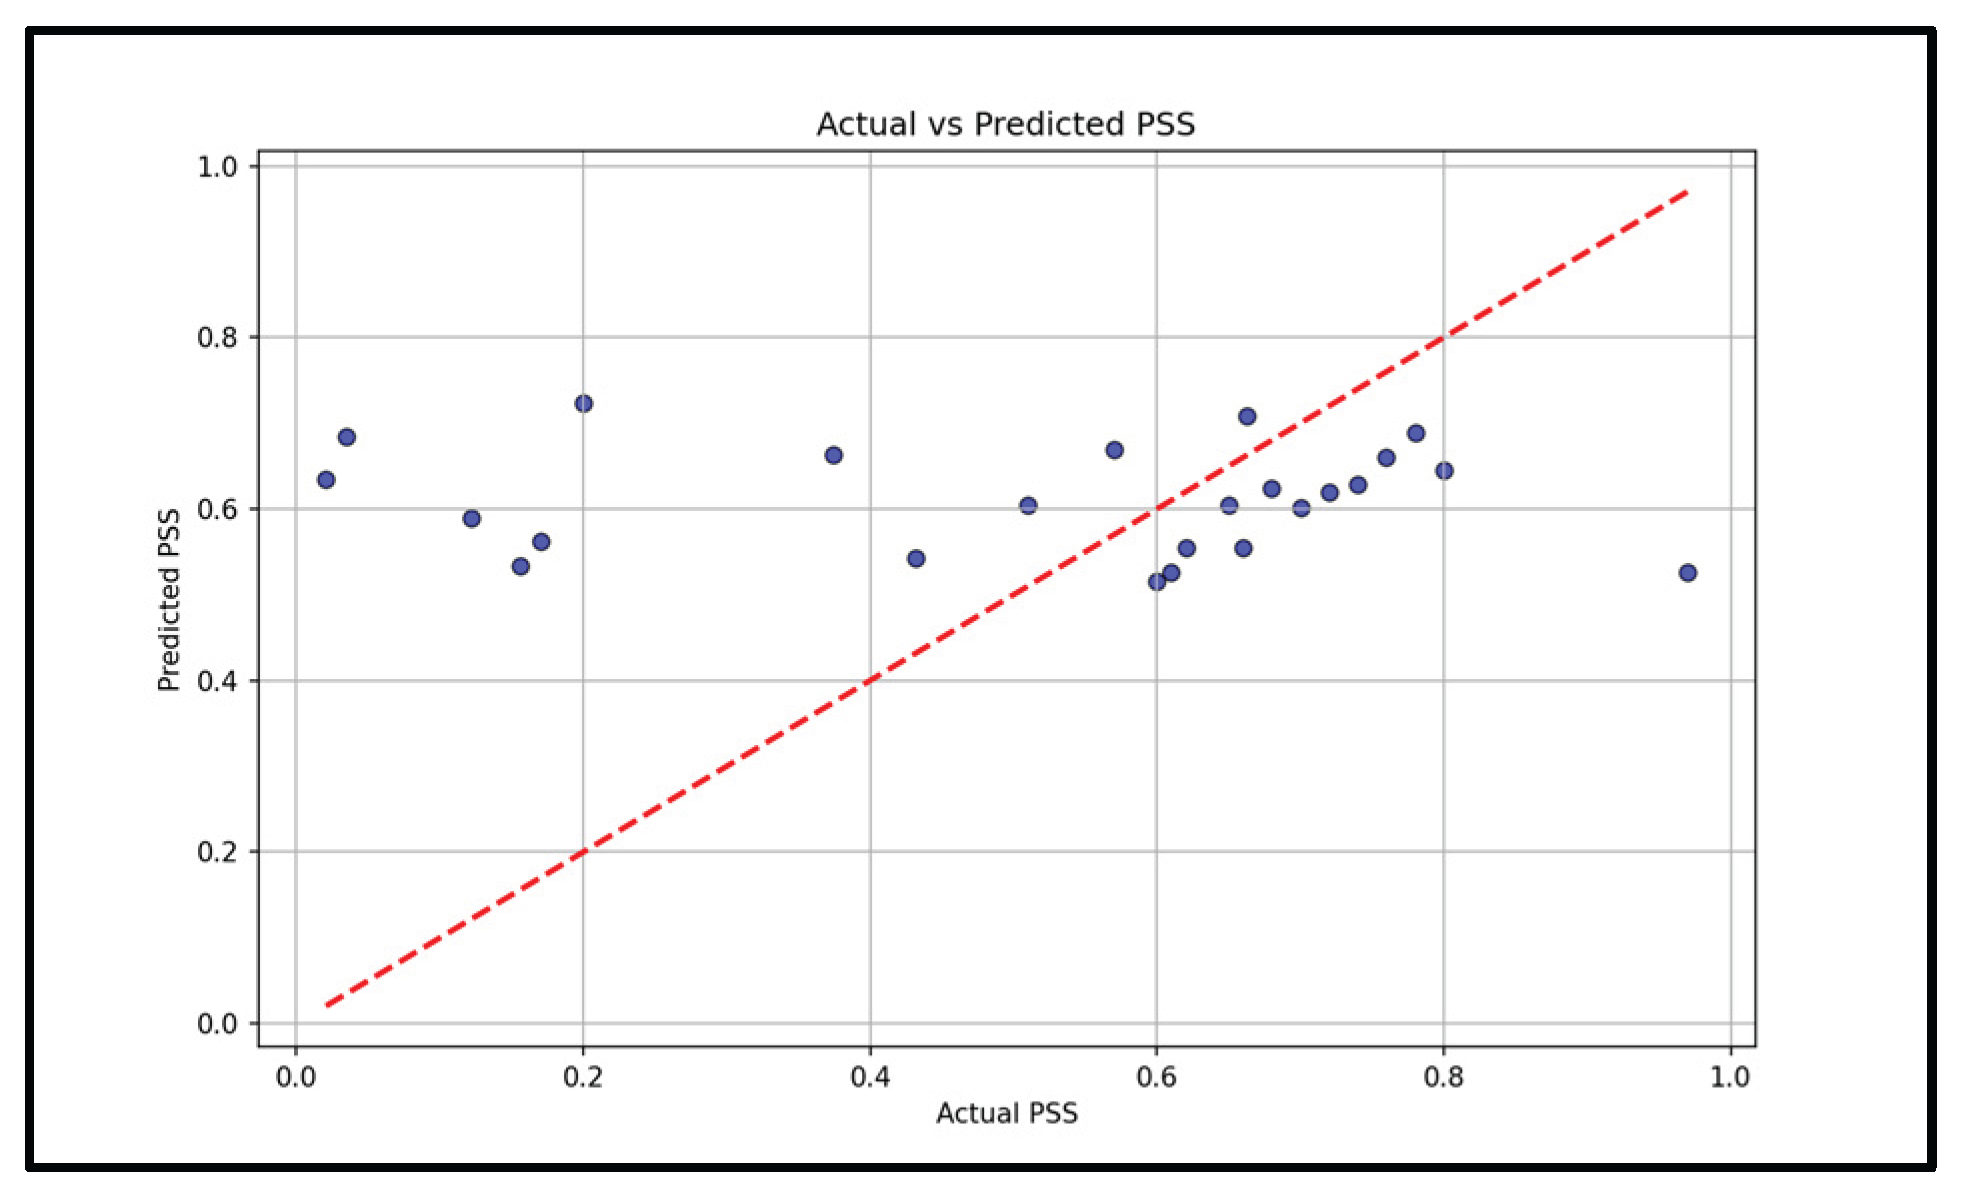
The system implements a machine learning algorithm to successfully identify stress by processing and analyzing the physiological data and fusing it with the active data to improve accuracy. In the current dataset, temperature showed the largest magnitude correlation with stress at −0.43, followed by Heart Rate Variability (HRV) at 0.36, while SpO2 had a small correlation at 0.09 (Figure 6). A Support Vector Machine reached mean squared error 0.08 on stress prediction (Figure 7). These results indicate that a fused model tracks simulated stress labels more consistently and accurately than single-sensor baselines. Having a multi-sensor model
4. Discussion
Stress triggers many physiological responses as it activates the body’s fight or flight response, and the non-invasive measurement of Galvanic Skin Response, heart rate variability, body temperature, and blood oxygen levels allows continuous monitoring that provides insights to the body’s response to stress. This work demonstrates the technical feasibility of integrating multi-sensor fusion with survey based labels for stress monitoring. This approach joins standardized survey frameworks passive wrist sensing to reduce gaps from either sources alone. This fusion approach, particularly with the late-fusion survey data, is shown to improve the models accuracy and robustness. The fused model reached a mean squared error of 0.08, while single-day benchmarks showed consistency with the commercial reference device for SpO2 and BPM measurements. Temperature had the strongest associates with simulated stress labels at -0.43, Heart Rate Variability (HRV) showed a moderate association at 0.36, and SpO2 showed a small association at 0.09. These trends align with the expected physiology where the peripheral temperature often drops during acute stress and Heart Rate Variability (HRV) changes with autonomic balance within the body [15,16,17,18,19,20,21].
Taken together, the signals indicate that a multi-model physiology provides complementary and strong information. While temperature and Heart Rate Variability (HRV) contribute most to the prediction, Galvanic Skin Response (GSR) and SpO2 contribute more as an optical quality than as primary stress markers. The mid-level fusion approaches allow for the encoders to learn appropriate scalings and nonlinearities of the features before concatenation. Late fusion with the self-reported questionnaires provides a simple advantage to incorporate user context when it is available, improving robustness as well when any single physiological feature/signal is compromised.
Within physiology, temperature only and Heart Rate Variability (HRV) only models each may lose accuracy relative to a mid-level fusion and can underperform. This suggests that Heart Rate Variability (HRV) and temperature data provide distinct and complementary data that the fused model can exploit. The correlation structure further supports this observation and will guide feature selection for future iterations.
Current and prior wrist systems typically rely only on Heart Rate Variability (HRV) and activity to measure stress, limiting the robustness when motion artifacts occur or when one single marker is compromised or non-specific. The mid-level fusion on our device with the Galvanic Skin Response (GSR), wrist temperature, SpO2, and Heart Rate Variability (HRV) integrates complementary modalities, and the last fusion of the survey base labels provides context. Commercial wearables, such as the Apple Watch and Fitbit, provide Heart Rate Variability (HRV) and its estimates, but do not sense Galvanic Skin Response (GSR) and they do not combine multi-model physiology with survey-based labels in a transparent fusion algorithm. The combination of the practical novelty of AwareOne in a wrist system.
This work has several limitations. First, the evaluation used self-reported surveys and simulated labels which limits generalizability. Second, the benchmark against commercial reference devices was conducted only over a single day, which does not capture the long-term drift or diverse conditions of sensor usability and wearability. Third, the correlations trends are exploratory and are/should not be interpreted as clinical findings. Future work will involve a larger-scale human subject validation under the appropriate ethical approval, including activity and posture normalization, and evaluate personalization strategies.
5. Conclusions
AwareOne integrates wrist-based physiology with mid-level fusions of sensors and late fusion with the survey based labels in a time-aligned workflow. Benchmarks showed closed agreement with the device against a commercial reference device for SpO2 and BPM in a one-day session. In the representative tests, the fused model achieved an MSE of 0.08 and highlighted temperature and Heart Rate Variability (HRV) as the most informative feature. The results support the feasibility of daily stress monitoring on a wrist system.
Informed Consent Statement
Not applicable
Data Availability Statement
Data supporting the findings of this study are available from the corresponding author on reasonable request.
Funding
This research received no external funding.
Conflicts of Interest
The authors declare no conflict of interest.
References
- American College Health Association, National College Health Assessment, 2023. [Online]. Available: https://www.acha.org/NCHA.
- World Health Organization, Mental Health of Students, 2022. [Online]. Available: https://www.who.int/mental_health_in_students.
- P. Corrigan, B. Druss, and D. Perlick, “The impact of mental illness stigma on seeking and participating in mental health care,” Psychological Science in the Public Interest, vol. 4, no. 2, pp. 81–104, 2003. [Online]. Available: https://journals.sagepub.com/doi/10.1111/1529-1006.00021. [CrossRef]
- A. Ahuja, A. Tiwari, A. Singh and A. Kushwaha, “Design and Implementation of a Wearable Device for Stress Detection Using IoT and Machine Learning,” Proceedings, vol. 81, no. 1, p. 12, 2025. [Online]. Available: https://www.mdpi.com/2673-4591/81/1/12.
- M. Hossain, Y. S. Lin, and A. K. Yetisen, “Laser-Induced Graphene Sensors for Electrochemical Sweat Analysis: A Review,” Sensors and Actuators B: Chemical, vol. 339, 2021.[Online].Available: https://www.sciencedirect.com/science/article/abs/pii/S1572665721007165.
- F. Shaffer and J. P. Ginsberg, “An overview of heart rate variability metrics and norms,” Frontiers in Public Health, vol. 5, pp. 1–17, 2017. [Online]. Available: https://www.frontiersin.org/articles/10.3389/fpubh.2017.00258/full. [CrossRef]
- A. Tyulepberdinova, R. Kadir, and F. Alieva, “Development of a wearable system for stress monitoring using IoT and machine learning,” International Journal of Innovative Research in Social Sciences, vol. 8, no. 1, pp. 599–612, 2025. [Online]. Available: https://ideas.repec.org/a/aac/ijirss/v8y2025i1p599-612id4406.html.
- Cambridge University Press, “Acute stress and temperature changes in peripheral and core body regions,” Psychological Medicine, vol. 50, no. 1, pp. 1–8, 2020. [Online]. Available: https://www.cambridge.org/core/journals/psychological-medicine.
- C. Young and J. Lightman, “Stress-induced thermoregulatory changes: A comprehensive review,” Journal of Stress Physiology & Biochemistry, vol. 7, no. 4, pp. 23–35, 2018. [Online]. Available: https://www.jspb.com/thermoregulation-stress.
- Q. Zhang, L. Zhou, and H. Zhang, “The effects of stress on thermoregulation and physiological responses,” Frontiers in Physiology, vol. 9, pp. 1–12, 2018. [Online]. Available: https://www.frontiersin.org/articles/10.3389/fphys.2018.00592/full.
- T. Ritz and A. Steptoe, “Physical activity and respiratory patterns during stress,” Psychophysiology, vol. 37, no. 4, pp. 464–473, 2000. [Online]. Available: https://onlinelibrary.wiley.com/doi/full/10.1111/1469-8986.3740464. [CrossRef]
- S. Cohen, T. Kamarck, and R. Mermelstein, “A global measure of perceived stress,” Journal of Health and Social Behavior, vol. 24, no. 4, pp. 385–396, 1983. [Online]. Available: https://journals.sagepub.com/doi/10.2307/2136404. [CrossRef]
- R. Spitzer, K. Kroenke, and J. Williams, “Validation and utility of a self-report measure for assessing generalized anxiety disorder: The GAD-7 scale,” Archives of Internal Medicine, vol. 166, no. 10, pp. 1092–1097, 2006. [Online]. Available: https://jamanetwork.com/journals/jamainternalmedicine/fullarticle/410326.
- C. Lee, “Perceived Stress Scale (PSS): Validity and implications in clinical practice,” International Journal of Behavioral Medicine, vol. 21, no. 3, pp. 306–314, 2014. [Online]. Available: https://link.springer.com/article/10.1007/s12529-013-9271-6.
- R. L. Spitzer, K. Kroenke, J. B. Williams, and B. Löwe, “A brief measure for assessing generalized anxiety disorder: the GAD-7,” Archives of Internal Medicine, vol. 166, no. 10, pp. 1092–1097, May 2006. [Online]. Available: https://jamanetwork.com/journals/jamainternalmedicine/fullarticle/410326.
- K. Kroenke, R. L. Spitzer, and J. B. W. Williams, “The PHQ-9: validity of a brief depression severity measure,” Journal of General Internal Medicine, vol. 16, no. 9, pp. 606–613, Sep. 2001. [Online]. Available: https://www.ncbi.nlm.nih.gov/pmc/articles/PMC1495268/.
Figure 2.
a-b. Wrist-temperature module. (a) Contact thermistor schematic. (b) PCB layout and connector mapping.
Figure 2.
a-b. Wrist-temperature module. (a) Contact thermistor schematic. (b) PCB layout and connector mapping.
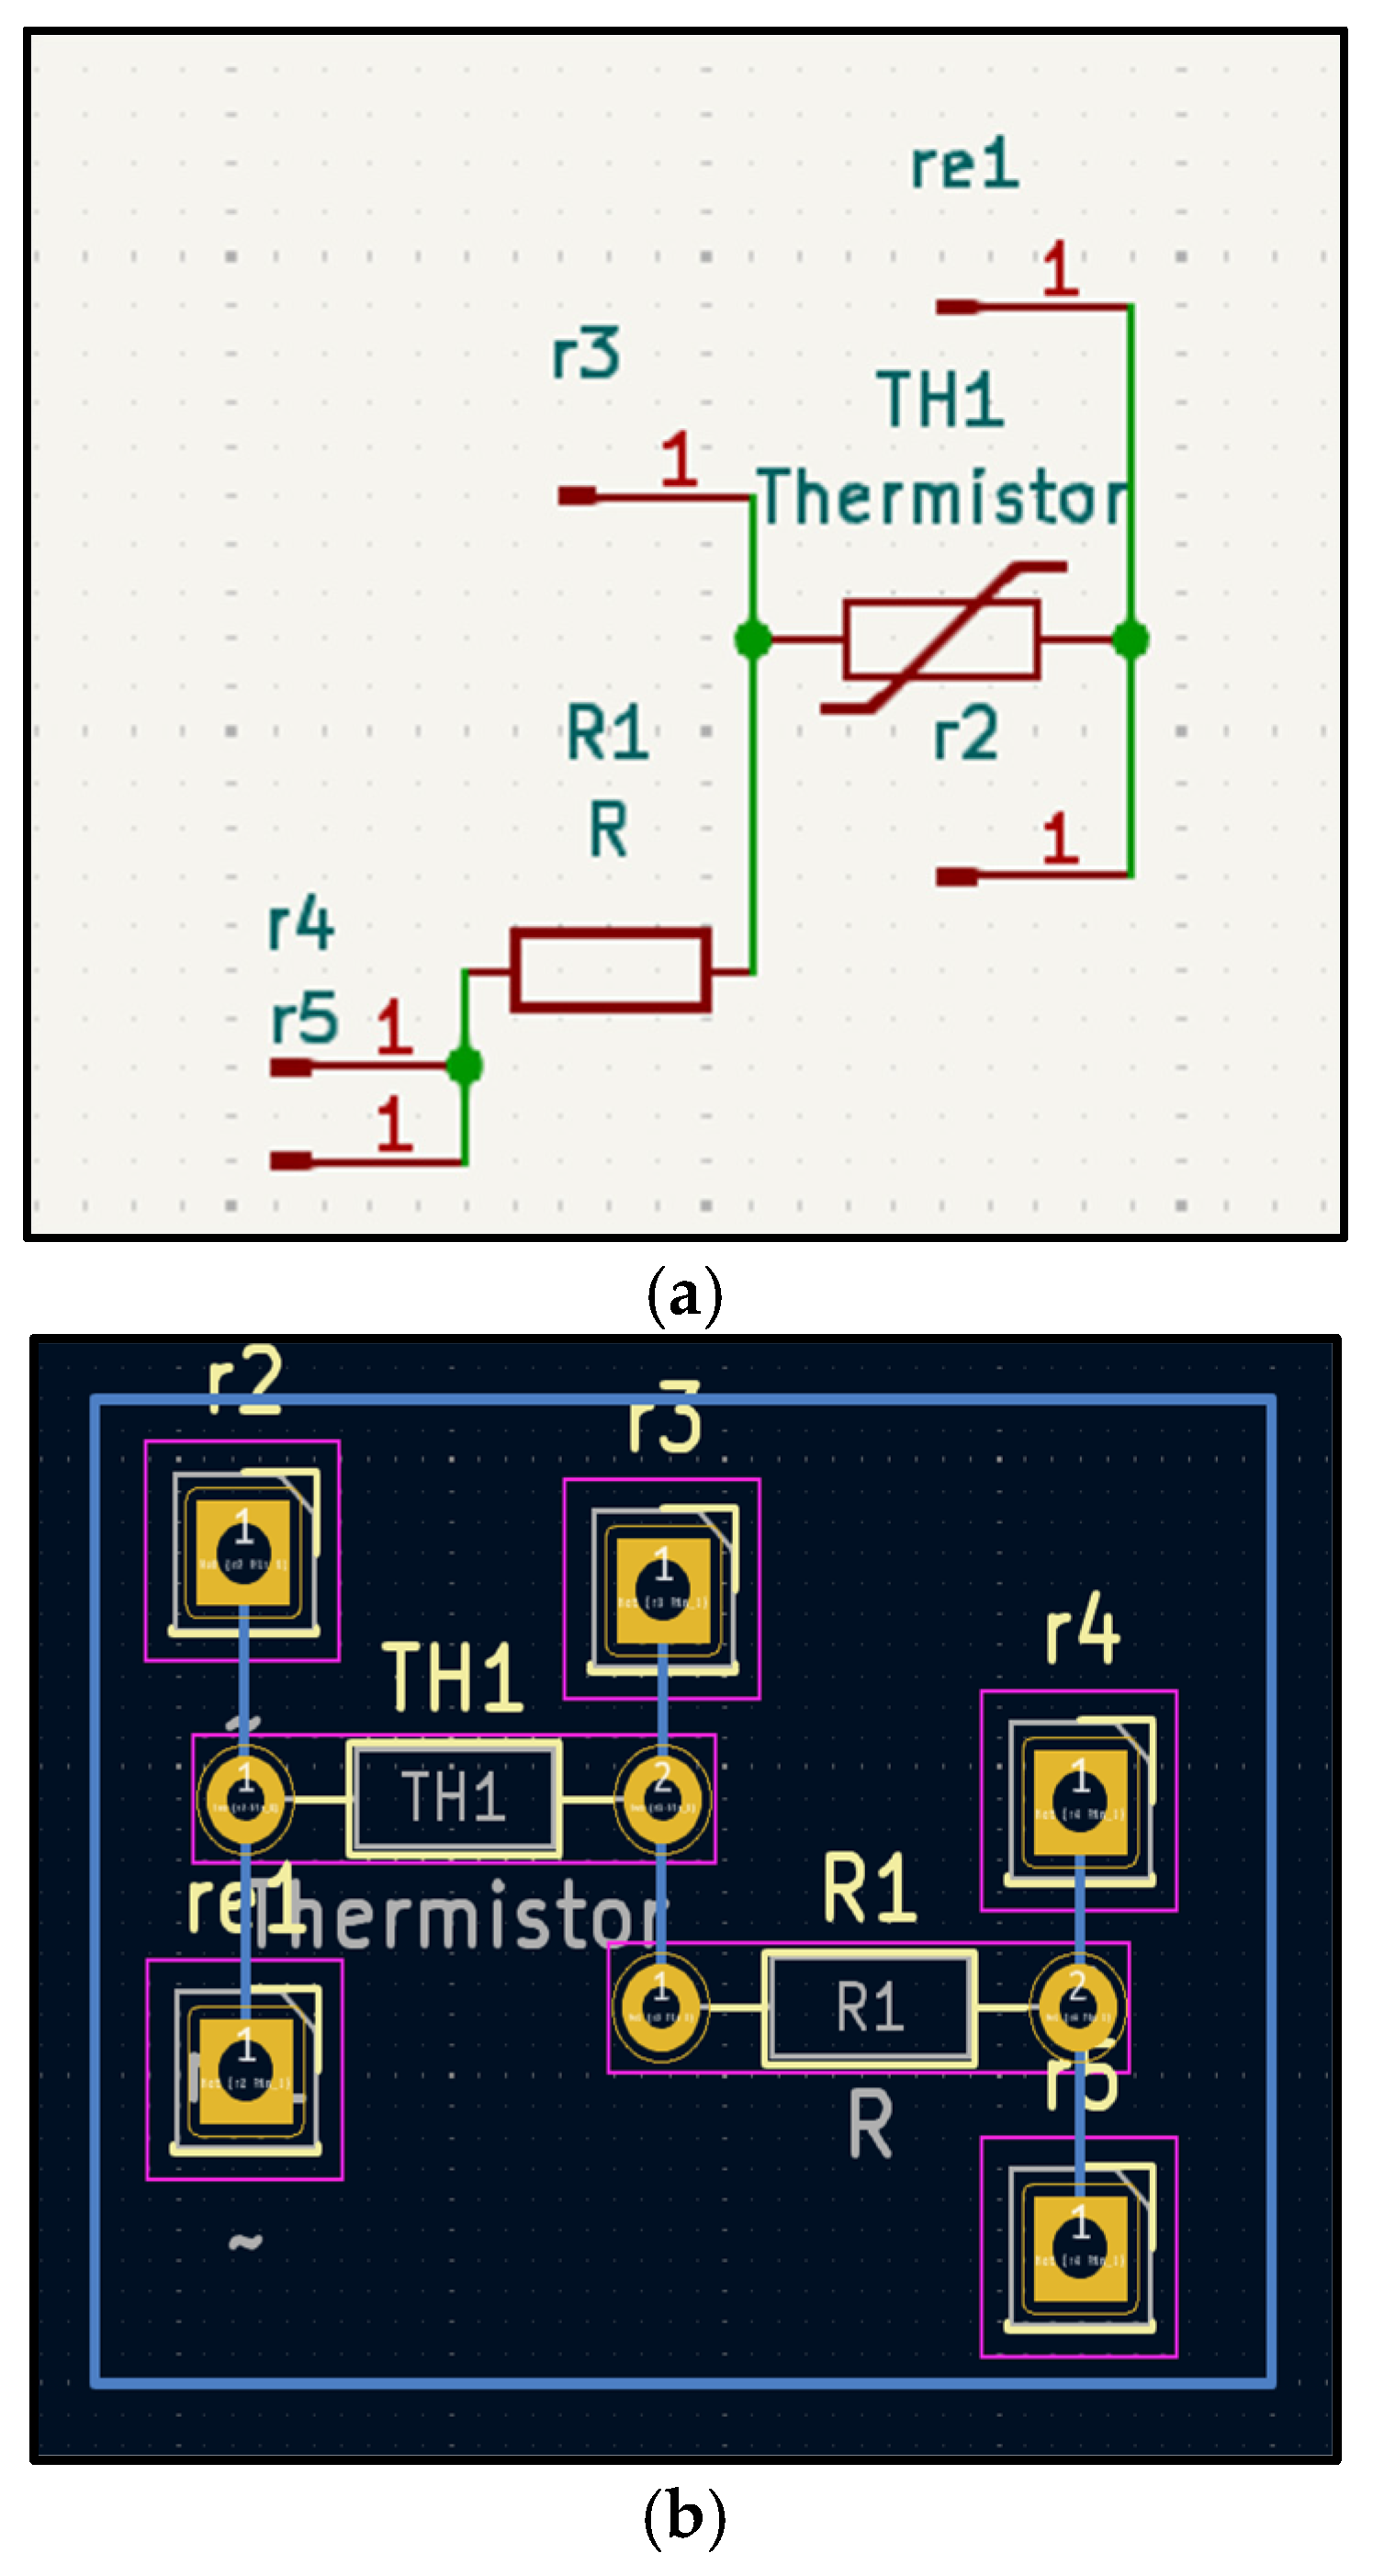
Figure 3.
Schematics and layout of the display, accelerometer, PPG, and body temperature sensor.
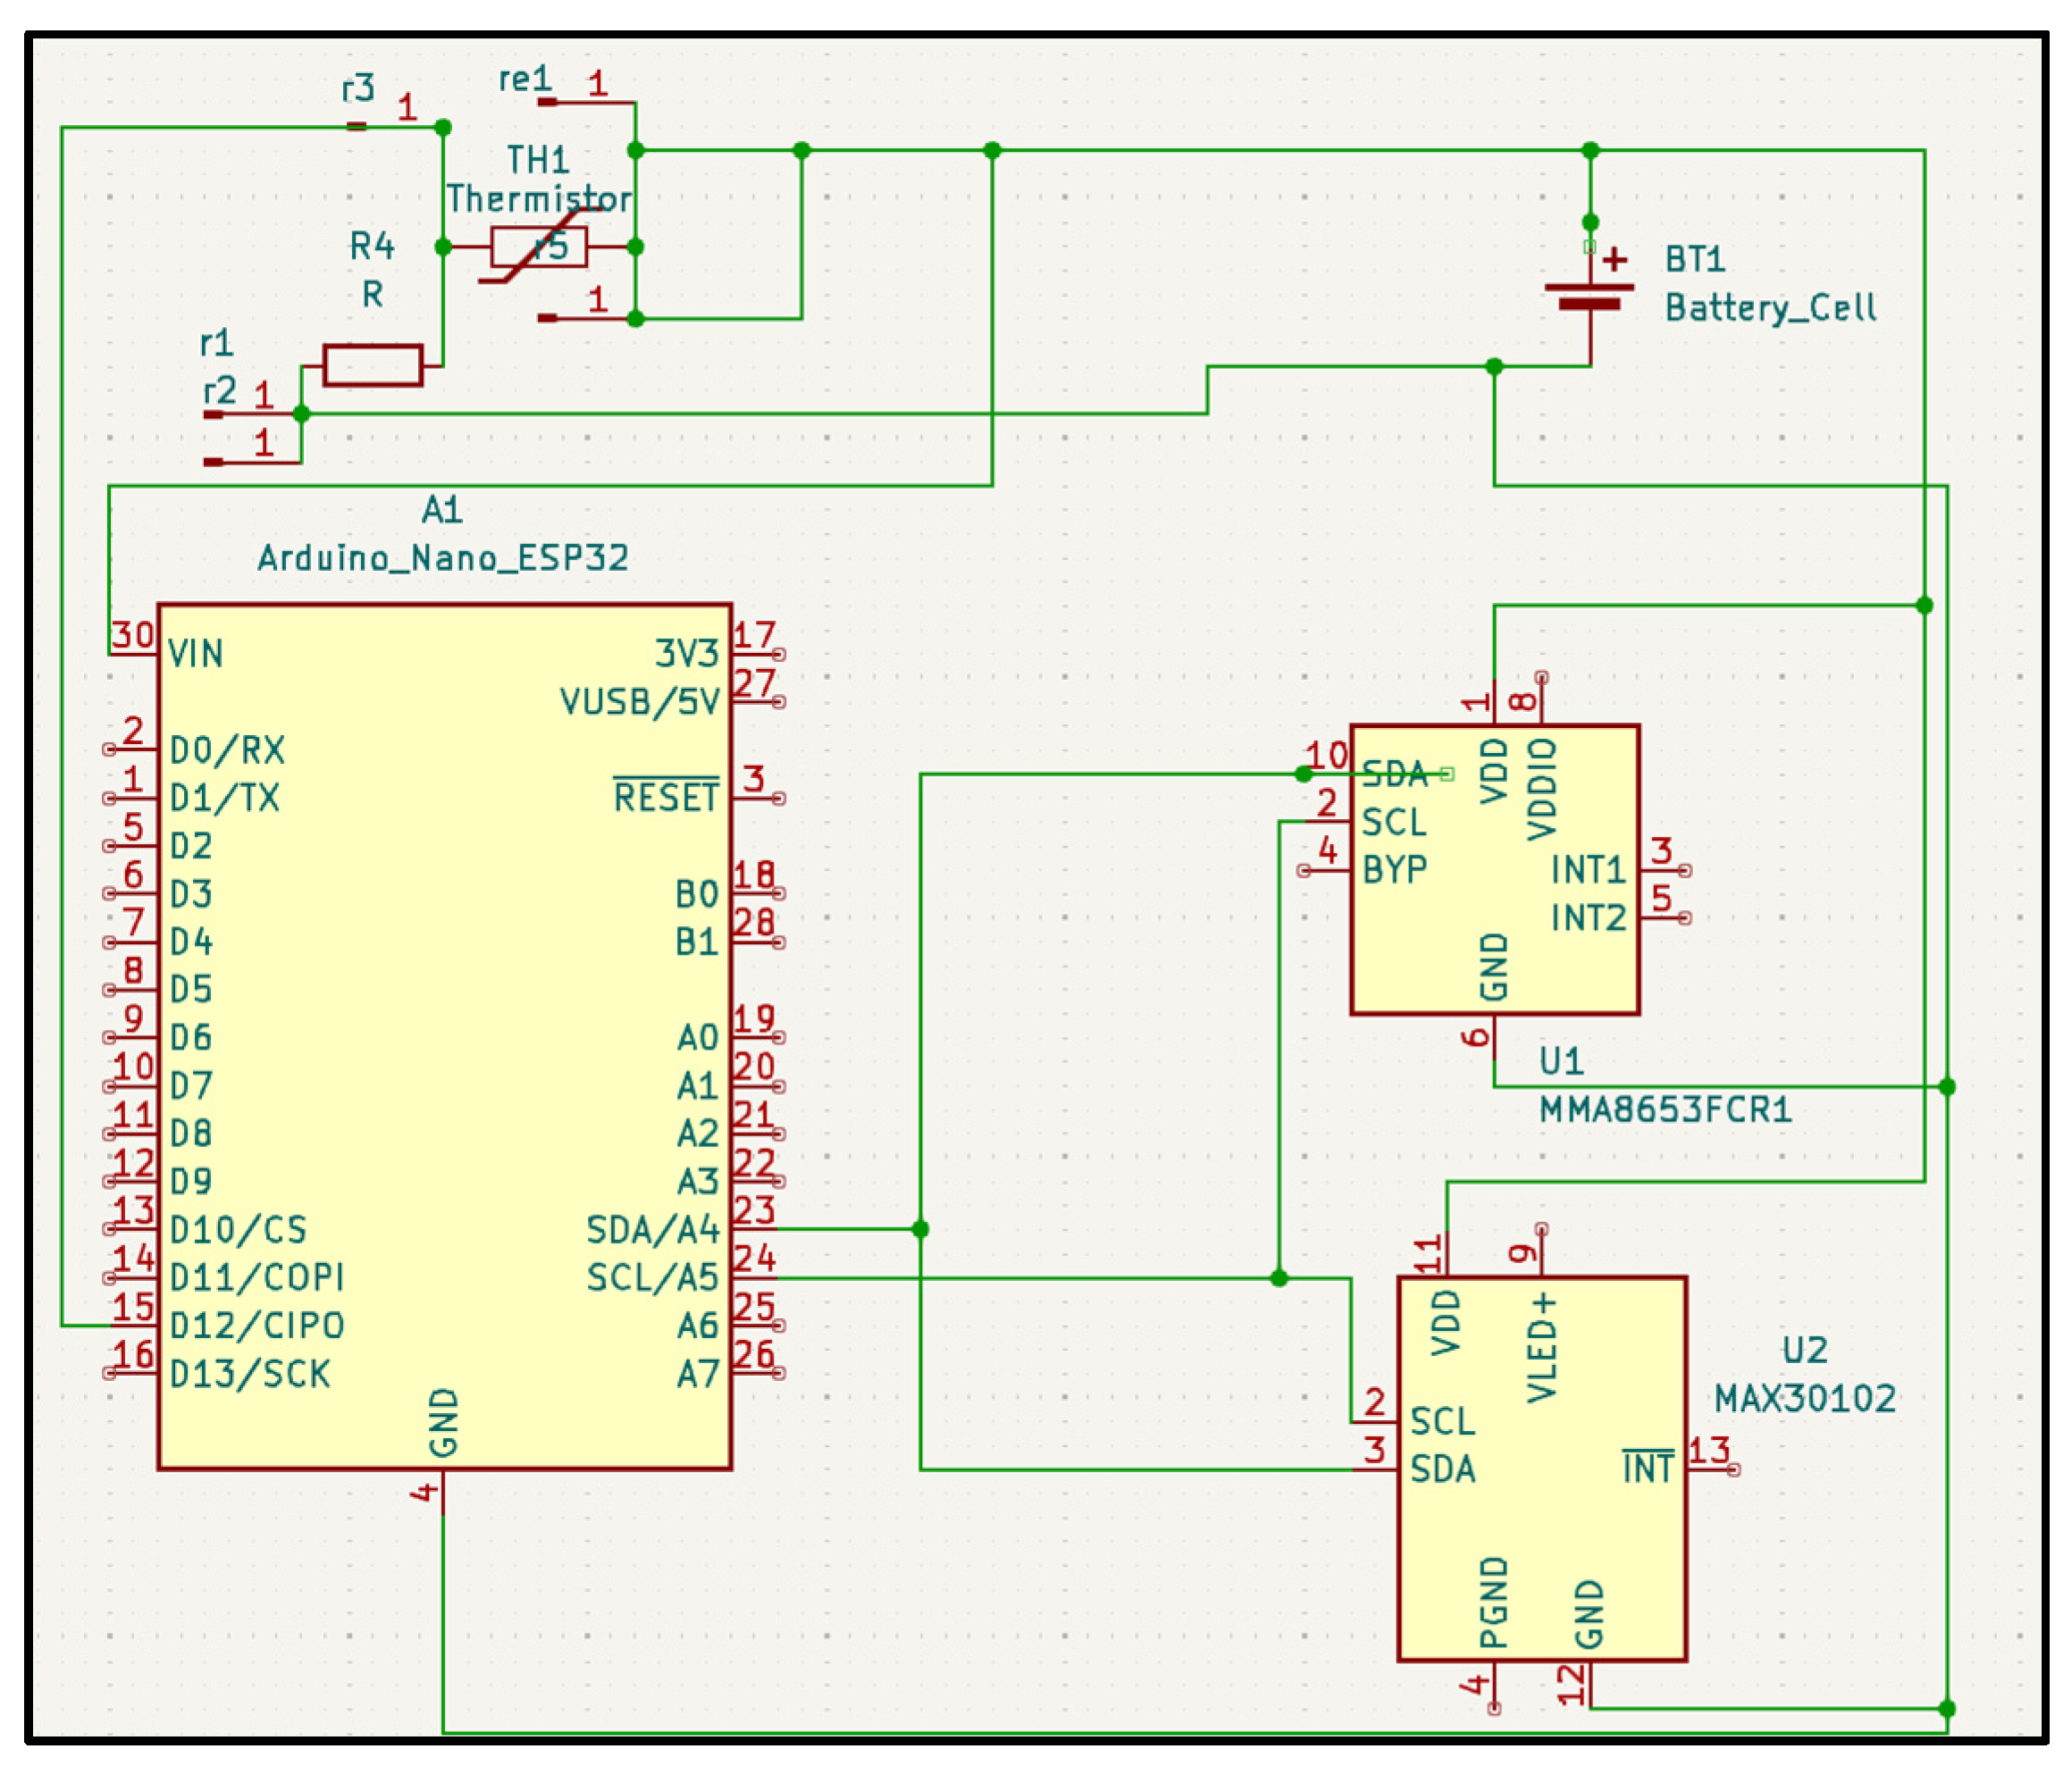
Figure 4.
a-b. Comparison of SpO2 (a) and Heart Rate (b) readings between the AwareOne device and a commercial reference device over a one-day benchmark session, demonstrating a mean absolute error of 0.23 for SpO2 and 4.94 for BPM.
Figure 4.
a-b. Comparison of SpO2 (a) and Heart Rate (b) readings between the AwareOne device and a commercial reference device over a one-day benchmark session, demonstrating a mean absolute error of 0.23 for SpO2 and 4.94 for BPM.
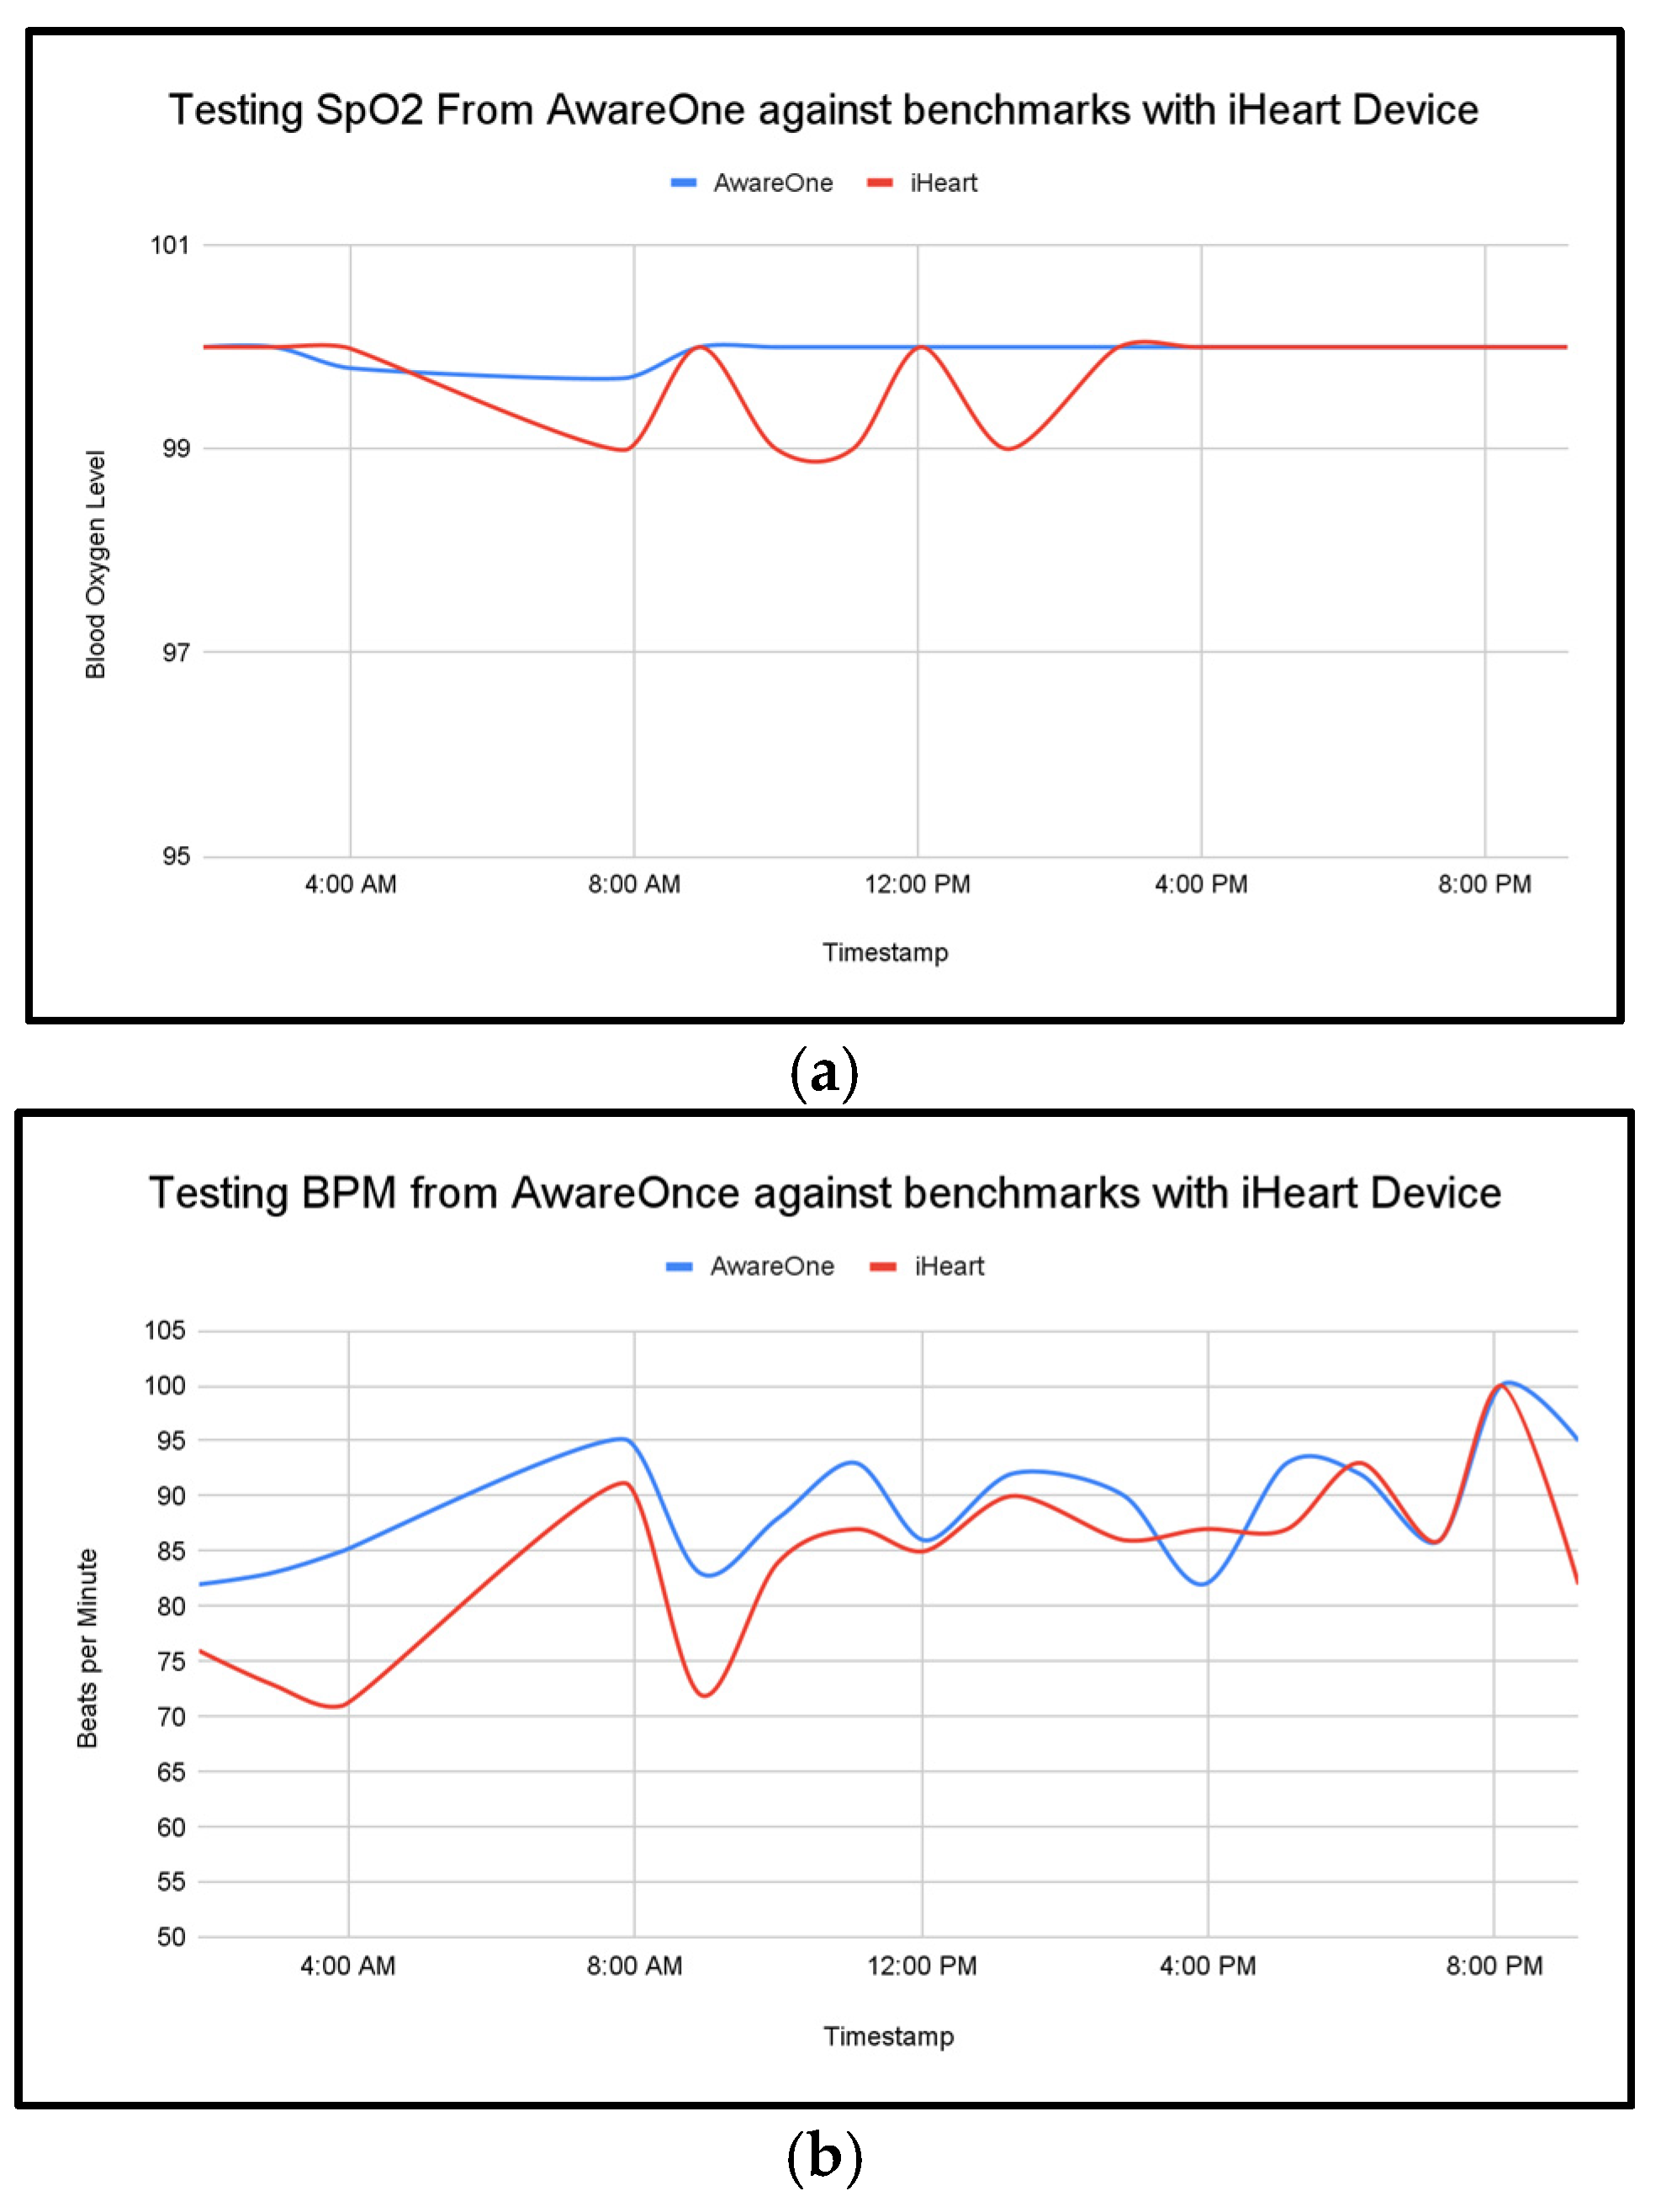
Figure 5.
Representative 24-hour trace of HR, SpO2, skin temperature, and GSR voltage during rest and light activity. Patterns illustrate plausible autonomic variation and measurement stability.
Figure 5.
Representative 24-hour trace of HR, SpO2, skin temperature, and GSR voltage during rest and light activity. Patterns illustrate plausible autonomic variation and measurement stability.
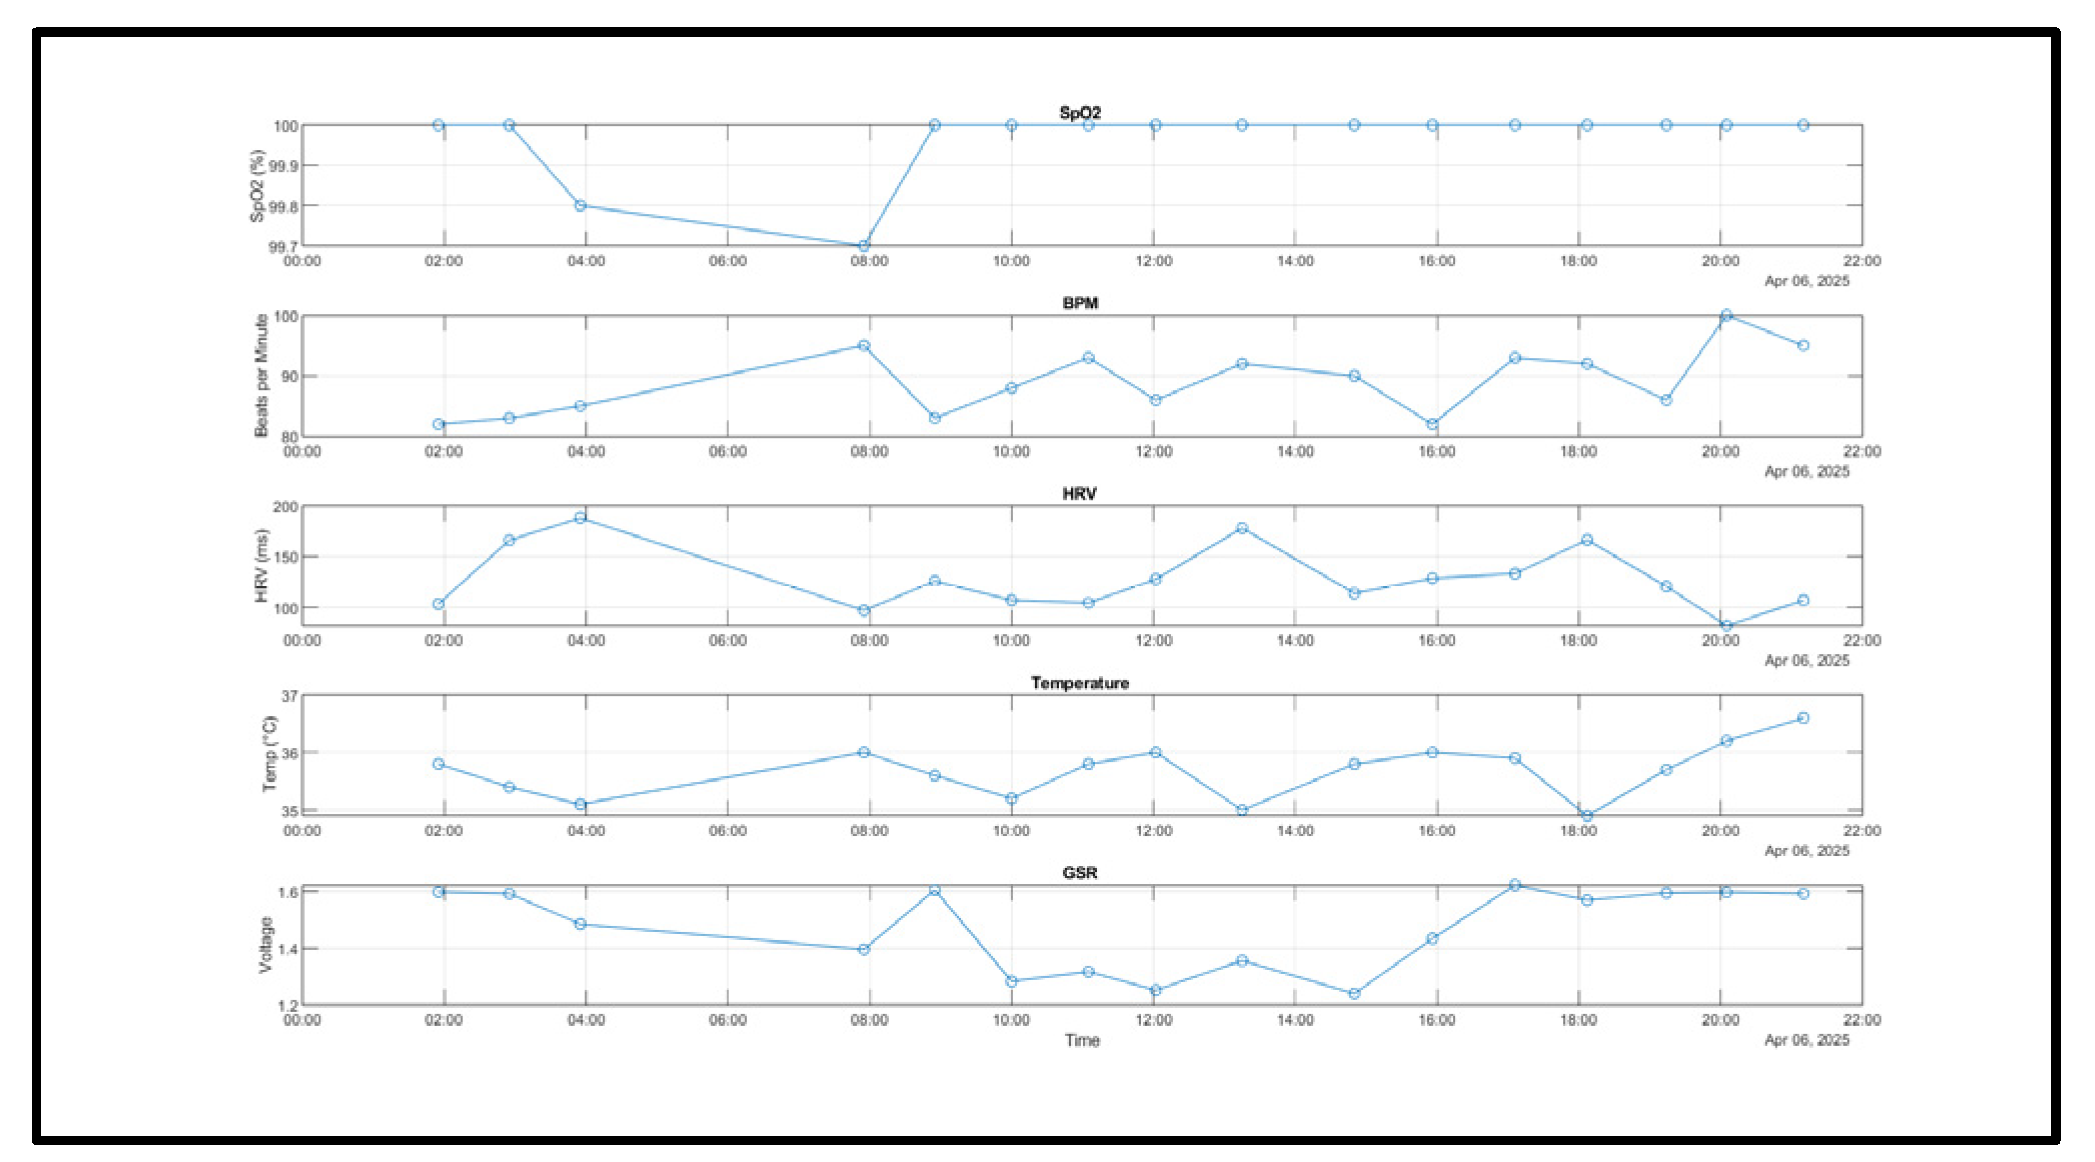
Figure 6.
Correlation matrix: showing the relationship between physiological features and simulated stress, demonstrating a strong negative correlation with temperature (-0.43) and a positive correlation with HRV (0.36).
Figure 6.
Correlation matrix: showing the relationship between physiological features and simulated stress, demonstrating a strong negative correlation with temperature (-0.43) and a positive correlation with HRV (0.36).
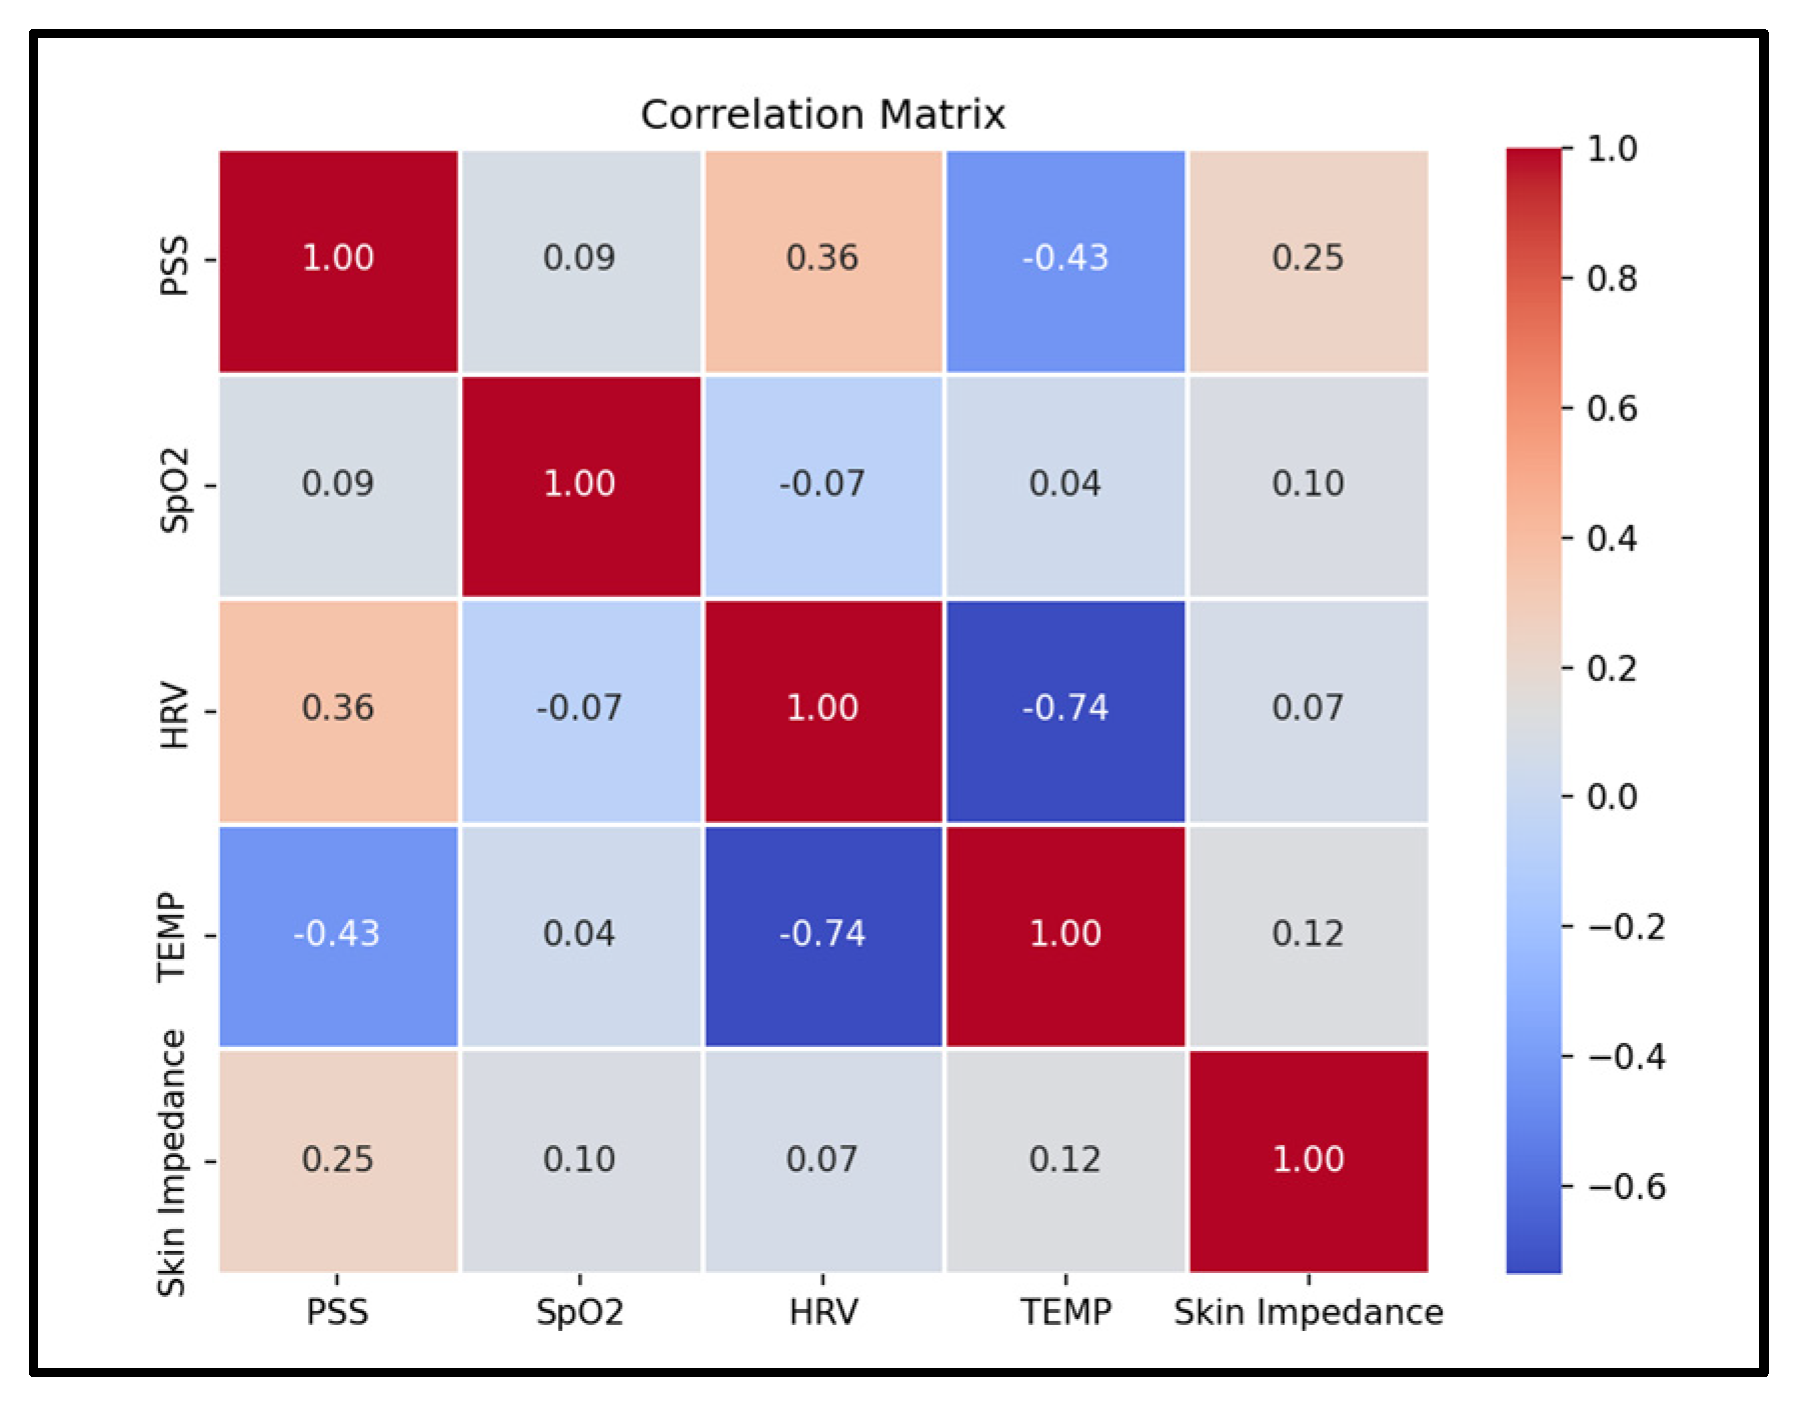
Figure 7.
Scatter plot illustrating the performance of the Support Vector Machine (SVM) model in predicting PSS scores, with a mean squared error (MSE) of 0.08, indicating a close alignment between actual and predicted values.
Figure 7.
Scatter plot illustrating the performance of the Support Vector Machine (SVM) model in predicting PSS scores, with a mean squared error (MSE) of 0.08, indicating a close alignment between actual and predicted values.
Disclaimer/Publisher’s Note: The statements, opinions and data contained in all publications are solely those of the individual author(s) and contributor(s) and not of MDPI and/or the editor(s). MDPI and/or the editor(s) disclaim responsibility for any injury to people or property resulting from any ideas, methods, instructions or products referred to in the content. |
© 2025 by the authors. Licensee MDPI, Basel, Switzerland. This article is an open access article distributed under the terms and conditions of the Creative Commons Attribution (CC BY) license (http://creativecommons.org/licenses/by/4.0/).
Copyright: This open access article is published under a Creative Commons CC BY 4.0 license, which permit the free download, distribution, and reuse, provided that the author and preprint are cited in any reuse.


