
Submitted:
09 September 2025
Posted:
10 September 2025
You are already at the latest version
Abstract
Cryptocurrency has grown in popularity among investors in recent years, but its high market volatility and technological complexity require deeper comprehension from investors. Most previous research has discussed investment decisions from a behavioural finance perspective underpinning the expectancy theory. As some investors may be guided by others’ investing decisions and investing in cryptocurrency requires their understanding of digital technology, this study attempts to integrate herding behaviour theory and expectancy theory and apply the Unified Theory of Acceptance and Use of Technology (UTAUT) to comprehend digital literacy in cryptocurrency. This study's goal is to analyse into the variables that affect cryptocurrency investment decisions. focusing on herding behaviour, financial literacy and digital literacy. Samples of Indonesian cryptocurrency retail investors were purposively selected to obtain 138 valid responses. Data were analysed using PLS-SEM. The findings demonstrated that digital and financial literacy had an impact on crypto investment decisions, but herding behavior had no effect. This study found that herding behavior significantly affects digital and financial literacy. As such, digital and financial literacy play pivotal roles as mediators between herding behaviour and cryptocurrency investment decisions. The research offers a comprehensive framework to investors, investment influencers, and crypto asset providers for developing educational content that increases financial and digital literacy using social media and crypto investment platforms.
Keywords:
herding behaviour
; financial literacy
; digital literacy
; cryptocurrency
; investment decision
1. Introduction
Innovations like cryptocurrencies have emerged as a result of technology's continued development and advancement, a digital currency that relies on cryptography (Gupta & Shrivastava, 2022). The introduction of Bitcoin in 2008 by Satoshi Nakamoto revolutionized investment tools by enabling peer-to-peer transactions without third-party interference (Rubasinghe, 2017). This innovation has shifted public perceptions of financial markets, drawing significant global attention. Cryptocurrency adoption has surged, with users growing from 5 million in 2016 to 575 million by November 2023 (de Best, 2023). Retail investors in this market mostly come from the Millennial and Gen Z generations, at 48% each, while Generation X is less than 5%, and Baby Boomers are less than 1% (Yu Qian, 2023).
The value of Bitcoin, the cryptocurrency with the highest value and the biggest market capitalization worldwide, has fluctuated sharply. Near the end of 2015, the value of Bitcoin exchange rate was below USD 450. However by April 2021, it had surged to approximately USD 60,000 (Hadi et al., 2021); as of late 2024, Bitcoin value has exceeded USD 100,000, reflecting its significant growth over the past decade. Despite the potential for significant profits, a considerable number of cryptocurrency investors have experienced substantial financial losses. Many investors purchase cryptocurrencies during market swings, only to encounter a subsequent decline, leading them to sell at a loss. This cyclical pattern of buying high and selling low contributes to investor losses. Furthermore, cryptocurrencies are susceptible to severe market volatility, with sudden downturns and even crashes, such as the Terra Luna incident in 2022, where prices plummeted unexpectedly. These variations is highlighting how risky investing in cryptocurrencies (Briola et al., 2022). The highly volatile value of cryptocurrencies presents a potential for investors to earn through capital gains, which is the difference between the price at which they were bought and the increase in the market price of the coins/tokens sold (Al-mansour, 2020). Investing in Bitcoin, for example, has resulted in significant wealth gains for many individuals (Mattke et al., 2020). Due to these characteristics of cryptocurrency investment, many studies have focused on market price volatility(Almeida & Gonçalves, 2023), perceived risk (Sukumaran et al., 2022), and financial literacy (Zhao & Zhang, 2021).
Investment in cryptocurrency trading is now more easily accessible by using an investment platform in the form of an online mobile application. The mobile application provides convenience and flexibility for investors to monitor the market and carry out transactions anytime and anywhere (Mir, 2020). With user-friendly features, the mobile application allows users to buy, sell, and store cryptocurrency quickly and safely (Sakas et al., 2022). Additionally, these apps often come with market analysis tools, breaking news, and price notifications that help investors make more informed decisions. The use of mobile applications in cryptocurrency trading enhances accessibility and convenience, enabling investors to monitor markets and make transactions efficiently. However, these tools can amplify herding behaviour as investors may follow market trends or others' actions without critical analysis. This highlights the importance of digital literacy to effectively use app features like real-time updates and analysis tools, and financial literacy to evaluate risks and returns rationally. Together, these factors influence cryptocurrency investment decisions, where higher literacy levels help mitigate impulsive, herd-driven behaviours while promoting informed decision-making.
The advancement of digital technology also contributes to the significant use of social media for obtaining information about cryptocurrency investment (Rodpangtiam et al., 2024). Currently, many influencers utilize social media platforms to post marketing content that indirectly encourages herding behaviour among investors, particularly in the market for cryptocurrencies. Herding is driven by existence of educational content that discusses cryptocurrency price prediction based on the influence of economic uncertainty (Bouri et al., 2019), geopolitics situation in Ukraine-Russia and Middle East, dan trading volume (Mnif et al., 2023). Gurdgiev & O’Loughlin (2020) examined American herding behavior with a focus on investors' reactions to fear and uncertainty, providing insight into the psychological aspects of cryptocurrency investment behaviour. Therefore, herding behaviour may affect financial literacy when individuals use observations of group actions as an opportunity to learn and understand the market when the herding comes from investment content that provides education (Trisno & Vidayana, 2023).
Particularly in volatile markets like cryptocurrency, investors often follow others' actions due to psychological factors like FoMO, or the fear of missing out (Kaur et al., 2023), which may lead to impulsive decisions and potential risks, such as overvalued assets or losses during market downturns (Boubaker et al., 2024). If this herding behaviour is stimulated by competent influencers, investors, or communities, it may increase investors’ literacy about cryptocurrency investment, especially novice investors, and eventually benefit them in making investment decisions. Financial literacy helps investors critically evaluate trends, assess risks, and make well-informed choices based on moral standards rather than peer pressure (Alomari & Abdullah, 2023). Similarly, Digital literacy is essential in the market for cryptocurrencies, enabling investors for navigate platforms, use analysis tools, and identify reliable information (Hartono & Oktavia, 2022). Together, these literacies mediate herding behaviour and support better decision-making. Based on the synthesis above, the gap is how previous research has studied herding behaviour and investment decisions but no studies have been conducted that consider financial and digital literacy as pivotal variables to explain investment decisions.
This study focuses on the Indonesian context, where the crypto asset market has expanded, with 18.25 million users by November 2023, primarily millennials aged 18-30 (Ricardo, 2023). As a collectivist country, Indonesians are potent to be carried away by herding behaviour, including in making investment decisions (Munkh-Ulzii et al., 2018). Several researchers have discussed cryptocurrency in Indonesia. For example, Amsyar et al. (2020) investigated the effects of cryptocurrency in Indonesian economy, concluded that inflation was caused by the role of banks and the government. Dasman (2021) found that even though there is a risk of price volatility, high returns remain an attraction. Other research was focusing on how investors could make profit from cryptocurrency investment decisions (Khuzaini et al., 2024). However, research on the interplay between investment behaviour and digital literacy in cryptocurrency is still limited. Further studies are needed to understand how technology influences investment decisions and how investment behaviour is affected by technology.
In order to analyze the variables impacting cryptocurrency investment decisions, this study will concentrate on the functions of herding behaviour, digital literacy, and financial literacy. By integrating technology acceptance models and behavioural finance concepts, This study offers a thorough understanding of the ways in which psychological and technological elements influence investment behavior. The findings of this study should help crypto investors avoid losses by allowing them to understand the variables that may affect their choices. By understanding the importance of digital literacy to operate the platform and having financial literacy, investors can act rationally and understand not only the potential profits but also the legality and risks of investing.
2. Literature Review
2.1. Underpinning Theory
Herding behavior, which has its origins in behavioral finance, describes why people often imitate the behavior of others instead of using their own discretion (Schumpeter & Keynes, 1936). This phenomenon is particularly relevant in financial markets, where uncertainty and volatility often drive investors to follow majority trends as a coping mechanism (Bikhchandani & Sharma, 2001). Irrational investment decisions might result from herding behavior, which is motivated by psychological reasons including social influence and FOMO (Kaur et al., 2023). Because of the speculative nature of the cryptocurrency market, herding has drawn a lot of attention, rapid information dissemination through social media, and frequent price volatility (Bouri et al., 2019). Investors may rely on collective actions for decision-making, increasing the risk of speculative bubbles or significant financial losses during downturns (Almeida & Gonçalves, 2023).
In cryptocurrency investment decisions, financial literacy and digital literacy are essential in reducing the negative consequences of herding behavior. Financial literacy gives investors the ability to recognize dangers, critically analyze trends, and steer clear of rash, herd-driven decisions (Lusardi & Mitchell, 2014). Digital literacy, on the other hand, enables effective navigation of digital platforms, interpretation of market tools, and identification of credible information sources, which are essential in the technology-driven cryptocurrency environment (Al Reshaid et al., 2024). These literacies serve as mediating variables, bridging herding behaviour with rational investment decisions by empowering investors to act independently and make informed choices.
Extending Expectancy Theory, which links motivation and behaviour through perceived outcomes, financial literacy and digital literacy can be conceptualised as mediating factors that enhance the expected utility of cryptocurrency investment decisions. While financial literacy aligns with expectancy by improving the perceived benefits of better decision making (Alomari & Abdullah, 2023), digital literacy enhances the perceived ease and accessibility of technology-driven investments (Jariyapan et al., 2022). With regard to cryptocurrency investments, this expansion provides a thorough framework for understanding the interaction of psychological, technological, and educational elements (Venkatesh et al., 2003).
Furthermore, Digital literacy can incorporate the Unified Theory of Acceptance and Use of Technology (UTAUT). UTAUT's constructs, including enabling conditions, performance expectancy, and effort expectancy, provide a structured approach to understanding how digital literacy influences the adoption of cryptocurrency platforms (Mohammadyari & Singh, 2015). By combining UTAUT with financial and digital literacy, researchers can develop a holistic perspective on the factors driving technology acceptance and rational decision-making in cryptocurrency investment (Venkatesh et al., 2012).
2.2. Hypothesis Development
2.2.1. Relationship Between Herding Behaviour and Cryptocurrency Investment Decision
The term of herding behavior describes people's propensity to mimic the behavior of a larger group, frequently without doing their own research or analysis. This phenomena occurs when people rely on social cues and group dynamics to guide their decisions, particularly in uncertain or complex environments (Bikhchandani & Sharma, 2001). In financial markets, herding behaviour is common as investors react to the actions of others, believing that group decisions are more informed or rational (Munkh-Ulzii et al., 2018). While herding can create a sense of security through conformity, it also leads to irrational market trends, such as bubbles or crashes, driven by collective sentiment rather than intrinsic asset values (Setiyono et al., 2013).
Cryptocurrency investment decisions involve the allocation of financial resources into digital assets like Bitcoin or Ethereum, often driven by high-risk, high-reward expectations (Kyriazis, 2020). Market volatility is one of the many elements that affect these decisions, regulatory uncertainty, and investor psychology (Hall & Jasiak, 2024). Unlike traditional investments, cryptocurrency trading operates in a decentralised and highly speculative environment, which heightens the part played by extraneous elements like social influence and emotional responses (Islam et al., 2024). Consequently, decision-making in cryptocurrency investment often extends beyond rational analysis because of fear of missing out, incorporating elements of behavioural finance and psychological biases (Gupta & Shrivastava, 2022).
Herding behaviour significantly impacts cryptocurrency investment decisions, as investors frequently rely on the actions and sentiments of others to navigate the volatile and unpredictable market (Samal & Dasmohapatra, 2020). According to herding theory, individuals are more likely to follow group trends when faced with uncertainty, if collective actions reflect superior information or strategies (Bikhchandani & Sharma, 2001). In the context of cryptocurrency, herding often manifests through price surges driven by social media trends, peer recommendations, or the actions of influential market participants (He & Hamori, 2024). Due to this behavioral bias, investors may make less than ideal choices, including buying assets during price peaks or selling during sudden declines, amplifying market volatility. Understanding the role of herding in cryptocurrency investment decisions is essential to developing strategies that mitigate its adverse effects and promote more informed and rational investment behaviours.
H1: Herding behaviour positively affect cryptocurrency investment decision.
2.2.2. Relationship Among Herding Behaviour, Financial Literacy and Cryptocurrency Investment Decision
Financial literacy is the capacity to understand and use financial information for risk assessment, resource management, and well-informed investment choices. It is essential to the navigating the complex cryptocurrency market, enabling investors to better understand market trends and make sound investment choices (Lusardi & Mitchell, 2014). In cryptocurrency investment, higher financial literacy allows individuals to assess both opportunities and risks effectively, fostering confidence in decision-making and improving investment outcomes (Amsyar et al., 2020).
Herding behaviour, the tendency to follow the decisions of others in uncertain situations, can positively influence financial literacy by providing collective learning opportunities (Bikhchandani & Sharma, 2001). Expectancy theory states that people are driven by the conviction that their efforts will result in the outcomes they want (Vroom, 1964). When investors observe actions from others in the market, they may be inspired to improve their financial knowledge to align with or critically evaluate group trends (Talwar et al., 2021). Herding can serve as a reference point, encouraging individuals to seek a deeper understanding of financial concepts and market dynamics, ultimately enhancing their financial literacy (Angela-Maria et al., 2015).
H2: Herding behaviour positively affect financial literacy.
Financial literacy can act as a mediator in a favorable association between herding behavior, crypto investment decisions, and financial literacy. Expectancy theory posits that individuals' expectations of success drive their behaviours, and in this context (Mu’izzuddin et al., 2017), herding behaviour may motivate investors to enhance their financial literacy to better participate in group-driven market trends (Lakonishok et al., 1992). Enhanced financial literacy, in turn, enables investors to critically evaluate herd behaviour and leverage it to make informed cryptocurrency investment decisions (Merli & Roger, 2014). This mediation suggests that herding behaviour, when combined with efforts to improve financial literacy, can result in more intelligent and calculated investment decisions in the cryptocurrency market (Setiyono et al., 2013).
H3: Financial literacy able to mediate effect of herding behaviour to cryptocurrency investment decision.
2.2.3. Relationship Among Herding Behaviour, Digital Literacy and Cryptocurrency Investment Decision
Digital literacy is the capacity to use digital technology efficiently, including understanding, evaluating, and engaging with digital tools and platforms (Hartono & Oktavia, 2022). In the context of cryptocurrency investment, digital literacy enables individuals to navigate complex platforms, analyse digital market trends, and access reliable information to support decision-making (Hajj & Farran, 2024). Investors more proficient in digital literacy are better able to utilize advanced tools, such as blockchain explorers or cryptocurrency analytics platforms, enhancing their confidence and accuracy in making investment decisions (Amsyar et al., 2020).
Herding behaviour, characterized by tendency to follow others' investment actions, often drives investors to participate in cryptocurrency trading (Bouri et al., 2019). This phenomenon can lead to increased digital literacy, as investors strive to understand and effectively utilize cryptocurrency trading platforms to align their actions with the perceived collective wisdom (Jariyapan et al., 2022). Expectancy Theory supports this relationship, suggesting that investors are influenced by herding anticipating positive outcomes by improving their literacy of digital platform to making well-informed investment decisions. Consequently, the interaction between herding behaviour and digital literacy reflects a process where social influence motivates individuals to enhance their technological competencies to align with prevailing market trends (Hajj & Farran, 2024).
H4: Herding behaviour positively affect digital literacy.
Expectancy theory suggests that herding behaviour encourages individuals to enhance their digital literacy, as they perceive it as a necessary skill to participate effectively in collective trends and achieve better outcomes (Lakonishok et al., 1992). Enhanced digital literacy enables investors to critically analyse herding behaviour, assess the validity of group actions, and make informed cryptocurrency investment decisions (Hartono & Oktavia, 2022). This mediation highlights that herding behaviour, when coupled with efforts to improve digital literacy, can result in more intelligent and successful crypto market investment decisions.
H5: Digital literacy able to mediate effect of herding behaviour to cryptocurrency investment decision.
On Figure 1 we present the conceptual model of our research
3. Methods
This study tested the suggested hypothesis using a cross-sectional quantitative technique. Survey Monkey platform was used to target retail investors of cryptocurrency investment instruments chosen with the use of a convenient sample method. The online questionnaire was distributed to cryptocurrency retail investors, members of Indonesian Crypto Asset Traders Association (ASPAKRINDO), and university students, who have already invested in cryptocurrency through the online crypto trading platform. Intercept survey was also performed on the government event of Crypto Literacy Month, which was held in May 2024. Using an alpha error probability of 0.05, a power of 0.9, and an effect size of 0.15, the G-Power Calculator was used to find the minimum sample size (Mayr et al., 2007) resulted in minimum sample of 99 respondents, while this research collected 138 respondents. The dataset of this research available at https://doi.org/10.5281/zenodo.14557337.
The Ethics Committee of Bina Nusantara University approved this study, which was carried out in compliance with ethical standards, reference number 002/HoP.DRM/I/2025. Prior to their participation, all participants received comprehensive information on the study's goals, methods, and any dangers. Prior to their involvement in the study, all individuals provided written informed consent.
Research questionnaire consist of two parts: the demographic and psychographic profile of respondents and the questions related to research variables. Measurement items of each variable were adopted from the literature. This study considered digital literacy as a second-order construct comprising four dimensions: perceived usefulness (Alomari & Abdullah, 2023), perceived ease of use (Kala et al., 2023), social influence (Kala et al., 2023), facilitating condition (Kala et al., 2023).herding behaviour (Kaur et al., 2023), financial literacy (Alomari & Abdullah, 2023), cryptocurrency investment decisions (Kaur et al., 2023). A 5- A point Likert scale was employed to assess the items on the survey.
In order to incorporate theoretical frameworks and maximize the model's explanatory power, as represented by the R2 value, the study objective drove the adoption of Structural Equation Modeling with Partial Least Squares (PLS-SEM). PLS-SEM is better appropriate for exploratory or predictive research as well as studies that integrate several theoretical viewpoints, in contrast to covariance-based SEM, which concentrates on evaluating the viability of accepted hypotheses (Hair et al., 2018).
The statistical analysis uses a two-stage disjoint approach with reflective-formative modelling for higher-order constructs. This method is particularly effective for handling hierarchical constructs, where the formative higher-order constructions are accompanied by reflected lower order structures. The justification for using this two-stage approach lies in its robustness for modelling constructs that are reflective at lower levels but operate formatively at a higher level. In this study, the higher-order constructs represent complex phenomena such as digital literacy or cryptocurrency investment decisions, which consist of distinct but interrelated dimensions that collectively influence the overarching construct (Becker et al., 2012).
The initial phase entails evaluating the first-order reflective model of measurement by looking at construct reliability, convergent validity (using AVE), discriminant validity (using HTMT ratios), and indicator reliability. They serve as formative indications for the second-order conceptions after they have been validated. By analyzing outer weights and using the Variance Inflation Factor (VIF) to check for multicollinearity among the formative indicators, the second stage evaluates the formative measurement model. Using bootstrapping, the importance of outer weights is examined to make sure each dimension contributes to the higher-order construct (Hair et al., 2019).
4. Results
4.1. Identity of Respondents
Respondents in this study consisted of individuals who met the criteria relevant to the research objectives, which is retail investors in the cryptocurrency instrument. The respondents' identities are displayed in Table 1.
Based on Table 1, most male respondents (69.89%) indicated that activity or interest in trading is more dominated by men than women. The dominating age range of 20-29 years (63.06%) shows that trading is more popular with the younger generation, especially those who are at the beginning or middle of their career.
Most respondents had a bachelor's degree (71.38%), which indicates that trading tends to be attractive to individuals with a higher educational background. The predominant single status (81.04%) may reflect that unmarried individuals are freer to take risks or have more time to manage their investments.
In terms of experience, most respondents have trading experience between 2-5 years (36.80%) or 1-2 years (36.43%), which reflects that most perpetrators are new traders who are still in the exploration and learning stage. The most common trading frequencies are daily (37.17%) and monthly (36.43%), indicating that most traders are active in monitoring and conducting transactions regularly.
For trading limits as a percentage of income, most allocations are in the 10%-20% range (33.46%), indicating that most respondents treat trading as an important activity but does not consume their entire income. However, there is also a significant group (22.30%) who allocate more than 40% of their income to trading, which could indicate high confidence in their investment results or a tendency to take greater risks.
4.2. Common Method Bias
Common method bias (CMB) is the term used to describe the possible bias that results from a study's independent and dependent variables. It measured using the same method, particularly in survey research (Kock, 2015). This can affect the internal validity of the research, because it can cause the relationship between variables to be inaccurate or too high due to the use of the same measurement method. Therefore, we performed a common method bias test using the full collinearity test method (Kock, 2017). This method is carried out by creating dummy variables that are not related to the research variables, regressing all research variables with dummy variables, and checking for collinearity across variables by calculating the Variance Inflation Factor (VIF) (Kock, 2015). Kock (2015) states that there are no significant issues if the inner VIF value of each variable is less than the cut-off criterion of 3.3 related to Common Method Bias in the research. The test result is presented in Table 2, in this case the VIF results ranged from 1.109 for effort expectancy to 2.060 for cryptocurrency investment decision which shows that CMB is not a significant problem and does not affect the research results.
4.3. Confirmatory Factor Analysis
First, the researcher conducts Confirmatory Factor Analysis (CFA), a method utilize to evaluate how well empirical data aligns with a predetermined theoretical model. As part of Structural Equation Modelling (SEM), CFA tests the construct validity by confirming whether the indicators in lower order construct truly reflect the intended constructs.
Key stages of CFA in this research include testing outer loadings in order to gauge how strongly indicators and latent components are related, reliability testing to ensure internal consistency, and validity testing for convergent and discriminant validity. While discriminant validity verifies that constructs are separate and do not overlap, convergent validity guarantees that indicators of the same construct have a significant correlation.
In the summarized results (Table 3), internal indicator reliability is assessed through outer loading values, Cronbach's Alpha, composite reliability, and Average Variance Extracted (AVE) for convergent validity. The outer loading values should exceed 0.70 to indicate adequate indicator reliability, although values between 0.50–0.70 are acceptable in exploratory study (Shmueli et al., 2019). An internal consistency metric called Cronbach's Alpha should be higher than 0.60 for exploratory research and higher than 0.70 for confirmatory research to ensure reliability. Composite reliability values should exceed 0.70, with an ideal threshold of 0.80, to demonstrate internal consistency among indicators. For convergent validity, the An AVE greater than 0.50 means that more variance is explained by the construct than by error (Hair et al., 2017).
In Table 3 we present the indicators that we used in our research that have passed the confirmatory test analysis including the outer loading test. There are several indicators that not valid (FC.3, CID.5), where the outer loading value for indicators below 0.5 so they are considered less representative of the variable/construct.
All of the constructs in Table 3 satisfy the necessary reliability and validity requirements. Outer loading for all indicators is above 0.5, which is still acceptable. Additionally, all structures' Cronbach's Alpha (CA) values were above 0.6, indicating sufficient internal consistency. In addition, Each construct's Composite Reliability (CR) value is more than 0.7, signifying strong and reliable (Sekaran & Bougie, 2016).
We also conducted discriminant validity tests, in order to evaluate The Heterotrait-Monotrait Ratio (HTMT) method was applied to discriminant validity. The main function of HTMT is to assess whether the different constructs in the model are more like each other than they should be. HTMT does this by contrasting the ratio of correlations within a single construct with correlations across constructs. High HTMT values indicate that the constructs may not have sufficient discriminant validity, meaning they may not actually measure a different concept. In contrast, low HTMT values (below 0.9) indicate proper, meaning each construct is distinct from the others and each measure something unique in the model. We present the HTMT values in Table 4.
Based on Table 4, all HTMT values are below 0.9, which shows that the constructs in this model have good discriminant validity. This means each construct is capable of measuring a different and unique concept in the model, according to accepted criteria for discriminant validity.
After confirming that all indicators for the lower-order constructs (LOC) meet the criteria for discriminant validity, the investigation moves on to the higher-order constructs (HOC) structural model evaluation. At this stage, to determine how significant their effects are, the relationships between the model's constructs are examined. The purpose of the structural model assessment is to evaluate the study hypothesis and confirm how strongly the variables in question are causally related
4.3. Hypothesis Testing
Hypothesis testing is conducted to determine whether there is statistical significance in the proposed correlations between the model's constructs. Before proceeding with testing the measuring model for the digital literacy dimensions and variables is crucial to ensuring validity and reliability in the structural model analysis. This involves assessing the constructs and indicators to confirm that they adequately measure the intended latent variables, using reflective or formative measurement model criteria. After that, hypothesis testing is conducted using p-values and t-statistics. The alternative hypothesis is accepted if substantial association between the constructs is indicated by the p value being less than 0.05. The researchers also looked at the coefficient of determination when assessing the structural model report (R²) and assessed predictive power. In lower order construct, an indicator is considered to adequately represent its construct if the p-value < 0.05, indicating statistical significance. Additionally, the absence of multicollinearity is guaranteed by looking at the Variance Inflation Factor (VIF); if the VIF is less than 10, there are no problems with multicollinearity among the indicators. Table 5 show the outcome of formative measuring framework. The indicators' direct formation of a latent variable is the result of the formative measurement model, where each indicator makes a unique contribution without having to correlate with each other. Evaluations are carried out to ensure that there is no multicollinearity between indicators, and the results of this model include path coefficients that show each indicator's impact on the latent variable, which has a direct effect on the structural analysis's overall findings.
Table 6 displays the findings of these evaluations using a structural model analysis for hypothesis testing. We use the bootstrapping procedure, which involved 5,000 subsamples. The Bias-Corrected and Accelerated (BCA) bootstrap method was applied to generate more accurate confidence intervals for statistical estimates(Grün & Miljkovic, 2023), with a one-tailed test and a significance level of 0.05. The f² statistic was used to measure the contribution of exogenous factors to endogenous variables, with effect sizes categorized as high (f² > 0.350), medium (f² > 0.150), and small (f² > 0.020) according to (Cohen, 1988). To better interpret the findings, combined p-values and effect sizes was employed, following the approach by (Lakens, 2021).
The results of hypothesis testing in Table 6 illustrate various relationships between variables related to investment decisions in cryptocurrency. Herding behaviour positively affect financial literacy (β = 0.411, t = 5.974, p = 0.000), with a large effect size (f² = 0.203). The confidence interval (BCI-LL = 0.263, BCI-UL = 0.527) confirms the robustness of this finding. Herding behaviour has an even stronger positive effect on digital literacy (β = 0.588, t = 9.039, p = 0.000), with a substantial effect size (f² = 0.529). Financial literacy shows a strong positive and significant effect on cryptocurrency investment decisions (β = 0.402, t = 5.041, p = 0.000), with a large effect size (f² = 0.182). The confidence interval (BCI-LL = 0.451, BCI-UL = 0.675) suggests a high level of confidence in this relationship. Digital literacy also significantly influences cryptocurrency investment decisions (β = 0.380, t = 4.246, p = 0.000), with a moderate effect size (f² = 0.128). The confidence interval (BCI-LL = 0.276, BCI-UL = 0.507) indicates that the bootstrapped results are stable, with no significant shifts in the estimate, further reinforcing the reliability of the findings.
The relationship between herding behaviour and cryptocurrency investment decisions shows a weak and statistically insignificant effect (β = 0.042, t = 0.628, p = 0.265), indicating that In this model, herding behavior has no discernible impact on investment decisions (f² = 0.003).
The R² values show that herding behaviour explains 16.9% of the variance in financial literacy and 34.6% in digital literacy, while financial literacy, digital literacy, and herding behaviour together account for 55.7% of the variance in cryptocurrency investment decisions.
For research models that have mediating variables, it is necessary to test the indirect effect hypothesis (Hayes & Preacher, 2010). With financial literacy and digital literacy as mediating variables, hypothesis testing for indirect effects was also carried out. Table 7 displays the results of the indirect effect test.
Both indirect effects are statistically significant, according to the findings in Table 7. Herding behaviour influences cryptocurrency investment decisions through financial literacy has a t-statistic of 4.022 and a p-value of 0.000, suggesting a strong indirect effect. Similarly, that herding behaviour influences cryptocurrency investment decisions through digital literacy also shows a significant indirect effect with a t-statistic of 3.829 and a p-value of 0.000. These findings confirm that both financial literacy and digital literacy effectively mediate the connection between bitcoin investing decisions and herding behavior.
5. Discussions
5.1. Discussion of Findings
This study intends to investigate the factors that influence bitcoin investment choices, it is evident that all antecedents have a moderate power to predict cryptocurrency investment decision. This study finds that financial literacy has a slightly greater effect on cryptocurrency investment decision than digital literacy. Financial literacy influences cryptocurrency investment decisions as it equips investors with the ability to evaluate risks, understand market dynamics, and make rational decisions in a highly volatile market. This finding supports the work of Lusardi and Mitchell (2014), who emphasized that financial literacy enhances the capacity to assess investment opportunities and avoid irrational behaviour. This finding is also consistent with Amsyar (2020), who stated that greater financial literacy enables individuals to evaluate opportunities and risks more effectively. In the context of cryptocurrency, where price fluctuations and speculative trends are common, financial literacy plays a pivotal role in helping investors discern between potential gains and associated risks.
Digital literacy significantly impacts cryptocurrency investment decisions by enabling investors to effectively utilize trading platforms, interpret data, and identify credible information sources. This result aligns with the findings of Hartono & Oktavia (2022), who highlighted the importance of digital skills in navigating complex online environments. This finding supports Hajj & Farran (2024), who demonstrated that mobile technology literacy has significantly boosted cryptocurrency adoption by improving access to digital financial services. For cryptocurrency investors, digital literacy is essential for accessing tools like market analysis, price alerts and secure transactions (Kumari et al., 2023), ensuring that they can make informed and efficient investment decisions in a digital-first market.
However, this study fails to provide evidence for the direct influence of herding behaviour on cryptocurrency investment decisions, as its impact is mediated by financial literacy and digital literacy, which is contrary to the findings of Gupta & Shrivastava (2022), who identified a significant impact of herding on retail investor investment decisions. The non-significant direct effect may be attributed to the nature of cryptocurrency investors, particularly in Indonesia, who are predominantly Millennials and Gen Z with higher digital and financial literacy levels. These individuals tend to rely on analytical tools and self-acquired knowledge rather than merely imitating others' actions, reducing the direct reliance on herding behaviour (Pangestu & Karnadi, 2020).
However, herding behaviour influences financial literacy by motivating individuals to seek a better understanding of financial concepts, as they observe others engaging in the cryptocurrency market. This finding is consistent with Angela-Maria et al. (2015), who noted that herding can encourage individuals to improve their financial literacy to justify their investment decisions. Similarly, herding behaviour impacts digital literacy as it drives investors to learn how to use digital platforms effectively to utilize digital media as well as achieve information (Furinto et al., 2023). This aligns with the research by Hajj & Farran (2024), which highlighted that social influence often compels individuals to enhance their digital skills to participate effectively in digital markets.
This research demonstrates that the impact of herding behaviour is not always direct but mediated by financial literacy and digital literacy. This finding enriches the behavioural finance literature by introducing literacy as a key mediating factor, showing that informed investors are less prone to irrational decision-making despite the presence of herding tendencies. By integrating these factors, the study provides a more nuanced view of how social and cognitive influences operate in technologically advanced and speculative markets like cryptocurrency.
Expectancy theory posits that individuals' decisions are guided by their beliefs about expected outcomes. This study extends the theory by illustrating that literacy transforms herd-driven impulses into informed decision making, the research broadens expectations theory's application to modern, technology driven investment instruments, emphasizing the importance of cognitive and skill-based factors in shaping rational investment behaviour.
5.2. Managerial Implications
The results of this investigation offer useful managerial implications, particularly for financial institutions, educational platforms, and policymakers involved in cryptocurrency markets. The significant impact of financial and digital literacy on cryptocurrency investment decisions highlights the need for financial institutions and crypto platforms to invest in educational programs socialization of crypto asset investment to campuses and society that enhance investors' knowledge in these areas. By offering comprehensive resources on financial management and digital skills, companies can help investors make more informed decisions, reducing reliance on herding behaviour and fostering long-term trust in digital asset markets. Cryptocurrency platforms can benefit from integrating user-friendly tools and features that encourage informed decision-making. This could include interactive tutorials, digital literacy courses, and in-app guides to educate users on how to analyse cryptocurrency trends and make strategic investments. By empowering users with knowledge, platforms can increase investor confidence and engagement, resulting in higher retention and transaction volumes. For policymakers, the study suggests that promoting financial and digital literacy could be an effective strategy for mitigating speculative bubbles and irrational investment behaviours in the crypto market. Initiatives such as national literacy campaigns, collaboration with educational institutions, and incorporating financial technology into school curriculum could significantly improve the overall decision-making quality of retail investors.
6. Conclusion
This study provides a comprehensive understanding of the factors influencing retail cryptocurrency investors' behaviour, particularly through the point of view of herding behaviour, digital literacy and financial literacy. The results highlight the importance of optimizing platform functionality and financial literacy to satisfy the various needs of retail investors.
Despite these contributions, this study has several limitations that warrant attention. One limitation lies in the sample, which is confined to a specific population and may not adequately represent the diverse characteristics of cryptocurrency investors across various regions. This could limit the generalizability of the findings to broader contexts. Another limitation is the exclusive use of quantitative methods, which, while effective in measuring relationships between variables, may overlook deeper perceptions of the psychological and contextual elements affecting investors behaviour. Additionally, the study’s cross-sectional designs record behavior at a specific moment in time, which might not be taken into consideration variations in the rapidly evolving cryptocurrency market.
To address these limitations, Future studies could increase the sample size to include participants from diverse regions and demographics, enhancing the applicability of the results to different investor populations. Qualitative techniques like focus groups and interviews, could be employed to explore the underlying motivations and thought processes of investors. Furthermore, longitudinal studies would provide a more dynamic understanding of how investor behaviour evolves over time, especially in response to regulatory shifts or advancements in cryptocurrency technologies. These approaches would deepen the understanding of cryptocurrency investment behaviour and offer practical insights for industry stakeholders.
Funding
This research did not receive any specific grant from funding agencies in the public, commercial, or not-for-profit sectors.
Declaration of the Use of AI
During the preparation of this work the author(s) used Chat GPT 4.0 in order to assist in the paper structure framework. After using this tool/service, the author(s) reviewed and edited the content as needed and take(s) full responsibility for the content of the publication.
Data Availability Statement
All data used in this study are available on https://doi.org/10.5281/zenodo.14557337. The data that support the findings of this study are available from the corresponding author, upon reasonable request.
References
- Al-mansour, B. Y. (2020). Cryptocurrency Market: Behavioral Finance Perspective. Journal of Asian Finance, Economics and Business, 7(12), 159–168. [CrossRef]
- Al Reshaid, F., Tosun, P., & Yanar Gürce, M. (2024). Cryptocurrencies as a means of payment in online shopping. Digital Policy, Regulation and Governance , 26(4), 375–393. [CrossRef]
- Almeida, J., & Gonçalves, T. C. (2023). A systematic literature review of investor behavior in the cryptocurrency markets. Journal of Behavioral and Experimental Finance, 37(1), 1–18. [CrossRef]
- Alomari, A. S. A., & Abdullah, N. L. (2023). Factors influencing the behavioral intention to use Cryptocurrency among Saudi Arabian public university students: Moderating role of financial literacy. Cogent Business and Management, 10(1), 1–21. [CrossRef]
- Amsyar, I., Christopher, E., Dithi, A., Khan, A. N., & Maulana, S. (2020). The Challenge of Cryptocurrency in the Era of the Digital Revolution: A Review of Systematic Literature. Aptisi Transactions on Technopreneurship (ATT), 2(2), 153–159. [CrossRef]
- Angela-Maria, F., Maria, P. A., & Miruna, P. M. (2015). An Empirical Investigation of Herding Behavior in CEE Stock Markets under the Global Financial Crisis. Procedia Economics and Finance, 25(15), 354–361. [CrossRef]
- Becker, J. M., Klein, K., & Wetzels, M. (2012). Hierarchical Latent Variable Models in PLS-SEM: Guidelines for Using Reflective-Formative Type Models. Long Range Planning, 45(5–6), 359–394. [CrossRef]
- Bikhchandani, S., & Sharma, S. (2001). Herd Behavior in Financial Markets. IMF Staff Papers, 47(3), 279–310. [CrossRef]
- Boubaker, S., Karim, S., Naeem, M. A., & Rahman, M. R. (2024). On the Prediction of Systemic Risk Tolerance of Cryptocurrencies. Technological Forecasting and Social Change, 198, 122963. [CrossRef]
- Bouri, E., Gupta, R., & Roubaud, D. (2019). Herding Behavioral in Cryptocurrencies. Finance Research Letters, 29(1), 216–221. [CrossRef]
- Briola, A., Vidal-Tomás, D., Wang, Y., & Aste, T. (2022). Anatomy of a Stablecoin’s failure: the Terra-Luna case. http://arxiv.org/abs/2207.13914.
- Cohen, J. (1988). Statistical Power Analysis for the Behavioral Sciences (Second Edition). In Analytical Biochemistry (Vol. 11, Issue 1). Lawrence Erlbaum Associates. http://link.springer.com/10.1007/978-3-319-59379-1%0Ahttp://dx.doi.org/10.1016/B978-0-12-420070-8.00002-7%0Ahttp://dx.doi.org/10.1016/j.ab.2015.03.024%0A. [CrossRef]
- Dasman, S. (2021). Analysis of Return and Risk of Cryptocurrency Bitcoin Asset as Investment Instrument. In IntechOpen (pp. 1–14).
- de Best, R. (2023). Estimate of The Monthly Number of Cryptocurrency Users Worldwide 2016-2022. https://www.statista.com/statistics/1202503/global-cryptocurrency-user-base/.
- Furinto, A., Tamara, D., Yenni, & Rahman, N. J. (2023). Financial and digital literacy effects on digital investment decision mediated by perceived socio-economic status. E3S Web of Conferences, 426. [CrossRef]
- Grün, B., & Miljkovic, T. (2023). The Automated Bias-Corrected and Accelerated Bootstrap Confidence Intervals for Risk Measures. North American Actuarial Journal, 27(4), 731–750. [CrossRef]
- Gupta, S., & Shrivastava, M. (2022). Herding and Loss Aversion in Stock Markets: Mediating Role of Fear of Missing Out (FOMO) in Retail Investors. International Journal of Emerging Markets, 17(7), 1720–1737. [CrossRef]
- Gurdgiev, C., & O’Loughlin, D. (2020). Herding and Anchoring in Cryptocurrency Markets: Investor Reaction to Fear and Uncertainty. J. Behav. Exp. Finance. [CrossRef]
- Hadi, H., Sadalia, I., Ilham, R. N., & Khaddafi, M. (2021). Cryptocurrency Risk Determinant Impact During Covid-19 Pandemic Moment: Emperical Case From Indonesia. European Union Digital Library, 1–6. [CrossRef]
- Hair, J. F., Risher, J. J., & Ringle, C. M. (2018). When to use and how to report the results of PLS-SEM. 31(1), 2–24. [CrossRef]
- Hair, J. F., Risher, J. J., Sarstedt, M., & Ringle, C. M. (2019). When to use and how to report the results of PLS-SEM. European Business Review, 31(1), 2–24. [CrossRef]
- Hair, J. F., Sarstedt, M., Ringle, C. M., & Gudergan, S. P. (2017). Advanced Issues in Partial Least Squares Structural Equation Modeling. Sage Publications.
- Hajj, M. El, & Farran, I. (2024). The Cryptocurrencies in Emerging Markets: Enhancing Financial Inclusion and Economic Empowerment. Journal of Risk Nad Financial Management, 17(10), 1–27.
- Hall, M. K., & Jasiak, J. (2024). Modelling common bubbles in cryptocurrency prices. In Economic Modelling (Vol. 139). [CrossRef]
- Hartono, K. W., & Oktavia, T. (2022). The Influence of Cryptocurrency Transaction as a Currency in NFT-Based Game Transactions. International Journal of Emerging Technology and Advanced Engineering, 12(8), 167–179. [CrossRef]
- Hayes, A. F., & Preacher, K. J. (2010). Quantifying and testing indirect effects in simple mediation models when the constituent paths are nonlinear. Multivariate Behavioral Research, 45(4), 627–660. [CrossRef]
- He, X., & Hamori, S. (2024). The Higher the Better? Hedging and Investment Strategies in Cryptocurrency Markets: Insights from Higher Moment Spillovers. International Review of Financial Analysis, 95(1), 1–24.
- Islam, K. M. A., Omeish, F., Islam, S., Sarea, A. M. Y., & Abdrabbo, T. (2024). Exploring Individuals’ Purchase Willingness for Cryptocurrency in an Emerging Context. Innovative Marketing, 20(2), 230–239. [CrossRef]
- Jariyapan, P., Mattayaphutron, S., Gillani, S. N., & Shafique, O. (2022). Factors Influencing the Behavioural Intention to Use Cryptocurrency in Emerging Economies During the COVID-19 Pandemic: Based on Technology Acceptance Model 3, Perceived Risk, and Financial Literacy. Frontiers in Psychology, 12(1), 1–20. [CrossRef]
- Kala, D., Chaubey, D. S., & Al-Adwan, A. S. (2023). Cryptocurrency Investment Behaviour of Young Indians: Mediating Role of Fear of Missing out. In Global Knowledge, Memory and Communication (Vol. 1, pp. 1–22). [CrossRef]
- Kaur, M., Jain, J., & Sood, K. (2023). “All are investing in Crypto, I fear of being missed out”: examining the influence of herding, loss aversion, and overconfidence in the cryptocurrency market with the mediating effect of FOMO. Quality & Quantity, 58(1), 2237–2263. [CrossRef]
- Khuzaini, Wahyuni, A., Irpan, M., & Setiadi, B. (2024). Investment Behavior and Strategy in Cryptocurrency in Indonesia. Journal of Business and Management Studies, 6(4), 179–194. [CrossRef]
- Kock, N. (2015). Common Method Bias in PLS-SEM: A Full Collinearity Assessment Approach. Int. J. E-Collaboration (IJEC), 11(4), 1–10. [CrossRef]
- Kock, N. (2017). Common Method Bias: A Full Collinearity Assessment Method for PLS-SEM BT - Partial Least Squares Path Modeling: Basic Concepts, Methodological Issues and Applications. In H. Latan & R. Noonan (Eds.), Springer Nature Link (pp. 245–257). Springer International Publishing. [CrossRef]
- Kumari, V., Bala, P. K., & Chakraborty, S. (2023). An Empirical Study of User Adoption of Cryptocurrency Using Blockchain Technology: Analysing Role of Success Factors like Technology Awareness and Financial Literacy. Journal of Theoretical and Applied Electronic Commerce Research, 18(3), 1580–1600. [CrossRef]
- Kyriazis, N. A. (2020). Herding behaviour in digital currency markets: An integrated survey and empirical estimation. Heliyon, 6(8), e04752. [CrossRef]
- Lakens, D. (2021). The Practical Alternative to the p Value Is the Correctly Used p Value. Perspectives on Psychological Science, 16(3), 639–648. [CrossRef]
- Lakonishok, J., Shleifer, A., & Vishny, R. W. (1992). The Impact of Institutional Trading on Stock Prices. Journal of Financial Economics, 32(1), 23–43. [CrossRef]
- Lusardi, A., & Mitchell, O. S. (2014). The Economic Importance of Financial Literacy: Theory and Evidence. Journal of Economic Literature, 52(1), 5–44.
- Mattke, J., Maier, C., Reis, L., Weitzel, T., Maier, C., & Reis, L. (2020). Bitcoin Investment: a Mixed Methods Study of Investment Motivations. European Journal of Information Systems, 00(00), 1–25. [CrossRef]
- Mayr, S., Buchner, A., Erdfelder, E., Faul, F., & Universität, C. A. (2007). A short tutorial of GPower. Tutorials in Quantitative Methods for Psychology, 3(2), 51–59.
- Merli, M., & Roger, T. (2014). What drives the herding behavior of individual investors? Finance, Vol. 34(3), 67–104. [CrossRef]
- Mir, U. (2020). Bitcoin and its energy usage: Existing approaches, important opinions, current trends, and future challenges. KSII Transactions on Internet and Information Systems, 14(8), 3243–3256. [CrossRef]
- Mnif, E., Mouakhar, K., & Jarboui, A. (2023). Energy-conserving cryptocurrency response during the COVID-19 pandemic and amid the Russia–Ukraine conflict. Journal of Risk Finance, 24(2), 169–185. [CrossRef]
- Mohammadyari, S., & Singh, H. (2015). Understanding the effect of e-learning on individual performance: The role of digital literacy. Computers and Education, 82, 11–25. [CrossRef]
- Mu’izzuddin, Ghasarma, R., Putri, L., & Adam, M. (2017). Financial Literacy; Strategies and Concepts in Understanding the Financial Planning With Self-Efficacy Theory and Goal Setting Theory of Motivation Approach. International Journal of Economics and Financial Issues, 7(4), 182–188. http:www.econjournals.com.
- Munkh-Ulzii, Moslehpour, M., & Van Kien, P. (2018). Empirical models of herding behaviour for asian countries with confucian culture. Studies in Computational Intelligence, 753(October), 464–491. [CrossRef]
- Pangestu, S., & Karnadi, E. B. (2020). The effects of financial literacy and materialism on the savings decision of generation Z Indonesians. Cogent Business and Management, 7(1). [CrossRef]
- Ricardo, E. (2023). RI Punya Bursa Kripto, Jual Beli Bitcoin Cs Tak Sebebas Dulu? CNBC Indonesia. https://www.cnbcindonesia.com/research/20230724151844-128-456814/ri-punya-bursa-kripto-jual-beli-bitcoin-cs-tak-sebebas-dulu.
- Rodpangtiam, A., Boonchutima, S., & Mazahir, I. (2024). Perception of social media users regarding cryptocurrency investment adoption: a case of social media platform–Reddit. Cogent Business and Management, 11(1). [CrossRef]
- Rubasinghe, D. I. (2017). Transaction Verification Model over Double Spending for Peer-to-Peer Digital Currency Transactions based on Blockchain Architecture. International Journal of Computer Applications, 163(5), 24–31. [CrossRef]
- Sakas, D. P., Giannakopoulos, N. T., Kanellos, N., & Tryfonopoulos, C. (2022). Digital Marketing Enhancement of Cryptocurrency Websites through Customer Innovative Data Process. Processes, 10(5), 1–24. [CrossRef]
- Samal, A., & Dasmohapatra, A. K. (2020). Impact of behavioral biases on investment decisions: A study on selected risk averse investors in india. International Journal of Advanced Science and Technology, 29(6 Special Issue), 2408–2425. https://www.scopus.com/inward/record.uri?eid=2-s2.0-85083732777&partnerID=40&md5=2d89886407e5564b072cdc33adab87e6.
- Schumpeter, J. A., & Keynes, J. M. (1936). The General Theory of Employment, Interest and Money. Journal of the American Statistical Association, 31(1), 1–190. [CrossRef]
- Sekaran, U., & Bougie, R. (2016). Research Methods For Business. A Skill Builing Approch. 7th Edition. Book. [CrossRef]
- Setiyono, Tandelilin, E., Hartono, J., & Hanafi, M. M. (2013). Detecting the existence of herding behavior in intraday data: Evidence from the indonesia stock exchange. Gadjah Mada International Journal of Business, 15(1), 27–44. [CrossRef]
- Shmueli, G., Sarstedt, M., Hair, J. F., Cheah, J. H., Ting, H., Vaithilingam, S., & Ringle, C. M. (2019). Predictive Model Assessment in PLS-SEM: Guidelines for Using PLSpredict. Eur. J. Mark., 53(1), 2322–2347. [CrossRef]
- Sukumaran, S., Bee, T. S., & Wasiuzzaman, S. (2022). Cryptocurrency as an Investment: The Malaysian Context. Risks, 10(4), 1–17. [CrossRef]
- Talwar, M., Talwar, S., Kaur, P., Tripathy, N., & Dhir, A. (2021). Has Financial Attitude Impacted the Trading Activity of Retail Investors During the COVID-19 Pandemic? Journal of Retailing and Consumer Services, 58(October 2020), 102341. [CrossRef]
- Trisno, B., & Vidayana. (2023). Understanding herding behavior among Indonesian stock market investors. E3S Web of Conferences, 426. [CrossRef]
- Venkatesh, Morris, Davis, & Davis. (2003). User Acceptance of Information Technology: Toward a Unified View. MIS Quarterly, 27(3), 425–478. [CrossRef]
- Venkatesh, V., Davis, F. D., & College, S. M. W. (2012). Theoretical Acceptance Extension Model : Field Four Studies of the Technology Longitudinal. 46(2), 186–204.
- Vroom, V. (1964). Work and Motivation. Wiley.
- Yu Qian, L. (2023). Top Crypto Exchanges in Indonesia (2023 Analysis). Https://Www.Coingecko.Com/. https://www.coingecko.com/research/publications/indonesia-crypto-exchanges.
- Zhao, H., & Zhang, L. (2021). Financial literacy or investment experience: which is more influential in cryptocurrency investment? International Journal of Bank Marketing, 39(7), 1208–1226. [CrossRef]
Figure 1.
The Conceptual Model.
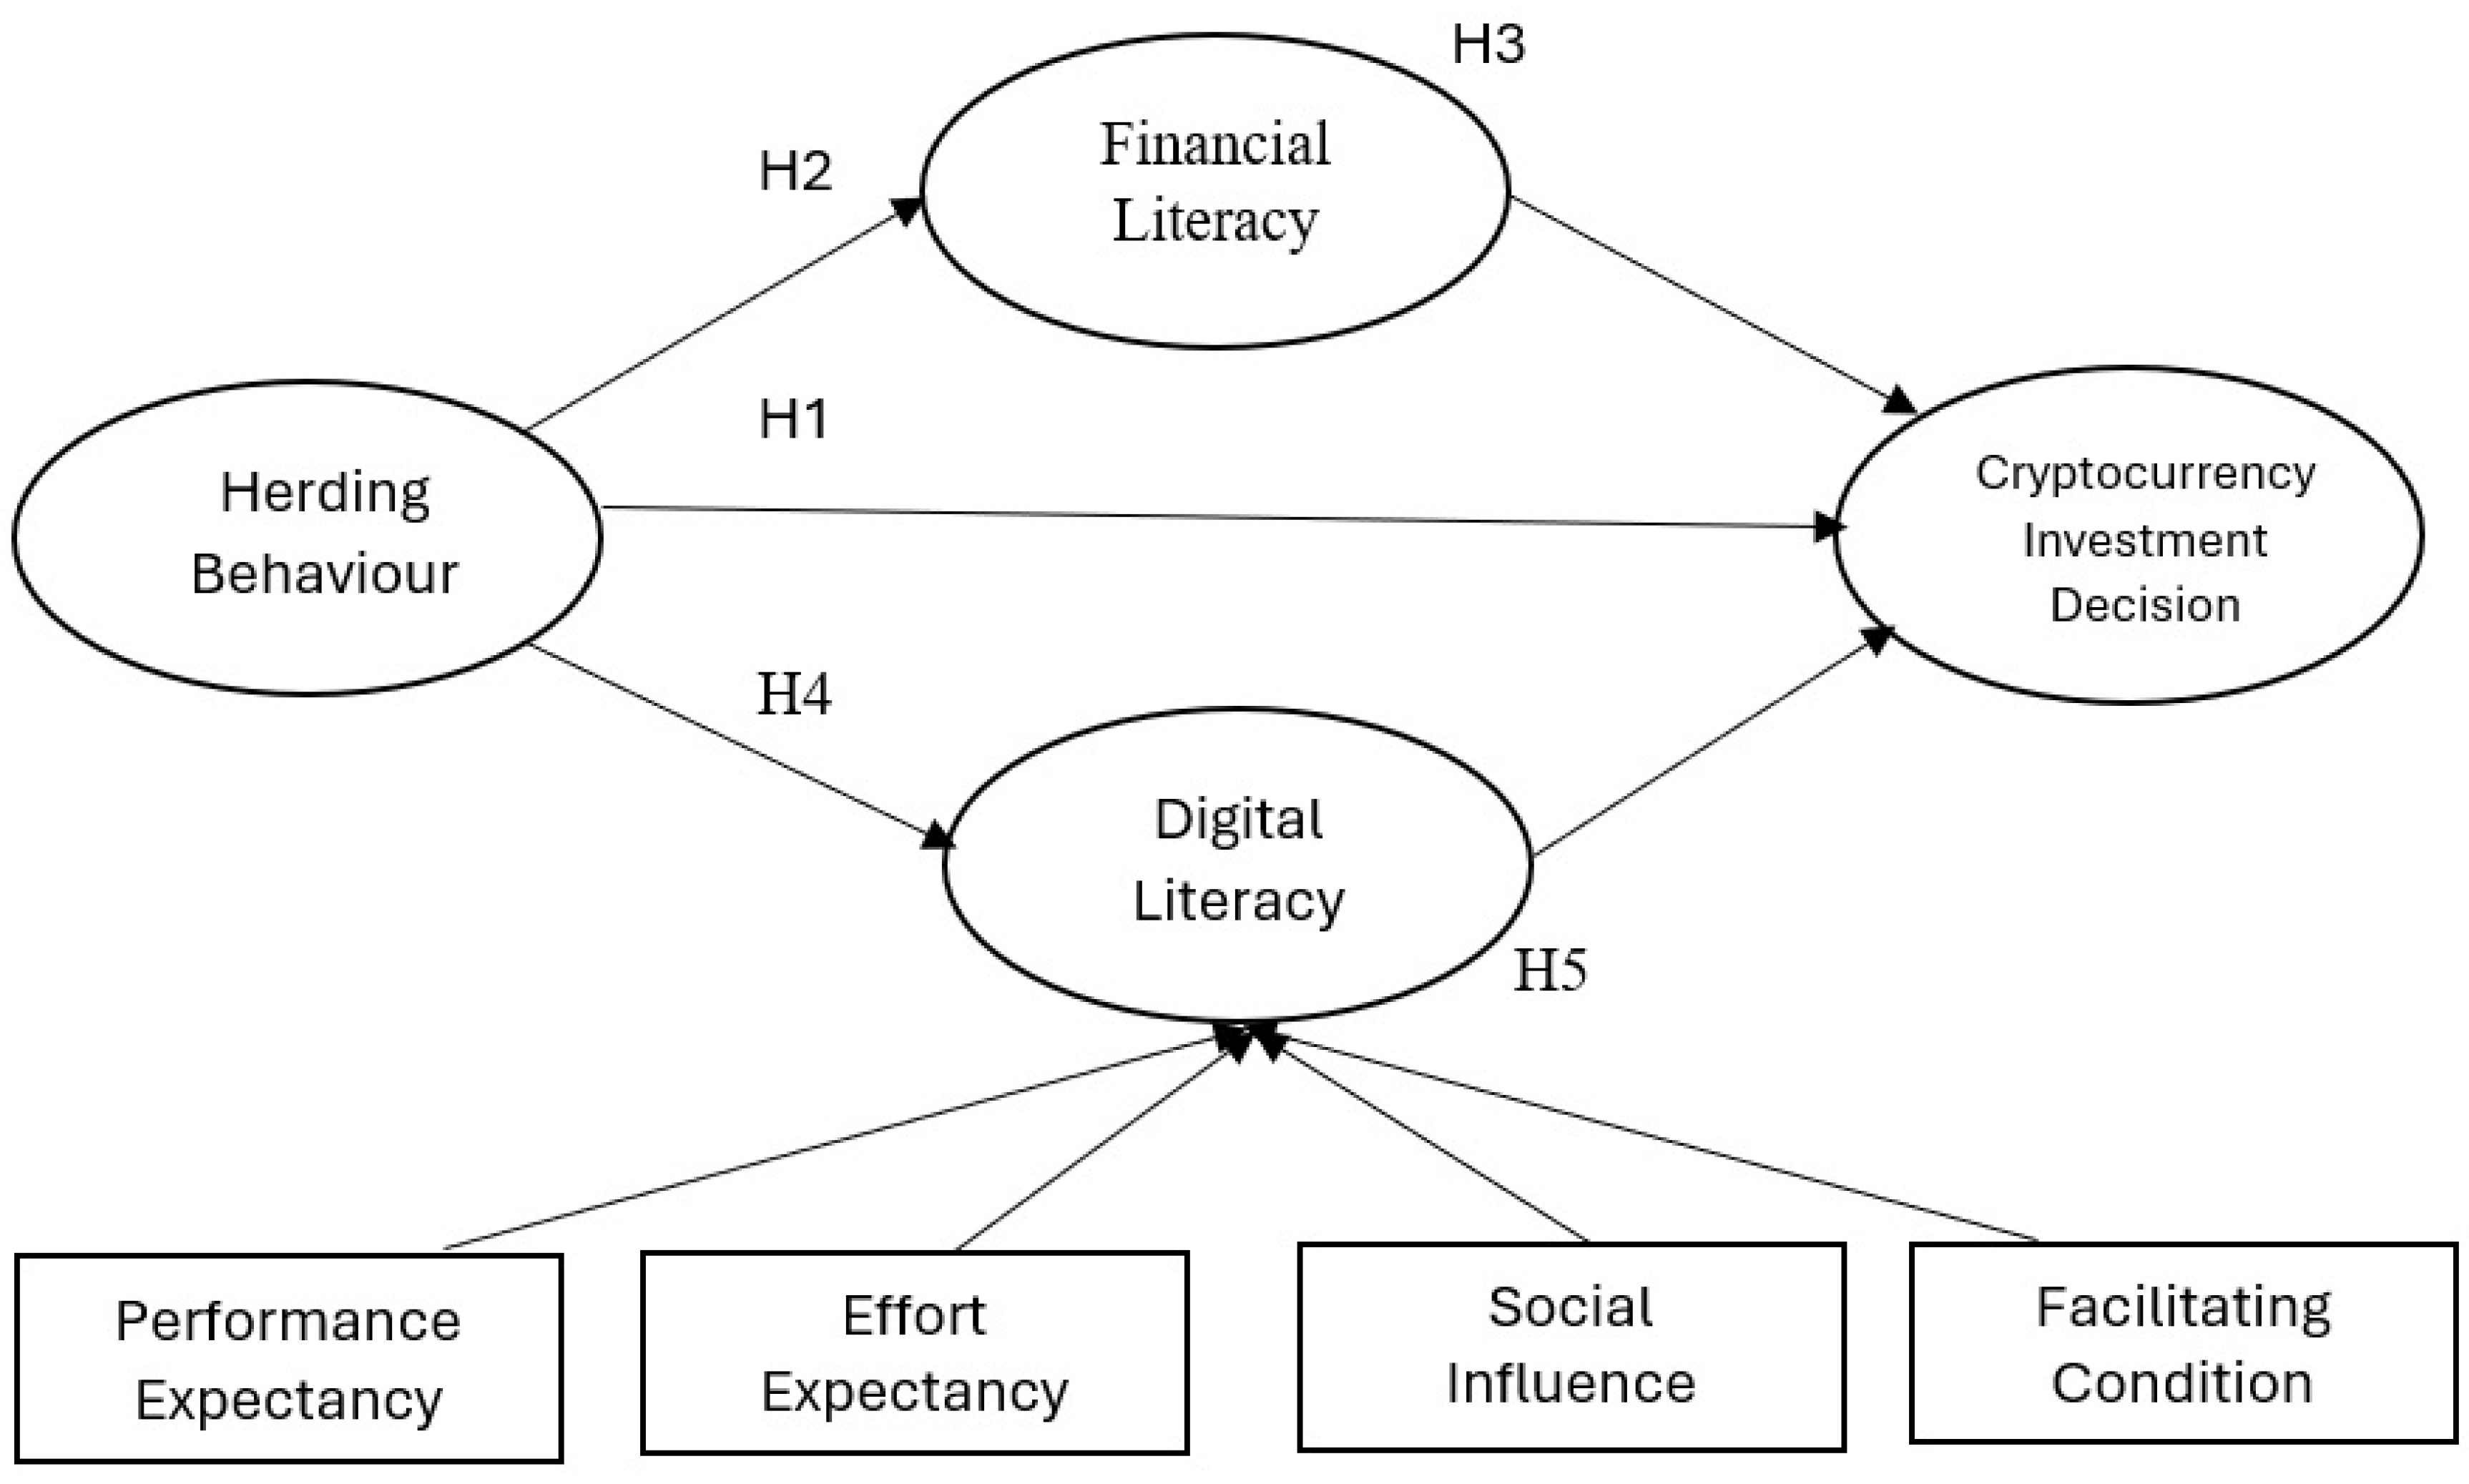

Table 1.
Identity of Respondents.
| Questions and Category | Frequency | Percentage | |
| Gender | Male | 96 | 69.89 |
| Female | 42 | 30.11 | |
| Age (years) | <20 | 24 | 17.16 |
| 20-29 | 87 | 63.06 | |
| 30-39 | 15 | 11.19 | |
| 40-49 | 7 | 5.22 | |
| >49 | 5 | 3.36 | |
| Education | Master/Doctor | 8 | 5.58 |
| Bachelor | 99 | 71.38 | |
| Diploma | 7 | 4.83 | |
| High School | 25 | 18.22 | |
| Marital Status | Single | 112 | 81.04 |
| Married | 25 | 17.84 | |
| Divorce | 2 | 1.12 | |
| Experience in Trading (years) | <1 | 28 | 20.45 |
| 1-2 | 50 | 36.43 | |
| 2-5 | 51 | 36.80 | |
| 5-10 | 10 | 7.43 | |
| >10 | 1 | 0.37 | |
| Frequency of Trading | Daily | 51 | 37.17 |
| Weekly | 18 | 13.38 | |
| Monthly | 50 | 36.43 | |
| Quarterly | 6 | 4.46 | |
| Six-monthly | 2 | 1.49 | |
| Yearly | 10 | 7.06 | |
| Trading limit (% of income) | No active income | 18 | 13.38 |
| <10% | 28 | 20.45 | |
| 10%-20% | 46 | 33.46 | |
| 20%-30% | 8 | 5.95 | |
| 30%-40% | 6 | 4.46 | |
| >40% | 31 | 22.30 | |
Table 2.
Common Method Bias.
| CID | EE | FC | FL | HB | PE | SI | |
| Inner VIF | 2.060 | 1.109 | 1.812 | 2.451 | 1.387 | 1.207 | 1.250 |
CID: cryptocurrency investment decision; EE: effort expectancy; FC: facilitating condition; FL: financial literacy; HB: herding behaviour; PE: performance expectancy; SI: social influence.
Table 3.
Confirmatory Factor Analysis.
| Variable | Question | Loading | CA | CR | AVE |
| Performance Expectancy (PE) | 0.705 | 0.836 | 0.631 | ||
| PE.1 | Cryptocurrency use will increase my chances of achieving my major objectives | 0.758 | |||
| PE.2 | I will be able to achieve my objectives more quickly if I use cryptocurrency | 0.865 | |||
| PE.3 | Using cryptocurrencies will raise my quality of life | 0.755 | |||
| Effort Expectancy (EE) | 0.689 | 0.783 | 0.551 | ||
| EE.1 | It will be simple for me to learn how to use cryptocurrency | 0.756 | |||
| EE.2 | Understanding and using cryptocurrencies won't be difficult for me | 0.852 | |||
| EE.3 | Using cryptocurrency will be easy for me | 0.597 | |||
| Social Influence (SI) | 0.660 | 0.812 | 0.593 | ||
| SI.1 | Those that influence my decisions think I should invest in cryptocurrency. | 0.823 | |||
| SI.2 | People I respect giving me advice on cryptocurrency investments. | 0.654 | |||
| SI.3 | People who have an impact on my actions agree that cryptocurrency has many advantages | 0.821 | |||
| Facilitating Condition (FC) | 0.617 | 0.796 | 0.566 | ||
| FC.1 | I have access to trustworthy resources regarding cryptocurrency usage | 0.785 | |||
| FC.2 | I can purchase and trade cryptocurrency on trustworthy and practical platforms | 0.764 | |||
| FC.4 | I can get help or customer service for problems relating to cryptocurrencies | 0.706 | |||
| Financial Literacy (FL) | 0.791 | 0.864 | 0.614 | ||
| FL.1 | I believe that my understanding of cryptocurrency investing is adequate. | 0.783 | |||
| FL.2 | I feel that I understand how to calculate the profit from index movements in cryptocurrency investments | 0.803 | |||
| FL.3 | I feel that I understand the nature of the problems with cryptocurrency investment | 0.775 | |||
| FL.4 | I know how to diversify risk in cryptocurrency investments | 0.772 | |||
| Herding Behaviour (HB) | 0.740 | 0.836 | 0.561 | ||
| HB.1 | My investment choices are influenced by other investors' crypto choices | 0.787 | |||
| HB.2 | My investing choices are influenced by the cryptocurrency volume selections made by other investors | 0.738 | |||
| HB.3 | Usually, I respond quickly to shifts in the choices made by other investors and observe how they respond to the cryptocurrency market | 0.717 | |||
| HB.4 | Other investors’ decisions on buying and selling crypto currencies have an impact on my investment decisions | 0.752 | |||
| Cryptocurrency Investment Decision (CID) | 0.787 | 0.855 | 0.543 | ||
| CID.1 | I mostly earn more than the average return generated by the crypto market | 0.778 | |||
| CID.2 | I decide all of my own cryptocurrency investments | 0.761 | |||
| CID.3 | My cryptocurrency portfolio's return validates my investment choices | 0.725 | |||
| CID.4 | I would use cryptocurrency if I had the option | 0.785 | |||
| CID.6 | When opportunity arises, I intend to use cryptocurrency | 0.623 | |||
Table 4.
Heterotrait-Monotrait Ratio (HTMT).
| CID | CID | EE | FC | FL | HB | PE | |
| CID | |||||||
| EE | 0.707 | ||||||
| FC | 0.754 | 0.894 | |||||
| FL | 0.858 | 0.793 | 0.876 | ||||
| HB | 0.568 | 0.469 | 0.629 | 0.522 | |||
| PE | 0.837 | 0.658 | 0.823 | 0.829 | 0.536 | ||
| SI | 0.622 | 0.483 | 0.552 | 0.569 | 0.735 | 0.636 |
CID: cryptocurrency investment decision; EE: effort expectancy; FC: facilitating condition; FL: financial literacy; HB: herding behaviour; PE: performance expectancy; SI: social influence.
Table 5.
Formative Measurement Model.
| Variable | Dimension | Outer Weight | t-statistics | p-values | Outer Loading | VIF |
| Digital Literacy | EE | 0.107 | 0.991 | 0.161 | 0.658 | 1.109 |
| FC | 0.451 | 3.095 | 0.001 | 0.861 | 1.812 | |
| PE | 0.276 | 2.105 | 0.018 | 0.796 | 1.207 | |
| SI | 0.427 | 4.554 | 0.000 | 0.752 | 1.205 |
CID: cryptocurrency investment decision; FL: financial literacy; DL: digital literacy; HB: herding behaviour.
Table 6.
Hypothesis Testing.
| Hypothesis | Β | S.E. | t-value | p-value | BCI-LL | BCI-UL | f2 |
| H1: HB → CID | 0.042 | 0.066 | 0.628 | 0.265 | -0.211 | 0.506 | 0.003 |
| H2: HB → FL | 0.411 | 0.069 | 5.974 | 0.000 | 0.263 | 0.527 | 0.203 |
| H3: HB → DL | 0.588 | 0.065 | 9.039 | 0.000 | 0.051 | 0.169 | 0.529 |
| H4a: FL → CID | 0.402 | 0.080 | 5.041 | 0.000 | 0.451 | 0.675 | 0.182 |
| H4b: DL → CID | 0.380 | 0.090 | 4.246 | 0.000 | 0.276 | 0.507 | 0.128 |
CID: cryptocurrency investment decision; FL: financial literacy; DL: digital literacy; HB: herding behaviour. R2 of FL = 16.9%, DL = 34.6%, CID = 55.7%.
Table 7.
Indirect Effect Testing.
| Hypothesis | Β | STDEV | t-statistics | p-values | BCI-LL | BCI-UL |
| H4b: HB → FL→CID | 0.165 | 0.041 | 4.022 | 0.000 | 0.099 | 0.231 |
| H5b: HB → DL→CID | 0.224 | 0.058 | 3.829 | 0.000 | 0.130 | 0.231 |
Disclaimer/Publisher’s Note: The statements, opinions and data contained in all publications are solely those of the individual author(s) and contributor(s) and not of MDPI and/or the editor(s). MDPI and/or the editor(s) disclaim responsibility for any injury to people or property resulting from any ideas, methods, instructions or products referred to in the content. |
© 2025 by the authors. Licensee MDPI, Basel, Switzerland. This article is an open access article distributed under the terms and conditions of the Creative Commons Attribution (CC BY) license (http://creativecommons.org/licenses/by/4.0/).
Copyright: This open access article is published under a Creative Commons CC BY 4.0 license, which permit the free download, distribution, and reuse, provided that the author and preprint are cited in any reuse.


