
Submitted:
08 September 2025
Posted:
11 September 2025
You are already at the latest version
Abstract
This study employed Guar Gum (GG) to decontaminate synthetic wastewater containing Ni(II) ions. The adsorbent was characterized using FTIR, scanning electron microscopy (SEM), thermogravimetric analysis (TGA), BET surface area, and X-ray diffraction (XRD). The effects of key operating parameters, contact time, pH, sorbent mass, temperature, and initial Ni(II) concentration, were systematically investigated. The optimum conditions for Ni(II) removal were found to be 0.8 g/50 mL adsorbent dosage, pH 7.0, and a contact time of 30 minutes. In addition to single-factor studies, a hierarchical cluster analysis (dendrogram) was performed to evaluate the relative influence of the process variables on removal efficiency. The analysis revealed that adsorbent dosage and pH were the most dominant factors, clustering closely with removal efficiency, while contact time and temperature formed a secondary group, and initial concentration appeared as a distinct parameter. This multivariate insight highlights the central role of pH and dosage in optimizing Ni(II) adsorption. To further predict adsorption performance, the experimental data were employed to develop an Artificial Neural Network (ANN) model. The model achieved a correlation coefficient (R²) of 0.967 and a mean square error (MSE) of 3.857, confirming strong predictive capability. In addition, K-Nearest Neighbors (KNN) modeling was applied and compared with ANN, further validating the predictive performance of the adsorption process. The kinetic analysis demonstrated that the pseudo-second-order model provided the best description of the adsorption kinetics. At equilibrium, the data were consistent with the Langmuir isotherm, yielding a maximum adsorption capacity of 86.0 mg g⁻¹. Thermodynamic analysis further indicated that the process is predominantly governed by physisorption and proceeds exothermically.
Keywords:
adsorption
; guar gum
; Ni(II) ions
; artificial neural network
; kinetics
1. Introduction
Heavy metals in wastewater and/or drinking water are among the riskiest environmental problems. This problem is likely due to the dumping of crude industrial wastes [1,2,3,4]. Various industries involve a final treatment process consisting of metal compounds that can cause contamination in the discharged water [2,5,6]. Most of these heavy metals are non-biodegradable, having a long biological half-life, leading to potential accumulation and human exposure through food or water [1].
Nickel ions are commonly found in water in the form of oxides, nitrates, and sulfides. However, when their concentration exceeds safe limits, they can lead to serious health problems e.g. skin dermatitis, pulmonary fibrosis, nausea, vomiting, and even neurological disorders in children [3,6,7,8,9].
Traditional methods for removing nickel from wastewater such as coagulation, ion exchange and chemical precipitation are often costly and generate large amounts of toxic sludge [10]. In response, researchers have recently turned to low-cost, renewable, and eco-friendly agricultural and natural materials as promising alternatives for nickel removal through biosorption [11,12,13,14].
Guar gum is composed of polysaccharides. Guar gum is made up of a backbone of mannose sugars linked in a straight chain, with galactose sugars branching off at every other mannose unit, forming short side chains. Guar gum is also known for its ability to withstand temperatures of up to 80 °C for several minutes without losing its stability. This composition helps Guar gum be an effective biosorbent for removing organic and inorganic pollutants from wastewater [4,10]. The effectiveness of this low-cost adsorbent is fundamentally because of the functional groups present in the polysaccharide structure [10].
Nickel(II) ions present in wastewater can be effectively removed using a variety of adsorbents [11,12,13,14,15,16]. Studies have shown that the efficiency of this process depends greatly on the operating conditions—particularly the initial concentration of metal ions, the dosage of the adsorbent, and the pH of the solution.
An artificial neural network (ANN) is a learning tool that mimics the human mind, which is made up of an input layer, one or more hidden layers, and an output layer. Each of these layers contains many nodes, often called neurons, that are connected to one another and work together to process and transmit information through the network. ANN is used to predict adsorption behavior based on experimental data. Each layer uses the preceding layer as its input to form an interconnected neural network. The neurons number in the input layer depends on the parameters used in the study [17]. ANN has been used in many applications to predict adsorption behavior and verify its efficiency successfully, such as using experimental data for the decontamination of Cr(VI) by ferrochrome slag/polyaniline adsorbent, where the model used gave the maximum correlation coefficient (R =0.991) and lowest Mean square error (MSE=9.801) [18]. ANN was used to predict the adsorption efficiency of Ni(II) with perlite in aqueous solutions using 140 experimental data sets. The model consists of three neurons in the input layer, viz. contact time, total concentration, and adsorbent mass. The results exhibited that the ANN prediction data is in good agreement with the experimental data [19].
This study aims to characterize, use, evaluate, and compare the adsorption of Ni(II) ions by Guar Gum (GG) without any thermal or/and chemical treatment. The parameters affecting adsorption efficiencies, such as pH, GG mass, contact time, initial Ni(II) ion concentration, and temperature, were studied. To our knowledge, GG has not previously been reported for removing Ni(II) ions from synthetic wastewater. Finally, A model containing a training algorithm to predict removal efficiency using ANN is created and verified by calculating Mean Square Error (MSE) and Correlation Coefficient (R2), where the results of the study indicate how closely the experimental data match the predicted values.
2. Materials and Methods
2.1. Chemicals and Instruments
All chemicals used in this study were obtained from BDH (England), and Merck (Germany), and were used without further purifications. In deionized water, Ni(II) ion stock solutions were prepared from nickel nitrate. Several Ni(II) ion concentrations were prepared by diluting the stock solutions. HCl and NaOH solutions were employed to adjust the pH value. The pH tests were performed using a pH-meter (Hanna 211). An atomic absorption spectrometer determined the equilibrium Ni(II) ion concentrations in the treated solutions (Spectra AA 20).
2.2. Sample Characterization
The composition of GG was analyzed using a Perkin Elmer Attenuated Total Reflection (ATR) spectrometer (10 scans, 4 cm⁻¹ resolution). The crystallinity of the guar gum (GG) samples was determined with an X-ray powder diffractometer (Japanese Dmax-rA, CuKα radiation, λ = 1.54 Å), scanned over the 2θ range of 80–5° with a step size of 2%. The surface morphology of GG was examined using Scanning Electron Microscopy (SEM) (FEI Company, The Netherlands) operated at 20 kV accelerating voltage. Furthermore, the surface area of GG was measured with a Micromeritics ASAP 2020 Surface Area and Porosity Analyzer (USA) following the Brunauer–Emmett–Teller (BET) method.
2.3. Adsorption Experiments
A stock solution of Ni(II) ions (1000 ppm) was first prepared, and the chosen concentrations were prepared by diluting it with deionized water. For each batch experiment, a measured amount of guar gum (GG) was mixed with 50 mL of Ni(II) solution (adjusted to the required pH) in plastic bottles. The mixtures were then placed on a shaker and allowed to equilibrate at a controlled temperature for predetermined time intervals. The quantity of Ni(II) ions adsorbed by GG was determined using Equation (1)
Here, qe represents the adsorption capacity (mg g⁻¹); Ci and Ce are the initial and equilibrium concentrations of Ni(II) (mg L⁻¹); V is the volume of the solution (L); and M is the GG mass (g).
To explore the effect of the initial pH value, the required mass of GG was mixed with 50 mL of known concentration of Ni(II) solution in batch experiments with the pH values kept between 2 to 11 using HCl and/or NaOH. The experiments were performed at 25 oC. Upon equilibration, the residual Ni(II) concentration was assessed using an atomic absorption spectrometer. The removal percent (R%) of Ni(II) ions from aqueous solutions was determined by Eq. (2).
The thermodynamic parameters were calculated using several experiments conducted at a 20-40 oC temperature range. Kinetic experiments were performed by studying Ni(II) adsorbed amounts as a function of contact time (10 – 60 mins). Adsorption isotherms were obtained following the same batch procedure, with initial Ni(II) concentrations varied between 50 and 400 ppm. After equilibration, the mixtures were filtered, and the residual Ni(II) concentrations were subsequently determined.
The selectivity of GG adsorbent was evaluated using aqueous solutions containing a mixture of Cr(VI), Cu(II), Pb(II), and Ni(II) ions, each at an initial concentration of 50 mg L⁻¹. A mass of 0.80 g of GG was added to 50 mL of the mixed-ion solution, adjusted to pH 6.0, and the suspensions were equilibrated on a shaker for 40 min at 25 °C. The remaining concentrations of each metal ion in the solution were measured using an atomic absorption spectrophotometer AAS. The distribution coefficients (D, L g⁻¹) and the selectivity coefficients (βNi²⁺/Mn²⁺) were subsequently calculated according to the following equations.
For reactivation, the Ni(II)-loaded GG sample was immersed in 100 mL of 0.5 M acidified thiourea solution, and stirred for 2 h. The sample was then thoroughly rinsed with deionized water until free from residual acid. The reactivation efficiency was subsequently evaluated using Equation (5).
2.4. Artificial Neural Networks (ANN)
A neural network model was developed in Maple software to predict the removal efficiency of Ni(II) ions from aqueous solutions. The network comprised three layers: an input layer with five parameters (initial Ni(II) concentration, guar gum (GG) mass, pH, contact time, and temperature), a hidden layer with a variable number of neurons, and an output layer with a single neuron representing Ni(II) removal efficiency. Each neuron carried an adjustable weight, and the layers were interconnected such that outputs from one layer served as inputs to the next.
The model was trained using 42 experimental data sets and a custom learning algorithm. Its predictive accuracy was evaluated by comparing outputs with experimental values, with performance verified through mean square error (MSE) and the correlation coefficient (R²), as shown in Equations (6) and (7).
In these equations, ai denotes the experimental value, represents the average of the experimental data, is the predicted value, and nT refers to the total number of training samples.
2.5. K-Nearest Neighbors (KNN)
K-Nearest Neighbors (KNN) regression was applied as a complementary machine learning method to model Ni(II) removal efficiency by Guar Gum (GG). The input variables included pH, GG mass, contact time, temperature, and initial Ni(II) concentration, while the output was removal efficiency. The dataset was standardized, and the number of neighbors (k) was optimized using five-fold cross-validation. Model performance was evaluated using R², MSE, and RMSE, and compared with the ANN results. The KNN figure was generated by ChatGPT5.
3. Results and Discussion
3.1. Characterization
3.1.1. Surface Area
Results showed that the average pore diameter is 97 Ao, confirming that GG has a mesoporous structure. Moreover, results also indicate that GG has a medium surface area (24.0 m2/g) compared to other adsorbents used to adsorb Ni(II) ions [14]. The total pore volume was determined as 23. 3 × 10⁻² cm3/g.
3.1.2. FTIR
The FTIR spectra of the adsorbent before and after Ni(II) loading are shown in Figure 1. The spectrum of the pristine material (spectrum a) displays the characteristic absorption bands of GG, thereby confirming the identity of the adsorbent. A broad band at 3400–3450 cm⁻¹ corresponds to O–H stretching vibrations of hydroxyl groups, which are abundant in the galactomannan backbone of GG. The peaks in the region 2920–2850 cm⁻¹ are assigned to C–H stretching of aliphatic groups. Absorption at ~1650 cm⁻¹ can be attributed to adsorbed water bending vibrations and possible C=O stretching of residual acetyl groups, while the bands in the region 1150–1020 cm⁻¹ are connected with C–O–C and C–O stretching vibrations in the polysaccharide structure. The presence of these functional groups (–OH, –C–H, –C–O–C) is consistent with the chemical composition of Guar Gum, confirming the polymeric adsorbent nature.
After Ni(II) adsorption (spectrum b), notable changes are observed, confirming the successful binding of metal ions. The broad –OH stretching band around 3400 cm⁻¹ shows a clear reduction in intensity and a slight shift, indicating involvement of hydroxyl groups in metal complexation through hydrogen bonding or direct coordination. The band near 2920 cm⁻¹ (C–H stretching) is slightly perturbed, reflecting structural adjustment in the GG matrix upon Ni(II) loading. Importantly, the peak at ~1630–1650 cm⁻¹ becomes more intense and shifts marginally, suggesting interactions of Ni(II) with oxygenated groups, possibly due to complexation with hydroxyls or residual carboxyl functionalities. Furthermore, in the fingerprint region (1200–1000 cm⁻¹), noticeable variations in intensity and shape are observed, confirming that the C–O and C–O–C bonds participate in coordination with Ni(II) ions.
Taken together, the spectral changes provide strong evidence that GG was successfully used as the adsorbent and that its hydroxyl and ether functional groups play a dominant role in Ni(II) uptake. The comparative FTIR spectra thus validate both the identity of GG and the efficient adsorption of Ni(II) ions onto its surface.
3.1.3. X-Ray Diffraction
The XRD pattern of Guar Gum (GG) (Figure 2) displays a broad halo with a main peak around 2θ ≈ 20°, which can be indexed to the (110) reflection of polysaccharide-based biopolymers. The absence of sharp and well-defined peaks such as (001) or (100) confirms the predominantly amorphous structure of GG. This amorphous nature, with only weak ordering of molecular chains, is typical of natural polysaccharides and provides numerous disordered sites and functional groups that can participate in adsorption. Such structural features are advantageous, as they facilitate the binding of Ni(II) ions by increasing the availability of active sites. [21].
3.1.4. SEM Analysis
The SEM micrograph of Guar Gum (GG) (Figure 3) reveals an irregular and heterogeneous surface morphology. The material shows a rough texture with aggregated particles of varying sizes distributed across the surface. The presence of cracks and pores indicates a non-uniform and porous surface, which rises the available surface area for adsorption. Larger agglomerates appear embedded in a continuous matrix, while numerous fine particles are scattered on the surface. Such morphological features are typical of natural polysaccharides and are advantageous for adsorption, as they provide multiple active sites for interaction with Ni(II) ions.
3.1.5. TGA Analysis
The thermogravimetric curve of Guar Gum (GG) (Figure 4) shows a three-step degradation profile typical of polysaccharide-based biopolymers. The initial weight loss below 150 °C corresponds to the evaporation of physically adsorbed moisture, accounting for about 8–10% of the total mass. The second major stage, occurring between 220–360 °C, represents the thermal decomposition of the polymer backbone, primarily due to cleavage of glycosidic linkages and breakdown of the galactomannan structure, leading to a mass loss of ~55%. A slower degradation step is observed in the range of 400–700 °C, which is attributed to the carbonization and degradation of more stable residues, leaving about 15–20% char at 800 °C.
This thermal behavior confirms the organic and amorphous nature of GG and highlights its moderate thermal stability, which is sufficient for application in aqueous adsorption processes. The presence of a residual carbonaceous fraction further suggests structural rigidity and crosslinking within the polysaccharide chains.
3.2. Artificial Neural Network (ANN)
The ANN is distinguished by its capacity to deal with a large amount of data since it operates on a self-learning system. In this study, a model was established to expect the removal efficacy of Ni(II) from aqueous solutions based on experimentally collected data. The hidden layer contained 1 layer and 9 neurons. The experimental data employed in this study are displayed in Table 1. The model proved effective in prediction, as the experimental results were in good agreement with the predicted results. It is mathematically verified that the model used is optimal by specifying a minimum value of MSE (3.857), and a maximum value of R2 (0.967).
3.3. Adsorption Studies
3.3.1. pH Effect
The efficiency of adsorption is strongly influenced by the pH value of the medium, as it governs the binding interface between metal ions and the sorbent surface. In this study, the performance of GG in removing Ni(II) ions was investigated across the pH range of 2–12, using both experimental data and ANN predictions. The ANN-predicted values exhibited good agreement with the experimental results, as illustrated in Figure 5. As anticipated, the adsorption effectiveness was significantly influenced by the solution pH. The removal efficiency increased with rising pH up to 7, beyond which it remained nearly constant. This behavior can be attributed to the competition between Ni²⁺ and H+ ions for active adsorption sites on the GG surface under acidic conditions [14]. At pH values above 7, fewer H+ ions are existing, and therefore, more adsorption positions are accessible to Ni(II) ions. The optimal pH value was 7, which was employed throughout this work.
3.3.2. Influence of GG Mass
The influence of GG mass on adsorption efficiency was examined to identify the optimum mass. As shown in Figure 6, the removal of Ni(II) ions, based on both experimental data and ANN predictions, increased steadily with GG mass from 0.05 g to 0.50 g. Further increases beyond 0.50 g produced no significant improvement in adsorption efficiency. This trend is consistent with the expectation that a larger adsorbent mass provides a greater surface area and number of active sites, thereby enhancing removal up to a saturation point. The ANN model successfully reproduced this behavior, accurately predicting the adsorption performance. Accordingly, an optimal GG mass of 0.50 g was employed in subsequent experiments.
3.3.3. Influence of Temperature
The influence of temperature on Ni(II) adsorption by the GG adsorbent was investigated within the range of 25–55 °C, under the previously established optimal conditions. The removal efficiency was also predicted using the ANN model. As illustrated in Figure 7, the adsorption effectiveness decreased with increasing temperature, indicating that the adsorption process is exothermic. This performance can be ascribed to the weak interactions between Ni(II) ions and the active sites of GG, as well as between adjacent molecules in the adsorbed phase [22]. In addition, the possible deactivation or damage of adsorption sites at elevated temperatures may also contribute to the decline in efficiency [14]. The ANN model demonstrated strong predictive capability, closely matching the experimental results for Ni(II) removal from aqueous solution..
The adsorption kinetics of Ni(II) ions were examined by applying both the pseudo-first-order and pseudo-second-order models to the experimental data. The pseudo-first-order kinetic equation is presented in Eq. (6) [23], while the pseudo-second-order kinetic model is expressed in Eq. (7) [24].
In these equations, qe and qt(mg g⁻¹) denote the amounts of Ni(II) ions adsorbed per unit mass of adsorbent at equilibrium and at time t, respectively. The parameter k1(min⁻¹) represents the pseudo-first-order rate constant, whereas k2 (g mg⁻¹ min⁻¹) refers to the pseudo-second-order rate constant of the adsorption process.
Linearized plots were used to assess the suitability of the kinetic models, and the calculated parameters are summarized in Table 2. Based on the correlation coefficient (R²) values, the adsorption data showed a stronger agreement with the pseudo-second-order model, indicating that chemisorption through coordination of Ni(II) ions with active functional groups on the GG surface is the rate-controlling step.
3.3.4. Influence of Contact Time
For assessing the optimal contact time for removing Ni(II) ions by GG, the effect of contact time was examined at constant experimental conditions and using an ANN model to predict the removal efficiency. The results are displayed in Figure 8. Within 25 minutes, the removal percentage was 93%. Then the uptake rate reached equilibrium. Compared with earlier studies [14,15], the GG adsorbent achieved Ni(II) removal in a shorter time, which makes it more efficient. The accuracy of the prediction of Ni(II) removal efficacy and its agreement with the experimental results can also be observed.
3.3.5. Thermodynamic Studies
The removal of Ni(II) ions by GG was examined at 25, 35, 45, and 55 °C to assess the effect of temperature on adsorption efficacy. The results showed a decrease in the adsorbed amount of Ni(II) ions with increasing temperature, confirming the exothermic nature of the process. This decline may be ascribed to the deactivation or deterioration of adsorption sites at higher temperatures [14].
Thermodynamic parameters, namely the changes in free energy (ΔG°), enthalpy (ΔH°), and entropy (ΔS°), were determined using Equations (8 - 10) and Figure 9.
In these equations, KD represents the equilibrium constant; qe (mg g⁻¹) is the amount of Ni(II) ions adsorbed per gram of GG; Ce (mg L⁻¹) is the equilibrium concentration of Ni(II) ions in solution; R is the gas constant (8.314 J mol⁻¹ K⁻¹); and T(K) denotes the temperature [14].
The thermodynamic variables were determined from the linear plot of ln KD versus 1/T (Figure 7), and the values are summarized in Table 3. The negative ΔH° value confirms that the adsorption process is exothermic, while the positive ΔS° value indicates its spontaneity, reflecting structural alterations in the GG adsorbent upon interaction with Ni(II) ions. The relatively high ΔS° value may be ascribed to the rough and porous texture of the GG surface, which enhances randomness at the solid/solution boundary throughout Ni(II) uptake.
Additionally, the ΔG° values were consistently negative across all studied temperatures and became progressively less negative with rising temperature, implying that adsorption occurs more readily at lower temperatures. All ΔG° values were found to lie between 0 and –20.0 kJ mol⁻¹, confirming the physical nature of the adsorption process [24].
3.3.6. Adsorption Isotherms
Adsorption isotherm experiments were performed at various concentrations of Ni(II) ions, and the results are presented in Figure 10. The data were examined using both the Langmuir and Freundlich models (Eqs. 11 and 12, respectively) [25].
In this context, qe (mg g⁻¹) denotes the equilibrium adsorption capacity, qm (mg g⁻¹) represents the maximum adsorption capacity, Ce (mg L⁻¹) is the remaining concentration of Ni(II), and KL is the Langmuir constant. The Freundlich constants are expressed as Kf and n.
The Langmuir model (Figure 10) was evaluated by plotting Ce/qe versus Ce, from which qm and KL were found from the slope and intercept, respectively. Similarly, the Freundlich model was analyzed by plotting ln qe versus ln Ce, where the slope and intercept yielded the values of n and Kf, respectively. The calculated parameters from both models are presented in Table 4.
The Langmuir model exhibited a higher correlation coefficient (R²) compared to the Freundlich model. The calculated qm value of 86.0 was consistent with the experimental findings, confirming that the Langmuir model provides a good fit to the data. According to this model, adsorption is considered favorable when 0 < RL < 1, linear at RL = 1, and unfavorable when RL > 1. The values of RL were obtained using Eq. (13).
Results revealed that RL values lie in the range 0.44 to 0.04, designating that the process is a favorable.
In the Freundlich model, the parameter n defines the connection between adsorbate concentration and the adsorption process: n < 1 indicates a physical process, n = 1 corresponds to a linear process, and n > 1 reflects a chemical process [26]. Results revealed that the n value is 0.87 confirming that the adsorption of Ni(II) onto GG proceeds predominantly through a physical mechanism.
3.4. The KNN Model
The KNN model (Figure 11) provided a reliable prediction of Ni(II) adsorption efficiency under varying operating conditions. Cross-validation results demonstrated that KNN achieved an R² of 0.942, with an MSE of 4.621 and RMSE of 2.15, confirming that the adsorption process is learnable even with a simple non-parametric approach. By comparison, the ANN model achieved a higher R² of 0.967 with a lower MSE of 3.857 and RMSE of 1.96, indicating superior predictive performance. The parity plots further highlighted that while KNN tracked the experimental data closely, ANN achieved a tighter fit to the 1:1 line, particularly at the extremes of high and low removal efficiencies. These findings indicate that although KNN offers a robust and computationally simple model, the ANN remains superior in capturing the complex nonlinear relationships among the influencing factors. Together, the complementary use of KNN and ANN strengthens the reliability of the predictive modeling approach applied in this study.
3.5. Hierarchical Clustering Analysis of Influencing Factors
To complement the one-factor-at-a-time analysis, a hierarchical cluster analysis (HCA) was carried out to evaluate the combined influence of pH, adsorbent mass, contact time, initial Ni(II) concentration, and temperature on the removal efficiency. The dendrogram is shown in Figure 12 (AI gen.) was constructed using Pearson correlation as a similarity measure and Ward’s linkage method. This multivariate approach enables a holistic understanding of the relative roles of the investigated parameters.
The clustering pattern clearly separates the parameters into two main groups. Adsorbent dosage and pH form a tight cluster with removal efficiency, indicating their dominant role in controlling Ni(II) uptake. This agrees with the individual experiments, where increasing the mass of GG significantly enhanced the removal performance up to a saturation point, and where pH adjustment strongly affected metal ion speciation and adsorbent surface charge. Contact time and temperature cluster together in a secondary branch, reflecting their shared influence on adsorption kinetics. The process was found to be rapid within the first 20–30 minutes, while temperature played a less significant role, with higher values slightly reducing adsorption because of the the exothermic nature of the process. In contrast, initial concentration appears as a separate cluster, highlighting its distinct role. While increasing concentration generally leads to a decrease in removal percentage (due to saturation of available sites), it simultaneously increases the adsorption capacity per unit mass of GG. This dual effect explains its separation from the other parameters in the dendrogram.
Overall, the HCA confirms that pH and dosage are the most critical parameters for optimizing Ni(II) removal efficiency using GG, while contact time and temperature play supportive roles in kinetics, and initial concentration primarily governs the adsorption capacity trade-off. This multivariate statistical insight strengthens the interpretation of the batch adsorption experiments and provides guidance for process optimization.
3.6. Heat Map Analysis
The correlation heat map (Figure 13) highlights the relative influence of the investigated factors on Ni(II) removal efficiency. Adsorbent dosage and pH show the strongest positive correlations with efficiency, confirming their primary role in optimizing adsorption performance. Contact time and temperature exhibit moderate associations, indicating their secondary influence, mainly on adsorption kinetics. In contrast, initial concentration shows a weaker or negative correlation with removal efficiency, consistent with site saturation at higher ion loads. These results support the conclusion that pH and dosage are the most critical parameters for maximizing Ni(II) uptake onto GG.
3.7. Selectivity
Selective adsorption experiments were carried out in an aqueous solution containing multiple interfering ionic species, namely Cu(II), Pb(II), Cr(VI), and Ni(II). These competing ions were chosen due to their analogous charge modes or charges, as well as their frequent coexistence with Ni(II) in industrial effluents (e.g., from electronic industries) and in natural sources.
The selectivity parameters, calculated using Eqs. (3,4) and summarized in Table 5, were found to be approximately five times higher for Ni(II) compared to the other competing ions. Furthermore, the relative selectivity coefficient values (>1) confirm that GG exhibits strong selectivity toward Ni(II) ions.
3.8. Regeneration and Reusability
Desorption and regeneration of the sorbent is a key challenge mainly from the economic point of view. The adsorption–desorption process was carried out for five successive cycles using the same sorbent (Figure 14), with each cycle evaluated according to Eq. (5). was used to calculate the regeneration efficacy. In the final adsorption cycle, the GG adsorbent retained ~86% of its initial capacity, demonstrating excellent reusability.
4. Conclusions
This study demonstrated the effectiveness of Guar Gum (GG) as a sustainable and inexpensive sorbent for the removal of Ni(II) ions from synthetic wastewater. Characterization using FTIR, SEM, TGA, BET, and XRD confirmed the structural features of GG and the successful adsorption of Ni(II) ions. The adsorption behavior was more accurately represented by the pseudo-second-order kinetic model and fitted well with the Langmuir isotherm, yielding a maximum adsorption capacity of 86.0 mg g⁻¹ under optimal conditions (0.8 g/50 mL, pH 7.0, 30 min contact time). Thermodynamic analysis indicated a physisorption-driven and exothermic process. Machine learning models provided further insight into the adsorption behavior. The ANN model showed excellent predictive performance (R² = 0.967, MSE = 3.857), while KNN modeling offered an additional validation tool, enabling a comparative evaluation of prediction accuracy. Dendrogram and heat map analyses highlighted the relative significance of key determinant variables such as pH, adsorbent mass, and initial Ni(II) ion concentration. Overall, the findings confirm that Guar Gum is a promising eco-friendly adsorbent for heavy metal remediation, and that coupling experimental investigations with machine learning approaches can significantly enhance process understanding and optimization.
Author Contributions
“Conceptualization, IH Ali, methodology, MF Alqahtani; software, SB Eltahir; validation, ND Eljack; MH Ahmed; formal analysis, A. Elkhaleefa; investigation, SB Eltahir; data curation, MH Ahmed; writing—original draft preparation, ND Eljack; writing—review and editing, ND Eljack; supervision, IH Ali; project administration, A. Elkhaleefa; funding acquisition, IH Ali. All authors have read and agreed to the published version of the manuscript.”
Funding
The authors extend their appreciation to the Deanship of Research and Graduate Studies at King Khalid University for funding this work through research groups program under grant number R.G.P.2/369/1446.
Data Availability Statement
The data is available upon request.
Conflicts of Interest
The authors declare no conflict of interest.
References
- Briffa, J.; Sinagra, E.; Blundell, R.; Heavy metal pollution in the environment and their toxicological effects on humans. Heliyon 2020, 6, e04691. [CrossRef]
- Tchounwou, P.B.; Yedjou, C.G.; Patlolla, A.K.; Sutton, D.J. Heavy metal toxicity and the environment. In EXS 2012, 101, 133-164.
- Walker, C.H.; Sibly, R.M.; Hopkin, S.P.; D.B.P. Principles of Ecotoxicology; Group, T. And F., Ed.; 4th Edition, CRC Press, 2012.
- Duffus, J.H.; Heavy metals” a meaningless term? Pure Appl. Chem 2002, 74, 793-807.
- Herawati, N.; Suzuki, S.; Hayashi, K.; Rivai, I.F.; Koyama, H. Cadmium, copper, and zinc levels in rice and soil of Japan, Indonesia, and China by soil type. Bull. Environ. Contam. Toxicol 2000, 64, 33-39. [CrossRef]
- He, Z.L.; Yang, X.E.; Stoffella, P.J. Trace elements in agroecosystems and impacts on the environment. J Trace Elem Med Biol 2005, 19, 125-140. [CrossRef]
- Shi, Z. Nickel carbonyl: toxicity and human health. Sci Total Environ 1994, 148, 293-8. [CrossRef]
- International Programme on Chemical Safety (IPCS), Chemical. Environmental Health Criteria 108: Nickel. WHO. Geneva, 1991.
- Kornik, R. and Zug, K. A. Nickel. Dermatitis 2008, 19, 3-8.
- Qasem, N.A.A., Mohammed, R.H.; Lawal, D.U. Removal of heavy metal ions from wastewater: a comprehensive and critical review. npj Clean Water 2021, 4, 36-51.
- Mahmood, T.; Khan, A.; Abdul Naeem, Hamayun, M.; Muska, M. Farooq, M.; Hussain, F. Adsorption of Ni(II) ions from aqueous solution onto a fungus Pleurotus ostreatus. Desalination and Water Treatment 2016, 57, 7209-7218. [CrossRef]
- Akram, M.; Bano, Z.; Ul Ain Bhutto, S.; Majeed, M.K.; Pan, J.; Li, L.; Xia,M.; Wang, F.; Enhanced nickel (II) removal from aqueous media using magnesium-Punica granatum linn based adsorbent: Mechanism and performance, Journal of Molecular Liquids, 2025, 431, 127808. [CrossRef]
- Li, Z.; Lu, G.; Du, D.; Zhao, D.; Harnessing low-cost adsorbents for removal of heavy metals and metalloids in contaminated water: Progress in the past decade and future perspectives, Journal of Cleaner Production, 2025, 518, 145845. [CrossRef]
- Elkhaleefa, A.; Ali, I.H.; Brima, E.I.; Elhag, A.B.; Karama, B. Efficient removal of Ni (II) from aqueous solution by date seeds powder biosorbent: adsorption kinetics, isotherm and thermodynamics. Processes 2020, 8, 1001. [CrossRef]
- Thangaraj, V.; Aravamudan, K.; Lingam, R.; Subramanian, S. Individual and simultaneous adsorption of Ni (II), Cd (II), and Zn (II) ions over polyamide resin: Equilibrium, kinetic and thermodynamic studies. Environmental Progress & Sustainable Energy 2019, 38, S340-S351. [CrossRef]
- Charazińska, S., Burszta-Adamiak, E.; Lochyński, P. Recent trends in Ni(II) sorption from aqueous solutions using natural materials. Rev Environ Sci Biotechnol 2022, 21, 105–138. [CrossRef]
- Maind, S.B. and P. Wankar, Research paper on basic of artificial neural network. International Journal on Recent and Innovation Trends in Computing and Communication, 2014. 2(1): p. 96-100.
- Khan, M.I., et al., Efficient adsorption of hexavalent chromium ions onto novel ferrochrome slag/polyaniline nanocomposite: ANN modeling, isotherms, kinetics, and thermodynamic studies. Environ Sci Pollut Res Int, 2022. 29(57): p. 86665-86679. [CrossRef]
- Turp, S.M., Prediction of adsorption efficiencies of Ni (II) in aqueous solutions with perlite via artificial neural networks. Archives of Environmental Protection, 2017. 43(4). [CrossRef]
- Iqbal, D.N.; Nazir, A.; Iqbal, M.; Yameen, M. Green synthesis and characterization of carboxymethyl guar gum: Application in textile printing technology. Green Processing and Synthesis 2020, 9, 212-218. [CrossRef]
- Singha, V.; Tiwaria, A.; Tripathia, D.N.; Sanghib, R. Microwave assisted synthesis of Guar-g-polyacrylamide, Carbohydrate Polymers 2004, 58, 1-6.
- Alghamdi, M. M., Alhomod, E. Y., Awwad, N. S., Idris, A. M., & El-Zahhar, A. A. (2022). Fast removal of methylene blue by modified sorel cement using manganese (VII) as an additive: kinetics, thermodynamics, and equilibrium studies. International Journal of Environmental Analytical Chemistry, 1-21. [CrossRef]
- Senthilkumar, K.; Chitradevi, V.; Mothil, S.; Kumar, M.N.; Kokilavani, N.S. Kinetics and Adsorption of Removal of Ni (II) ions by using Egg Shell Powder. International Journal of Industrial Engineering 2018, 2, 41-50.
- Ali, I.H.; Bani-Fwaz, M.Z.; El-Zahhar, A.A.; Marzouki, R.; Jemmali, M.; Ebraheem, S.M. Gum Arabic-Magnetite Nanocomposite as an Eco-Friendly Adsorbent for Removal of Lead (II) Ions from Aqueous Solutions: Equilibrium, Kinetic and Thermodynamic Studies. Separations 2021, 8, 224. [CrossRef]
- Ali, I.H.; Al Mesfer, M.K.; Khan, M.I.; Danish, M.; Alghamdi, M.M. Exploring adsorption process of lead (II) and chromium (VI) ions from aqueous solutions on acid activated carbon prepared from Juniperus procera leaves. Processes 2019, 7, 217-230. [CrossRef]
- Elkhaleefa, A.; Ali, I.H.; Brima, E.I.; Shigidi, I.; Elhag, A.; Karama, B. Evaluation of the adsorption efficiency on the removal of lead (II) Ions from aqueous solutions using Azadirachta indica leaves as an adsorbent, Processes 2021, 9, 559-673. [CrossRef]
Figure 1.
FT-IR spectra of Ni(II) free (a) and Ni(II) loaded (b) GG.
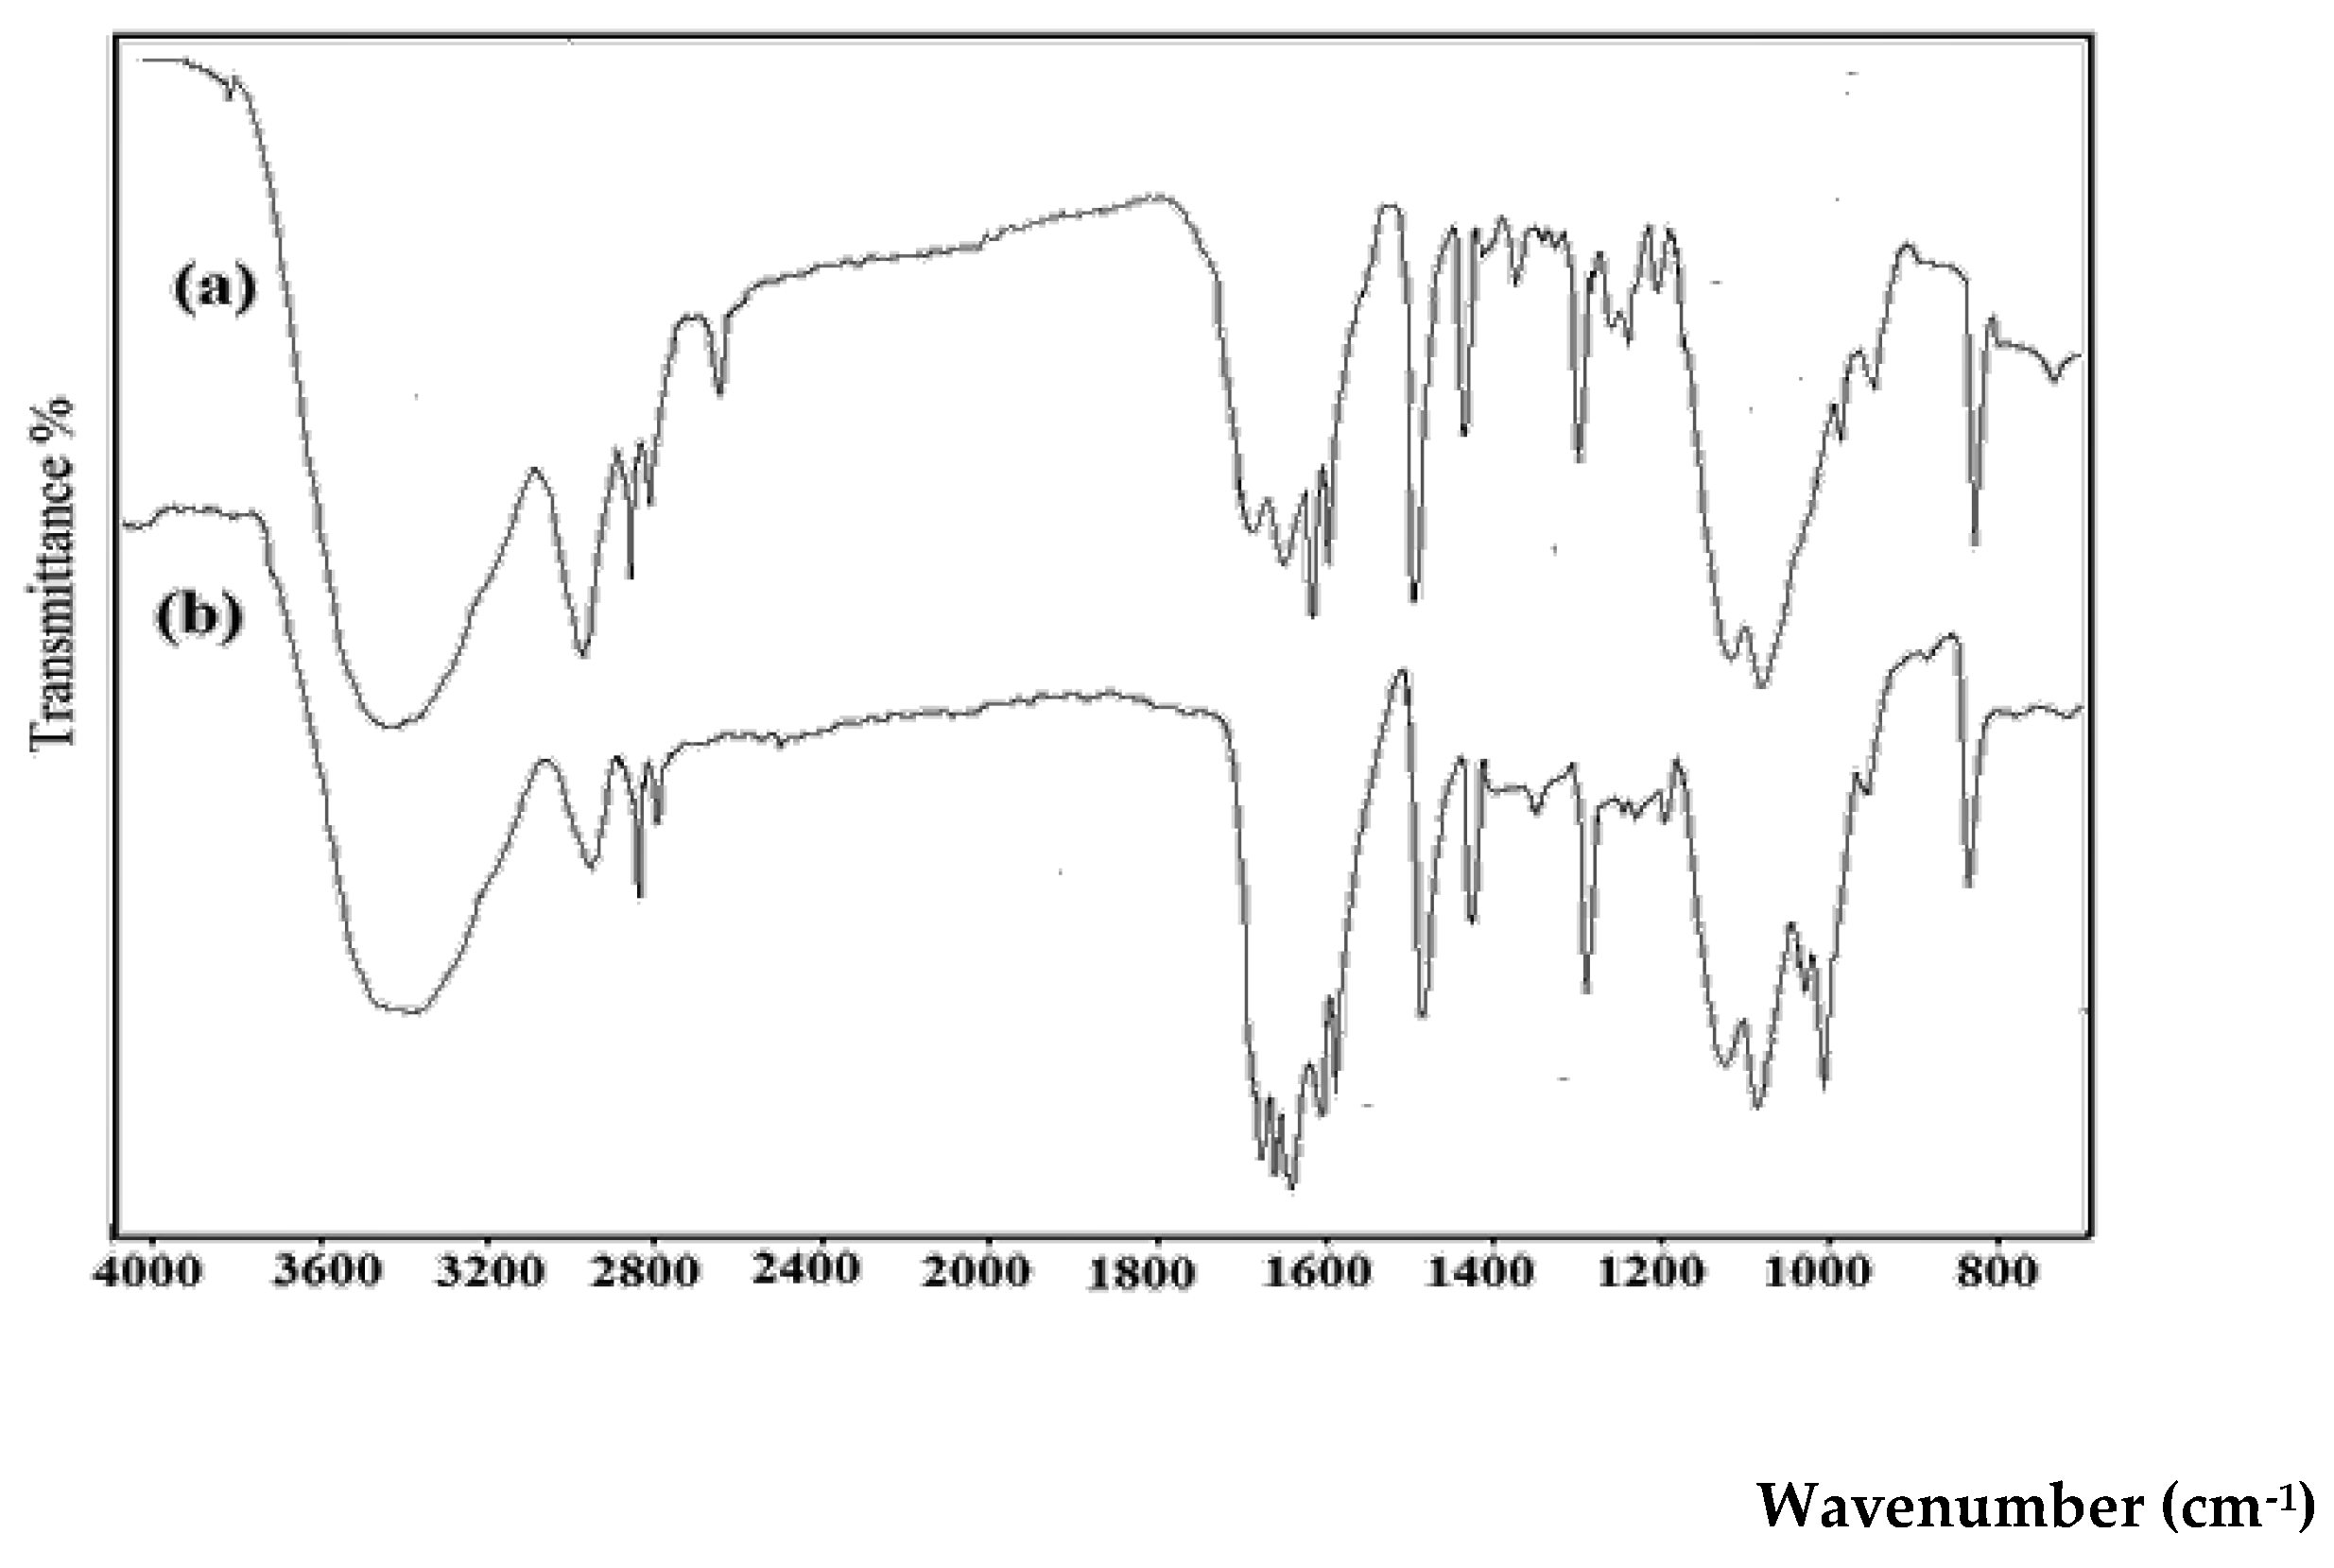
Figure 2.
X-ray diffractogram of GG.
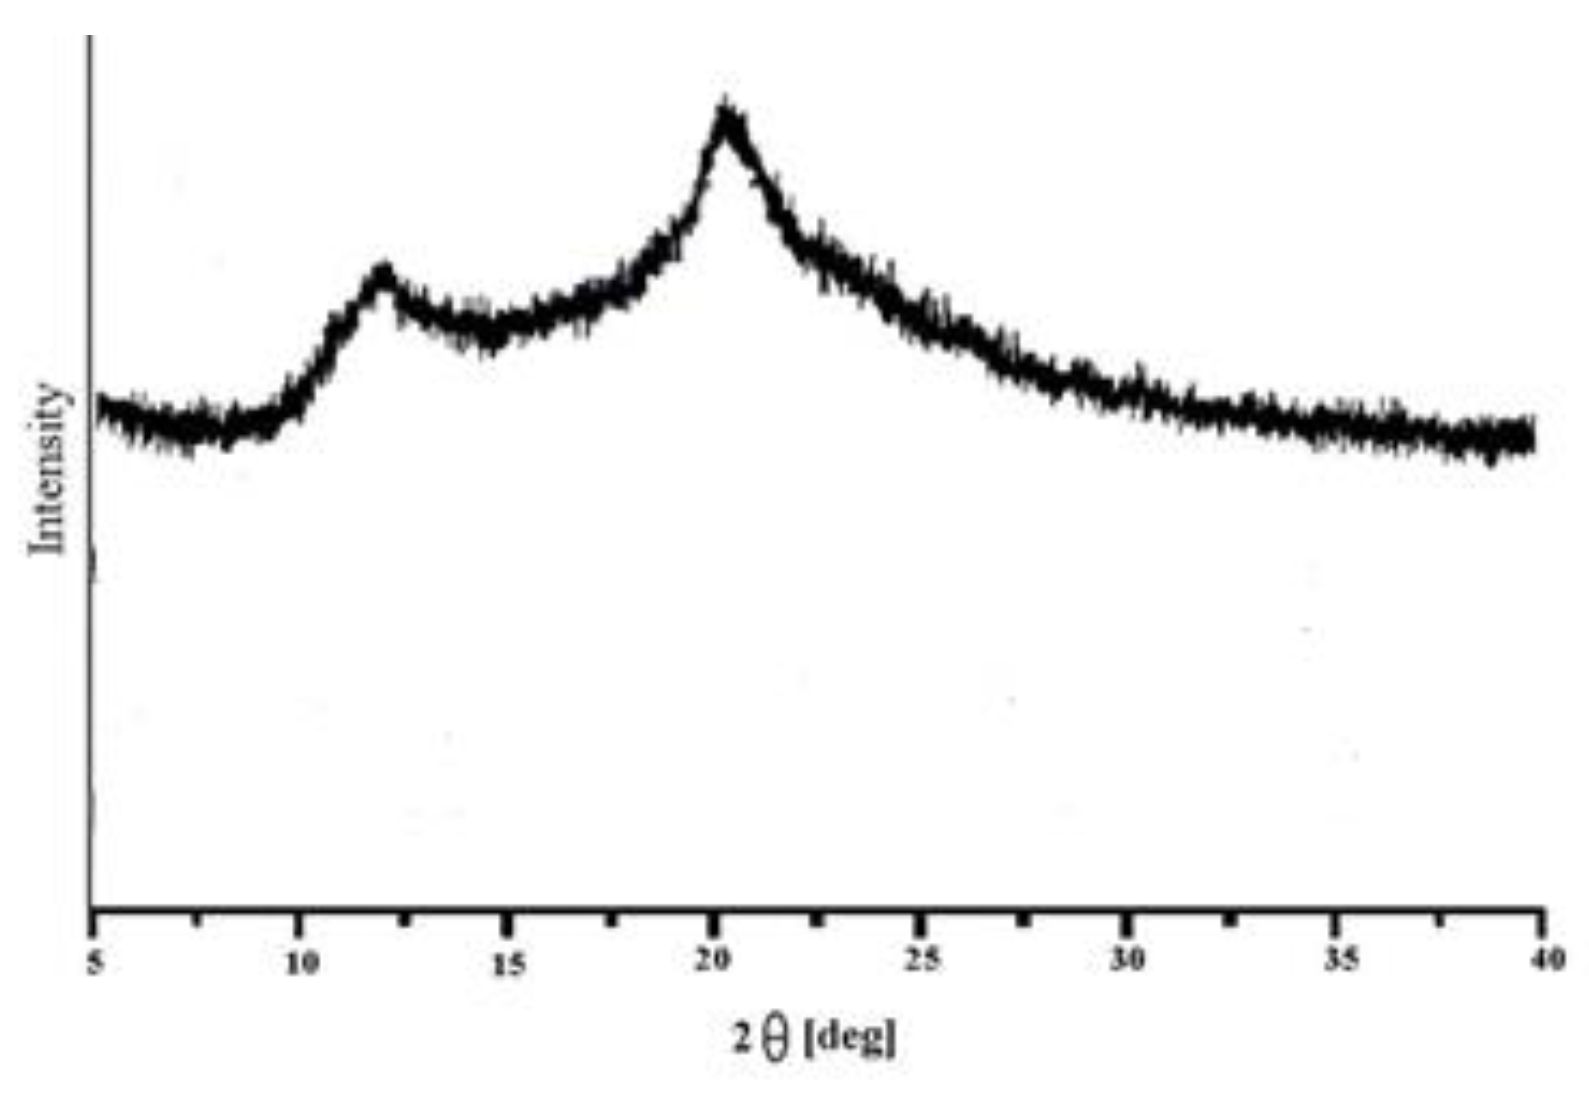
Figure 3.
SEM photos of (a) GG , and (b) Ni(II)-GG.
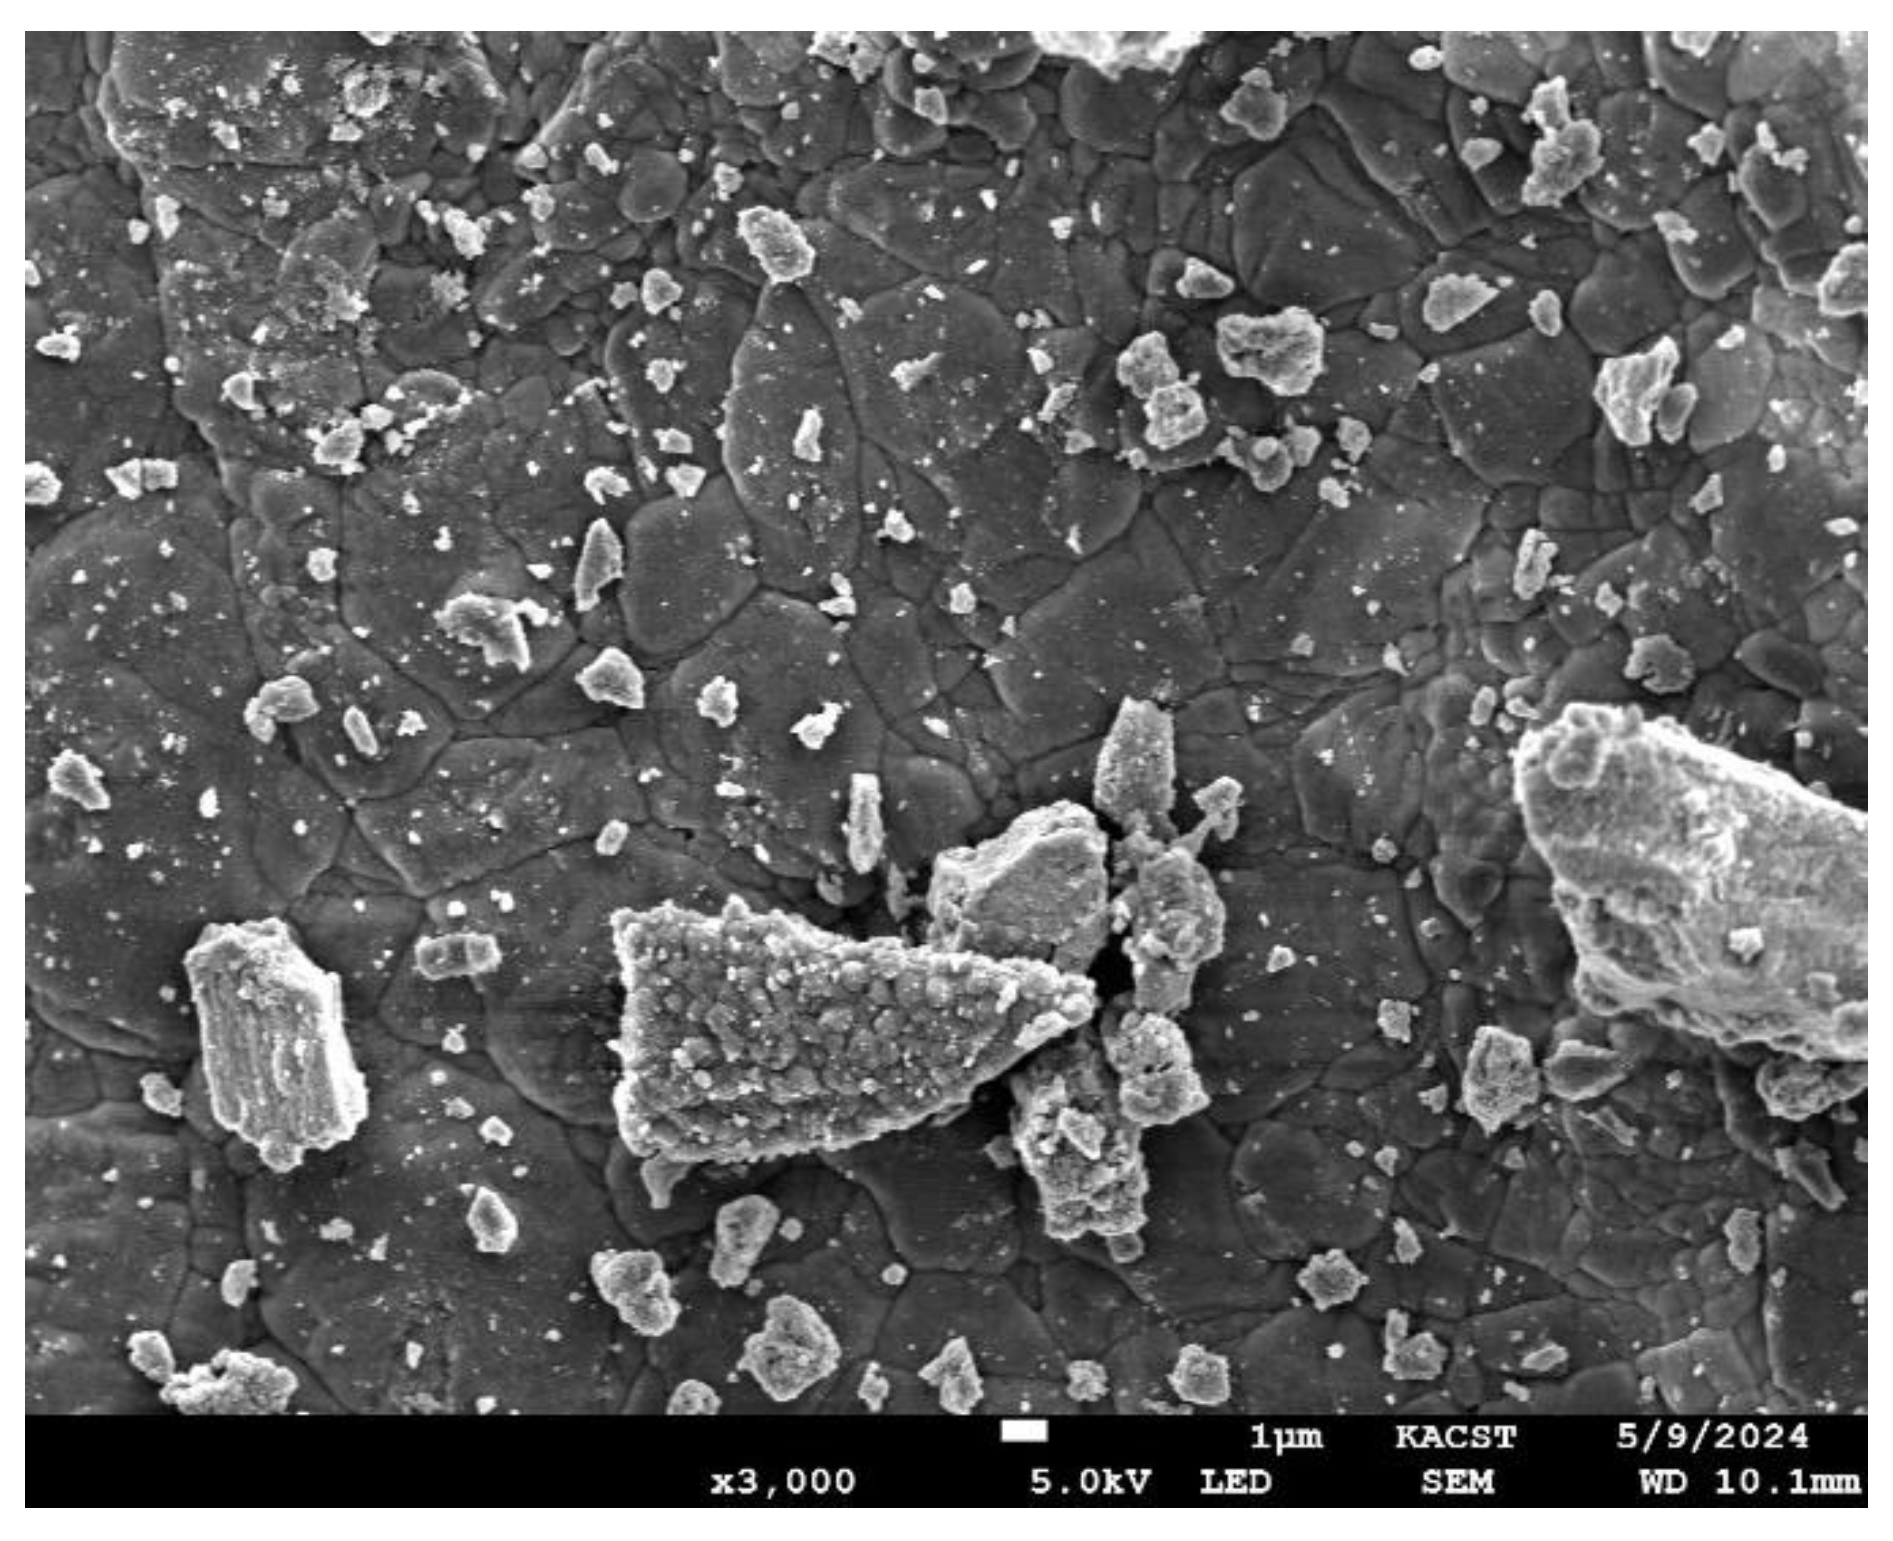
Figure 4.
Thermogravimetric analysis (TGA) curve of Guar Gum (GG) showing mass loss as a function of temperature.
Figure 4.
Thermogravimetric analysis (TGA) curve of Guar Gum (GG) showing mass loss as a function of temperature.
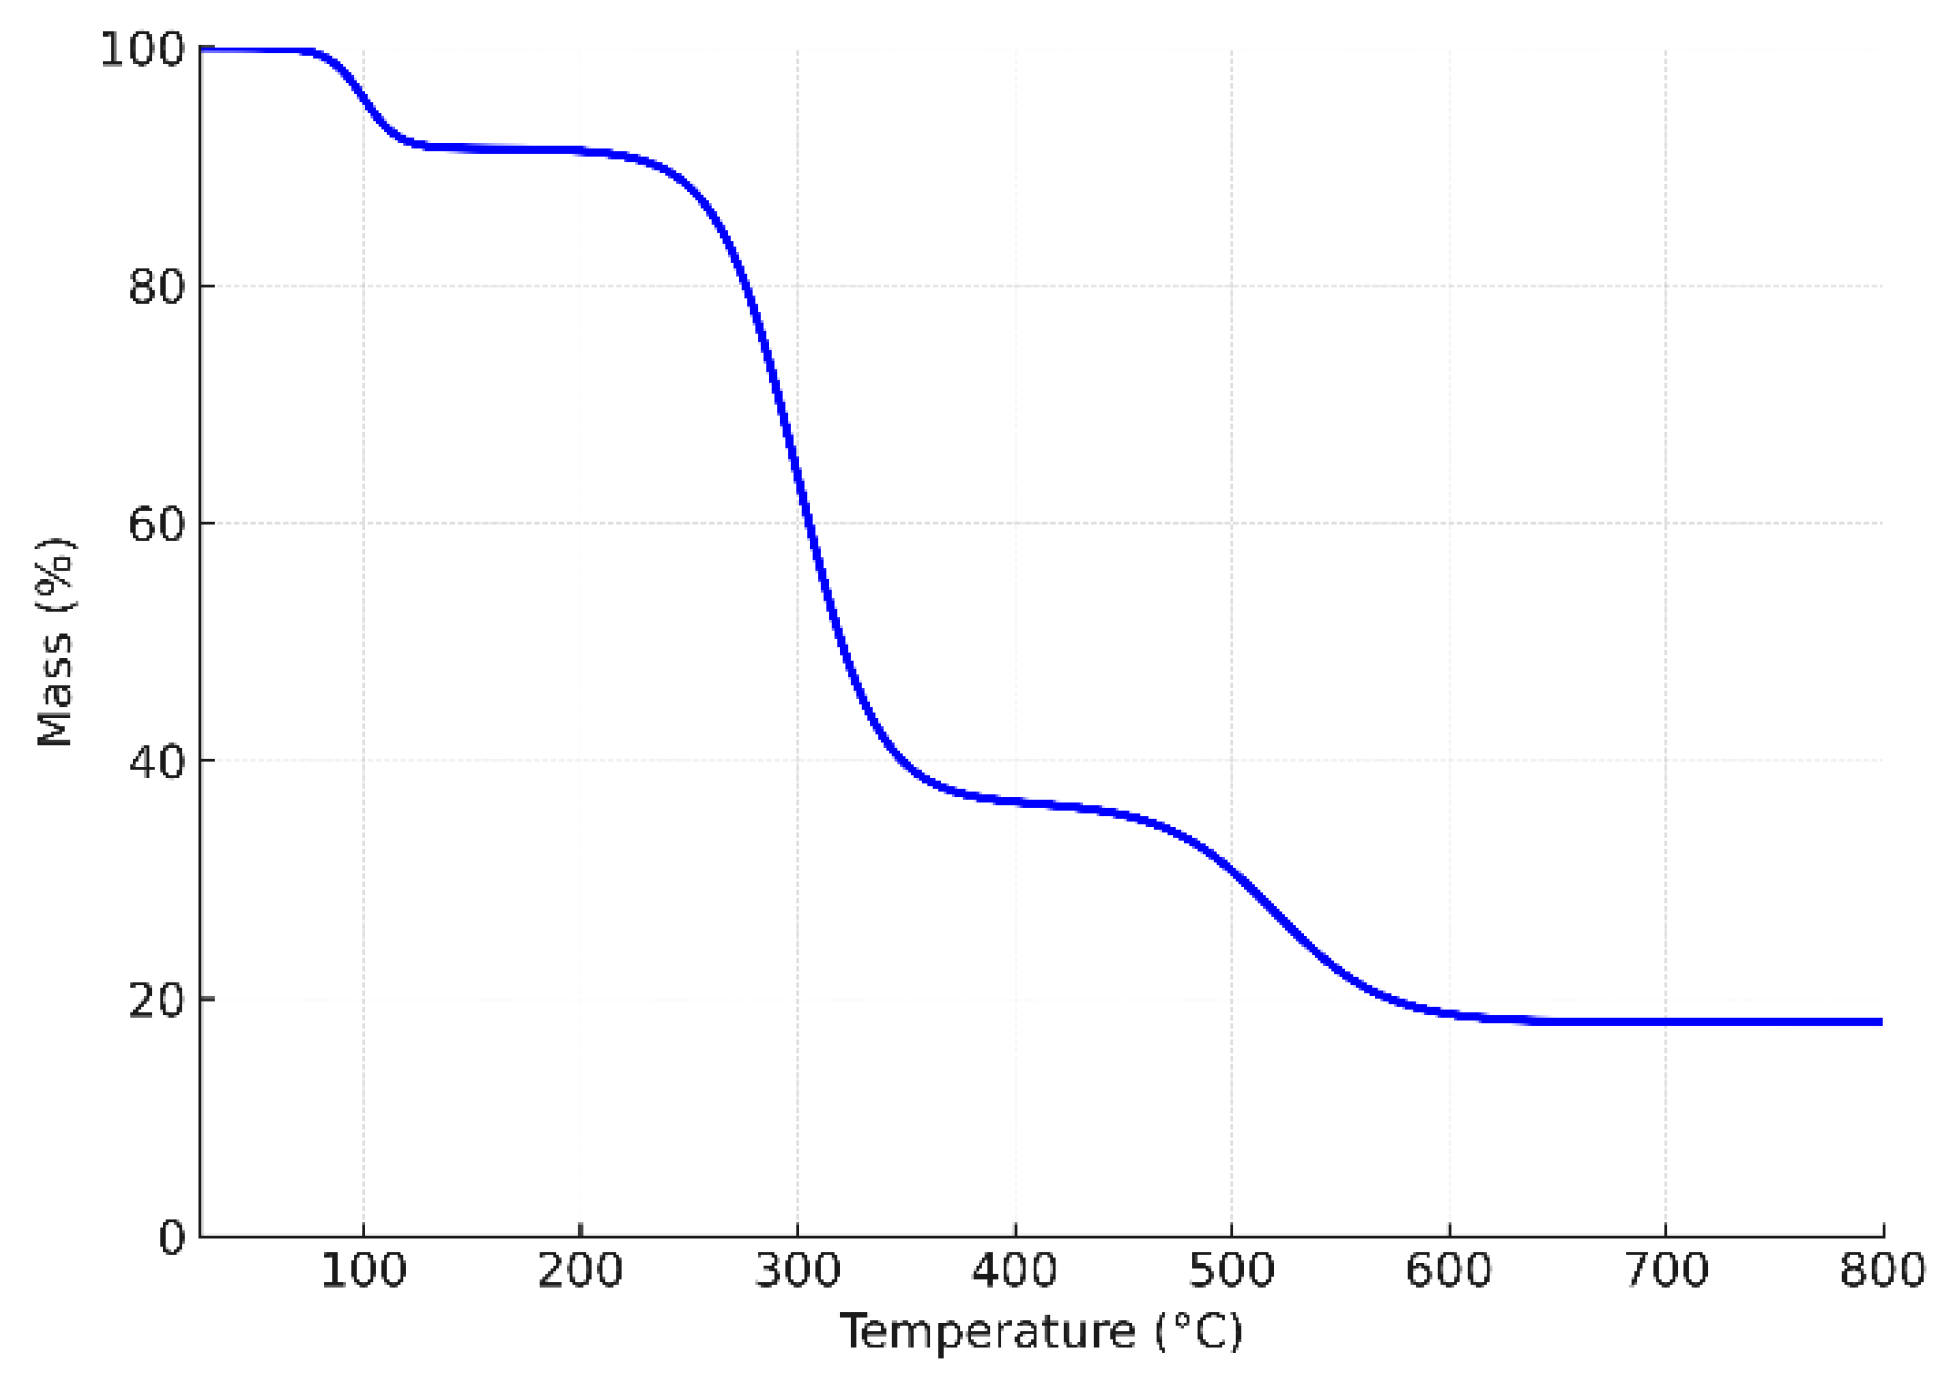
Figure 5.
Influence of pH on the adsorption of Ni(II) by GG under fixed conditions (initial concentration 50 mg L⁻¹, 0.5 g adsorbent, 30 min contact time, 150 rpm, 25 °C).
Figure 5.
Influence of pH on the adsorption of Ni(II) by GG under fixed conditions (initial concentration 50 mg L⁻¹, 0.5 g adsorbent, 30 min contact time, 150 rpm, 25 °C).
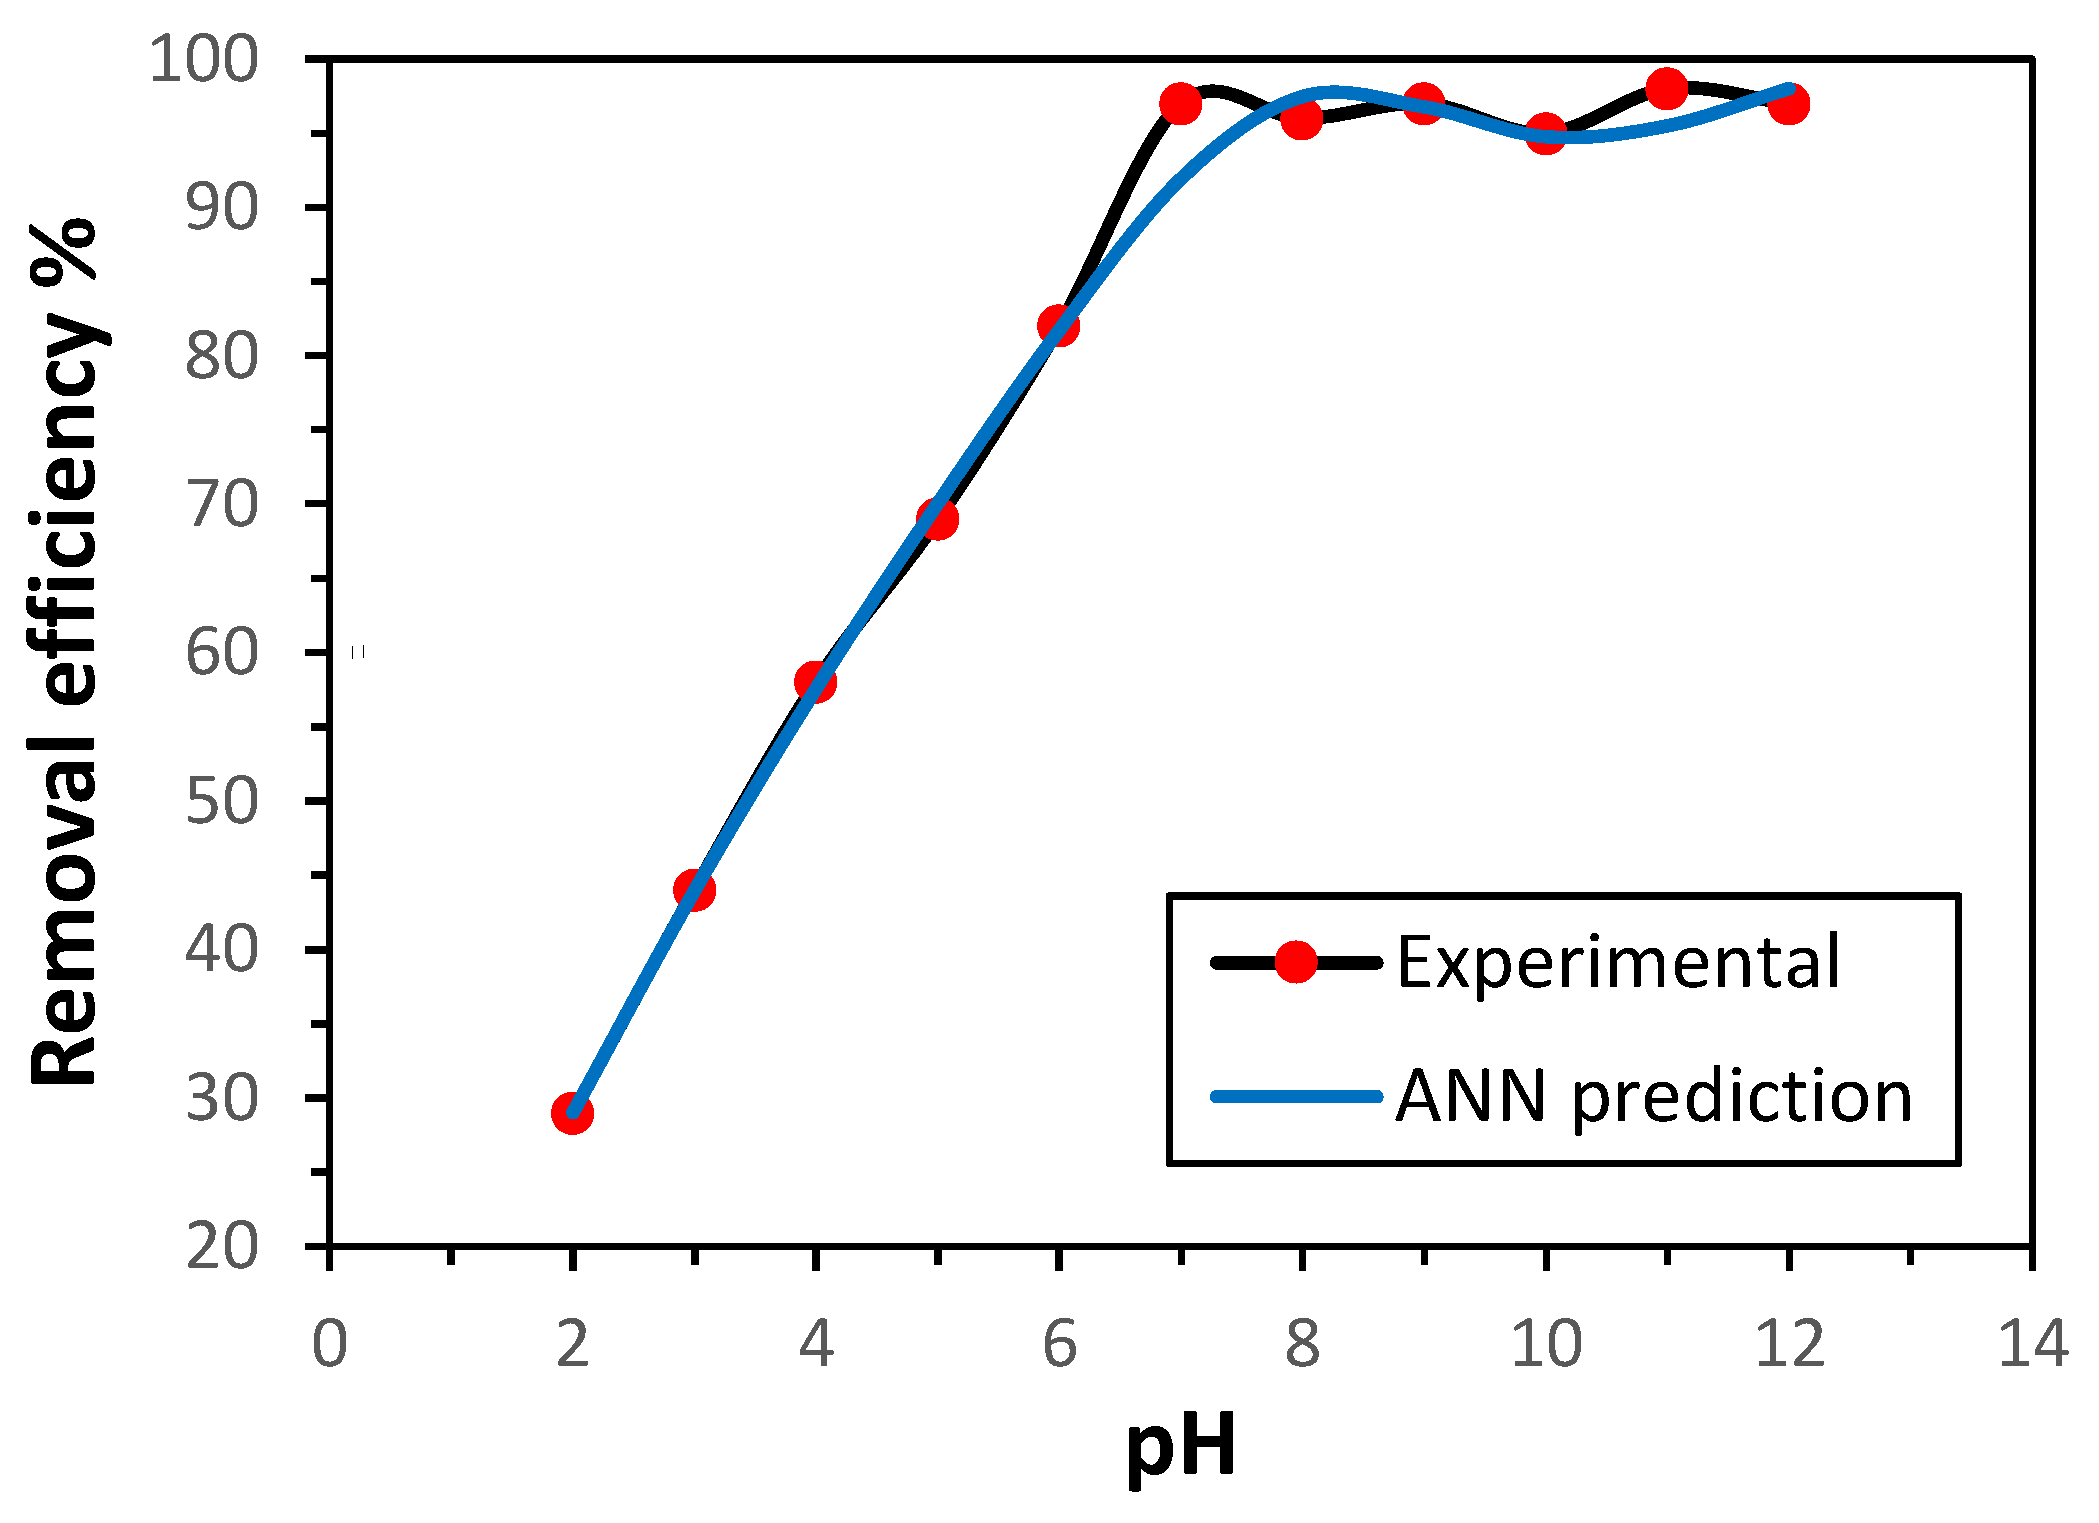
Figure 6.
Effect of GG mass on the uptake of Ni(II) ions (initial concentration 50 mg/L, time 30 min, pH 7.0, shaking rate 150 rpm, 25 oC).
Figure 6.
Effect of GG mass on the uptake of Ni(II) ions (initial concentration 50 mg/L, time 30 min, pH 7.0, shaking rate 150 rpm, 25 oC).
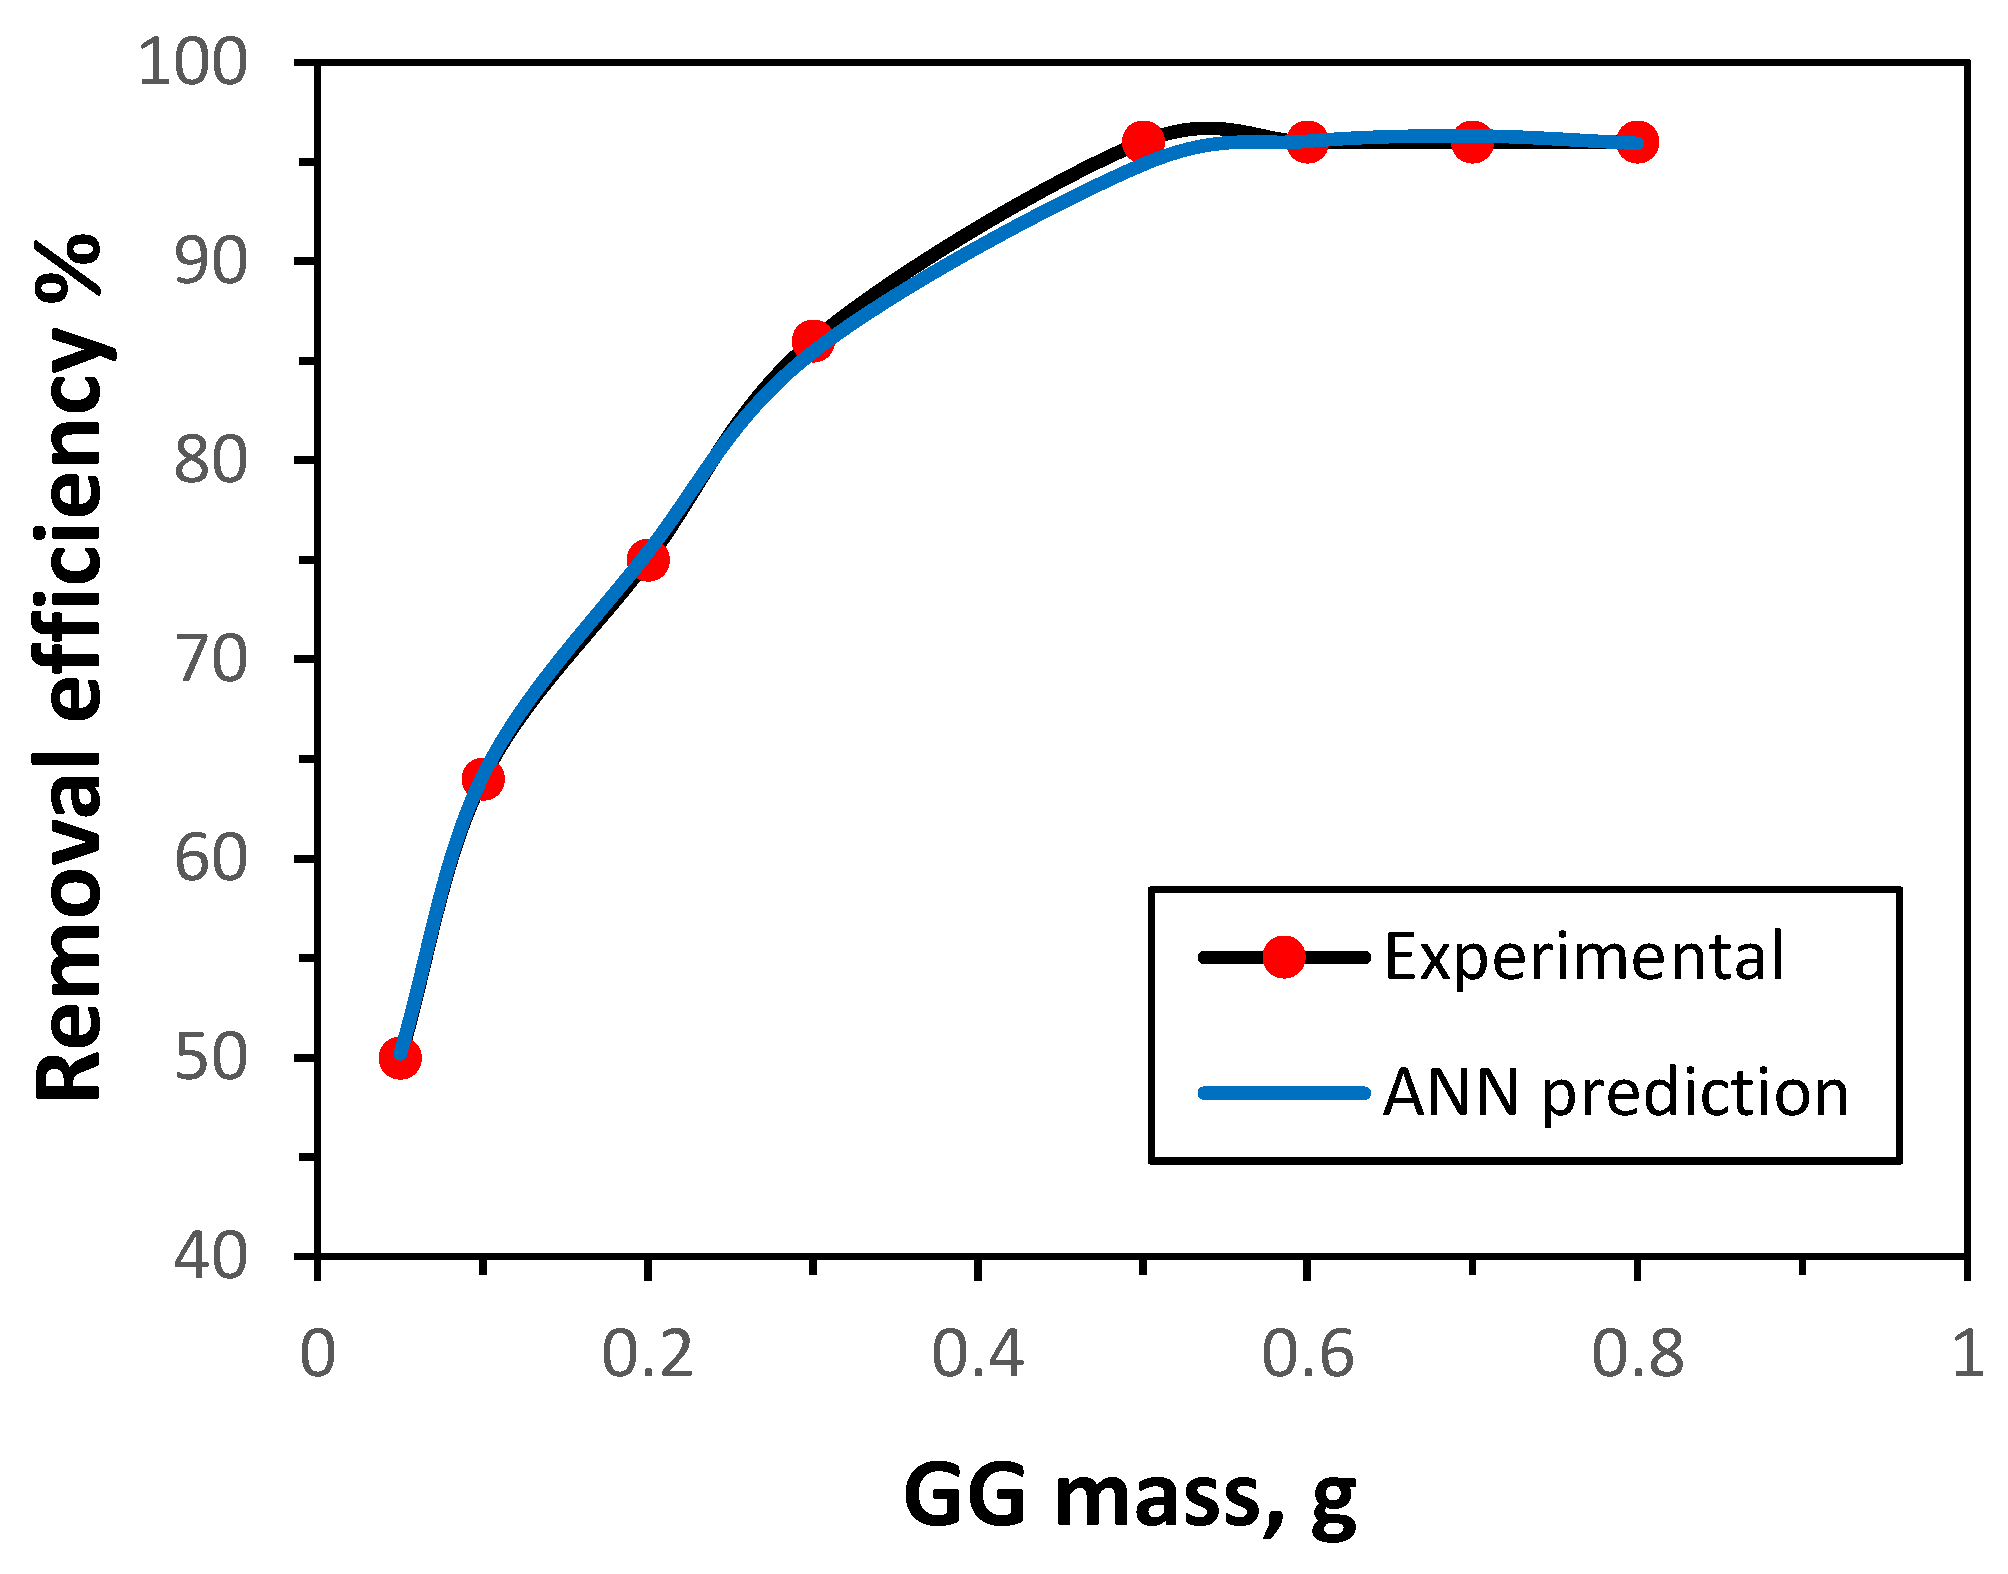
Figure 7.
Effect of Temperature on the uptake of Ni(II) ions (initial concentration 50 mg/L, adsorbed mass 0.5 g, time 30 min, pH 7.0, shaking rate 150 rpm.
Figure 7.
Effect of Temperature on the uptake of Ni(II) ions (initial concentration 50 mg/L, adsorbed mass 0.5 g, time 30 min, pH 7.0, shaking rate 150 rpm.
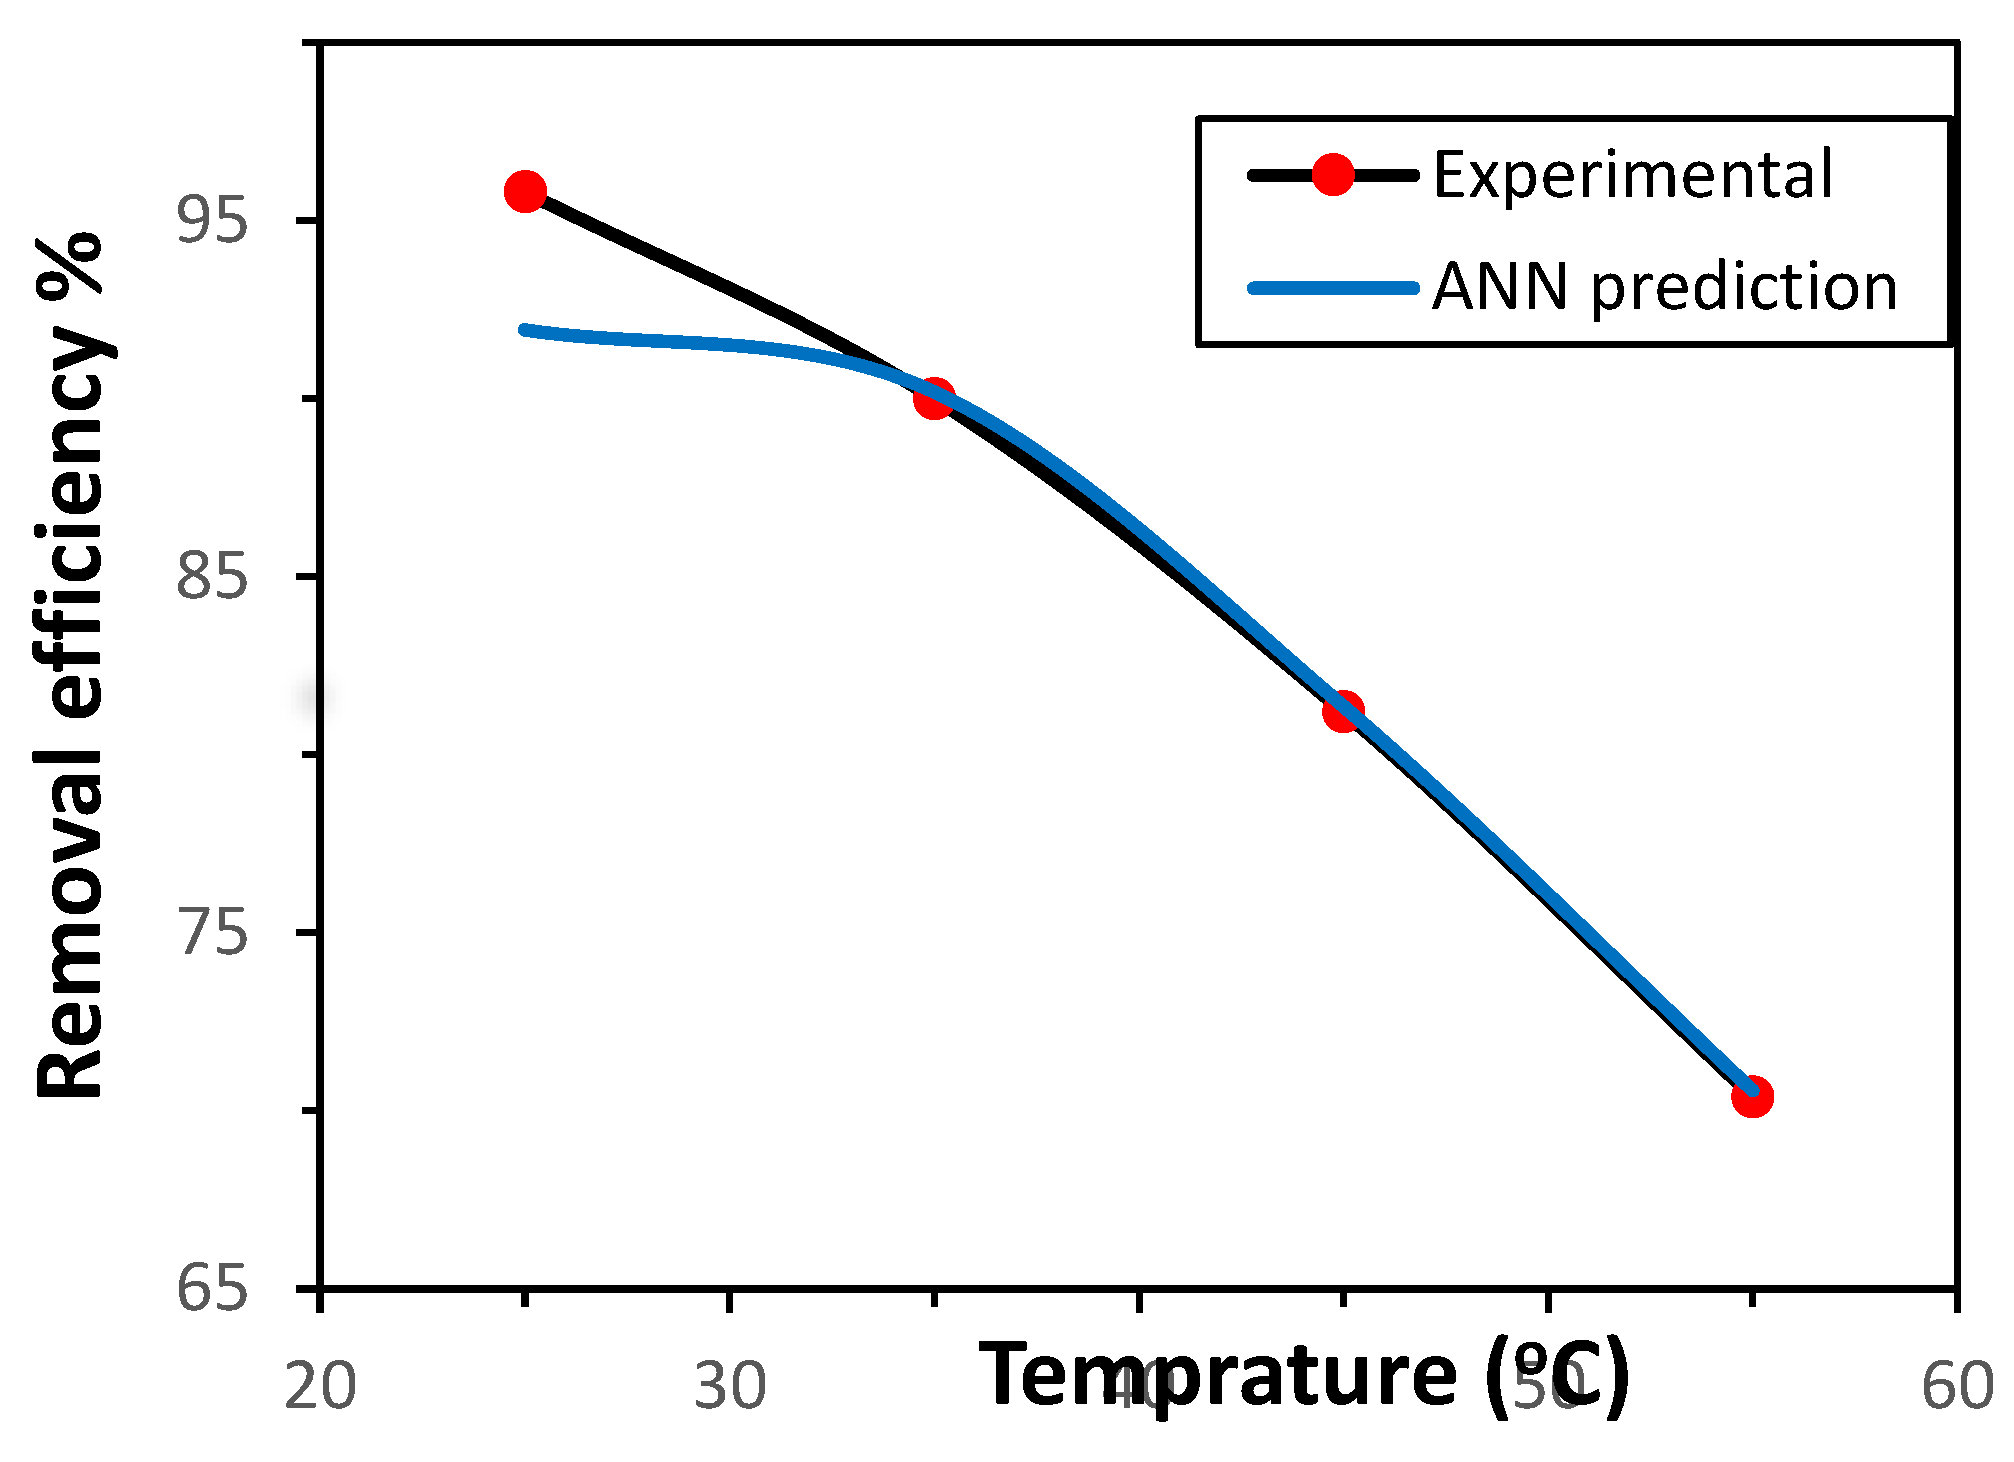
Figure 8.
Variation in Ni(II) uptake by GG as a function of contact time under fixed conditions (initial concentration 50 mg L⁻¹, 0.5 g adsorbent, pH 7.0, 150 rpm, 25 °C).
Figure 8.
Variation in Ni(II) uptake by GG as a function of contact time under fixed conditions (initial concentration 50 mg L⁻¹, 0.5 g adsorbent, pH 7.0, 150 rpm, 25 °C).
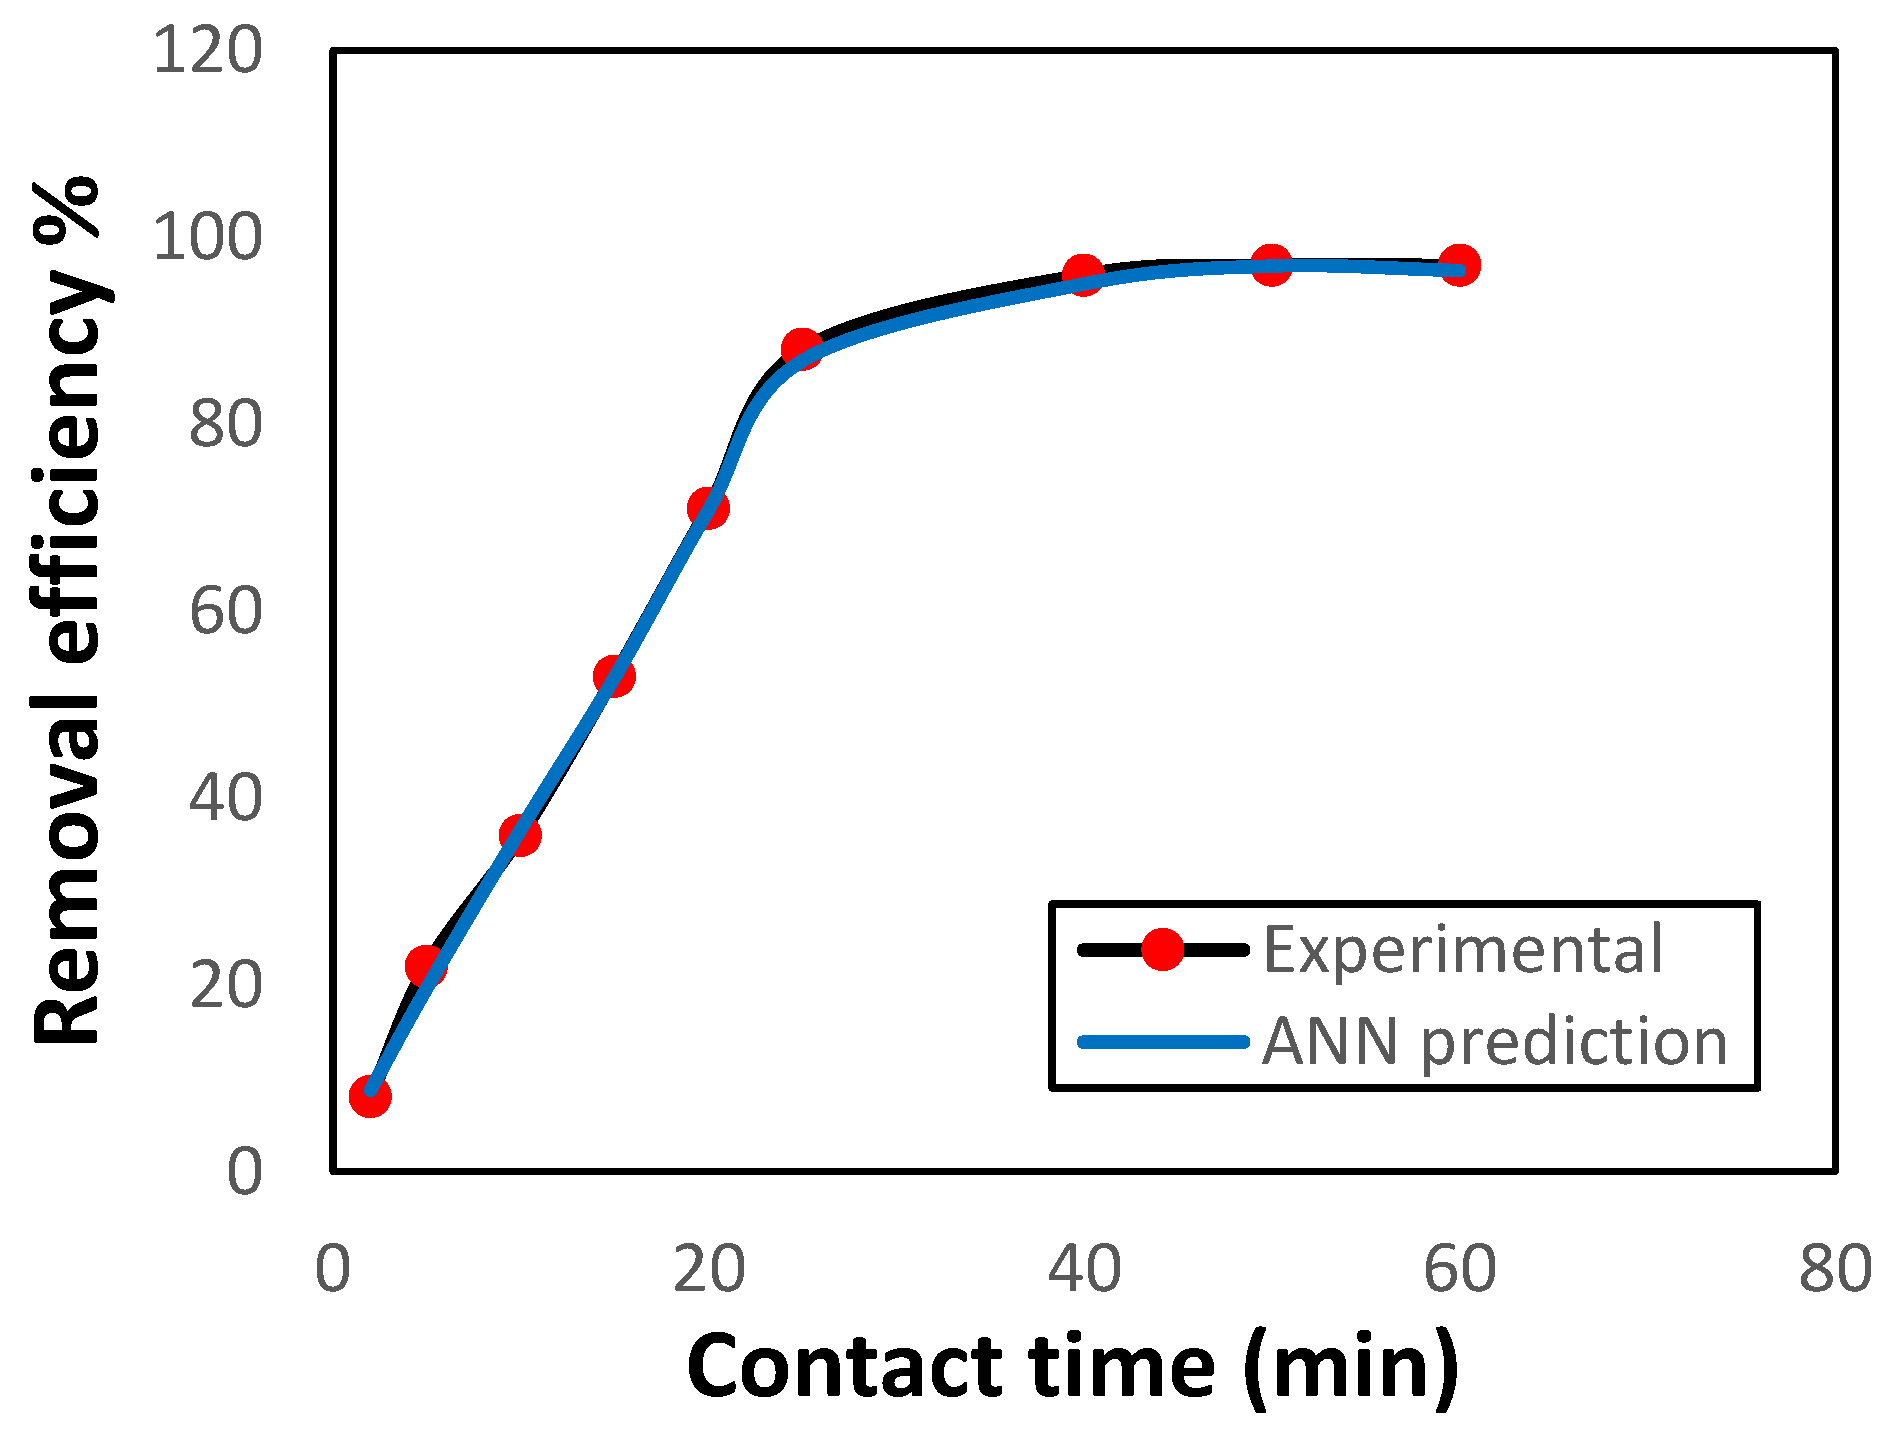
Figure 9.
Relationship between ln Kᴅ and 1/T for Ni(II) adsorption onto GG.
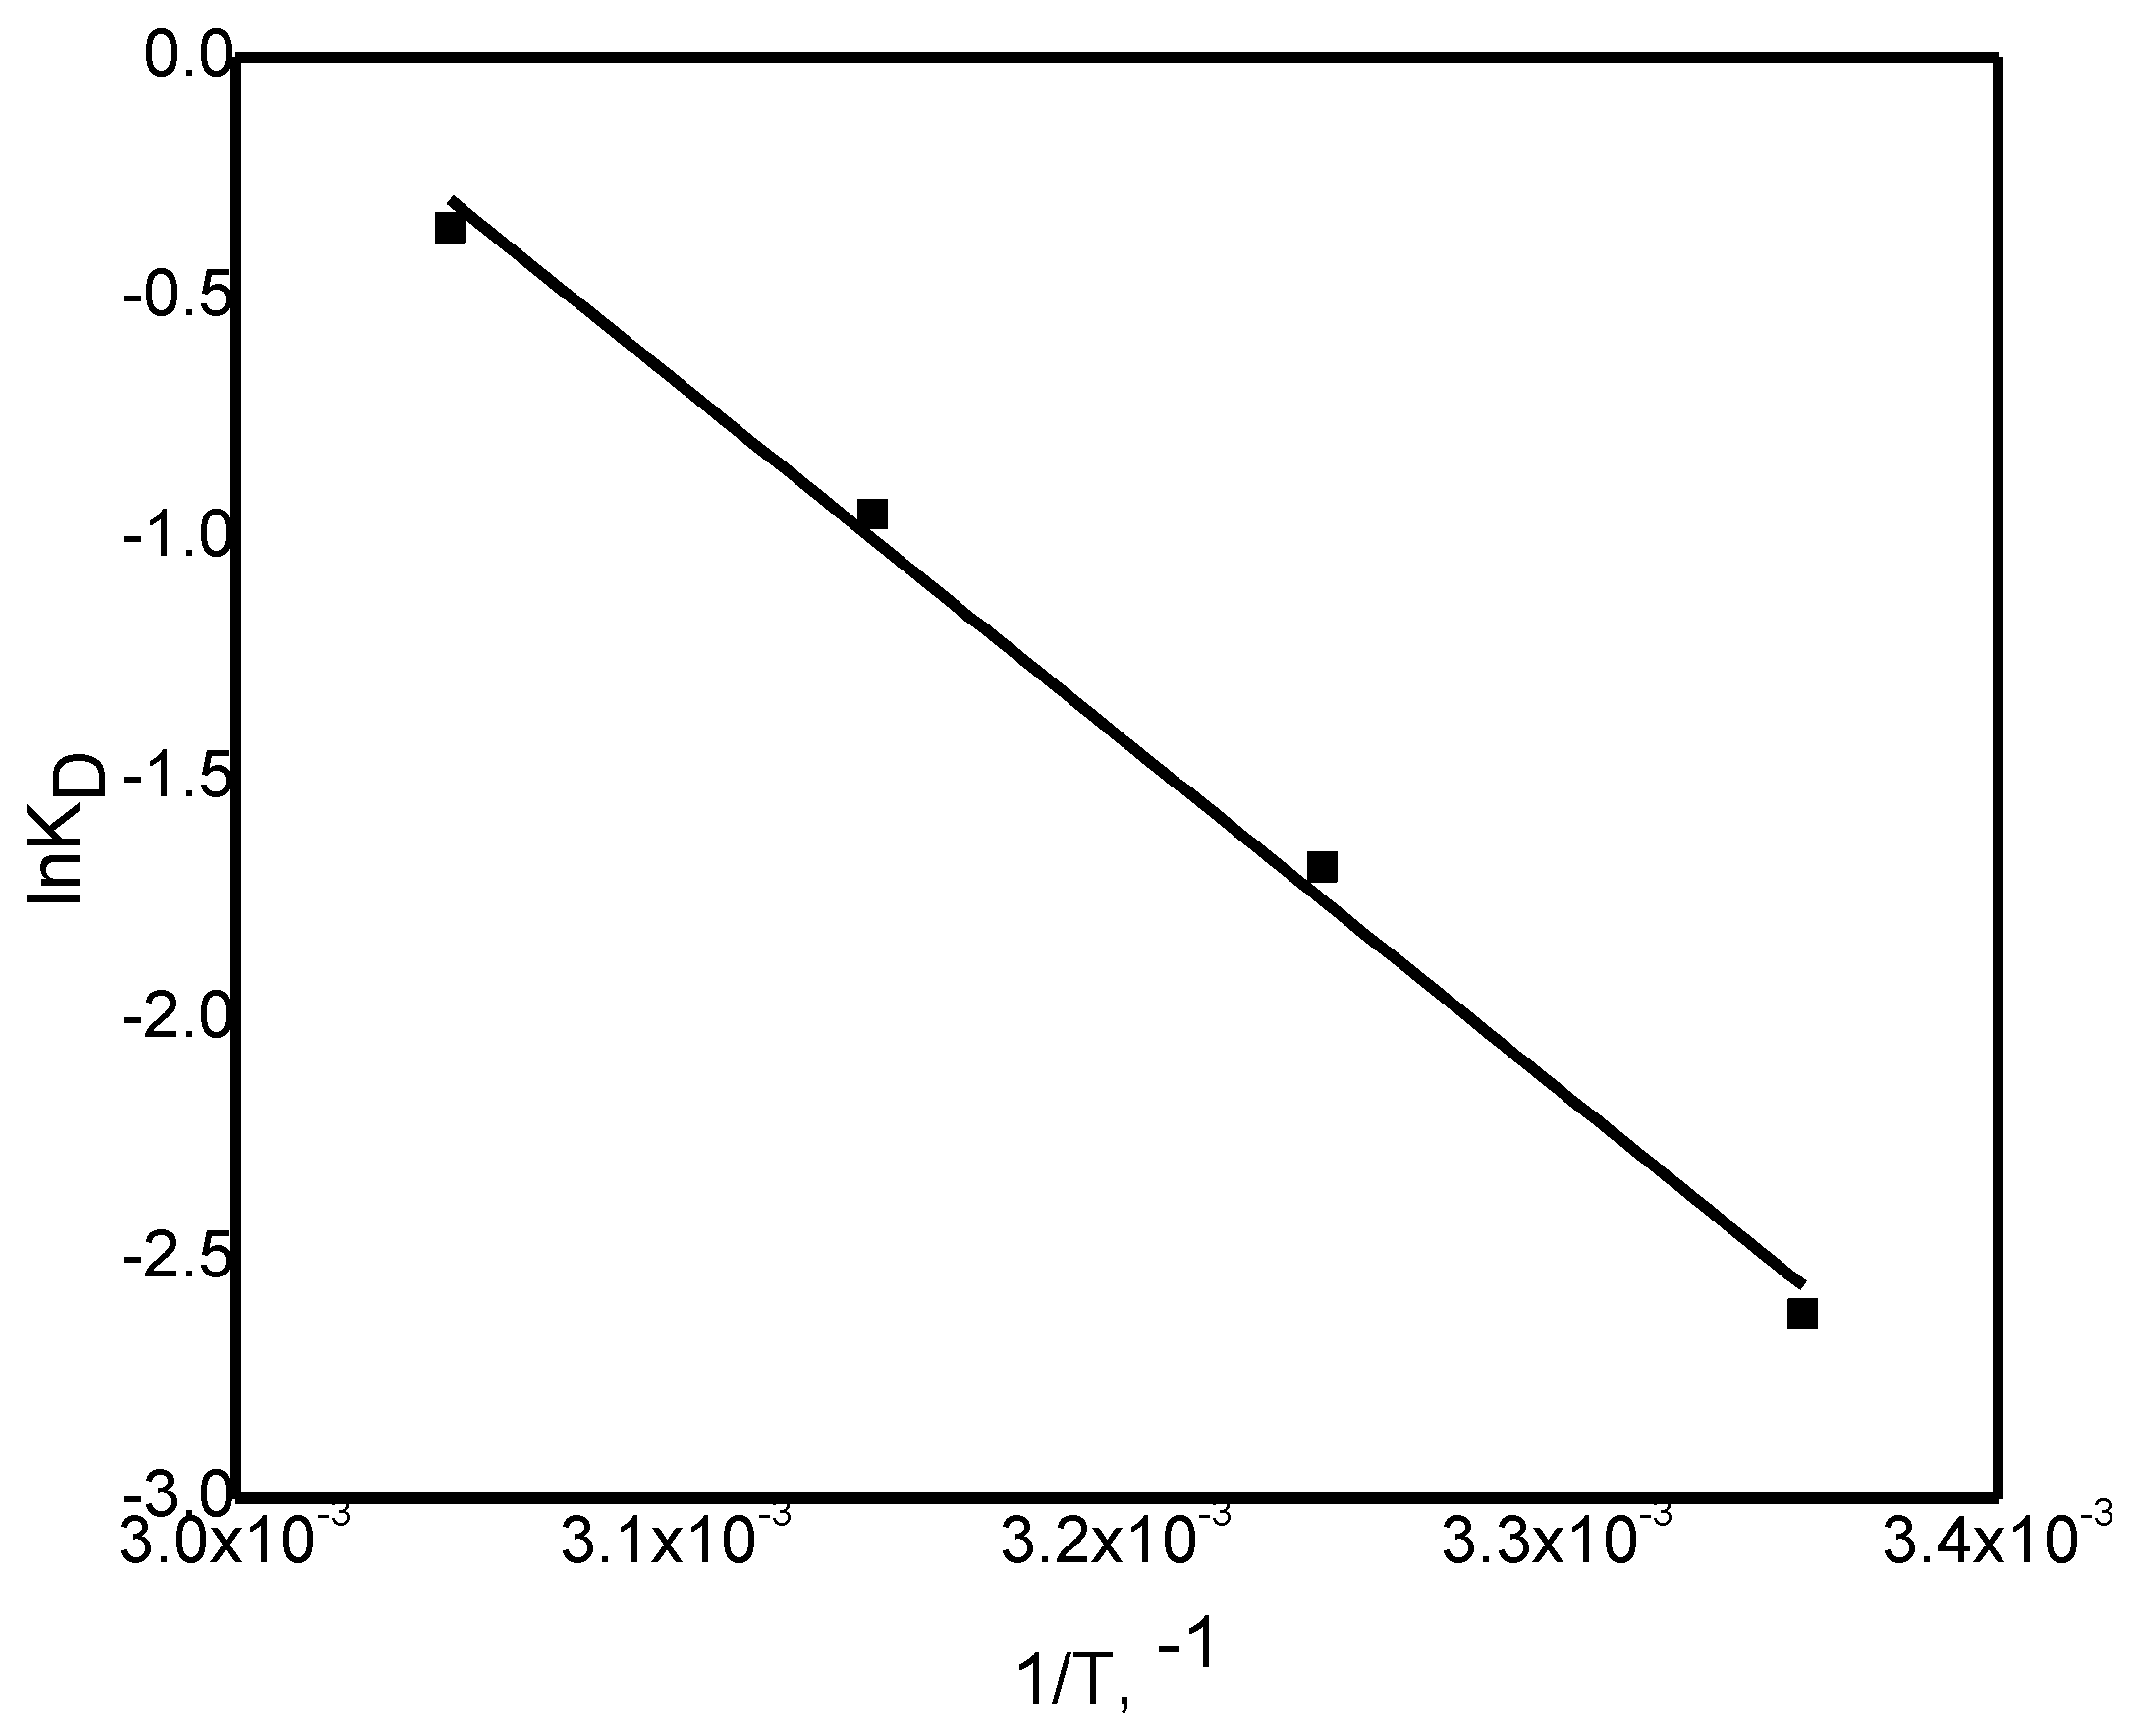
Figure 10.
Langmuir isotherm for Ni(II) adsorption onto GG (C₀ = 50–300 mg L⁻¹; adsorbent = 0.8 g; pH = 7.0; shaking rate = 150 rpm; T = 25 °C).
Figure 10.
Langmuir isotherm for Ni(II) adsorption onto GG (C₀ = 50–300 mg L⁻¹; adsorbent = 0.8 g; pH = 7.0; shaking rate = 150 rpm; T = 25 °C).
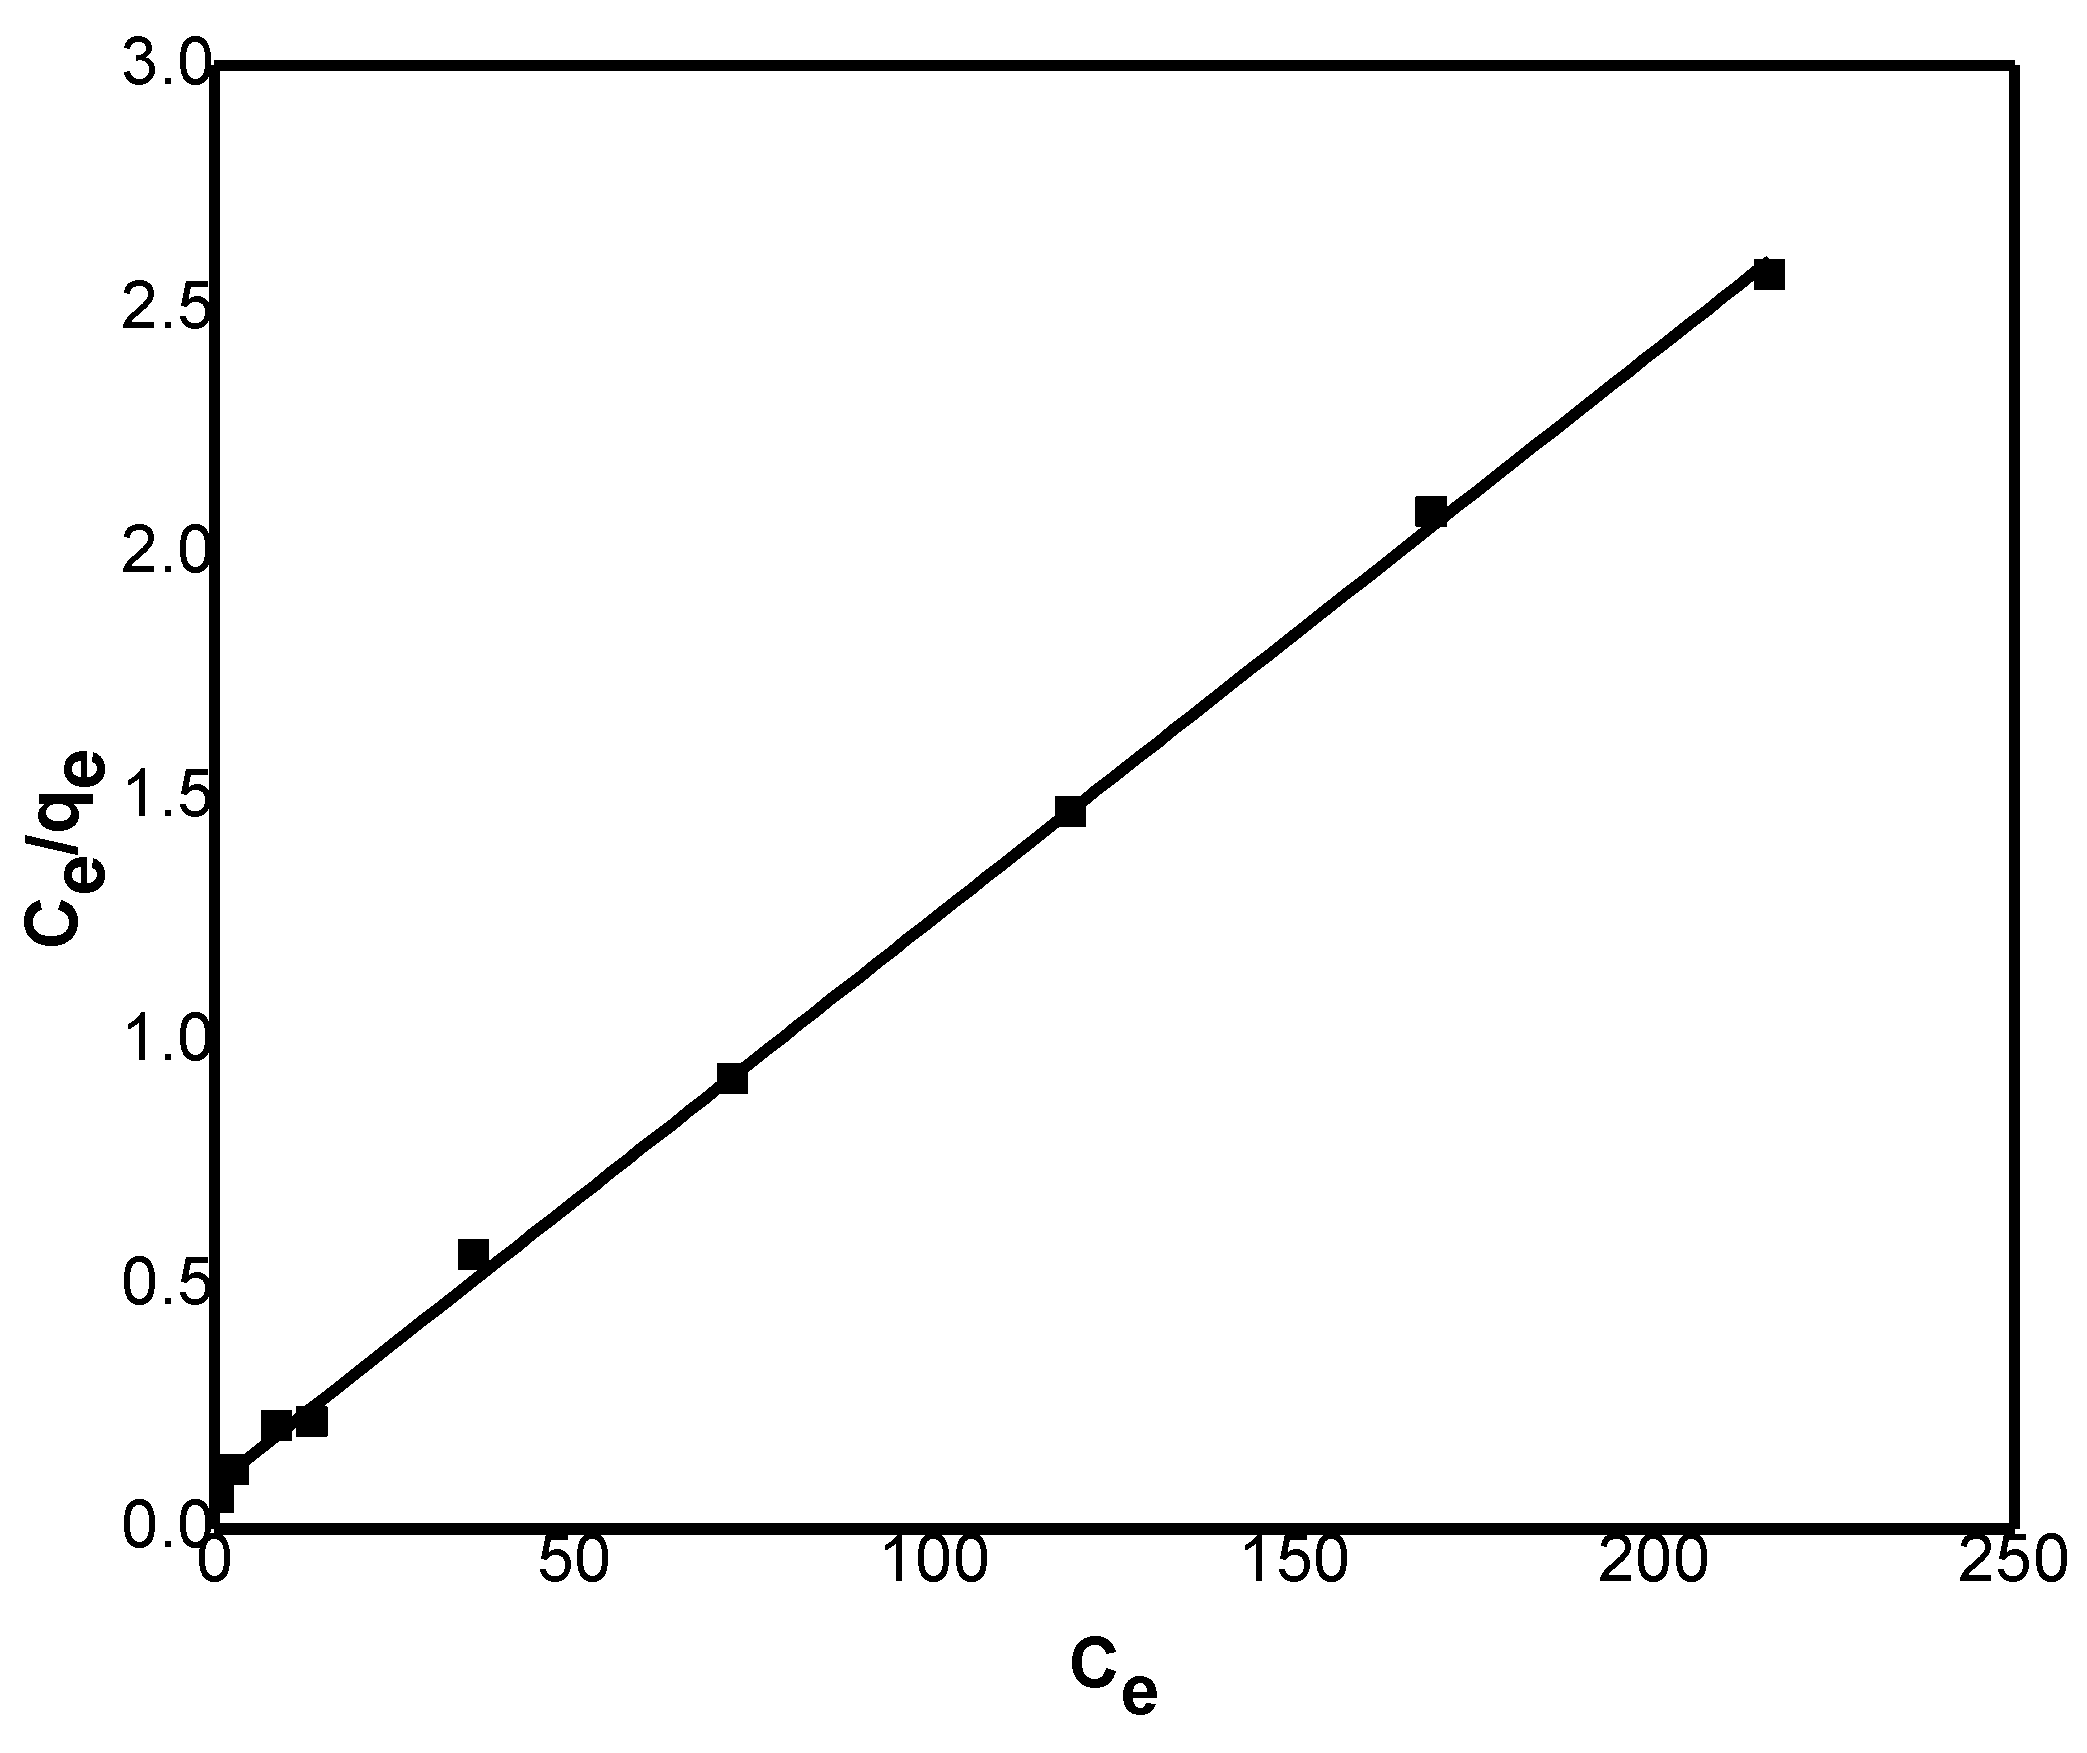
Figure 11.
Parity plot comparing experimental and predicted Ni(II) removal efficiencies using Artificial Neural Network (ANN) and K-Nearest Neighbors (KNN) models.
Figure 11.
Parity plot comparing experimental and predicted Ni(II) removal efficiencies using Artificial Neural Network (ANN) and K-Nearest Neighbors (KNN) models.
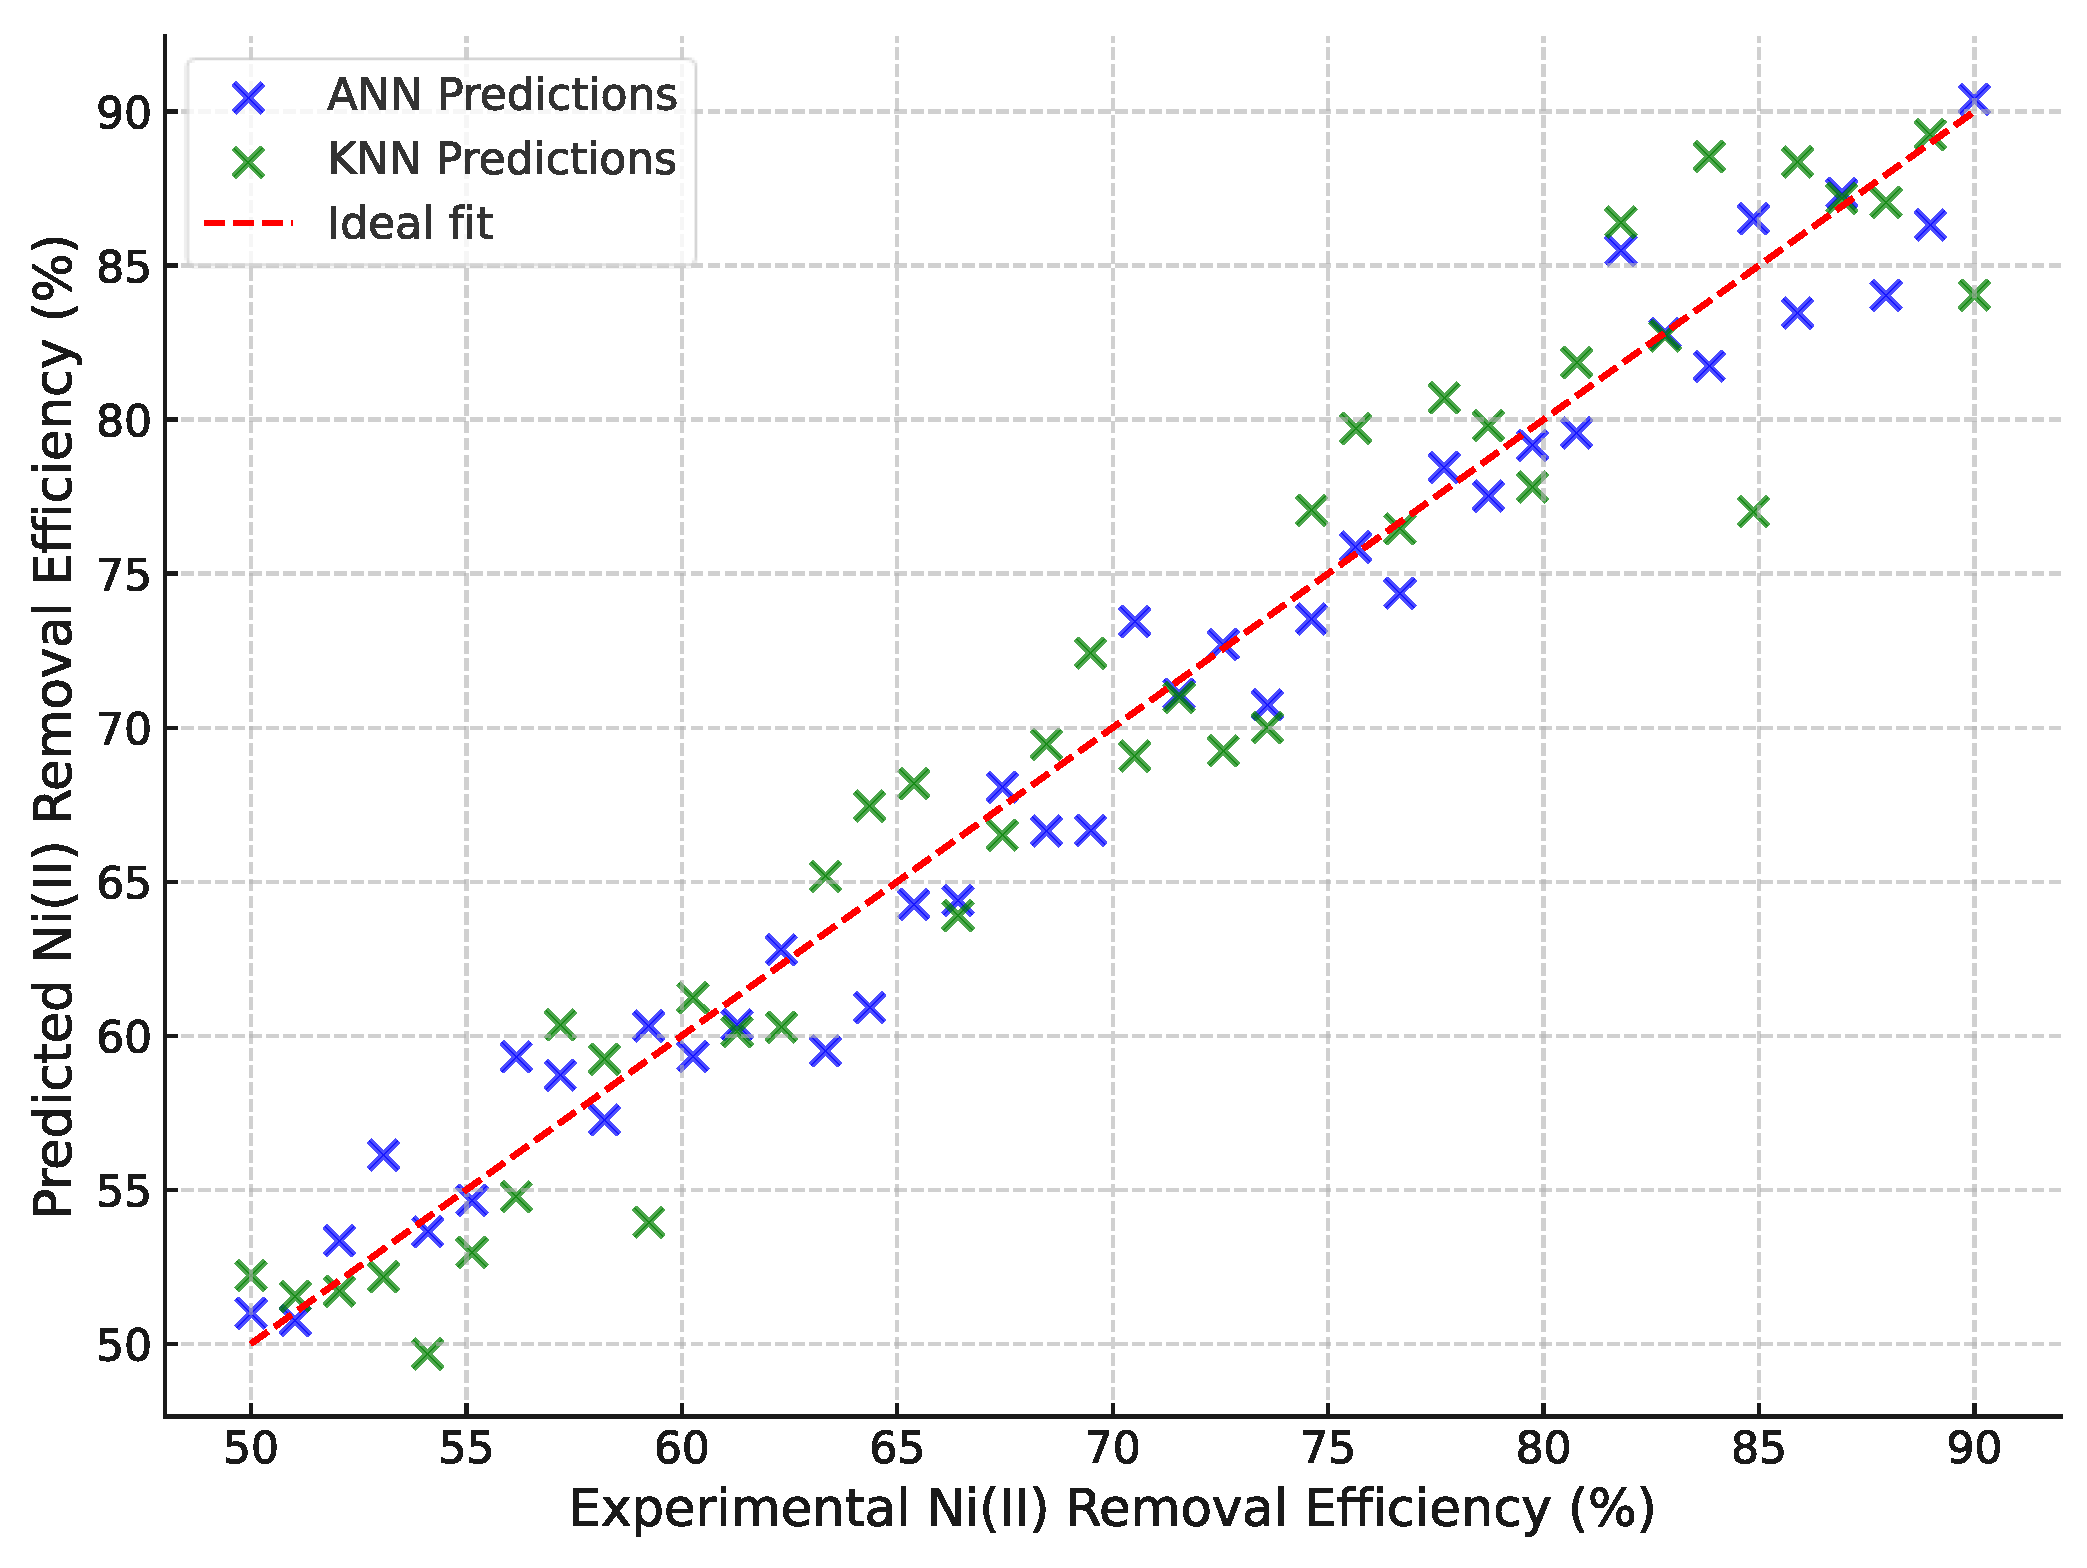
Figure 12.
Hierarchical clustering of operating parameters affecting Ni(II) removal efficiency.
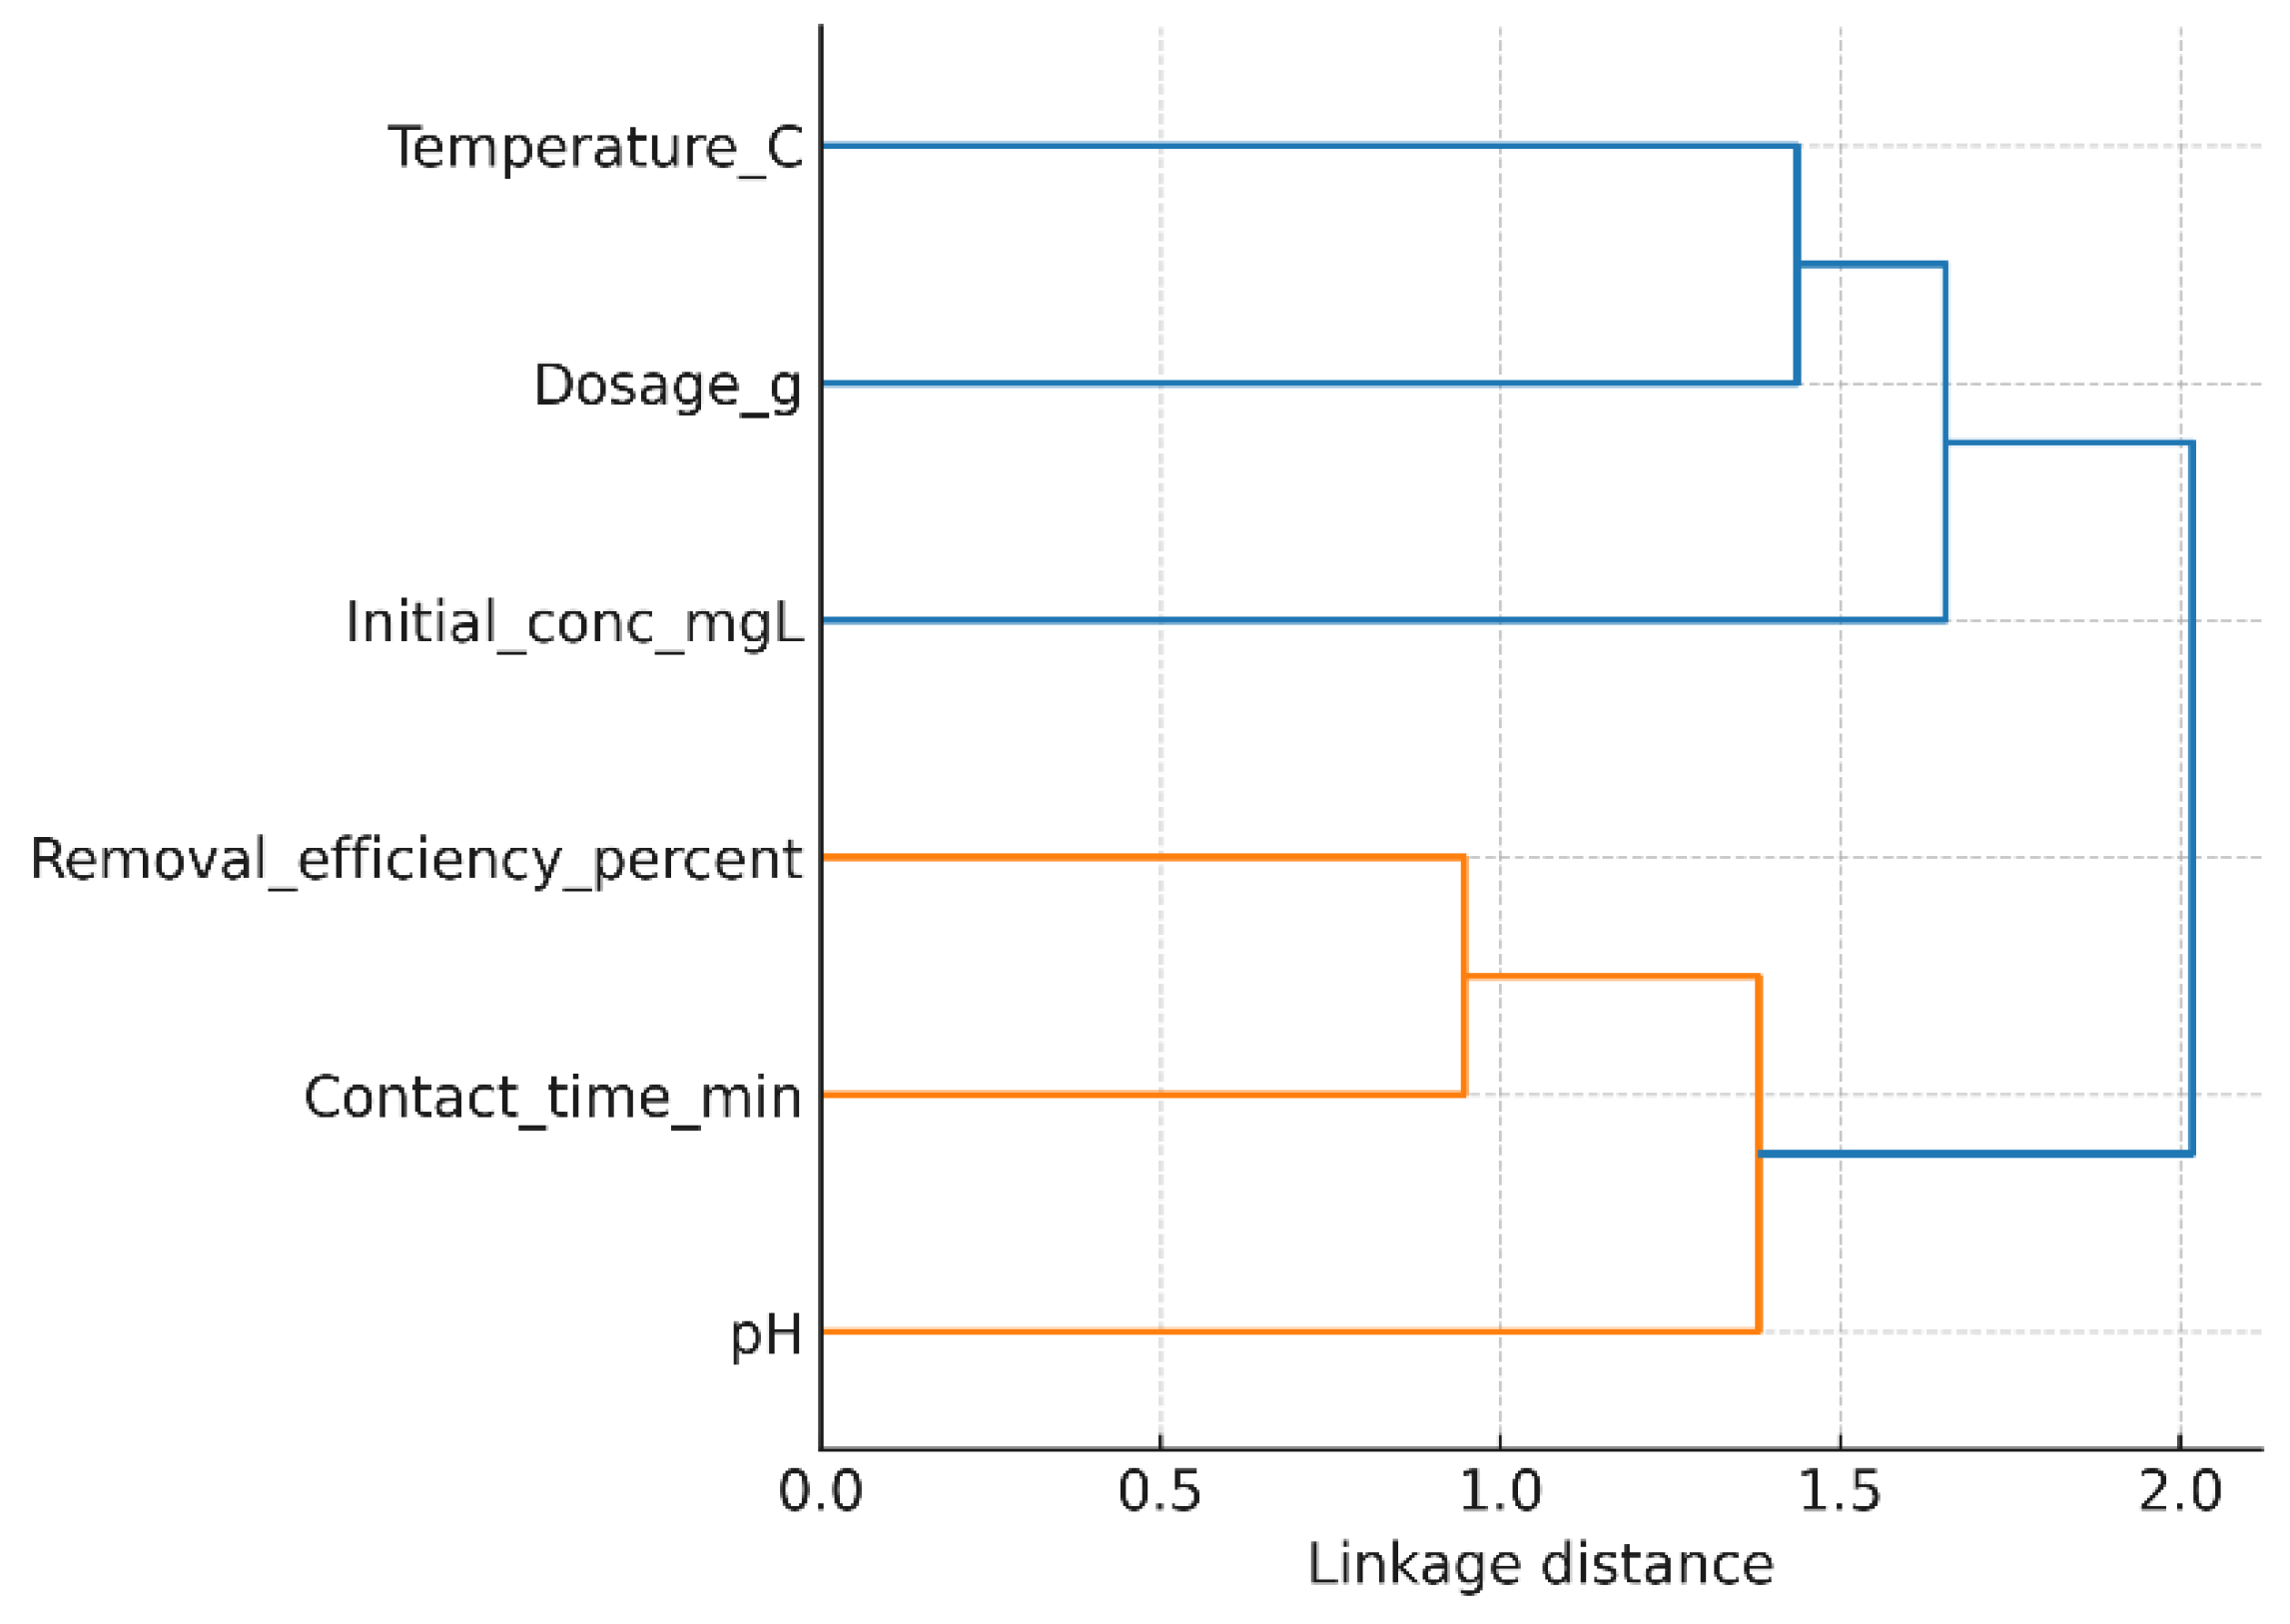
Figure 13.
Correlation heat map of operating parameters and Ni(II) removal efficiency.
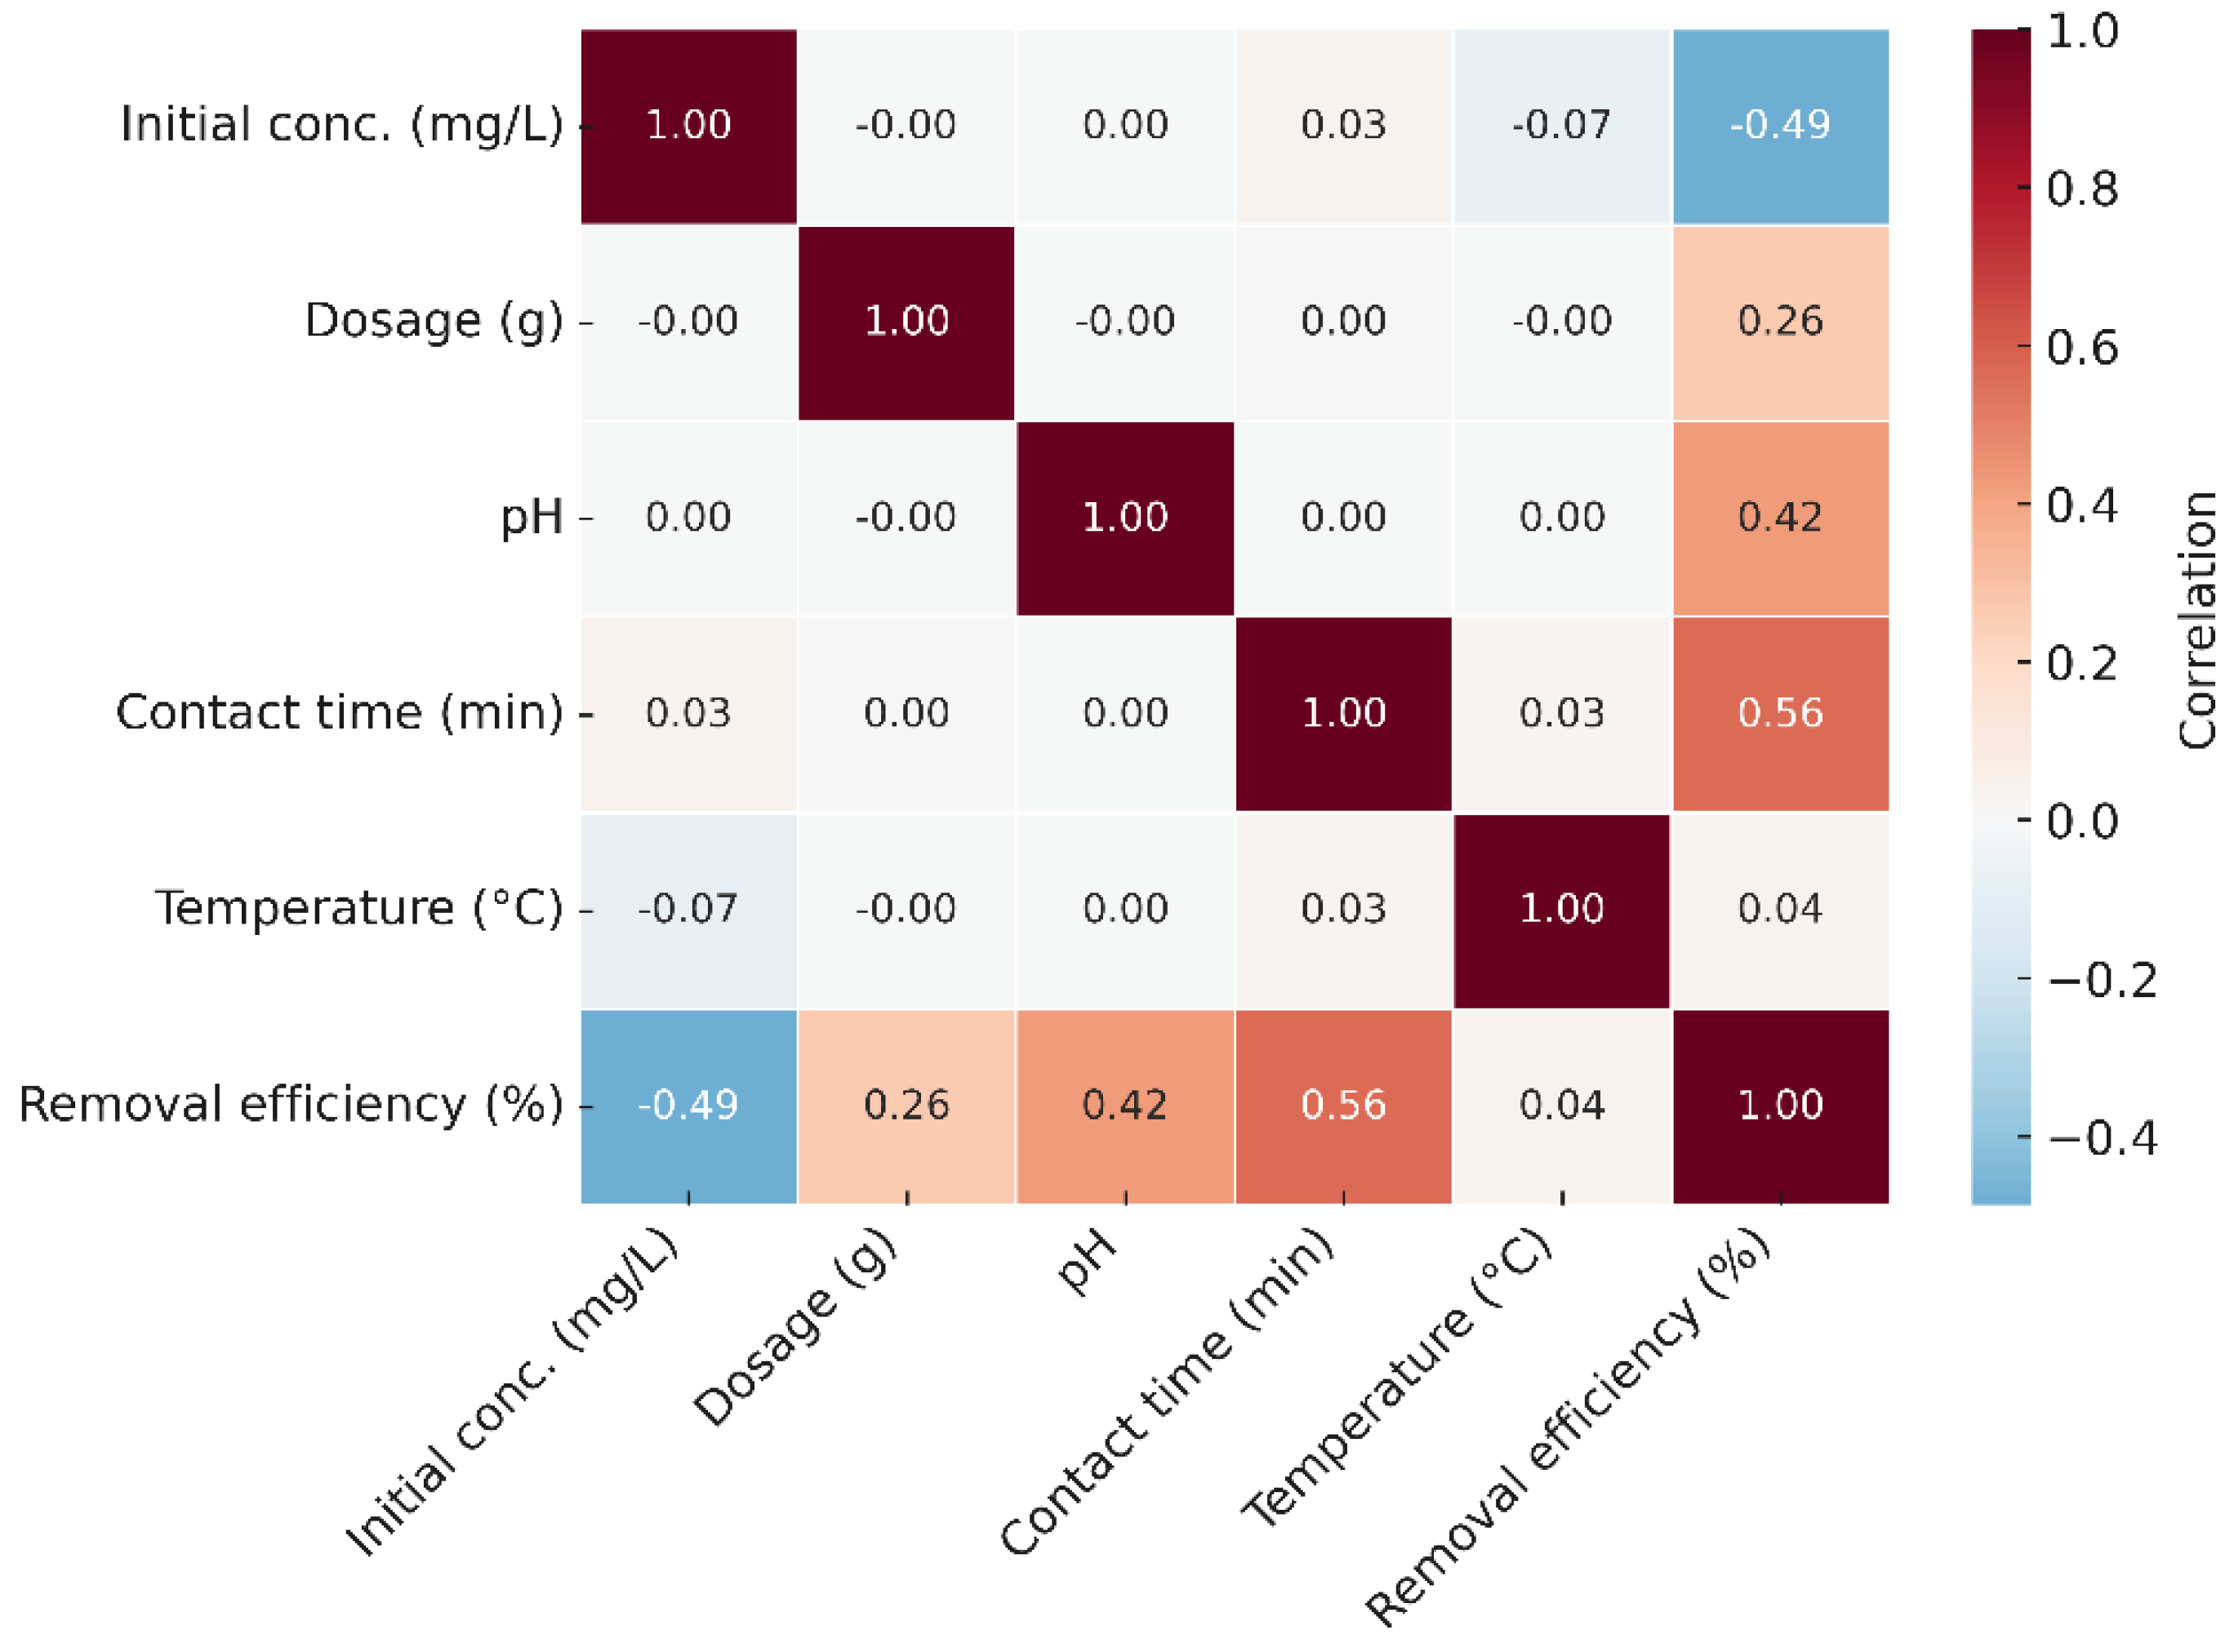
Figure 14.
Reusability of GG adsorbent on removal of Ni(II) from aqueous solution.
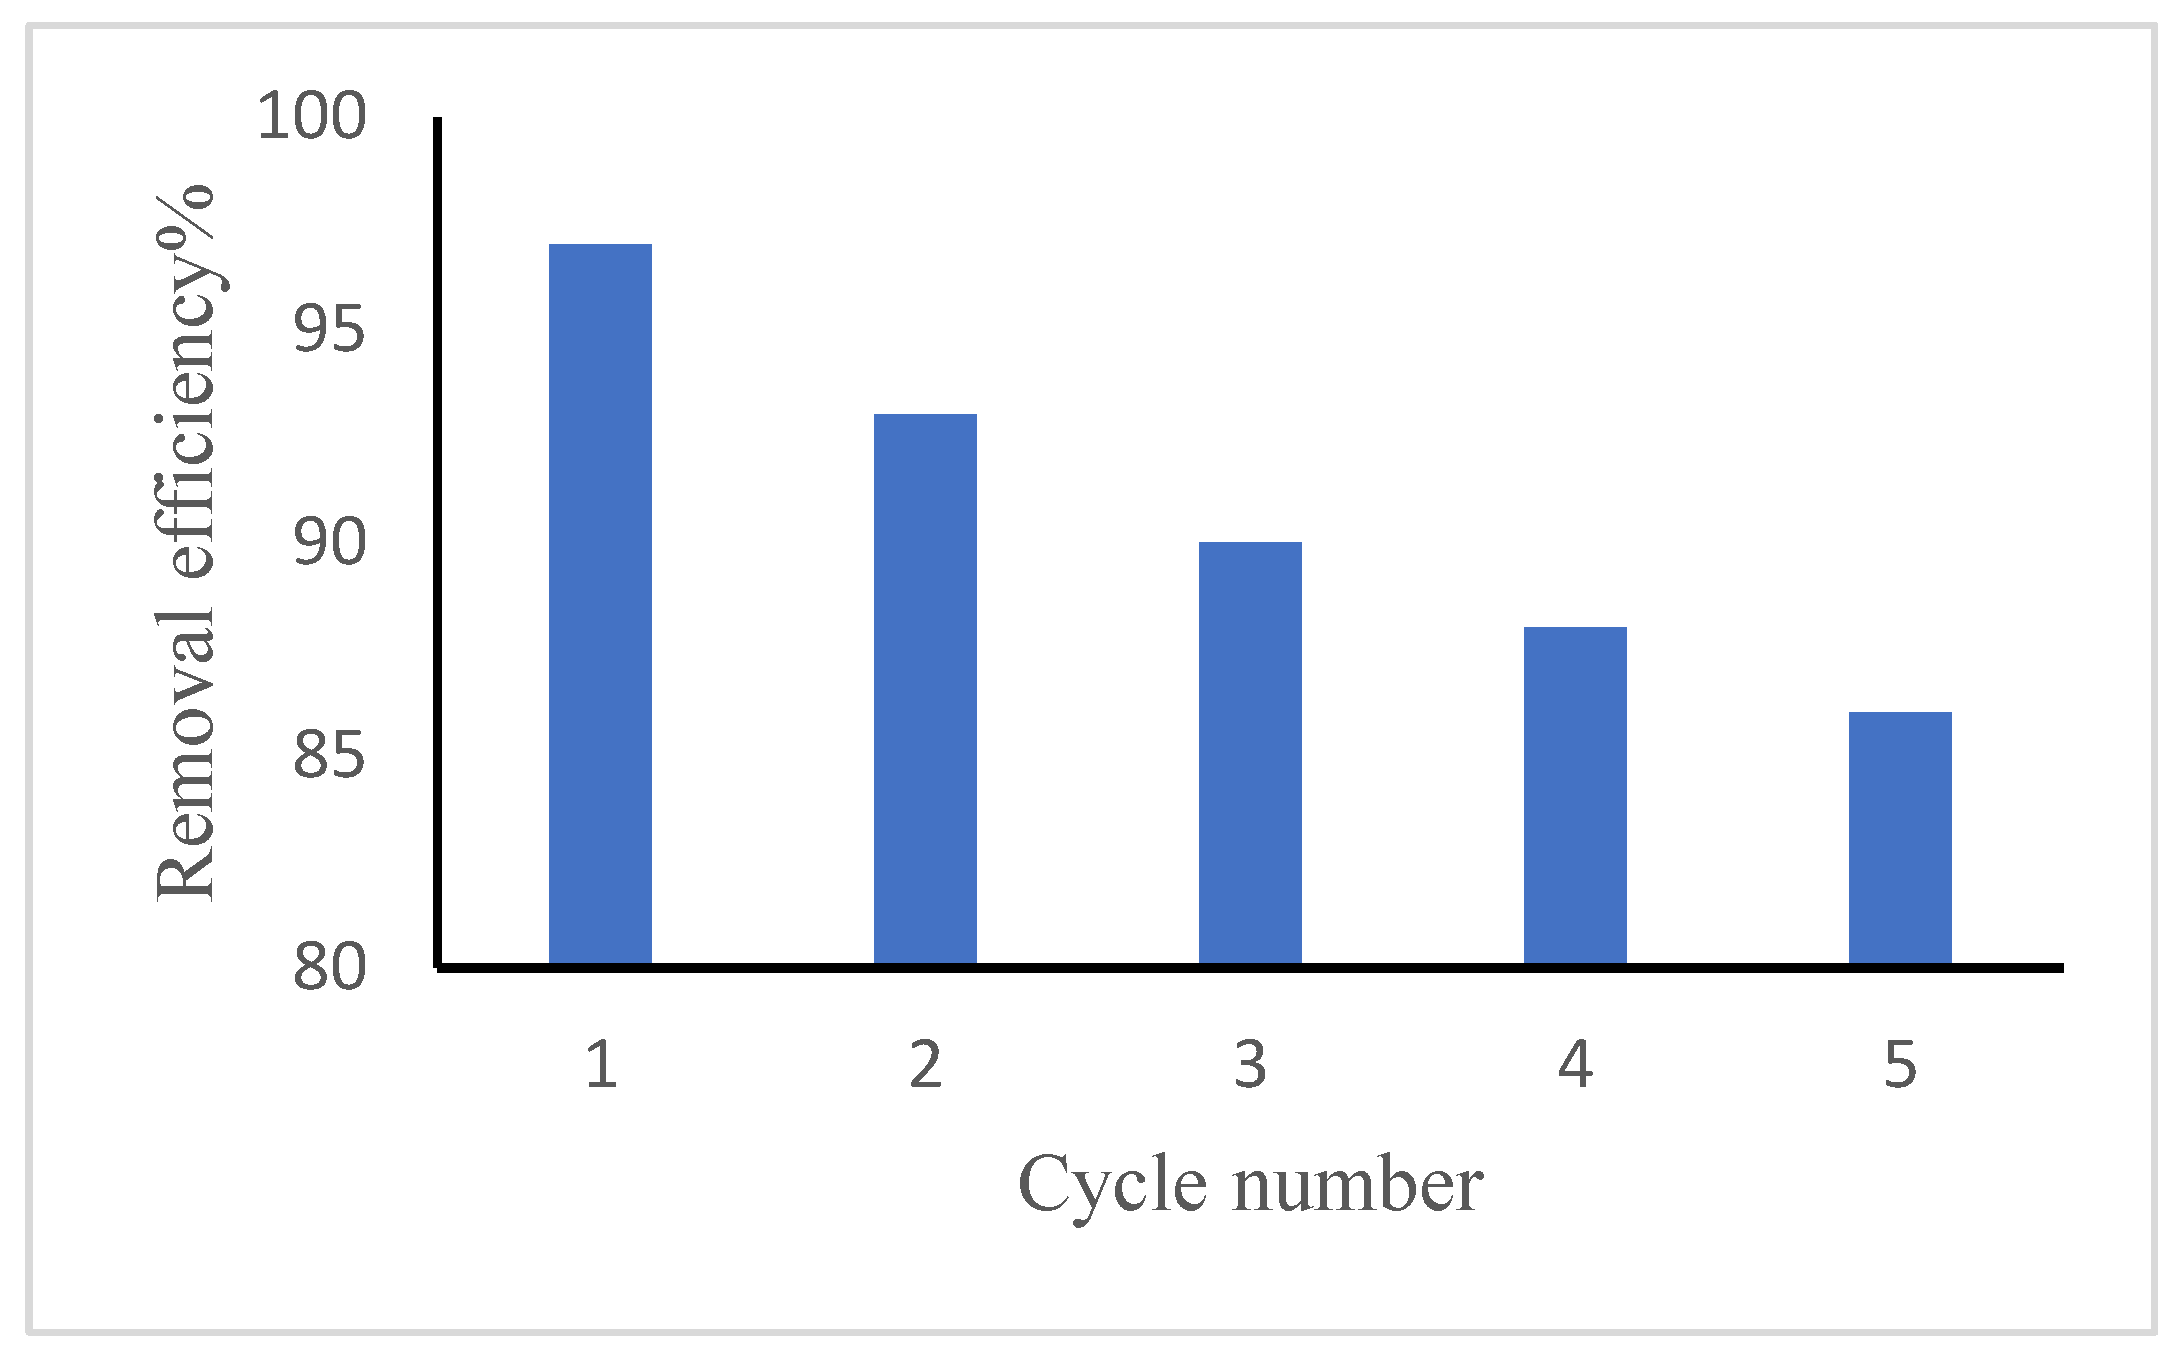

Table 1.
Operating conditions used to build the ANN model for Ni(II) removal effectiveness.
| Initial concentration (mg/L) | Dosage (g) | pH | Contact time (min) | Temperature (oC) | Removal efficiency (%) | Process parameters |
| 50 50 50 50 50 50 50 50 50 50 50 50 50 50 50 50 50 50 50 50 50 50 50 50 50 50 50 50 5 10 25 50 75 100 150 200 250 300 50 50 50 50 |
0.05 0.1 0.2 0.3 0.5 0.6 0.7 0.8 0.4 0.4 0.4 0.4 0.4 0.4 0.4 0.4 0.4 0.4 0.4 0.4 0.4 0.4 0.4 0.4 0.4 0.4 0.4 0.4 0.4 0.4 0.4 0.4 0.4 0.4 0.4 0.4 0.4 0.4 0.4 0.4 0.4 0.4 |
7 7 7 7 7 7 7 7 2 3 4 5 6 7 8 9 10 11 12 7 7 7 7 7 7 7 7 7 7 7 7 7 7 7 7 7 7 7 7 7 7 7 |
30 30 30 30 30 30 30 30 30 30 30 30 30 30 30 30 30 30 30 2 5 10 15 20 25 40 50 60 30 30 30 30 30 30 30 30 30 30 30 30 30 30 |
25 25 25 25 25 25 25 25 25 25 25 25 25 25 25 25 25 25 25 25 25 25 25 25 25 25 25 25 25 25 25 25 25 25 25 25 25 25 25 35 45 55 |
50 64 75 86 96 96 96 96 29 44 58 69 82 97 96 97 95 98 97 8 22 36 53 71 88 96 97 97 96 94 89 82 82 64 52 40 32 28 96 90 81 70 |
Dosage pH Contact time Initial Concentration Temperature |
Table 2.
Parameters of kinetic models describing Ni(II) adsorption by GG.
| Kinetic models | Parameters | |
| Pseudo-first-order model | qe (mg/g) | 63.0 |
| k1 (min-1) | 4.2 × 10⁻² | |
| R2 | 0.9753 | |
| Pseudo-second-order model | qe (mg/g) | 88.2 |
| k2 (g/mg min) | 2.4 × 10⁻⁴ | |
| R2 | 0.9934 | |
Table 3.
Thermodynamic variables (ΔG°, ΔH°, ΔS°) for Ni(II) uptake by GG.
| KD | -ΔGoad (kJ/mol) | -ΔHoad (kJ/mol) | ΔSoad (J/mol K) | ||||||
| 298 | 308 | 318 | 328 | 298 | 308 | 318 | 328 | 61.2 | 183.9 |
| 0.073 | 0.185 | 0.386 | 0.701 | 6.9 | 4.6 | 2.7 | 1.0 | ||
Table 4.
Adsorption isotherm constants of Ni(II) on GG.
| Adsorption model | Isotherm constant | Value |
| Langmuir | qm (mg/g) | 84.0 |
| KL (L/g) | 0.1133 | |
| R2 | 0.9964 | |
| Freundlich | n | 0.87 |
| Kf (mg/g)/(mg/L) | 0.976 | |
| R2 | 0.8576 |
Table 5.
Ni(II) selectivity in multi-ionic systems by GG under fixed conditions (50 mg L⁻¹ initial concentration, 0.8 g L⁻¹ adsorbent, pH 7.0, 150 rpm, 25 °C).
Table 5.
Ni(II) selectivity in multi-ionic systems by GG under fixed conditions (50 mg L⁻¹ initial concentration, 0.8 g L⁻¹ adsorbent, pH 7.0, 150 rpm, 25 °C).
| Metal ion | Distribution ratio (L/g) | Selectivity coefficient |
| Ni(II) | 303 | --- |
| Cu(II) | 45 | 4.9 |
| Pb(II) | 37 | 4.1 |
| Cr(VI) | 29 | 5.3 |
Disclaimer/Publisher’s Note: The statements, opinions and data contained in all publications are solely those of the individual author(s) and contributor(s) and not of MDPI and/or the editor(s). MDPI and/or the editor(s) disclaim responsibility for any injury to people or property resulting from any ideas, methods, instructions or products referred to in the content. |
© 2025 by the authors. Licensee MDPI, Basel, Switzerland. This article is an open access article distributed under the terms and conditions of the Creative Commons Attribution (CC BY) license (https://creativecommons.org/licenses/by/4.0/).
Copyright: This open access article is published under a Creative Commons CC BY 4.0 license, which permit the free download, distribution, and reuse, provided that the author and preprint are cited in any reuse.


