
Submitted:
08 September 2025
Posted:
08 September 2025
You are already at the latest version
Abstract
A fundamental physical and mechanical characterization was performed on the natural stone utilized in the Mosque of Cordoba, Spain, using samples from the designated restoration quarry. The experimental investigation encompassed density measurements, Ultrasonic Wave Propagation Velocity (UWPV), uniaxial compression, indirect tension (splitting), and three-point bending tests on over 100 specimens. The study confirmed the stone’s isotropic nature and lack of significant sample size effect within the tested range. Key quantitative results include a mean uniaxial compressive strength of approximately 6 MPa and the establishment of predictive relationships. A strong linear correlation (R2=0.86) between UWPV and compressive strength was identified, supporting the use of Ultrasonic Test for in-situ evaluation. Compressive strength was also strongly correlated with flexural strength (R2=0.95), whereas its correlation with tensile strength was moderate (R2=0.31). This research delivers crucial reference values and validated correlations for the stone, directly informing structural analysis and conservation strategies for this UNESCO World Heritage site.
Keywords:
Cordoba
; natural stone
; mechanical tests
; ultrasonic test
; mechanical properties
; anisotropy
1. Introduction
The Great Mosque of Córdoba is one of the most significant monuments in the Islamic West and a masterpiece of world architecture. It exemplifies the peak of the Hispano-Muslim style, featuring innovative construction techniques and intricate decorative elements. Built between 780 and 990, it underwent several expansions under different emirs and caliphs, each contributing to its unique architectural identity. Following the Christian reconquest, a cathedral was integrated into the structure in the 12th century, making it the only religious site in the world where a mosque and a cathedral coexist. Recognised for its historical and cultural importance, UNESCO designated it a World Heritage Site in 1984 [1,2]. Today, with over one million annual visitors, it remains one of the most valuable heritage landmarks in the region.
A distinctive feature of the Mosque is its construction based on spolia, incorporating elements from earlier prominent buildings [3]. These include Roman marble columns and Byzantine capitals, seamlessly integrated into its structure. However, the majority of the monument was built using freestone from the Córdoba region, extracted from nearby quarries. This stone, a bio-calcarenite, has historically been one of the most widely used lithic materials in Córdoba. Various types of biocalcarenites—biomicrite, biosparite, and biorudite—can be identified in many of the city’s historical monuments [4]. These stones originate from Tortonian marine marginal facies within the Guadalquivir Depression, forming amalgamated carbonate deposits with a sandy matrix, rich in fossils and sedimentary microfauna. Their physical and mechanical properties make them well-suited for architectural applications but also subject them to weathering and degradation over time.
Ensuring the long-term conservation of this architectural treasure requires a thorough understanding of its mechanical behaviour and structural stability. A key aspect of this effort is the study of the mechanical properties of its construction materials, mainly the original stone, making its characterization essential for conservation efforts. The mechanical properties are necessary for instance for the development of numerical models for the assessment of the structural behaviour, seismic performance and risk assessment, structural reinforcement designs, etc.
These properties can be determined through mechanical testing of material samples in a laboratory setting. Among the most relevant tests is the uniaxial compressive test, which provides a direct evaluation of the material’s compressive strength.
However, extracting specimens directly from the monument is impractical due to its protected status. As an alternative, in-situ testing offers a non-destructive approach to material characterization [5]. Ultrasonic and sonic methods, Ground Penetrating Radar for investigating subsurface features, infrared thermography for identifying thermal anomalies and material variations, and photogrammetry and laser scanning for detailed geometric documentation are employed in the assessment of heritage structures [5,6]. Integrating data from multiple non-destructive techniques offers a more comprehensive understanding of the condition and material characteristics of historical buildings [6].
Among these, Ultrasonic Wave Propagation Velocity (UWPV) testing is a widely utilized technique to measure wave propagation and infer material properties such as compressive strength, stiffness and stone deterioration [7,8,9,10]. Furthermore, UWPV testing offers the advantage of assessing the structural integrity and detecting internal defects within heritage stones [7].
Despite its potential, existing literature lacks sufficiently strong correlations to reliably interpret ultrasonic results for this specific stone [11,12,13,14,15,16]. To enhance the reliability of this method, the determination of robust correlations between the results of ultrasonic tests and the mechanical properties of the natural stone is essential.
To complement ultrasonic tests, sonic tests, employing lower frequency waves, are considered more suitable for heterogeneous materials such as granite masonry due to reduced attenuation [8]. In particular, the Direct and Indirect Sonic Impact Method have shown potential to determine both P and R wave velocities in masonry walls, allowing the estimation of their Young’s modulus [17,18,19].
However, the need for further research to develop robust, material-specific correlations for ultrasonic testing and other methods remains critical for enhancing the reliability of mechanical characterization of stones in heritage construction [8]. Future efforts should also focus on standardizing UWPV protocols and exploring the integration of UWPV result data with advanced modeling tools like Heritage Building Information Modeling to improve diagnostic capabilities [5].
Consequently, the primary objective of this study is to establish correlations that enable the in-situ assessment of heritage buildings constructed from the freestone from the Córdoba (or similar natural stone), allowing for the determination of their mechanical properties on-site without causing damage. This will be achieved through UWPV testing, which, if successfully correlated with mechanical properties obtained from mechanical tests, could serve as a reliable tool for structural evaluation and conservation efforts. The study aims thus to validate ultrasonic testing as a viable technique for assessing the mechanical properties of this stone in heritage buildings, ensuring accurate and damage-free structural evaluation.
The study is based on the laboratory testing of six ashlars composed of the same bio-calcarenite found in the monument. First, the anisotropic behaviour of the stone is evaluated by analysing its mechanical response in two principal orientations: A (vertical in the quarry) and B (perpendicular), to determine whether directional dependence affects its mechanical properties. Next, the potential influence of sample size is examined by testing specimens of two different dimensions (50×50×50 cm and 70×70×70 cm) to assess scale effects. To obtain reference values, mechanical tests are conducted on the ashlars, measuring key mechanical properties: compressive, tensile, and flexural strength. These values serve as a benchmark for comparison with ultrasonic testing results. The core of the study involves correlating ultrasonic velocity with compressive strength, verifying whether the ultrasonic method can reliably estimate mechanical properties. Finally, further correlations are established between compressive strength and other key properties (tensile and flexural strength), allowing for their indirect determination through in-situ testing.
Once the correlations are stablished, it would be possible to obtain the propagation velocity in-situ by means of UWPV, then calculate the stone compressive strength through the correlation with the compression tests and finally correlate that value with the flexural and tensile strength of the material. This approach aims to improve the accuracy and applicability of ultrasonic testing for assessing the structural integrity of the Great Mosque of Córdoba and other historic buildings constructed with similar materials.
2. Materials and Methods
The Mosque was built based on the spolia of other prominent buildings, comprising elements like roman marble columns or byzantine capitals. However, the largest part of the structure is constructed using Córdoba’s freestone, gathered in quarries from the nearby area. This stone, which is a bio-calcarenite, has been one of the most widely utilized lithic materials in the Córdoba region throughout history. In a significant number of Cordobese monuments, several types of biocalcarenites can be identified: biomicrite, biosparite, and biorudite [20]. They originate from the Tortonian marine marginal facies within the Guadalquivir Depression, comprising amalgamated carbonate deposits with a sandy matrix, notably enriched in fossils and sedimentary microfauna.
Given the impossibility of removing samples from the Córdoba’s Mosque itself, six ashlars of 40x30x10 cm (Figure 1) were obtained from one of the region’s quarries, Mármoles y Piedra Gutiérrez [21], which is one of the main providers of natural stone for the restoration works in the Mosque.
2.1. Stone composition: microscopy and spectroscopy
Three stone samples underwent a microscopy analysis using the High-Resolution Field Emission Scanning Electron Microscope (FEI Teneo) to examine their microstructure and morphology. This technique enabled the visualization of the stone’s surface and internal structure, revealing the size, shape, and distribution of its components. Additionally, Energy Dispersive X-ray Spectroscopy (EDS) was employed alongside the microscope to determine the elemental composition of specific areas within the samples. For each sample, six measurements were conducted to ensure accuracy and reproducibility.
The microscopy analysis revealed that the stone features a calcite (calcium carbonate) matrix, visible as smaller grains in Figure 2. This matrix acts as a binding agent, providing structural cohesion by holding the rock’s components together. This conclusion is supported by prominent calcium (Ca) and oxygen (O) peaks observed in the EDS spectrum (Figure 3, left). In addition, the material contains a significant amount of quartz, identified as larger and darker grains in Figure 2. This finding aligns with the peaks for silicon (Si) and oxygen (O) in the EDS analysis (Figure 3).
Furthermore, angular inclusions of phyllosilicates are present, characterized by their bright, angular shapes in Figure 2. These inclusions correspond to the detection of iron (Fe), aluminium (Al), and magnesium (Mg) in the EDS spectrum (Figure 3). These results are consistent with previous studies on heritage buildings in the region, which also employed Córdoba’s freestone as a construction material [20].
2.2. Bulk density
The bulk density by immersion was determined for six specimens from ashlars 1, 2 and 3 following the UNE-EN 1936:2007 standard [22]. The process involved weighing oven-dried specimens to obtain their dry mass (), followed by vacuum treatment at 2.0 ± 0.7 kPa for 2.0 ± 0.2 hours to remove air from open pores. Deionised water at 20 ± 0.5 ºC was then introduced under maintained vacuum, fully submerging the specimens within 15 minutes. After vacuum release, specimens remained submerged for 24 ± 2 hours at atmospheric pressure. Measurements included the mass in water () and the saturated surface-dry mass (), used to calculate bulk density. The study extended saturation to 168 hours to verify complete saturation, as the standard lacks clarity on whether immersion at 24 hours is sufficient.
For comparison, the same samples were also analysed using a geometric method: edge measurements provided an approximate volume, with density calculated as mass divided by this volume. Results showed only a 2 % discrepancy between immersion and geometric methods (Table 1), validating the latter for testing all the samples employed in the study. The resulting mean values per ashlar can be seen in the following table (Table 2).
The final average density across all Córdoba’s freestone specimens was 1820 kg/, aligning closely with literature values for similar biocalcarenites [23], with densities ranging from 1200 kg/ (highly porous) to 2400 kg/ (low porosity) depending on diagenesis and fossil fragment density.
2.3. Experimental Tests
In order to achieve the discussed objectives, the ashlars were first cut in smaller samples (Table 3) and then analysed through Ultrasonic Wave Propagation Velocity (UWPV) testing. With this method (see Section 2.3.1), the UWPV through several samples for each ashlar were measured. Then, the samples were subjected to mechanical testing, allowing for an accurate determination of the ashlar’s mechanical properties: compressive, bending and tensile strength (see Section 2.3.2). Finally, the results of both campaigns were used to establish correlations between the propagation velocity and the mechanical properties.
The UWPV and mechanical tests are described in the following sections.
2.3.1. UWPV tests
The UWPV of volumetric P-waves was determined by generating an excitation pulse on one side of the specimen and measuring the time-of-flight to a sensor positioned on the opposite side. This direct transmission method was conducted in accordance with technical recommendation [24], with ten measurements taken at each location. The UWPV was computed as the ratio of the travel distance to the measured time-of-flight. The equipment records the received signal following the excitation pulse (Figure 4).
A Proceq Pundit Lab system was utilized, employing two 54 kHz piezoelectric transducers, which could function interchangeably as transmitters or receivers (Figure 5). These transducers were selected to accommodate varying inspection distances. UWPV test was performed on all specimens in multiple orientations, as detailed in Section 3.1.
2.3.2. Mechanical tests
As previously indicated, three types of mechanical tests were performed (Table 3):
- Uniaxial compression
- Three-point bending
- Splitting test
The tests were performed using a universal servo-hydraulic testing machine (200 kN capacity and 200 mm displacement stroke). The compression and three-point bending tests were displacement controlled at a 1 mm/min speed rate, while the splitting tests were force controlled at 125 N/s loading rate. A scheme and a picture of the experimental set-up of each test are shown in Figure 6 and Figure 7.
During the uniaxial compressive strength testing setup, it was decided to employ expanded polystyrene sheets to minimise the effect of geometric irregularities, and to ensure a proper distribution of the load among the surfaces. For the same purpose, neoprene strips were used in the splitting tests between the loading rolls and the specimen surface.
The measures taken during the tests are processed to obtain the desired properties values as follows (Equation (1), Equation (2) and Equation (3)).
Uniaxial compression test:
Three-point bending test:
Splitting test:
Where (see Figure 6):
- F is the peak load
- A is the area of the cross section of the sample
- l is the length among loading points
- L is the length of the contact line
- b is the sample width
- h is the sample thickness
Before performing any further analysis, the resulting dataset was filtered to remove potential outliers that could skew the results. This was achieved by applying a statistical outlier removal process based on the commonly used empirical rule of normal data distribution. Specifically, any data points falling outside the range defined by (two standard deviations below the mean) and (two standard deviations above the mean) were excluded from the analysis.
3. Results
3.1. Stone Anisotropy
In order to assess the possible anisotropic behavior of the material, both uniaxial compression tests and ultrasonic tests were conducted on cubic samples (see Table 4). The ultrasonic test, being not destructive, can be repeated several times on different directions on the same sample. Accordingly, it was performed twice per sample: once in direction A and once in direction B (Figure 8) , with a total of 80 measures taken on 40 samples. For the compressive strength, the test is destructive, so it can be performed only once. Consequently, the same 40 samples were tested, but half (20) were tested in direction A and the other half (20) in direction B.
A t-test for independent samples was applied to both sets of results to determine whether there was a statistically significant difference between the two directions. For the ultrasonic test, the results showed that the t Statistic (t Stat) was , which is lower in magnitude than the Critical t-Value (t Critical two-tail) of . Additionally, the p-value (two-tailed) was , which is above the standard significance level of . Similarly, for the compressive strength test, the results showed a t Statistic (t Stat) of , also lower than the Critical t-Value (t Critical two-tail) of , with a p-value (two-tailed) of .
Since t Stat Critical and in both tests, we fail to reject the null hypothesis, indicating that there is no statistically significant difference in compressive strength or wave propagation velocity between the two tested directions. These findings suggest that the stone does not exhibit significant anisotropic behaviour based on the measured mechanical properties and, from this point on, the stone will be considered isotropic in this study.
For a better representation of the results, a Box-and-Whisker plot is shown in Figure 9, displaying the distribution of the dataset. The main box in the plot represents the interquartile range (IQR), which spans from the first quartile () to the third quartile (). This box contains the middle 50% of the data points. The line inside the box represents the median () of the dataset. The cross corresponds with the mean value of the dataset. The lines extending from both ends of the box are the whiskers, which indicate the range of the data. Any data points beyond the whiskers are considered outliers.
3.2. Dependence with sample size
UWPV tests and uniaxial compressive tests were performed to determine whether the size of natural stone specimens has a significant effect on the measured mechanical properties (velocity of propagation and compressive strength, respectively).
Based on this, twenty 50 × 50 × 50 cm and an equal number of 70 × 70 × 70 cm samples were tested (Figure 10).
A t-test for independent samples was conducted, with the null hypothesis () stating that there is no significant difference between the two specimen sizes, and the alternative hypothesis () suggesting that specimen size does influence the measured mechanical properties.
For the UWPV test, the results showed that the t Statistic (t Stat) was , which is lower than the Critical t-Value (t Critical two-tail) of . Additionally, the p-value (two-tailed) was , which is well above the standard significance level of . Similarly, for the compressive test, the results showed a t Statistic (t Stat) of , also lower than the Critical t-Value (t Critical two-tail) of , with a p-value (two-tailed) of .
Since t Stat Critical and in both tests, we fail to reject the null hypothesis () in both cases. These findings indicate that there is no statistically significant difference in compressive strength or UWPV between the two specimen sizes, suggesting that specimen size does not have a measurable effect on the tested properties.
The Box-and-Whisker plots of the results can be consulted in Figure 11.
3.3. Determination of the mechanical properties of the stone
To establish a robust reference dataset for the intended correlations and to characterise the natural stone under study, the mechanical tests described in Section 2.3.2 were performed. The number of tests and shape of the tested samples can be seen in Table 5 and Figure 12. The samples were obtained from six different ashlars, although only three of them (1, 2 and 3) were tested in bending and tension. Given the lack of anisotropy and sample size dependency, the results of all the tested samples and loading directions are deemed valid and grouped together.
The results of the tests, clustered by ashlar, can be consulted in Table 6. Two types of samples were used for the uniaxial compression test: cubic (ashlars 1, 2 and 3) and prismatic (ashlars 4, 5 and 6). According to EN 772-1 [25], a shape factor of 0.96 was applied to cubic samples and 1.27 to prismatic ones, reflecting a 30% difference. The values reported in Table 6 are therefore the corrected results (shape factor included).
3.4. Correlation Between Compressive Strength and UWPV
The UWPV and the compressive strength () values of the six ashlars were analysed looking for a possible dependency of one parameter with the other. The Pearson correlation coefficient (r) is used to quantify the strength and direction of the correlation. A value of was found, indicating a linear relationship between UWPV and , Figure 13.
To quantify this relationship further, a linear regression model is used. The regression analysis confirms that UWPV is a significant predictor of compressive strength in the ashlars, with an of , meaning the model explains 84.7 % of the variation in compressive strength. The p-value for UWPV () indicates that the relationship is statistically significant. The linear regression equation is (Equation (4)):
3.5. Correlation between Compressive Strength and Tensile and Flexural Strength
Finally, the study aims to establish correlations between compressive strength () and other key mechanical properties, specifically tensile strength () and flexural strength (). This will allow to obtain such properties indirectly from the non-destructive in-situ testing.
Again, the strength of these correlations was quantified using the Pearson coefficient (r). A strong positive linear relationship was found between flexural () and compressive strength (), with . In contrast, the correlation between tensile () and compressive strength () was weaker, with , indicating only a moderate relationship.
Based on these results, linear regressions were performed, Figure 14. A strong linear correlation was observed between compressive and flexural strength (), as shown in Equation (5). However, the regression for compressive versus tensile strength resulted in an of , which is not satisfactory (see Figure 14, right panel). These results suggest that while the correlation between compressive and flexural strength is strong, the relationship with tensile strength is less reliable. Further testing may be necessary to refine this correlation.
4. Conclusions
This study aimed to establish reliable correlations for the non-destructive assessment of heritage buildings constructed from a specific type of stone, using ultrasonic testing to determine mechanical properties without causing damage.
To achieve the objective, six ashlars were first cut into smaller samples and analysed using UWPV tests, where the Ultrasonic Wave Propagation Velocities (UWPV) through multiple samples and directions was measured. The samples were then tested mechanically to determine compressive, bending, and tensile strength. Finally, the results were used to establish correlations between propagation velocity and the main mechanical properties.
The main objective of validating ultrasonic testing as a viable tool for assessing the mechanical properties of the stone in-situ has been successfully achieved, as it was demonstrated that UWPV can serve as a strong predictor of compressive strength.
The study’s secondary goals were also met. First, the stone’s anisotropic behaviour was investigated, and it was found that the stone does not exhibit anisotropy, as no significant differences in mechanical response were observed between the two principal directions tested (A and B). Second, no dependence between sample size and measured mechanical properties was observed, as tests on both 50 × 50 × 50 cm and 70 × 70 × 70 cm samples yielded consistent results. Mechanical testing of the ashlars provided reliable reference values for mechanical properties, which formed the basis for further analysis.
The most significant outcome was the identification of a meaningful linear correlation between UWPV and compressive strength (), with a Pearson correlation coefficient of , and a linear regression of .
Additionally, correlations between compressive strength () and other key mechanical properties, such as flexural () and tensile strength (), were established. A significant linear correlation was observed between flexural and compressive strength (). While the relationship between compressive and flexural strength is robust, the correlation with tensile strength is weaker and less reliable. Further testing is prescribed to improve this correlation.
In conclusion, this study validates the use of ultrasonic testing as an effective and reliable non-destructive method for assessing compressive strength in heritage stone buildings. The established correlations with other mechanical properties, such as flexural strength, provide a comprehensive framework for on-site structural evaluation, which can significantly aid in conservation and maintenance efforts without the need for destructive testing.
However, the study focused on a specific type of stone, and while the findings are promising, the results may not be directly applicable to other stone types or materials commonly found in heritage buildings. Additionally, the tested ashlars exhibited relatively similar properties, with compressive strengths ranging from [4.6, 9.4] MPa. Testing ashlars from different quarries or batches could help expand the validity of the results. The correlation between compressive and tensile strength was weaker and less reliable, and further testing with a larger dataset is needed to refine this relationship. Future work will address this by extending the sample set to include a larger number and greater variety of ashlars.
Future work could include validating the methodology in-situ, ideally on a building from which samples could be extracted and tested in the lab. In addition to this, replicating a wall structure could be an interesting follow up: while the present study focused on ashlars, its applicability to complete masonry could be explored, with a need for further investigation into the role of mortar.
Author Contributions
Conceptualization, B.Z., J.D.R.M and M.S.; methodology, B.Z., J.D.R.M and M.S.; software, B.Z. and J.D.R.M.; validation, B.Z., J.D.R.M and M.S.; formal analysis, B.Z., J.D.R.M and M.S.; investigation, B.Z., J.D.R.M and M.S.; resources, B.Z.; data curation, B.Z. and J.D.R.M; writing—original draft preparation, B.Z., J.D.R.M and M.S.; writing—review and editing, B.Z., J.D.R.M and M.S.; visualization, B.Z., J.D.R.M and M.S.; supervision, M.S.; project administration, B.Z.; funding acquisition, B.Z. and M.S. All authors have read and agreed to the published version of the manuscript.
Funding
This research was funded by the Junta de Andalucía, Consejería de Universidad, Investigación e Innovación, Spain, through its EMERGIA program for research talent attraction (EMC21-00255) and Spanish Ministry of Science and Innovation trough un the research project PID2022-138674OB-C21
Data Availability Statement
The data are available at https://idus.us.es/items/2e985d2e-e563-4d7d-bc7b-6ced629edc78.
Acknowledgments
The authors would like to express their sincere appreciation to Miguel Carrión Colchero, laboratory technician, for his valuable assistance during the experimental campaign, and to Pablo Máquez García for his contribution to the graphical design
Conflicts of Interest
The authors declare no conflicts of interest.
References
- UNESCO World Heritage Centre. Historic Centre of Cordoba. https://whc.unesco.org/en/list/313. Accessed: 2025-09-04.
- National Geographic. La Mezquita de Córdoba, el esplendor de Al-Andalus. https://historia.nationalgeographic.com.es/a/mezquita-cordoba-esplendor-al-andalus_16265. Accessed: 2025-09-04.
- González Gutiérrez, C. Spolia and Umayyad Mosques: Examples and Meanings in Córdoba and Madinat al-Zahra’. Journal of Islamic Archaeology 2022, 9, 83–104. [CrossRef]
- Barrios Neira, J.; Nieto Cumplido, M.; Palma, J.; Montealegre de Contreras, L. Contribución al estudio litológico de los materiales empleados en monumentos de Córdoba de distintas épocas. Arqueología de la arquitectura 2003, pp. 47–54.
- Tejedor, B.; Lucchi, E.; Bienvenido-Huertas, D.; Nardi, I. Non-destructive techniques (NDT) for the diagnosis of heritage buildings: Traditional procedures and futures perspectives. Energy and Buildings 2022, 263, 112029. [CrossRef]
- Matias, M.; Almeida, F.; Moura, R.; Barraca, N. High resolution NDT in the characterization of the inner structure and materials of heritage buildings walls and columns. Construction and Building Materials 2021, 267, 121726. [CrossRef]
- Patil, S.; Kasthurba, A.; Patil, M. Evaluation of heritage stone deterioration through non-destructive techniques (ultrasonic pulse velocity, rebound hammer test, SEM, and X-ray diffraction). In Diagnosis of Heritage Buildings by Non-Destructive Techniques; Elsevier, 2024; pp. 529–550. [CrossRef]
- Martini, R.; Carvalho, J.; Mesquita, E.; Arêde, A.; Varum, H. Sonic test singularities of granite stone masonries. Construction and Building Materials 2023, 397, 132391. [CrossRef]
- Foorginejad, A.; Taheri, M.; Mollayi, N. A Non-destructive Ultrasonic Testing Approach for Measurement and Modelling of Tensile Strength in Rubbers. International Journal of Engineering, Transactions C: Aspects 2020, 33, 2549–2555.
- Pozhanka, M.; Zagrai, A.; Baez Avila, F.; Drach, B. Application of Ultrasonic Testing for Assessing the Elastic Properties of PLA Manufactured by Fused Deposition Modeling. Applied Sciences 2024, 14. [CrossRef]
- Martini, R.; Carvalho, J.; Arêde, A.; Varum, H. Correlation Between Sonic and Mechanical Test Results on Stone Masonry Walls. In Proceedings of the Structural Analysis of Historical Constructions; Aguilar, R.; Torrealva, D.; Moreira, S.; Pando, M.A.; Ramos, L.F., Eds., Cham, 2019; pp. 456–464. [CrossRef]
- ukomski, T.; Stepinski, T. Steel hardness evaluation based on ultrasound velocity measurements. Insight: Non-Destructive Testing and Condition Monitoring 2010, 52, 592–596. [CrossRef]
- Mikulic, D.; Sekulic, D.; Štirmer, N.; Bjegovic, D. Application of ultrasonic methods for early age concrete characterisation. In Proceedings of the 8th International Conference of the Slovenian Society for Non-Destructive Testing: Application of Contemporary Non-Destructive Testing in Engineering, 2005, pp. 99–108.
- Amjad, U.; Saadeh, M.; Raqeeb, A.M.; Bader, N.; Alnuaimi, H.; Irshida, M.R. CHARACTERIZATION AND EVALUATION OF MORTAR COMPOSITES USING LINEAR AND NONLINEAR ULTRASONIC TECHNIQUES. In Proceedings of the Proceedings of 2024 51st Annual Review of Progress in Quantitative Nondestructive Evaluation, QNDE 2024, 2024. [CrossRef]
- Sánchez, J.A.; Spalvier, A.; Pérez, N. Ultrasonic Characterization of Pervious Concrete. In Proceedings of the 2023 15th IEEE International Conference on Industry Applications, INDUSCON 2023 - Proceedings, 2023, pp. 1284–1288. [CrossRef]
- Benavente, D.; Fort, R.; Gomez-Heras, M. Improving uniaxial compressive strength estimation of carbonate sedimentary rocks by combining minimally invasive and non-destructive techniques. International Journal of Rock Mechanics and Mining Sciences 2021, 147. [CrossRef]
- Bourgeois, I.; Gregorio, L.; Rodrigues, H.; Fonseca, J.; Tavares, A.; Costa, A. Application of Sonic Tests and Modal Identification in the Characterization of Masonry Walls. Applied Sciences 2023, 13. [CrossRef]
- Ortega, J.; Stepinac, M.; Lulić, L.; Núñez García, M.; Saloustros, S.; Aranha, C.; Greco, F. Correlation between sonic pulse velocity and flat-jack tests for the estimation of the elastic properties of unreinforced brick masonry: Case studies from Croatia. Case Studies in Construction Materials 2023, 19. [CrossRef]
- Ortega, J.; Meersman, M.F.; Aparicio, S.; Liébana, J.C.; Anaya, J.J.; González, M. Influence of stress level and damage on sonic tomography imaging and on the estimation of deformability properties of historic stone masonry. Construction and Building Materials 2024, 417. [CrossRef]
- Barrios Neira, J.; Montealegre, L.; Ortega, A.; Meroño, J.E.; Aguilera, M.L. Biocalcarenites as construction materials in Santa Marina de Aguas Santas Church at Cordoba, Spain. Materiales de Construcción 2009, 59, 125–134. [CrossRef]
- Mármoles y Piedras Gutierrez. Mármoles y Piedras Gutierrez. http://mypg.es/index2.html. Accessed: 2025-09-04.
- AENOR. UNE-EN 1936:2007 - Natural stone test methods - Determination of real density and apparent density, and of total and open porosity. Standard UNE-EN 1936:2007, Asociación Española de Normalización (AENOR), 2007.
- Huesca-Tortosa, M.; Navarro-Jiménez, M.; Rodríguez-García, J. Evaluation of Eco-Friendly Consolidating Treatments in Pugliese Tuff (Gravina Calcarenite). Buildings 2024, 14, 1–24. [CrossRef]
- AENOR. UNE-EN 12390-1:2022 - Ensayos de hormigón endurecido. Resistencia a tracción indirecta de probetas. Standard UNE-EN 12390-1:2022, Asociación Española de Normalización (AENOR), 2022.
- European Committee for Standardization (CEN). EN 772-1:2011+A1:2015 - Methods of test for masonry units – Part 1: Determination of compressive strength. Standard EN 772-1:2011+A1:2015, CEN, Brussels, 2015.
Figure 1.
Ashlars received from the quarry
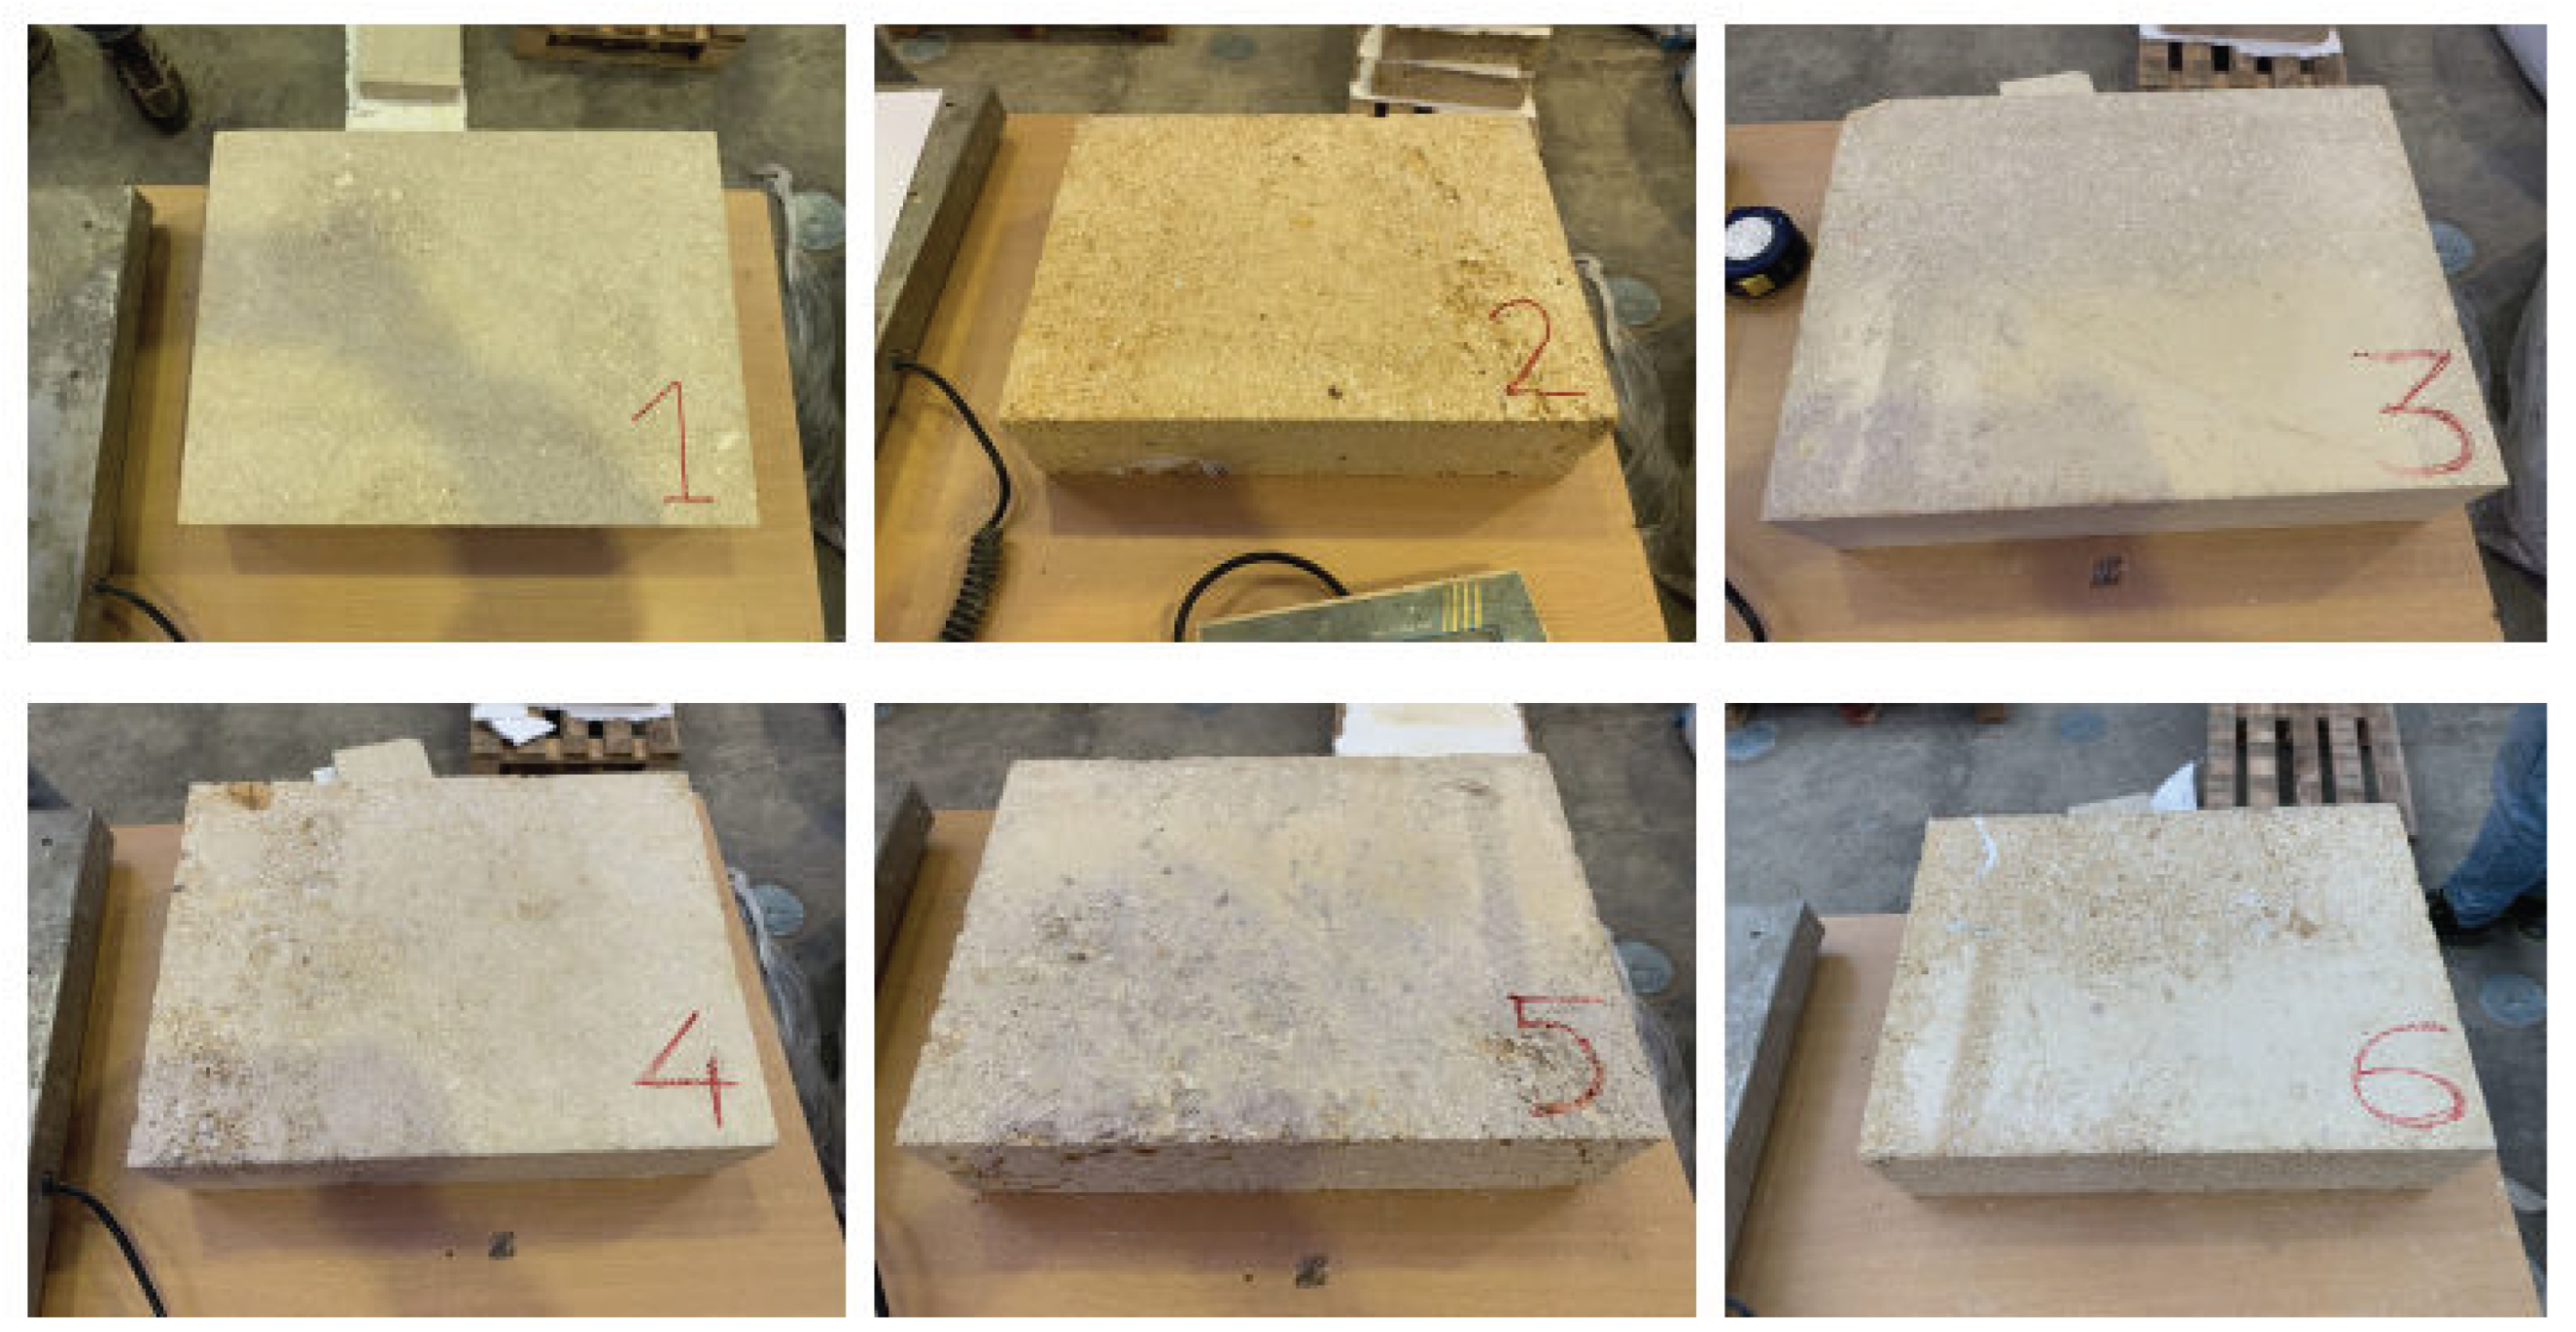
Figure 2.
High-resolution Scanning Electron Microscope FEI Teneo image of one of the samples
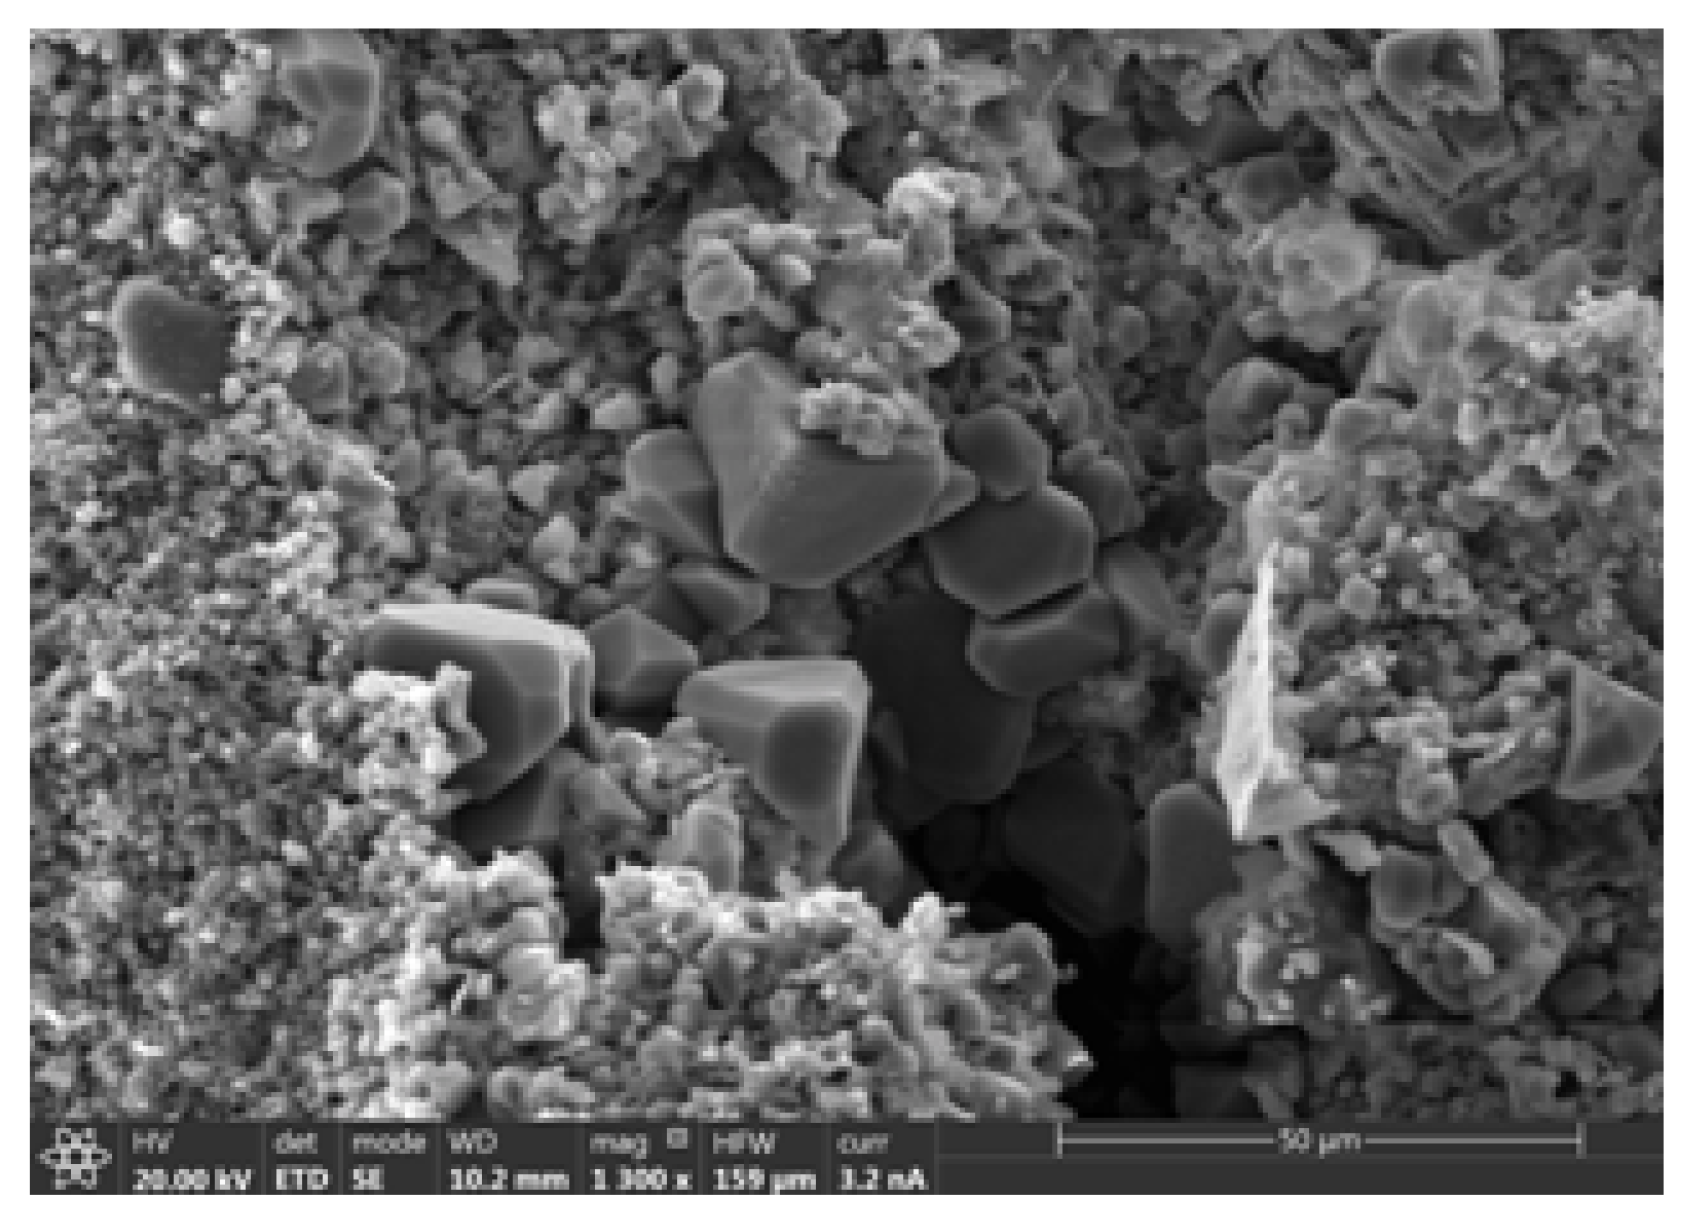
Figure 3.
EDS for the calcite matrix (a), quartz and phyllosilicates (b).
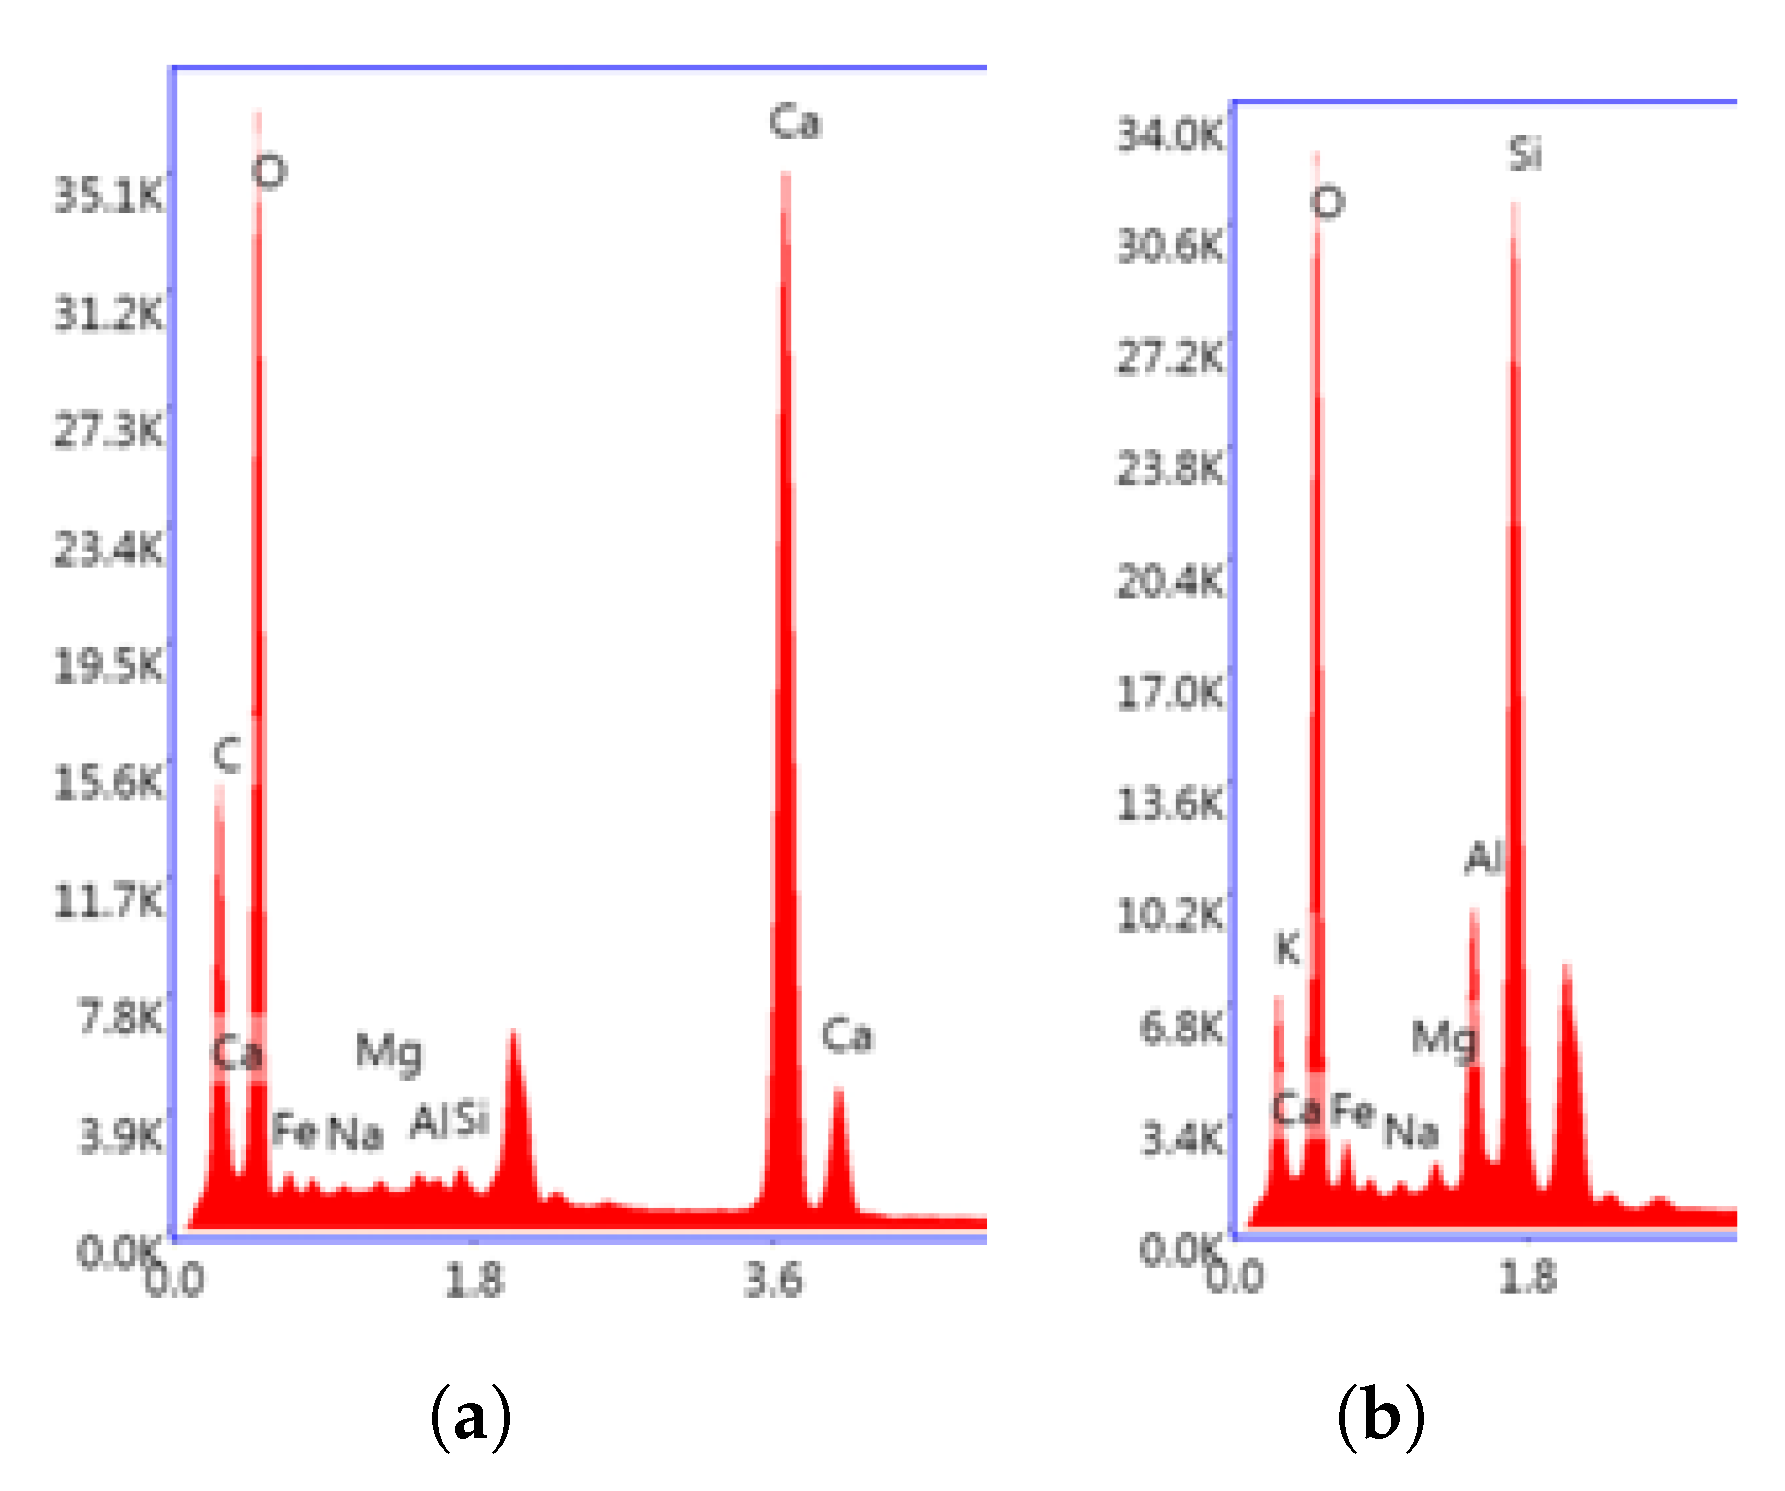
Figure 4.
Receiver signal from ultrasonic equipment
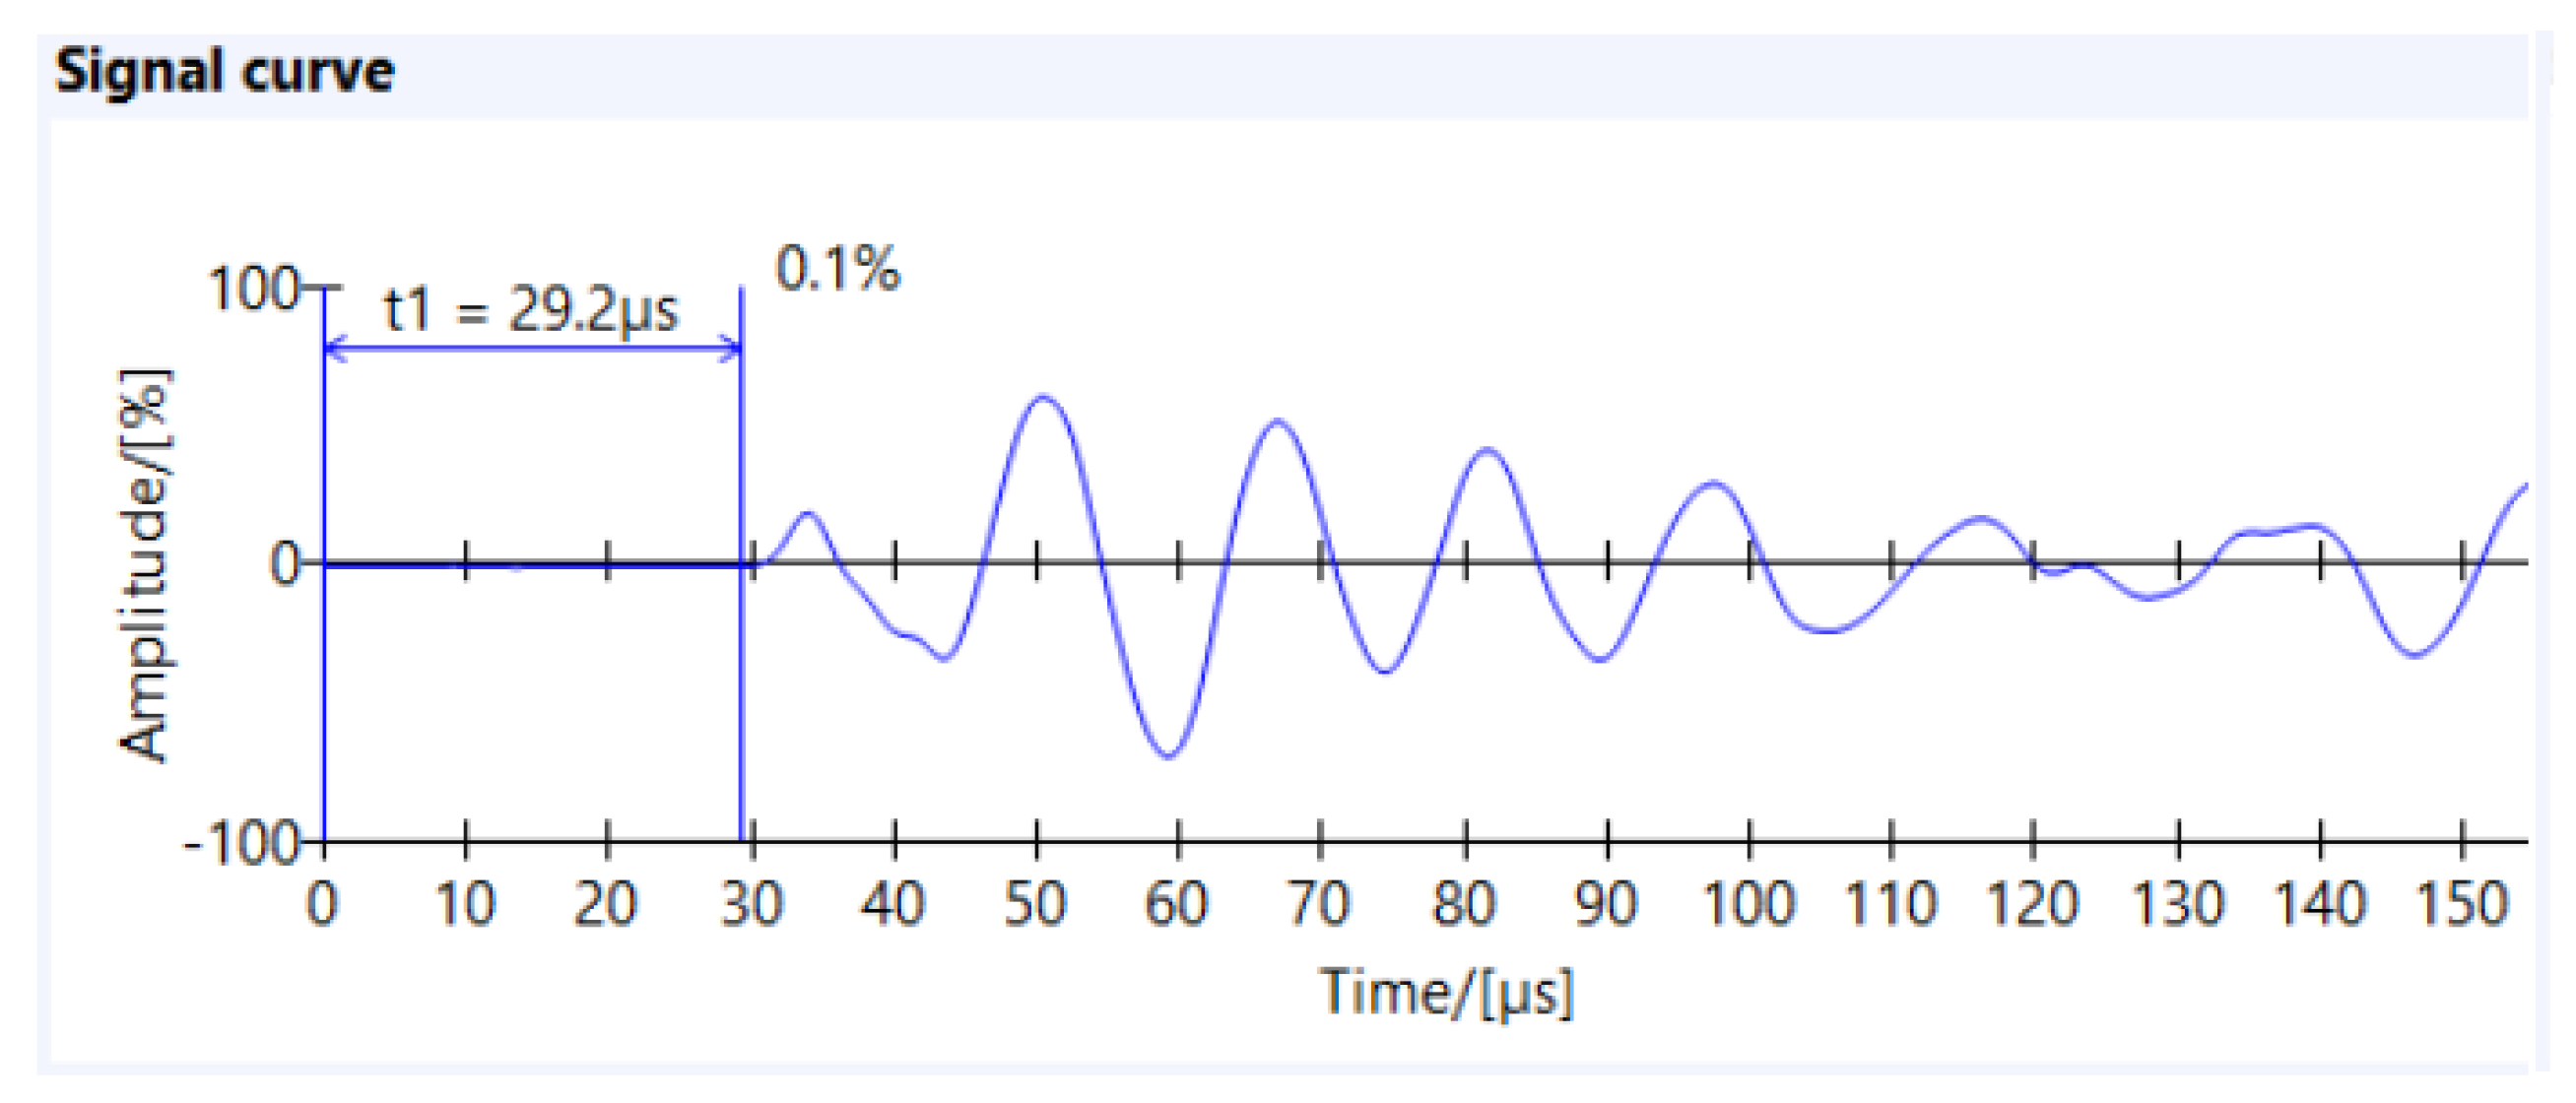
Figure 5.
UWPV testing equipment
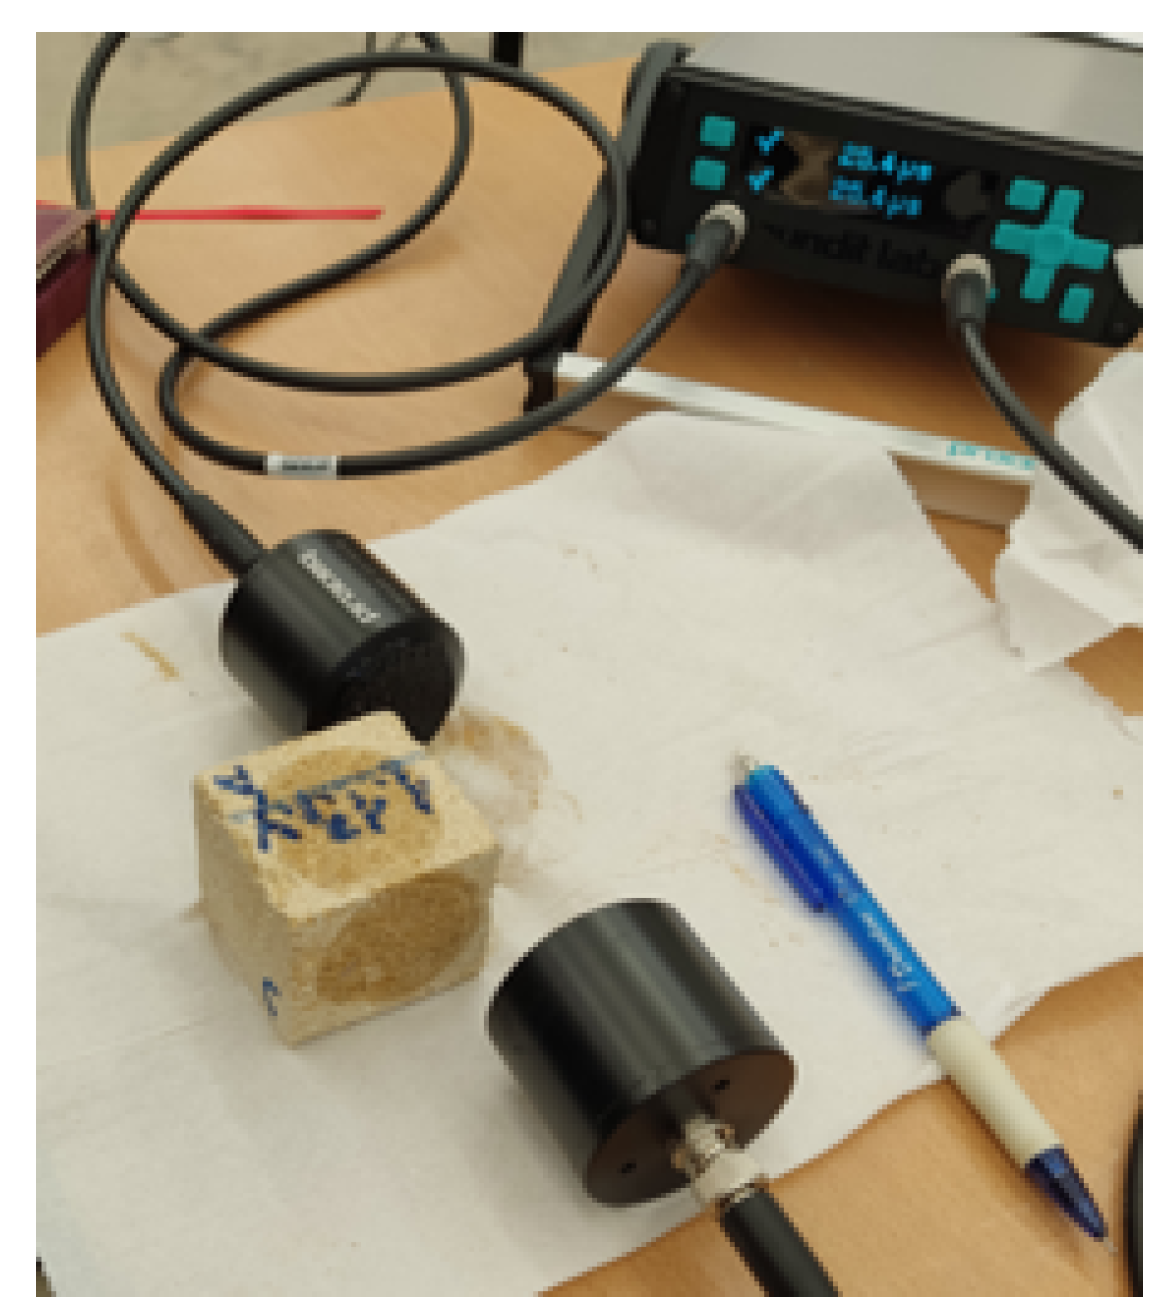
Figure 6.
Tests set up for the uniaxial compression test (left), the three-point bending test (middle) and split test (right). The arrow shows the loading direction.
Figure 6.
Tests set up for the uniaxial compression test (left), the three-point bending test (middle) and split test (right). The arrow shows the loading direction.
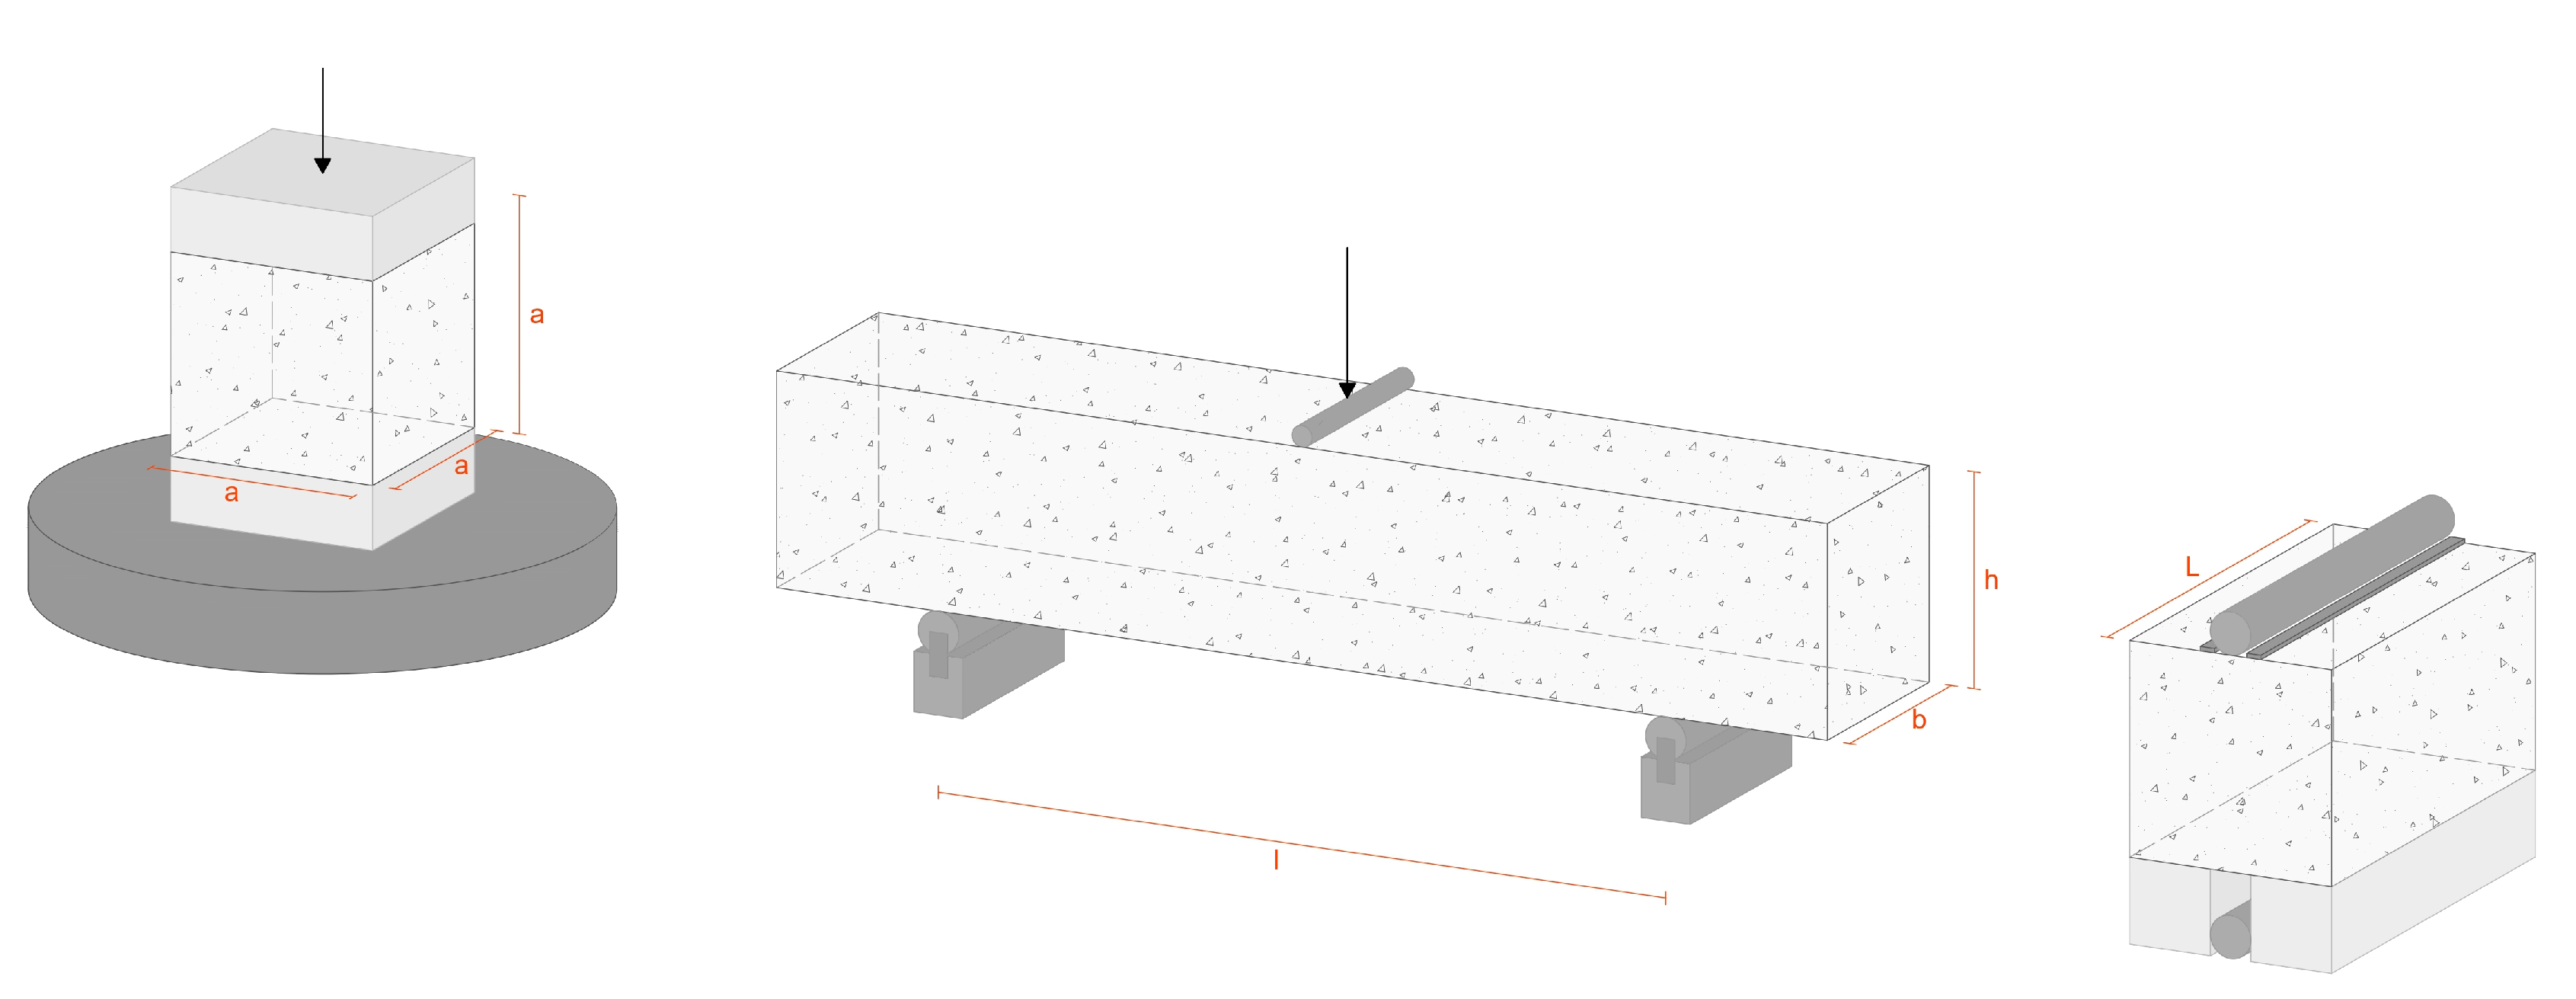
Figure 7.
Images of the test set up for the uniaxial compression test (a), the three-point bending test (b) and split test (c).
Figure 7.
Images of the test set up for the uniaxial compression test (a), the three-point bending test (b) and split test (c).
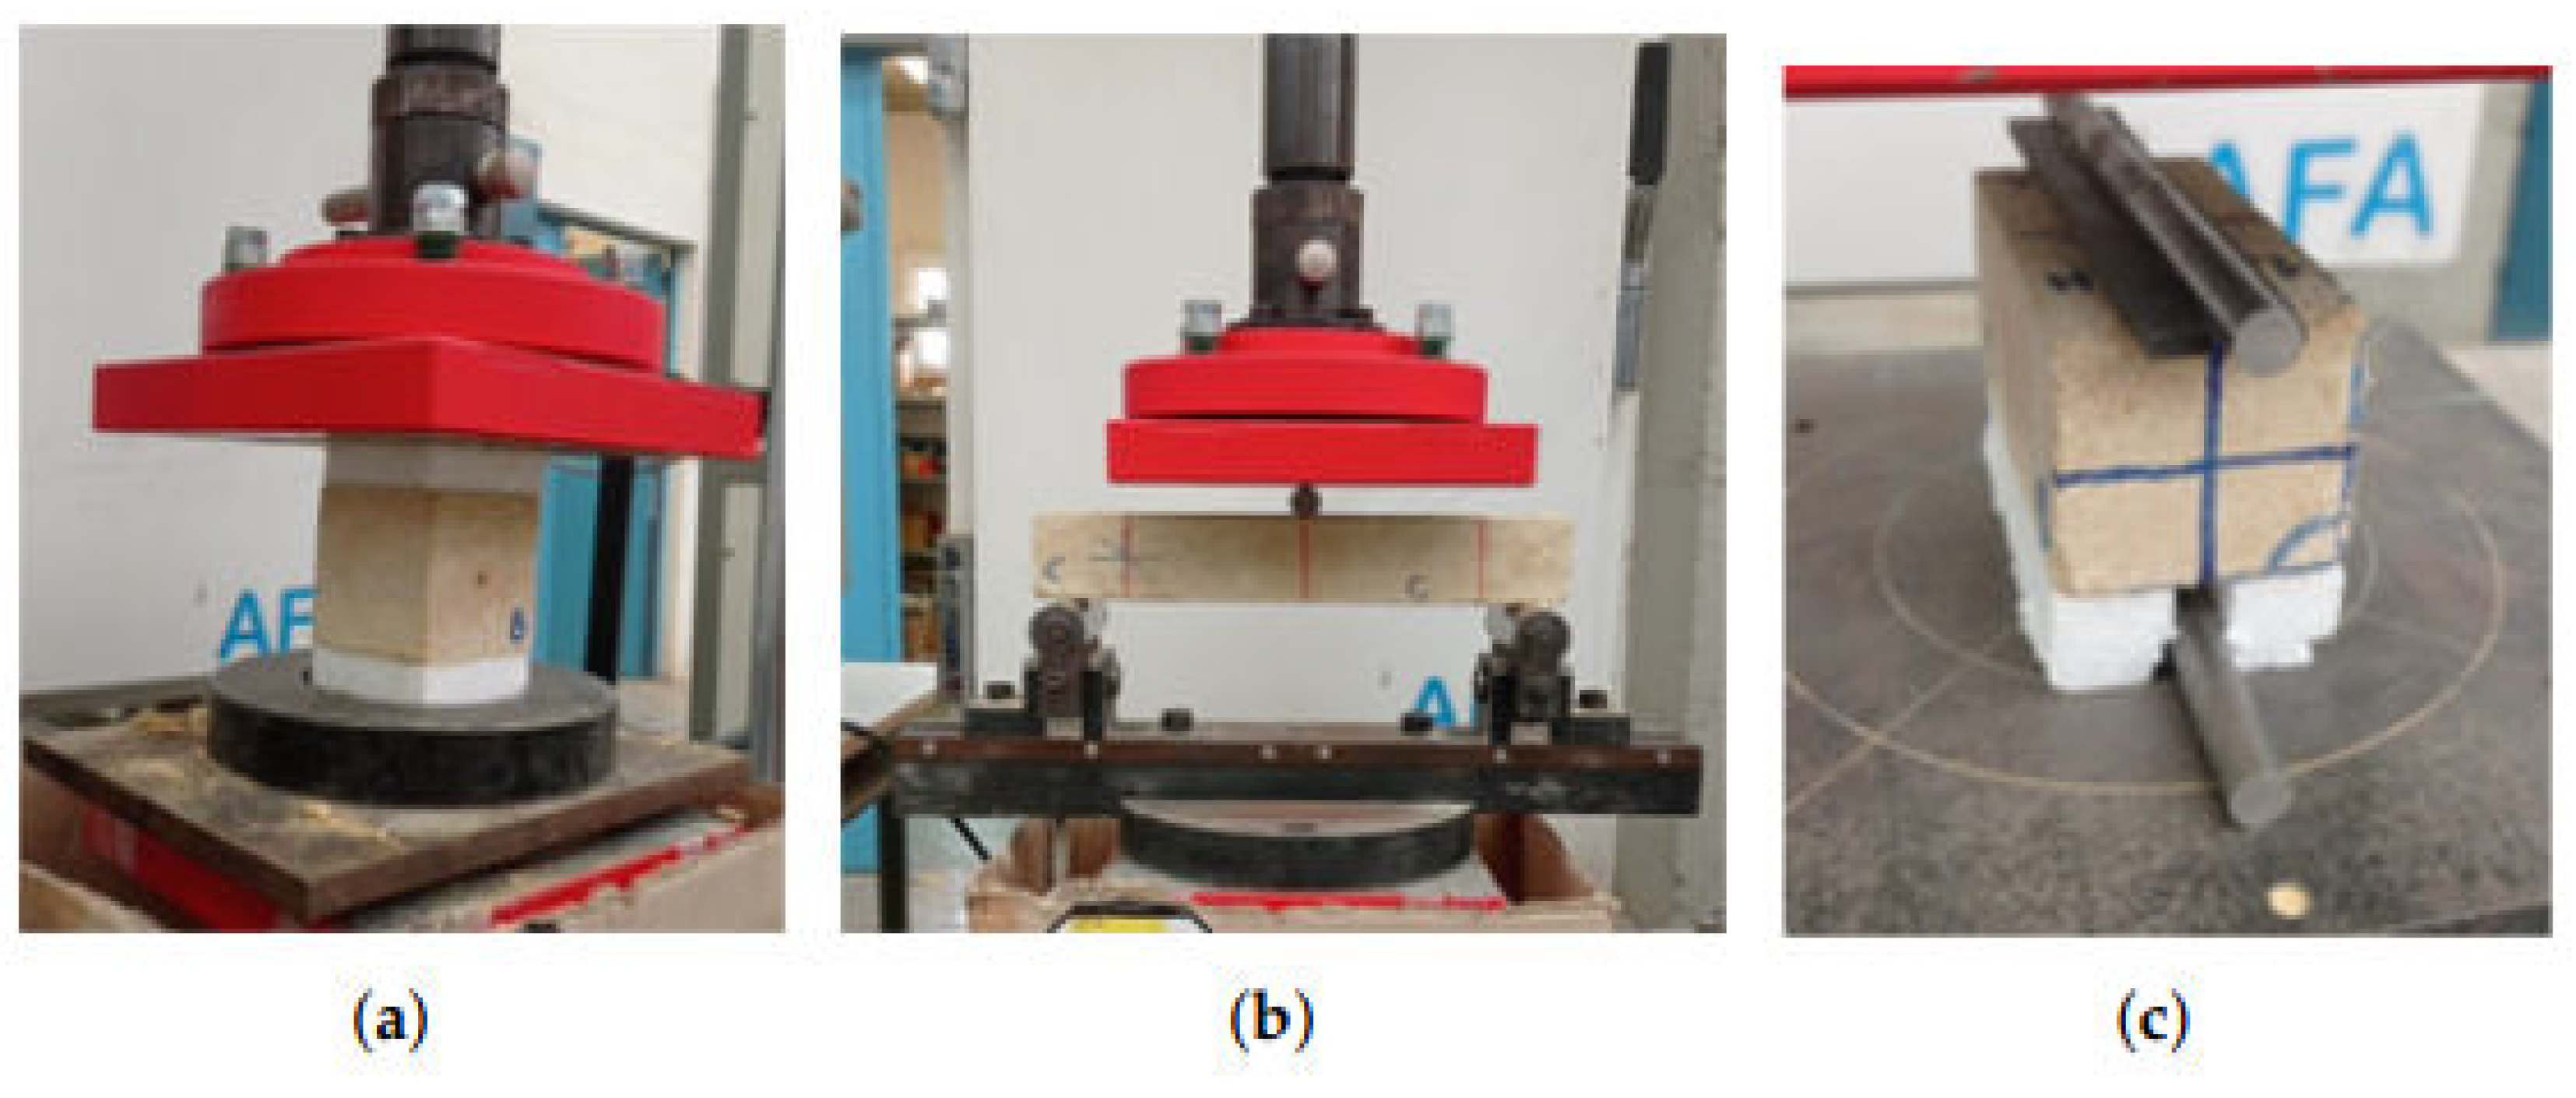
Figure 8.
Tested samples and testing directions A and B, perpendicular to the marked surface.
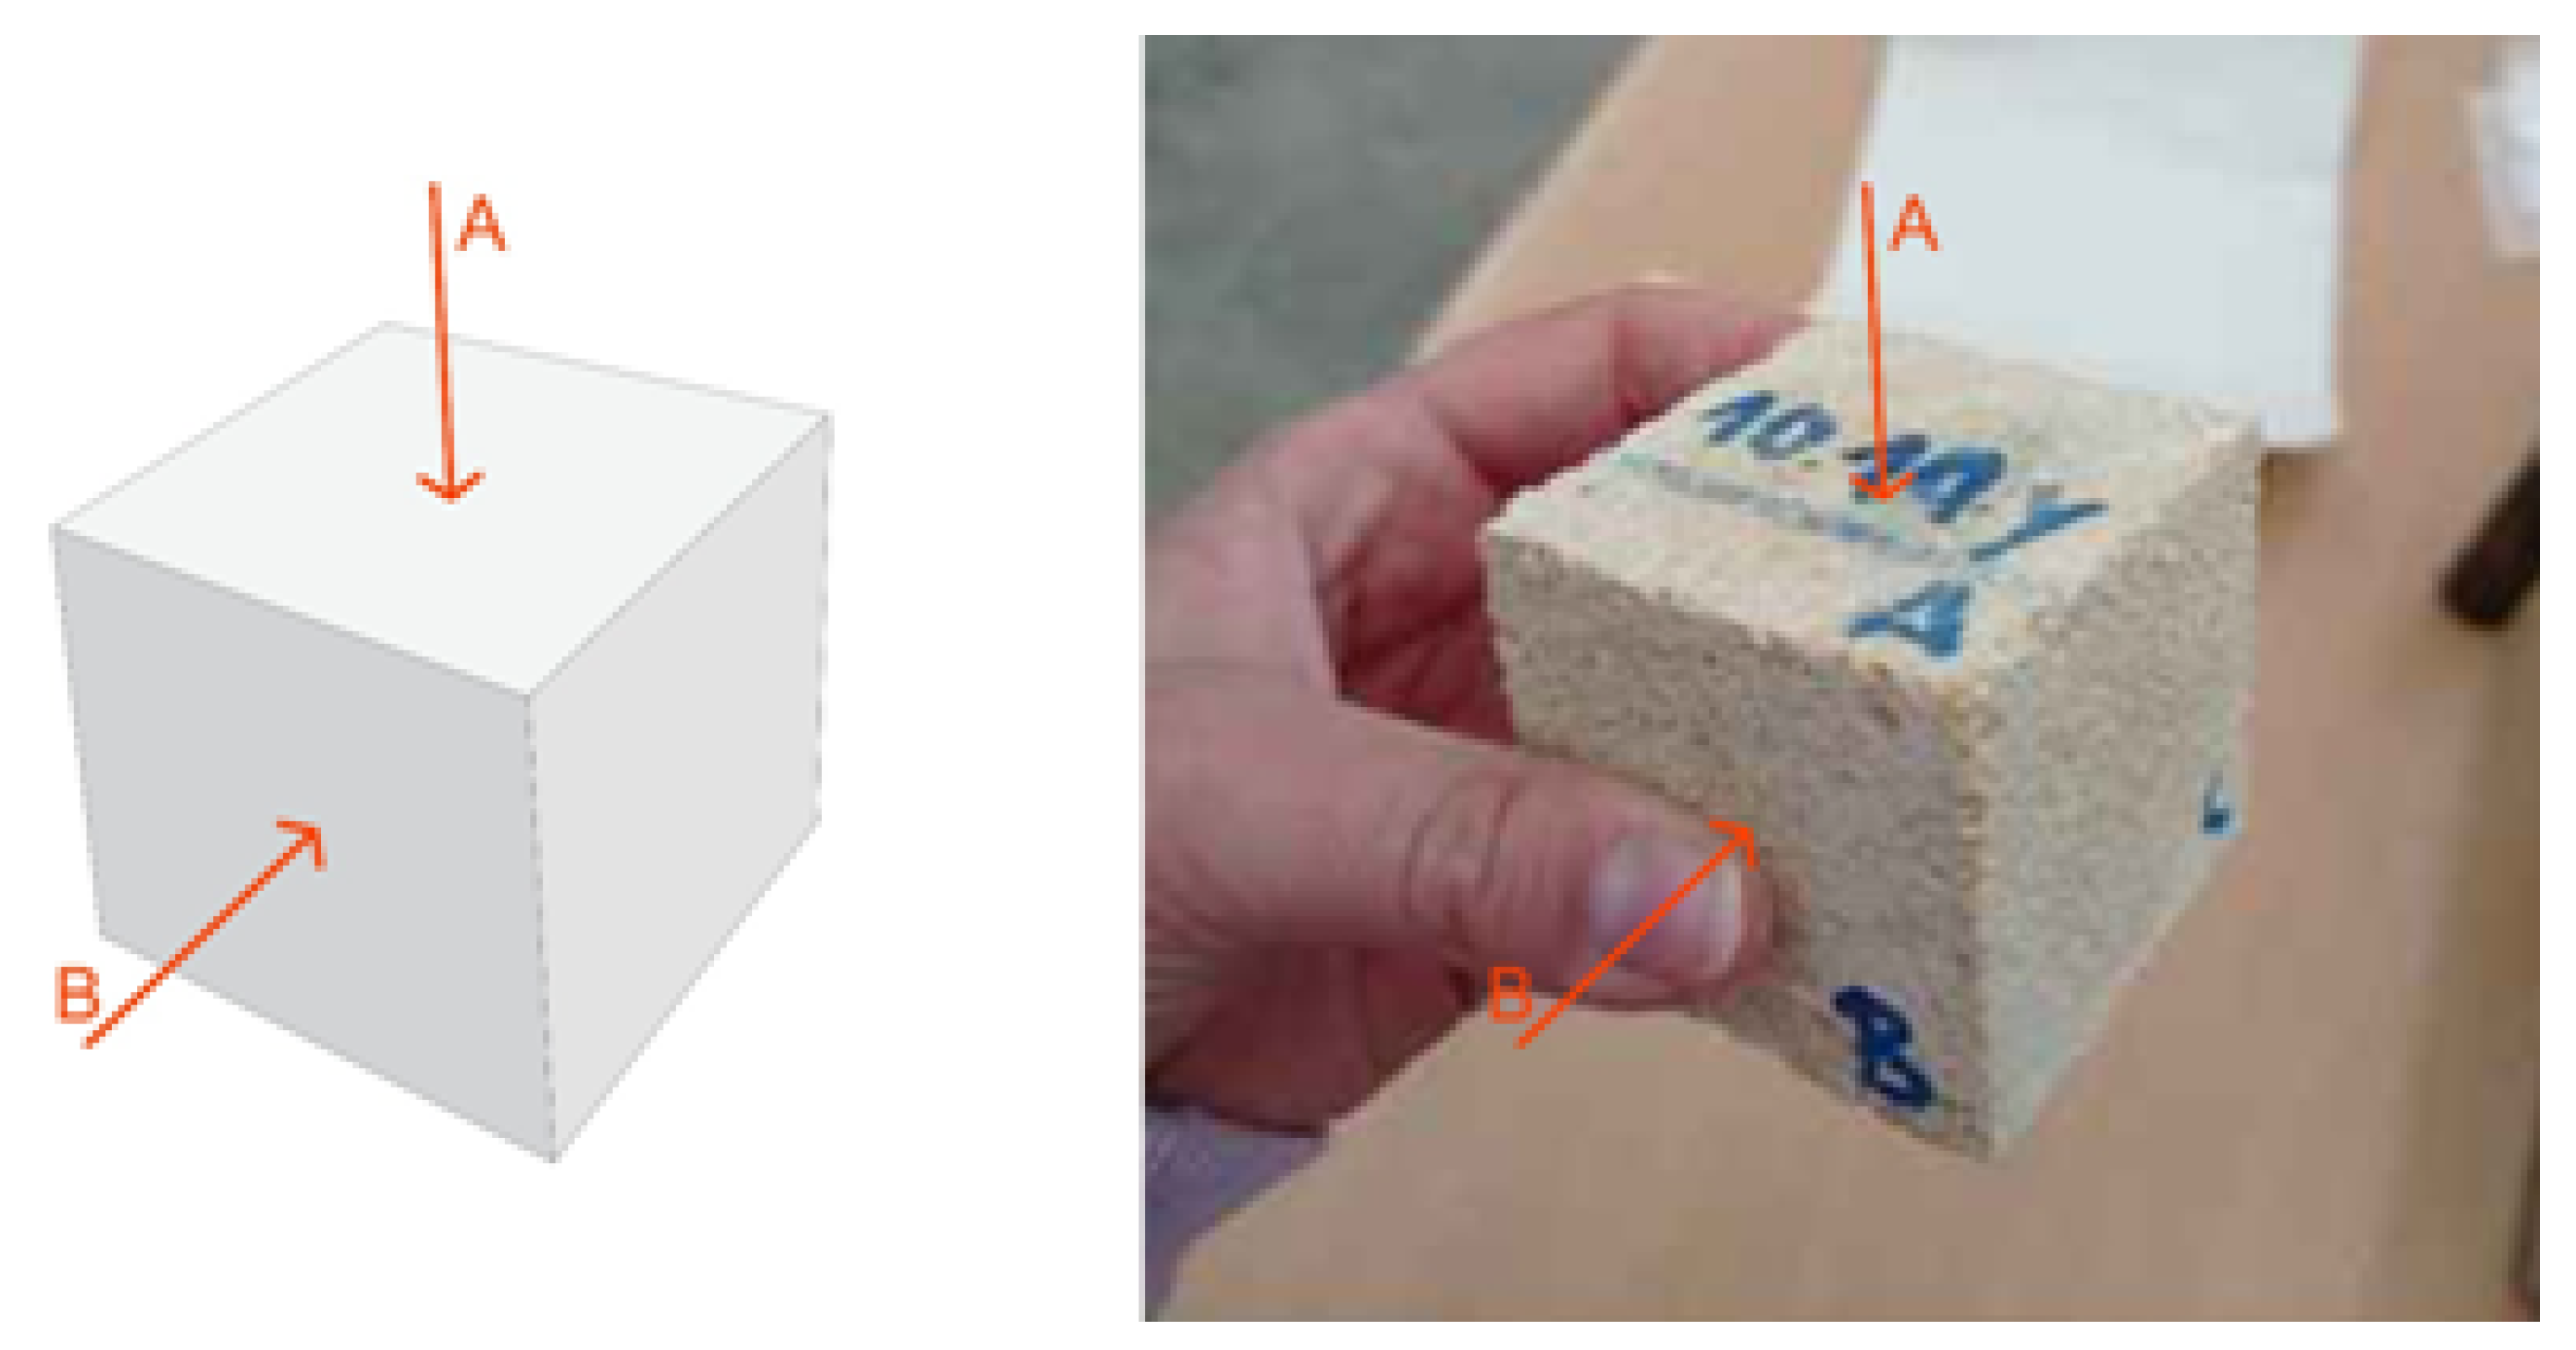
Figure 9.
Box-and-Whisker plot of the results for compressive test (a) and UWPV test (b) for directions A (blue) and B (orange).
Figure 9.
Box-and-Whisker plot of the results for compressive test (a) and UWPV test (b) for directions A (blue) and B (orange).
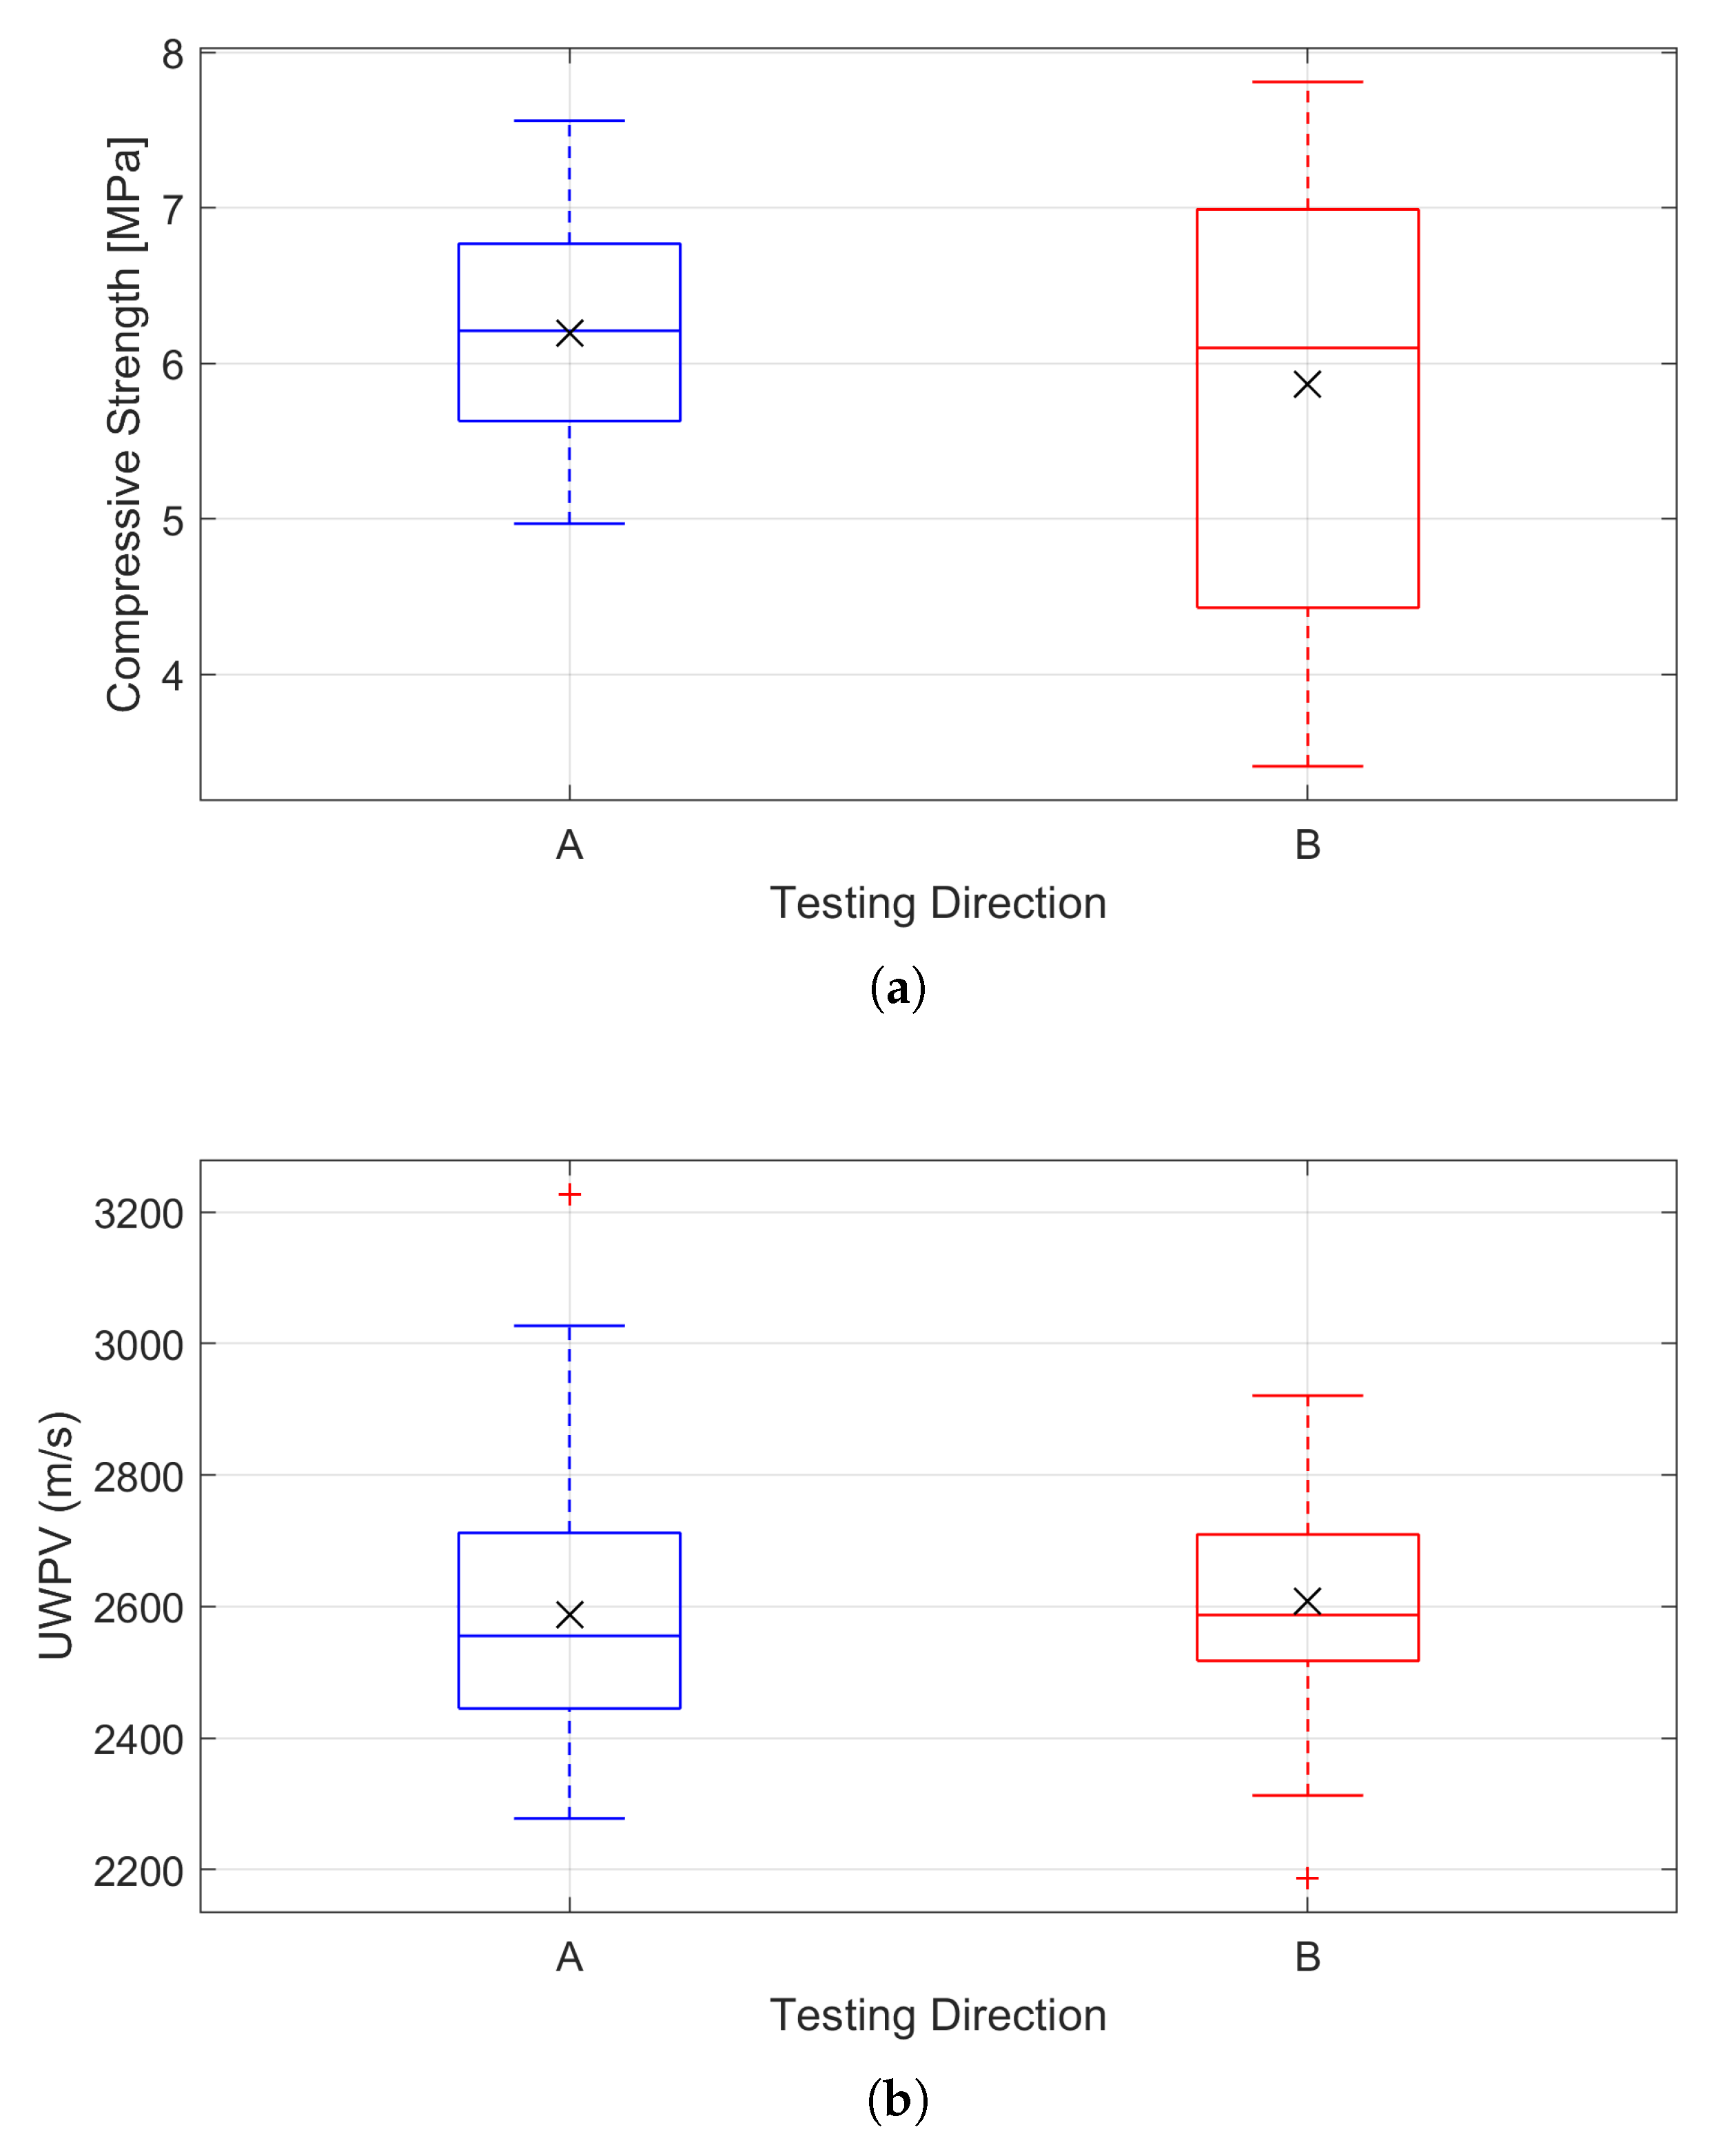
Figure 10.
Cubic samples used for dependence with sample size study.
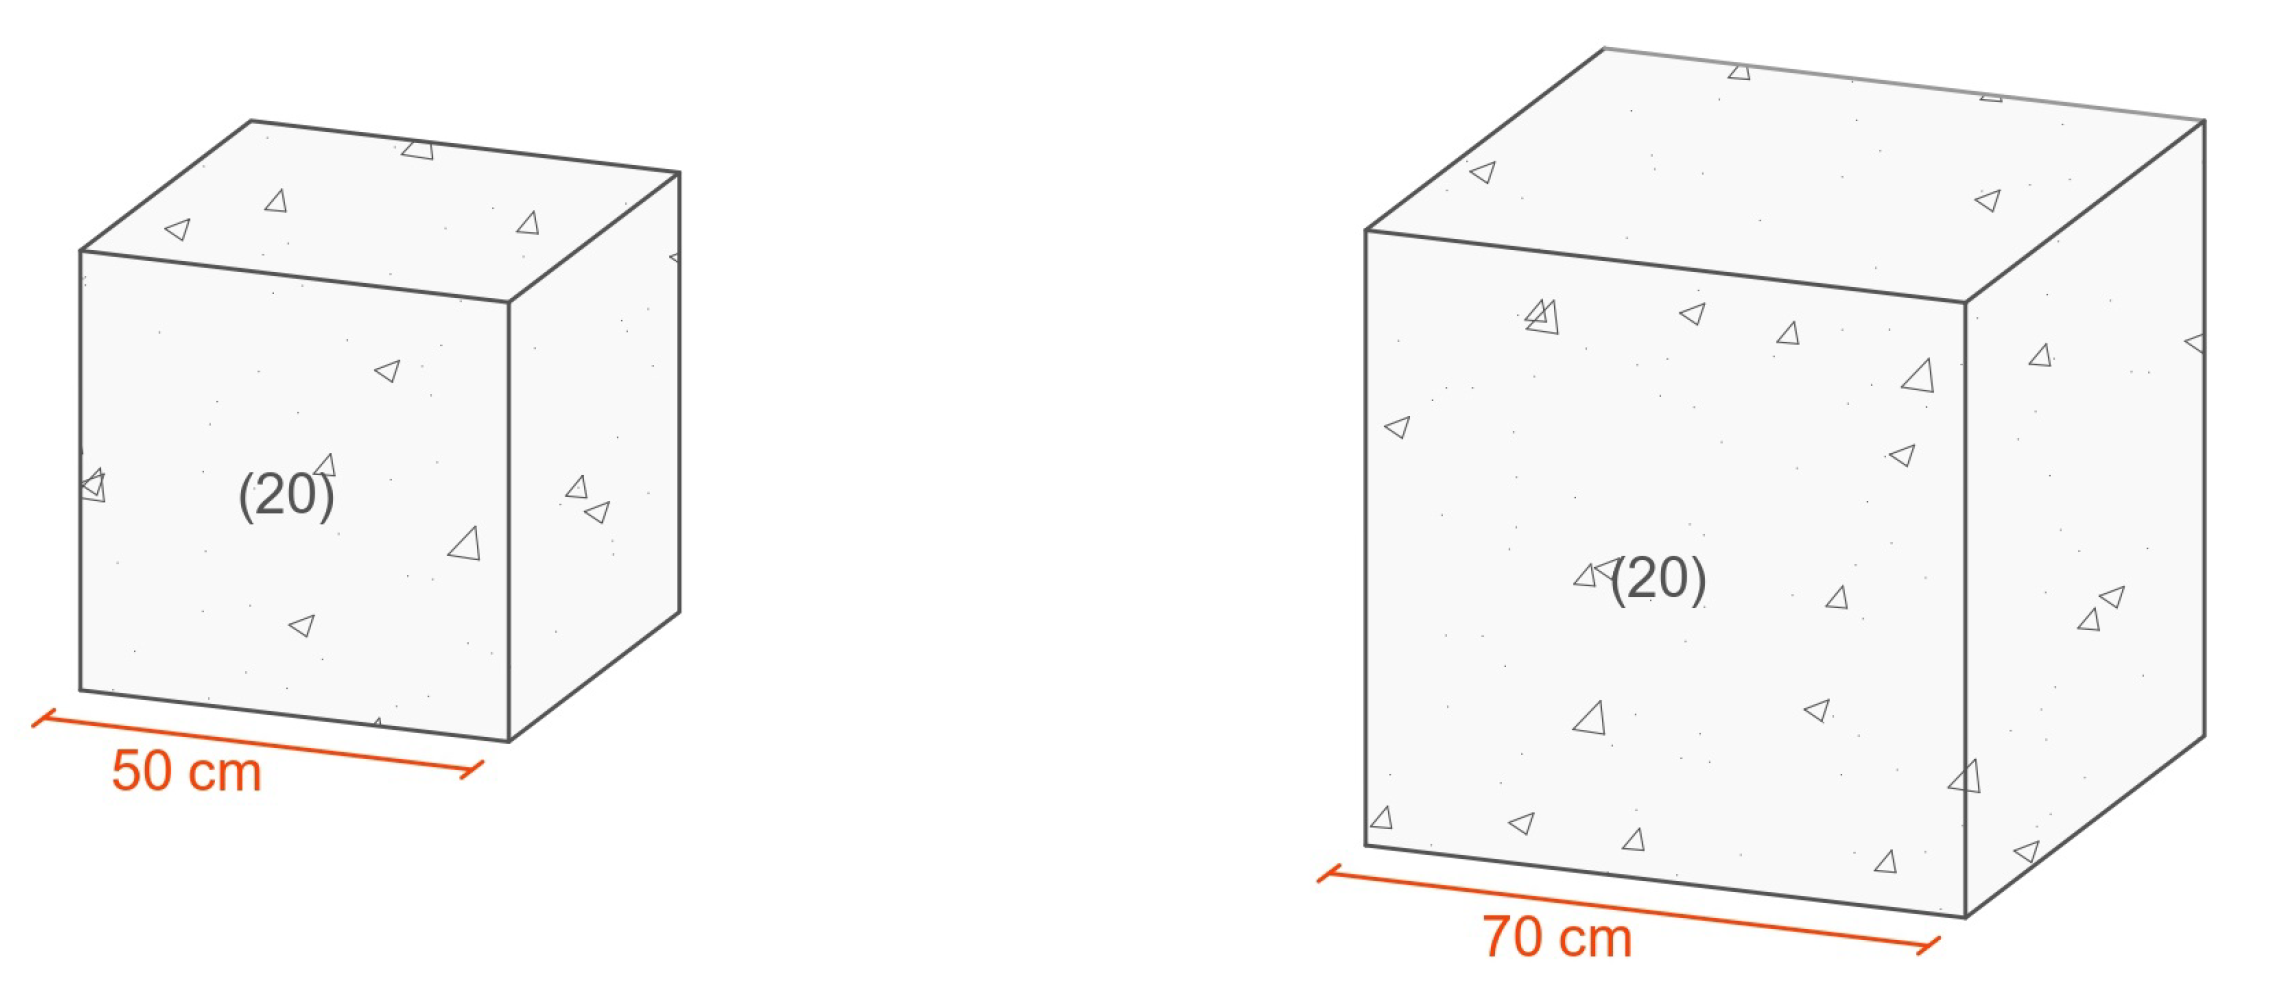
Figure 11.
Box-and-Whisker plot of the results for compressive test (a) and UWPV test (b) for 50 cm cubic samples (blue) and 70 cm cubic samples (orange).
Figure 11.
Box-and-Whisker plot of the results for compressive test (a) and UWPV test (b) for 50 cm cubic samples (blue) and 70 cm cubic samples (orange).
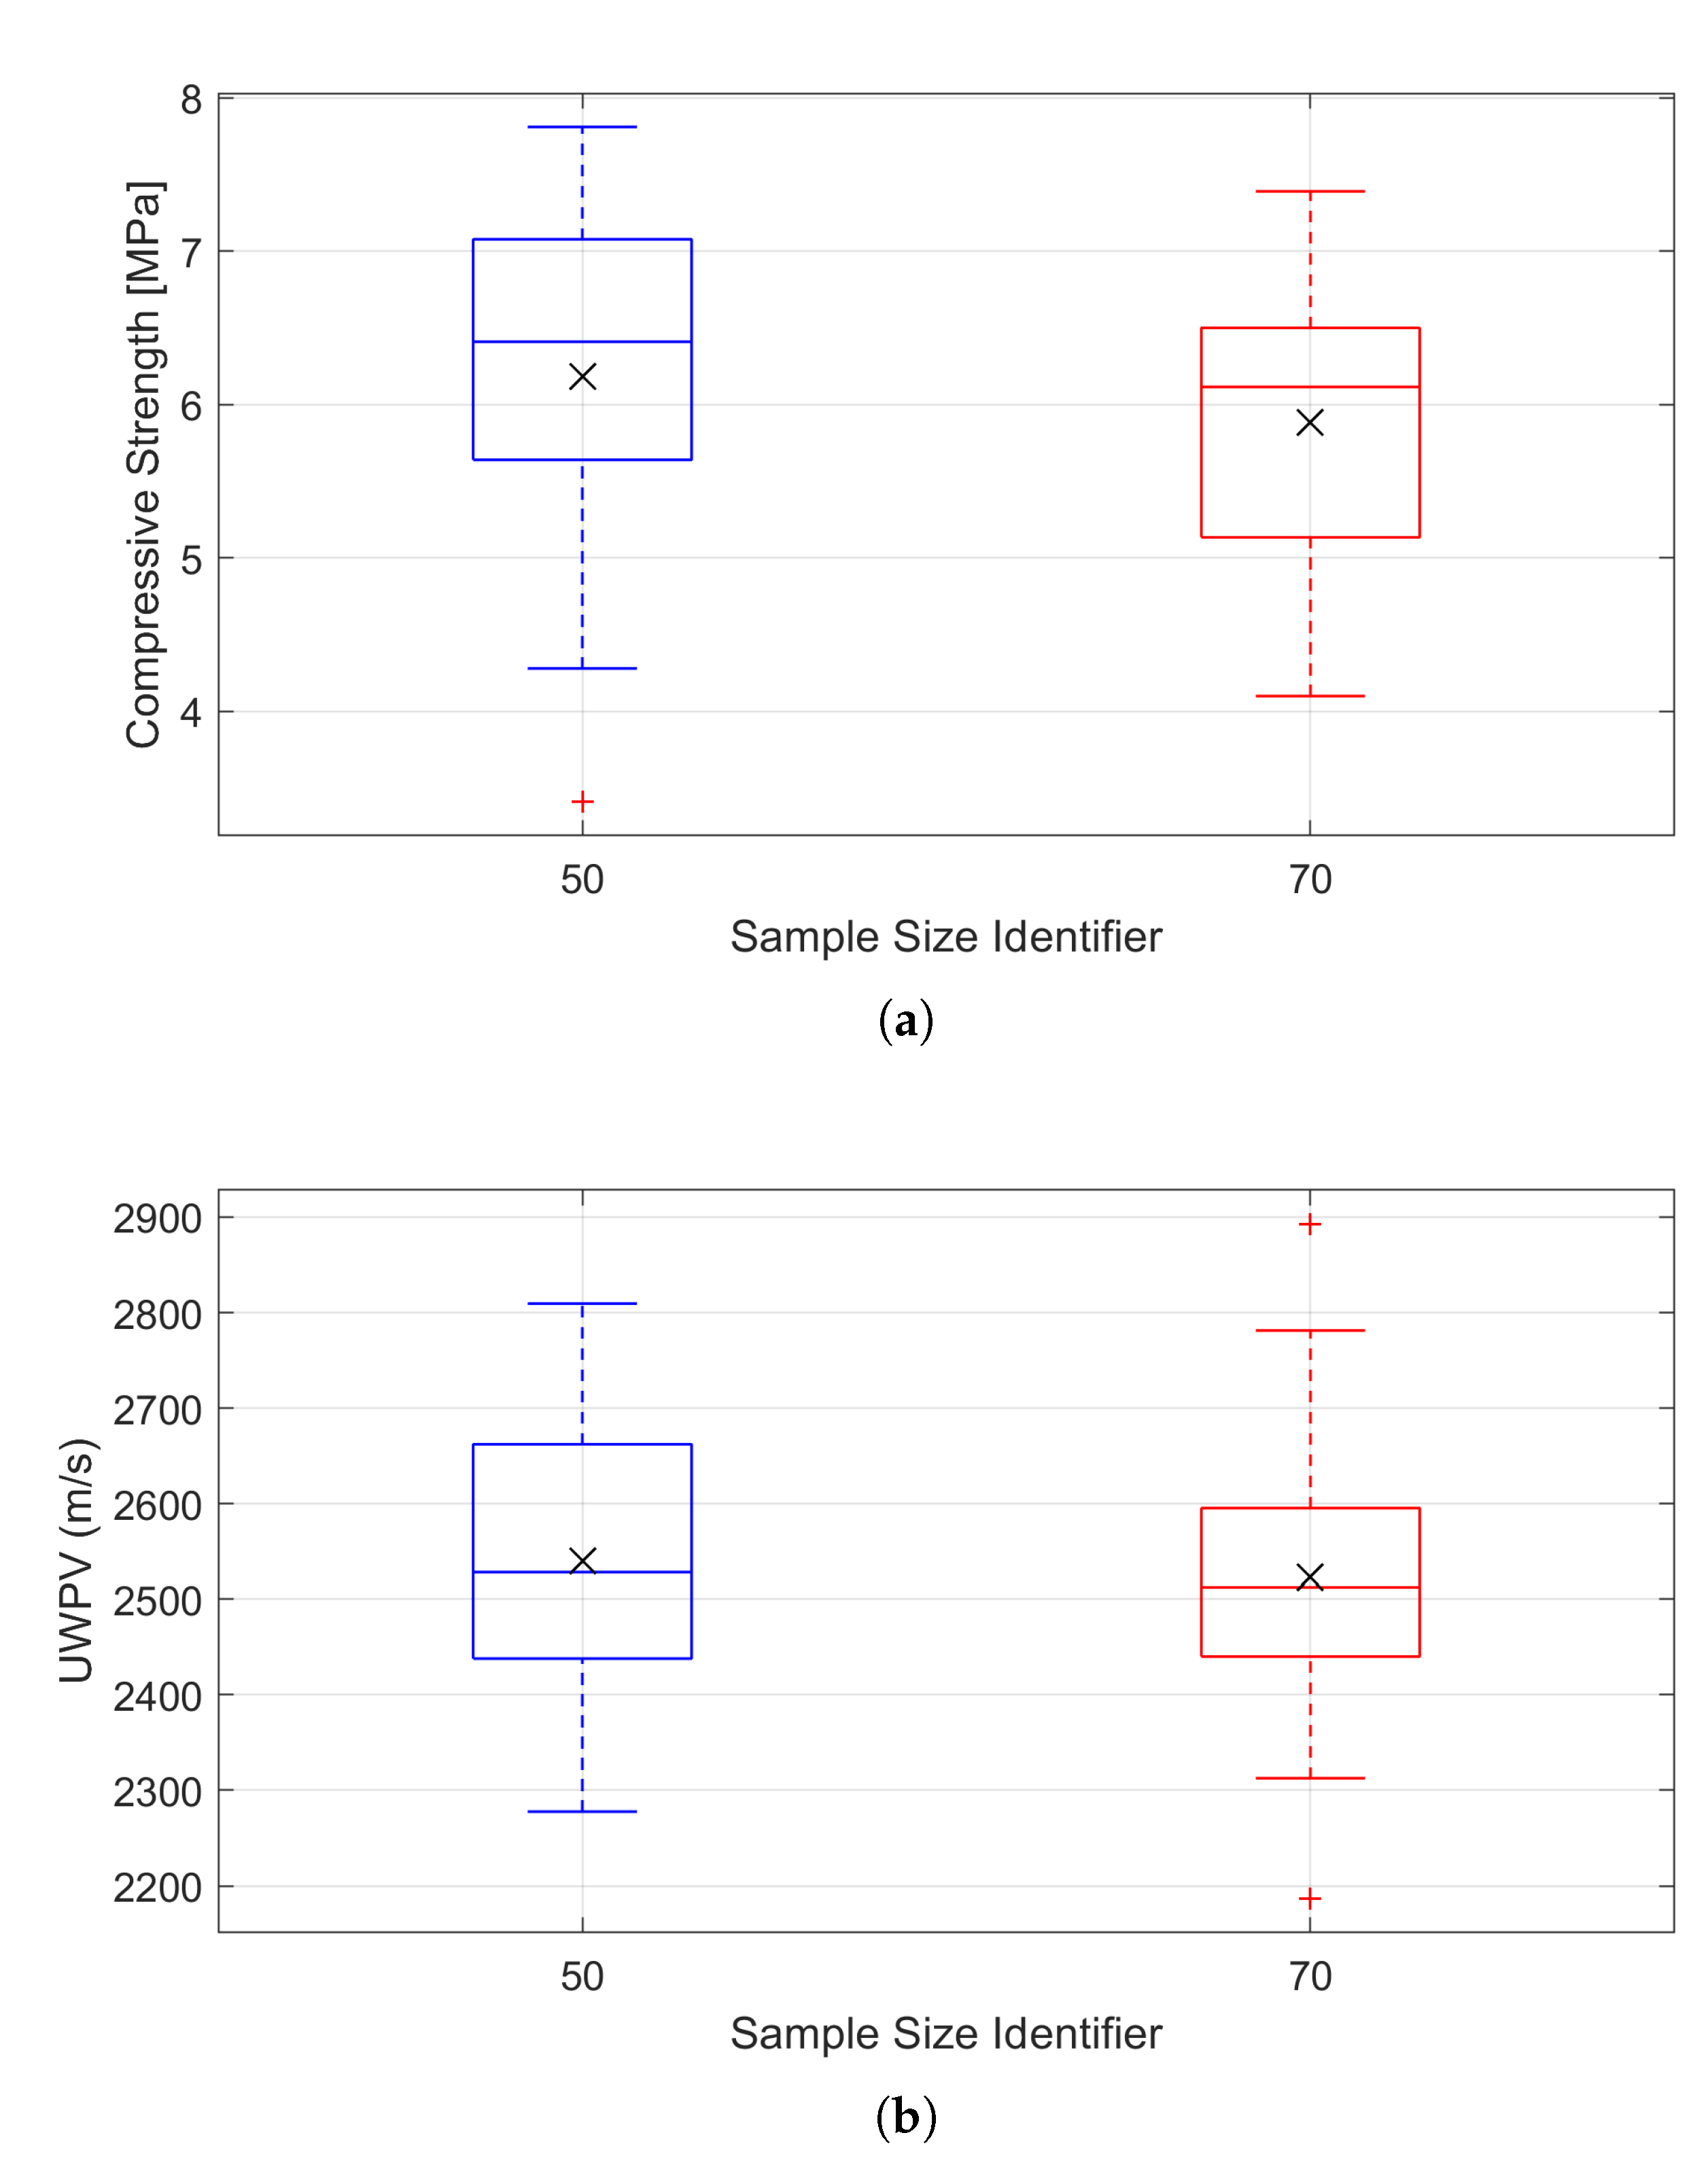
Figure 12.
Samples used for the determination of the mechanical properties of the natural stone and their dimensions.
Figure 12.
Samples used for the determination of the mechanical properties of the natural stone and their dimensions.

Figure 13.
Correlation between propagation velocity and compressive strength.
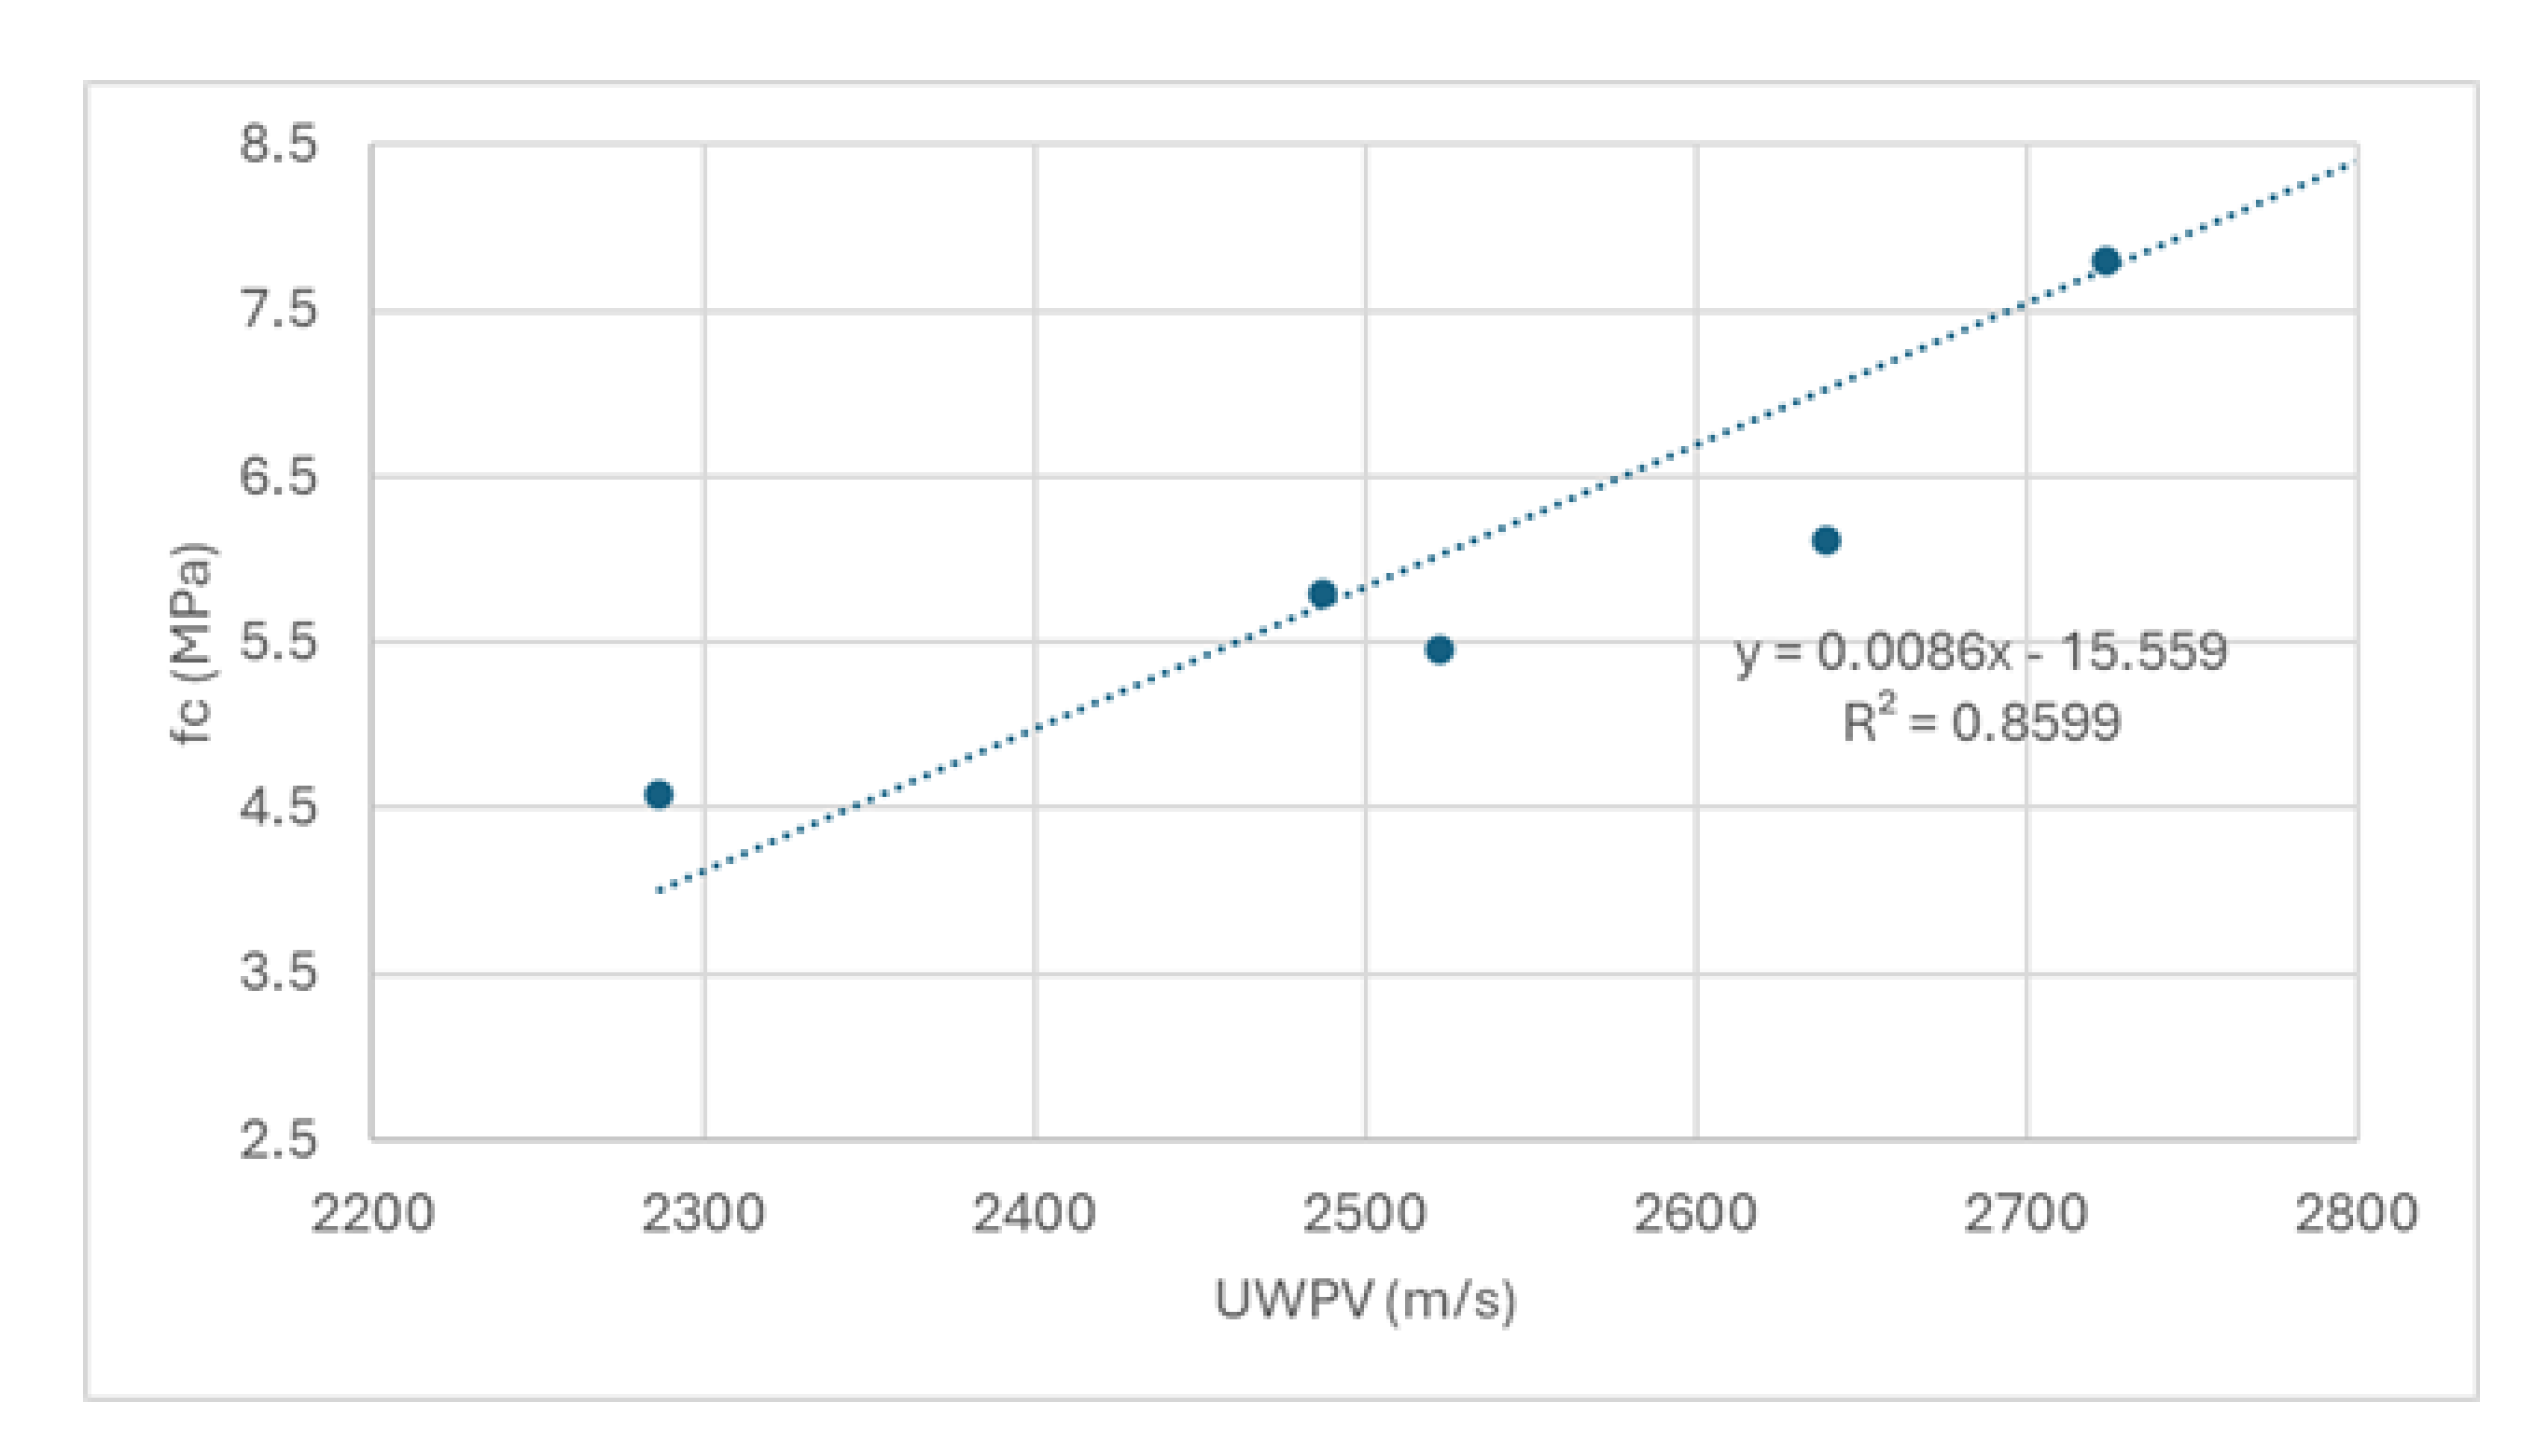
Figure 14.
Correlation between compressive and flexural strength (a), and tensile strength (b).
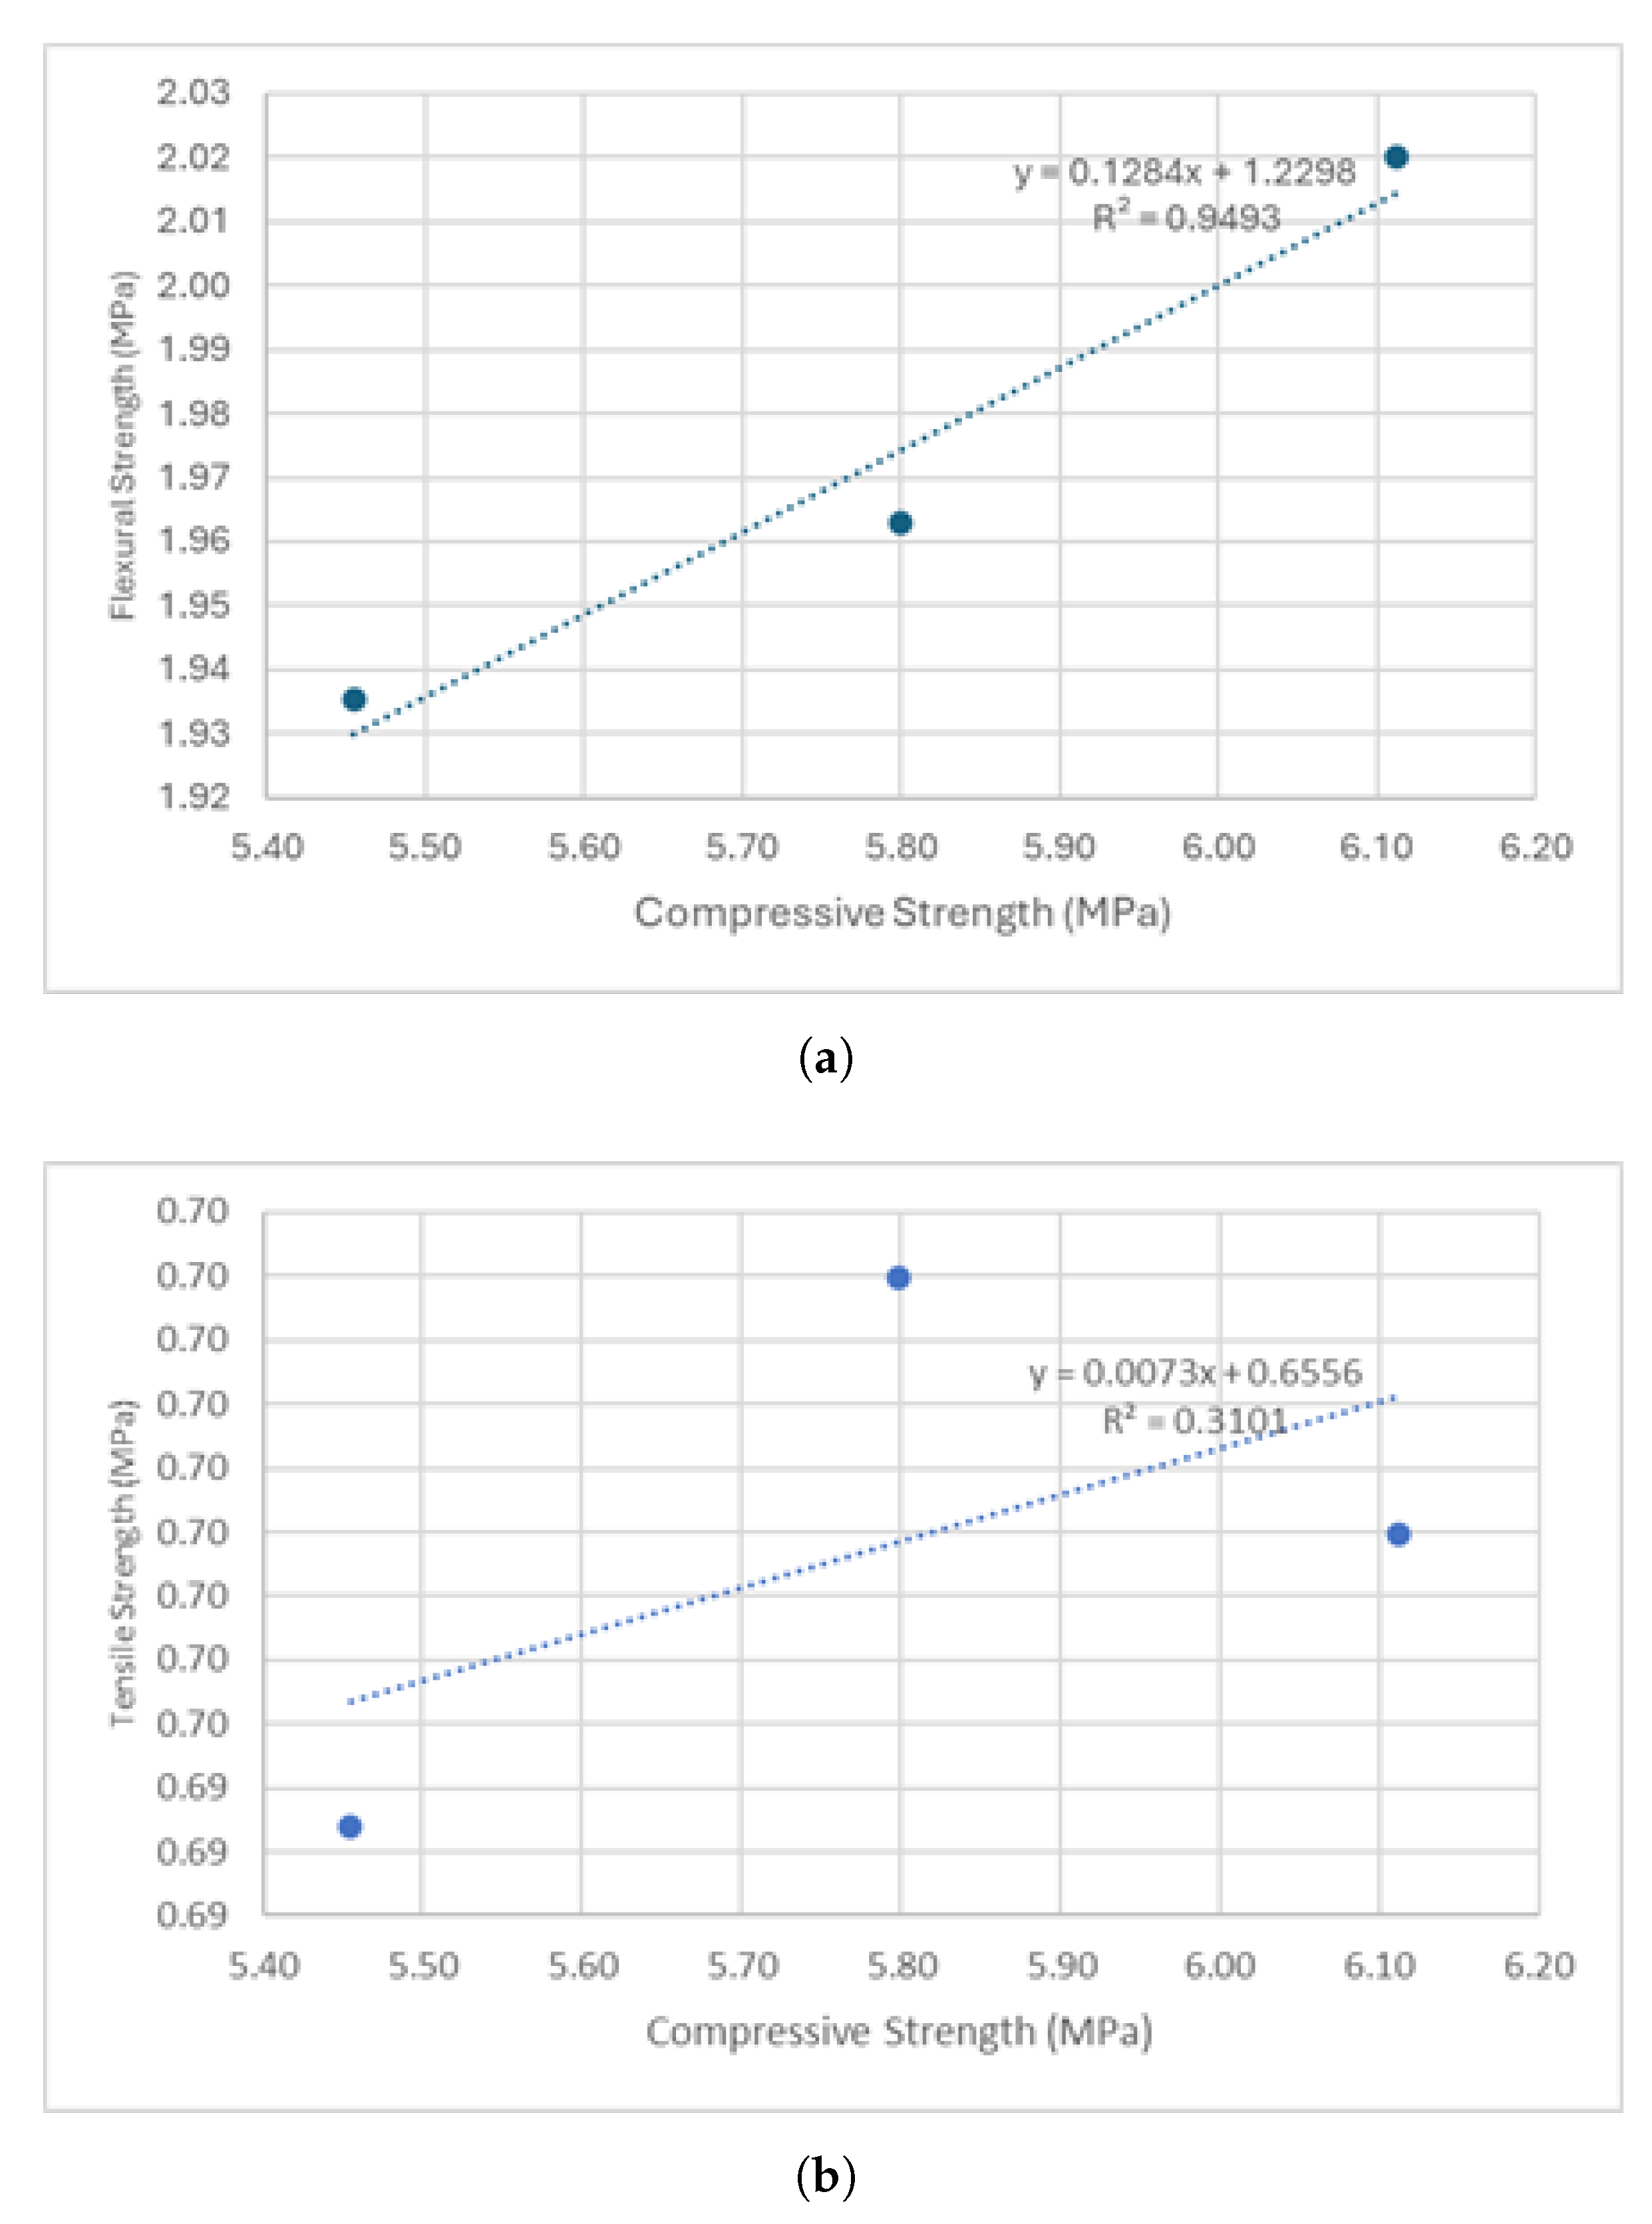

Table 1.
Comparison of density determined by immersion and geometric methods for selected samples.
| Ashlar | Sample | Density (kg/) | |
|---|---|---|---|
| Immersion | Geometric | ||
| 1 | 1.1 | 1822 | 1798 |
| 1.2 | 1808 | 1776 | |
| 2 | 2.1 | 1815 | 1789 |
| 2.2 | 1808 | 1783 | |
| 3 | 3.1 | 1841 | 1809 |
| 3.2 | 1829 | 1793 | |
Table 2.
Mean density per ashlar.
| Ashlar | Mean Density (kg/) |
|---|---|
| 1 | 1814 |
| 2 | 1833 |
| 3 | 1858 |
| 4 | 1905 |
| 5 | 1875 |
| 6 | 1786 |
Table 3.
Number of the samples tested for each test type
| Type of test | Number of tests |
|---|---|
| Uniaxial compression | 62 |
| Three-point bending | 20 |
| Splitting | 40 |
Table 4.
Number of tests and testing direction for each test type.
| Type of test | Number of tests | Testing direction |
|---|---|---|
| Uniaxial compression | 20 | A |
| 20 | B | |
| Ultrasonic | 40 | A |
| 40 | B |
Table 5.
Number and dimensions of the samples tested for each test type.
| Type of test | Ashlar tested | Number of tests | Sample dimensions (mm) |
|---|---|---|---|
| Ultrasonic | 1 to 3 | 40 | 50x50x50 |
| 40 | 70x70x70 | ||
| 4 to 6 | 20 | 50x50x100 | |
| 24 | 100x100x200 | ||
| Compression | 1 to 3 | 20 | 50x50x50 |
| 20 | 70x70x70 | ||
| 4 to 6 | 10 | 50x50x100 | |
| 12 | 100x100x200 | ||
| Three-point bending | 1 to 3 | 20 | 50x50x300 |
| Splitting | 1 to 3 | 40 | 50x50x100 |
Table 6.
Average mechanical properties values for each ashlar (1 to 6).
| 1 | 2 | 3 | 4 | 5 | 6 | Mean | CoV (%) | |
|---|---|---|---|---|---|---|---|---|
| UWPV (m/s) | 2639.11 | 2522.23 | 2487.59 | 2818.06 | 2723.89 | 2286.80 | 2638.18 | 6.69 |
| (MPa) | 6.11 | 5.46 | 5.80 | 9.35 | 7.80 | 4.59 | 6.52 | 24.44 |
| (MPa) | 2.02 | 1.94 | 1.96 | 1.97 | 1.79 | |||
| (MPa) | 0.70 | 0.69 | 0.70 | 0.70 | 0.50 |
Disclaimer/Publisher’s Note: The statements, opinions and data contained in all publications are solely those of the individual author(s) and contributor(s) and not of MDPI and/or the editor(s). MDPI and/or the editor(s) disclaim responsibility for any injury to people or property resulting from any ideas, methods, instructions or products referred to in the content. |
© 2025 by the authors. Licensee MDPI, Basel, Switzerland. This article is an open access article distributed under the terms and conditions of the Creative Commons Attribution (CC BY) license (http://creativecommons.org/licenses/by/4.0/).
Copyright: This open access article is published under a Creative Commons CC BY 4.0 license, which permit the free download, distribution, and reuse, provided that the author and preprint are cited in any reuse.


