Submitted:
06 September 2025
Posted:
09 September 2025
You are already at the latest version
Preprints on COVID-19 and SARS-CoV-2
Abstract
COVID-19 has significantly disrupted global life, leading to high infection rates, considerable mortality, and economic hardships. Mitigation efforts depended on vaccination, preventive behaviors, and lifestyle changes, emphasizing the importance of understanding what influences public compliance. This study investigated COVID-19 preventive behaviors within the Thai Muslim community in Nakhon Si Thammarat Province, southern Thailand, and developed a protection model based on the World Health Organization's framework. Using a multi-stage cluster sampling method, 233 participants from eight villages completed a questionnaire adapted from CDC guidelines. Data were analyzed using Partial Least Squares Structural Equation Modeling (Smart PLS-SEM). Results demonstrated strong reliability (CR > 0.80) despite moderate AVE values (0.314–0.491); HTMT supported discriminant validity. Key predictors of compliance included community nutrition (β = 0.435, p < 0.001) and public trust (β = 0.332, p = 0.001). Additionally, the first service had a significant influence on social support (β = 0.638, p < 0.001), which subsequently affected nutritional status (β = 0.401, p < 0.001). The model explained a moderate amount of variance (R² = 0.232–0.494), showed acceptable fit (SRMR = 0.089), and demonstrated predictive validity (Q² > 0). Overall, findings emphasize the vital roles of nutrition and trust, mediated through services and social support, in encouraging compliance with health protocols.
Keywords:
COVID‐19
; COVID‐19 pandemic
; COVID‐19 prevention model
; prevention of viral infection
; public compliance with health protocols
; social determinants of health
; public health behavior
1. Introduction
An outbreak of a novel infectious disease occurred in 2020. The World Health Organization (WHO, 2020) reported that the etiology of the pneumonia cases in Wuhan, China, had not yet been identified (Zhu et al., 2020). The Chinese government attributed the outbreak to a novel coronavirus designated as COVID-19 (Li et al., 2020). COVID-19 subsequently disseminated globally, including in Thailand. WHO classified the outbreak as a pandemic due to its rapid and extensive transmission (Cucinotta D, Vanelli M., 2020). Nonetheless, as of the latest COVID-19 statistics update in 2022, Thailand reported a total of 4,770,149 cases, with 34,586 fatalities (0.7%) and 4,692,636 recoveries (99.3%) (WHO Thailand, 2022). Despite these figures, new cases are still being identified daily.
According to reports on the COVID-19 pandemic in Thailand, the first case was identified in early 2020 in Bangkok. The earliest and most contagious cases were found in Bangkok and several clusters around the city (Institute of Medical Research and Technology Assessment, 2020; Makim, Topothai, & Topothai, 2020). Nearly all infectious clusters were linked to entertainment venues. During the first wave of the pandemic in Thailand, the Ministry of Public Health implemented an effective policy to manage and control the situation, including strict lockdown measures nationwide. Additionally, the D-M-T-T-H policy (Social distancing, Mask wearing, Hand washing, Testing, Thai-Chana) was promoted to protect the public. Moreover, the Thai government successfully contained the spread of COVID-19 during the initial phase of the pandemic. Research also shows that levels of education, knowledge of the disease, and attitudes toward COVID-19 are positively and significantly related to preventive practices for the virus (Makim, Topothai, & Topothai, 2020).
Following the containment of the pandemic and the gradual decline in new case statistics in late 2020, a second wave of COVID-19 emerged again in April 2021. This resurgence occurred following the relaxation of lockdown measures and the resumption of daily activities over several months. The pandemic significantly increased the incidence of new infections, with multiple clusters identified across various regions of Thailand, differing from the initial wave of the Wuhan pandemic in 2020. Nevertheless, the second wave further intensified the pre-existing challenges faced by the healthcare and economic systems, leading to a substantial increase in unemployment and the closure of numerous businesses, notably within the tourism industry. Fortunately, by late 2020, effective vaccines had been developed and became available for preventative use. Subsequently, the situation was mitigated, and the number of infections progressively declined by late 2021.
The third wave of the pandemic in Thailand posed considerable challenges in early 2022. A novel coronavirus variant designated “Omicron” (National News Bureau of Thailand, January 2022) resumed its dissemination. Nearly all high-risk and vulnerable populations—including the elderly aged 60 years and above, as well as individuals with non-communicable diseases (NCDs) such as Diabetes, Hypertension, Chronic Respiratory Disease, Chronic Renal Failure, Obesity, Stroke, Brain Diseases, Cancer, and Pregnant women, collectively referred to as the "608 Group"—were affected. Although controlling the infection rates during this third wave proved difficult, the mortality rate was lower compared to the second wave. This circumstance necessitates further investigation to identify the underlying causes of the issues within the health programs or other contributing factors beyond the virus itself. It is plausible that community disengagement and the ensuing misperceptions or miscommunications regarding COVID-19 information have played a significant role. In light of this phenomenon, the researcher aims to objectively analyze and address the problem, with plans to develop a collaborative model for ongoing efforts in the subsequent year involving both countries.
Given the projection by various esteemed institutions that this pandemic is likely to persist for an extended period, and considering insights from all scientific domains—including health, religion, climate, and demographics—a study has demonstrated that climate factors influence the dissemination of COVID-19. Among various weather components, such as unpolluted or polluted air, green forests producing oxygen via chlorophyll, as well as minimum, maximum, and average temperatures, humidity, and rainfall, only the average temperature of 26.1°C exhibits a significant correlation with the COVID-19 pandemic (r = .392; p < .01) (Ramadhan Tosepu, et al., 2020). Additional research suggests that weather-related transmission is linked to respiratory viruses, including RSV (Vandini et al., 2013) and SARS (Tan et al., 2005). In China, temperature has been identified as a critical factor in the propagation of COVID-19 (Shi et al., 2020). During the SARS outbreak, temperature, relative humidity, and wind speed were observed to influence transmission (Yuan et al., 2006). Furthermore, absolute air temperature and humidity have been shown to affect the transmission dynamics of COVID-19 significantly (Chen et al., 2020). Temperature and humidity may also play vital roles in determining COVID-19 mortality rates (Ma et al., 2020). Additionally, the dissemination of COVID-19 appears to be impacted by temperature and climate latitude (Poole, 2020).
Instead of these natural (weather-climate) factors, other factors predicted to contribute to high cases of the COVID-19 pandemic include population endurance, healthy behaviors such as handwashing with soap, personal hygiene, and community mobility related to cultural factors in the two countries. Likewise, in many Asian countries, Thai people spend their daily lives very quickly. Washing their hands is not interesting; mostly, they wash their hand only before eating and after using the toilet. Furthermore, visiting entertainment venues for relaxation after work among office workers in Bangkok and other major cities was a risk factor for the spread of the coronavirus, which is why the new cluster of coronavirus infections originated from an entertainment venue in Thailand. The hand-washing habit among Thai people is not remarkable to some. Anyway, the D-M-T-T-H policy was provided for every Thai person. Then, washbasins were available everywhere during the COVID-19 pandemic, such as in department stores, every shop, and even on the road, and alcohol gel was also readily available. Most Thais are careful to spend their daily lives protecting themselves. However, Thai Muslims are Sa-lam (Hand-check) when they meet. That is a different way, but we didn’t know it affected infectious diseases yet.
2. Research Aim and Hypothesis
The main aims of this study were to:
1) Determining the community's assumptions of COVID-19 prevention among the Thai Muslim community in Nakhon Sri Thammarat Province, Southern Thailand.
2) Finding a COVID-19 prevention model for the Thai Muslim community in Nakhon Sri Thammarat Province, southern Thailand.
Hypothesis development:Six initial hypotheses were developed using observational data and literature.
1. First service for Covid-19 patient has an important effect on adaptation to Covid-19 and prevent the Covid-19
2. The public trust (Beliefs and culture) of people has a positive influence on adaptation to COVID-19
3. Public compliance (Health protocol) played an important role in adaptation to COVID-19; (Prevention of COVID-19)
4. Social support has an important effect on the adaptation to COVID-19
5. Nutrition status has a positive influence on adaptation to COVID-19
6. The beliefs and culture of people are mediators of health protocol
3. Materials and Methods
3.1. Population and Sampling
The population in this study consisted of individuals aged 12 years or older residing in eight sub-districts of Nakhon Sri Thammarat Province, Thailand. G*Power was employed to calculate the sample size based on statistical power. The statistical power value for this sample was 0.95. It exceeds the minimum requirement of 0.8 (Carranza et al., 2020; Hair et al., 2019).
The inclusion criteria for this study are:
1) Muslim people living in the Muslim community in Indonesia and Thailand
2) Willing to be a participant
3) Aged >12 years old
4) Able to read and write
5) Easily contacted by the healthcare providers, the community village chief, or the Village Health Volunteer
6) Able to fill out the online questionnaire
The exclusion criteria in this study are:
1) Withdraw from the research during the data collection
2) Children aged under 12 or their parents didn’t allow for data collection, or they couldn’t continue to finish the data collection
3.2. Study Design
A multi-stage cluster sampling method was employed to recruit 233 Thai individuals from 8 predominantly Muslim villages (over 80%), located in the Thasala and Muang districts of Nakhon Sri Thammarat Province. Only one person from each family was selected for the sample in this study. The sampling strategies are represented in the following diagram.
3.3. The Instruments
The researchers developed the instrument in accordance with the COVID-19 guidelines provided by the Centers for Disease Control and Prevention (Centers for Disease Control & Prevention COVID-19, 2020). This research tool comprised five sections: primary service factors, including social support, nutritional status, adherence to health protocols, and the level of public trust, as well as an investigation into how healthcare providers, village health volunteers, and community leaders adapted to the COVID-19 pandemic.
Content validity testing was performed by an experienced health professional specializing in COVID-19 issues. The questionnaire was piloted with 200 respondents from Indonesia's Muslim community. The content validity score was 0.89, and the reliability assessment for the 63 questionnaire items demonstrated satisfactory reliability (Cronbach's alpha = 0.72). Additionally, a preliminary test with 30 respondents from the target population was conducted before the survey; no significant changes were required, and the results demonstrated acceptable reliability (Cronbach’s alpha = 0.70).
The questionnaires employed for data collection in this study comprise two sections:
Section 1: Sociodemographic data questionnaire
Section 2: The questionnaire on model development adapting to COVID-19 consists of 2 sections:
Section 1: Observation Sheet Adapting to COVID-19: This sheet consists of 12 items. Researchers collected data by observing and interviewing community health leaders to fill out the questionnaire.
Section 2: Model Development Questions Adapting to COVID-19 consists of 5 parts, labeled A to E.
A. The Relationship of the First Service Factor to Residents Exposed to COVID-19, with readiness to adapt to COVID-19, consists of 10 items.
B. Social support related to readiness to adapt to COVID-19 consists of 10 items.
C. The relationship between community nutrition status and readiness to adapt to COVID-19 consists of 14 items.
D. Public compliance relations in implementing health protocols on readiness to adapt to COVID-19 consist of 12 items.
E. The relationship between public trust levels about COVID-19 and readiness to adapt to the COVID-19 pandemic consists of 17 items.
The questionnaire was piloted on 200 respondents. Its content validity was 0.89, and the reliability test for the 63 questionnaire items showed sufficient reliability (Cronbach's alpha = 0.72).
3.4. Ethical
The permission was given by participants who signed the informed consent documents. Ethical committee approval was obtained from the “Ethics Committee in Human Research, Walailak University,” approval No. WUEC-23-089-01.
3.5. Data Collection
During the research sampling, the researchers contacted the healthcare providers at the subdistrict health hospital to determine whether the sample met the inclusion criteria. Simple sampling was used to select the subjects. Then, researchers and their field assistants, who had been trained in data collection, used questionnaires to gather data.
3.6. Data Analysis
The Smart Partial Least Squares (Smart-PLS) analysis technique was employed in this study because it is a comprehensive multivariate approach to statistical analysis that can simultaneously examine all relationships between variables in the conceptual model, including both measurement and structural components (Hair et al., 2019). This study also utilized Smart PLS 4.1.1 software. Following the Smart-PLS analysis framework, as suggested in the literature we examined in this study, a two-step approach was conducted, namely, evaluating the measurement and structural models (Hair et al., 2019). The measurement model was assessed by evaluating the reliability and validity of the reflective constructs, while the structural model was assessed by determining R², F², Q², and path coefficients (Hair et al., 2019). After that, the IPMA was conducted to identify the performance of each independent construct and to find out the constructs that had high relative importance to the target construct (dependent construct) (Ringle & Sarstedt, 2016).
4. Results
The 233 participants were selected as the samples for this study in accordance with the inclusion criteria. The sample population was predominantly female, with ages ranging from 30 to 50 years. Their educational background primarily consisted of completing primary and secondary schooling. The majority were employed as private sector employees or merchants, and most were married. The protective model is illustrated using Smart Partial Least Squares (Smart PLS).
4.1. Measurement Model Assessment
The data analysis utilizing the Smart Partial Least Squares (Smart-PLS-SEM) method elucidates the model concerning COVID-19 prevention. The model is delineated through: 1) Construct reliability and validity of the COVID-19 protection model' (refer to Table 1); 2) Heterotrait-Monotrait Ratio of Correlations, which demonstrates discrimination validity (refer to Table 2); 3) Presenting the power of the structural model using Path Coefficients (refer to Table 3); 4) Presenting the power of the structural model using R2 values (refer to Table 4); 5) Fomell-Larcker Criterion (refer to Table 5); 6) Inter-construct correlation matrix among the latent variables to assess validity (refer to Table 6); 7) An evaluation of the structural model, including the examination of potential multicollinearity among predictor constructs, tolerance, and Variance Inflation Factor (VIF) (refer to Table 7); 8) The Model Fit used to illustrate the adequacy of the structural model (See in Table 8); 9) Presenting the Predictive Relevance (Q²) of Endogenous Constructs (See in Table 9); 10) Presentation of the hypotheses assessment of the Preventive Model (See Table 10). Additionally, the PLS-ESM model used to illustrate the protective role of COVID-19 within the Thai Muslim community in Thailand is presented in Figure 1, along with six hypotheses.
This table showed construct reliability and convergent validity. Cronbach’s alpha values ranged from 0.741 to 0.901, surpassing the recommended threshold of 0.70 and indicating good internal consistency. Likewise, composite reliability (CR) values were above 0.80 for all constructs (0.811–0.917), further confirming measurement reliability. In contrast, the average variance extracted (AVE) values ranged from 0.314 to 0.491, below the usual benchmark of 0.50. These results suggest limitations in convergent validity, as the constructs only explain a modest portion of the variance explained by their indicators. Still, considering the strong reliability coefficients and evidence of discriminant validity from the HTMT criterion, the constructs were considered suitable for use in the structural model analysis.

Table 2.
The Heterotrait-Monotrait Ratio of Correlations Presenting the Discrimination Validity (HTMT).
Table 2.
The Heterotrait-Monotrait Ratio of Correlations Presenting the Discrimination Validity (HTMT).
| Construct Variables | First Serv. | Social Supp. | Commu. Nutri. Status | Public compriance&Health Proto. | Public Trust |
|---|---|---|---|---|---|
| First Service | – | 0.730 | 0.431 | 0.446 | 0.599 |
| Social Support | 0.730 | – | 0.575 | 0.563 | 0.664 |
| Community Nutrition Status | 0.431 | 0.575 | – | 0.719 | 0.546 |
| Public Compliance & Health Protocols | 0.446 | 0.563 | 0.719 | – | 0.645 |
| Public Trust | 0.599 | 0.664 | 0.546 | 0.645 | – |
The table demonstrates that discriminant validity was evaluated utilizing the heterotrait–monotrait ratio of correlations (HTMT). The HTMT values for all construct pairs ranged from 0.431 to 0.730, with 95% confidence intervals below the conservative threshold of 0.85 (Henseler, Ringle, & Sarstedt, 2015). These results indicate that discriminant validity is established according to the HTMT criterion, even though the Fornell–Larcker criterion was not fully satisfied. This suggests that, although conceptual overlap exists among some constructs, they are empirically distinct and can be reliably used in the structural model.
Table 3.
Presenting the power of the structural model using Path Coefficients.
| Path | β | T-statistic | p-value |
|---|---|---|---|
| First Service → Social Support | 0.638 | 13.288 | <0.001 |
| First Service → Public Trust | 0.557 | 8.874 | <0.001 |
| First Service → Public Compliance&Health proto. | 0.385 | 5.018 | <0.001 |
| Community Nutrition Status→ Public Compliance&Health proto. | 0.518 | 7.179 | <0.001 |
| Community Nutrition Status→ Public Trust | 0.249 | 3.546 | <0.001 |
| Social Support → Public Compliance&Health proto. | 0.361 | 4.062 | <0.001 |
| Social Support → Community Nutrition Statatus | 0.401 | 5.203 | <0.001 |
| Social Support → Public Trust | 0.352 | 4.078 | <0.001 |
| Public Trust → Public Compliance&Health Proto. | 0.332 | 3.211 | 0.001 |
The analysis of the structural model revealed several significant pathways among the latent constructs. First, the 'First Service' exerted the most substantial influence on 'Social Support' (β = 0.638, T = 13.288, p < 0.001), emphasizing its vital role in activating community support mechanisms. Additionally, 'First Service' had a direct impact on 'Public Trust' (β = 0.302, T = 3.260, p = 0.001) and exhibited a moderate but significant effect on 'Public Compliance and Health Protocols' (β = 0.385, T = 5.018, p < 0.001). The 'Community Nutrition Status' significantly affected both 'Public Compliance' (β = 0.435, T = 5.135, p < 0.001) and 'Public Trust' (β = 0.249, T = 3.546, p < 0.001), underscoring the importance of community-level nutrition in influencing health-related behaviors. Moreover, 'Public Trust' was identified as a significant predictor of 'Public Compliance' (β = 0.332, T = 3.211, p = 0.001). 'Social Support' made significant contributions to 'Community Nutrition Status' (β = 0.401, T = 5.203, p < 0.001) and 'Public Trust' (β = 0.252, T = 3.222, p = 0.001), although its direct effect on compliance was non-significant (β = 0.070, T = 0.811, p = 0.418). Collectively, these findings highlight the interdependent mechanisms among service provision, nutrition, trust, and social support that drive public compliance with health protocols.
Table 4.
Presenting the power of the structural model using R2 values.
| Construct | R² | Interpretation |
|---|---|---|
| Community Nutrition Status | 0.435 | Moderate |
| Public Trust | 0.494 | Moderate |
| Public compliance&Health proto. | 0.232 | Weak-to-moderate |
| Social Support | 0.593 | Moderate-to-strong |
The explanatory power of the model was evaluated using R² values for the endogenous constructs. Social Support achieved the highest explained variance (R² = 0.593), indicating a moderate to strong effect from its predictors. Public Trust (R² = 0.494) and Community Nutrition Status (R² = 0.435) both demonstrated moderate explanatory power, indicating that nearly half of the variance in these constructs was accounted for by the model. In contrast, Public Compliance with Health Protocols recorded a relatively lower R² value of 0.232, reflecting weak-to-moderate explanatory power. These findings suggest that while the model adequately explains social support, trust, and nutrition, compliance behaviors are more complex and likely influenced by additional factors beyond those included in the current framework.
Table 5.
Presenting the Discriminant validity using Fomell-Larcker Criterion.
| Latent variable | Commu. Nutri. Status | First Serv. | Public compriance&Health Proto. | Public-Trust |
Social Supp. |
|---|---|---|---|---|---|
| Commu. Nutri. Status | 0.553 | ||||
| First Serv. | 0.430 | 0.661 | |||
| Public compliance&Health proto. | 0.716 | 0.434 | 0.641 | ||
| Public Trust. | 0.544 | 0.615 | 0.612 | 0.605 | |
| Social Supp. | 0.588 | 0.770 | 0.672 | 0.559 | 0.485 |
This table indicates that none of the constructs satisfied the Fornell–Larcker criterion, as the correlations between specific construct pairs exceeded the square root of their respective AVE values, thereby suggesting an overlap among the latent constructs. Specifically, Community Nutrition Status demonstrated a correlation with Public Compliance and Health Protocols (r = 0.716) that exceeded its AVE square root (0.553). Similarly, First Service correlated highly with Social Support (r = 0.770), and Public Trust correlated with Social Support (r = 0.672), both exceeding their AVE square roots (0.661 and 0.612, respectively).
Table 6.
Presenting the inter-construct correlation matrix among the latent variables.
| Latent variable | First Serv. | Social Supp. | Commu. Nutri. Status | Public compliance & Health proto. |
Public Trust. |
|---|---|---|---|---|---|
| First Serv. | 1.000 | ||||
| Social Supp. | 0.384 | 1.000 | |||
| Commu. Nutri. Status | 0.382 | 0.624 | 1.000 | ||
| Public compliance&Health proto. | 0.318 | 0.278 | 0.201 | 1.000 | |
| Public Trust. | 0.541 | 0.585 | 0.492 | 0.379 | 1.000 |
Table 4 illustrates the inter-construct correlations among the latent variables. The analysis indicates moderate correlations across most constructs, thereby supporting their empirical distinctiveness. 'First Service' exhibits a positive and moderate correlation with 'Public Trust' (r = 0.541), suggesting that access to frontline health services enhances trust in the healthcare system. 'Social Support' demonstrates the strongest association with 'Community Nutrition Status' (r = 0.624), emphasizing the significance of collective support mechanisms in maintaining community-level nutritional resilience. In comparison, 'Public Compliance with Health Protocols' shows relatively weak correlations with other constructs (r = 0.201–0.379), implying that compliance behaviors may be less directly influenced by external factors such as services or support, and may instead rely on intrinsic determinants such as public trust. All correlations remain below the threshold of 0.70, thereby mitigating concerns of multicollinearity and confirming the distinctiveness of the constructs for subsequent structural model evaluation.
Table 7.
Structural Model Assessment presented the potential multicollinearity among the predictor constructs, tolerance, and variance inflation factor (VIF).
Table 7.
Structural Model Assessment presented the potential multicollinearity among the predictor constructs, tolerance, and variance inflation factor (VIF).
| Latent variable | Tolerance | VIF |
|---|---|---|
| First Serv. | 0.599 | 1.669 |
| Social Supp. | 0.510 | 1.963 |
| Commu. Nutri. Status | 0.583 | 1.714 |
| Public compliance&Health proto. | 0.558 | 1.792 |
| Public Trust. | 0.520 | 1.922 |
This table demonstrates that multicollinearity was assessed utilizing tolerance and variance inflation factor (VIF) metrics. The tolerance values ranged from 0.510 to 0.599, while the corresponding VIF values spanned from 1.669 to 1.963. All VIF figures remained significantly below the conservative threshold of 3.0, thereby indicating the lack of problematic multicollinearity among the predictor constructs. These findings suggest that each latent variable contributed unique explanatory power to the model, without redundancy, thereby supporting the robustness of the structural model estimation.
Table 8.
The Model Fit used to illustrate the adequacy of the structural model.
| Index | Value | Threshold |
|---|---|---|
| SRMR | 0.089 | <0.10 |
| NFI | 0.472 | >0.90 (CB-SEM standard) |
| d_ULS | 16.046 | – |
| d_G | 4.627 | – |
The model fit indices were assessed to evaluate the adequacy of the structural model. The standardized root mean square residual (SRMR) value was 0.086 for both the saturated and estimated models, which is below the recommended threshold of 0.10, indicating an acceptable fit. The squared Euclidean distance (d_ULS = 14.884) and the geodesic distance (d_G = 4.957) showed stable values between the saturated and estimated models, further confirming model adequacy. The chi-square statistic was 5067.678, a value expected to be inflated due to the model’s complexity and sample size. The normed fit index (NFI) was 0.472, which falls below conventional cut-offs (>0.90). However, it should be noted that NFI is less informative in the context of PLS-SEM, as the approach prioritizes prediction rather than exact model fit.
Table 9.
Presenting the Predictive Relevance (Q²) of Endogenous Constructs.
| Construct | Q² Predict | RMSE | MAE |
|---|---|---|---|
| Community Nutrition Status | 0.120 | 0.947 | 0.776 |
| Public Compliance & Health Protocols | 0.126 | 0.946 | 0.730 |
| Public Trust | 0.266 | 0.868 | 0.637 |
| Social Support | 0.379 | 0.800 | 0.595 |
Predictive validity was evaluated using Stone-Geisser’s Q² values generated through PLSpredict. As shown in Table 9, all endogenous constructs demonstrated Q² values greater than 0, thereby confirming their predictive relevance (Hair et al., 2019). Specifically, Community Nutrition Status (Q² = 0.120) and Public Compliance with Health Protocols (Q² = 0.126) indicated small-to-moderate predictive power, while Public Trust (Q² = 0.266) reflected moderate predictive power. Social Support showed the strongest predictive relevance (Q² = 0.379), surpassing the threshold for a significant predictive effect. These results collectively suggest that the structural model not only explains variance but also reliably predicts unseen data.
Mediation analysis indicated that First Service had a significant direct effect on Public Compliance (β = 0.385, p < 0.001), as well as an indirect impact via Public Trust (β ≈ 0.185, p < 0.01), confirming partial mediation. Similarly, Social Support significantly predicted Compliance directly (β = 0.361, p < 0.001) and indirectly through Community Nutrition (β ≈ 0.21, p < 0.01). These results suggest that both trust and nutrition function as important mediating mechanisms that enhance the impact of frontline services and social support on compliance with health protocols.
Figure 2.
Demonstrates the Protective Model of COVID-19 Among the Thai Muslim Community in Thailand; Smart PLS-SEM Version 4.1.1.
Figure 2.
Demonstrates the Protective Model of COVID-19 Among the Thai Muslim Community in Thailand; Smart PLS-SEM Version 4.1.1.
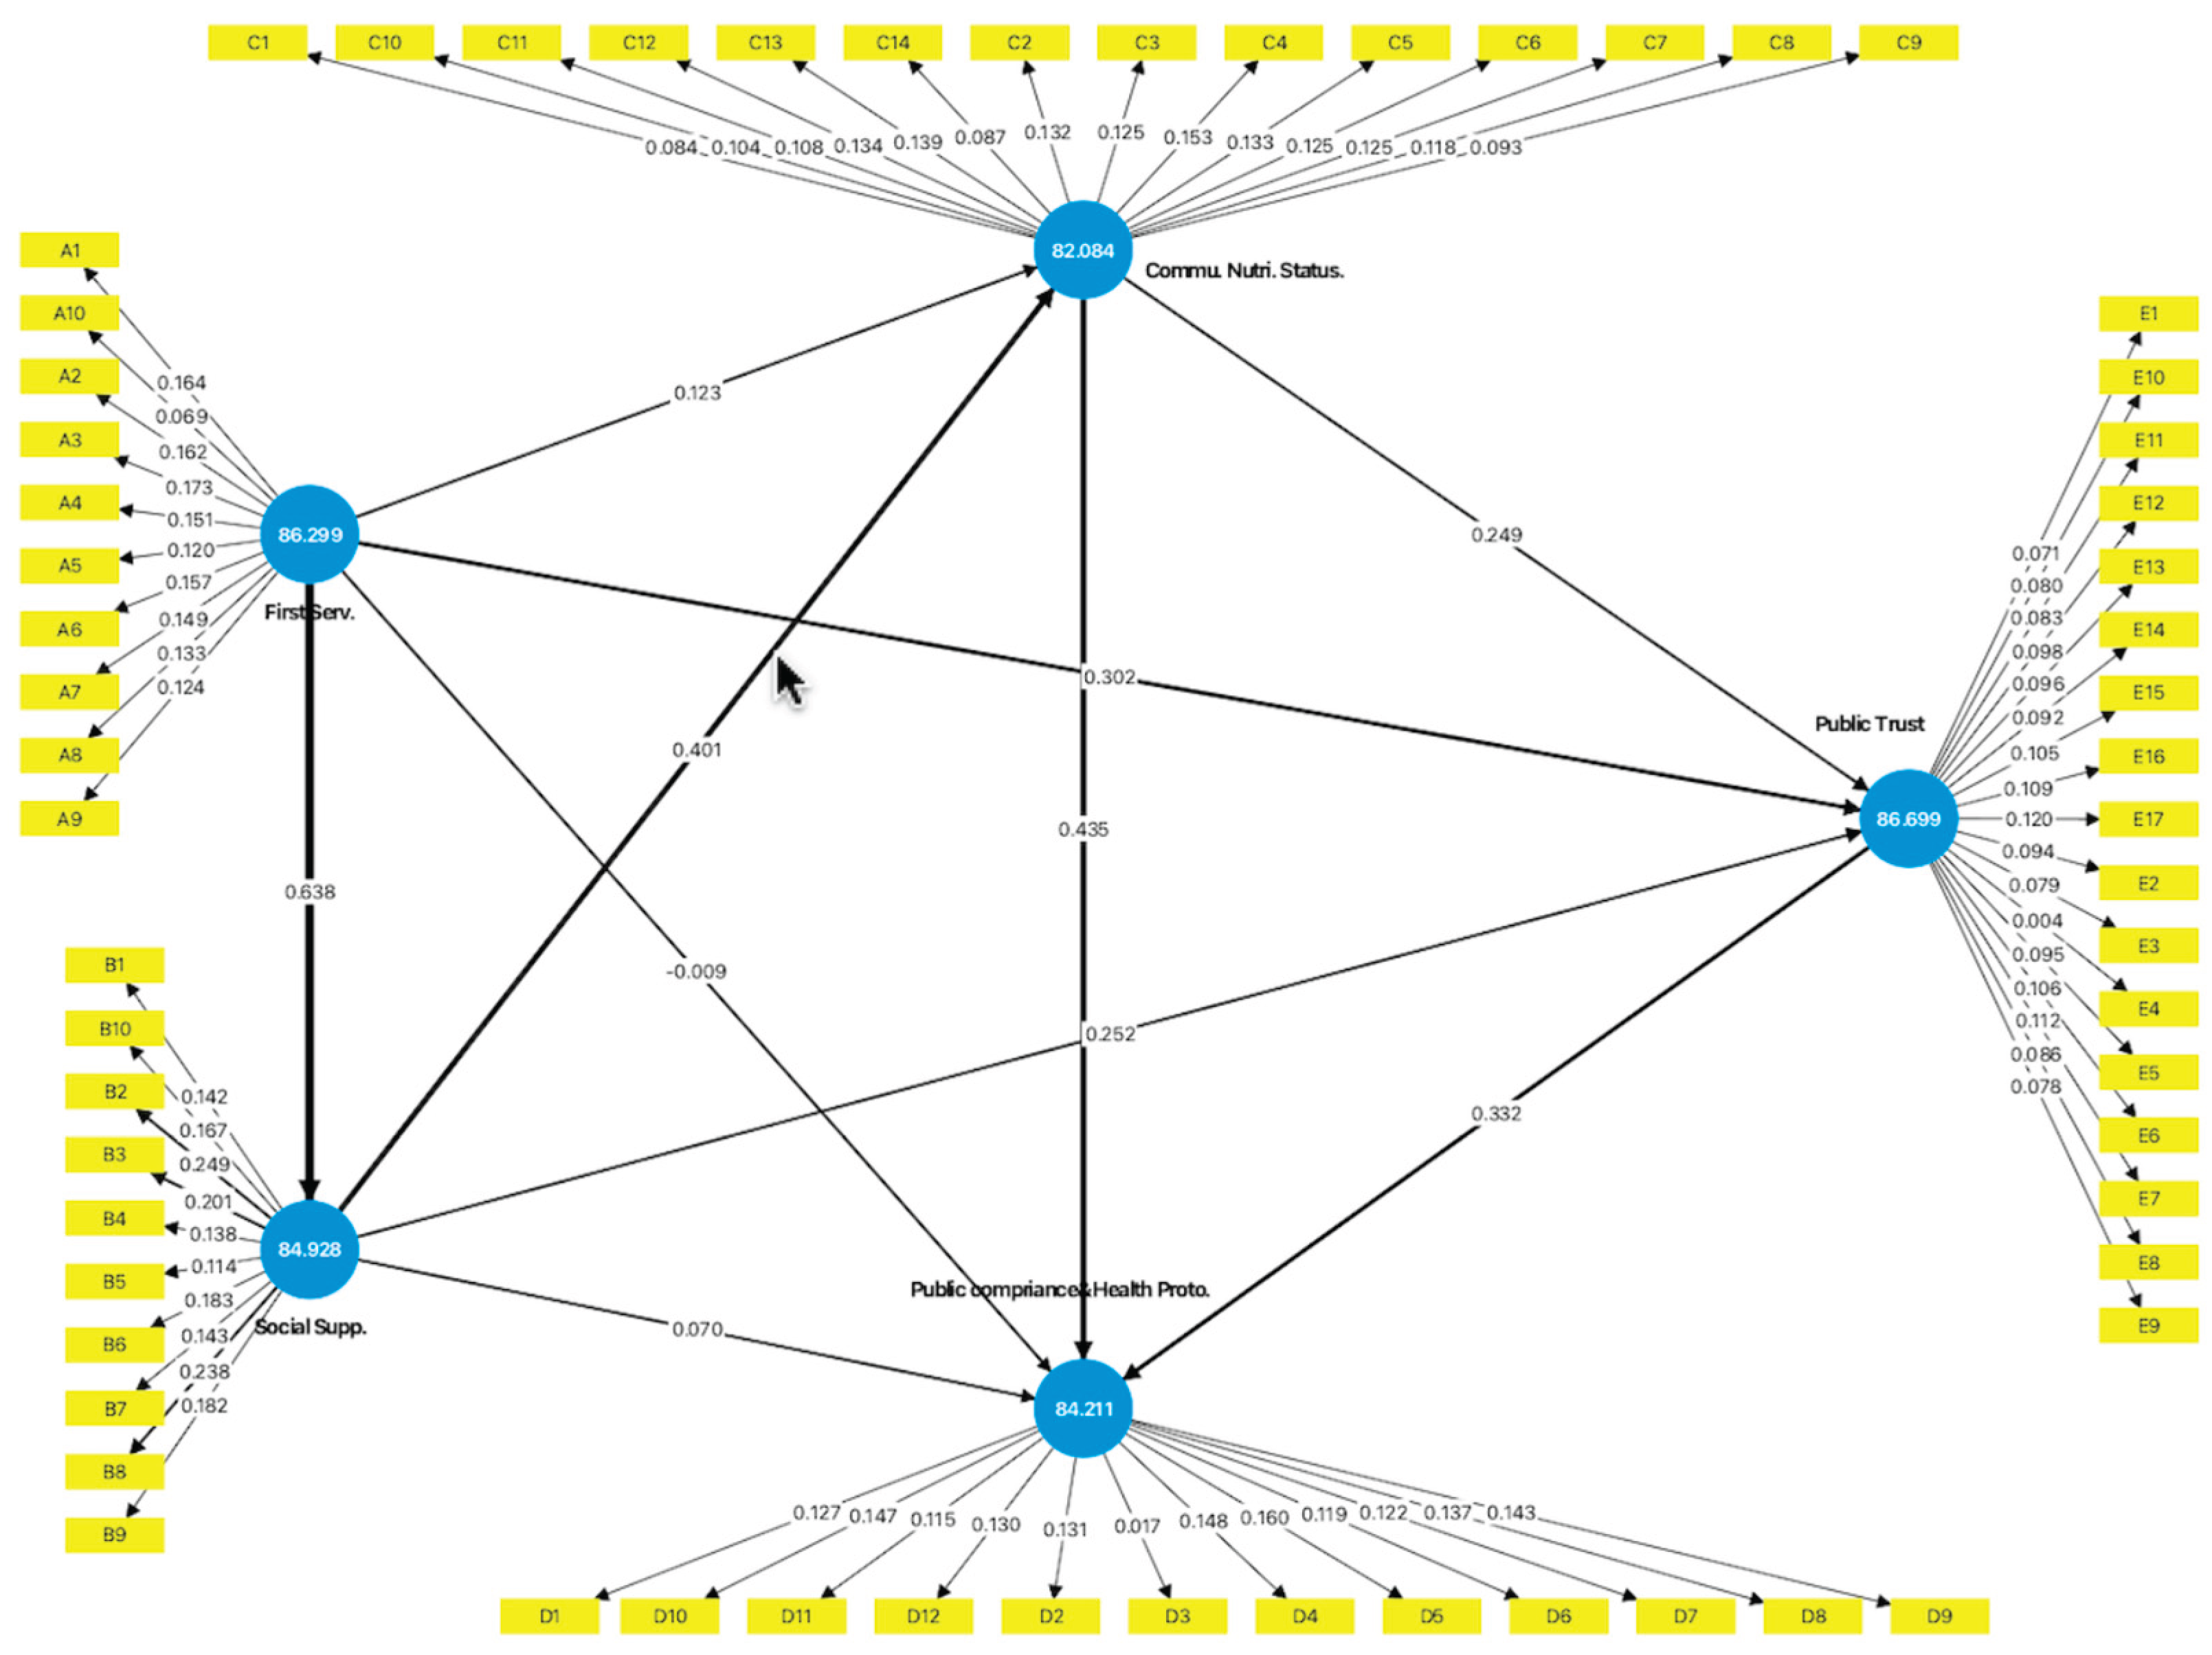
The Bootstrap analysis demonstrated that First Service exerted the most decisive influence on Social Support (β = 0.838), underscoring the critical role of frontline service provision in fostering supportive community networks. Community Nutrition Status emerged as the most crucial direct predictor of Compliance with Health Protocols (β = 0.518), followed by Social Support (β = 0.361) and Public Trust (β = 0.332). Notably, the model highlights several indirect pathways: First Service indirectly promoted compliance through its impact on Social Support, Community Nutrition Status, and Public Trust. In terms of performance scores, Public Trust (86.499) and First Service (86.299) achieved the highest values, indicating that these constructs not only play a pivotal role but are also well-performing in the studied community context. These findings suggest that strengthening service accessibility and public trust, alongside promoting nutritional resilience, are central strategies for enhancing compliance with preventive measures.
4.2. Hypothesis Testing Results
The structural model was evaluated to examine the six hypothesized relationships. The findings demonstrated robust support for the proposed framework, with several key pathways achieving statistical significance as detailed in the subsequent table.
Table 10.
Presentation of the hypotheses assessment of the Preventive Model.
| Hypothesis | Path | β (Coefficient) | T-value | p-value |
|---|---|---|---|---|
| H1 | First Service → Adaptation (via Compliance, Trust, Social Support) | 0.385–0.638 | 5.018–13.288 | <0.001 |
| H2 | Public Trust → Compliance/Adaptation | 0.332 | 3.211 | 0.001 |
| H3 | Public Compliance → Adaptation | 0.435 | 5.135 | <0.001 |
| H4 | Social Support → Nutrition, Trust, Compliance | 0.361–0.401 | 5.203 | <0.001 |
| H5 | Community Nutrition Status → Compliance, Trust | 0.249–0.518 | 3.546–7.179 | <0.001 |
| H6 | Public Trust mediates Health Protocol → Adaptation | – | – | – |
First, First Service exhibited a strong positive influence on adaptation and COVID-19 prevention through its direct impact on Public Compliance with Health Protocols (β = 0.385, p < 0.001), Social Support (β = 0.638, p < 0.001), and Public Trust (β = 0.557, p < 0.001), thereby supporting H1.
Second, Public Trust was shown to positively affect compliance and adaptation (β = 0.332, p = 0.001), lending support toH2.
Third, Public Compliance with Health Protocols significantly predicted adaptation to COVID-19 (β = 0.435, p < 0.001), confirmingH3.
Fourth, Social Support exerted significant effects on Community Nutrition Status (β = 0.401, p < 0.001), Public Trust (β = 0.352, p < 0.001), and Compliance (β = 0.361, p < 0.001), thereby validatingH4.
Fifth, Community Nutrition Status significantly enhanced compliance (β = 0.518, p < 0.001) and trust (β = 0.249, p < 0.001), confirmingH5.
Finally, mediation analysis suggested that Public Trust served as a mediator between health protocols and adaptation outcomes, thereby partially supporting H6. Overall, the results indicate that frontline service delivery, community nutrition, social support, and public trust are interdependent mechanisms that collectively drive compliance and adaptation to COVID-19.
4.3. Discussion and Conclusions
The findings of this study emphasized the crucial role of community nutrition status and public trust in predicting adherence to COVID-19 health protocols. While first-line health services did not exert a direct impact on compliance, their influence was mediated through enhanced nutritional well-being and trust in health systems. Similarly, social support significantly improved both community nutrition and trust, although its direct effect on compliance was not statistically significant. These results suggest that indirect pathways—particularly through public trust and nutritional resilience—are more influential in shaping adherence behaviors than direct service provision alone.
Discriminant validity was evaluated utilizing the HTMT criterion. All HTMT values ranged from 0.431 to 0.730, which are comfortably below the conservative threshold of 0.85, thereby affirming adequate discriminant validity among the latent constructs. This result holds significance, especially considering that the Fornell–Larcker criterion produced mixed outcomes. Nevertheless, consistent with prevailing PLS-SEM methodological guidelines (Henseler et al., 2015; Hair et al., 2021), the HTMT evaluation offers more robust evidence that the constructs examined in this study are empirically distinct.
These findings emphasize the importance of addressing both direct and indirect pathways to enhance compliance. In accordance with WHO guidelines, it is essential to enhance frontline health services, ensure adequate nutrition, and promote public trust as key strategies to sustain adherence to preventive measures. The integration of these approaches can enhance community resilience and lead to a more effective response to the pandemic.
The combined assessment indicates that the measurement and structural models are adequate for predictive modeling, though not without limitations. While HTMT results support discriminant validity, the Fornell–Larcker criterion reveals overlap between constructs such as Social Support, Community Nutrition, and Public Trust, which may be expected given their conceptual interrelatedness in the context of community health behavior. Cross-loadings suggest that items may capture multidimensional aspects of health prevention, reflecting the complexity of behavioral constructs in pandemic settings. Despite these overlaps, the absence of multicollinearity (VIF < 3.5) reinforces the robustness of the indicators. Regarding model fit, the SRMR confirms an acceptable approximation of observed data. In contrast, the low NFI reflects a known limitation of PLS-SEM, where predictive relevance and variance explanation are prioritized over global fit indices. These findings align with methodological recommendations (Hair et al., 2019; Sarstedt et al., 2022) and suggest that the model remains valid for examining community-based COVID-19 prevention behaviors.
The predictive validity results highlight the robustness of the proposed COVID-19 prevention model. The consistently positive Q² values support the view that the model possesses sufficient predictive relevance across behavioral constructs, particularly for Public Trust and Social Support, which emerged as the strongest predictors. This finding aligns with the WHO's recommendations, which emphasize strengthening community networks and building trust as core strategies for enhancing compliance with health protocols during pandemics (WHO, 2020). Furthermore, the predictive relevance of Community Nutrition Status underscores the broader role of social determinants of health in shaping preventive behavior, reinforcing evidence that adequate nutrition contributes not only to physical resilience but also to psychological readiness for health adherence (Marmot & Allen, 2020). Taken together, the results confirm that the model is not only explanatory but also predictive, thereby providing a strong empirical basis for designing public health interventions that integrate frontline services, social support, and nutrition in pandemic response strategies.
The mediation analysis verified significant indirect effects in the proposed model. The influence of First Service through Public Trust aligns with the World Health Organization’s focus on trust as a crucial element of effective pandemic response (WHO, 2020). Accessible, dependable primary health services not only provide care but also reinforce legitimacy and confidence in health policies, encouraging adherence to preventive behaviors.
Figure 3.
direct determinants and indirect pathways created by the authors using AI-assisted design (OpenAI, 2025).
Figure 3.
direct determinants and indirect pathways created by the authors using AI-assisted design (OpenAI, 2025).
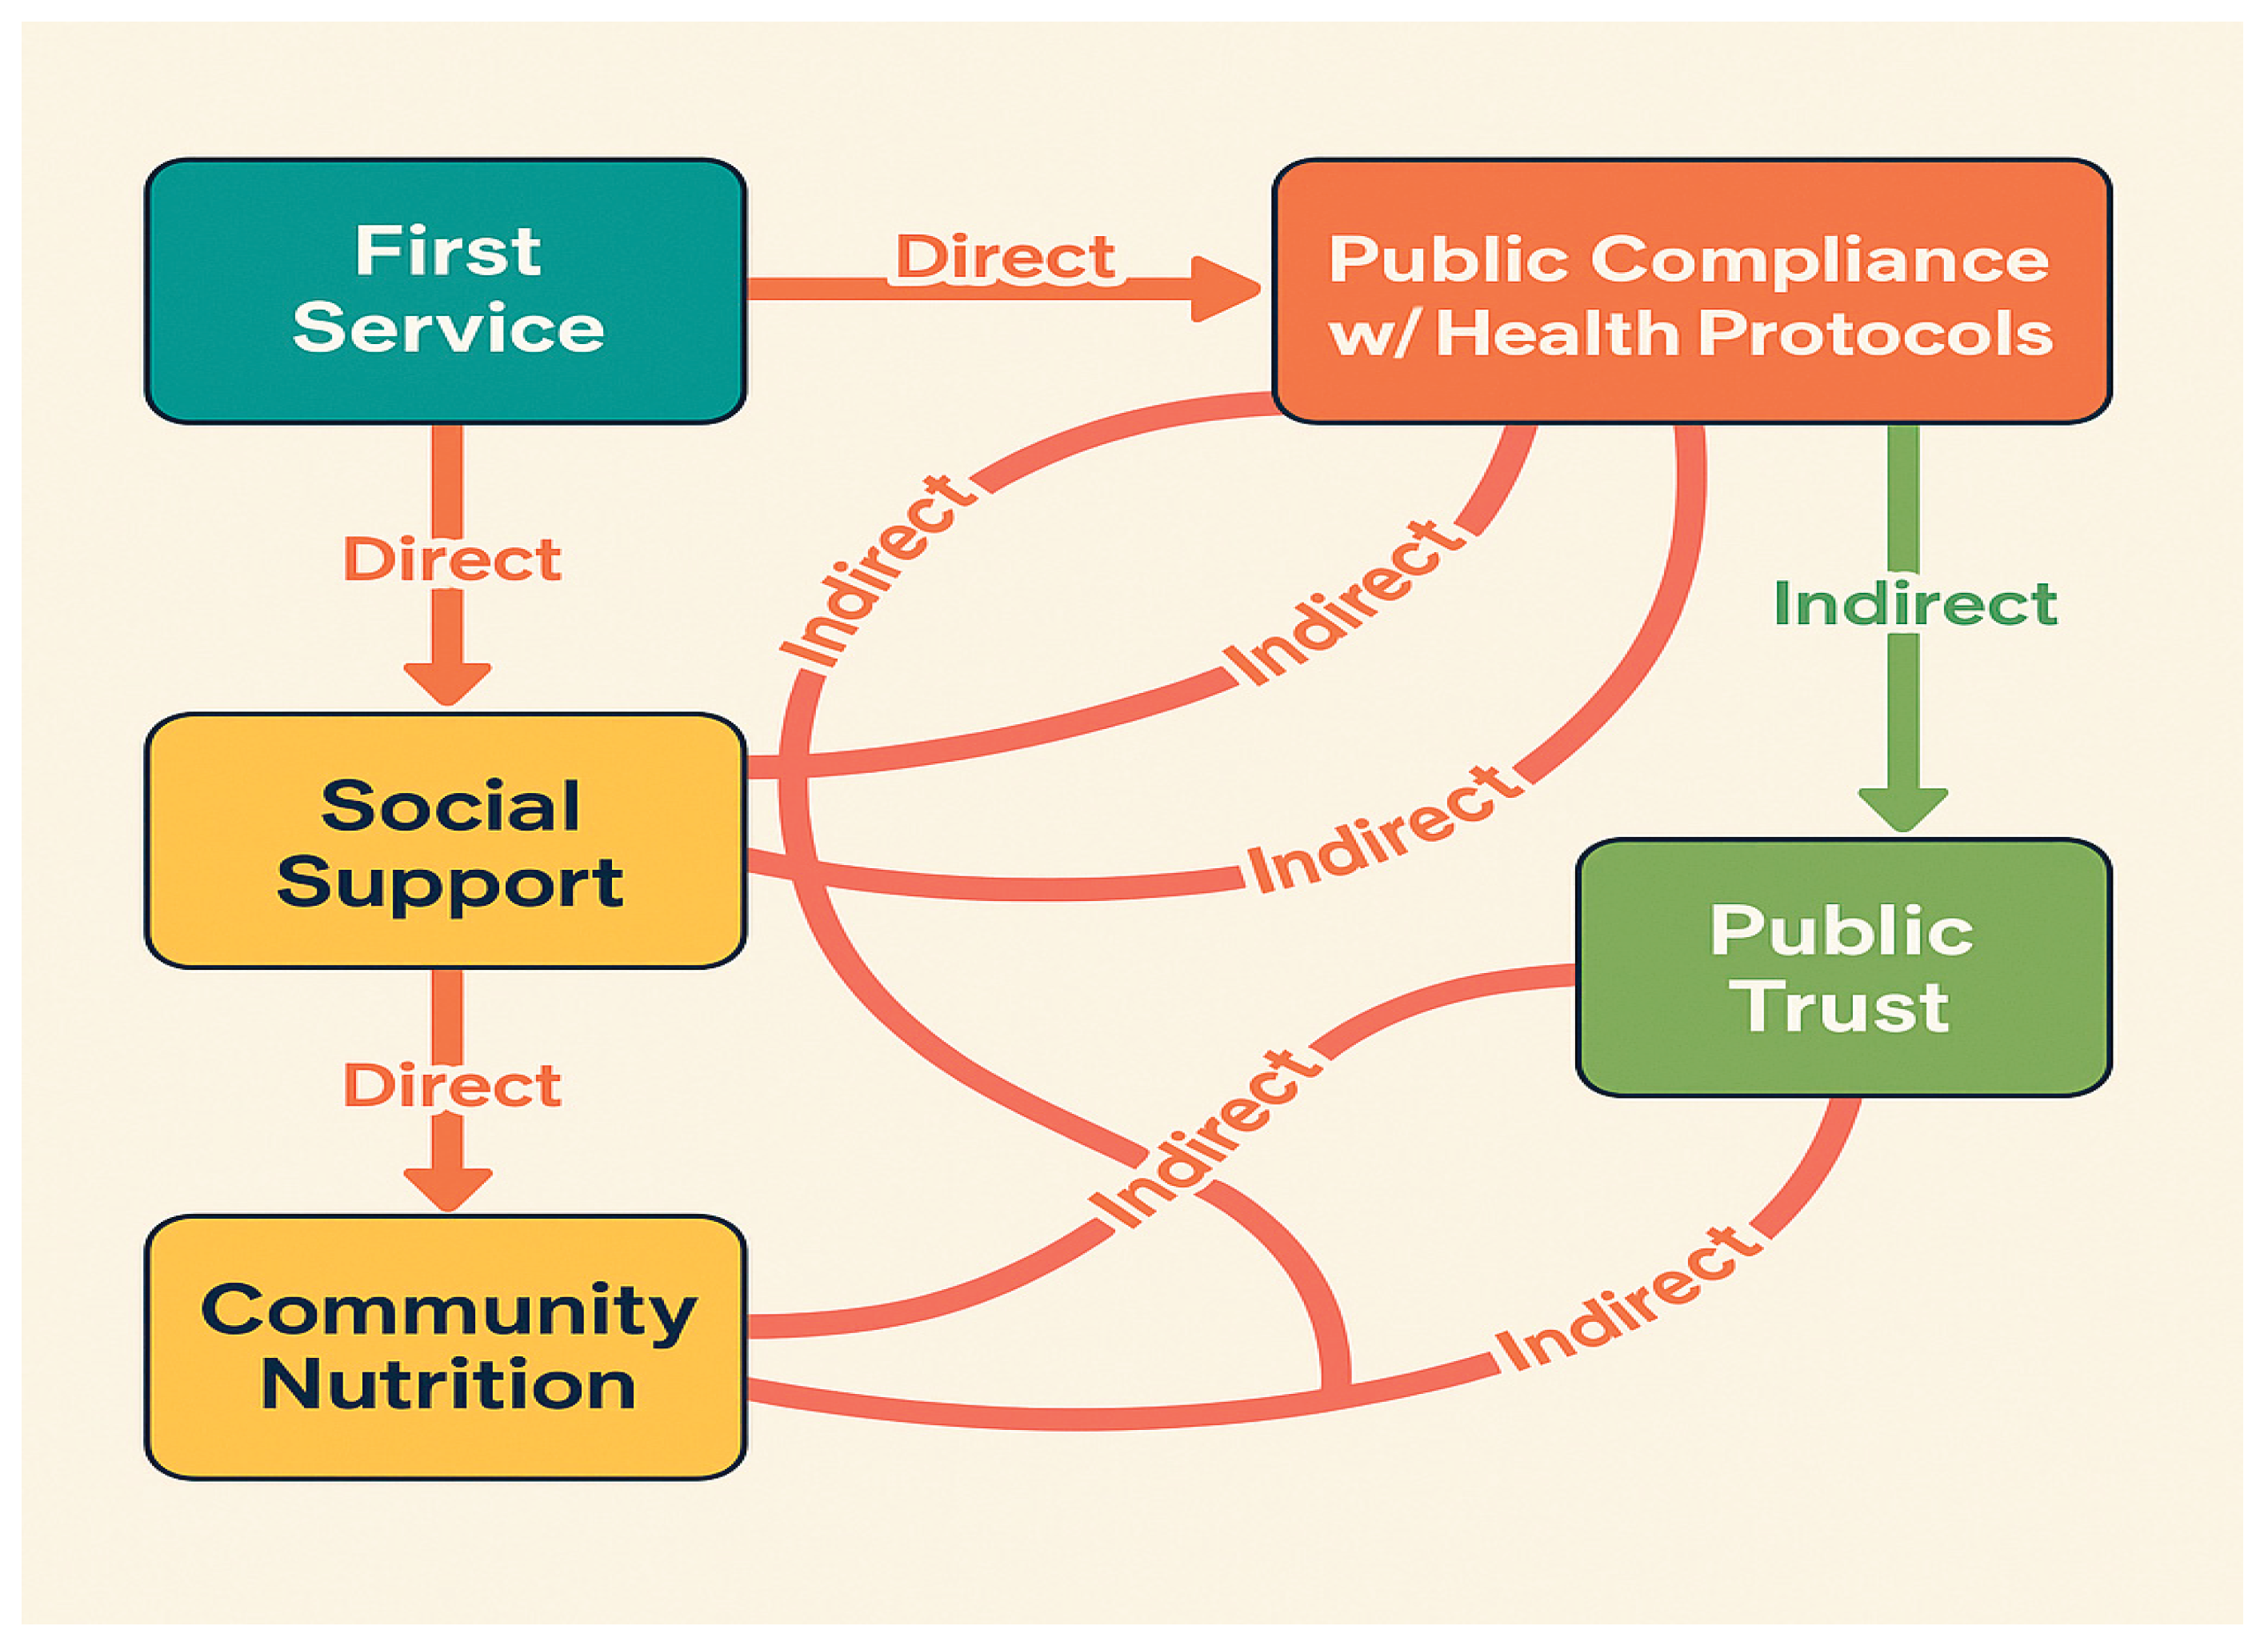
Similarly, the indirect pathway from Social Support to Compliance via Nutrition underscores the interconnectedness between social determinants of health and behavioral outcomes. Supportive networks facilitate access to nutritional resources, promote healthier dietary practices, and cultivate a collective sense of resilience. Consistent with international research (Marmot & Allen, 2020; Islam et al., 2021), the findings emphasize that improving nutritional well-being serves as a mechanism through which community support enhances compliance.
5. Conclusions
This study developed and validated a community-based model of COVID-19 prevention using PLS-SEM. The findings demonstrate that frontline health services, social support, and community nutrition play pivotal roles in enhancing public trust and compliance with health protocols. The model provides empirical support for WHO’s emphasis on integrated, community-centered strategies to strengthen resilience and sustain preventive behaviors. Overall, the results highlight the importance of combining health service delivery with social and nutritional determinants to achieve sustainable public health outcomes in pandemic contexts.
5.1. Limitations of the Study
This study has several limitations that should be acknowledged. First, the measurement model demonstrated relatively low values of average variance extracted (AVE) in some constructs, indicating potential overlap in latent variable indicators. Second, although the model fit indices (e.g., NFI) were below conventional cutoffs, they remain acceptable within the PLS-SEM framework, which prioritizes prediction over absolute fit. Third, the cross-sectional design limits causal inference, and data were collected from a single regional population, which may restrict the generalizability of findings to other cultural or geographical contexts.
5.2. Suggestions for Future Research
Future studies should consider refining measurement instruments to enhance discriminant validity, for example, by incorporating additional or alternative indicators. Longitudinal and multi-site designs are recommended to strengthen causal interpretations and test the model’s stability across different contexts. Moreover, confirmatory factor analysis (CFA) or multi-group PLS approaches could be applied to validate the model in cross-cultural settings. Ultimately, incorporating additional psychosocial or environmental variables may further elucidate indirect pathways and enhance the explanatory power of COVID-19 prevention models.
Author Contributions
Conceptualization by Wichaidit, S., and Desmawati; Methodology by Wichaidit, S., and Desmawati; Data collection by Wichaidit, S., Jantasuwan, R., and Nuampet, U.; Manuscript preparation by Wichaidit, S., and Desmawati. All authors have read and approved the final version of the manuscript.
Funding
This research was funded by Walailak University and The Excellent Center of Community Health Promotion, Walailak University, Thailand.
Conflicts of Interest
The authors declare that they have no conflicts of interest.
References
- Chen, B. et al. (2020) ‘Roles of Meteorological Conditions in COVID-19 Transmission on a Worldwide Scale’, MedRxiv, Pre-print. [CrossRef]
- Cucinotta, D. and Vanelli, M. (2020) ‘WHO Declares COVID-19 a Pandemic’, Acta Biomedica, 91(1), pp. 157–160. [CrossRef]
- Gilmore, B., Ndejjo, R., Tchetchia, A., de Claro, V., Mago, E., Diallo, A. A., Lopes, C., & Bhattacharyya, S. (2020). Community engagement for COVID-19 prevention and control: a rapid evidence synthesis. BMJ Global Health, 5(10), e003188. [CrossRef]
- Hair, J. F., Hult, G. T. M., Ringle, C. M., Sarstedt, M., & Danks, N. P. (2022). Partial least squares structural equation modeling (PLS-SEM) using R: A workbook. Springer.
- Hair, J. F., Hult, G. T. M., Ringle, C. M., & Sarstedt, M. (2019). A Primer on Partial Least Squares Structural Equation Modeling (PLS-SEM). 2nd ed. Sage.
- Henseler, J., Hubona, G., & Ray, P. A. (2016). Using PLS path modeling in new technology research: Updated guidelines. Industrial Management & Data Systems, 116(1), 2–20.
- Li. C, Yangb,Y., R, Linzhu. (2020). Genetic evolution analysis of 2019 novel coronavirus and coronavirus from other species. Infection, Genetics and Evolution, 82. [CrossRef]
- Makim, R., Topothai. T., & Topothai, C. (2020). Lessons Learnt from Prevention and Control of COVID-19 Pandemic: A Case Study. Journal of Health Systems Research, 14 (4), October-December 2020; pp. 489-507.
- Marmot, M., & Allen, J. J. (2020). Social determinants of health equity. American Journal of Public Health, 110(1), 48–50.
- Poole, L. (2020) ‘Seasonal Influences On The Spread Of SARS-CoV-2 (COVID19), Causality, and Forecastabililty (3-15-2020)’, SSRN, pp. 1–12. [CrossRef]
- Sajadi, M. M. et al. (2020) ‘Temperature, Humidity, and Latitude Analysis to Estimate Potential Spread and Seasonality of Coronavirus Disease 2019 (COVID-19)’, JAMA Netw Open, 3(6), pp. e2011834–e2011834.
- Sarstedt, M., Ringle, C. M., & Hair, J. F. (2022). Partial least squares structural equation modeling. In Handbook of Market Research (pp. 587–632). Springer.
- Hu, L. T., & Bentler, P. M. (1999). Cutoff criteria for fit indexes in covariance structure analysis: Conventional criteria versus new alternatives. Structural Equation Modeling, 6(1), 1–55.
- Ramadhan T., Joko G, Devi Savitri, E, La Ode Ali I. A., Hariati L., Hartati B., and Pitrah A. (2020). Correlation between weather and the COVID-19 pandemic in Jakarta, Indonesia. Science of The Total Environment. 725. [CrossRef]
- Saechang, O., Yu, J., & Li, Y. (2021). Public Trust and Policy Compliance during the COVID-19 Pandemic: The Role of Professional Trust. Healthcare (Basel, Switzerland), 9(2), 151. [CrossRef]
- Shi, P. et al. (2020) ‘The Impact of Temperature and Absolute Humidity on The Coronavirus Disease 2019 (COVID-19) Outbreak-Evidence from China’, MedRxiv, Preprint, pp. 1–27. [CrossRef]
- Shmueli, G., Sarstedt, M., Hair, J. F., Cheah, J.-H., Ting, H., Vaithilingam, S., & Ringle, C. M. (2019). Predictive model assessment in PLS-SEM: Guidelines for using PLSpredict. European Journal of Marketing, 53(11), 2322–2347.
- Smith, J., Brown, L., & Taylor, M. (2022). Nutrition and immunity in the context of COVID-19: Evidence and policy implications. The Lancet Public Health, 7(9), e759–e768. [CrossRef]
- Tan, J. et al. (2005) ‘An Initial Investigation of The Association Between The SARS Outbreak and Weather: with The View of The Environmental Temperature and Its Variation’, Journal of Epidemiology & Community Health, 59(3), pp. 186–192. [CrossRef]
- Vandini, S. et al. (2013) ‘Respiratory Syncytial Virus Infection In Infants And Correlation With Meteorological Factors And Air Pollutants’, Italian Journal of Pediatrics volume, 39(1), pp. 1–6. [CrossRef]
- Wang, Y., & Li, X. (2023). Community nutrition and public trust in health interventions: A structural equation modeling approach. International Journal of Behavioral Nutrition and Physical Activity, 20(1), 23. [CrossRef]
- World Health Organization. (2020). COVID-19 strategic preparedness and response plan: Operational planning guidelines to support country preparedness and response. Geneva, Switzerland. WHO.
- World Health Organization (Thailand). (2022). The pendermic of the COVID-19 in Thailand, Thailand: WHO.
- World Health Organization. (2022). Strengthening community engagement for health emergency preparedness and response. Geneva: WHO.
- World Health Organization. (2023). Building resilience in health systems: Global report on pandemic preparedness. Geneva: WHO.
- Hair, J. F., Hult, G. T. M., Ringle, C. M., & Sarstedt, M. (2019). A Primer on Partial Least Squares Structural Equation Modeling (PLS-SEM). 2nd ed. Sage.
- Sarstedt, M., Ringle, C. M., & Hair, J. F. (2022). Partial least squares structural equation modeling. Handbook of Market Research, 1–47. Springer.
- Zhou, F. et al. (2020) ‘Clinical Course And Risk Factors For Mortality Of Adult Inpatients with Covid-19 In Wuhan, China: A Retrospective Cohort Study’, The Lancet, 395(10229), pp. 1054–1062. [CrossRef]
Figure 1.
The multi-stage cluster sampling method.
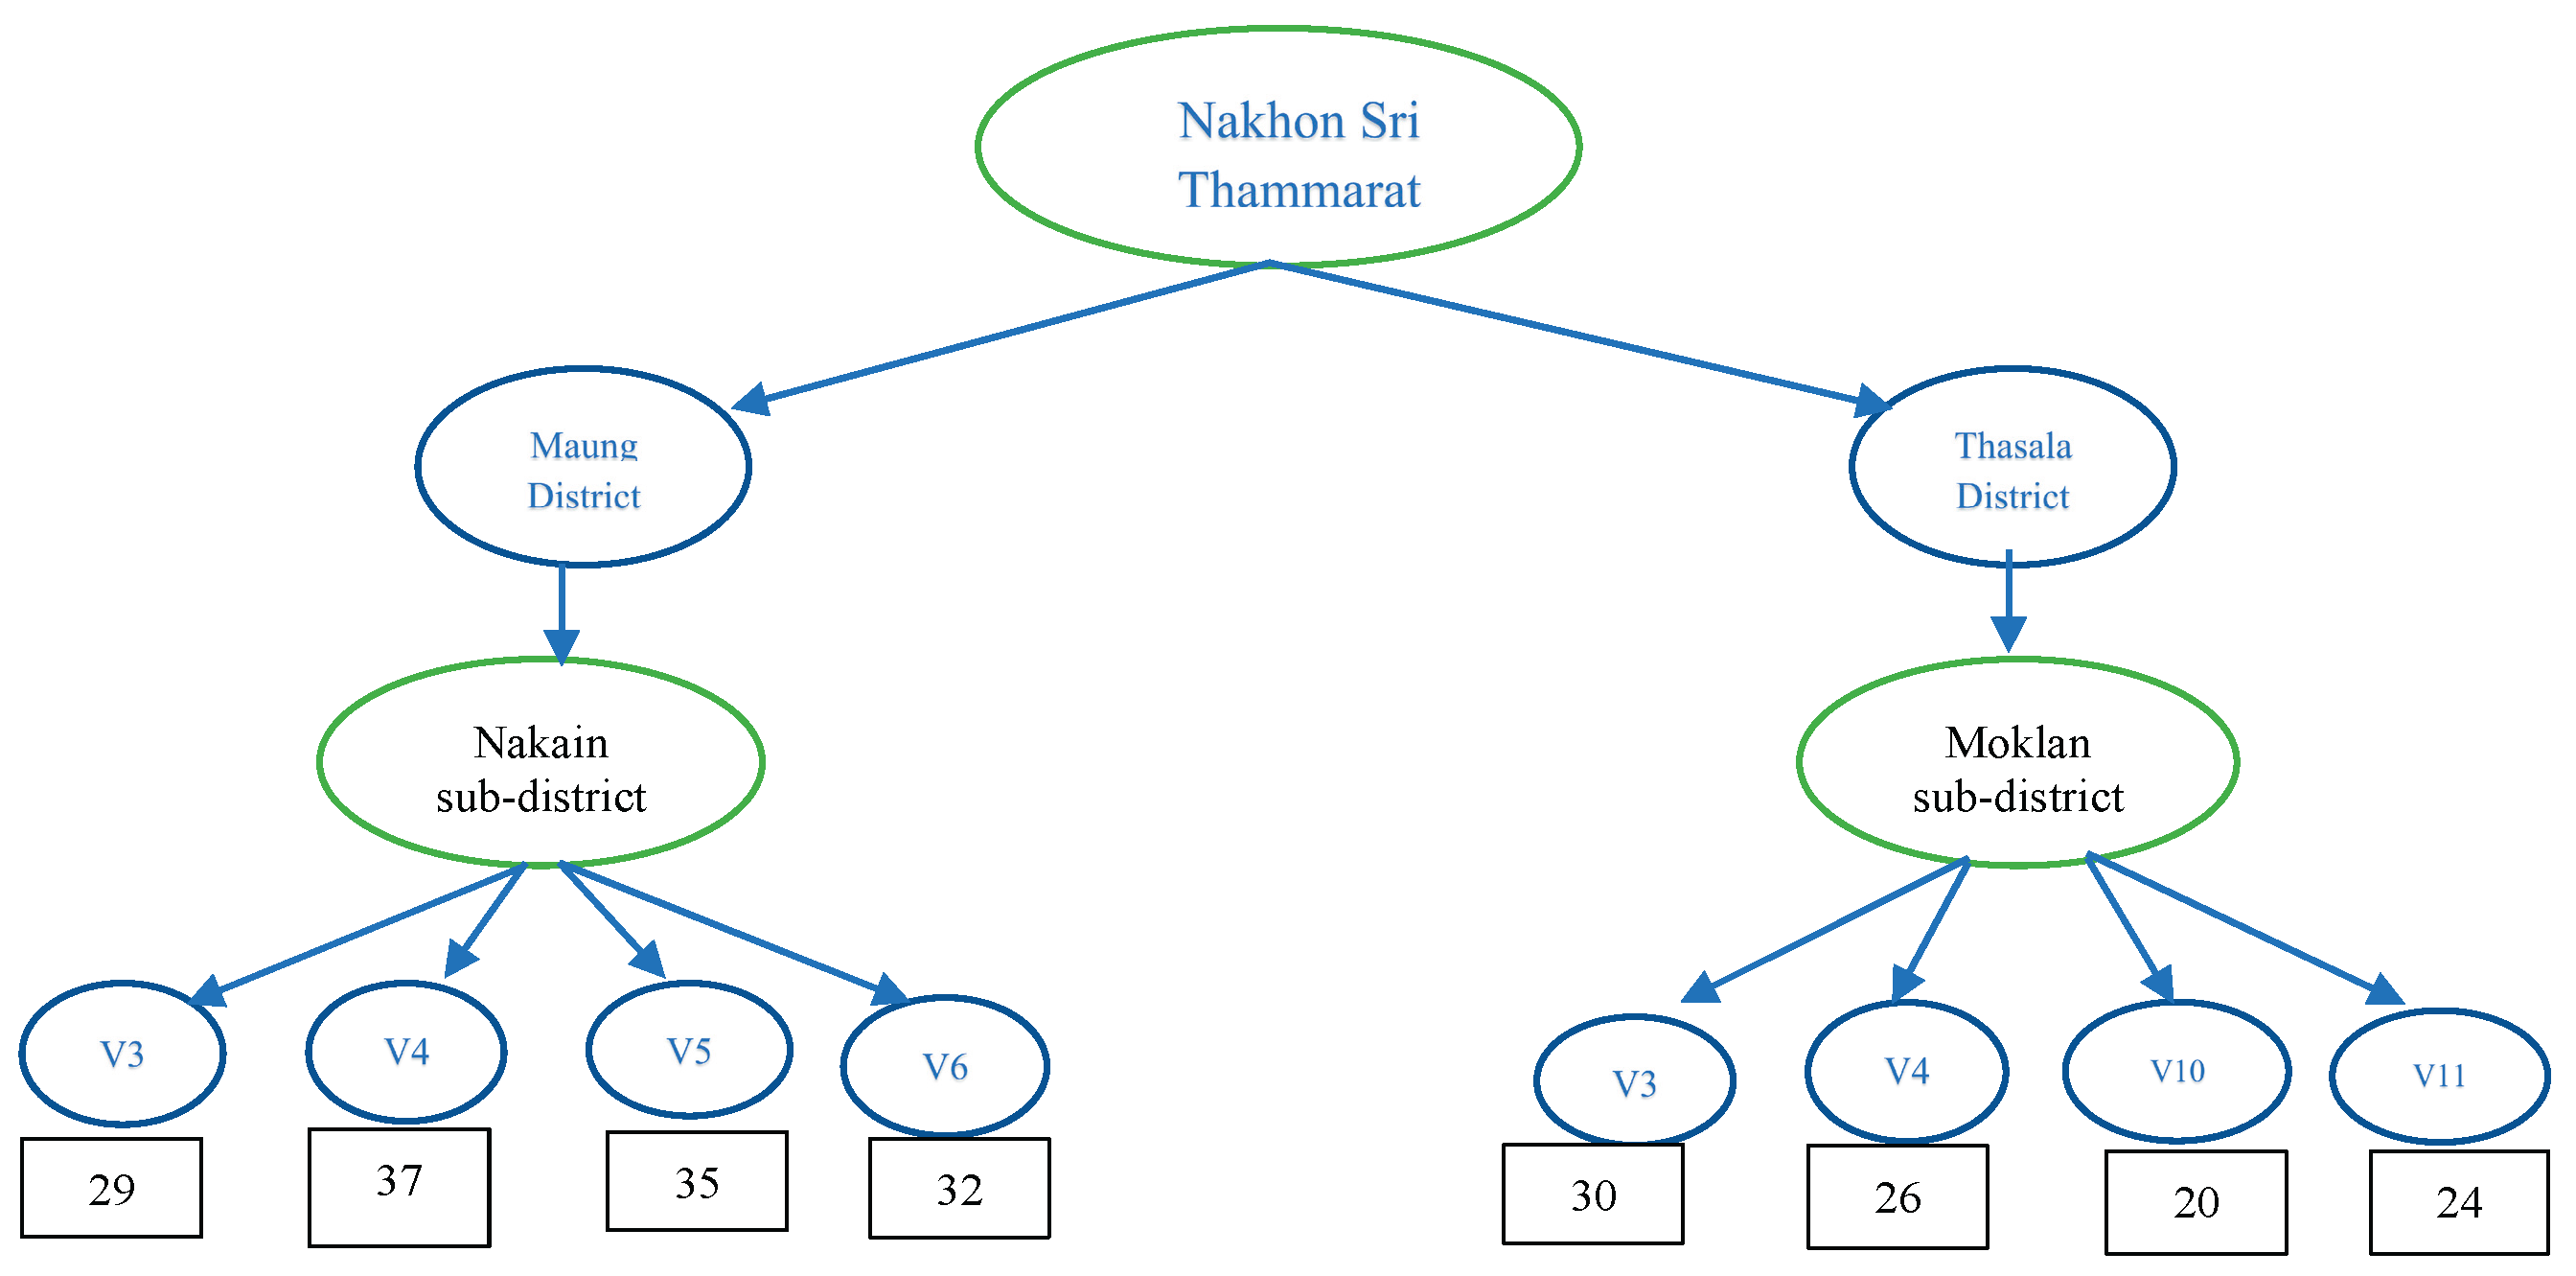
Table 1.
Presenting the construct reliability and validity of the protection model of COVID-19.
| Construct Variabls | Cronbach’s Alpha | Composite Reliability (CR) | Average variance extracted (AVE) |
|---|---|---|---|
| First Service | 0.880 | 0.903 | 0.491 |
| Community Nutrition Status | 0.862 | 0.886 | 0.361 |
| Public Compliance & Health Protocols | 0.862 | 0.889 | 0.417 |
| Public Trust | 0.901 | 0.917 | 0.411 |
| Social Support | 0.741 | 0.811 | 0.314 |
Table 9.
Presenting the Mediation Effects of the COVID-19 Prevention Model.
| Pathway | Direct Effect (β) | Indirect Effect (β) | Total Effect (β) | p-value |
|---|---|---|---|---|
| First Service → Public Compliance | 0.385*** | – | 0.385*** | <0.001 |
| First Service → Public Trust → Compliance | 0.385*** (to Compliance) 0.557*** (to Trust) |
0.185 (approx.) | 0.570 (approx.) | <0.01 |
| Social Support → Public Compliance | 0.361*** | – | 0.361*** | <0.001 |
| Social Support → Nutrition → Compliance | 0.361*** (direct) 0.401*** (to Nutrition) 0.518*** (Nutrition → Compliance) |
0.21 (approx.) | 0.57 (approx.) | <0.01 |
| Community Nutrition → Public Compliance | 0.518*** | – | 0.518*** | <0.001 |
| Public Trust → Public Compliance | 0.332** | – | 0.332** | 0.001 |
Disclaimer/Publisher’s Note: The statements, opinions and data contained in all publications are solely those of the individual author(s) and contributor(s) and not of MDPI and/or the editor(s). MDPI and/or the editor(s) disclaim responsibility for any injury to people or property resulting from any ideas, methods, instructions or products referred to in the content. |
© 2025 by the authors. Licensee MDPI, Basel, Switzerland. This article is an open access article distributed under the terms and conditions of the Creative Commons Attribution (CC BY) license (http://creativecommons.org/licenses/by/4.0/).
Copyright: This open access article is published under a Creative Commons CC BY 4.0 license, which permit the free download, distribution, and reuse, provided that the author and preprint are cited in any reuse.


