Submitted:
01 September 2025
Posted:
03 September 2025
You are already at the latest version
Abstract
In response to the challenges of posture diversity, motion blur and small target detection in unmanned aerial vehicle (UAV) target detection in long-distance and complex scenarios, this paper proposes an improved UAV target detection model:YOLO11n-SMSH. This model significantly improves the detection performance through four core mechanisms: Firstly, a CRIE module with edge perception integration is introduced in the backbone network to enhance the ability of extracting target edge features; Secondly, a SRA-DFF network with semantic association enhancement capability is used as the neck network to achieve high-quality feature interaction and fusion; Furthermore, the NTTAA detection head is finely designed, and through the weight sharing mechanism and bidirectional parallel task alignment path, the collaboration between classification and localization tasks is effectively strengthened; Finally, the GIoU loss function is introduced, and the boundary box regression is optimized using spatial coverage, improving the model's adaptability to UAV targets. Experimental results on the DUT Anti-UAV dataset show that YOLO11n-SMSH performs excellently. Compared with the baseline model, the accuracy (P), recall rate (R), mAP50 and mAP50-95 have significantly increased by 1.5%, 3.9%, 2.6% and 2.5%, respectively. The experimental results verify the effectiveness of the multi-module collaborative optimization strategy and provide a high-performance solution for UAV target detection tasks in practical applications.
Keywords:
object detection
; YOLO11
; anti-drone technology
; multi-scale features
; dynamic task alignment
1. Introduction
In recent years, with the continuous maturation and advancement of modern technologies such as information communication technology, flight control technology, and intelligent navigation technology, the unmanned aerial vehicle (UAV) industry has witnessed rapid development. UAVs, due to their low cost, high maneuverability, and safety, are widely used in fields such as traffic surveillance, forest fire prevention, aerial mapping, and military warfare. However, with the rapid development and wide application of UAVs, various safety issues have become increasingly prominent. UAVs may "fly illegally" or "fly randomly", intruding into residential areas and infringing upon personal privacy, or be exploited by criminals for drug smuggling. Even worse, terrorist groups may use UAVs to conduct reconnaissance or attacks on important infrastructure such as military bases, nuclear power plants, and airports. Therefore, in order to address these potential threats, how to quickly and accurately detect and identify flying UAVs has become a hot issue of concern for governments and security agencies in various countries.
Unmanned aerial vehicle (UAV) detection technology refers to the comprehensive utilization of various sensors to "discover" or "locate" threatening UAVs [1], and to analyze and evaluate their status in order to identify and respond to UAV threats. Traditional UAV detection methods mainly include radar detection, acoustic detection, and radio spectrum detection, etc. However, all these methods have their own shortcomings and weaknesses. For example, radar detection mainly relies on the micro-Doppler feature [2], but UAVs usually have the characteristics of "low, slow, and small" (low altitude, low speed, and small size), and the Doppler effect is not obvious, which makes the detection difficult; acoustic detection relies on the specific frequency range of sound signals produced by the UAV during flight [3], but sound waves will attenuate with the increase of distance, thus limiting the detection range and being easily interfered by surrounding environmental noise; radio spectrum detection technology uses highly sensitive radio receivers to scan and capture radio signals between the UAV and the control station, and through direction-finding and positioning technology to determine the position of the UAV and its operator [4]. As a passive detection method, its identification ability highly depends on the preset spectrum database, which also leads to the inability to cover certain target states (radio silence) and signal patterns (using unknown control protocols or located outside the detection frequency band).
To address these issues, researchers have applied deep learning algorithms to the anti-drone field and have achieved certain results. He et al. [5] extracted multi-receptive field features using Res2Net and innovatively proposed a hybrid feature pyramid structure, achieving positive results on their self-built drone detection dataset. Tan Liang [6] et al. improved the accuracy of the drone image detection algorithm by independently deploying the SPD-Conv module in the backbone network and neck network, and changing the loss function from CIoU to Alpha-CIoU. Zhang Chengwei [7] et al. developed a deformable drone detector based on DETR to enhance the remote sensing capability by improving the resolution of the backbone features. At the same time, they proposed two data augmentation methods, namely illumination jitter and multiple blurring, to ensure the environmental adaptability of the detector is maintained. AlDosari [8] evaluated multiple YOLO models through experiments, and the results showed that the YOLO model has high accuracy and real-time detection performance in the drone detection task. To solve the problem of bias caused by target differences and the imbalance of the dataset, Yasmine [9] designed a real-time multi-object detection model based on YOLOv7, maintaining high performance while ensuring fast detection and accurately, quickly detecting, identifying and locating aerial targets. Jiao Liuhao [10] et al. addressed the issues of missed detections, false detections and insufficient accuracy in traditional anti-drone detection methods, proposing the YOLO-DAP model based on YOLOv8 [11]. This model integrates a new detection head, introduces the residual attention DWR module and the lightweight Adown downsampling module, significantly reducing the number of parameters while effectively improving the detection accuracy.
In conclusion, whether domestically or internationally, deep learning-based detection technologies have become an important means for detecting drones. However, due to the small and flexible nature of drones, the image of the drone captured by the cameras often exhibit motion blur and drastic changes in posture and angle, especially in complex backgrounds at long distances, where the size of the drone target images is small, greatly limiting the detection effect. To improve the detection performance of the model, based on the improvement ideas proposed in related literature of the YOLO series, this paper presents a new model: YOLO11n-SMSH. This model makes a series of improvements to the YOLO11n model.
Specifically, the key contributions of this paper can be summarized as follows:
- Import of CRIE module: This unit aims to optimize the process of feature extraction and information integration, enhancing the model's ability to learn image feature representations.
- Design of SRA-DFF network: This innovative architecture is dedicated to improving the multi-level feature extraction effect, strengthening the semantic correlation between feature expression levels, and significantly enhancing the cross-scale feature integration capability.
- Construction of NTTAA detection head: This detection head addresses the issue of spatial deviation in classification and localization tasks, designing a bidirectional parallel task alignment path, which strengthens the feature interaction between the two types of tasks.
- Adoption of GIoU loss function: To solve the problem of limited accuracy improvement and waste of computing resources of the CIoU loss function in the unmanned aerial vehicle target detection task, a GIoU loss function that is friendly to regular small targets is adopted.
The remaining parts of the paper are as follows: The second section provides a detailed introduction to the improved YOLO11n-SMSH model; the third section describes the experimental environment and parameter configuration, the source of the data set used in the experiment and the evaluation indicators of the experiment. A large number of comparative ablation experiments were also conducted on the DUT Anti-UAV data set [12] to verify the effectiveness of the model improvement. At the same time, a comparative experiment was conducted between the improved YOLO11n-SMSH model and the YOLO11n model on the Det-Fly data set [13], indicating the generalization and applicability of the improved model on public drone data sets; the fourth section summarizes the research results and proposes the future research development directions.
2. Materials and Methods
2.1. YOLO11
YOLOll is a new model in the YOLO series released by Ultralytics on September 30, 2024. As an outstanding representative of single-stage algorithm models, it can support computer vision tasks such as object detection, instance segmentation, and pose estimation. Through the improvement and optimization of the classic models in the YOLO series, a better balance between detection speed, accuracy, and model size has been achieved [14]. This model is mainly composed of the backbone network (Backbone), the neck network (Neck), and the detection head network (Head), and its network structure is shown in Figure 1. Compared with classic models such as YOLOv8 and YOLOv10 [15], the innovation points of YOLO11 mainly lie in the following aspects:
Firstly, YOLO11 introduces the C3k2 feature extraction module. C3k2, as an important feature extraction component, effectively leverages the speed advantage of the C2f structure and reasonably utilizes the flexibility of the C3k module. Through parameter configuration, it supports two internal topological structures: 1. Sequentially connecting multiple C3k sub-modules; 2. Adopting a form similar to the multi-layer Bottleneck concatenation in YOLOV8. By further integrating variable convolution kernels and channel separation strategies, the feature representation capability is significantly enhanced, and it exhibits excellent performance in complex scene understanding and deep semantic feature extraction tasks.
Secondly, YOLO11 integrates the C2PSA module at the output end of the spatial pyramid pooling (SPPF) module. As one of the core feature enhancement components of YOLO11, C2PSA combines the cross-stage local (CSP) architecture [16] and the partial self-attention (PSA) mechanism [17]. The input features first undergo an initial transformation through a 1×1 convolution layer.
Subsequently, the features are divided into two groups for grouped parallel processing: one group retains the original information flow features and is forward-passed through the residual direct connection path; the other group is input to the PSA module for deep processing. The PSA module first performs feature extraction through multi-scale convolution kernels, and then SE module weights the channels.
Finally, the processed features are further achieved through the Softmax function to implement point-wise convolution within the channels, thereby effectively improving the detection performance of the model in complex backgrounds and scenarios with multiple scales of objects coexisting. Additionally, YOLO11 references the efficient lightweight design of YOLOV10 and introduces the depthwise separable convolution (DWConv) module [18] in the classification detection head, significantly reducing the model parameters and computational complexity.
Overall, YOLO11 achieves a win-win situation in terms of detection accuracy and inference speed through a series of optimization innovations. For example, on the COCO dataset [19], YOLO11m achieved a higher mean average precision (mAP), while using 22% fewer parameters than YOLOv8m.
2.2. YOLO11n-SMSH
For the problem of unmanned aerial vehicle (UAV) target detection in complex backgrounds, the detection effect of the YOLO11n model is not satisfactory. However, replacing with other versions of the model would significantly increase the computational load and parameter quantity. Therefore, this paper chooses to improve the YOLO11n model and names the improved model YOLO11n-SMSH. Its network structure is shown in Figure 2.
2.2.1. CRIE Module
The CRIE (Crystal Radiance Interactive Enhancement) module is an innovative module proposed for the first time in this paper, aiming to serve as an efficient front-end module in image recognition tasks, specifically to enhance the model's response to the edges of unmanned aerial vehicle (UAV) targets. The C3k2 module in YOLO11 mainly relies on standard convolution for feature extraction, but lacks a targeted design for UAV targets, which not only leads to a large amount of redundant information being involved in the calculation, but also makes the model's response to the rigid contours (such as supports and wings) of UAV targets relatively weak, especially in small-scale or high-speed motion scenarios. To address these issues, this paper references the network idea proposed by Zhao et al. [20], combines the SobelConv branch for extracting edge information and the Conv branch for extracting spatial information, and studies and designs this module. The main features of the CRIE module include:
- Edge feature deep extraction: Convolutional Neural Network (CNN) excels in extracting spatial features of images, but has limitations in capturing edge information. To address this deficiency, the CRIE module innovatively introduces the SobelConv branch - this branch is optimally designed based on the Sobel operator [21], and by accurately identifying the abrupt changes in pixel intensity, it achieves deep extraction of image edge features.
- Efficient retention of spatial features: In the target detection task, edge information is crucial for precise boundary positioning, while spatial information is the fundamental support for understanding the structure of the target. The Conv branch relies on local receptive fields and translation invariance, capturing image texture details, corner distributions, etc. through convolution kernels, and passing the relative positional relationships within the target layer by layer, efficiently retaining the original spatial structure features.
- Perfect fusion of dual-path features: The CRIE module fuses the edge features extracted by the SobelConv branch and the spatial structure features extracted by the conv branch (Concat) to generate a comprehensive representation that combines boundary positioning and spatial integrity. This jointly enhances the robustness and adaptability of target detection in complex scenarios, providing strong support for subsequent target detection tasks.
The CRIE module not only performs excellently in extracting the boundary features of unmanned aerial vehicle targets, but can also be applied to other high-precision boundary detection tasks, such as surface defect detection, coal-rock interface recognition, and real-time monitoring of road targets. Experimental results show that the integration of the CRIE module effectively improves the performance of the model on multiple datasets, fully demonstrating its effectiveness and universality. The overall architecture of the CRIE module is shown in Figure 3, and its processing flow is as follows:
The input image first enters the bidirectional feature extraction path in parallel:one path decomposes it through SobelConv into horizontal (Sobel-x) and vertical (Sobel-y) edge detectors, and the edge gradient features output by both are fused through arithmetic addition (Add) to form a comprehensive edge feature; the other path extracts spatial features through standard convolution layer (Conv). Subsequently, the two types of features are heterogeneously fused and concatenated along the channel dimension, and then pass through two consecutive convolution layers for nonlinear transformation: the first layer Conv focuses on cross-channel feature interaction to achieve complementary advantages, while the second layer Conv optimizes the features to enhance the model's deep perception ability of the image. Finally, not only do the output feature maps enhance the target boundary information, but the CRIE module, through the multi-scale feature synergy mechanism, significantly improves the model's adaptability to complex scenes, providing strong support for subsequent target detection tasks.
2.2.2. SRA-DFF Network
- Feature Integration Path
During the Neck network optimization process, this paper refers to the BiFPN structure proposed by Tan et al. [22] and integrates multiple improvements to design the Starlight Radiance Aggregation-Dispersion Feature Fusion (SRA-DFF) Network. Firstly, by combining the Inception-style components in PKINet [23] and the Adown module in YOLOv9 [24], and drawing on the ResNet [25] idea, the FocusFeature module is studied and designed for feature focusing. Through deep processing of image data, cross-scale information integration is achieved; Secondly, a feature diffusion mechanism is customized for multi-scale fusion features, ensuring that each scale feature map has detailed context information; Finally, through three-dimensional spatial loop fusion, a feature map containing multi-scale context information is output. This series of improvements enhance the multi-level feature extraction effect, strengthen the semantic correlation between feature expression levels, and significantly improve the cross-scale feature interaction and fusion, providing rich information flow for subsequent detection tasks. The network structure is shown in Figure 4, and the specific workflow is as follows:
Firstly, the multi-scale feature maps (P3, P4, P5) extracted from the backbone network are input in parallel to the Feature Focus Module (FFt) for preliminary processing, generating optimized features. Subsequently, the features enter the dual-path symmetric heterogeneous feature interaction network: the semantic deepening path gradually downsamples through the cascaded convolution module (Conv-C3k2), extracting high-order semantic features and forming a deep feature flow; the detail fusion path upsamples (Upsample) to improve the feature resolution and concatenates (Concat) with the corresponding scale features, and then undergoes spatial cyclic fusion to generate multi-scale feature maps, which are passed to the output layer (Dt). Finally, the output layers at different levels (s, m, l) based on the output adaptation mechanism balance the local details and global semantic information carried, significantly improving the adaptability and robustness of the model for multi-scale object detection.
- FFt Module
The fusion method of YOLO11 for features of different scales is to directly add feature maps in the depth dimension [26]. This simple concatenation operation will prevent the model from effectively capturing global semantic information. To address this issue, this paper designs the Feature Focus Module (FFt), which serves as the core component of the SRA-DFF Network. The specific network structure is shown in Figure 5.
This module adopts a multi-scale feature collaborative processing architecture: Firstly, the feature maps at three scales P3, P4 and P5, are input in parallel for processing. Among them, the high-resolution feature map P3, which contains a large amount of spatial detail information, is processed through a lightweight adaptive downsampling module (ADown). While compressing the spatial dimension, it can retain the key spatial features of the target and enhance the saliency of small targets in the subsequent feature maps [27]; the intermediate feature P4 is enhanced through a 3×3 convolution; the deep feature rich in high-level semantic information P5 is restored with details and texture through a bilinear upsampling module (Upsample) and a 3×3 convolution, and the semantic information is optimized to make up for the shortcomings of the low-resolution feature maps. Secondly, the three-scale features are fused and concatenated in the channel dimension through a Concat module to form the fused feature Ffuse1, significantly improving the adaptability to small targets and large scenes. That is:

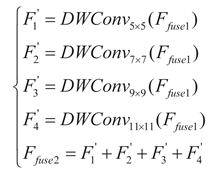
Subsequently, Ffuse1 inputs the gradient-based convolution kernel combination design module (Inception-style) and executes four groups of depthwise separable convolutions (DWConv) in parallel: DW5×5 focuses on local key features (such as target edges), DW7×7 extracts context correlations (such as target component relationships), DW9×9 captures large-scale structural information (such as the overall shape of the target), DW11×11 models global spatial dependencies (such as the layout of complex scenes). This design is different from traditional single-scale convolutions and achieves cross-scale receptive field coverage and multi-scale detection collaboration. The mathematical expression of this process is:
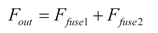
Finally, features of different scales are compressed and aggregated through 1×1 convolution to obtain the fused feature Ffuse2. Ffuse1 and Ffuse2 integrate and add together through the residual direct connection path to generate the optimized feature Fout that combines spatial details and global context information:
2.2.3. NTTAA Detection Head
Object detection is typically formulaObject detection is usually described as a multi-task learning problem that jointly optimizes object classification and localization. The classification task aims to learn distinguishing features concentrated in the key parts or significant areas of the object, while the localization task precisely locates the entire object and its boundaries [28]. Due to the differences in the learning mechanisms of the two tasks, the feature spaces they learn may be different. Common one-stage detectors usually adopt a dual-branch independent structure to achieve the localization and classification tasks. This structure may lead to a certain degree of spatial deviation in the classification and localization results. To enhance the feature interaction between the two tasks, this paper refers to the TOOD idea proposed by Feng et al. and designs the NTTAA (Nebula Turbulence Task Adaptation Alignment) detection head. Its network structure is shown in Figure 6. The specific workflow is as follows:
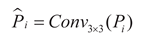
(1) The multi-scale feature maps Pi generated by the SRA-DFF network are input to the shared convolution module (ShareConv) in parallel. This module adopts the Conv_GN normalization structure: a 3×3 convolution layer is used for feature extraction and transformation, and the GroupNorm[29] layer, which performs normalization processing in the Channels direction, effectively avoids the influence of batch_size on the model performance. The unique shared weight mechanism also significantly reduces the total number of parameters and the risk of model overfitting. The mathematical expression of this process is:
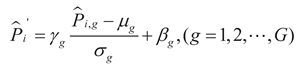
In the formula: 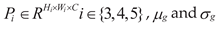 represent the mean
and standard deviation of the features in the g group respectively, G represents the
number of groups along the
channel dimension.
represent the mean
and standard deviation of the features in the g group respectively, G represents the
number of groups along the
channel dimension.
represent the mean
and standard deviation of the features in the g group respectively, G represents the
number of groups along the
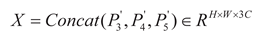
channel dimension.(2) The normalized multi-scale feature Pi' is
fused and concatenated (Concat) and then input into the task decoupling module
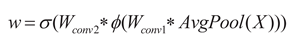
(TDp): The task interaction features gradually pass through the average pooling
layer (Avg-Pool), Conv1, ReLU activation function layer, Conv2, and finally,
through the sigmoid function, to generate an N-dimensional layer attention
weight vector w. That is:
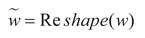
Subsequently, the weight vector w is adjusted to match
the shape suitable for the dot product with the convolution kernel, and then it
is multiplied with the built-in Conv_GN1 module for a dot product operation,
resulting in a new convolution kernel Knew. That is:

Meanwhile, the input features are adjusted to a shape suitable for matrix multiplication, and a matrix multiplication operation is performed with the new convolution kernel Knew. The operation result is then normalized by the Conv_GN2 module and processed by the activation function to complete the re-calibration of the features. That is:
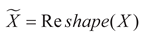
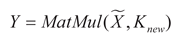
In the formula: 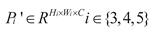 , X represents the
concatenated feature, Wconv1 and Wconv2 respectively
represent the weights of the two convolutional layers in TDp, and respectively
represent the adaptive adjusted weight vector and the concatenated feature. Kbase represents the
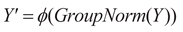
initial convolution kernel of the built-in Conv_GN1 module in TDp, σ(·) and ϕ(·) respectively
represent the Sigmoid function and the ReLU function. Thus, the classification
and localization tasks can each obtain the feature representation with their
own characteristics Y′, thereby
achieving task decoupling.
, X represents the
concatenated feature, Wconv1 and Wconv2 respectively
represent the weights of the two convolutional layers in TDp, and respectively
represent the adaptive adjusted weight vector and the concatenated feature. Kbase represents the
initial convolution kernel of the built-in Conv_GN1 module in TDp, σ(·) and ϕ(·) respectively
represent the Sigmoid function and the ReLU function. Thus, the classification
and localization tasks can each obtain the feature representation with their
own characteristics Y′, thereby
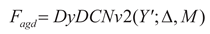
achieving task decoupling.(3) The output features of the Task Decoupling Module (TDp) are input in parallel to the dual-path collaborative processing architecture: the Spatial Convolution Offset Layer (SCO) predicts the offset of the sampling points at each spatial position based on the local information of the input feature map, and generates a modulation mask (mask) through the mask prediction branch to drive the Dynamic Deformable Convolution Module (DyDCNV2) to output feature maps adapted to geometric deformation; the Class Probability Layer (CPL) directly calculates the class probability distribution information through a four-level cascading structure: Conv1, ReLU, Conv2, Sigmoid. This process can be expressed as:
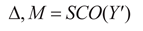
In the formula: Δ and M represent the
predicted offset and modulation mask respectively, Fagd represents the
feature map adapted to geometric deformation, Pcls represents the
calculated category probability distribution information, Wcpl2 and Wcpl1 represent the
weights of the two convolutional layers in the CPL respectively.
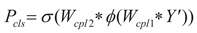
(4) The dual-path output interacts through the feature re-calibration mechanism: the category probability serves as the weight and is multiplied element-wise with the adapted geometrically deformed feature map, achieving the dynamic modulation of semantic information on geometric features, while retaining the complete geometric deformation features and suppressing background interference features. That is:
The re-calibrated feature maps are upsampled and distributed to the s, m, and l scale branches. Each branch performs detection through localization convolution (RegConv) and classification convolution (ClsConv):
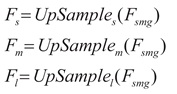
To address the issue of inconsistent target scales detected by each detection head, the Scale layer is used to scale the features. That is:
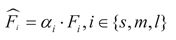
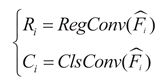
In the formula: Fsmg represents
the semantic modulation geometric feature map, represents the
feature map after scale adaptation with adaptive scaling, αi represents the
learnable scaling factor, Ri and Ci respectively
represent the location and classification feature maps.
2.2.4. GIoU Loss Function
The YOLO11 model employs the CIoU loss function [30] as the bounding box regression loss function (Bounding box regression, BBR), and its calculation formula is as shown in (20)-(23).
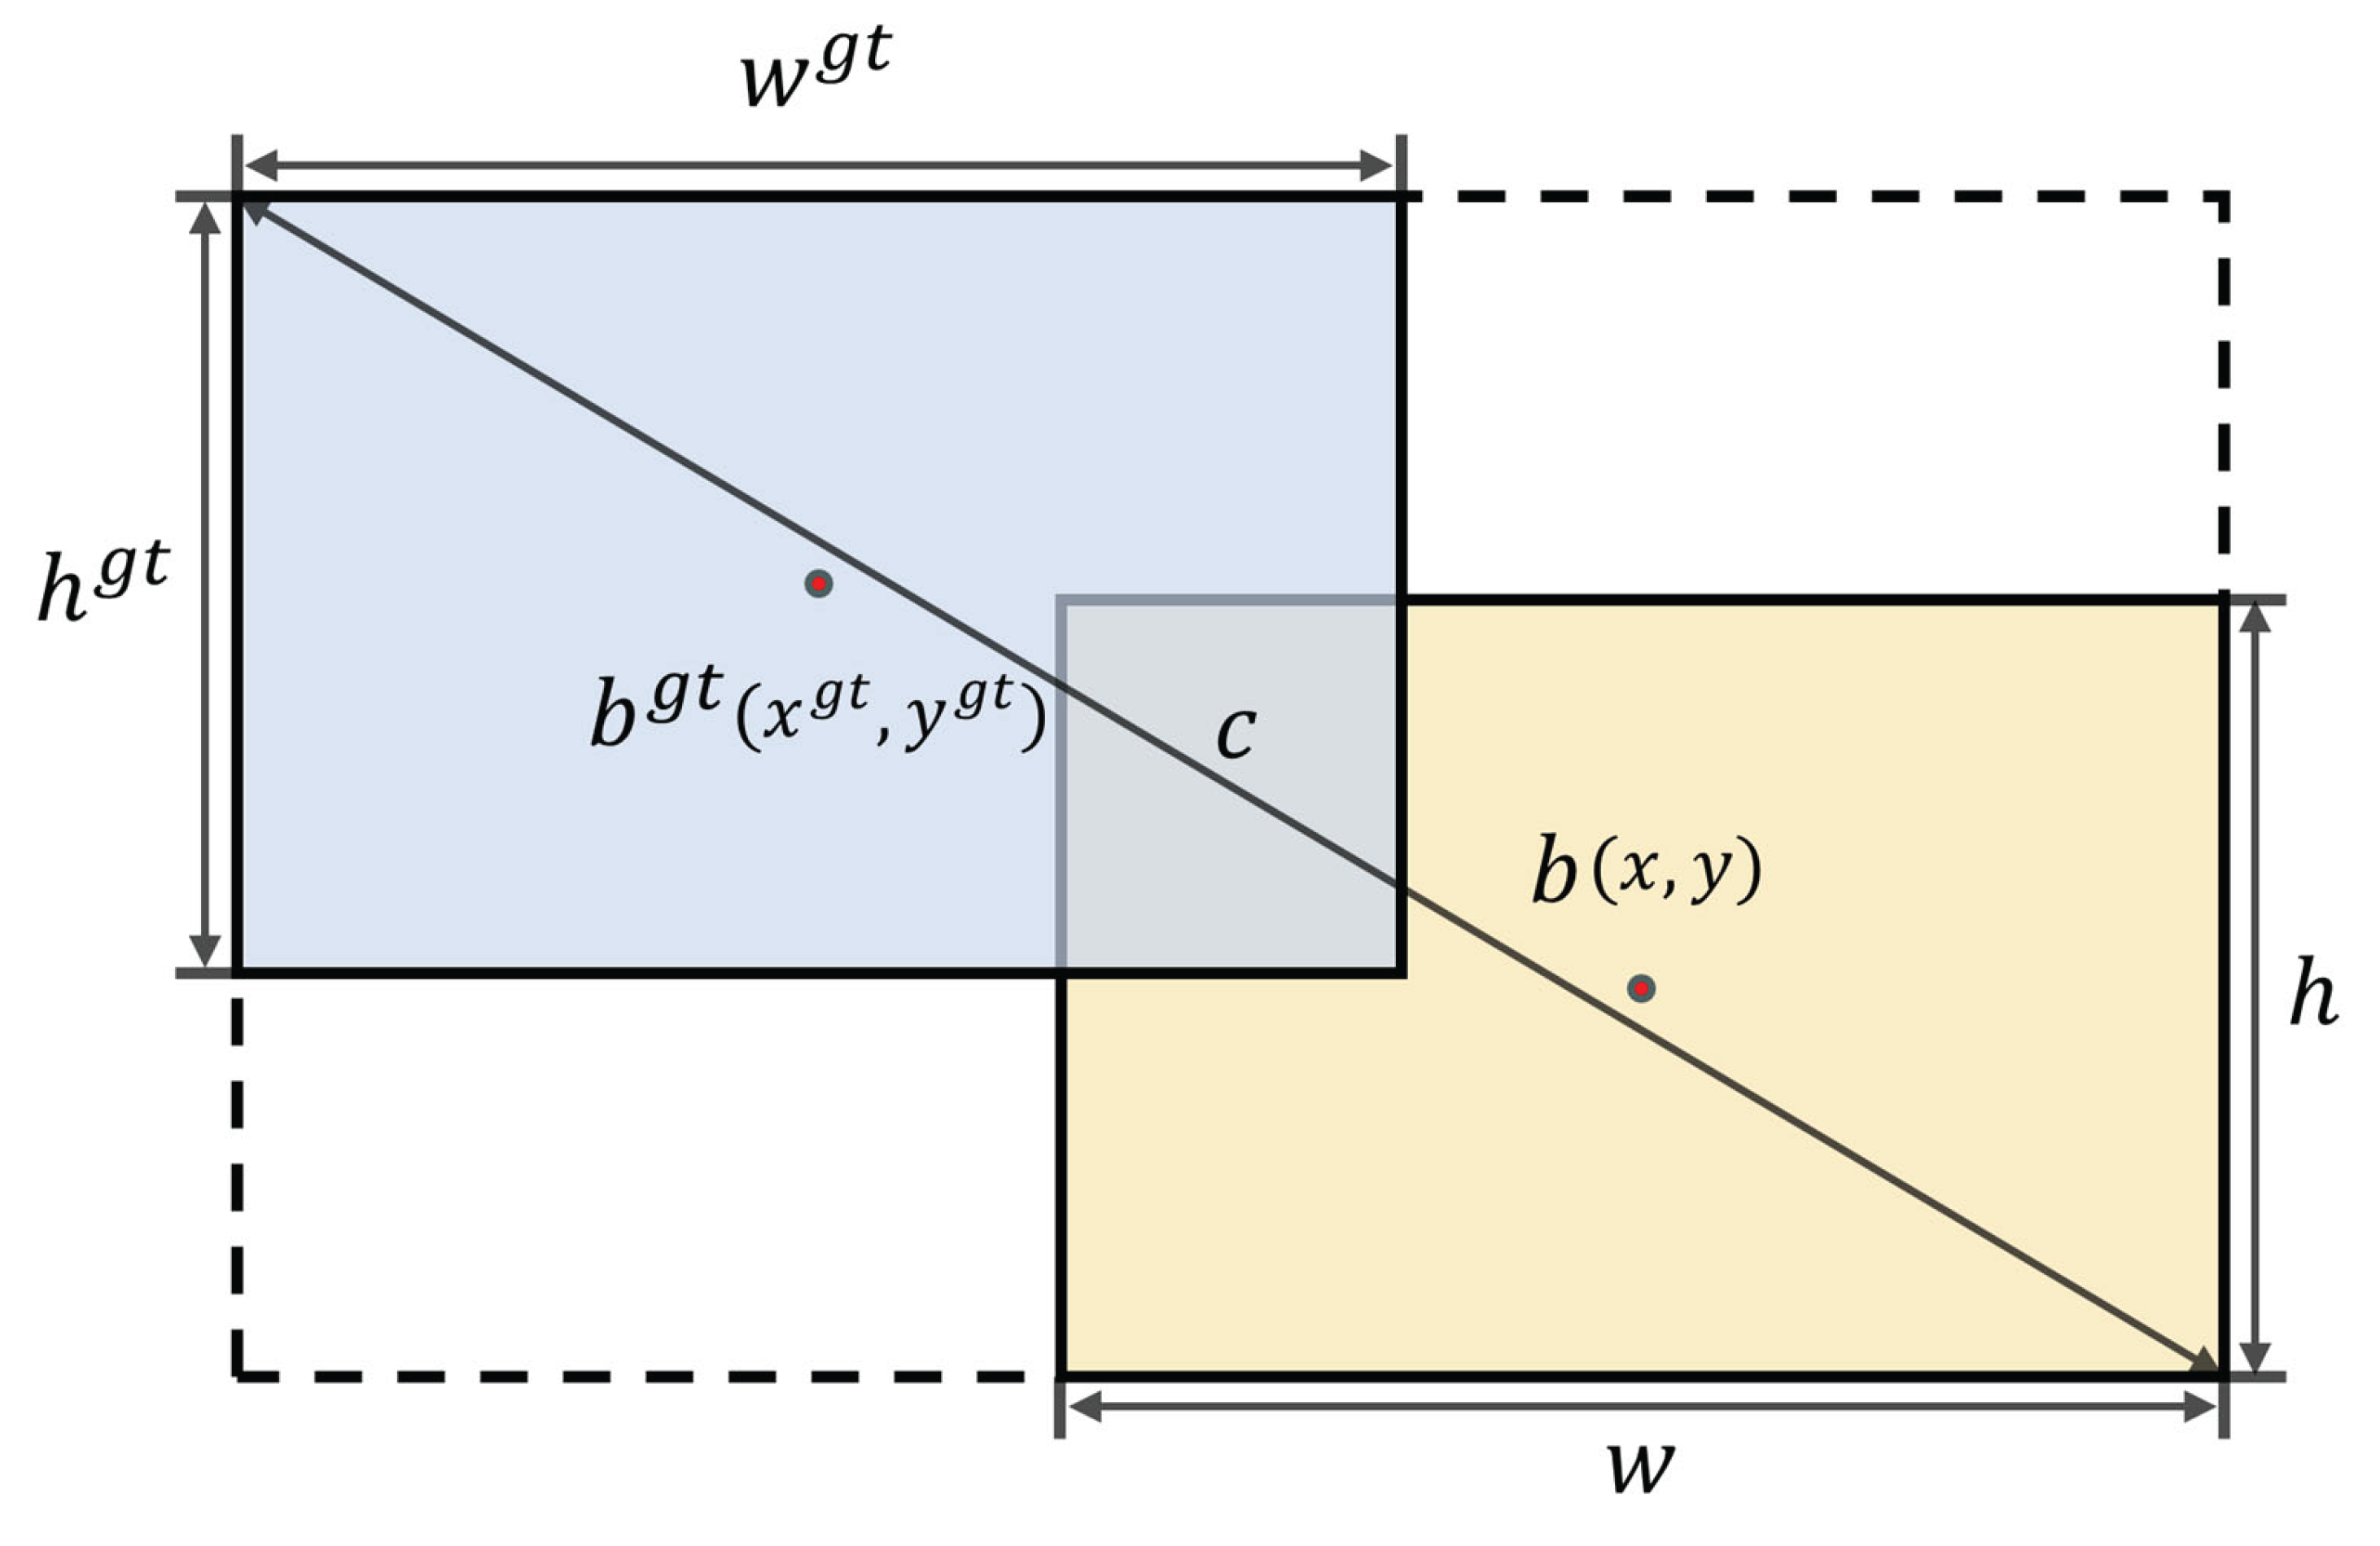
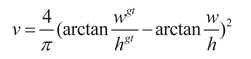
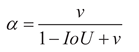
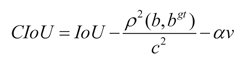
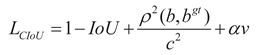
Figure 7.
Schematic diagrams of CIoU loss function.
In the formula: v represents the aspect ratio penalty term, which is used to
measure the consistency of the width and height of the true box and the
predicted box. wgt and hgt represent the width
and height of the true box, w and h represent the width
and height of the predicted box. α is the weight coefficient. IoU represents the intersection-over-union ratio between the true box and the predicted box. ρ represents the Euclidean distance between the two centers. b and bgt
represent the center
points of the predicted box and the true box respectively. c represents the
diagonal distance of the minimum enclosing region that can simultaneously
contain the predicted box and the true box.
Although the CIoU loss function takes into account multiple factors such as position, shape, and orientation, enabling the model to more comprehensively learn the features of the target box, when detecting objects like unmanned aerial vehicles (UAVs), CIoU has the following problems:
(1) The target aspect ratio dynamic change violates the CIoU constraint premise: The CIoU loss function introduces an aspect ratio penalty term v to aim at constraining the aspect ratio consistency in bounding box regression. The calculation of v depends on the aspect ratio difference between the predicted box and the real box, and its optimization goal requires the aspect ratios of both to tend to be consistent. However, due to the significant influence of flight attitude and shooting perspective on unmanned aerial vehicle (UAV) targets, their aspect ratios exhibit a high degree of dynamic change characteristics. This characteristic forces the model to fit the constantly changing aspect ratio targets, resulting in noisy gradients for the v term, which further misleads the model's optimization direction and limits the further improvement of the model's performance.
(2) The weakening of the necessity of constraining the aspect ratio due to the reduced symmetry of the target shape: The shapes of unmanned aerial vehicle (UAV) targets are highly regular, generally presenting centrosymmetric cross-shaped or X-shaped structures. Therefore, for the same target, there may exist multiple bounding boxes with different aspect ratios but geometrically equivalent. However, in the CIoU, the v term still requires the predicted box to have a strictly consistent aspect ratio with the real box, and gives positive rewards to the predictions that meet this requirement. This not only introduces additional optimization noise and contradictions, but also may cause the model to oscillate repeatedly between multiple equivalent aspect ratio solutions. This oscillation not only consumes additional computational resources, but also delays the convergence speed of the model.
(3) Small-scale targets amplify the CIoU quantization
error:In the CIoU loss function, the v
term evaluates the aspect ratio difference between the predicted box and the
real box through the calculation function arctan(w/h). However, for
small-scale targets captured from a long distance by drones, their aspect ratio
is extremely sensitive to even minor deviations at the pixel level. Moreover,
this stepwise change is amplified by arctan(·) function,
causing the v term to continuously generate abnormal gradient signals, forcing the model to overfit the subtle deviations at the pixel level and hindering the effective improvement of positioning accuracy.
To address the aforementioned issues, this paper replaces the CIoU loss function with the GIoU loss function [31], and its calculation formula is as follows:
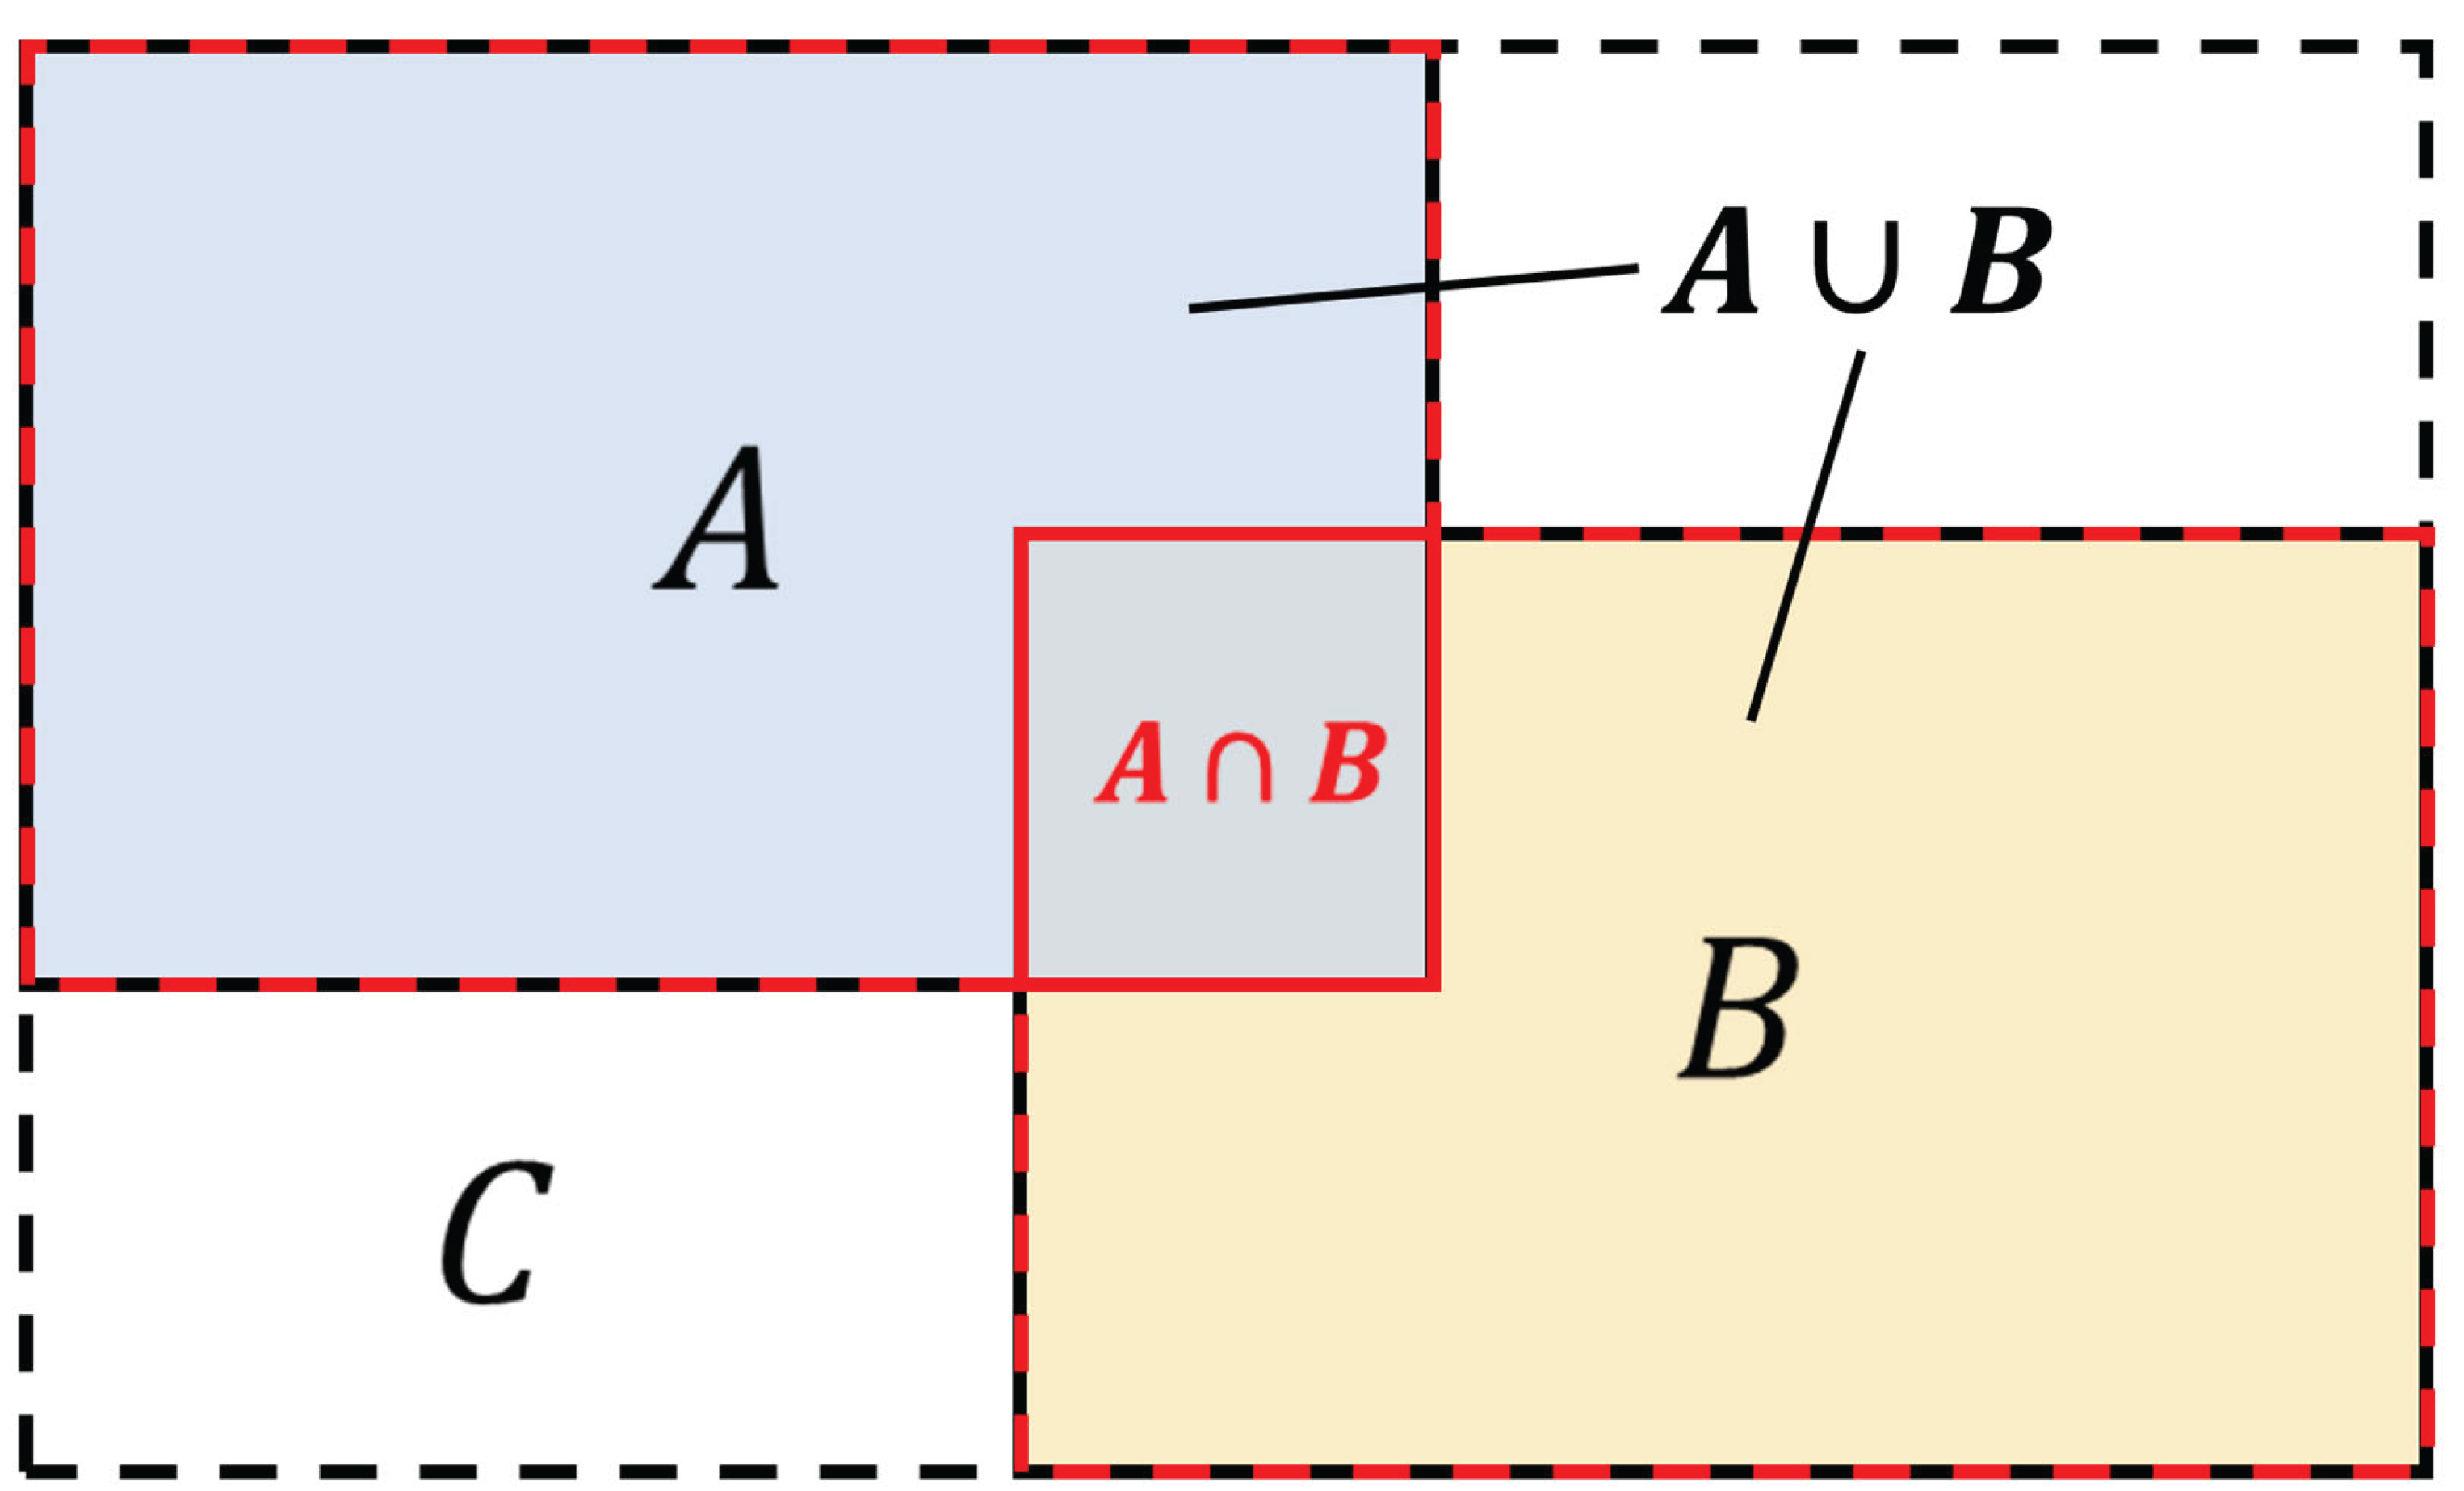
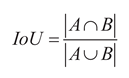
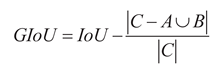
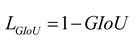
Figure 8.
Schematic diagrams of GIoU loss function.
In the formula: A represents the area of the true bounding box, B represents the area of the predicted bounding box, and C represents the area of the smallest bounding box that simultaneously includes both the predicted and true bounding boxes. The GIoU loss function completely eliminates the strong constraint on the aspect ratio of the target. Its loss design based on spatial coverage not only avoids optimization conflicts caused by dynamic shapes, eliminates redundant constraints on symmetrical targets, but also suppresses the propagation of errors for small targets through closure area normalization, thereby improving the model's detection performance for unmanned aerial vehicle targets.
2.3. Chapter Summary
This chapter elaborates in detail on the core improvement work for the YOLO11n model. Firstly, it introduces the YOLO11n model as the baseline, clarifying its network structure and performance characteristics, serving as a reference for subsequent improvements. On this basis, it systematically and comprehensively presents four key improvement points: introducing the CRIE module, designing the SRA-DFF network, constructing the NTTAA detection head, and adopting the GIoU loss function, forming a complete model optimization scheme, laying the theoretical foundation for subsequent comparative ablation experiments.
3. Results
This chapter introduces the experimental environment and parameter configuration, the source of the datasets used in the experiment, and the evaluation metrics of the experiment, and describes the details of the experiment. To verify the effectiveness of each improved module of the YOLO11n model, ablation experiments were conducted on the improved parts on the DUT Anti-UAV dataset [32]. To further verify the superiority of the model, comparative experiments were carried out between the improved model and the current typical models of the YOLO series, and the generalization of the model was verified on the Det-Fly dataset. Finally, the experimental results were visualized and analyzed.
3.1. Experimental Environment and Parameter Configuration
To ensure the fairness and reliability of the experiments, all experiments in this paper are consistent with the YOLOv11n baseline model [33] and meet the following conditions: (1) The experimental platform uses Windows 11 as the operating system, equipped with an Intel® Core™ i9-14900HX @ 2.20GHz processor and 32GB of memory. The graphics card is an NVIDIA GeForce RTX 4060 Laptop GPU with a total of 8GB of video memory; (2) The development language is Python 3.10.16, and the deep learning framework is Pytorch-2.1.0 with CUDA version 11.8; (3) No pre-trained weights were used in the training process of the ablation and comparison experiments. Table 1 shows the important hyperparameter settings of the model during the training stage. Parameters not mentioned in this paper all use the default parameters of the official YOLOv11 version.

Table 1.
Configuration table of experimental parameters.
| Parameters | Setup |
|---|---|
| Optimizer | SGD |
| Batch_Size | 16 |
| Epochs | 200 |
| Imges_Size | 640 |
| Learning rate | 0.01 |
| Amp | True |
| workers | 2 |
| Momentum | 0.937 |
| Weight-Decay | 0.0005 |
YOLO11 is divided into five types (n, s, m, l, x) based on different network depths and widths. The detection accuracy of these types gradually increases, but the parameter quantity also increases accordingly. Considering that edge computing devices equipped with cameras usually face limitations in computing resources and energy consumption, when improving the model, the lightest YOLO11n was selected as the benchmark model [34].
3.2. Dataset
This study verified the improved model on multiple public datasets to ensure the validity and generalization of the model [35]. Firstly, the experiments mainly used the anti-UAV dataset proposed by Zhao Jie, Zhang Jingshu, et al., named Dalian University of Technology Anti-UAV (DUT Anti-UAV). This dataset is dedicated to promoting the development of the UAV detection and tracking field, and it includes detection and tracking subsets. In this paper, the detection subset is used. The detection subset contains a total of 10,000 images, with the training set, test set, and validation set consisting of 5,200, 2,200, and 2,600 images respectively. Since a single image may contain multiple objects, the total number of detected objects is 10,109, with 5,243, 2,245, and 2,621 objects in the training set, test set, and validation set respectively. Compared to general target detection datasets, this dataset has the following characteristics:
(1) The dataset contains images of various resolutions: the smallest image has a size of 160×240, while the height and width of the largest image are 3744 and 5616 respectively. The size range is quite wide, and this setup enables the model to adapt to images of different sizes and avoids overfitting.
(2) The image content covers various types of drones and background environments: This dataset involves more than 35 types of drones, consisting of multiple groups of images from different outdoor environments (such as sky, clouds, jungle, high-rise buildings, residential buildings, farmland and playgrounds), various lighting conditions (daytime, night, dawn, dusk), and complex weather conditions (sunny, cloudy, snowy). The diverse types of raw data can enhance the universality and generalization of the model, and are crucial for training a high-performance UAV target detection model.
(3) The proportion of small objects in the dataset is significant: Considering that the size of drones is often small and the outdoor environment is vast, the dataset contains a large number of small object targets. The average target area ratio in the dataset is approximately 0.013, the minimum target area ratio is 1.9e-06, and the largest target occupies 0.7 of the entire image. Most of the targets are very small. The proportion of the object size in the entire image is approximately less than 0.05.
By analyzing the above characteristics, it is clearly observable that there are many difficulties and challenges in detecting UAV targets. The main challenges include the targets being too small, complex backgrounds, similarity to the targets, and significant changes in light. Figure 9 presents an example of the detection dataset that reflects these challenges.
Secondly, we verified the generalization ability of the model on the Det-Fly dataset. This dataset was proposed by Ye Zheng et al. in 2021 and was specifically designed for the visual detection task of small unmanned aerial vehicles in air-to-air scenarios. Among the 13,271 images of DJI Mavic unmanned aerial vehicles in the dataset, 12,000 images were captured by another flying unmanned aerial vehicle, covering various situations of the target unmanned aerial vehicle in different background scenes, viewpoints, relative distances, flight heights, and lighting conditions. Figure 10 shows an example of the Det-Fly dataset.
3.3. Evaluation Metrics
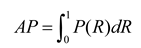
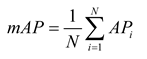
Evaluation metrics play a crucial role in measuring the performance of a model. By quantifying the performance of the model, they provide an intuitive and reliable basis for comparing the performance of different models. In this study, Precision(P), Recall(R), average precision (AP), and average precision mean (mAP) were selected as the main evaluation metrics. Considering that in the UAV target detection task, false detection and missed detection issues are particularly prominent, and mAP can comprehensively reflect the detection ability of the model in multiple categories, it is a comprehensive performance metric. Therefore, mAP50 and mAP50-95 were chosen as key evaluation metrics. At the same time, the size of the model and the computational cost are also important factors for evaluation, and they are generally measured by floating-point computation volume (GFLOPs) and parameter volume (Params). The detailed calculation formulas for AP and mAP are presented in Equation (27) and Equation (28) respectively.
3.4. Comparison and Ablation Experiments
3.4.1. Comparison Effect of Different Block Modules
To verify the effectiveness of the CRIE module proposed in this paper in unmanned aerial vehicle (UAV) target detection, it was compared with other mainstream Block modules: the C3 module of YOLOv5, the C2f module of YOLOv8, the C3k2 module of YOLO11, the A2C2f module of YOLO12 [36], and the RepC3 module of RT-DETR [37] under the same experimental conditions. The experimental results are shown in Table 1 and Figure 11.
Table 1.
Comparison Effect of different Block modules.
| Block | P | R | mAP50 | mAP50-95 | GFLOPs | Params/106 |
|---|---|---|---|---|---|---|
| CRIE | 0.942 | 0.83 | 0.9 | 0.598 | 6.4 | 2.57 |
| RepC3 | 0.946 | 0.825 | 0.898 | 0.598 | 6.9 | 2.98 |
| C3 | 0.925 | 0.84 | 0.897 | 0.592 | 5.5 | 2.42 |
| C2f | 0.934 | 0.816 | 0.893 | 0.591 | 6.1 | 2.63 |
| C3k2 | 0.933 | 0.818 | 0.89 | 0.587 | 6.3 | 2.58 |
| A2C2f | 0.919 | 0.796 | 0.879 | 0.571 | 6.4 | 2.97 |
The results indicate that the CRIE module achieves a coordinated optimization of accuracy and efficiency. While maintaining the top position of mAP50, its parameter size is 13.8% lower than that of the mainstream module RepC3, and its computational cost is also superior to RepC3. At the same time, its precision rate (P) is significantly higher than that of the baseline modules C3, C2f, etc., and differs from RepC3 by only 0.4%. However, it is worth noting that the mAP50-95 of the CRIE module is tied with the RepC3 module, verifying the robustness of the model in complex backgrounds. Although the recall rate (R) is slightly lower than that of the C3 module, its comprehensive advantages in terms of accuracy improvement, computational efficiency optimization, and parameter compression demonstrate the application value of the CRIE module in the UAV target detection task.
3.4.2. Comparison Effect of CRIE at Different Replacement Position
This paper proposes a self-developed CRIE module to replace the C3k2 module in the backbone network, aiming to enhance the model's ability to extract target edge features. For the four C3k2 modules (marked from the shallow layer to the deep layer as A, B, C, and D) in the backbone network, the effect of different replacement positions is evaluated using the control variable method. To comprehensively assess the performance of a single module and the compatibility across modules, two sets of experiments are set up: 1. Replace the CRIE module in the YOLO11n baseline model, and the results are shown in Table 2(a); 2. Replace the CRIE module in the improved model integrating the SRA-DFF network, and the results are shown in Table 2(b).
The experimental results show that in Table 2(a), the combinations of B+C+D and B performed well, with mAP50-95 reaching 61.2% and 60.1% respectively. The other indicators were also in the leading position. This indicates that the shallow position (B) plays a crucial role in enhancing edge features. However, in Table 2(b), the indicators of the B+C+D combination sharply decreased, especially the mAP50-95 dropped to 58.9% (a decrease of 2.3%). The B combination also had the same situation. This suggests that its cross-module collaboration ability needs to be strengthened. At the same time, it is noted that in Table 2(b), the accuracy indicators of the A combination, mAP50 and mAP50-95, reached 91.0% and 59.8% respectively, which was the best among all combinations. However, in Table (a), it performed at the bottom, indicating its high dependence on module combination. Comparatively, the A+C combination is more in line with the experimental expectations: in both sets of experiments, the A+C combination had all indicators ranked at the top, and mAP50 and mAP50-95 could stabilize at 90% and 59.8% respectively, with significant improvement compared to the baseline model, indicating its good cross-experiment stability. Therefore, the A+C combination scheme was finally selected for the subsequent research.
3.4.3. Comparison Effect of Different Loss Function
Given the several issues exposed by the CIoU loss function when dealing with drone targets, this paper evaluated the effects of GIoU, Inner-DIoU [38], Inner-ShapeIoU [39], Focaler-EIoU [40], Focaler-MPDIoU [41], Wise-WIoU [42], and Wise-Inner-SIoU [43] loss functions on the detection performance. It compared them with the default CIoU loss function of YOLO11 and selected the more effective loss function to replace it.
Table 3 and Figure 12 show the experimental results using different types of loss functions. Since the model computation volume (GFLOPs) and parameter volume (Params) were not significantly affected by different loss functions, they were not included in the evaluation indicators.
The results show that different loss functions have distinct characteristics in the object detection task. For the original model using CIoU, P, R, mAP50, and mAP50-95 reached 95%, 84.9%, 90.9%, and 60.8% respectively. Although Inner-DIoU demonstrated a relatively high accuracy rate (95.9%), its recall rate and mAP values did not reach the cutting-edge level. The Focaler series performed relatively weakly in all indicators. The fundamental reason is that the Focaler series mainly addresses the issue of class imbalance, which is fundamentally different from the core difficulty of unmanned aerial vehicle target detection (lack of information, difficult positioning, etc.). The newly proposed Wise-WIoU in the Wise series achieved the current highest recall rate (86%), and its accuracy and mAP50 were in the first rank, but its mAP50-95 was only 60.2%, indicating that there is considerable room for improvement. In comparison, the comprehensive performance of GIoU is more outstanding. Its mAP50 and mAP50-95 performed best and were significantly superior to loss functions such as CIoU, with a recall rate only 0.3% behind the Wise-WIoU loss function, and its accuracy ranked among the top. Therefore, GIoU achieved a golden balance in multiple indicators and became the best choice for unmanned aerial vehicle target detection tasks.
3.4.4. Ablation Experiment
To verify the effectiveness of each improvement module in the unmanned aerial vehicle (UAV) target detection task, this paper conducted ablation experiments on the DUT Anti-UAV dataset. The YOLO11n model was used as the baseline model (Table 4 and Figure 13, Baseline), and the performance of each module was quantitatively evaluated by sequentially integrating the modules. The experimental results showed that each improvement module could play an active role in enhancing the model's detection performance.
Firstly, after replacing the C3k2 module in the main network of the baseline model with the CRIE module, all indicators of the model were significantly improved. With almost unchanged computational cost and parameters, the core accuracy indicators mAP50 and mAP50-95 increased from 89.0% and 58.7% to 90.0% and 59.8% respectively. This indicates that the CRIE module has better feature extraction capabilities than the original C3k2 module, can more effectively capture the edge features of the target, and significantly improves the overall accuracy of the model's target detection, verifying its effectiveness in the improvement of the main network.
Secondly, on the basis of the model that has integrated the CRIE module, the neck network was further replaced with the SRA-DFF network. The experimental results showed that this improvement point had a relatively weak effect on accuracy, but a more significant promotion effect on recall (+1.3%). It is worth noting that the core indicators mAP50 and mAP50-95 remained at a relatively high level during this stage. This reflects that the SRA-DFF network enhanced the model's feature interaction and fusion ability, significantly improved the model's sensitivity to the target position, and helped detect more difficult samples. The increase in computational cost also confirmed the complexity of its structure.
Then, with the introduction of the NTTAA detection head, the key indicators of the model achieved breakthrough progress again: the accuracy improved to 95.0%, the recall further increased to 84.9%, the core indicator mAP50 significantly improved to 90.9%, indicating that the mAP50-95 indicator, which represents more strict positioning accuracy, also increased from 59.8% to 60.8%. This clearly shows that the NTTAA detection head has unique advantages in strengthening the feature interaction between the main network and the neck network for the task of classification and positioning: by more effectively utilizing the optimized features from the main network and the neck, it collaborates with the final bounding box prediction. It is also noted that by using shared convolution, the model parameters decreased to a certain extent, further verifying the superiority of this detection head.
Finally, although the use of the GIoU loss function led to a very slight decrease in accuracy, it significantly increased the recall to 85.7%, and further improved mAP50 and mAP50-95 to the peak values of the experiment. This demonstrates that GIoU effectively solves the problems existing in the UAV target detection scenario through better consideration of the overlap and position relationship between the predicted box and the real box.
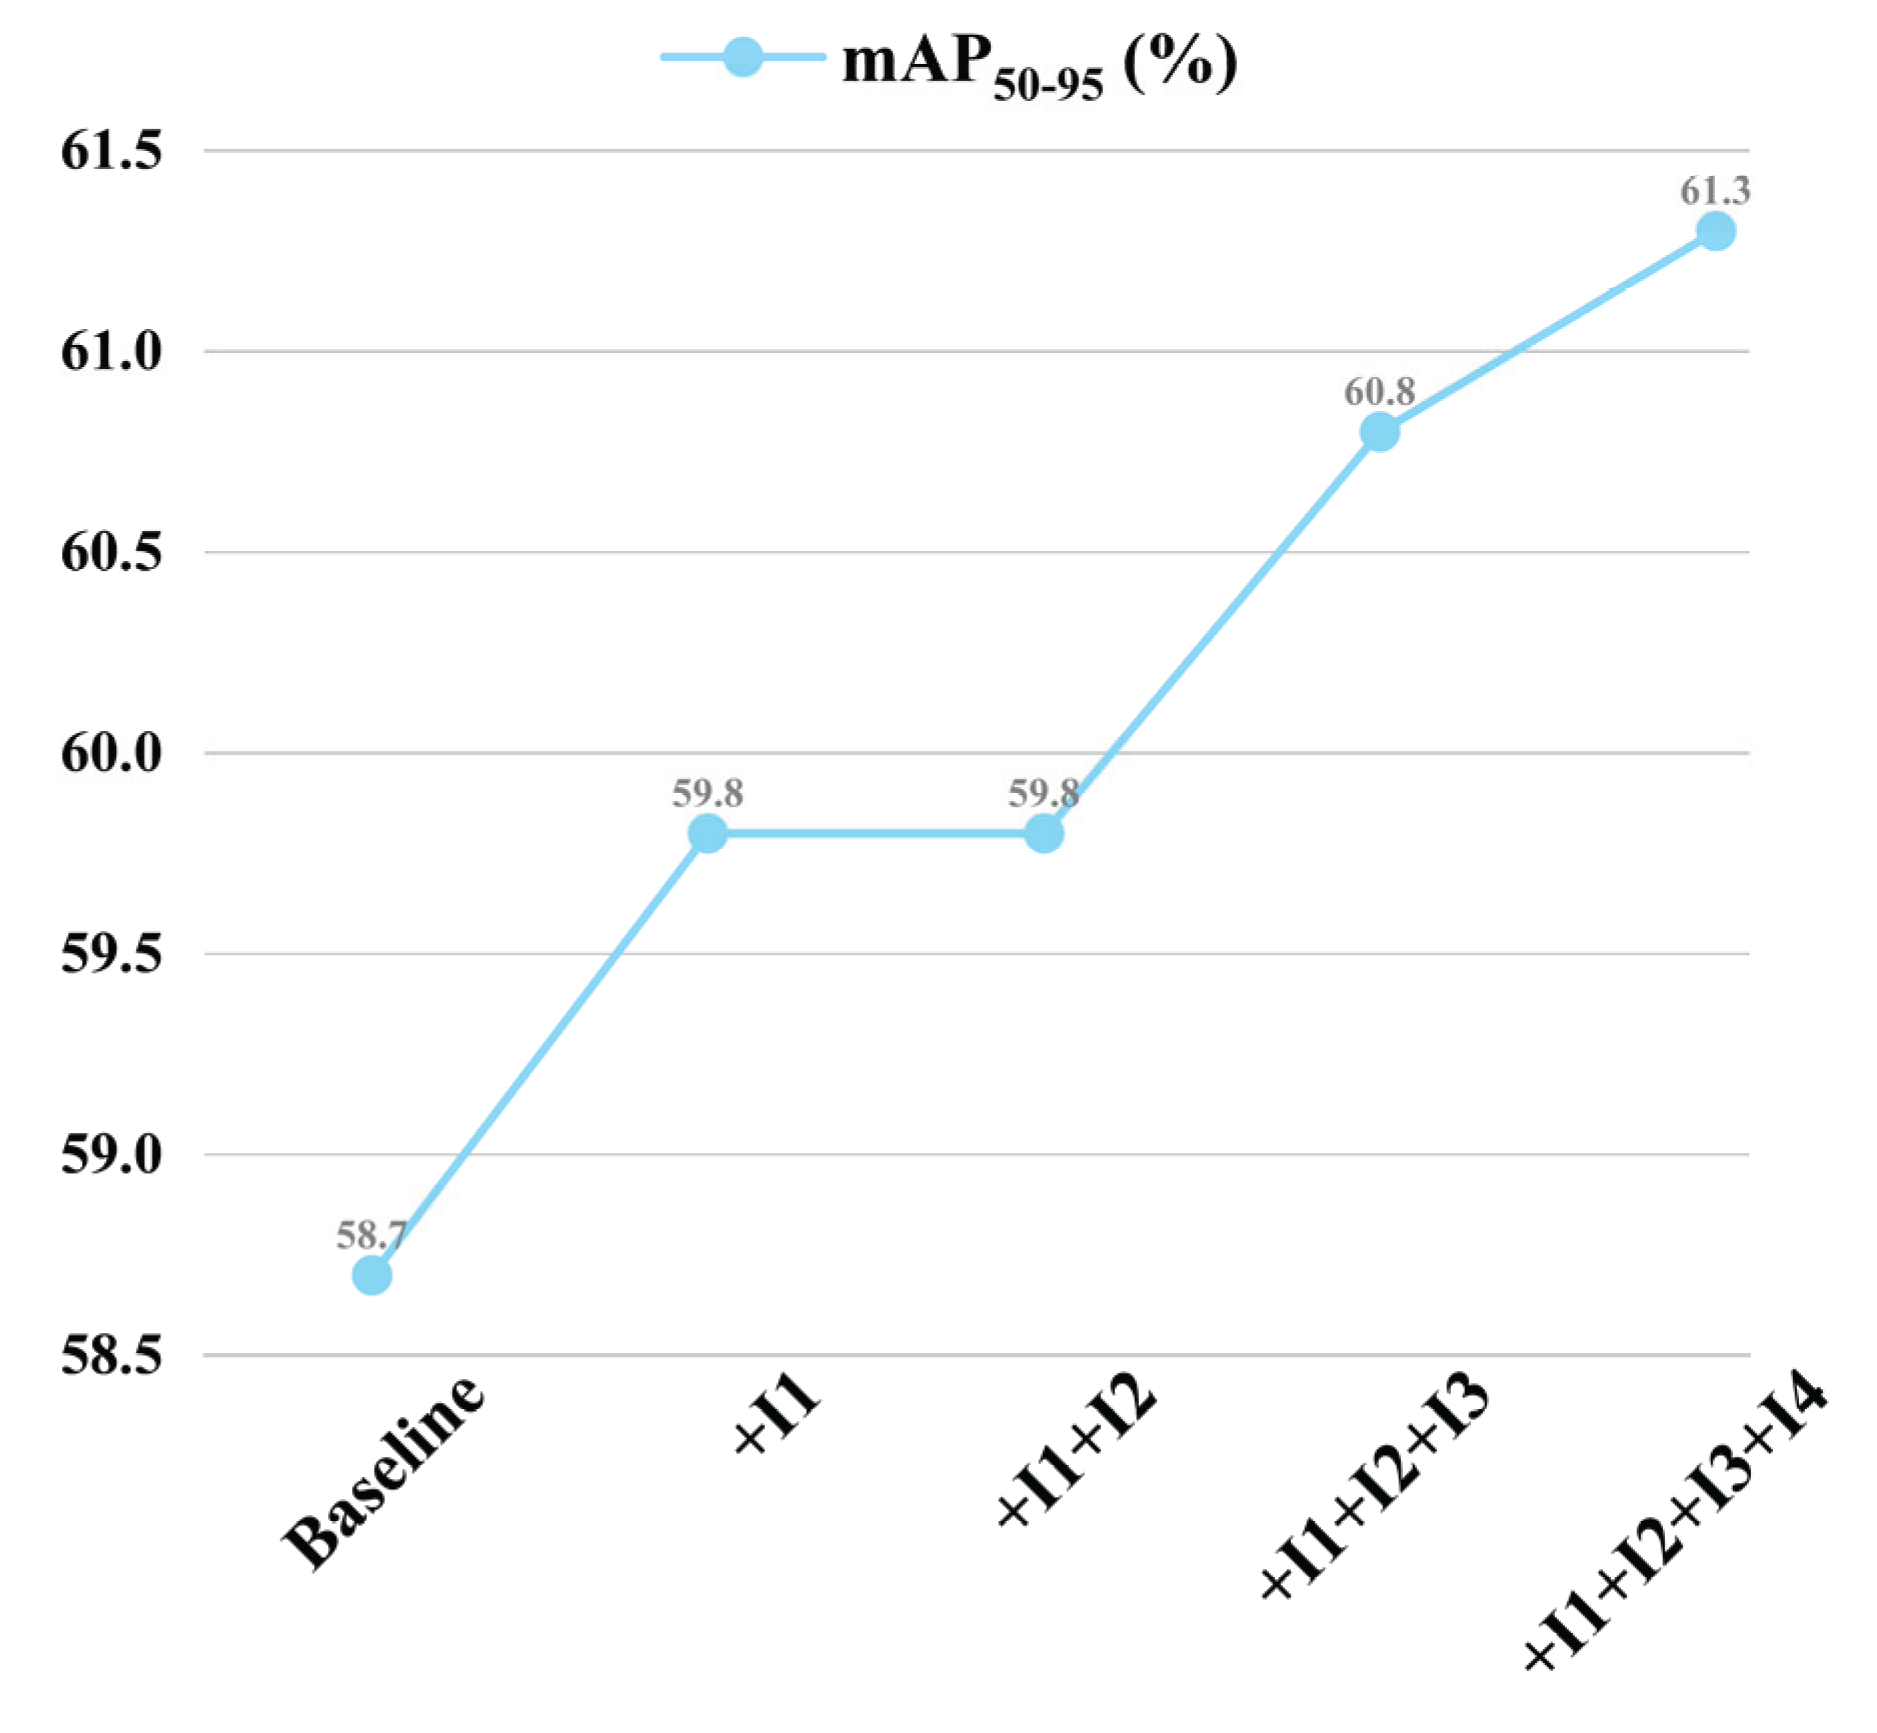
In conclusion, with the collaborative effect of all improvement modules, the core detection performance of the model, mAP50, was significantly improved from the baseline 89.0% to 91.5% (+2.5%), and mAP50-95 was improved from 58.7% to 61.3% (+2.6%), fully verifying the effectiveness of each improvement module in the sequential integration process for enhancing the comprehensive detection performance of the YOLOv11n model.
Figure 13.
Comparison of P,R,mAP50.
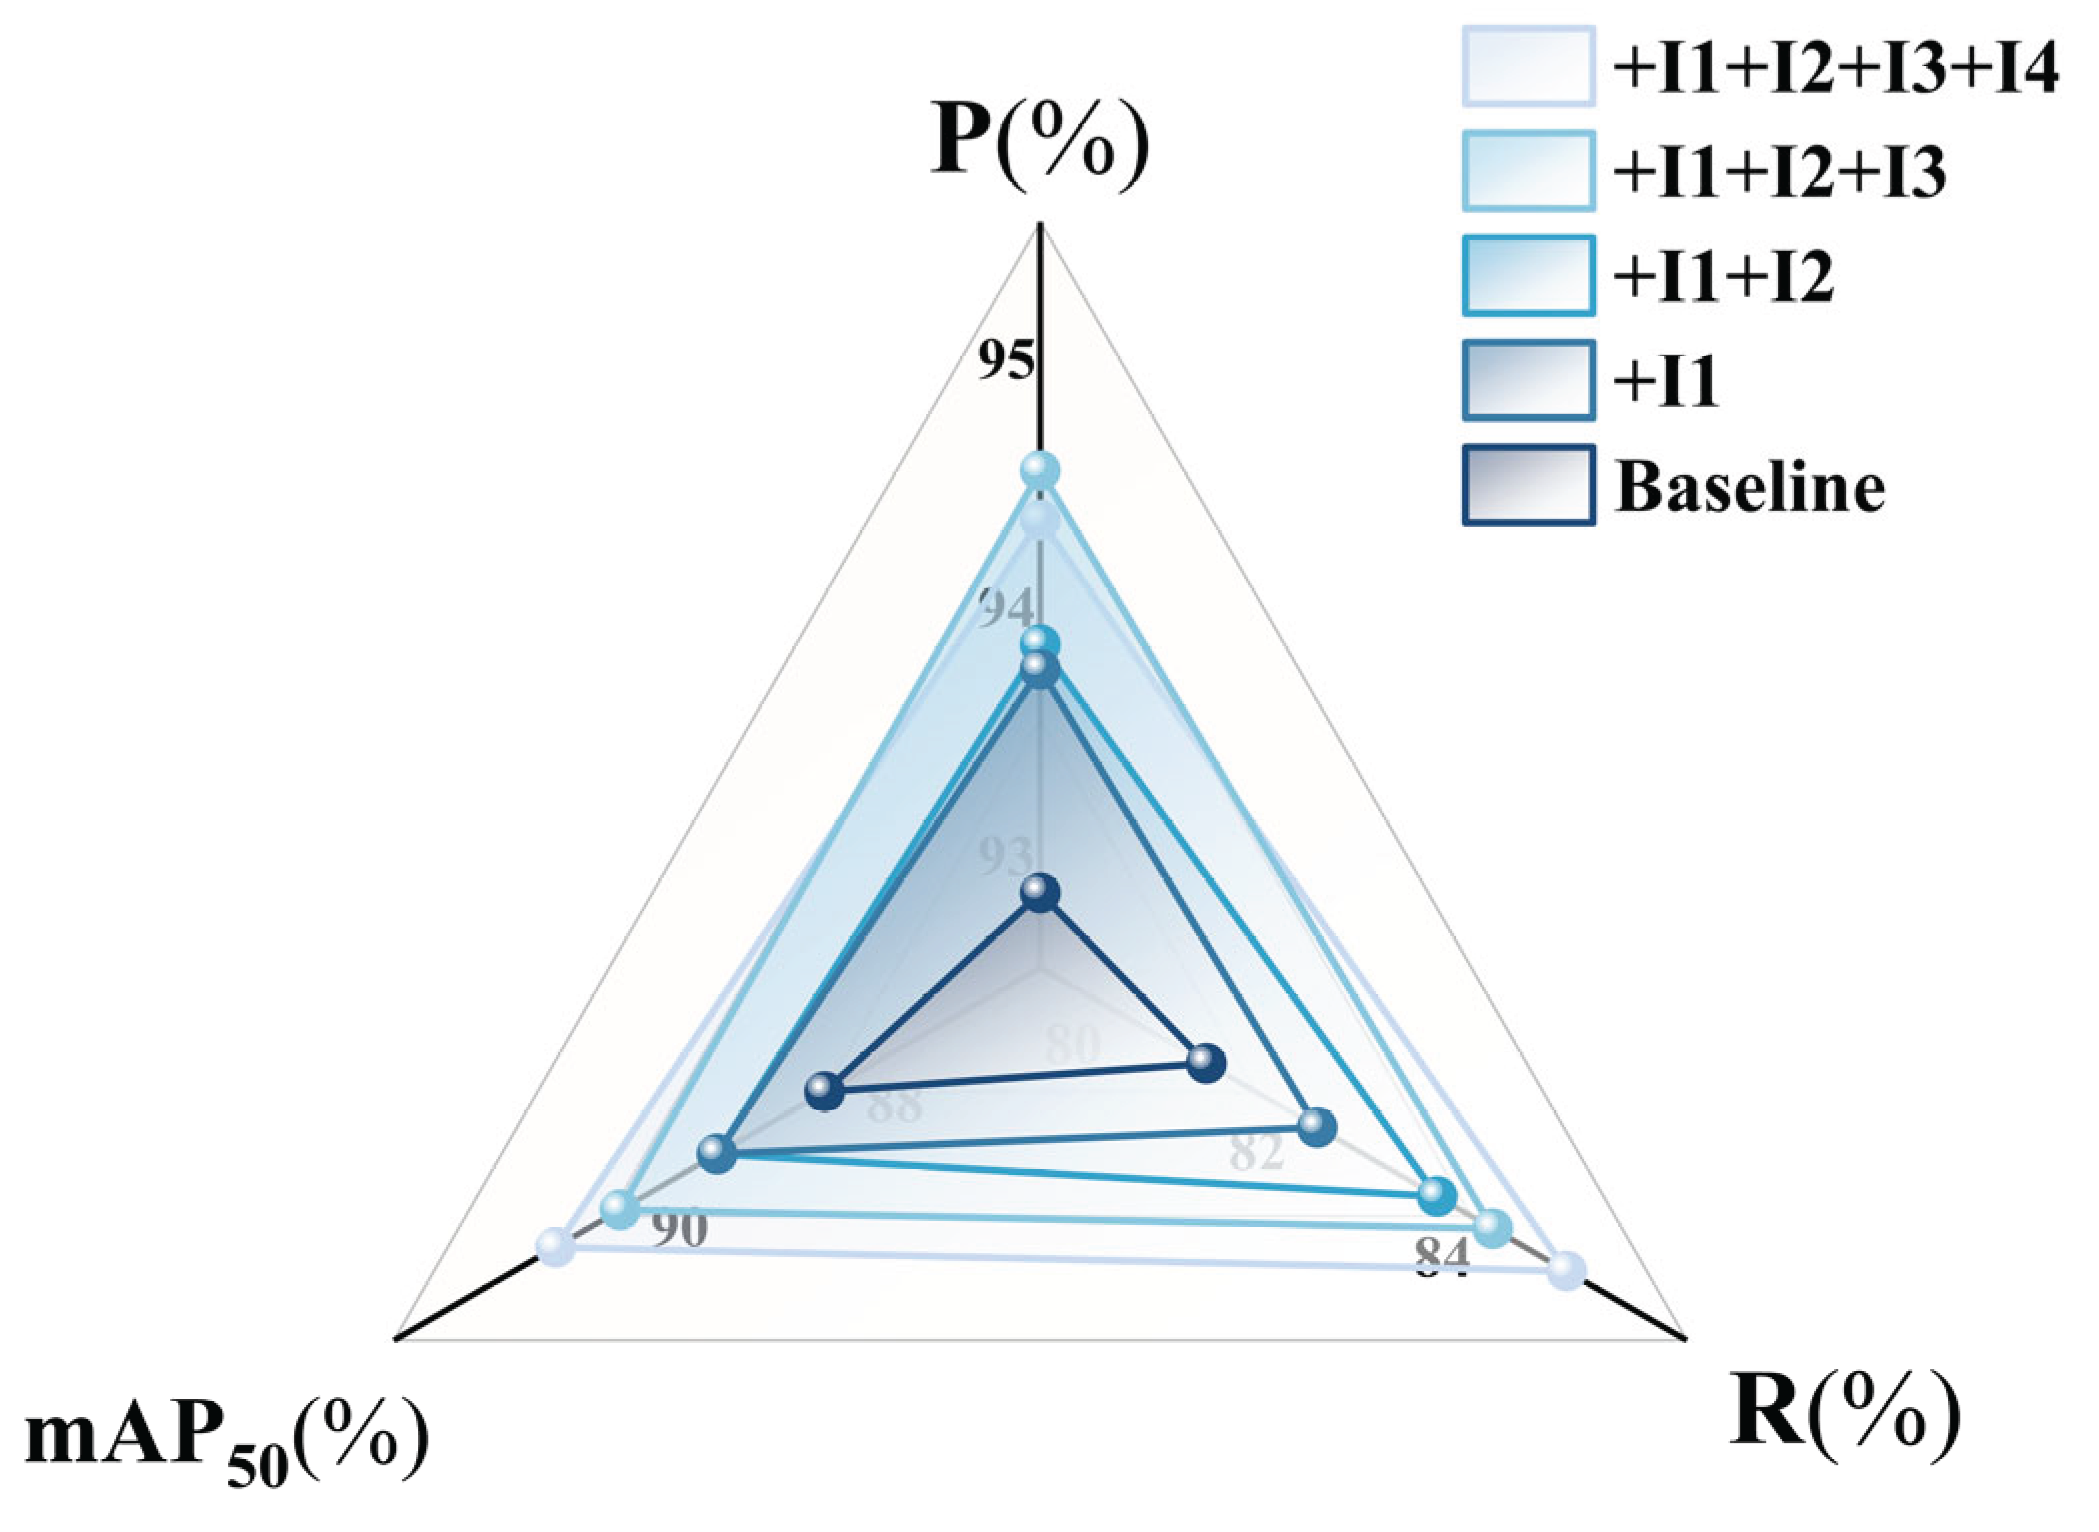
Figure 14.
Comparison of mAP50-95.
3.4.5. Comparison of Classic Models in the YOLO Series
To verify the effectiveness of the improved model, a comparative experiment was conducted with the classic YOLO series models (including YOLOv5n, YOLOv8n, YOLOv9t, etc.). The specific results are presented in Table 5 and Figure 15.
The results show that the improved model YOLO11n-SMSH performs exceptionally well in detection performance. Its mAP50 and mAP50-95 reach 91.5% and 61.3% respectively, which are significantly improved by 2.5% and 2.6% compared to the baseline model. In terms of accuracy indicators, except for mAP50-95 which is slightly lower than YOLOv5s, all other indicators are superior to YOLOv5s. At the same time, YOLO11n-SMSH has a significant advantage in controlling model complexity, with its parameter quantity being only 33.3% of YOLOv5s and its computational cost being only 50.3% of the latter. Comprehensive comparison shows that the accuracy indicators of this model are significantly higher than those of most classic models. Thus, YOLO11n-SMSH achieves a better balance between accuracy and model size, and its overall performance is superior to most YOLO series classic algorithms, demonstrating good practical application value.
3.4.6. Model Generalization Verification
To verify the applicability of the YOLO11n-SMSH model on other public drone datasets, this paper conducts a generalization experiment on the improved model on the Det-Fly dataset. The experimental environment and parameter settings are the same as those in the comparative ablation experiments, and the dataset division is similar to that in the original literature of the Det-Fly dataset. The specific experimental results are shown in Table 6 and Figure 16.
The results show that the improved model has achieved significant improvements in all indicators on the Det-Fly dataset. The precision(P)and recall (R) have increased by 1.3% and 4.2% respectively, while mAP50 and mAP50-95 have increased by 1.6% and 1.8% respectively. This further indicates that the improved model has strong generalization and adaptability across different drone datasets.
3.5. Visualization of Detection Results
To evaluate the actual performance of the YOLO11n-SMSH model in the scenario of unmanned aerial vehicle (UAV) target detection, this paper analyzes the actual detection results of the model for UAVs in different scenarios and compares the detection performance of YOLO11n and YOLO11n-SMSH. At the same time, to make the images more readable, the detection boxes have been enlarged. As can be clearly seen from Figure 17, YOLO11n-SMSH outperforms the YOLO11n baseline model in terms of detection accuracy, handling difficult samples, and resisting interference from noisy images.
In Figure (a), for the same drone target, YOLO11n-SMSH shows higher confidence. As shown in Figure (b), YOLO11n fails to detect distant blurry objects, while YOLO11n-SMSH can successfully identify them with a high degree of confidence. It is worth noting that in Figure (c), YOLO11n mistakenly detects the roof of a building as a drone, while YOLO11n-SMSH can correctly identify it as the background. In conclusion, YOLO11n-SMSH effectively solves the problem of drone target detection in complex backgrounds faced by YOLO11n.
4. Discussion
This paper addresses the problem that in a long-distance and complex environment, the images of unmanned aerial vehicle (UAV) targets present motion blur, small size, and various postures, which greatly restricts the detection effect. To solve this issue, a new UAV target detection model, YOLO11n-SMSH, is proposed. Firstly, a self-developed CRIE module integrating the Sobel operator is introduced into the backbone network, which not only enhances the model's ability to learn image features but also eliminates a large amount of redundant information, strengthening the model's specificity for the specific detection task. Secondly, a SRA-DFF network is independently designed to improve the effect of deep feature extraction, enhancing the semantic correlation between feature expression levels, and significantly improving the interaction and fusion of multi-scale features, providing rich information flow for subsequent detection tasks. Thirdly, an NTTAA detection head is constructed, integrating the weight sharing mechanism [44] and bidirectional parallel task alignment path, which not only strengthens the feature interaction between classification and localization tasks but also effectively reduces the model's parameter quantity. Finally, the GIoU loss function based on spatial coverage is adopted, which not only avoids optimization conflicts caused by dynamic shapes but also eliminates redundant constraints of symmetrical targets, and further suppresses the error propagation of small targets through closure region normalization, thereby improving the model's detection performance for UAV targets.
Experimental results on the DUT Anti-UAV dataset show that the YOLO11n-SMSH model demonstrates superior performance in the UAV target detection task. Compared with the baseline model YOLO11n, YOLO11n-SMSH has achieved significant improvements in all key indicators: the R reaches 85.7% (an increase of 3.9%), mAP50 reaches 91.5% (an increase of 2.5%), and mAP50-95 reaches 61.3% (an increase of 2.6%). These advancements directly reduce the risks of missed detection and false detection, laying a solid foundation for the construction of an efficient and reliable UAV monitoring and countermeasure system. Therefore, YOLO11n-SMSH not only verifies the effectiveness of the proposed improvement modules but also provides strong technical support for the development of more accurate and practical UAV target detection models.
Looking forward to the future, the model structure will be further optimized to further improve the model's detection accuracy and reduce model complexity, pursuing more efficient deployment and application of the model on edge computing devices, making contributions to the improvement of anti-UAV technology.
Author Contributions
Conceptualization, J.Y. and T.G.; methodology, J.Y.; software, J.Y.,J.H.and F.L.; validation, X.L. and Z.W.; formal analysis, J.Y. and J.H.; investigation, J.Y.; resources, T.G.; data curation, J.Y.; writing—original draft preparation, J.Y., T.G. and J.H.; writing—review and editing, J.Y. and T.G.; visualization, J.Y. and J.H.; supervision, J.Y.; project administration, T.G.; funding acquisition, J.Y. All authors have read and agreed to the published version of the manuscript.
Funding
This research was funded by Pre-research topics of the college.
Data Availability Statement
The raw data supporting the conclusions of this article will be made available by the authors on request.
Conflicts of Interest
The authors declare no conflicts of interest.
References
- Ma Wen, Chi Gan Xiaoxuan. Research on the Development of Anti-UAV Technology [J]. Aviation Weaponry, 2020, 27(06): 19-24.
- Mei Tao. Research on the Optical Real-time Precise Detection and Tracking System for Urban Low-altitude Anti-UAV [D]. Central South University, 2023. [CrossRef]
- Sun Yibo. Research on Anti-UAV Detection and Tracking Algorithm Based on YOLOv8 [D]. Xidian University, 2024.
- Analysis of the Application of Anti-UAV Detection and Countermeasures in Radio Spectrum Technology [J]. China Security, 2024, (03): 33-38.
- He J, Liu M, Yu C. UAV reaction detection based on multi-scale feature fusion[C]//2022 International Conference on Image Processing, Computer Vision and Machine Learning (ICICML). IEEE, 2022: 640-643.
- Tan Liang, Zhao Liangjun, Zheng Liping, et al. Research on Anti-UAV Target Detection Algorithm Based on YOLOv5s-AntiUAV [J]. Optoelectronics and Control, 2024, 31(05): 40-45 + 107.
- Wang X, Zhou C, Xie J, et al. Drone detection with visual transformer[C]International Conference on Autonomous Unmanned Systems: Springer, 2021: 2689-2699.
- AlDosari K, Osman A I, Elharrouss O, et al. Drone-type-Set: A benchmark for detecting and tracking drone types using drone models [J]. arXiv preprint arXiv:2405.10398, 2024.
- Yasmine G, Maha G, Hicham M. Anti-drone systems: An attention based improved YOLOv7 model for a real-time detection and identification of multi-airborne target[J]. Intelligent Systems with Applications, 2023, 20: 200296.
- Jiao Lihaohao, Cheng Huanxin. YOLO-DAP: An Improved Anti-UAV Target Detection Algorithm Based on YOLOv8 [J]. Opto-Electronic Engineering and Control, 2025, 32(06): 38-43 + 55.
- Jocher, G.; Chaurasia, A.; Qiu, J. YOLO by Ultralytics. 2023. Available online: https://github.com/ultralytics/ultralytics/blob/main/CITATION.cff (accessed on 30 June 2023).
- J. Zhao, J. Zhang, D. Li and D. Wang, "Vision-Based Anti-UAV Detection and Tracking," in IEEE Transactions on Intelligent Transportation Systems, vol. 23, no. 12, pp. 25323-25334, Dec. 2022. [CrossRef]
- Y. Zheng, Z. Chen, D. Lv, Z. Li, Z. Lan and S. Zhao, "Air-to-Air Visual Detection of Micro-UAVs: An Experimental Evaluation of Deep Learning," in IEEE Robotics and Automation Letters, vol. 6, no. 2, pp. 1020-1027, Apr. 2021. [CrossRef]
- Wu Ge, Zhu Yufan, Jia Zhening. An Improved PCB Surface Defect Detection Method Based on YOLO11 [J/OL]. Electronic Measurement Technology, 1-11 [2025-06-06].
- Wang, A.; Chen, H.; Liu, L.; Chen, K.; Lin, Z.; Han, J.; Ding, G. YOLOv10: Real-Time End-to-End Object Detection. arXiv 2024, arXiv:2405.14458. [CrossRef].
- Jocher, G.; Stoken, A.; Borovec, J.; Chaurasia, A.; Changyu, L.; Hogan, A.; Hajek, J.; Diaconu, L.; Kwon, Y.; Defretin, Y. ultralytics/yolov5:v5. 0-YOLOv5-P6 1280 models, AWS, Supervise. ly and YouTube integrations. Zenodo. Zenodo. 2021. Available online: https://github.com/ultralytics/yolov5 (accessed on 18 May 2020).
- Zhao, H. et al. (2018). PSANet: Point-wise Spatial Attention Network for Scene Parsing. In: Ferrari, V., Hebert, M., Sminchisescu, C., Weiss, Y. (eds) Computer Vision – ECCV 2018. ECCV 2018. Lecture Notes in Computer Science(), vol 11213. Springer, Cham.
- Chollet, F., "Xception: Deep Learning with Depthwise Separable Convolutions", <i>arXiv e-prints</i>, Art. no. arXiv:1610.02357, 2016. [CrossRef]
- LIN T Y, MAIRE M, BELONGIE S, et al. Microsoft coco:Common objects in context[C]// 13th European Conference on Computer Vision, 2014:740-755.
- Zhao, Yian, Lv,et al. DETRs Beat YOLOs on Real-time Object Detection[J]. arXiv,2023.
- Vincent O R, Folorunso O. A descriptive algorithm for Sobel image edge detection [C]/ /Proceedings of the Informing Science & IT Education Conference. Macon: Informing Science Institute, 2009: 97-107.
- Tan, M., Pang, R., and Le, Q. V., "EfficientDet: Scalable and Efficient Object Detection", <i>arXiv e-prints</i>, Art. no. arXiv:1911.09070, 2019. [CrossRef]
- Cai, X., Lai, Q., Wang, Y., Wang, W., Sun, Z., and Yao, Y., "Poly Kernel Inception Network for Remote Sensing Detection", <i>arXiv e-prints</i>, Art. no. arXiv:2403.06258, 2024. [CrossRef]
- Wang, C.-Y., Yeh, I.-H., and Liao, H.-Y. M., "YOLOv9: Learning What You Want to Learn Using Programmable Gradient Information", <i>arXiv e-prints</i>, Art. no. arXiv:2402.13616, 2024. [CrossRef]
- He, K., Zhang, X., Ren, S., and Sun, J., "Deep Residual Learning for Image Recognition", in <i>2016 IEEE Conference on Computer Vision and Pattern Recognition (CVPR)</i>, 2016, Art.no.1. [CrossRef]
- LIU S, HUANG D, WANG Y. Learning spatial fusion for single-shot object detection [J]. arXiv: 1911.09516, 2019.
- Zhang Shuai, Wang Baotao, Tu Jiayi, et al. SCE-YOLO: An Improved Lightweight UAV Vision Detection Algorithm [J/OL]. Computer Engineering and Applications, 1-14 [2025-06-24].
- Feng, C., Zhong, Y., Gao, Y., Scott, M. R., and Huang, W., "TOOD: Task-aligned One-stage Object Detection", <i>arXiv e-prints</i>, Art. no. arXiv:2108.07755, 2021. [CrossRef]
- Wu, Y. and He, K., "Group Normalization", <i>arXiv e-prints</i>, Art. no. arXiv:1803.08494, 2018. [CrossRef]
- ZHENG Z H, WANG P, LIU W, et al. Distance-IoU loss: Faster and Better Learning for Bounding Box Regression [C]// Proceedings of the AAAI conference on artificial intelligence,New York: AAAI, 2020: 12993-13000.
- REZATOFIGHI H, HAMID T, NATHAN G, et al. Generalized Intersection over Union: A Metric and a Loss for Bounding Box Regression[C]// Proceedings of the IEEE International Conference on Computer Vision, Long Beach: IEEE, 2019: 658-666.
- Fang Zhengbo, Gao Xiangyang, Zhang Xieshi, et al. Underwater Object Detection Model Based on Improved YOLO11 [J/OL] Electronic Measurement Technology, 1-10 [2025-05-15].
- Xia Shufang, Yin Haonan, Qu Zhong. ETF-YOLO11n: Multi-scale Feature Fusion Object Detection Method for Traffic Images [J/OL]. Computer Science, 1-10 [2025-05-15].
- Zhang Zemin, Meng Xiangyin, Wang Zizhou, et al. YOLO11-LG: Glassware Detection Combining Boundary Enhancement Method [J]. Computer Engineering and Applications, 2025.
- Li Bin, Li Shenglin. Improved YOLOv11n Algorithm for Small Object Detection in Unmanned Aerial Vehicles [J]. Computer Engineering and Applications, 2025, 61.
- Tian, Y., Ye, Q., and Doermann, D., “YOLOv12: Attention-Centric Real-Time Object Detectors”, <i>arXiv e-prints</i>, Art. no. arXiv:2502.12524, 2025. [CrossRef]
- Zhao, Y., “DETRs Beat YOLOs on Real-time Object Detection”, <i>arXiv e-prints</i>, Art. no. arXiv:2304.08069, 2023. [CrossRef]
- Zhang, H., Xu, C., and Zhang, S., “Inner-IoU: More Effective Intersection over Union Loss with Auxiliary Bounding Box”, <i>arXiv e-prints</i>, Art. no. arXiv:2311.02877, 2023. [CrossRef]
- Zhang, H. and Zhang, S., “Shape-IoU: More Accurate Metric considering Bounding Box Shape and Scale”, <i>arXiv e-prints</i>, Art. no. arXiv:2312.17663, 2023. [CrossRef]
- Zhang, H. and Zhang, S., “Focaler-IoU: More Focused Intersection over Union Loss”, <i>arXiv e-prints</i>, Art. no. arXiv:2401.10525, 2024. [CrossRef]
- Ma, S. and Xu, Y., “MPDIoU: A Loss for Efficient and Accurate Bounding Box Regression”, <i>arXiv e-prints</i>, Art. no. arXiv:2307.07662, 2023. [CrossRef]
- Tong, Z., Chen, Y., Xu, Z., and Yu, R., “Wise-IoU: Bounding Box Regression Loss with Dynamic Focusing Mechanism”, <i>arXiv e-prints</i>, Art. no. arXiv:2301.10051, 2023. [CrossRef]
- Gevorgyan, Z., “SIoU Loss: More Powerful Learning for Bounding Box Regression”, <i>arXiv e-prints</i>, Art. no. arXiv:2205.12740, 2022. [CrossRef]
- Zhang, Y., “Deeper Insights into Weight Sharing in Neural Architecture Search”, <i>arXiv e-prints</i>, Art. no. arXiv:2001.01431, 2020. [CrossRef]
Figure 1.
YOLO11 Network structure.
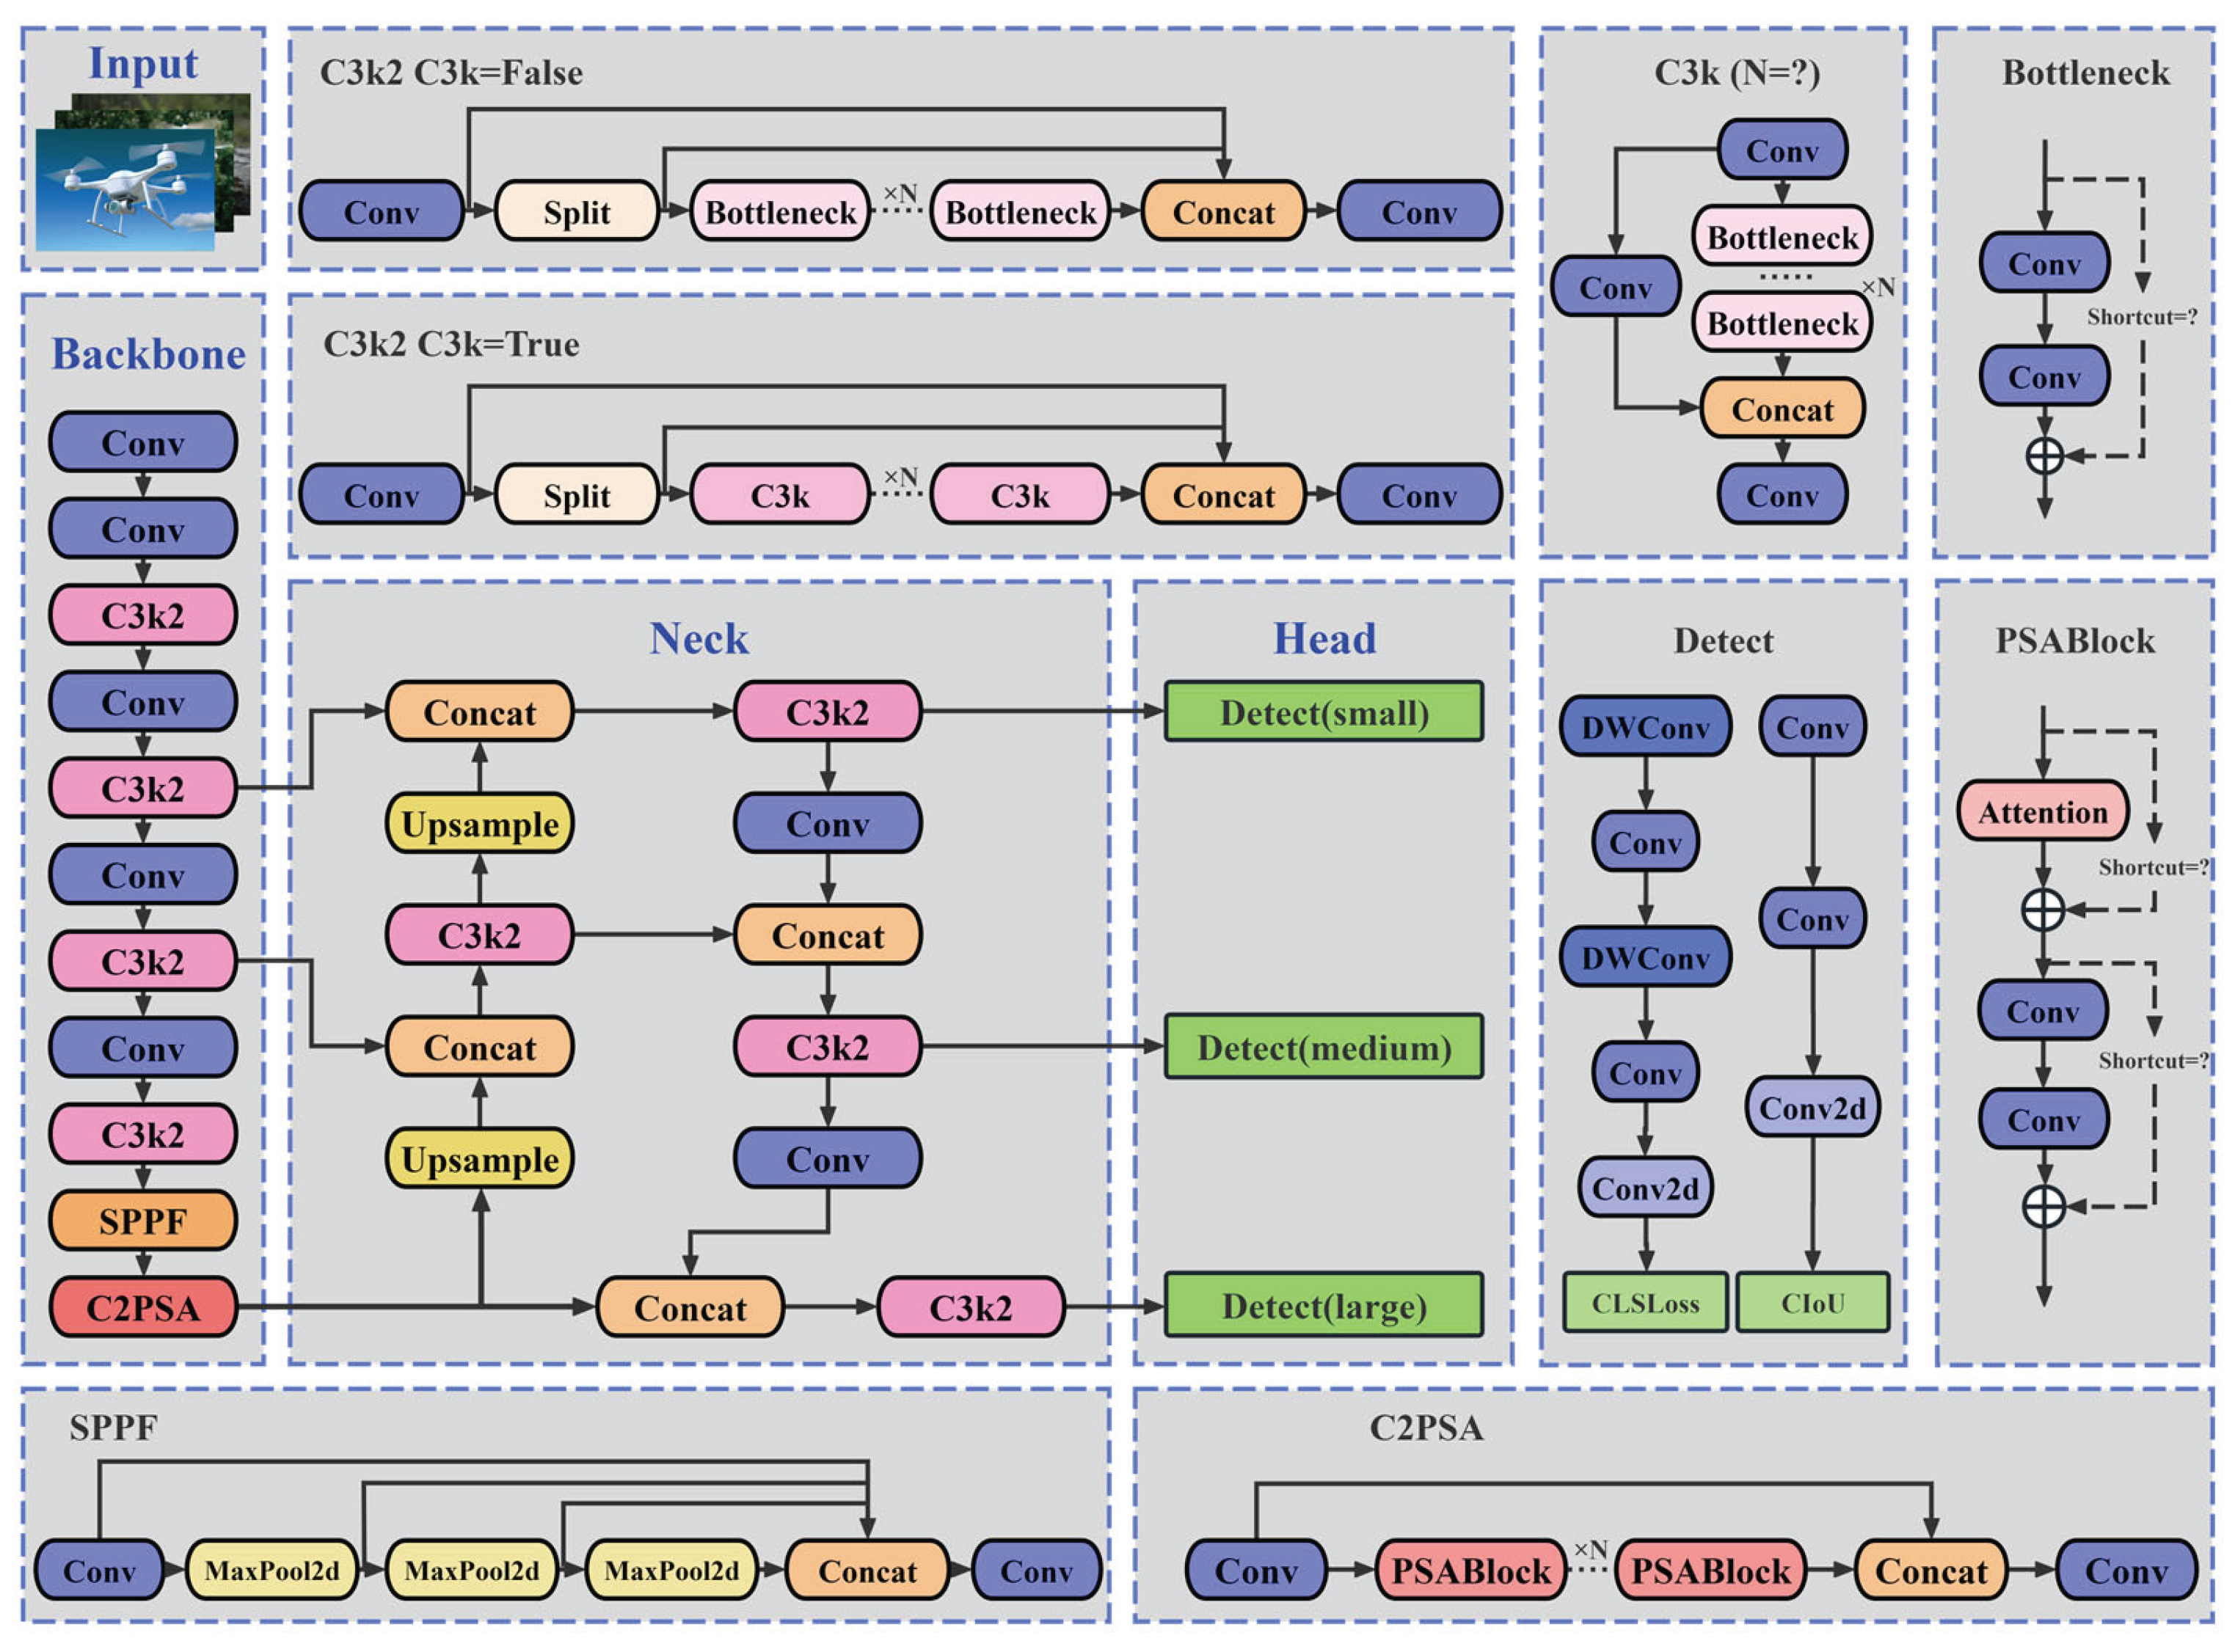
Figure 2.
YOLO11n-SMSH Network structure.
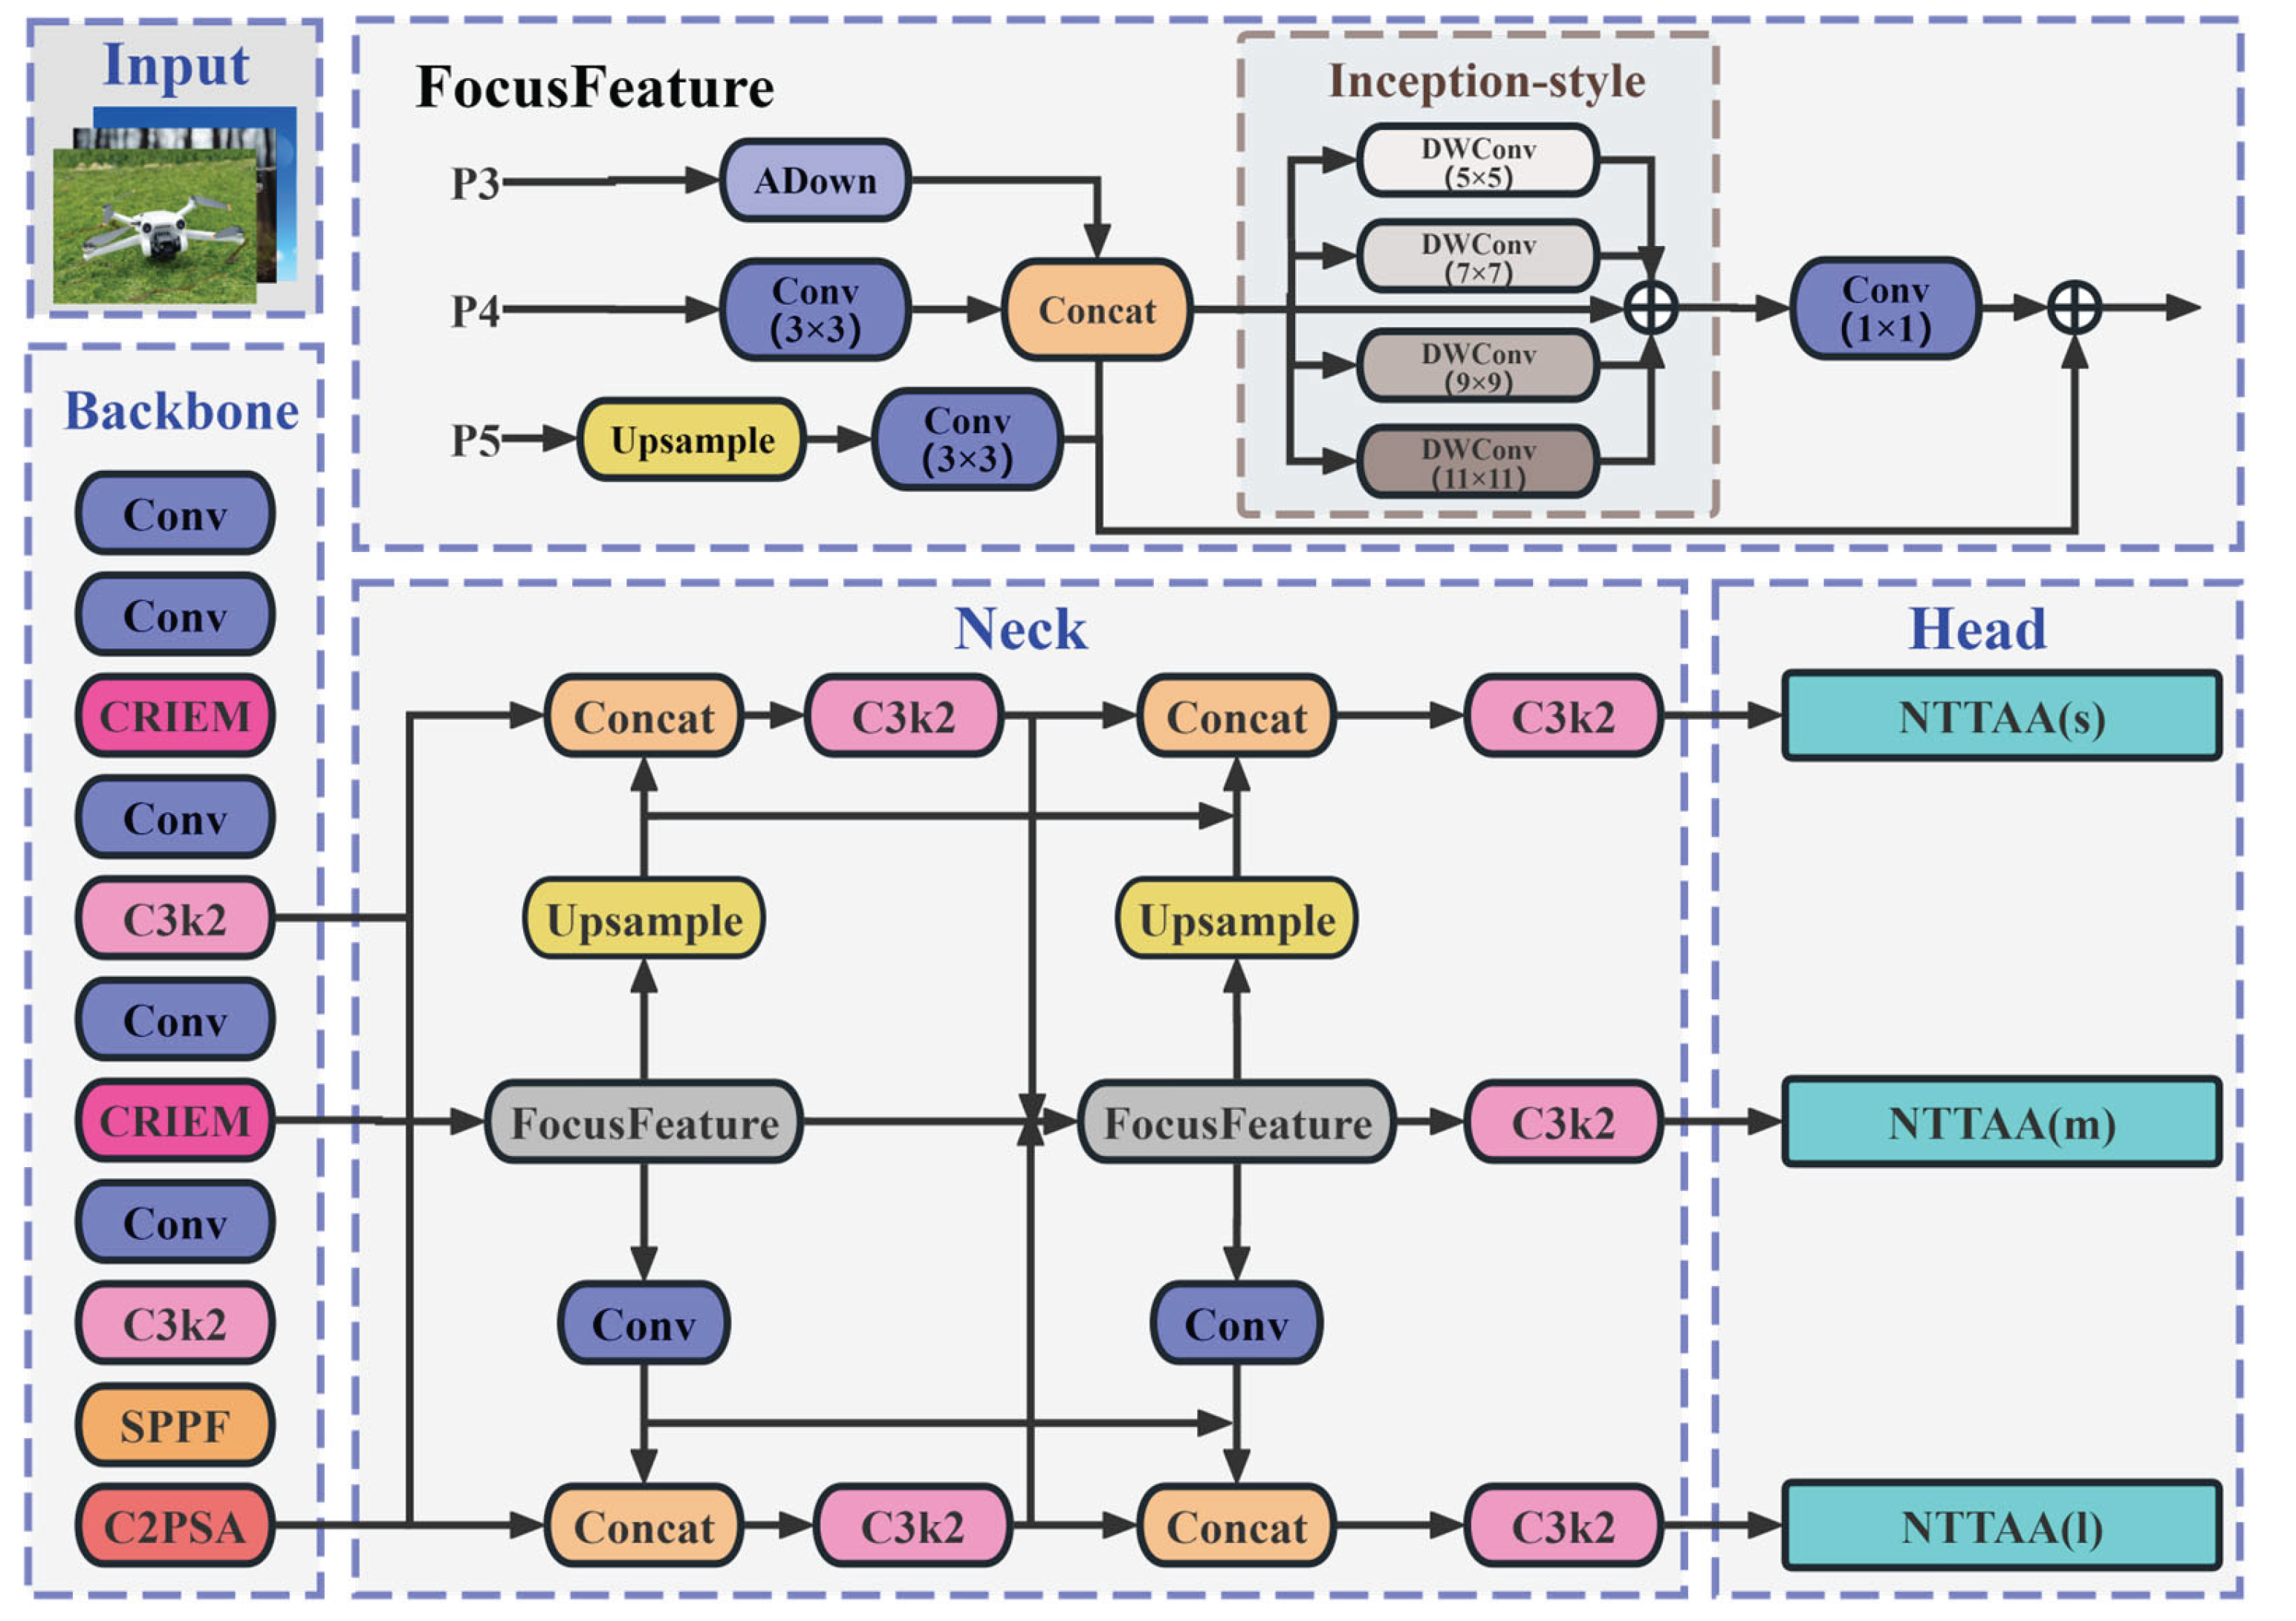
Figure 3.
The architecture of the CRIE module.
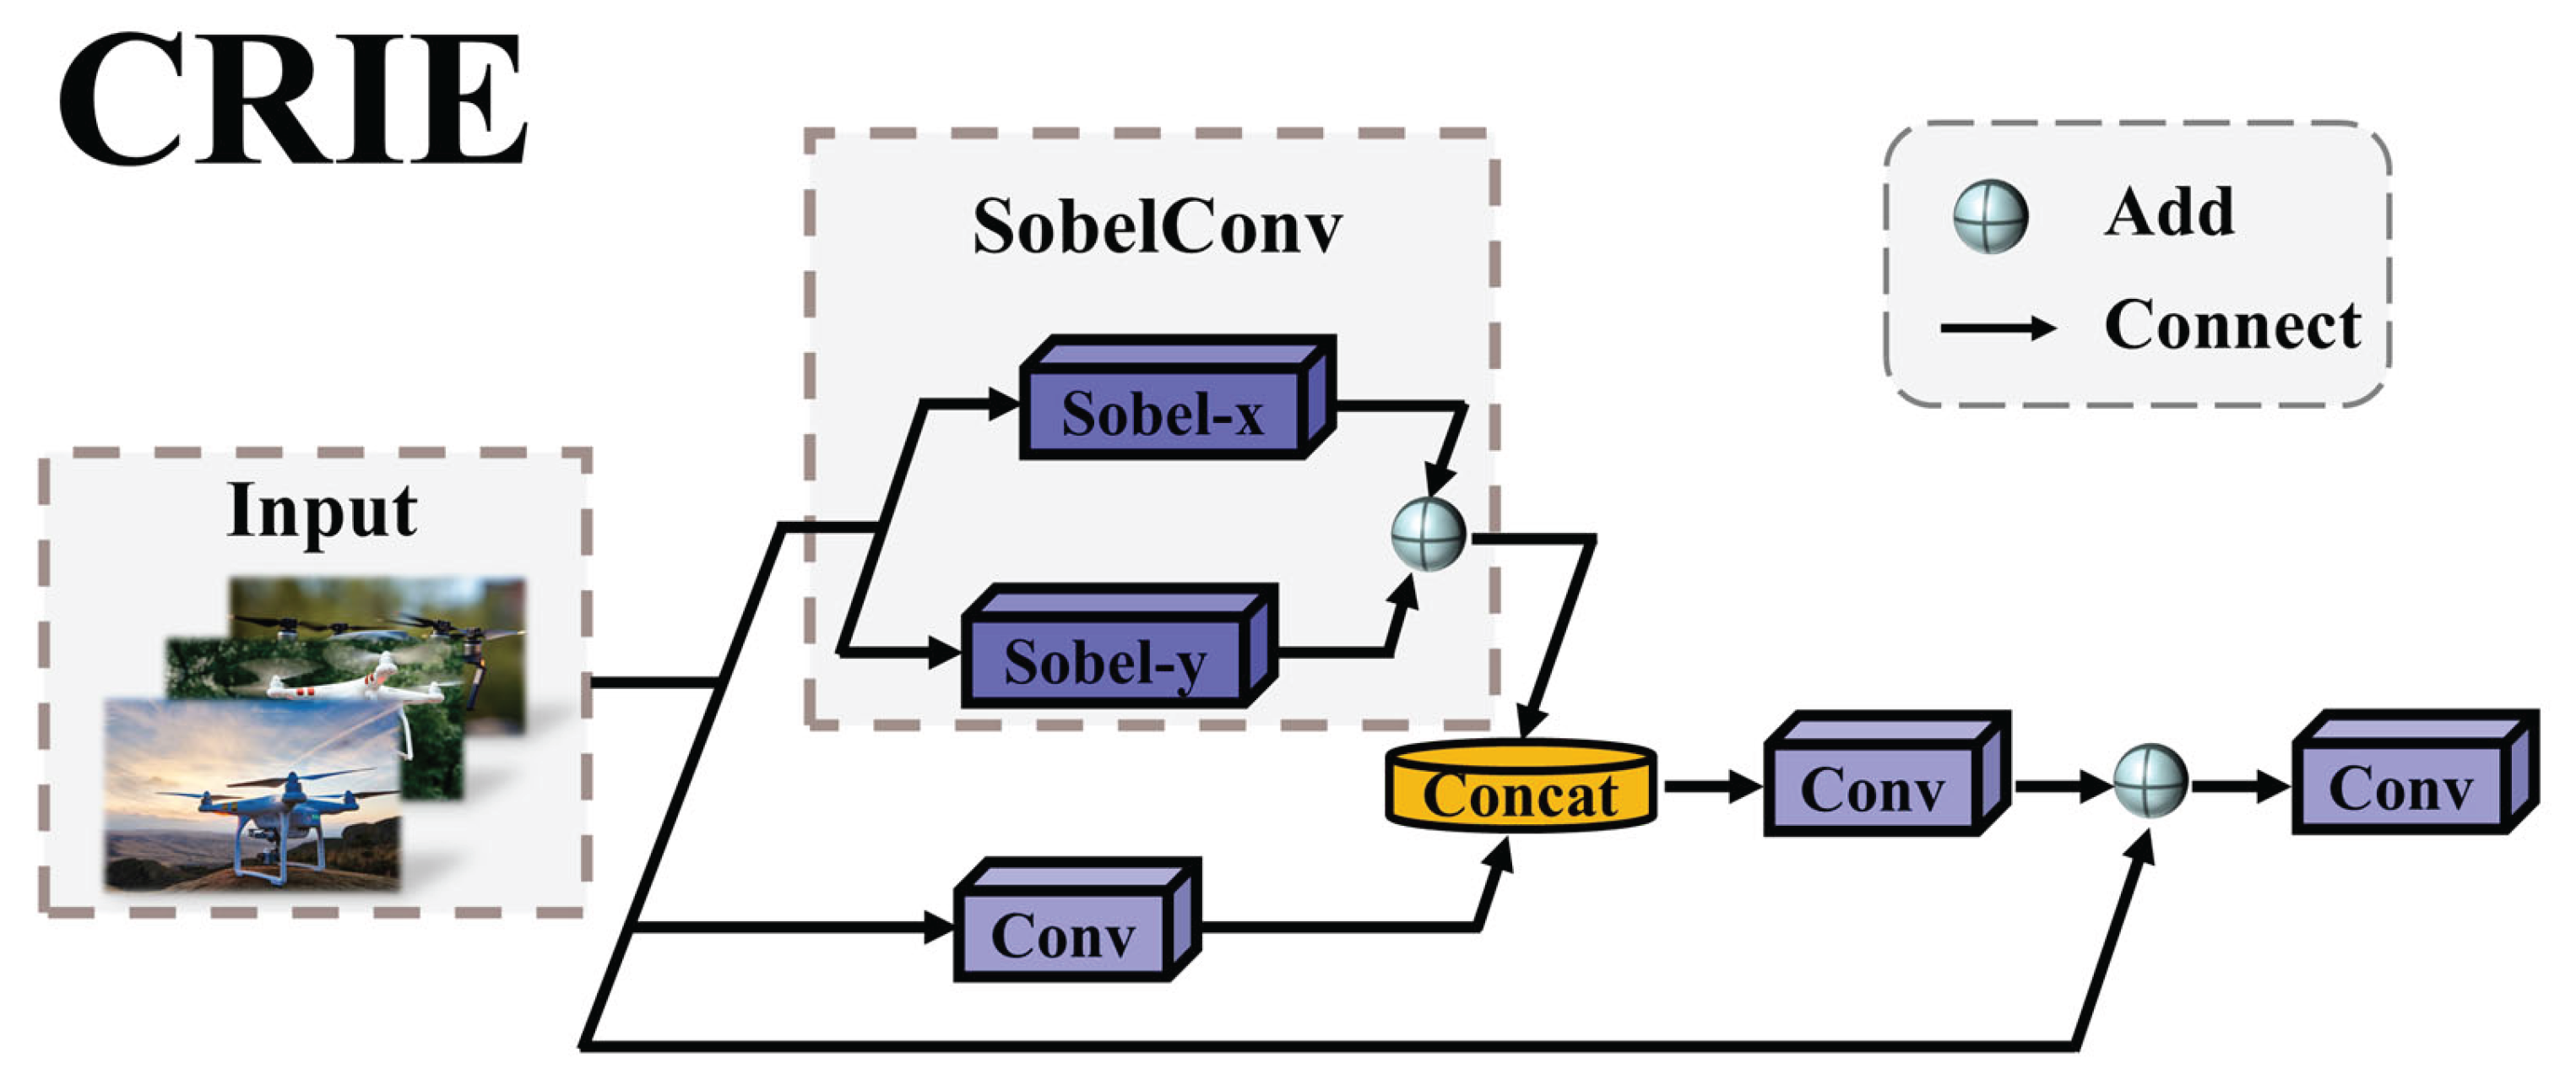
Figure 4.
The architecture of the SRA-DFF Network.
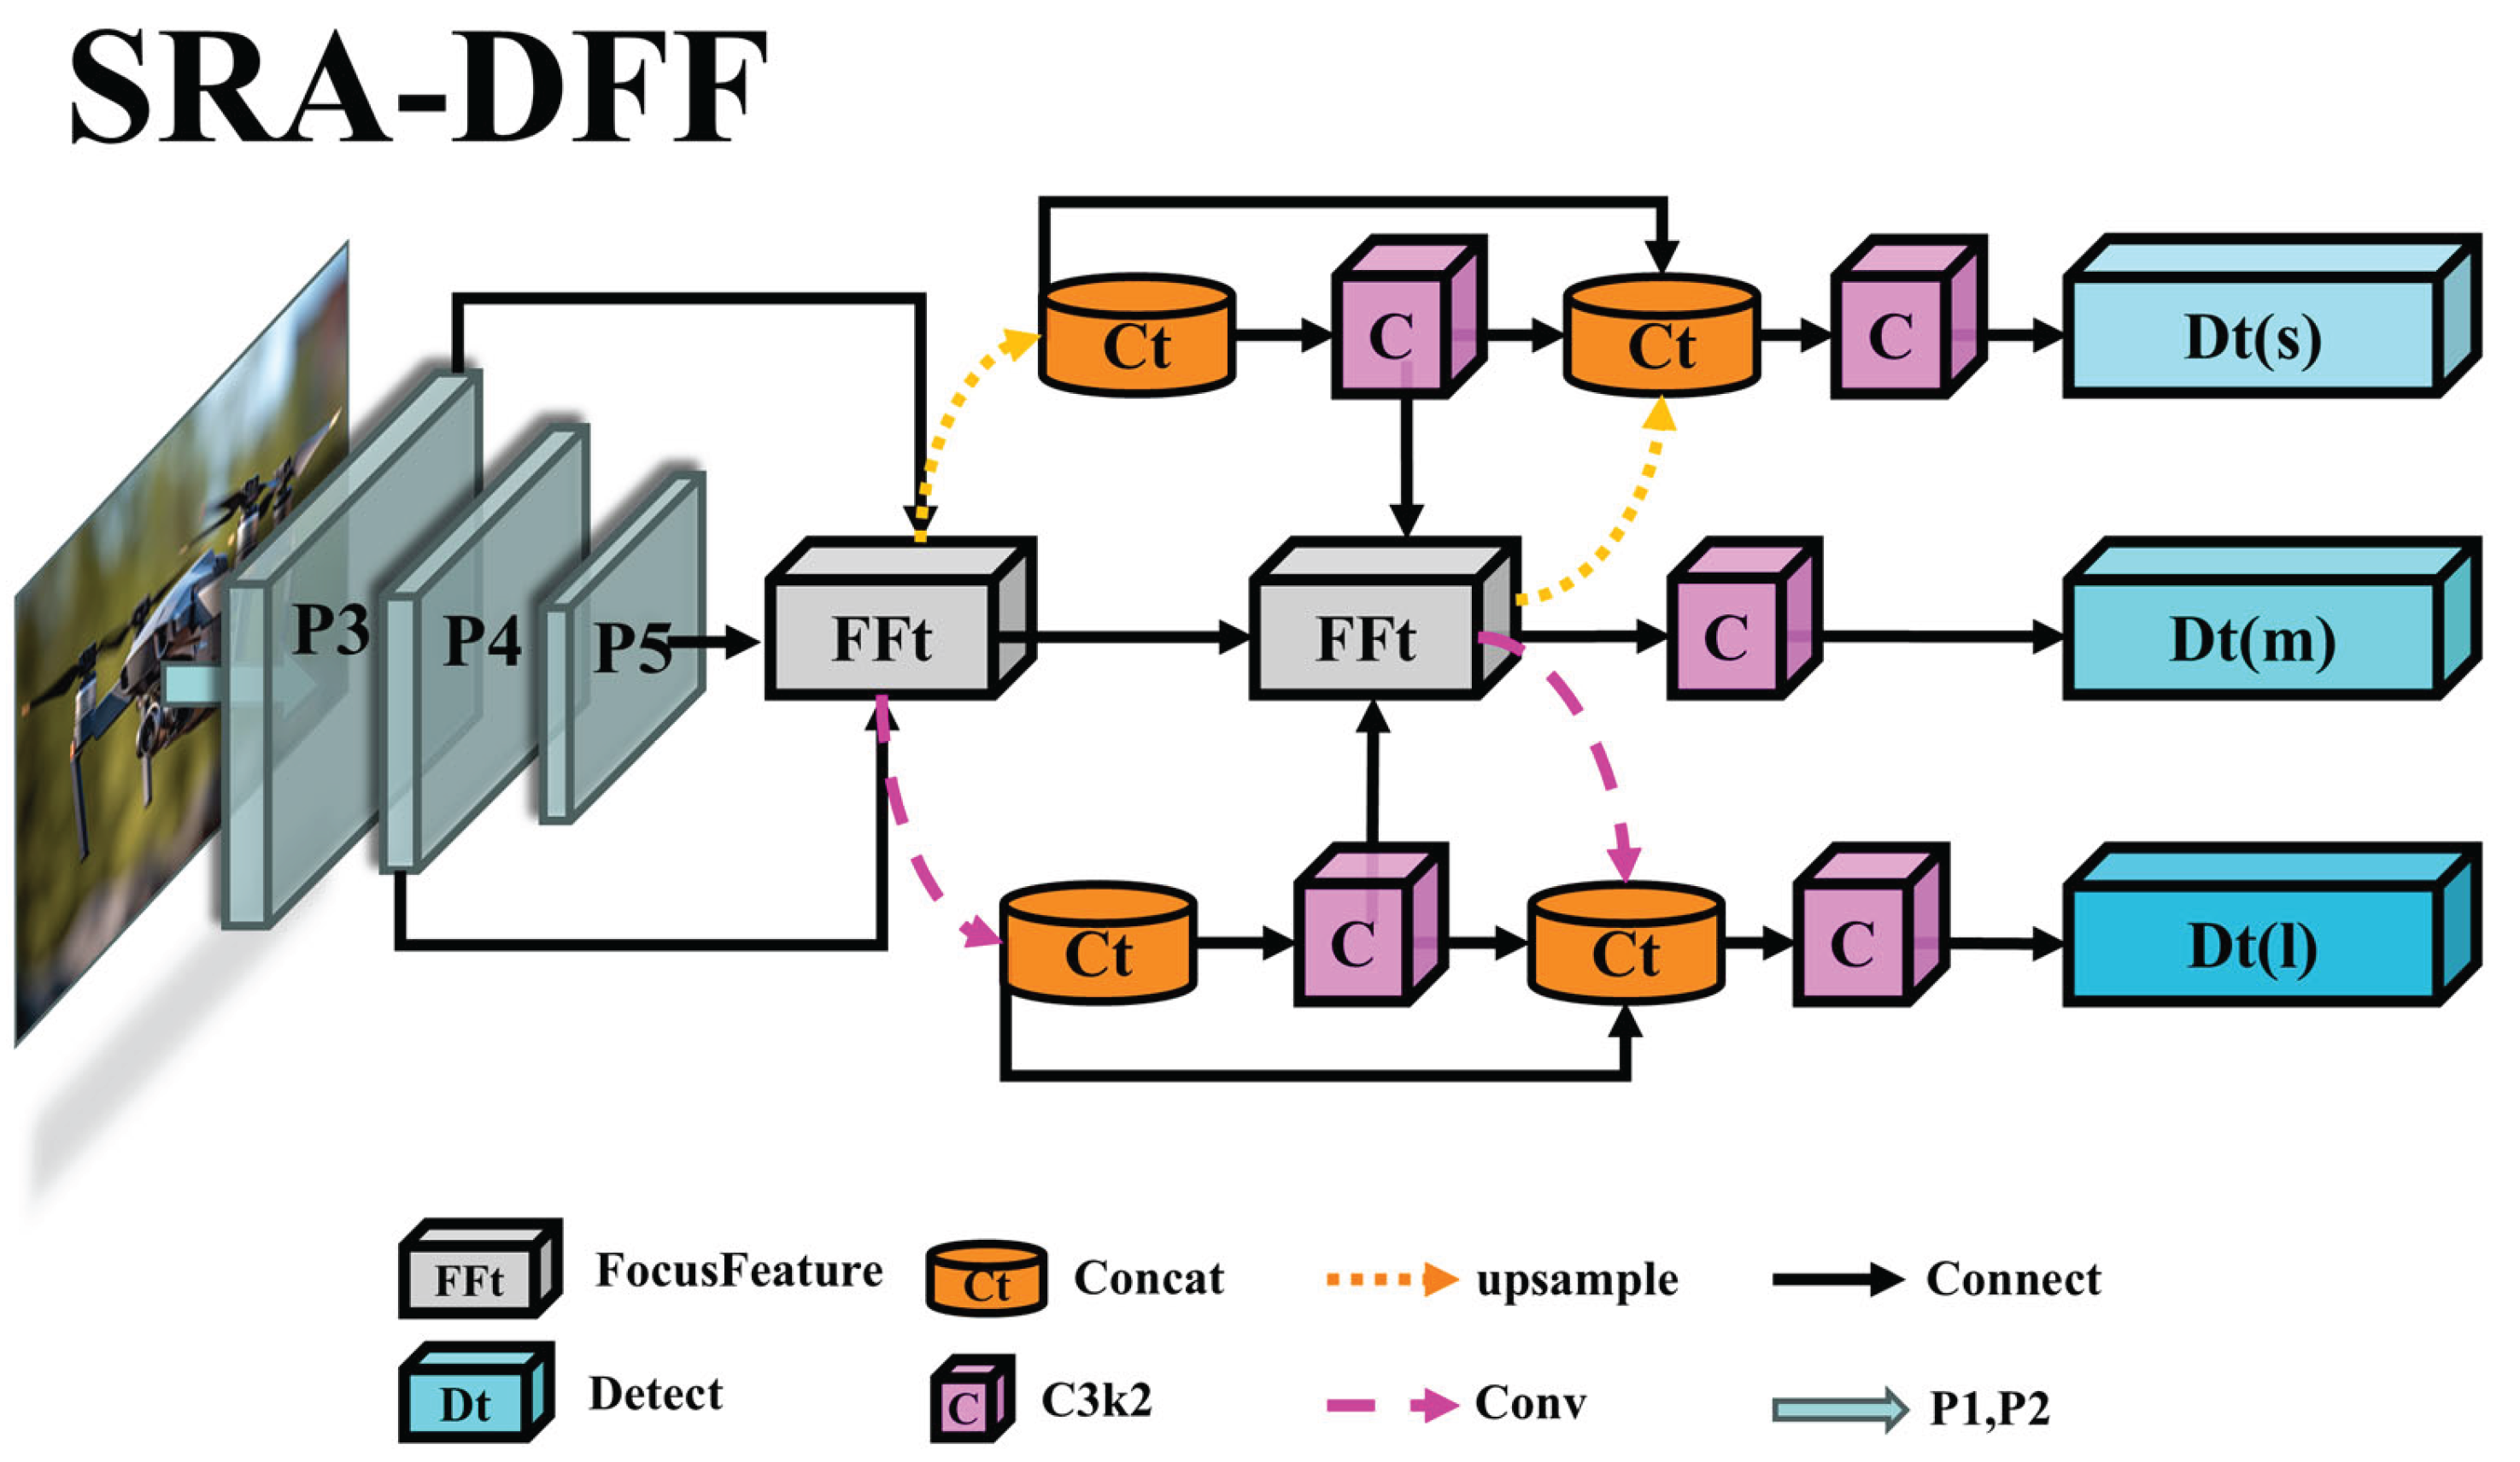
Figure 5.
The architecture of the FFt module.
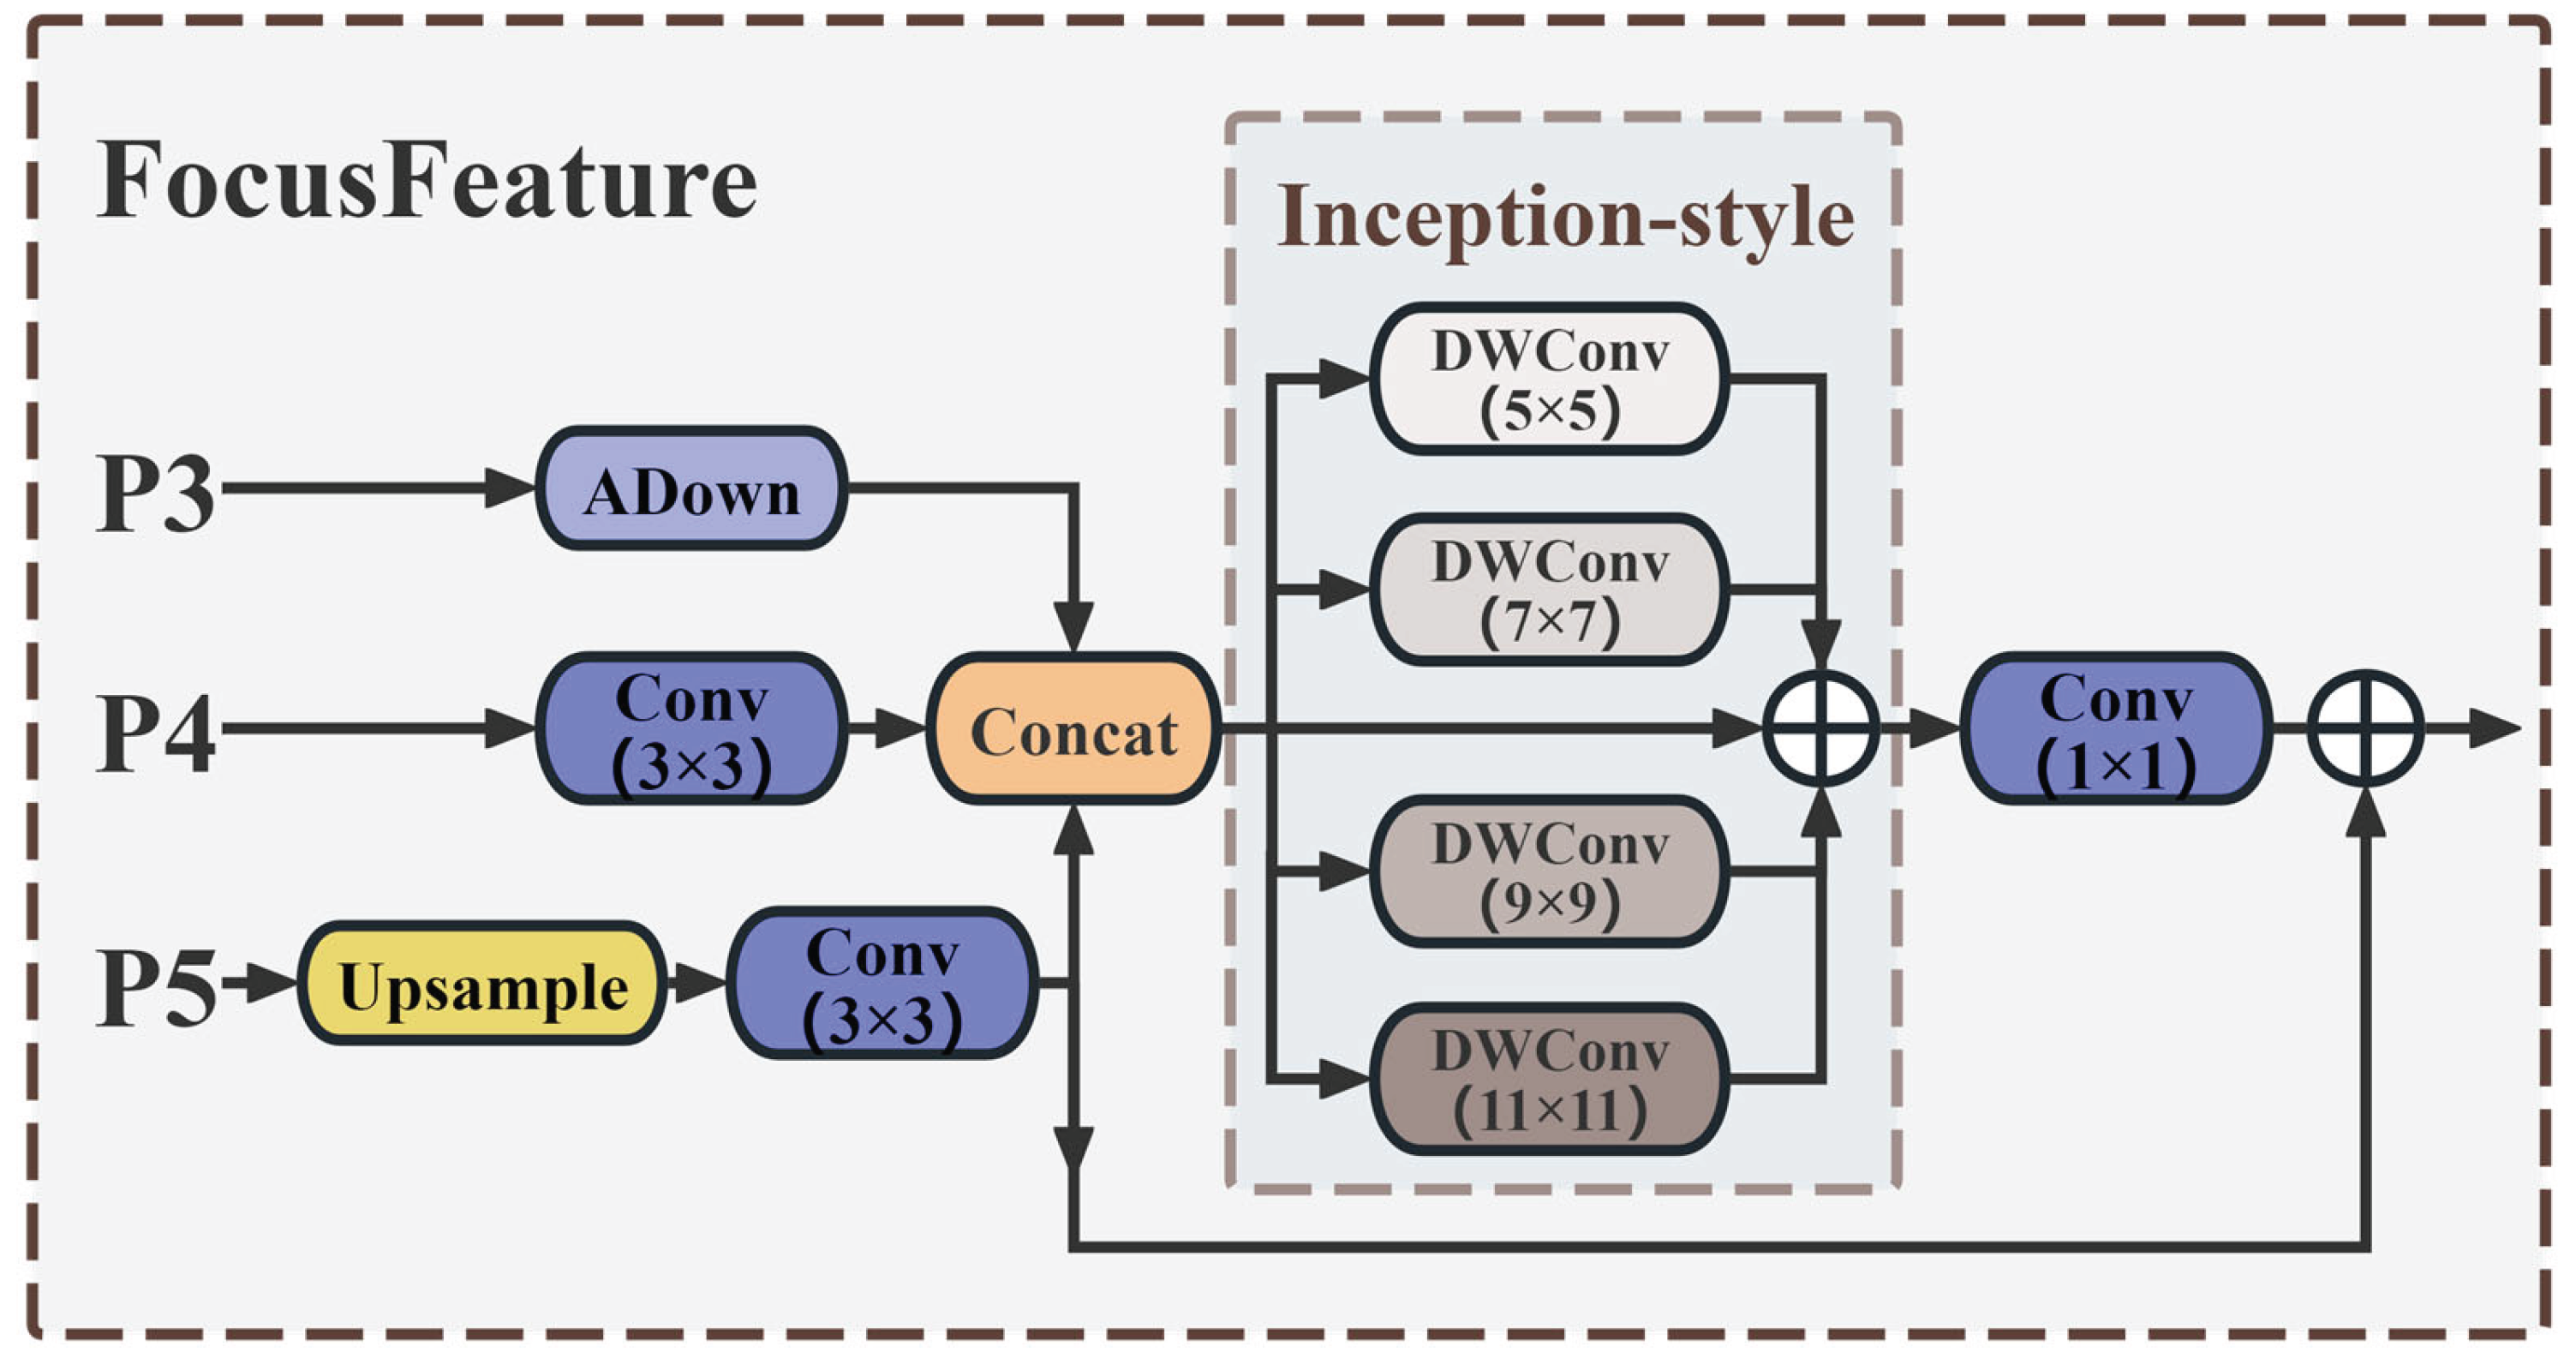
Figure 6.
The structure of NTTAA Detection Head.
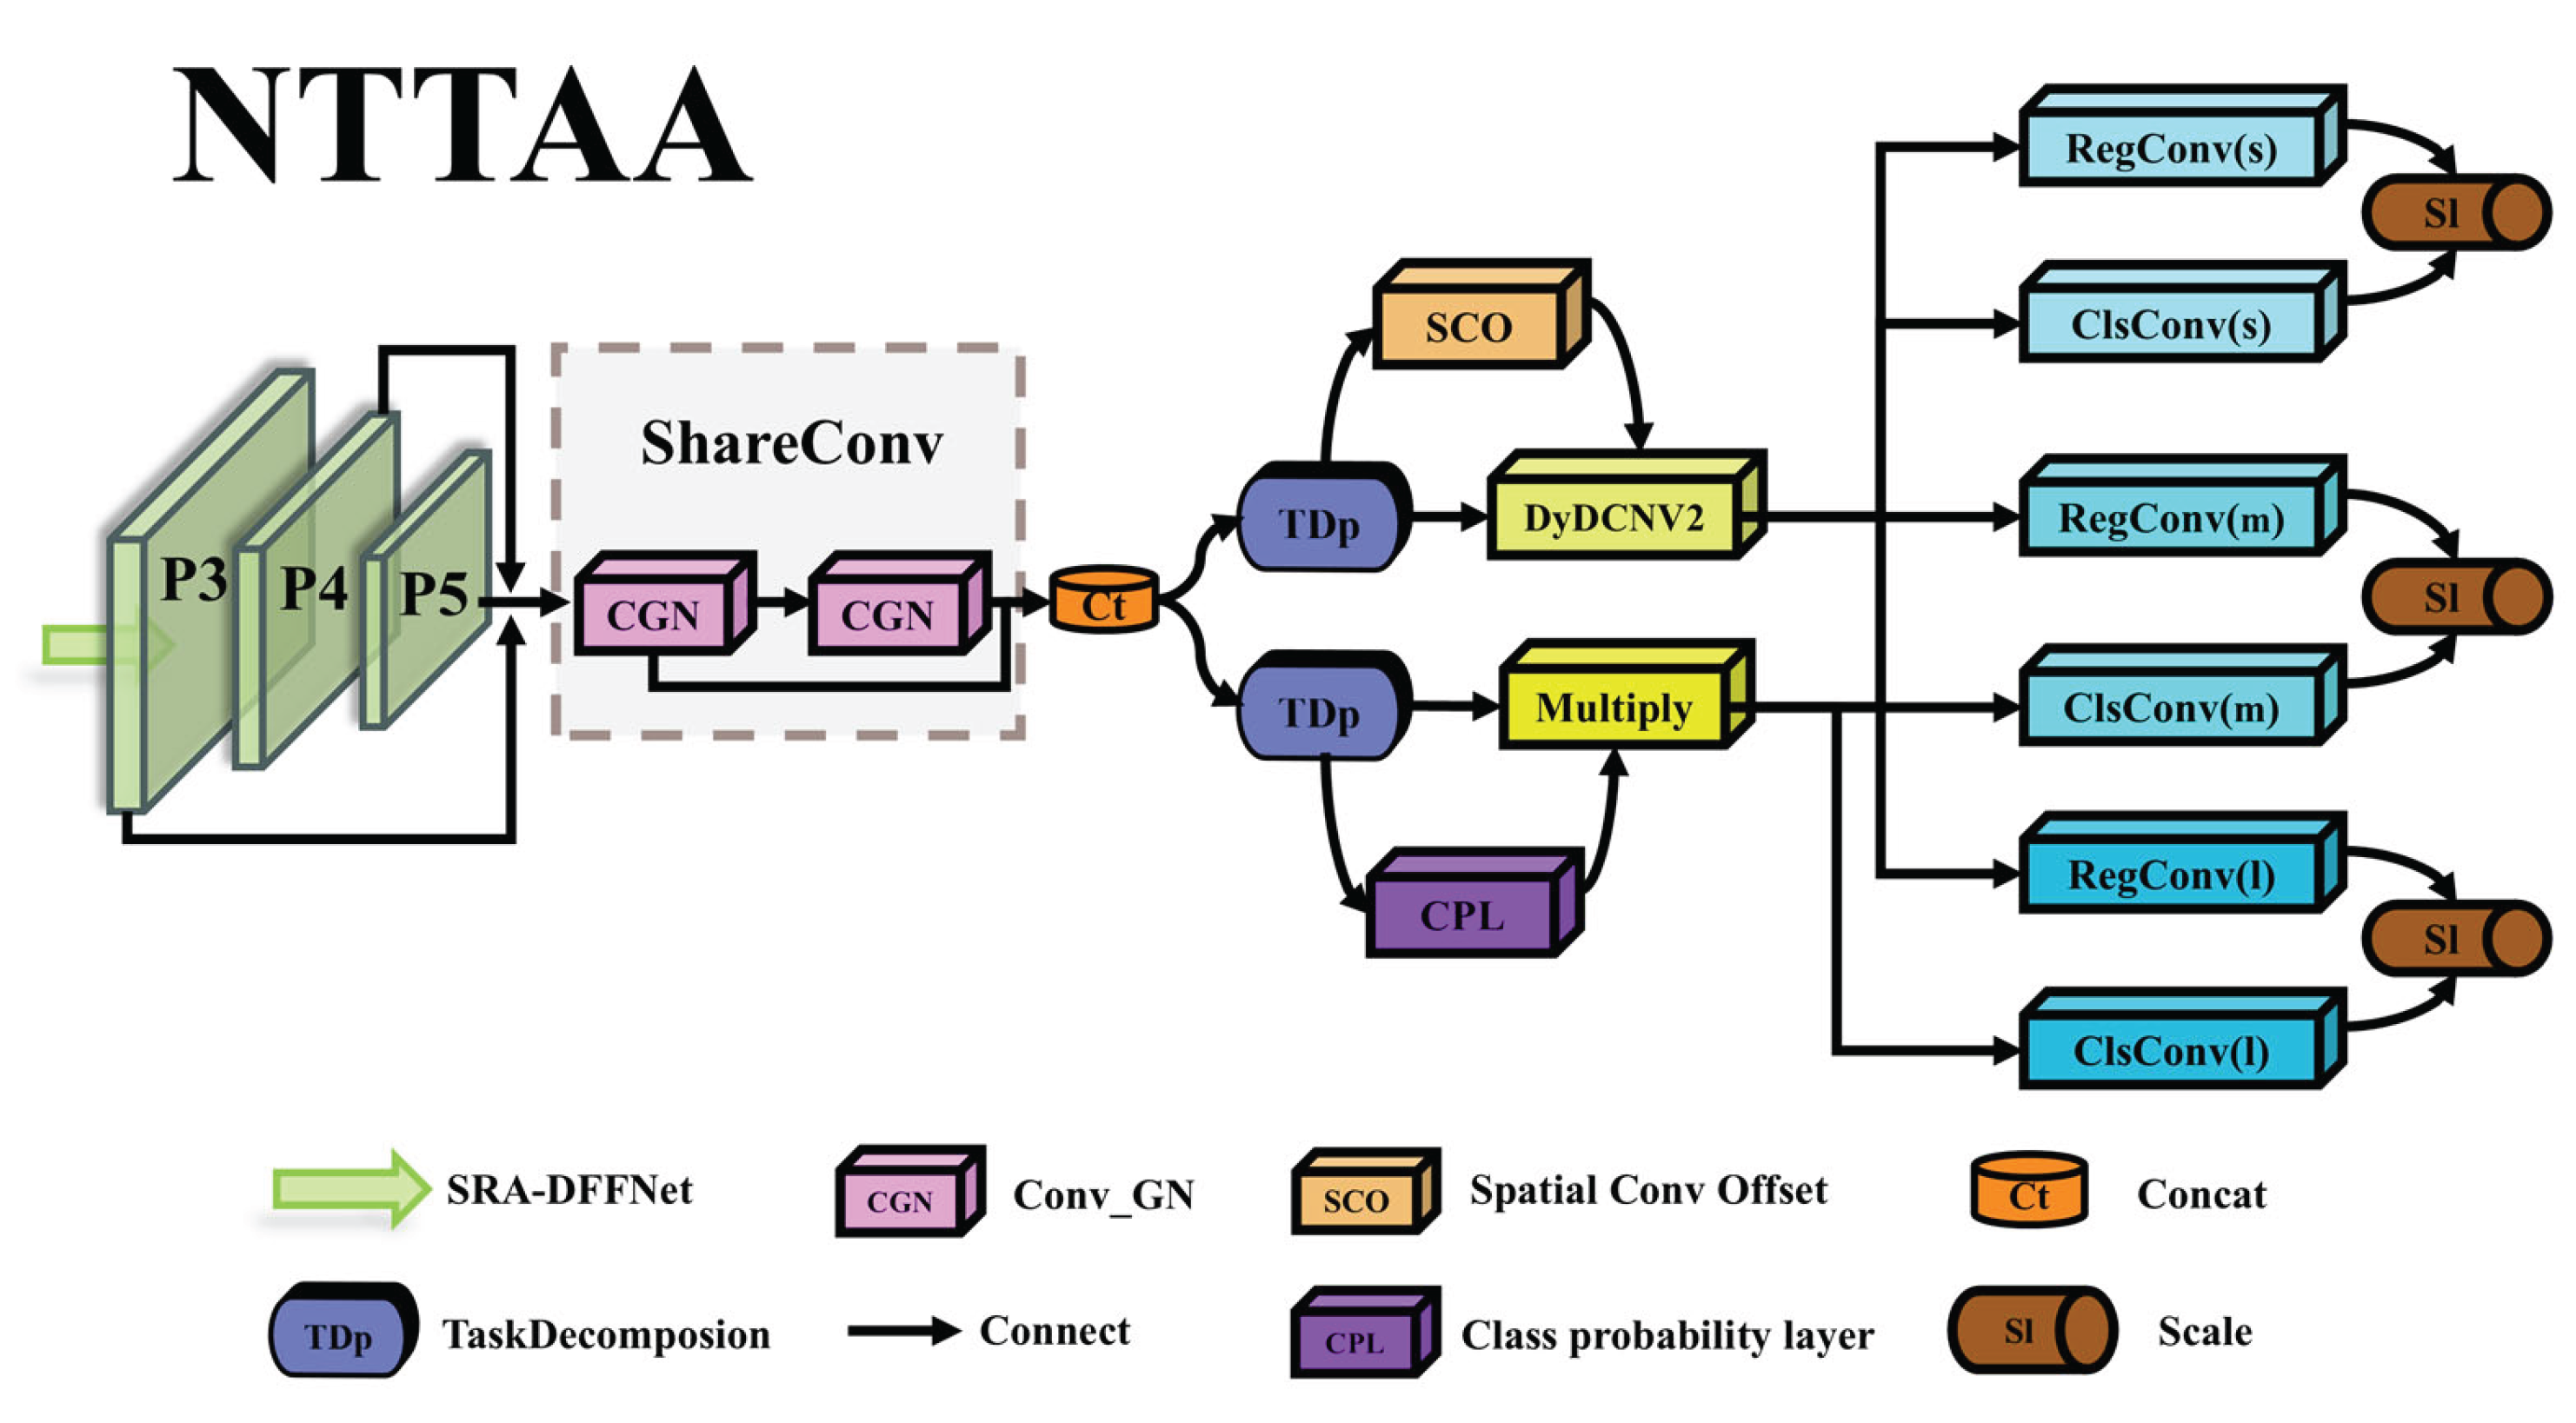
Figure 9.
Examples of the detection images of DUT Anti-UAV dataset.
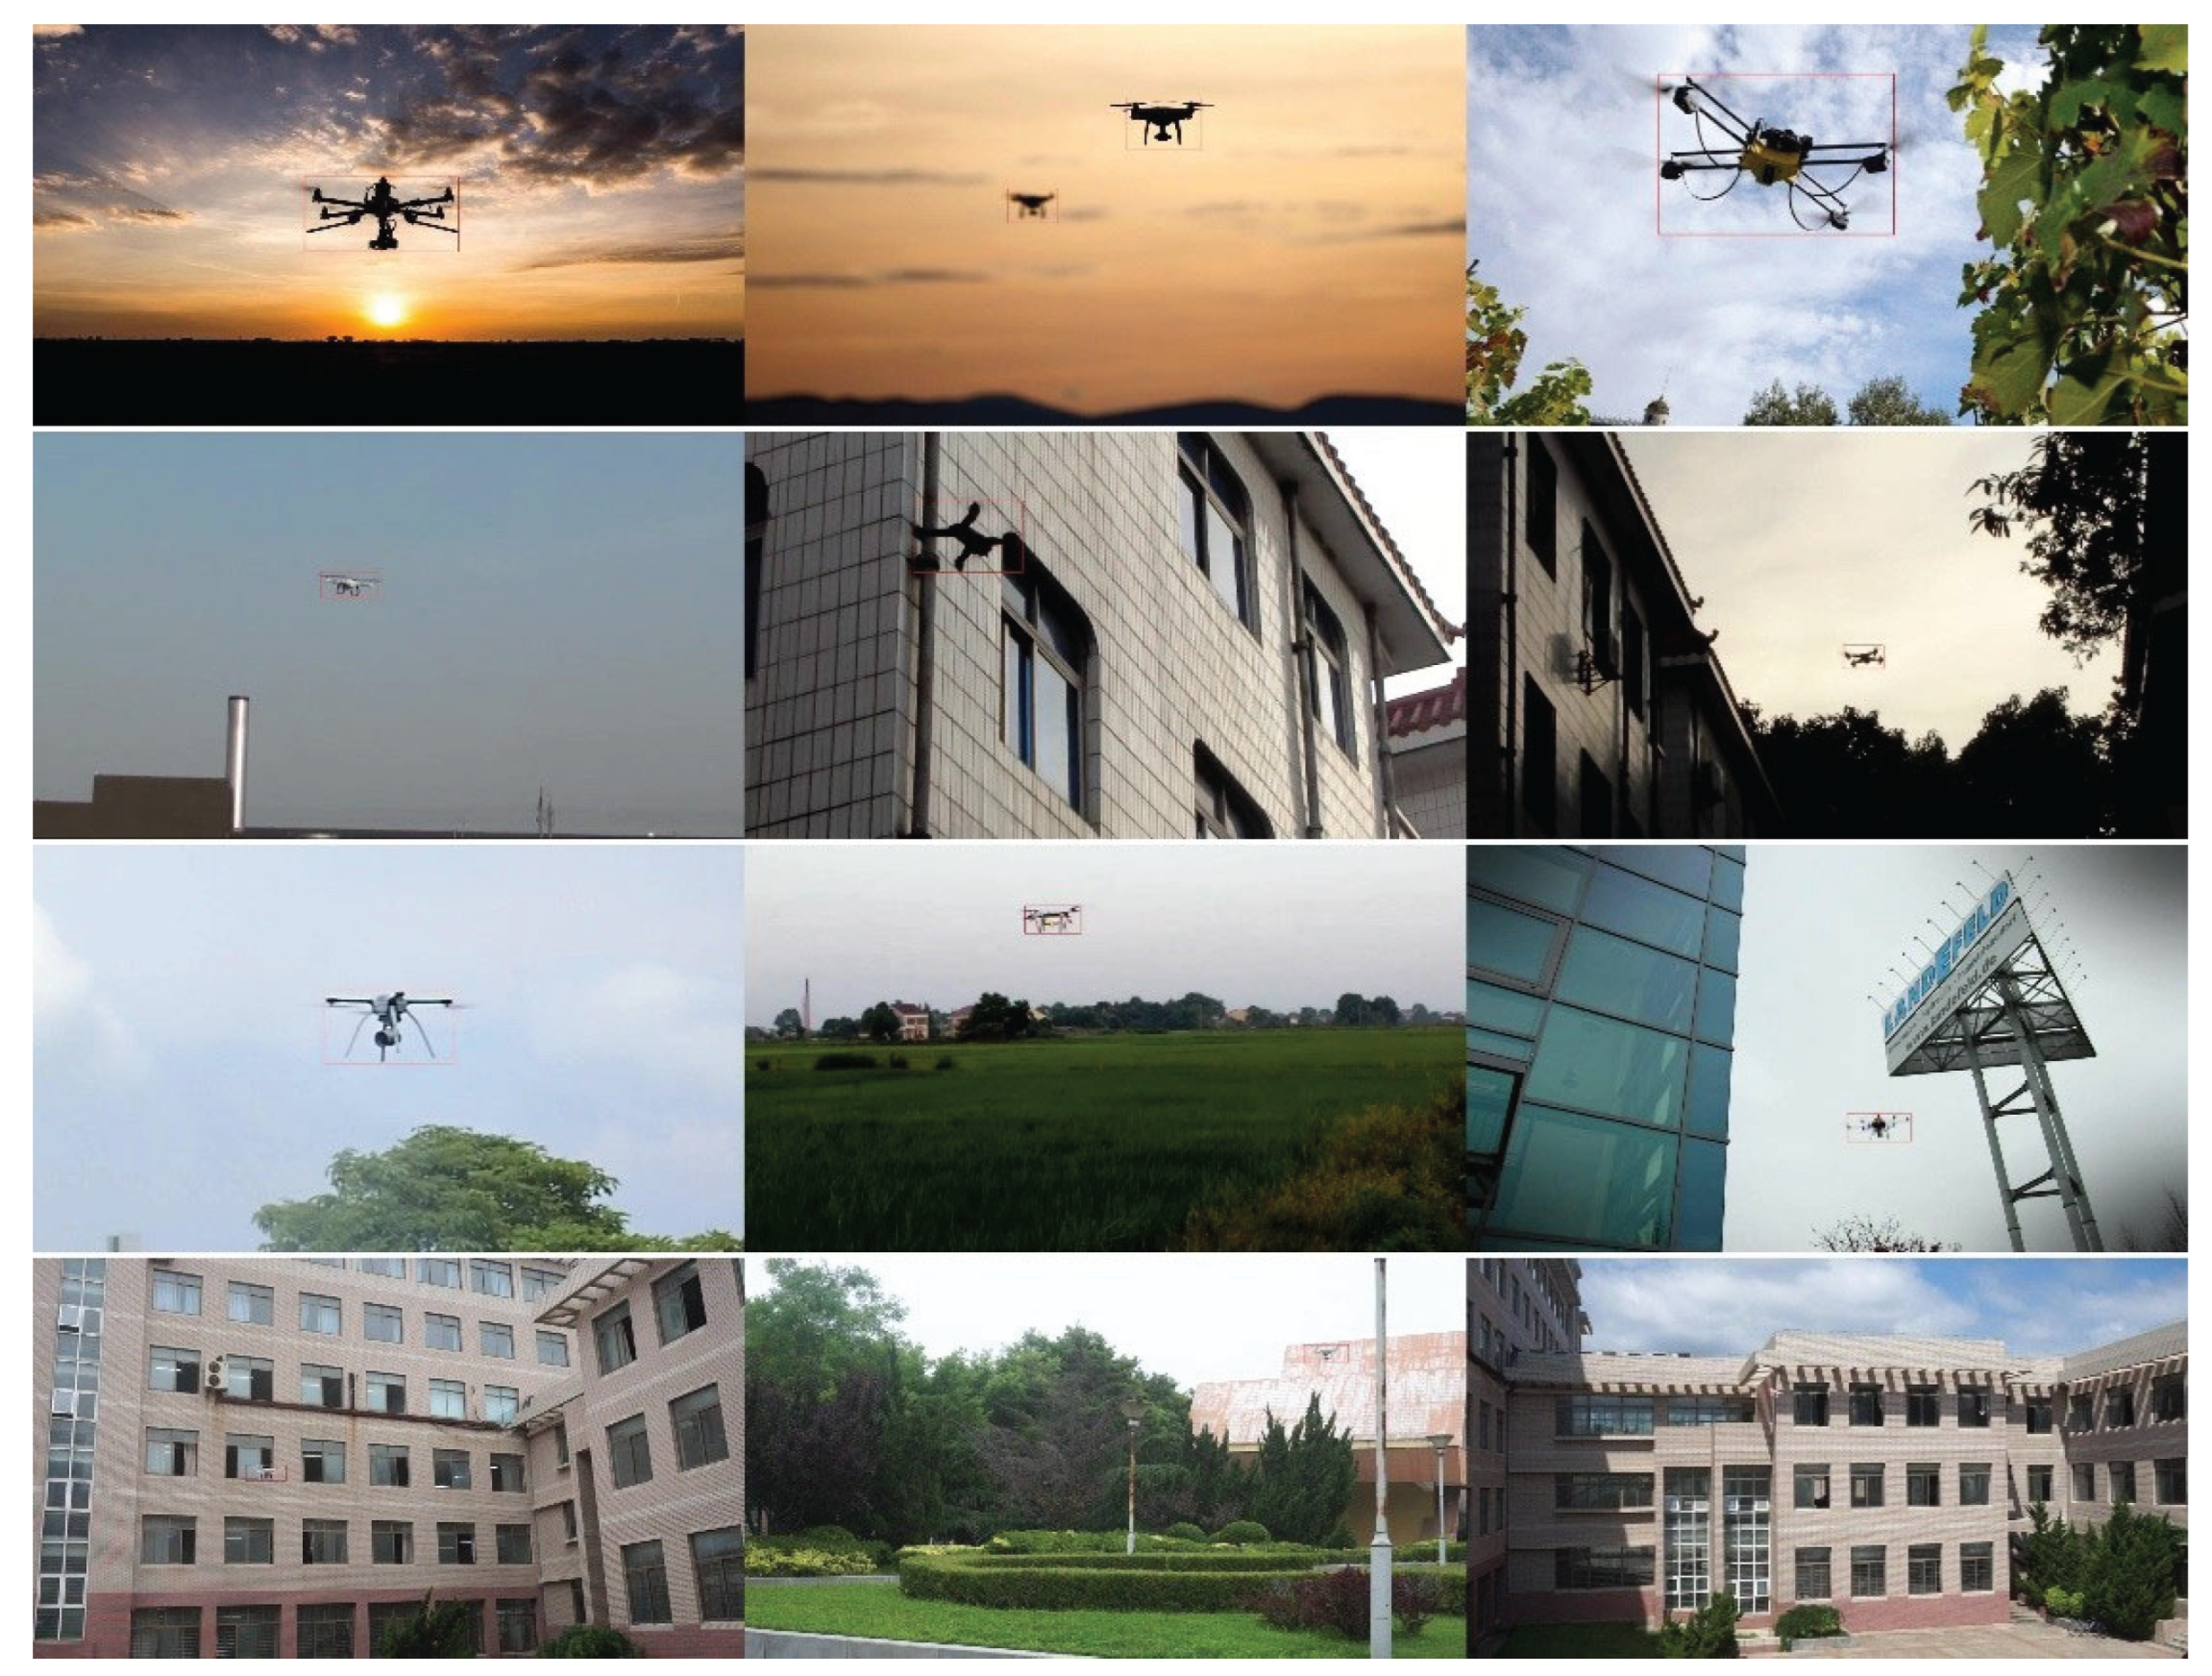
Figure 10.
Examples of Det-Fly dataset.
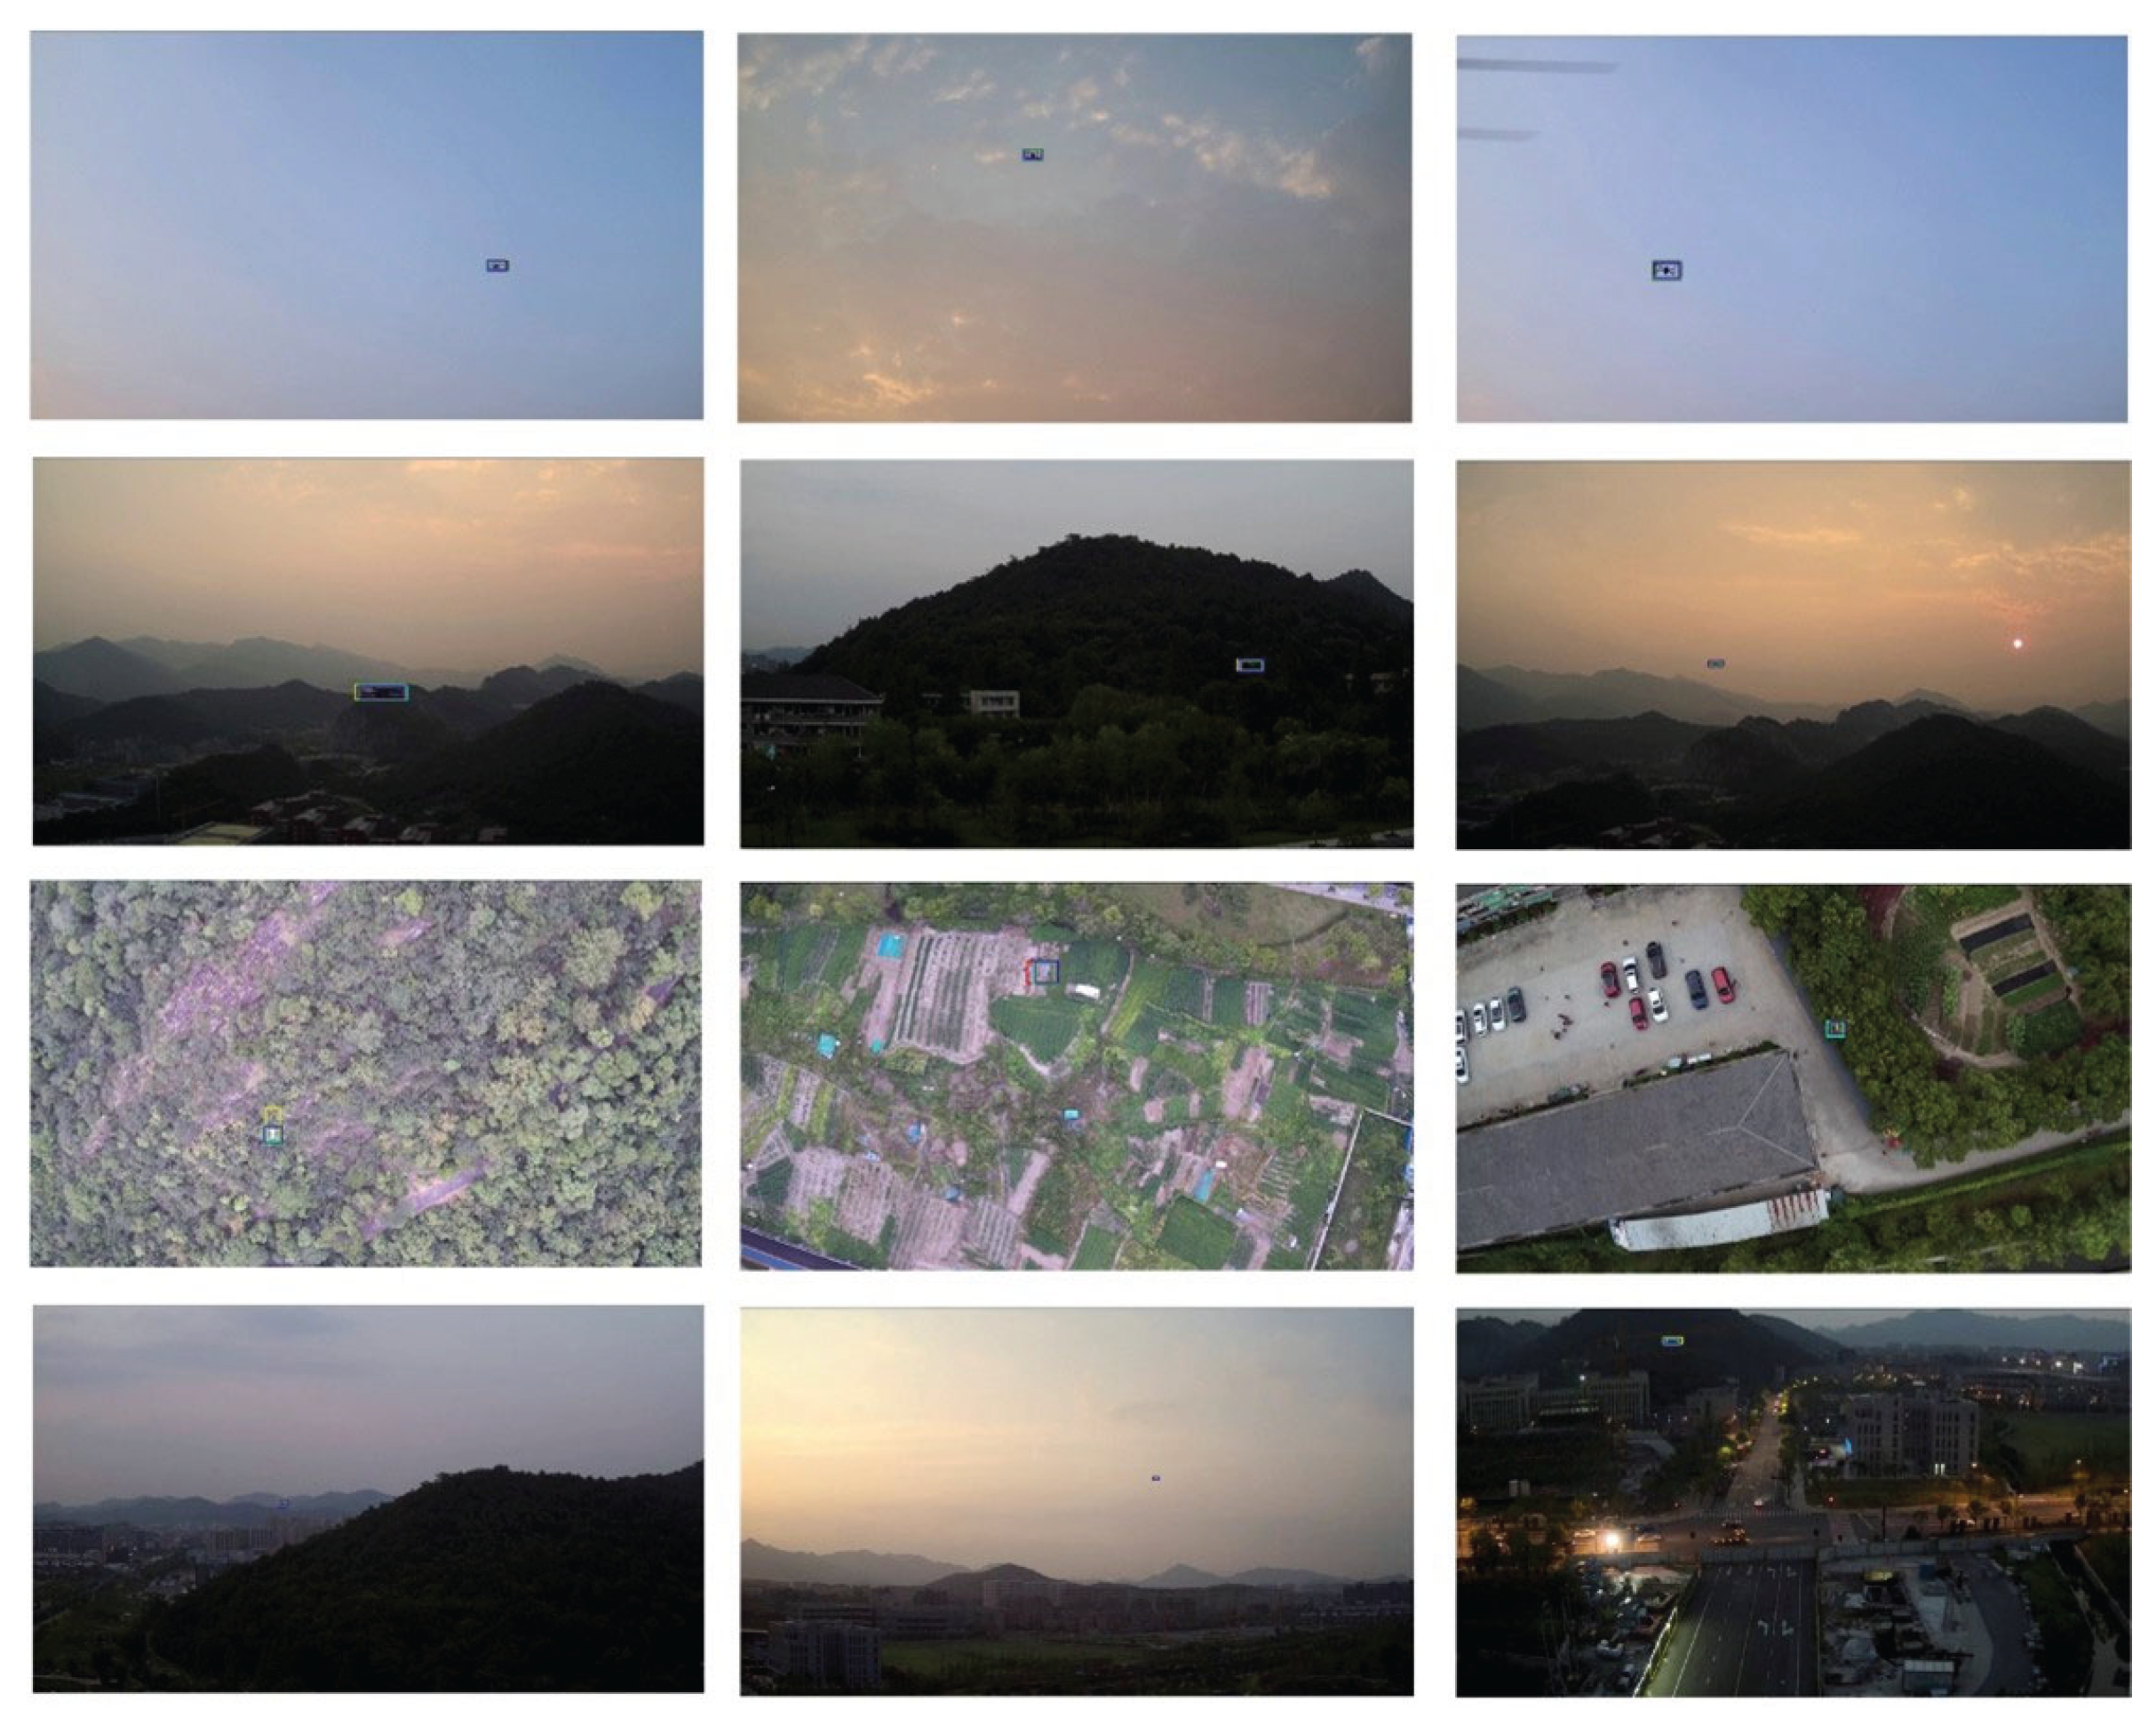
Figure 11.
Comparison chart of effects of different types of Block modules.
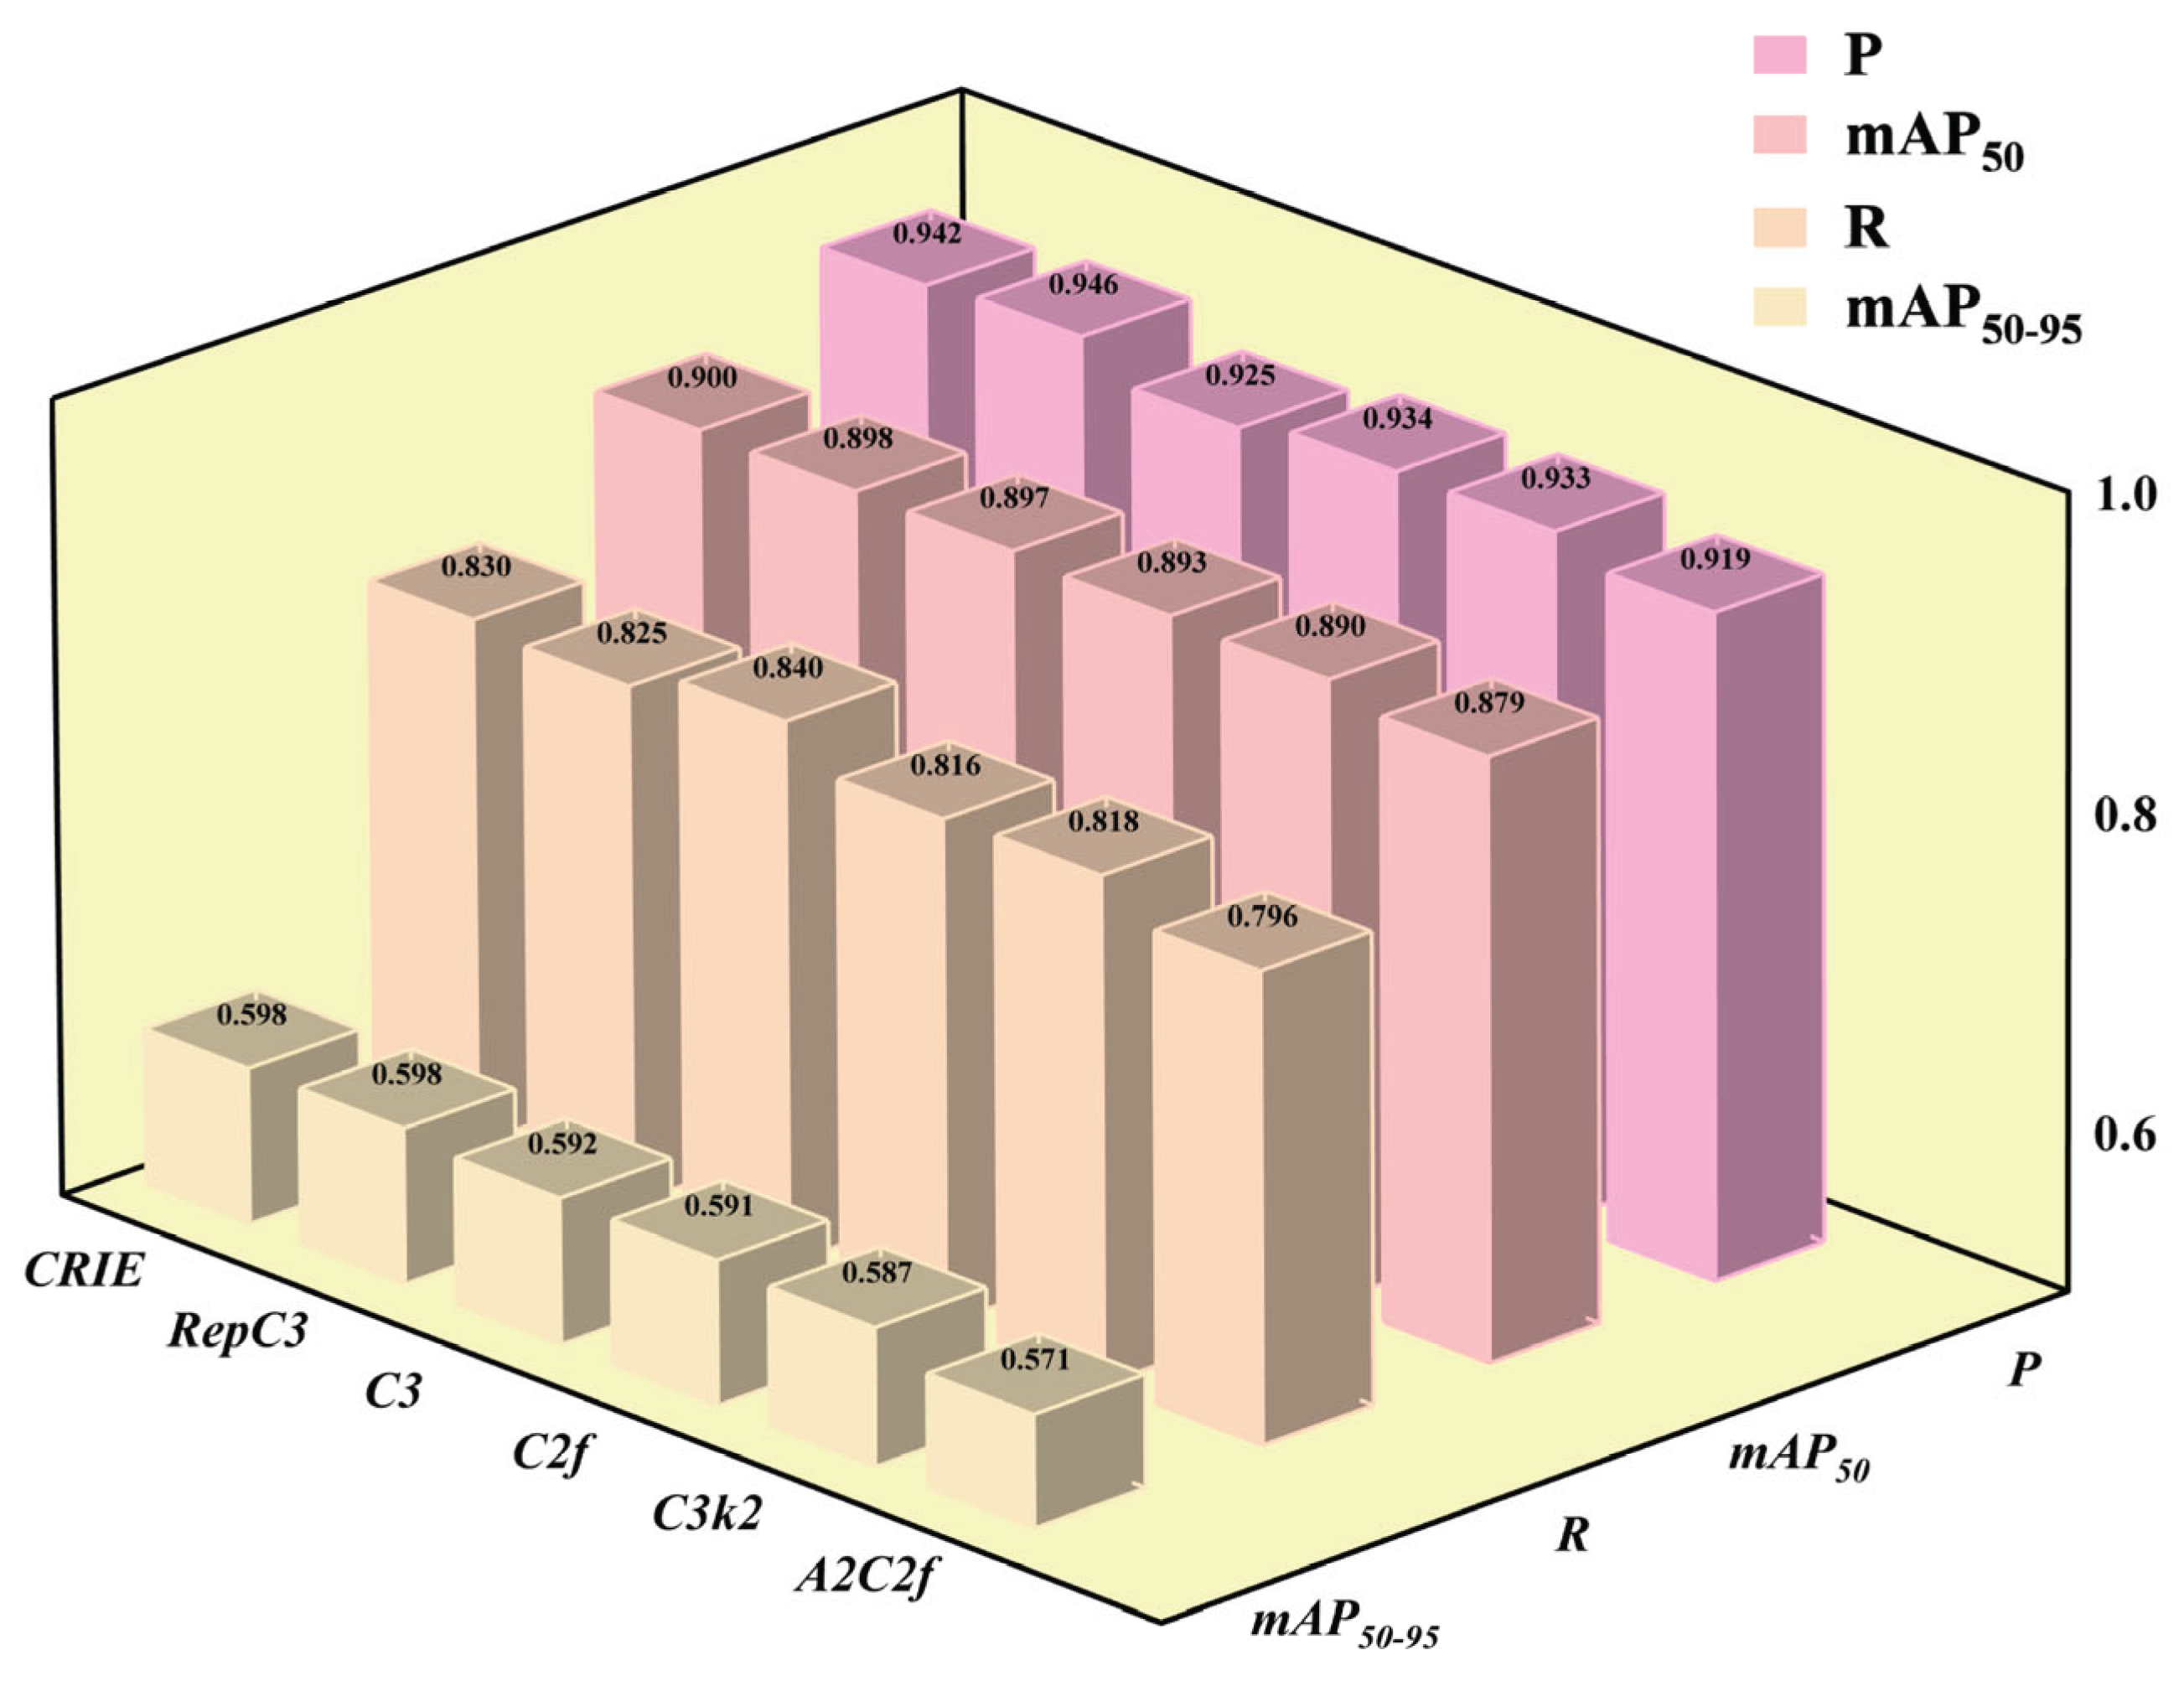
Figure 12.
Comparison Effect of different Loss Function.
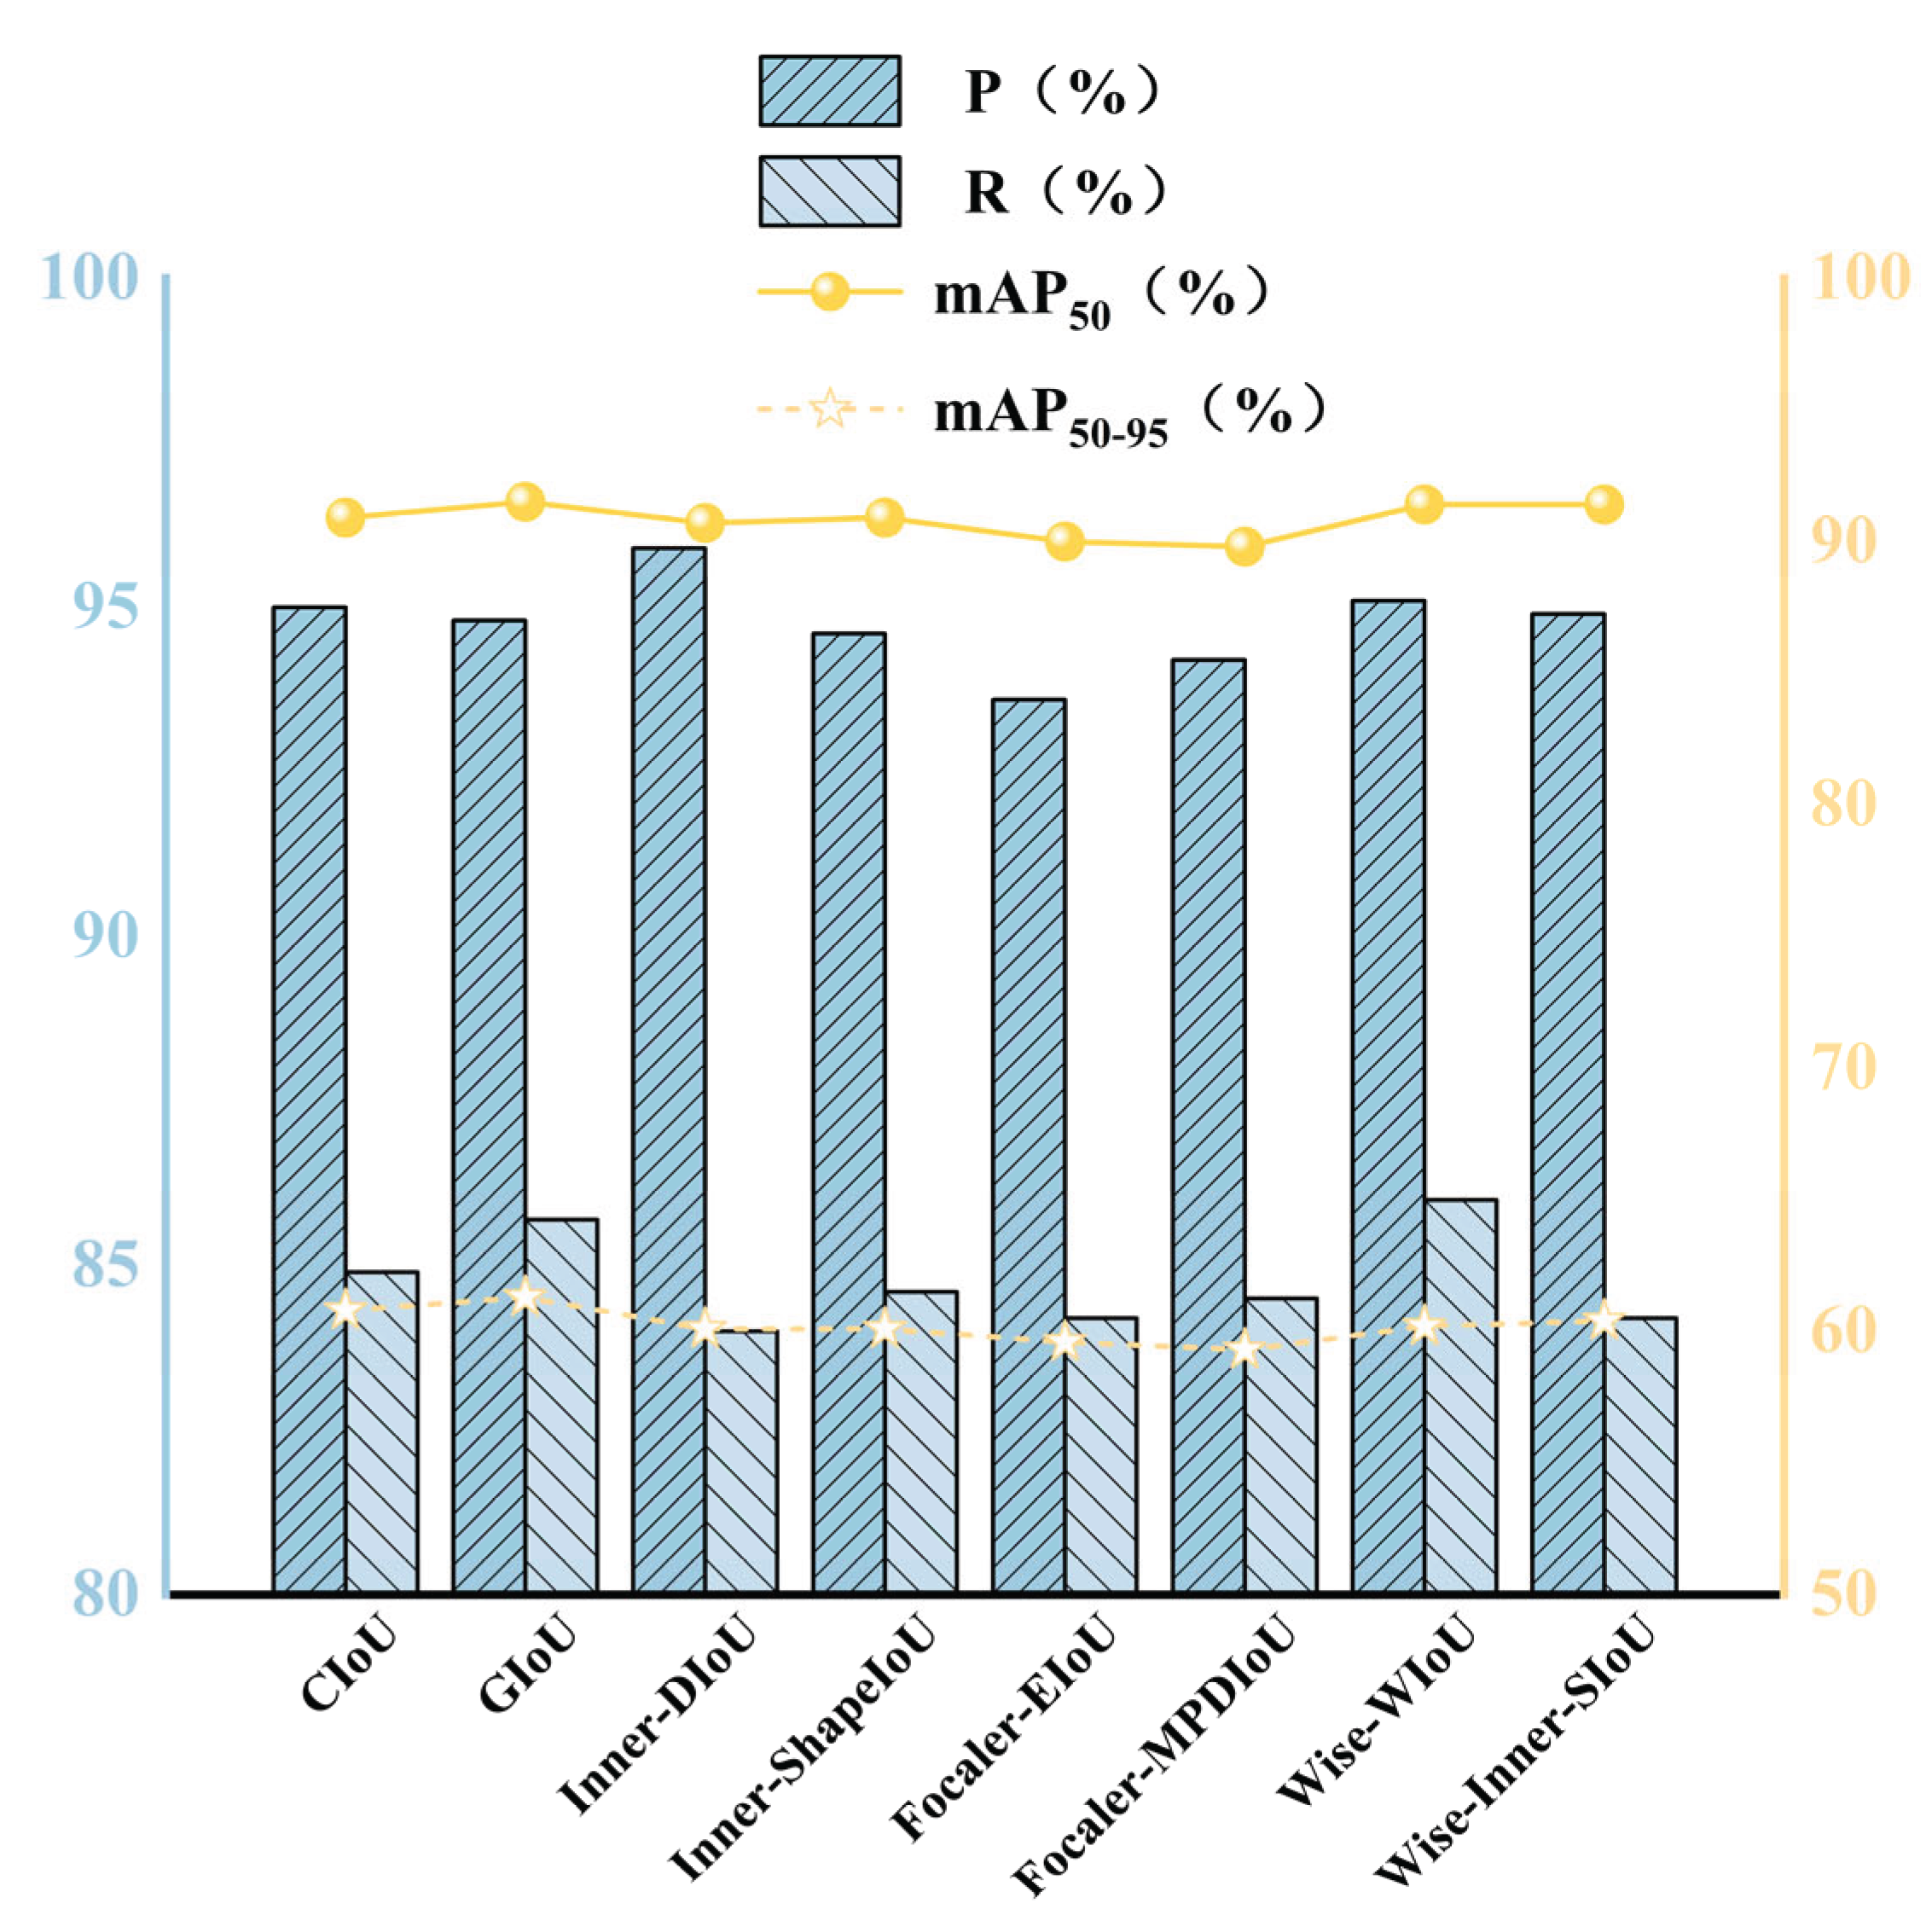
Figure 15.
Comparison of each model under different indicators:(a)P and mAP50; (b)R and mAP50; (c)mAP50-95 and mAP50; (d)Parameters and mAP50.
Figure 15.
Comparison of each model under different indicators:(a)P and mAP50; (b)R and mAP50; (c)mAP50-95 and mAP50; (d)Parameters and mAP50.
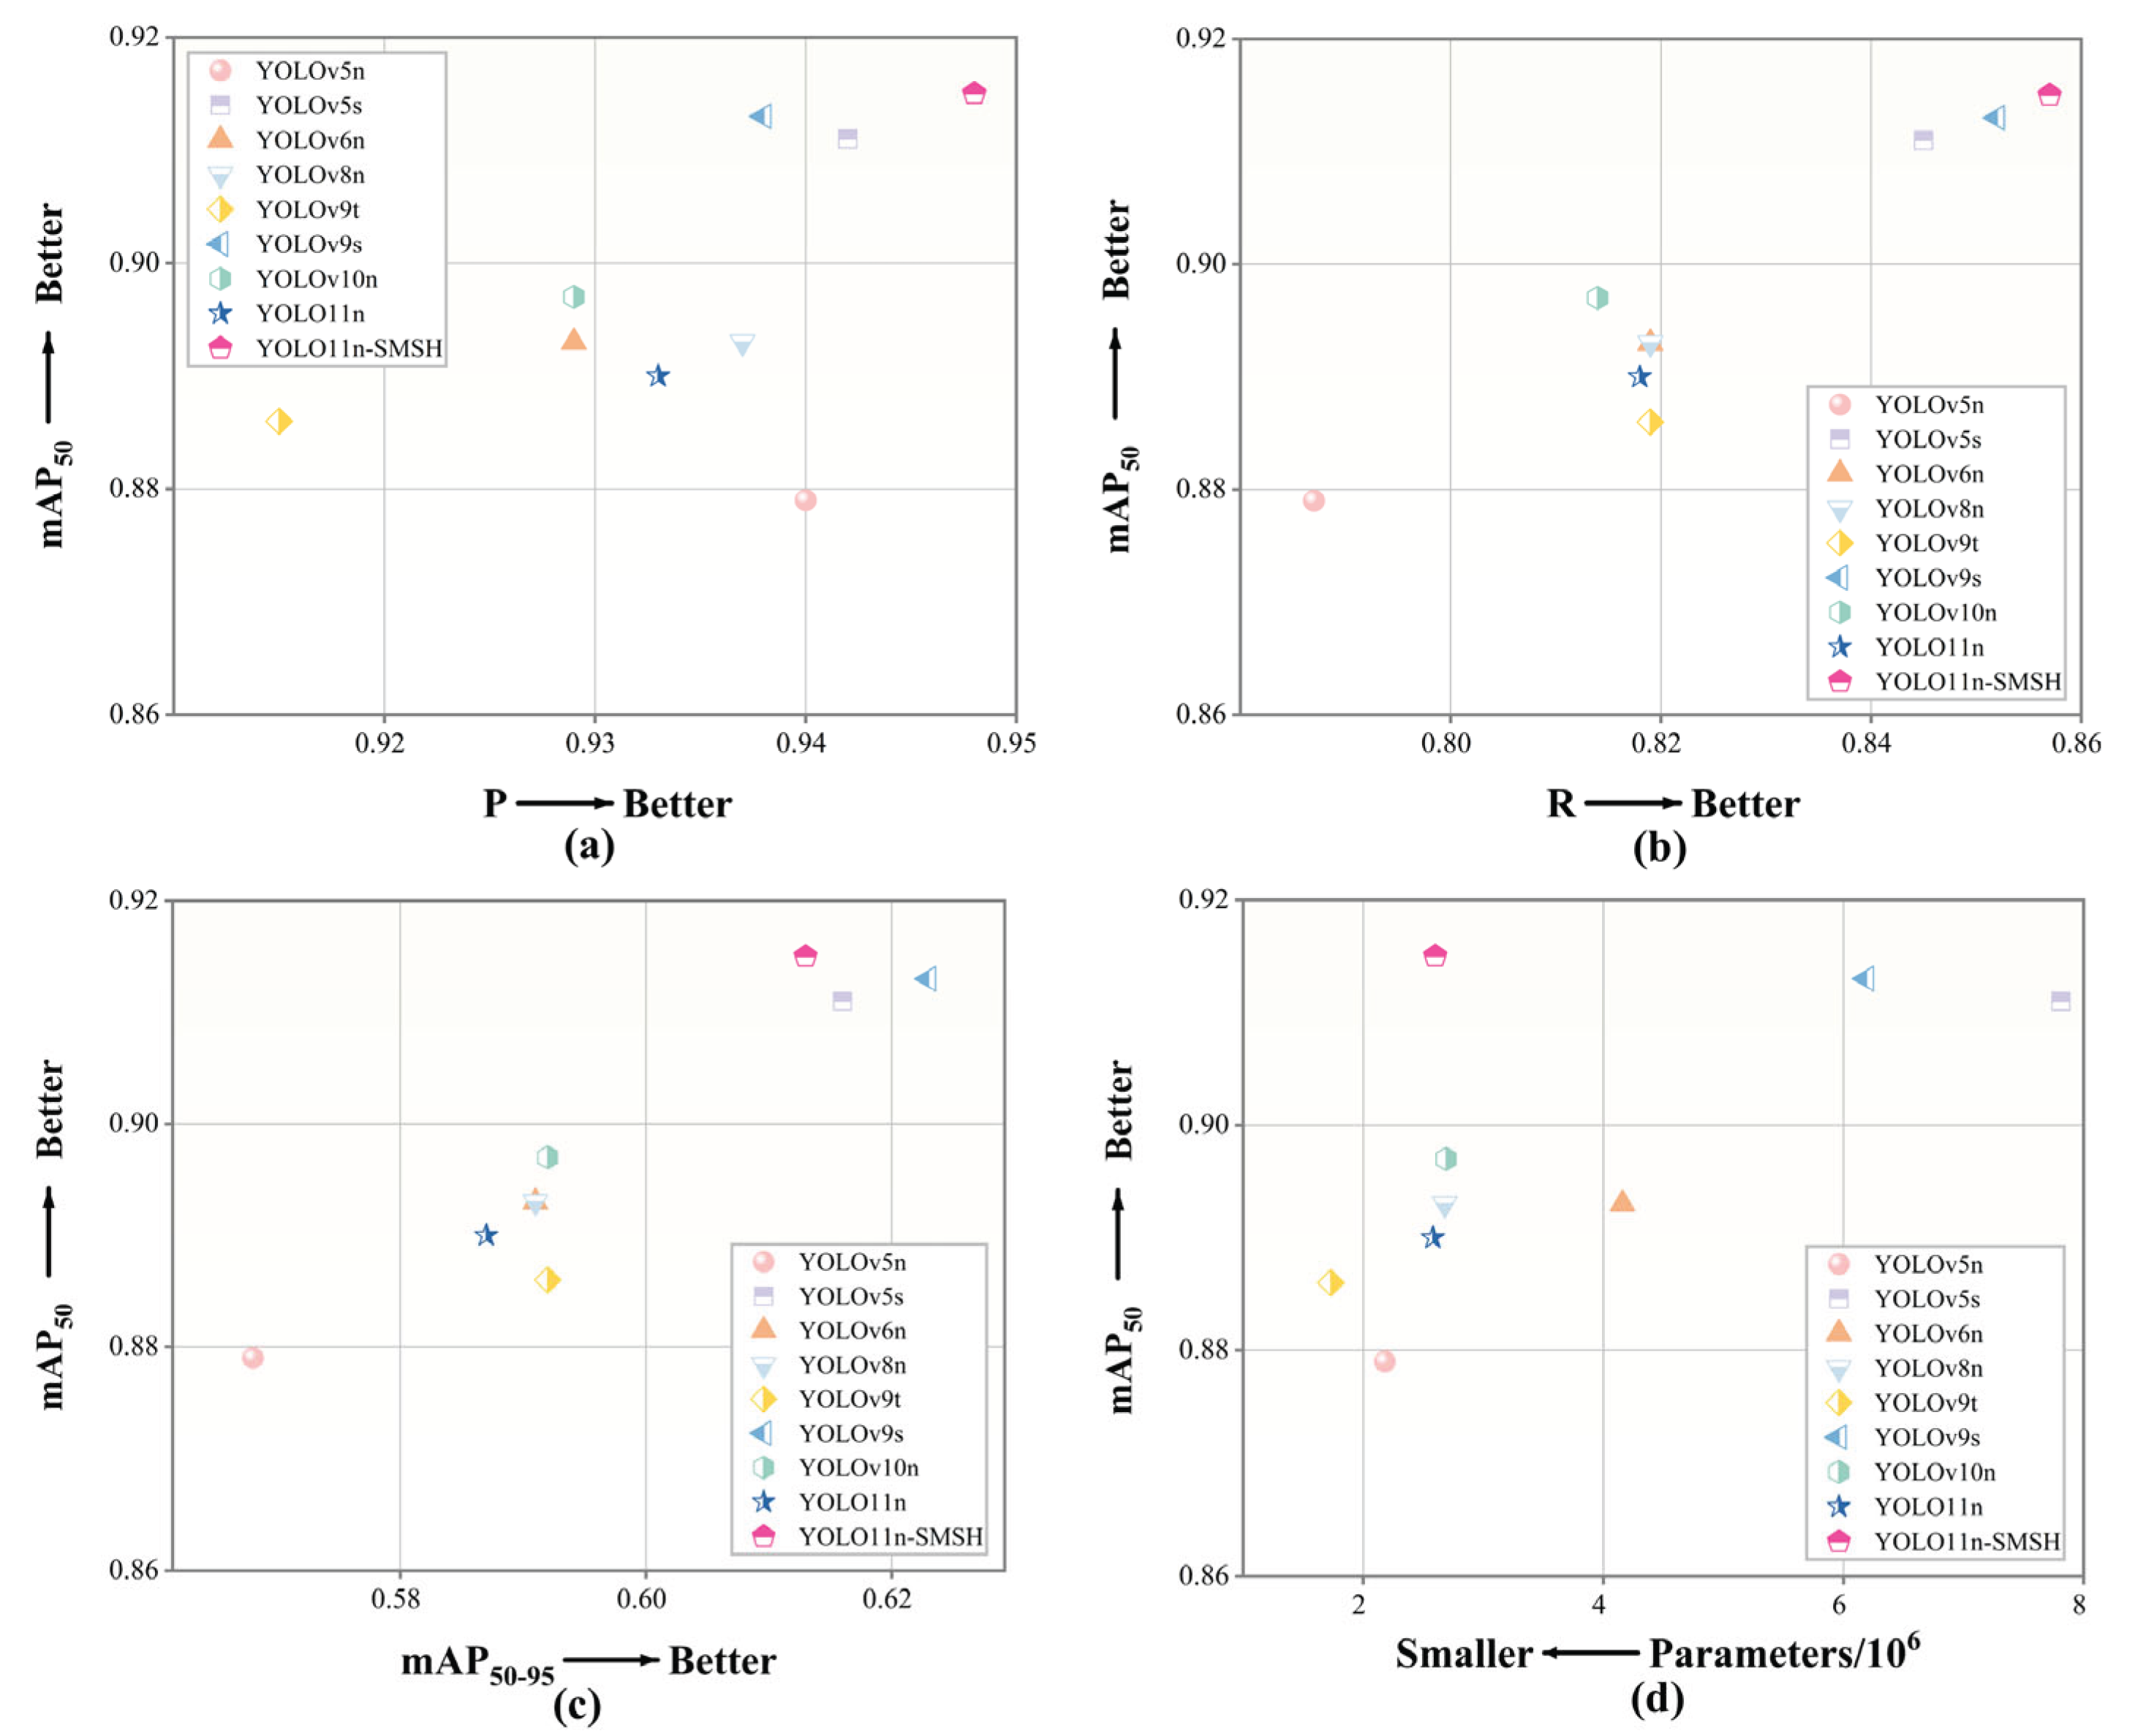
Figure 16.
Comparative analysis of P, R, mAP50, and mAP50-95.
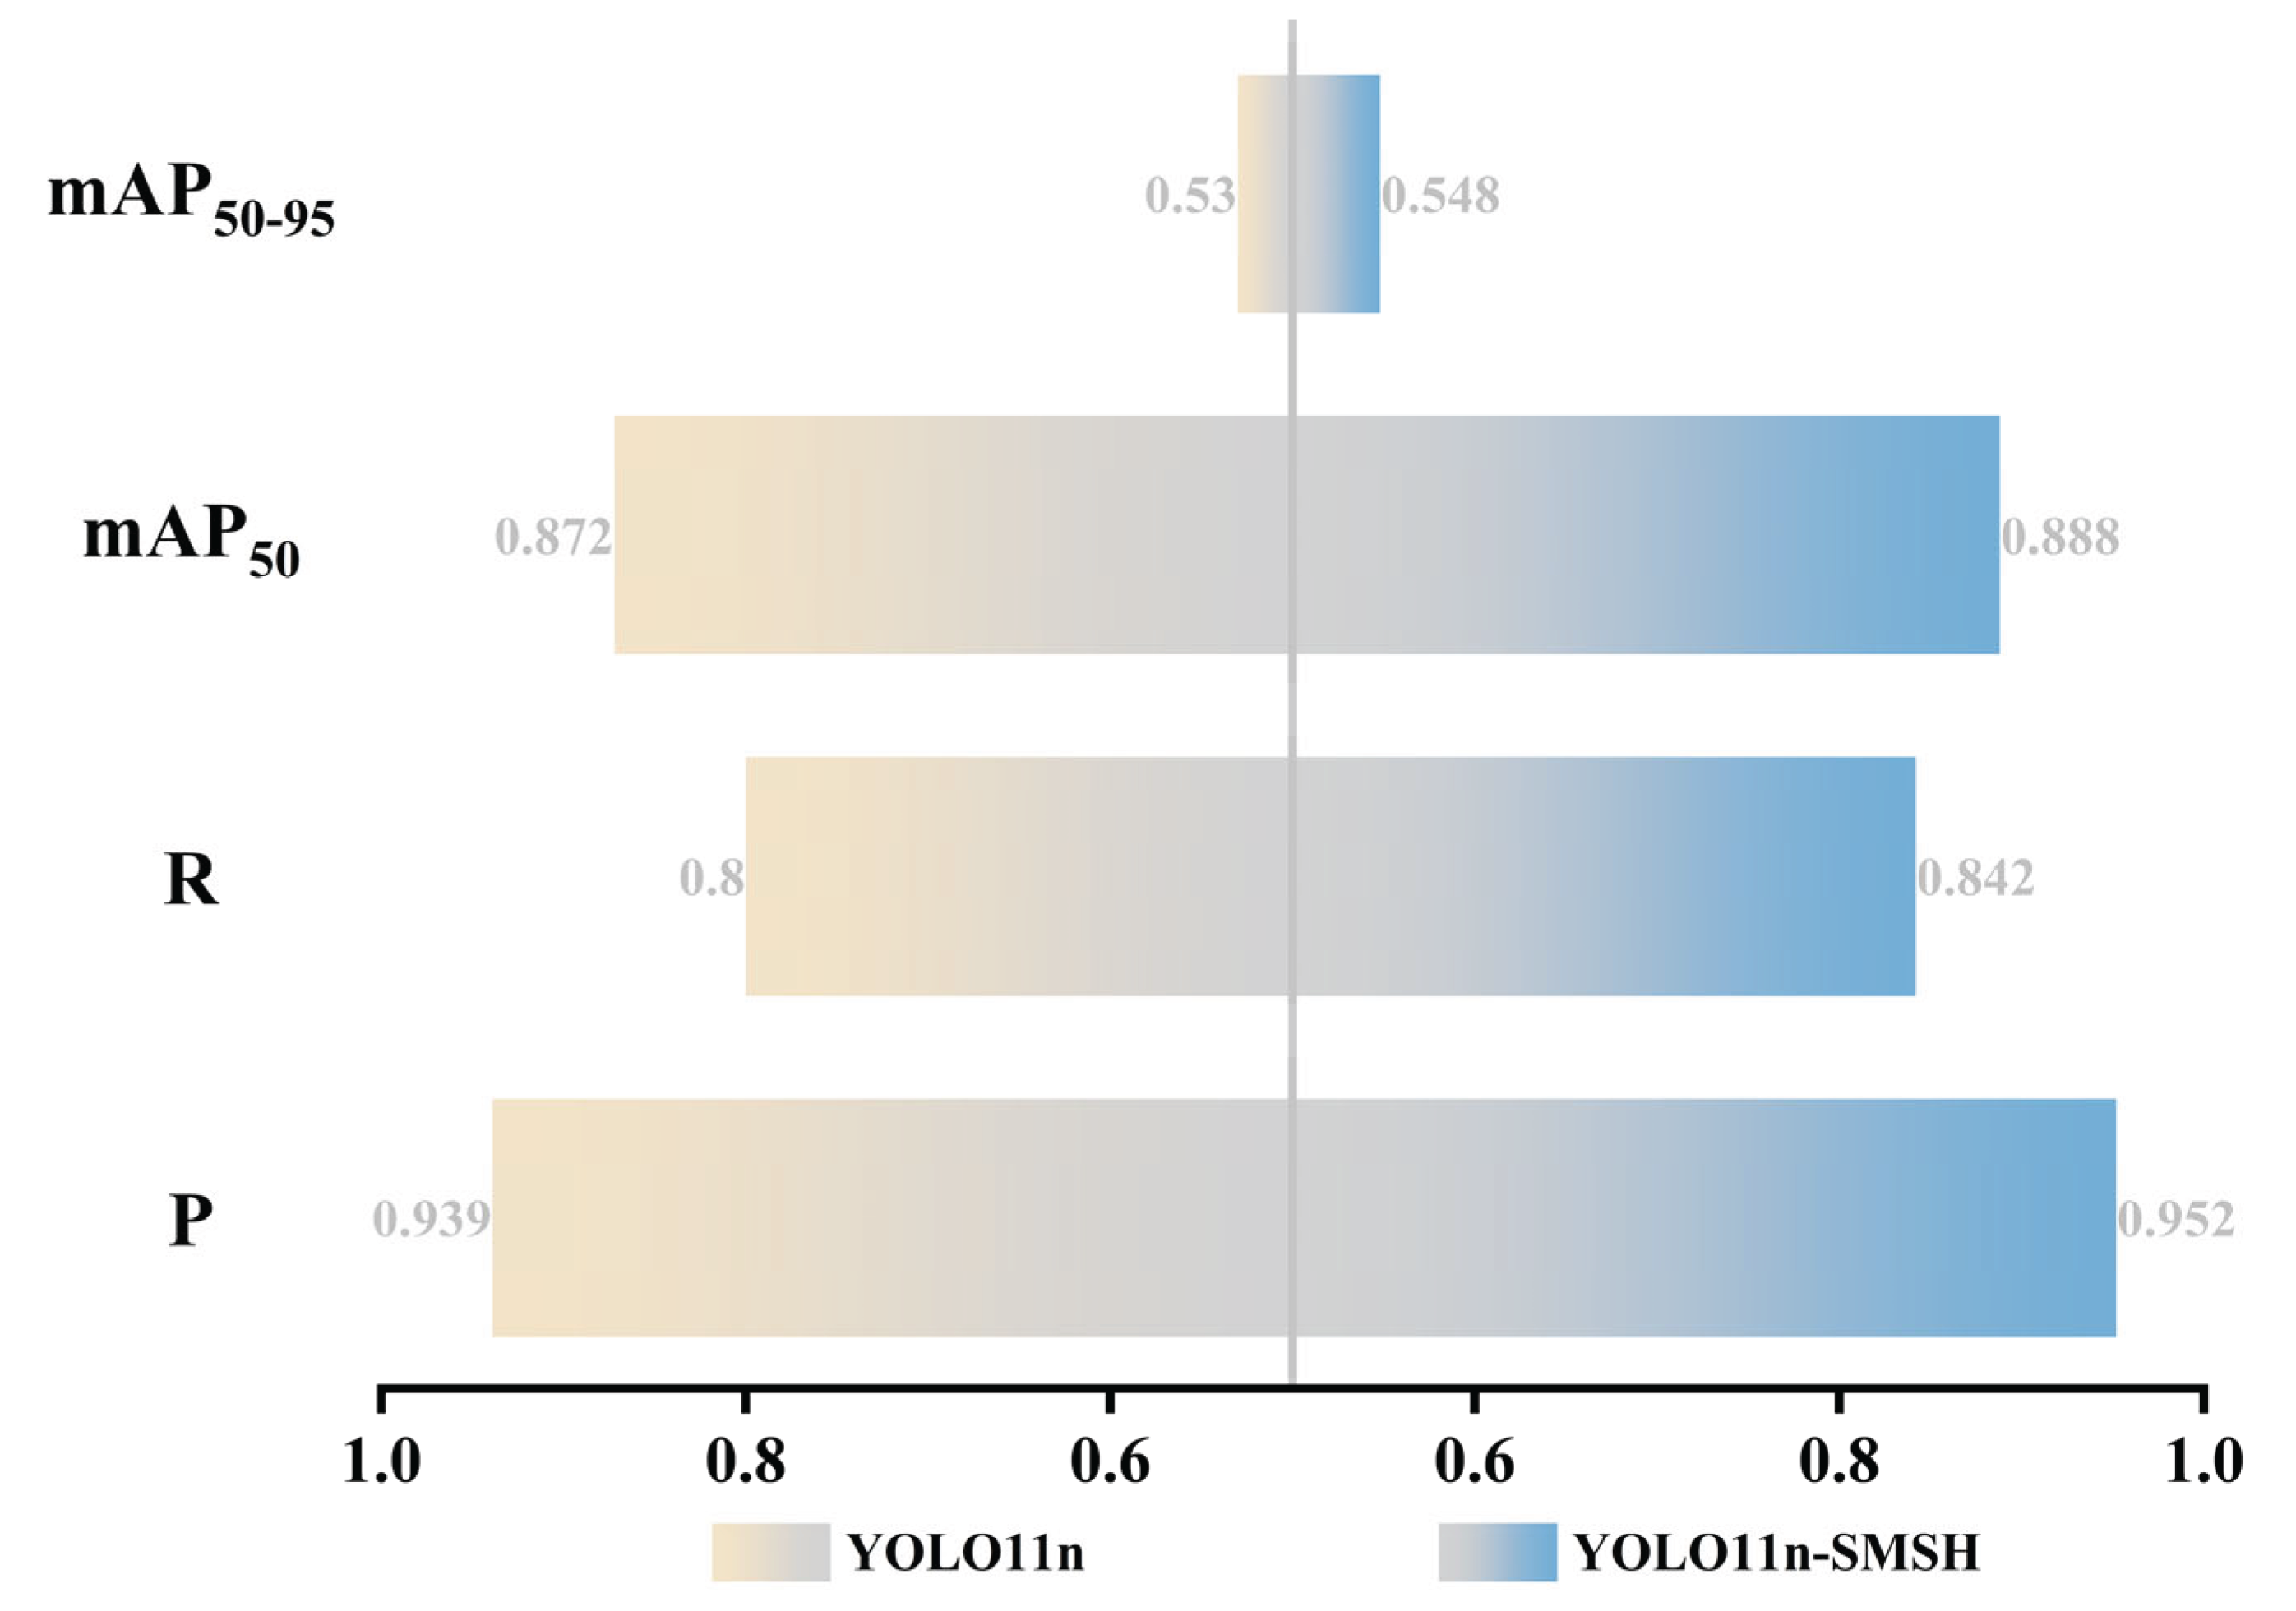
Figure 17.
Detection results of YOLO11n (left) and YOLO11n—SMSH (right):(a): Precision comparison; (b): Missed detection issue; (c): False detection issue.
Figure 17.
Detection results of YOLO11n (left) and YOLO11n—SMSH (right):(a): Precision comparison; (b): Missed detection issue; (c): False detection issue.
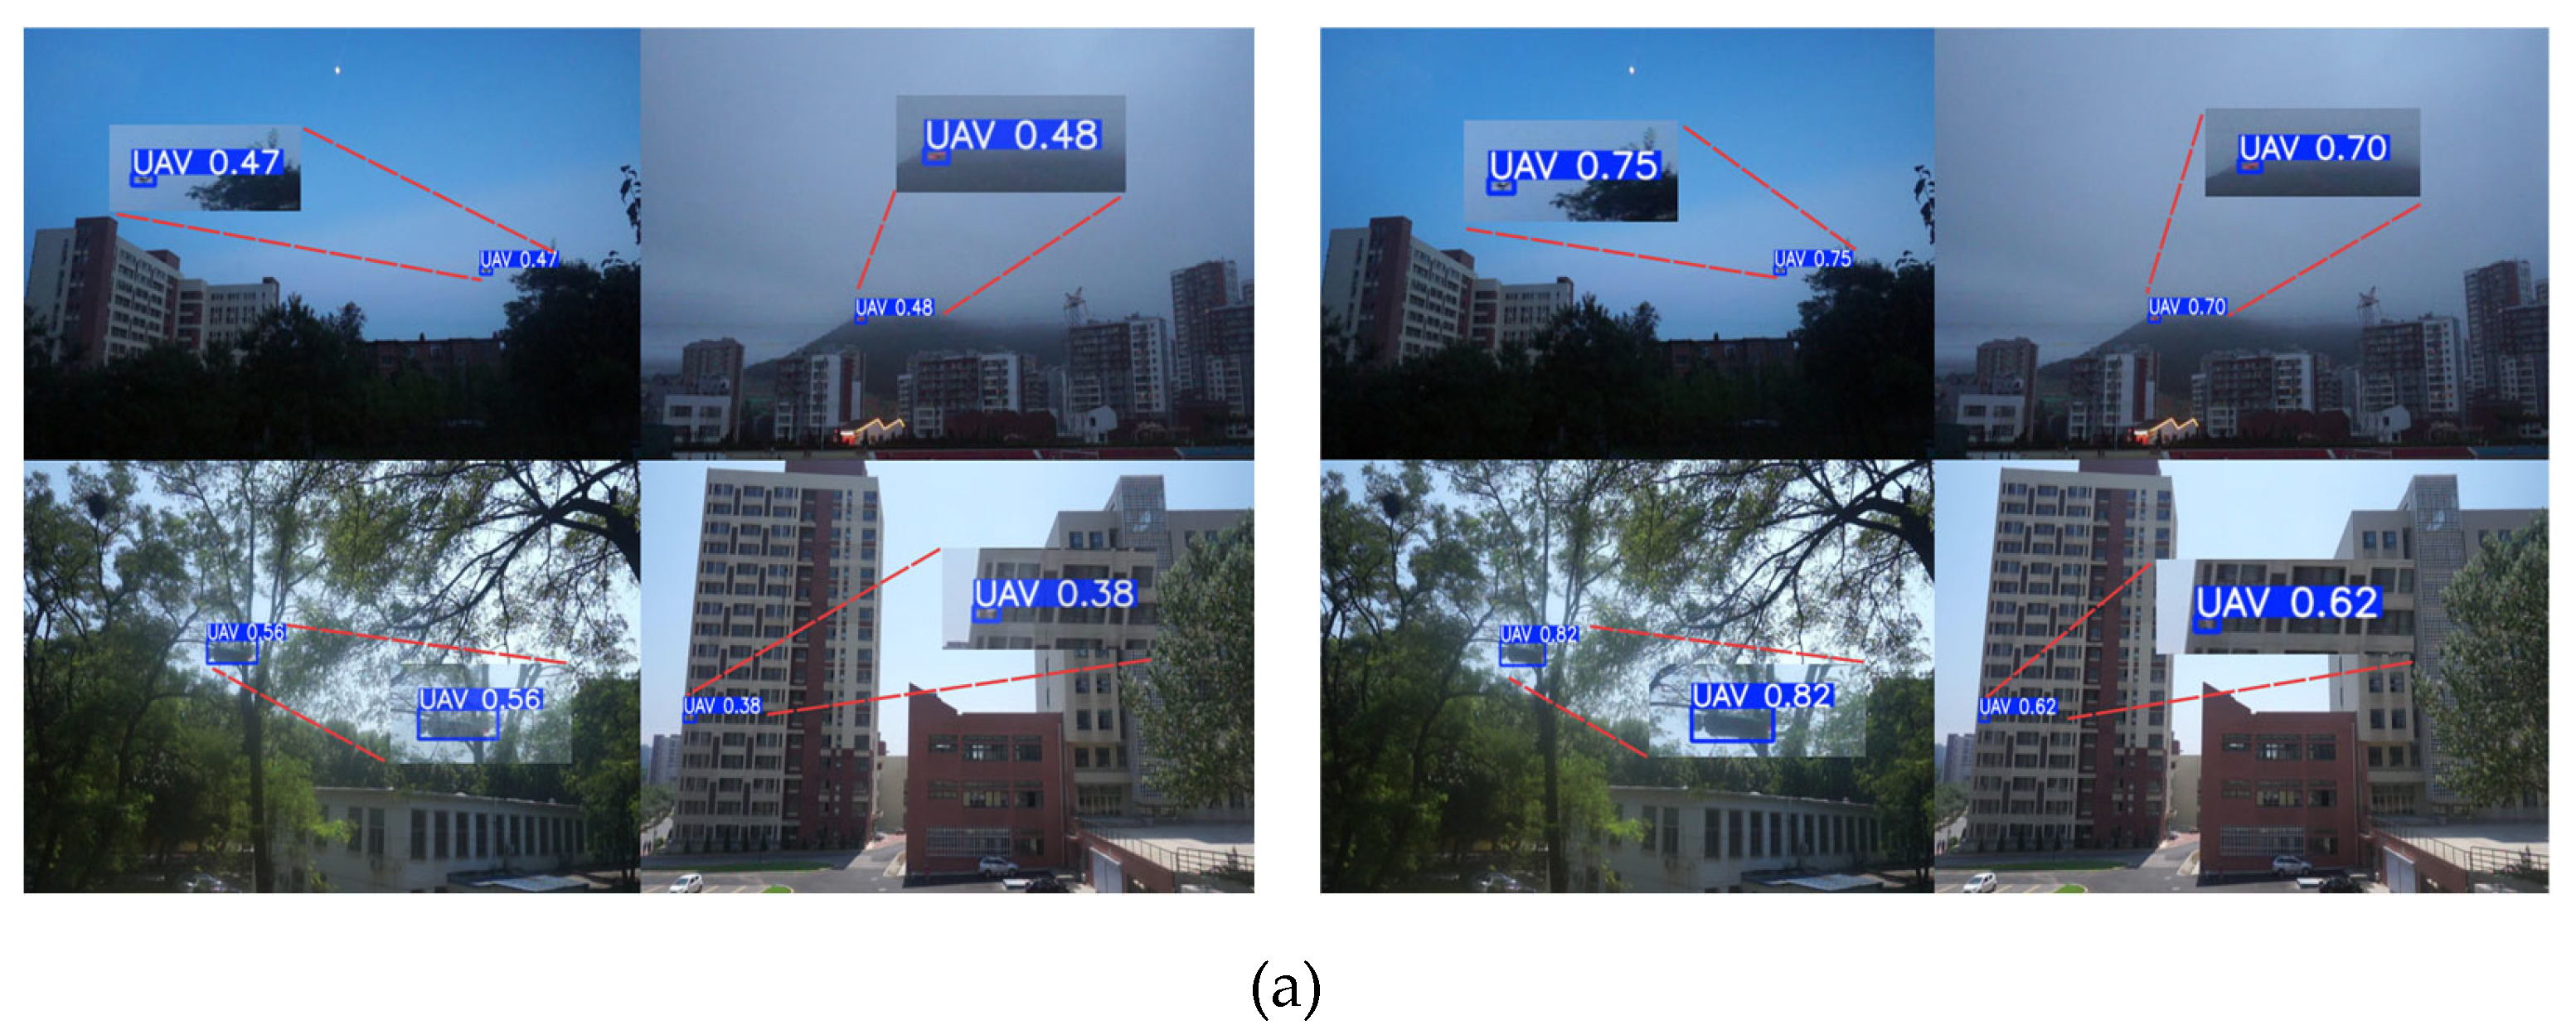
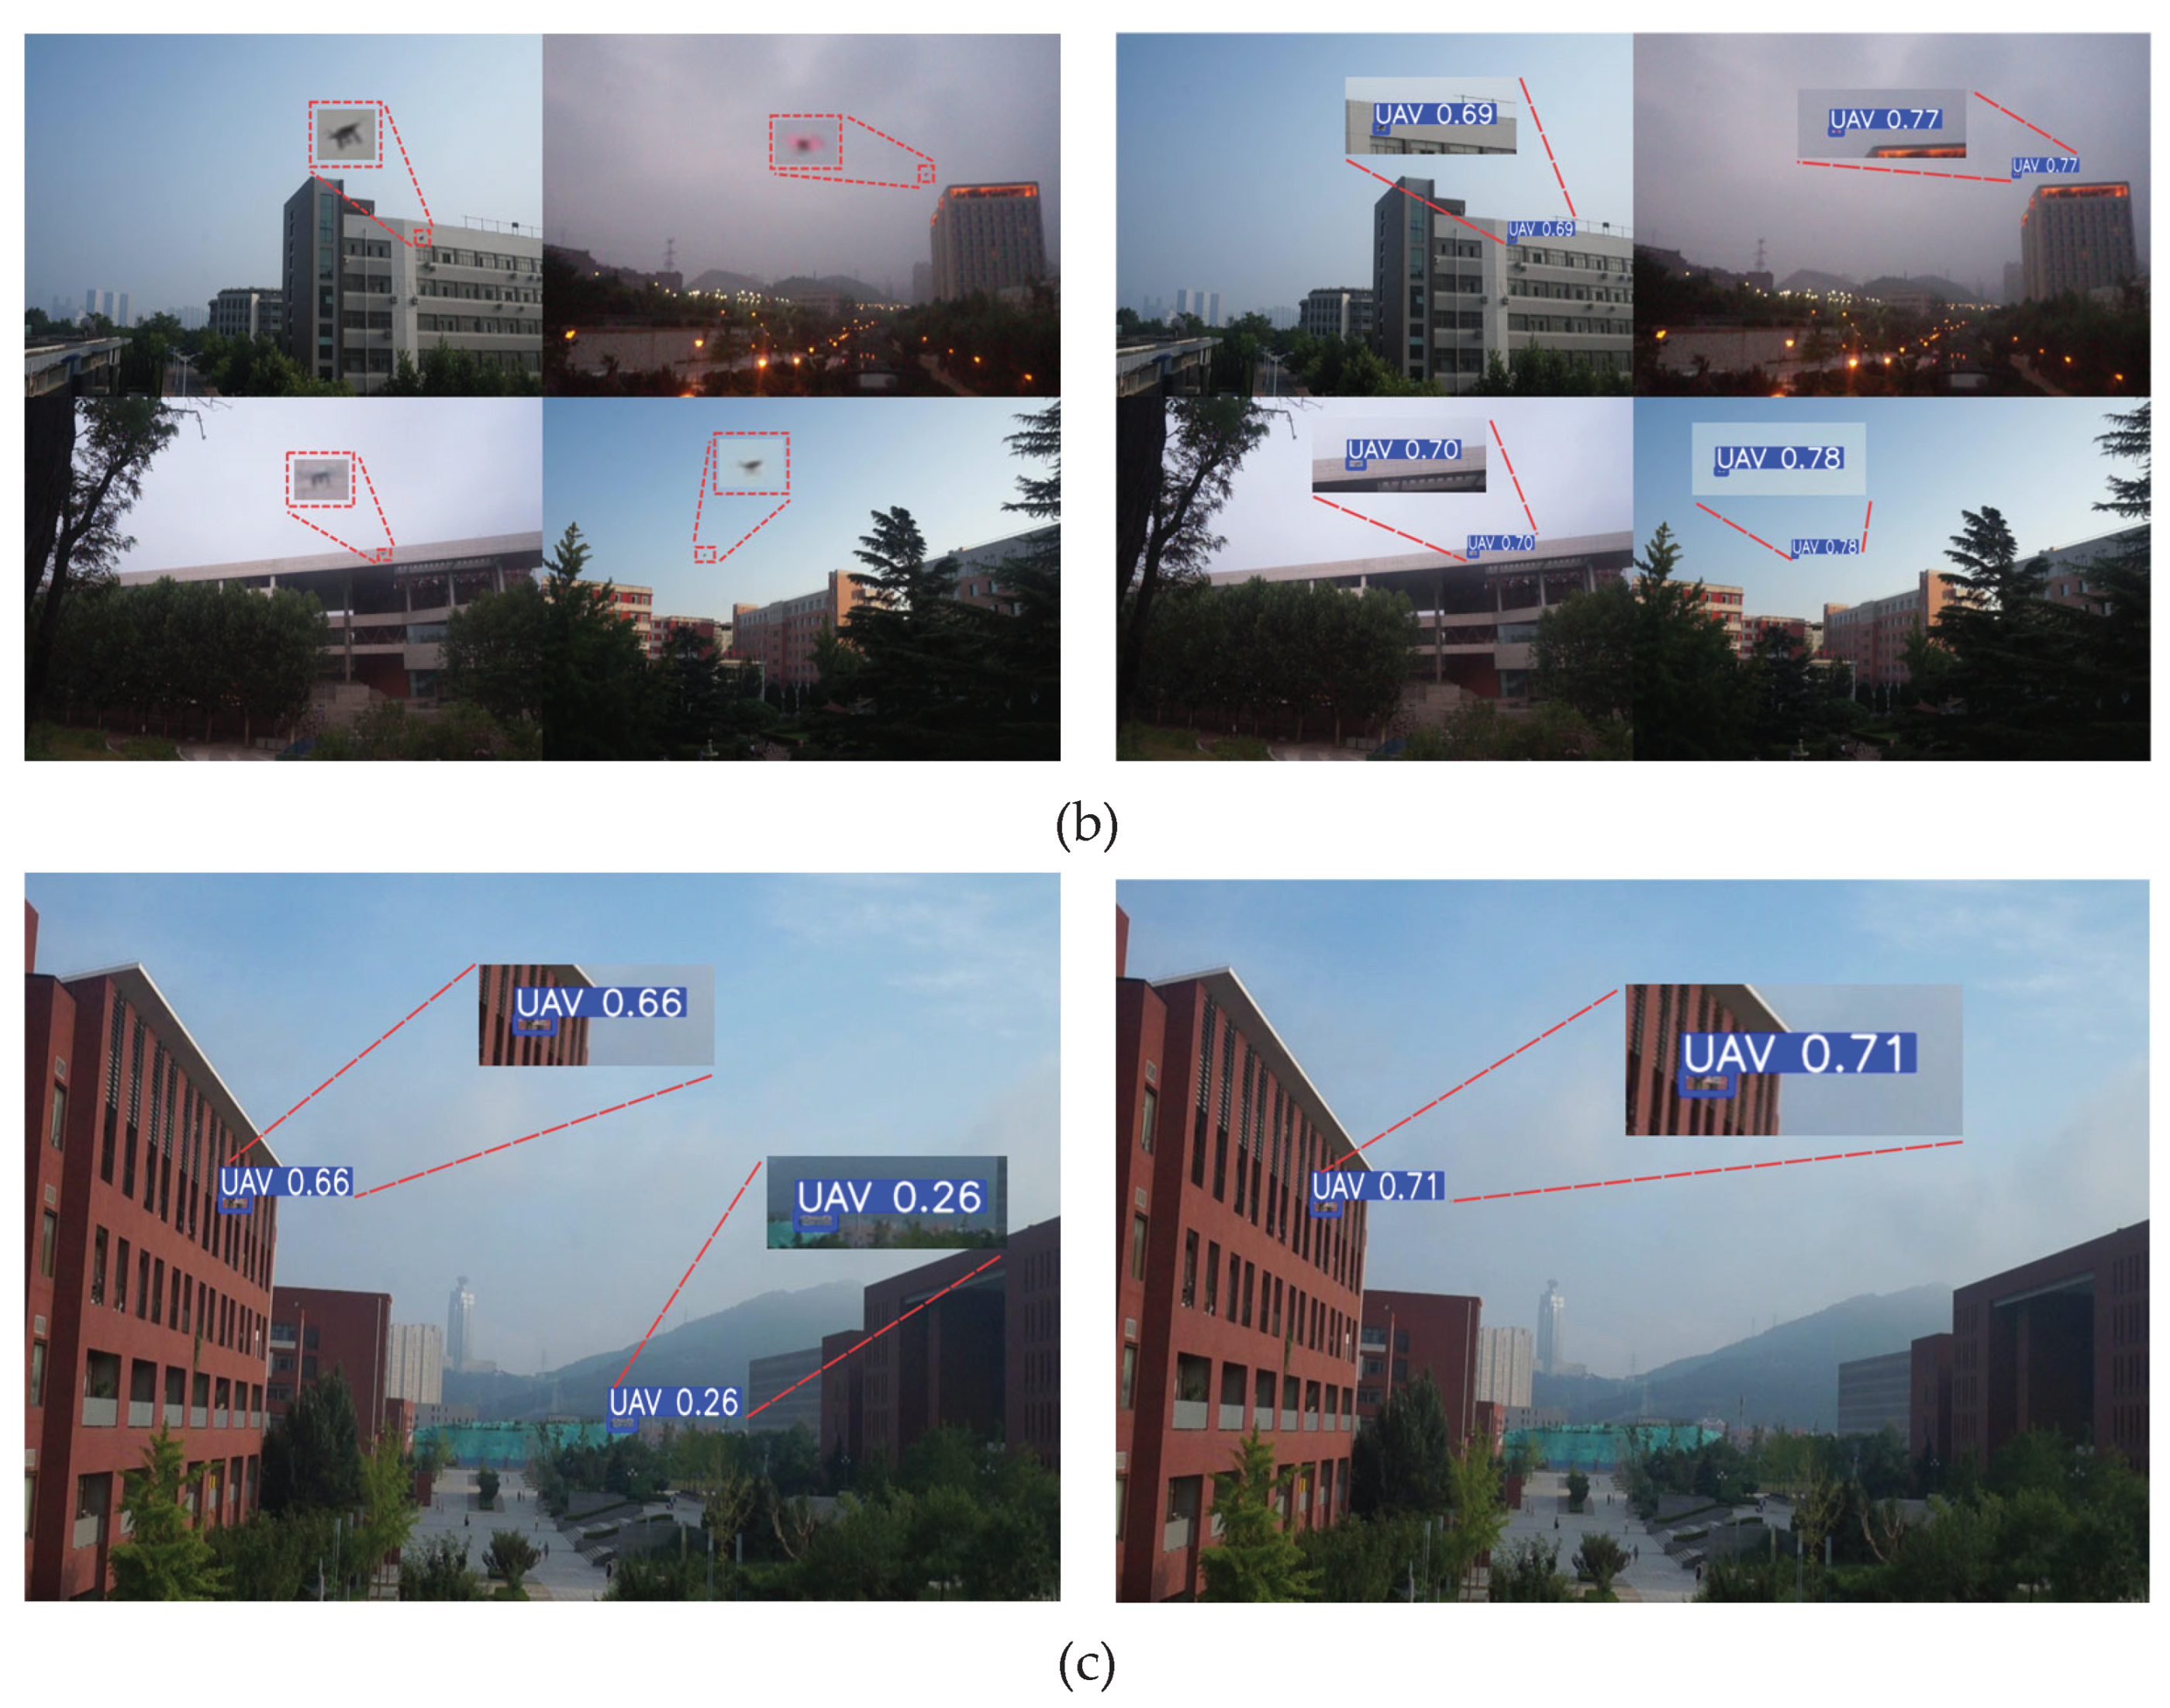
Table 2.
(a) Experiment 1. (b) Experiment 2.
| Model | Figure | Replacement Position | P | R | mAP50 | mAP50-95 | |||
| A | B | C | D | ||||||
| YOLO11n | 1 |  |
|
|
0.946 | 0.829 | 0.905 | 0.612 | |
| 2 | |
0.942 | 0.827 | 0.901 | 0.601 | ||||
| 3 | |
|
0.942 | 0.83 | 0.9 | 0.598 | |||
| 4 | |
0.948 | 0.812 | 0.898 | 0.598 | ||||
| 5 | |
|
|
0.924 | 0.84 | 0.899 | 0.595 | ||
| 6 | |
|
|
0.945 | 0.809 | 0.894 | 0.596 | ||
| 7 | |
|
0.939 | 0.821 | 0.897 | 0.595 | |||
| 8 | |
|
|
|
0.92 | 0.829 | 0.892 | 0.595 | |
| 9 | |
0.931 | 0.819 | 0.896 | 0.594 | ||||
| 10 | |
|
|
0.931 | 0.825 | 0.894 | 0.593 | ||
| 11 | |
|
0.925 | 0.821 | 0.895 | 0.592 | |||
| 12 | |
|
0.911 | 0.838 | 0.895 | 0.589 | |||
| 13 | |
|
0.934 | 0.83 | 0.893 | 0.585 | |||
| 14 | |
|
0.93 | 0.813 | 0.887 | 0.584 | |||
| 15 | |
0.91 | 0.829 | 0.891 | 0.581 | ||||
| (b) | |||||||||
| Model | Figure | Replacement Position | P | R | mAP50 | mAP50-95 | |||
| A | B | C | D | ||||||
| YOLO11n+ SRA-DFF | 1 |  |
0.935 | 0.844 | 0.91 | 0.598 | |||
| 2 | |
|
0.943 | 0.843 | 0.9 | 0.598 | |||
| 3 | |
|
|
|
0.94 | 0.833 | 0.903 | 0.596 | |
| 4 | |
|
|
0.949 | 0.814 | 0.898 | 0.597 | ||
| 5 | |
|
0.924 | 0.851 | 0.906 | 0.595 | |||
| 6 | |
|
0.936 | 0.829 | 0.901 | 0.596 | |||
| 7 | |
0.949 | 0.821 | 0.902 | 0.595 | ||||
| 8 | |
|
|
0.931 | 0.834 | 0.897 | 0.595 | ||
| 9 | |
|
0.943 | 0.831 | 0.9 | 0.594 | |||
| 10 | |
0.944 | 0.829 | 0.903 | 0.592 | ||||
| 11 | |
|
|
0.923 | 0.85 | 0.903 | 0.59 | ||
| 12 | |
|
|
0.934 | 0.838 | 0.902 | 0.589 | ||
| 13 | |
0.934 | 0.834 | 0.901 | 0.589 | ||||
| 14 | |
|
0.93 | 0.829 | 0.898 | 0.589 | |||
| 15 | |
|
0.947 | 0.825 | 0.897 | 0.587 | |||
Table 3.
Comparison Effect of different Loss Function.
| Loss | P | R | mAP50 | mAP50-95 |
|---|---|---|---|---|
| CIoU | 0.950 | 0.849 | 0.909 | 0.608 |
| GIoU | 0.948 | 0.857 | 0.915 | 0.613 |
| Inner-DIoU | 0.959 | 0.84 | 0.907 | 0.601 |
| Inner-ShapeIoU | 0.946 | 0.846 | 0.909 | 0.601 |
| Focaler-EIoU | 0.936 | 0.842 | 0.9 | 0.596 |
| Focaler-MPDIoU | 0.942 | 0.845 | 0.898 | 0.593 |
| Wise-WIoU | 0.951 | 0.86 | 0.914 | 0.602 |
| Wise-Inner-SIoU | 0.949 | 0.842 | 0.914 | 0.604 |
Table 4.
Ablation experiment.
| Model | P | R | mAP50 | mAP50-95 | GFLOPs | Params/106 |
|---|---|---|---|---|---|---|
| Baseline | 0.933 | 0.818 | 0.89 | 0.587 | 6.3 | 2.58 |
| +I1 | 0.942 | 0.83 | 0.9 | 0.598 | 6.4 | 2.57 |
| +I1+I2 | 0.943 | 0.843 | 0.9 | 0.598 | 7.7 | 2.72 |
| +I1+I2+I3 | 0.95 | 0.849 | 0.909 | 0.608 | 9.4 | 2.6 |
| +I1+I2+I3+I4 | 0.948 | 0.857 | 0.915 | 0.613 | 9.4 | 2.6 |
Note: I1 - CRIE; I2 - SRA-DFF; I3 - NTTAA; I4—GIoU.
Table 5.
Comparison of Classic Models in the YOLO Series.
| Model | P | R | mAP50 | mAP50-95 | GFLOPs | Params/106 |
|---|---|---|---|---|---|---|
| YOLOv5n | 0.94 | 0.787 | 0.879 | 0.568 | 5.8 | 2.18 |
| YOLOv5s | 0.942 | 0.845 | 0.911 | 0.616 | 18.7 | 7.81 |
| YOLOv6n | 0.929 | 0.819 | 0.893 | 0.591 | 11.5 | 4.16 |
| YOLOv8n | 0.937 | 0.819 | 0.893 | 0.591 | 6.8 | 2.68 |
| YOLOv9t | 0.915 | 0.819 | 0.886 | 0.592 | 6.4 | 1.73 |
| YOLOv9s | 0.938 | 0.852 | 0.913 | 0.623 | 22.1 | 6.19 |
| YOLOv10n | 0.929 | 0.814 | 0.897 | 0.592 | 8.2 | 2.69 |
| YOLO11n | 0.933 | 0.818 | 0.89 | 0.587 | 6.3 | 2.58 |
| YOLO11n-SMSH | 0.948 | 0.857 | 0.915 | 0.613 | 9.4 | 2.6 |
Table 6.
The performance of the YOLO11n-SMSH model on the Det-Fly dataset.
| Block | P | R | mAP50 | mAP50-95 |
|---|---|---|---|---|
| YOLO11n(baseline) | 0.939 | 0.8 | 0.872 | 0.53 |
| YOLO11n-SMSH(ours) | 0.952 | 0.842 | 0.888 | 0.548 |
Disclaimer/Publisher’s Note: The statements, opinions and data contained in all publications are solely those of the individual author(s) and contributor(s) and not of MDPI and/or the editor(s). MDPI and/or the editor(s) disclaim responsibility for any injury to people or property resulting from any ideas, methods, instructions or products referred to in the content. |
© 2025 by the authors. Licensee MDPI, Basel, Switzerland. This article is an open access article distributed under the terms and conditions of the Creative Commons Attribution (CC BY) license (http://creativecommons.org/licenses/by/4.0/).
Copyright: This open access article is published under a Creative Commons CC BY 4.0 license, which permit the free download, distribution, and reuse, provided that the author and preprint are cited in any reuse.


