
Submitted:
21 November 2025
Posted:
24 November 2025
You are already at the latest version
Abstract
Electrocardiography (ECG) is a key biosensing technique for assessing cardiac function and autonomic activity. Accurate detection of R-wave peaks and precise calculation of R-R intervals (RRIs) are essential for heart rate variability (HRV) analysis, yet automated detection algorithms remain vulnerable to misdetections caused by noise or baseline fluctuations. Conventional correction methods based on filter or threshold adjustments may introduce new errors, highlighting the need for an intuitive manual correction function. To address this issue, we developed a prototype graphical user interface (GUI)-based ECG viewer implemented in Fortran for high computational efficiency. The system enables interactive insertion or deletion of R-wave peaks with immediate recalculation of RRIs and automatic updates of related analyses, including power spectral density, histograms, Lorenz plots, and polar plots. Validation using synthetic ECG signals at four sampling frequencies (125-1000 Hz) and three time scales (2, 5, and 10 s) compared GUI-derived RRIs with gold-standard RRIs, showing correction errors below 0.7% and stable update times within 20-30 ms. When applied to real ECG recordings from the MIT-BIH Arrhythmia Database using the MLII lead from records 115 and 122, the same RRI-based comparison achieved accuracies exceeding 0.985 at ±10 ms and reaching 1.000 at ±20 ms or higher. These results confirm that the proposed system provides reliable and immediate feedback and is applicable to physiological data. The algorithm may support future applications in research, clinical, and educational domains of biosignal processing.
Keywords:
ECG viewer
; GUI
; R-R interval
; signal correction
; biosignal processing
1. Introduction
Electrocardiography (ECG) is a representative biosensor that noninvasively measures weak bioelectrical signals, and improving the accuracy of these signals is essential for reliable applications. ECG is widely used as a measurement tool across various medical and physiological fields, including the diagnosis of cardiovascular diseases, assessment of autonomic nervous system activity, and exercise physiology research [1,2,3,4,5]. Since ECG records the electrical activity of the heart over time, analysis of the rhythm and morphology of the waveform enables the evaluation of both normal and abnormal cardiac events, as well as subtle changes in cardiac function. In particular, the R-R interval (RRI), defined as the interval between consecutive R-peaks, serves as a fundamental metric in heart rate variability (HRV) analysis and is broadly applied in studies assessing autonomic function, monitoring stress load, analyzing sleep stages, and evaluating exercise responses [6,7,8]. Such applications of ECG highlight its central role in biosignal processing, where cardiac dynamics are analyzed alongside other physiological signals to assess systemic conditions. Furthermore, RRI time-series data, when combined with techniques such as power spectral analysis, time-series analysis, and nonlinear analysis, have been reported to detect subtle changes in cardiac activity that cannot be captured by mean heart rate alone [9,10,11,12,13,14]. Therefore, accurate detection of R-peaks and precise calculation of RRIs are critically important in ECG analysis research.
Automated R-peak detection algorithms, originating from the Pan-Tompkins method proposed in 1985 [15] and subsequent improvements, have been widely utilized to support large-scale data analysis in both research and clinical settings. These algorithms combine multiple processing steps, including noise removal via bandpass filtering, R-peak enhancement using differentiation and squaring, peak shaping through moving integration, and peak extraction via thresholding, to achieve rapid and automated R-peak detection [16,17]. More recently, deep learning-based methods for R-peak detection have also been proposed [18,19,20].
However, baseline variations caused by experimental conditions or subject movement, cases where T-waves exceed R-waves [21], and the presence of noise can result in inaccurate R-peak identification. Such errors reduce the precision of RRI calculation and may introduce inaccuracies in subsequent analyses, such as HRV or stress evaluation. Manual correction of misdetections is burdensome even in short recordings, and the workload increases dramatically in long-term recordings such as 24-hour Holter ECG. Therefore, an efficient and user-friendly function that allows analysts to quickly and intuitively correct R-wave positions is essential. In the present study, the focus is on short-term experimental recordings and partial corrections within long-term or clinical recordings, rather than manual correction of entire long-duration datasets. Traditional approaches typically correct misdetections by readjusting filters or thresholds, but these methods carry the risk of introducing new errors outside the corrected regions, underscoring the need for a manual yet efficient correction function that avoids such trade-offs.
Previously developed software tools include Kubios HRV, widely used for HRV analysis [22]; RR-APET, a Python-based graphical user interface (GUI) tool allowing R-peak editing and batch processing [23]; ECGdeli, a MATLAB-based ECG visualization tool [24]; as well as CEPS [25] and PhysioZoo [26]. These tools provide valuable functionalities for HRV and ECG research, offering extensive metrics and analysis capabilities. However, their support for interactive, immediate correction of single R-peak misdetections remains limited. For example, Kubios HRV provides comprehensive HRV metrics and some manual editing options but does not prioritize immediate propagation of edits across all derived analyses. RR-APET allows GUI-based editing, but corrections are applied in batch rather than supporting fine-grained, single-beat adjustments with immediate updates. ECGdeli is powerful for ECG delineation but does not emphasize interactive correction or immediate recalculation of RRIs, while CEPS and PhysioZoo focus on complexity analysis or mammalian HRV, without a strong emphasis on GUI-based correction. In contrast, the proposed system was specifically designed to address this gap by enabling intuitive, single-event correction. Users can visually identify and directly adjust an R-wave with a single mouse click, after which the RRI time series and related analyses are immediately updated. This unique combination of fine-grained manual correction and immediate feedback distinguishes our system from existing tools.
To address these challenges, this study proposes an ECG viewer equipped with GUI-based correction functionality. The system allows simple manual correction of failed R-peak detection or T-wave misidentification and immediate updating of the RRI time series. By complementing the limitations of automated detection algorithms, the proposed system aims to improve both the efficiency and accuracy of ECG analysis.
2. Design
2.1. Programming Language and Drawing Library
The computational core of the system was implemented in Fortran (FTN95 compiler, Silverfrost Ltd., Manchester, UK), and the DISLIN graphics library was used for drawing. Fortran was chosen because of its high numerical computation performance and compatibility with existing code assets. DISLIN provides versatile two- and three-dimensional graphics functions as well as bitmap output, making it suitable for waveform visualization and interactive drawing.
For the development environment, the Fortran editor on Windows (Plato IDE, version 4.3.0, Silverfrost Ltd., Manchester, UK) was used to implement both the numerical processing and GUI logic. DISLIN (version 10.0, Dislin Software, Göttingen, Germany) was employed for graphics, and the linkage to DISLIN was established through dynamic linking. In Plato IDE, diss32.lib was added as the link library, enabling calls to DISLIN functions. At runtime, disdll.dll, diss32.dll, and the FTN95 runtime library salflibc.dll were placed in the same directory, allowing the graphics functions to be accessed via dynamic linking. The specifications of the PC and display used in this study are summarized in Table 1.
2.2. Viewer Design and Operation
The viewer was designed using the DISLIN functions CALL CURVE and CALL BARS, as illustrated in Figure 1. First, the CALL METAFL('XWIN') function was used to define a graphical output window, with the window size set to approximately 465 mm (H) × 310 mm (V). The screen layout was organized as follows:
(a) Top panel: ECG waveform (cyan) and peak flags (magenta)
(b) Middle panel: RRI time series (cyan)
(c) Bottom panel: From left to right, the power spectral density function of the RRI time series (yellow), histogram (orange), Lorenz plot (green), and polar plot (peach, circular waveform of RRI)
The four analyses were mathematically defined as follows:
Power spectral density (PSD): estimated using the fast Fourier transform (FFT) of the RRI time series r(n):
Histogram: distribution of RRI values r(n) , represented as frequency counts within bins:
Lorenz plot: scatter plot of successive RRIs: (rn, rn+1)
Polar plot: circular mapping of RRIs:
In addition, a toolbar was placed at the top of the screen. The toolbar contained the following buttons: Insert, Delete, Resolution: up, Resolution: down, Reset, and Quit, which could be operated using the left mouse button. Right clicking was disabled.
2.2.1. Time Scale Adjustment
Clicking the Resolution: up button shortened the time scale of the ECG display (e.g., 60 s → 30 s → 10 s), down to a minimum of 1 s. Conversely, the Resolution: down button extended the scale (e.g., 120 s → 180 s → 300 s), up to a maximum of approximately 1 hour at a sampling frequency of 1000 Hz.
These operations affected only the time scale of the ECG graph, without influencing other plots. Clicking outside the toolbar advanced the time axis by one time scale unit. Similarly, pressing the numeric keypad "6" or the right arrow key advanced the display by half a time scale unit, while the Backspace key moved back one unit, and the numeric keypad "4" or the left arrow key moved back by half a unit. Clicking Reset restored the full-length ECG display.
2.2.2. Insert Function
Clicking the Insert button activated insertion mode, indicated by the button turning yellow. In this mode, clicking within the ECG graph frame or pressing the Enter key displayed a vertical line (flag), and the corresponding time was recorded. Clicks or key presses outside the frame were ignored. This function allowed the user to add flags at arbitrary time points simply by positioning the mouse cursor and clicking. Clicking Insert again terminated the mode.
2.2.3. Delete Function
The Delete function removed a flag and its associated time, using an operation similar to the Insert function. By clicking or pressing Enter just before the target flag, the flag and its recorded time were deleted. The deletion interval was fixed at 0.2 s, independent of the sampling frequency. This feature was useful for removing misdetected peaks caused by P- or T-waves.
2.3. Operational Flowchart and Algorithm
The processing flow of the system is illustrated in Figure 2. After acquisition, ECG data were converted into a three-column, two-dimensional array, array(3, ), storing measurement time, ECG values, and peak information as follows:
(a) array(1, i): Measurement time (in seconds or sampling index). For example, at a sampling frequency of 1000 Hz, values such as 0.001 s, 0.002 s, 0.003 s … were stored.
(b) array(2, i): Sampled ECG waveform (raw data).
(c) array(3, i): Flag indicating whether an R-wave peak was detected (1 for peak, 0 otherwise).
The RRI is calculated by extracting the measurement times corresponding to array(3, i) = 1 and computing the time differences between consecutive peaks. With this structure, when the user interactively inserts or deletes an R-wave peak, only the corresponding flag value in array(3, i) is updated, while the raw ECG data remain unchanged. After editing, the RRI is recalculated from the updated array(3, i), interpolated using a spline function, and other graphs (RRI time series, power spectrum, Lorenz plot, histogram, and polar plot) are updated rapidly. This non-destructive raw-data approach with flag updates preserves data integrity and enables lightweight, immediate updates. Thus, error correction and temporal adjustments can be performed intuitively and safely.
Figure 3 compares the ECG before and after editing for a 5-s segment around 2 minutes. In Insert mode (Figure 3, middle), the P- and T-wave times for this segment were extracted, whereas in Delete mode (Figure 3, lower), three R-waves at the same time point were removed. Compared with the unedited version, the RRI time series and other graphs changed accordingly.
After displaying the graphs, the system waited for user input, responding interactively to mouse clicks and keyboard commands. To convert mouse click positions on the screen into time information, the following equation (Eq. (4)) was defined:
Here, xt is the starting time of the currently displayed ECG (s), Time scale is the display length (s), NX is the mouse click x- coordinate (in pixels), Xleft is the x- coordinate of the left ECG axis, and Xright is the x- coordinate of the right ECG axis. This transformation ensured that any mouse click on the screen could be mapped precisely to the corresponding time in the ECG time series, allowing accurate addition or deletion of R-wave peaks.
2.4. ECG Simulation Data for Accuracy Evaluation
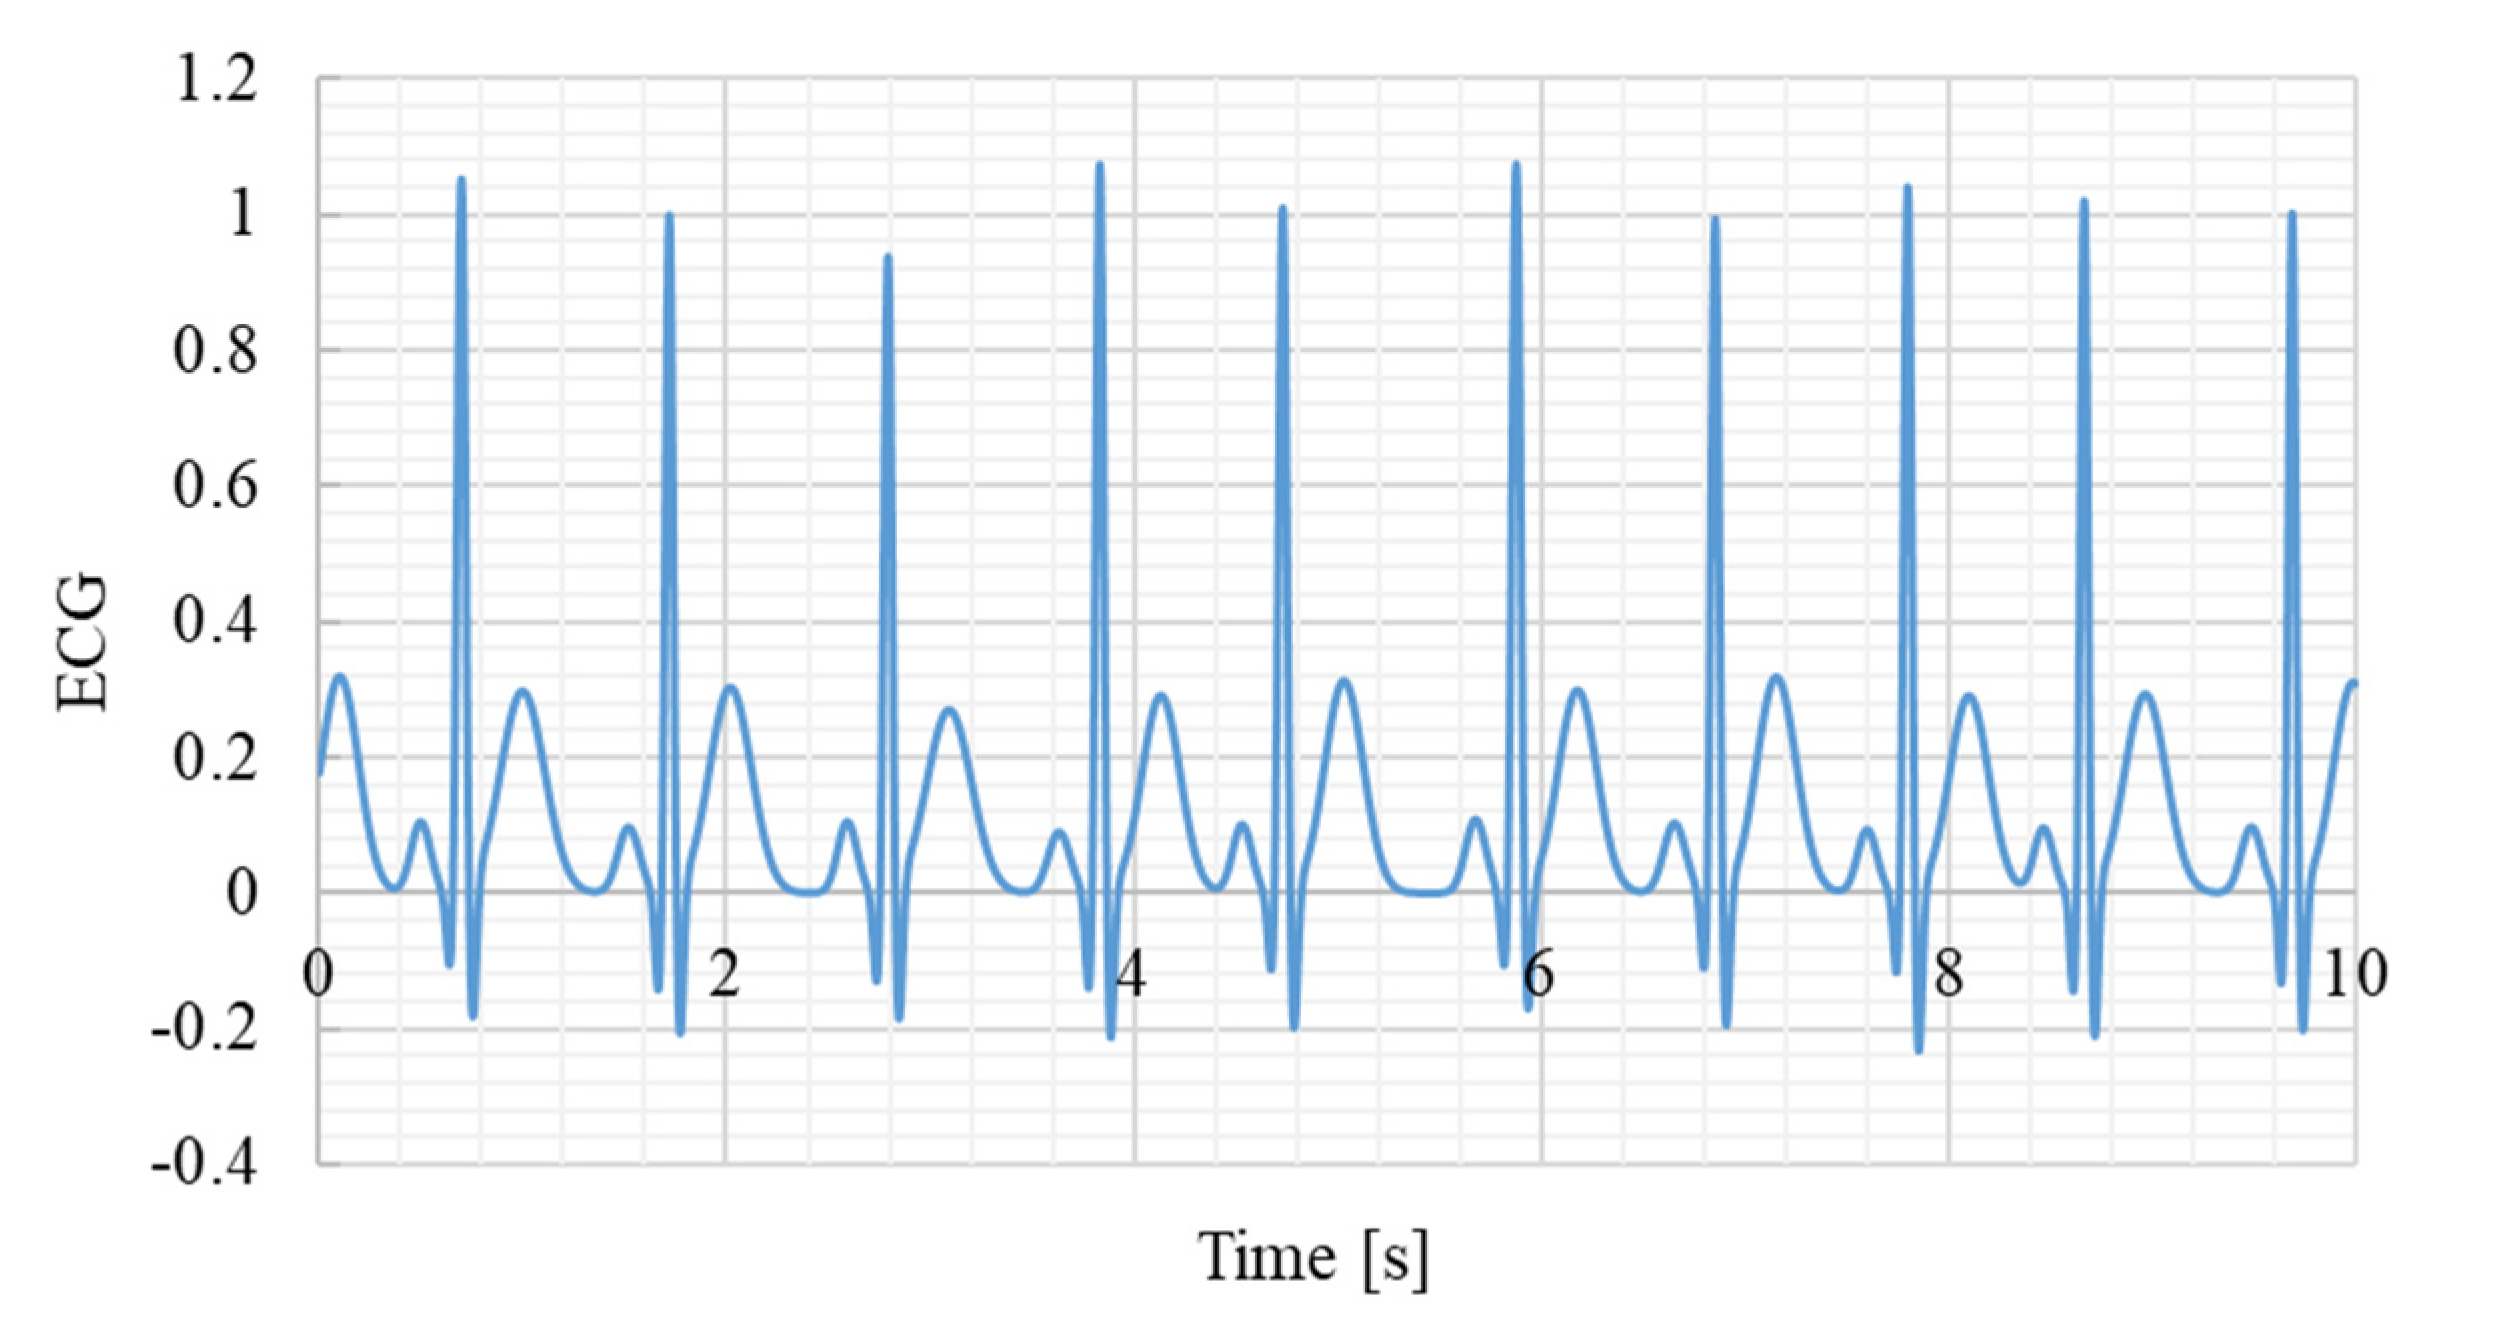
Because R-wave correction in the GUI was performed by converting screen coordinates to time, errors could arise depending on the accuracy of this transformation. Such errors were expected to depend on the ECG sampling frequency and the time scale used for display. To evaluate the accuracy of the system, a synthetic ECG dynamic model was employed (Eq. (5)), in which the P-, Q-, R-, S-, and T-waves were approximated using Gaussian functions with specified amplitudes (Ak), time offsets (tk), and standard deviations (σk). Each parameter was randomly varied within ±10% of its reference value to reproduce beat-to-beat morphological variability (Table 2).
The reference values were derived from the widely used model of McSharry et al. [27], which has become a standard for generating physiologically plausible ECG signals under normal sinus rhythm. Using this model ensured that the simulated ECG retained realistic morphology while providing precise gold-standard R-wave timings for accuracy evaluation. Although the core aim of this study was simply to test the accuracy of the coordinate-to-time transformation—something that could theoretically be evaluated with any waveform containing known peaks—a synthetic ECG was selected to align the validation process with the context of ECG analysis.
Simulation data were generated at sampling frequencies of 125 Hz, 250 Hz, 500 Hz, and 1000 Hz, with cycle lengths set to approximately 1 s, yielding 180 s of synthetic ECG signals. RRI values were calculated from each signal and defined as the gold-standard reference. Then, across 12 conditions (four sampling frequencies × three time scales: 2 s, 5 s, and 10 s), the author manually clicked on R-wave peaks using the mouse cursor, and relative errors between the GUI-derived RRI and the gold standard were computed using Eq. (6). In this validation, the 180 s ECG contained approximately 180 R-wave peaks. All peaks were manually clicked to detect RR intervals, and 180 relative errors were calculated for each condition. The mean and standard deviation of these errors were then obtained.
Figure 4.
Example of a synthetic ECG signal. Sampling frequency 1000Hz.
Additionally, to evaluate system responsiveness, the processing time between using the Insert/Delete functions and updating the graphical display (see Figure 2 flowchart) was measured with the Fortran CALL CPU_TIME function. For each condition (four sampling frequencies × two modes), 30 clicks were performed, and the mean response time was calculated.
Furthermore, to evaluate the accuracy of the GUI-derived RRIs, statistical analyses were performed by comparing GUI-derived values with the simulated gold standard. For each condition (four sampling frequencies × three time scales), the following indices were calculated: the mean ± standard deviation (SD) and 95% confidence interval (CI) of both GUI-derived and simulated RRIs; the mean ± SD of relative errors; the Shapiro-Wilk test (W and p values) to assess the normality of error distributions; and the number of outliers (|z| > 3). In the Shapiro-Wilk test, the null hypothesis was that the error distributions follow a normal distribution, with a significance level of α = 0.05. Thus, p > 0.05 indicated no significant deviation from normality.
All statistical analyses were performed using Python (version 3.12.7). Data handling was conducted with pandas, descriptive statistics with numpy, and normality testing with the Shapiro-Wilk test implemented in scipy.stats.
2.5. Application to Real ECG Data
To verify the applicability of the proposed GUI-based correction method to real data, electrocardiogram (ECG) waveforms from the MIT-BIH Arrhythmia Database (PhysioNet) were analyzed [28,29,30]. Two normal sinus rhythm records were selected: record 115 (1953 R-peaks, 1952 RRIs; rate 50-84 bpm, duration 30 min 06 s) and record 122 (2476 R-peaks, 2475 RRIs; rate 67-97 bpm, duration 30 min 06 s) [31]. Each record contained two ECG leads (MLII and V1); the MLII lead was used in this study because it provides clearer R-wave morphology, as commonly adopted in previous QRS detection benchmarks. The sampling frequency was 360 Hz for both records. The R-wave timestamps provided in the annotation files (.atr) were used as the gold standard.
The author manually clicked all R-waves using the proposed GUI at three time-scale settings (2 s, 5 s, and 10 s) to extract the corresponding RRIs. The GUI-derived RRIs were directly computed from the differences between consecutive clicked R-wave timestamps without any resampling or interpolation, because temporal resampling can introduce phase shifts and distort millisecond-level comparisons between the GUI and the gold-standard data.
For accuracy evaluation, the RRIs derived from the GUI-clicked R-peaks were directly compared with those obtained from the gold-standard annotations. A GUI-derived RRI was regarded as correct if its duration differed from the gold-standard RRI by less than ±10, ±20, ±30, or ±40 ms. Since all R-peaks were visually confirmed, no missed beats occurred.
Therefore, the accuracy was defined as the ratio of RRIs within the specified tolerance to the total number of RRIs in each record, as expressed by Eq. (7):
where denotes the number of RRIs whose differences from the gold standard were within ±10, ±20, ±30, or ±40 ms, and represents the total number of RRIs in the record.
3. Results
Table 3 presents the mean ± SD and 95% CI of simulated RRIs (gold standard reference) and GUI-derived RRIs at different sampling frequencies and time scales. GUI-derived values were obtained from manual peak selections at 2, 5, and 10 s time scales. Across all conditions, GUI-derived RRIs showed close agreement with the simulated reference values, indicating consistency between manual corrections and the gold standard.
Table 4 summarizes the relative errors of GUI-derived RRIs compared with the simulated RRIs. The smallest relative error was 0.146 ± 0.264% at 125 Hz with a time scale of 2 s, whereas the largest error was 0.694 ± 0.601% at 125 Hz with a time scale of 10 s. The smallest standard deviation was ±0.132% at 1000 Hz with a time scale of 10 s. Shapiro-Wilk tests indicated that the error distributions did not significantly deviate from normality (all W > 0.98, p > 0.19), and the number of outliers (|z| > 3) was negligible (≤ 2 cases per condition). These results confirm that GUI-induced errors were small, statistically well- behaved, and robust across different sampling frequencies and time scales.
Table 5 presents the mean and standard deviation of operation response times for Insert and Delete modes across different sampling frequencies. The mean response time for Insert ranged from 25 to 29 ms, while that for Delete ranged from 24 to 30 ms. The standard deviation of response times ranged from 8 to 17 ms for Insert and from 8 to 14 ms for Delete.
Table 6 shows the accuracy of manual R-peak clicking for records MIT-BIH 115, 122, and their combined dataset under different error tolerances (±10-±40 ms) and GUI display time scales. For both records, the accuracy exceeded 0.985 even at the strict ±10 ms tolerance for the 2 s and 5 s display scales, and reached 1.000 at tolerances of ±20 ms or higher.At the 10 s display scale, the accuracy slightly decreased due to waveform compression, which made manual clicking more difficult.
Figure 5 compares the RRI time series obtained from record 115 and 122 (gold standard vs. GUI-derived RRIs at the 10 s scale), showing that both series were almost identical even under the most error-prone condition. These findings confirm that the GUI-based correction method achieves sub-sample-level temporal precision and is robustly applicable to real ECG data.
4. Discussion
The GUI-based ECG viewer developed in this study is characterized by its ability to intuitively and immediately correct R-wave misdetections, distinguishing it from conventional software. For example, Kubios HRV covers a wide range of indices required for heart rate variability analysis and is widely used in both clinical and research settings; however, its R-peak correction functionality is limited [22]. RR-APET, a Python-based tool, allows GUI-driven R-peak editing and batch processing, but it is not fully optimized for immediate RRI updates [23]. ECGdeli is a powerful MATLAB-based tool for ECG visualization and fiducial point detection [24], and tools such as CEPS [25] and PhysioZoo [26] provide specialized functions for complexity analysis and mammalian HRV analysis, respectively. However, all of these tools primarily focus on analysis capabilities, and their GUI interfaces offer limited functionality for interactive and immediate correction of misdetections. More recently, attempts have been made to benchmark HRV analysis toolboxes [32,33], and LightWAVE [34] allows waveform and annotation editing in a browser environment. Yet, the functionality required in short-term experimental settings—namely simple correction of misdetections with simultaneous immediate updates of the RRI series and analysis results—remains insufficient. The proposed algorithm is unique in this regard, as it allows the correction of R-wave misdetections through the GUI while instantly updating the RRI time series, making it potentially applicable to short-term experimental settings.
From an engineering perspective, the system achieves both high accuracy and immediate responsiveness. The relative error of RRIs calculated after GUI-based correction was found to be less than 0.7%, demonstrating that manual corrections can be incorporated without compromising reliability. As shown in Table 4, relative error is minimally affected by sampling frequency but is sensitive to the time scale setting. This is because a longer time scale compresses the waveform per beat, making it difficult to accurately click the R-peak with a mouse, whereas a shorter time scale enlarges the waveform, facilitating visual peak identification and reducing relative error. Therefore, appropriate time scale settings are important for achieving high correction accuracy via GUI operation. Notably, at 125 Hz with a 2 s time scale, the relative error was smallest on average (0.146%), but the standard deviation was relatively large (±0.264%). This suggests that with coarse sampling, even a slight deviation in mouse clicking leads to substantial variability, since each sample point corresponds to a relatively large time step (8 ms). Conversely, at 1000 Hz with a 2 s time scale, the relative error showed the smallest standard deviation (±0.132%). This is because the temporal resolution is high (1 ms per sample), so even if the mouse click deviates by one sample, the resulting error remains small. Statistical analyses further confirmed that the errors introduced by the GUI followed a normal distribution, as indicated by the Shapiro-Wilk test (all W > 0.98, p > 0.19). This finding suggests that the errors primarily reflect random fluctuations in mouse positioning rather than systematic bias in the GUI itself. The number of outliers (|z| > 3) was negligible (≤ 2 per condition), supporting the stability of the error distribution. Taken together, these results indicate that the correction accuracy achieved by the system is statistically reliable, with errors being small and well behaved.
Furthermore, as shown in Table 5, the time required to update the RRI after correction was approximately 20-30 ms and remains stable regardless of the sampling frequency or time scale. This update time includes not only RRI recalculation but also updates of four graphs based on the RRI time series: power spectral density, Lorenz plot, histogram, and polar plot. Despite the relatively high computational load of these analyses, the total processing time remains within 20-30 ms, highlighting the system's immediate responsiveness, which offers significant advantages by providing instant feedback.
To further evaluate its performance, the GUI was further validated using real ECG recordings (MIT-BIH 115 and 122, MLII lead), demonstrating consistent accuracy under physiological conditions. As summarized in Table 6, accuracies exceeded 0.985 even at the strict ±10 ms tolerance and reached 1.000 at ±20 ms or higher for both records, by increasing the display magnification (i.e., using a shorter time scale). This confirms that the GUI maintains sub-sample-level precision not only in simulation but also when applied to real ECG signals. Moreover, the comparison of RRI time series (Figure 5) revealed nearly identical temporal patterns between the GUI-corrected RRIs and the gold-standard annotations, indicating that the proposed system can accurately reflect beat-to-beat variability without temporal distortion. These findings substantiate the robustness of the algorithm in practical use.
A key feature of the proposed algorithm is its simplicity: by maintaining a dedicated flag array that records the positions of detected peaks, the system enables immediate recalculation of the RRI time series whenever peaks are added or removed, without altering the raw ECG data. This non-destructive structure ensures that only the flag values need to be updated, which greatly reduces computational cost and allows near-instantaneous updates of the RRI and associated analyses. The implementation of the system in Fortran is also an important strength in terms of processing speed. Fortran is a compiled language specialized for numerical computation, providing faster execution compared to interpreted languages such as Python or MATLAB. It is widely used in fields such as fluid dynamics, high-speed mathematical model development, and aerospace engineering [35,36,37], and its long-standing track record in high-performance computing (HPC) and numerical analysis is well recognized in academia. For example, its compiled array-based optimization structures and explicit memory access directives can achieve several- to hundred-fold speed improvements compared to Python [38]. Moreover, Fortran supports High Performance Fortran (HPF) for HPC, enabling efficient parallelization using FORALL constructs and PURE procedures [39]. In this system, the GUI and computational modules are closely integrated, and although the entire waveform is recalculated each time, high responsiveness is still achieved. Thus, the Fortran implementation represents a rational design choice emphasizing both performance and responsiveness.
Overall, the results indicate that the proposed system combines low error, low latency, and high efficiency, demonstrating feasibility for immediate updating after R-wave correction in short-term experimental settings. The present study primarily focused on the development and validation of the underlying algorithm, and the GUI was now verified not only with simulated but also with real ECG data (MIT-BIH Database), demonstrating consistent accuracy under physiological conditions. Broader aspects of usability, such as interface layout, toolbar design, and user experience, were not considered in this study and remain subjects for future improvement. Further benchmarking against other available tools and user studies involving multiple operators should be conducted to establish practical applicability and assess inter-rater reliability. Although the current validation mainly targeted R-wave correction, the same algorithmic structure may be extended to other fiducial points (e.g., P-, Q-, S-, and T-waves) or even to other biosignals such as respiration and electromyography (EMG) when displayed as time series. Supplementary Materials include the synthetic ECG signals, GUI-derived RRI data, and demonstration video to ensure transparency and reproducibility.
5. Conclusions
In this study, we proposed a prototype GUI-based ECG viewer equipped with an embedded algorithm for intuitive R-wave correction. The system achieved immediate updating of the R-R interval (RRI) time series and related analyses, with correction errors below 0.7% and update times of 20-30 ms in the simulation tests. When applied to real ECG recordings from the MIT-BIH database (records 115 and 122, MLII lead), the system also demonstrated high accuracy—exceeding 0.985 at a strict ±10 ms tolerance and reaching 1.000 at ±20 ms or higher. These results demonstrate that the system provides reliable and immediate feedback, highlighting its potential usefulness in short-term experimental and analytical contexts.
Moreover, because the proposed algorithm allows manual extraction of arbitrary time points directly from the displayed waveform, it may be extended to derive not only R-R intervals but also P-P and Q-Q intervals. Such an extension should be considered for future applications in research, clinical, and educational domains of biosignal processing.
Supplementary Materials
The following supporting information can be downloaded at the website of this paper posted on Preprints.org. Video S1: Demonstrating the ECG viewer; File S2: synthetic ECG signal used for verification; File S3: RRI_GUI vs gold standard _2s_5s_10s.
| Name | Type | Description |
| S1 | Video (.mp4) | Demonstration of the GUI-based ECG viewer in operation (90 s). |
| S2 | File (.csv) | Synthetic ECG signals used for validation at four sampling frequencies (125, 250, 500, and 1000 Hz). The file contains columns for time, ECG amplitude, and an R-wave peak flag. |
| S3 | File (.csv) | This file contains the simulated RRI (gold standard) as well as the RRI generated by the GUI at three-time scales (2, 5, and 10 s). |
Author Contributions
Conceptualization, Y.Y. ; methodology, Y.Y.; software, Y.Y.; validation, Y.Y., K.Y. ; formal analysis, Y.Y.; investigation, Y.Y.; resources, K.Y.; data curation, Y.Y.; writing—original draft preparation, Y.Y.; writing—review and editing, Y.Y.; visualization, Y.Y.; supervision, K.Y.; project administration, K.Y. All authors have read and agreed to the published version of the manuscript.
Funding
This research received no external funding.
Institutional Review Board Statement
This study used only de-identified ECG data obtained from the publicly available MIT-BIH Arrhythmia Database (PhysioNet). No new human data were collected. According to the institutional guidelines, analyses of publicly available, fully anonymized datasets are exempt from ethical review; therefore, formal ethical approval was not required.
Informed Consent Statement
Not applicable.
Data Availability Statement
The ECG datasets analyzed in this study are publicly available in the PhysioNet repository: MIT-BIH Arrhythmia Database, https://physionet.org/content/mitdb/1.0.0/ (accessed on 1 November 2025). The simulation data generated for this study are provided in the Supplementary Materials.
Conflicts of Interest
The authors declare that they have no competing interests.
Abbreviations
The following abbreviations are used in this manuscript:
| ECG | Electrocardiogram |
| GUI | Graphical User Interface |
| HPC | High Performance Computing |
| HPF | High Performance Fortran |
| HRV | Heart Rate Variability |
| RRI | R-R Interval |
References
- Ahmad, M.; Ahmed, A.; Hashim, H.; Farsi, M.; Mahmoud, N. Enhancing Heart Disease Diagnosis Using ECG Signal Reconstruction and Deep Transfer Learning Classification with Optional SVM Integration. Diagnostics 2025, 15, 1501. [Google Scholar] [CrossRef]
- Nechita, L.C.; Nechita, A.; Voipan, A.E.; Voipan, D.; Debita, M.; Fulga, A.; Fulga, I.; Musat, C.L. AI-Enhanced ECG Applications in Cardiology: Comprehensive Insights from the Current Literature with a Focus on COVID-19 and Multiple Cardiovascular Conditions. Diagnostics 2024, 14, 1839. [Google Scholar] [CrossRef]
- Grégoire, J.M.; Gilon, C.; Carlier, S.; Bersini, H. Autonomic Nervous System Assessment Using Heart Rate Variability. Acta Cardiol. 2023, 78, 648–662. [Google Scholar] [CrossRef]
- Brazdzionyte, R.; Velicka, D.; Motiejunaite, K.; Poderiene, K.; Kairiukstiene, Z. Advanced ECG Analysis to Evaluate Multimodal Exercise Effects on Cardiovascular Health. Medicina 2025, 61, 473. [Google Scholar] [CrossRef]
- Beltrame, J.F.; La, S.; Marathe, J. Clinical Utility of the Humble Exercise ECG Stress Test. J. Am. Coll. Cardiol. 2024, 83, 300–302. [Google Scholar] [CrossRef] [PubMed]
- Peabody, J.E.; Ryznar, R.; Ziesmann, M.T.; Gillman, L. A Systematic Review of Heart Rate Variability as a Measure of Stress in Medical Professionals. Cureus 2023, 15, e34345. [Google Scholar] [CrossRef]
- Eddie, D.; Bentley, K.H.; Bernard, R.; Mischoulon, D.; Winkelman, J.W. Aggregating Heart Rate Variability Indices Across Sleep Stage Epochs Ignores Significant Variance Through the Night. Sleep Med. 2022, 90, 262–266. [Google Scholar] [CrossRef] [PubMed]
- Hebisz, R.G.; Hebisz, P.; Zatoń, M.W. Heart Rate Variability After Sprint Interval Training in Cyclists and Implications for Assessing Physical Fatigue. J. Strength Cond. Res. 2022, 36, 558–564. [Google Scholar] [CrossRef]
- Moura-Tonello, S.C.G.; Carvalho, V.O.; Godoy, M.F.; Porta, A.; Leal, Â.M.O.; Bocchi, E.A.; Catai, A.M. Evaluation of Cardiac Autonomic Modulation Using Symbolic Dynamics After Cardiac Transplantation. Braz. J. Cardiovasc. Surg. 2019, 34, 572–580. [Google Scholar] [CrossRef]
- Santos, M.C.S.; Silveira, L.C.L.; Moura-Tonello, S.C.G.; Porta, A.; Catai, A.M.; Souza, G.D.S. Heart Rate Variability in Multibacillar Leprosy: Linear and Nonlinear Analysis. PLoS One 2017, 12, e0180677. [Google Scholar] [CrossRef] [PubMed]
- Georgieva-Tsaneva, G.; Gospodinova, E. Heart Rate Variability Analysis of Healthy Individuals and Patients with Ischemia and Arrhythmia. Diagnostics 2023, 13, 2549. [Google Scholar] [CrossRef]
- Hargens, T.A.; Chambers, S.; Luden, N.D.; Womack, C.J. Reliability of the Heart Rate Variability Threshold During Treadmill Exercise. Clin. Physiol. Funct. Imaging 2022, 42, 292–299. [Google Scholar] [CrossRef]
- Kumar, S.M.; Vaishali, K.; Maiya, G.A.; Shivashankar, K.N.; Shashikiran, U. Analysis of Time-Domain Indices and Frequency-Domain Measures of Heart Rate Variability Derived from ECG Waveform and Pulse-Wave-Related HRV Among Overweight Individuals: An Observational Study. F1000Res. 2023, 12, 1229. [Google Scholar] [CrossRef]
- Miyagi, T.; Yamazato, M.; Nakamura, T.; Tokashiki, T.; Namihira, Y.; Kokuba, K.; Ishihara, S.; Sakima, H.; Ohya, Y. Power Spectral Analysis of Heart Rate Variability as a Screening Tool for Detecting Sympathetic and Parasympathetic Nervous Dysfunctions in Parkinson's Disease. BMC Neurol. 2022, 22, 339. [Google Scholar] [CrossRef]
- Pan, J.; Tompkins, W.J. A Real-Time QRS Detection Algorithm. IEEE Trans. Biomed. Eng. 1985, 32, 230–236. [Google Scholar] [CrossRef]
- Neri, L.; Oberdier, M.T.; Augello, A.; Suzuki, M.; Tumarkin, E.; Jaipalli, S.; Geminiani, G.A.; Halperin, H.R.; Borghi, C. Algorithm for Mobile Platform-Based Real-Time QRS Detection. Sensors 2023, 23, 1625. [Google Scholar] [CrossRef]
- Agostinelli, A.; Marcantoni, I.; Moretti, E.; Sbrollini, A.; Fioretti, S.; Di Nardo, F.; Burattini, L. Noninvasive Fetal Electrocardiography Part I: Pan-Tompkins' Algorithm Adaptation to Fetal R-Peak Identification. Open Biomed. Eng. J. 2017, 11, 17–24. [Google Scholar] [CrossRef] [PubMed]
- Yun, D.; Lee, H.C.; Jung, C.W.; Kwon, S.; Lee, S.R.; Kim, K.; Kim, Y.S.; Han, S.S. Robust R-Peak Detection in an Electrocardiogram with Stationary Wavelet Transformation and Separable Convolution. Sci. Rep. 2022, 12, 19638. [Google Scholar] [CrossRef] [PubMed]
- Chen, H.; Maharatna, K. An Automatic R and T Peak Detection Method Based on the Combination of Hierarchical Clustering and Discrete Wavelet Transform. IEEE J. Biomed. Health Inform. 2020, 24, 2825–2832. [Google Scholar] [CrossRef]
- Rizwan, A.; Priyanga, P.; Abualsauod, E.H.; Zafrullah, S.N.; Serbaya, S.H.; Halifa, A. A Machine Learning Approach for the Detection of QRS Complexes in Electrocardiogram Using Discrete Wavelet Transform Algorithm. Comput. Intell. Neurosci. 2022, 2022, 9023478. [Google Scholar] [CrossRef]
- Kenny, B.J.; Brown, K.N. ECG T Wave. StatPearls, 2022. Available online: https://www.ncbi.nlm.nih.gov/books/NBK538264/ (accessed on 20 August 2025).
- Tarvainen, M.P.; Niskanen, J.P.; Lipponen, J.A.; Ranta-Aho, P.O.; Karjalainen, P.A. Kubios HRV: Heart Rate Variability Analysis Software. Comput. Methods Programs Biomed. 2014, 113, 210–220. [Google Scholar] [CrossRef]
- McConnell, M.; Schwerin, B.; So, S.; Richards, B. RR-APET: Heart Rate Variability Analysis Software. Comput. Methods Programs Biomed. 2020, 185, 105127. [Google Scholar] [CrossRef]
- Pilia, N.; Nagel, C.; Lenis, G.; Becker, S.; Dössel, O.; Loewe, A. ECGdeli: An Open Source ECG Delineation Toolbox for MATLAB. SoftwareX 2021, 13, 100639. [Google Scholar] [CrossRef]
- Mayor, D.; Panday, D.; Kandel, H.K.; Steffert, T.; Banks, D. CEPS: An Open Access MATLAB Graphical User Interface for the Analysis of Complexity and Entropy in Physiological Signals. Entropy 2021, 23, 321. [Google Scholar] [CrossRef]
- Behar, J.A.; Rosenberg, A.A.; Weiser-Bitoun, I.; Shemla, O.; Alexandrovich, A.; Konyukhov, E.; Yaniv, Y. PhysioZoo: A Novel Open Access Platform for Heart Rate Variability Analysis of Mammalian Electrocardiographic Data. Front. Physiol. 2018, 9, 1390. [Google Scholar] [CrossRef] [PubMed]
- McSharry, P.E.; Clifford, G.D.; Tarassenko, L.; Smith, L.A. A Dynamical Model for Generating Synthetic Electrocardiogram Signals. IEEE Trans. Biomed. Eng. 2003, 50, 289–294. [Google Scholar] [CrossRef]
- Moody, G.B.; Mark, R.G. The Impact of the MIT-BIH Arrhythmia Database. IEEE Eng. Med. Biol. Mag. 2001, 20, 45–50. [Google Scholar] [CrossRef] [PubMed]
- Goldberger, A.L.; Amaral, L.A.N.; Glass, L.; Hausdorff, J.M.; Ivanov, P.C.; Mark, R.G.; Mietus, J.E.; Moody, G.B.; Peng, C.K.; Stanley, H.E. PhysioBank, PhysioToolkit, and PhysioNet: Components of a New Research Resource for Complex Physiologic Signals. Circulation 2000, 101, E215–E220. [Google Scholar] [CrossRef]
- Moody, G.B.; Mark, R.G.; Goldberger, A.L. PhysioNet: Physiologic Signals, Time Series, and Related Open Source Software for Basic, Clinical, and Applied Research. Proc. Annu. Int. Conf. IEEE Eng. Med. Biol. Soc. 2011, 2011, 8327–8330. [Google Scholar]
- PhysioNet. MIT-BIH Arrhythmia Database: Record List and Annotations. Available online: https://www.physionet.org/physiobank/database/html/mitdbdir/records.htm (accessed on 1 November 2025).
- Vest, A.N.; Li, Q.; Liu, C.; Nemati, S.; Shah, A.; Clifford, G.D. Benchmarking Heart Rate Variability Toolboxes. J. Electrocardiol. 2017, 50, 744–747. [Google Scholar] [CrossRef]
- Vest, A.N.; Da Poian, G.; Li, Q.; Liu, C.; Nemati, S.; Shah, A.J.; Clifford, G.D. An Open Source Benchmarked Toolbox for Cardiovascular Waveform and Interval Analysis. Physiol. Meas. 2018, 39, 105004. [Google Scholar] [CrossRef]
- Moody, G.B. LightWAVE: Waveform and Annotation Viewing and Editing in a Web Browser. Comput. Cardiol. 2013, 40, 17–20. [Google Scholar]
- Kulikov, I.; Chernykh, I.; Karavaev, D.; Prigarin, V.; Sapetina, A.; Ulyanichev, I.; Zavyalov, O. A New Parallel Code Based on a Simple Piecewise Parabolic Method for Numerical Modeling of Colliding Flows in Relativistic Hydrodynamics. Mathematics 2022, 10, 1865. [Google Scholar] [CrossRef]
- Kim, B.; Yoon, K.S.; Kim, H.-J. GPU-Accelerated Laplace Equation Model Development Based on CUDA Fortran. Water 2021, 13, 3435. [Google Scholar] [CrossRef]
- Kan, Y.; Liu, X.; Liu, H. An Image and State Information-Based PINN with Attention Mechanisms for the Rapid Prediction of Aircraft Aerodynamic Characteristics. Aerospace 2025, 12, 434. [Google Scholar] [CrossRef]
- Aruoba, B.; Fernández-Villaverde, J. A Comparison of Programming Languages in Macroeconomics. J. Econ. Dyn. Control 2015, 58, 265–273. [Google Scholar] [CrossRef]
- Markus, A.; Mullin, L. Implementing Mathematics of Arrays in Modern Fortran: Efficiency and Efficacy. Software 2024, 3, 534–548. [Google Scholar] [CrossRef]
Figure 1.
Graphical ECG viewer. ECG sampling frequency:1000Hz, data length:3min, data number:180000.
Figure 1.
Graphical ECG viewer. ECG sampling frequency:1000Hz, data length:3min, data number:180000.
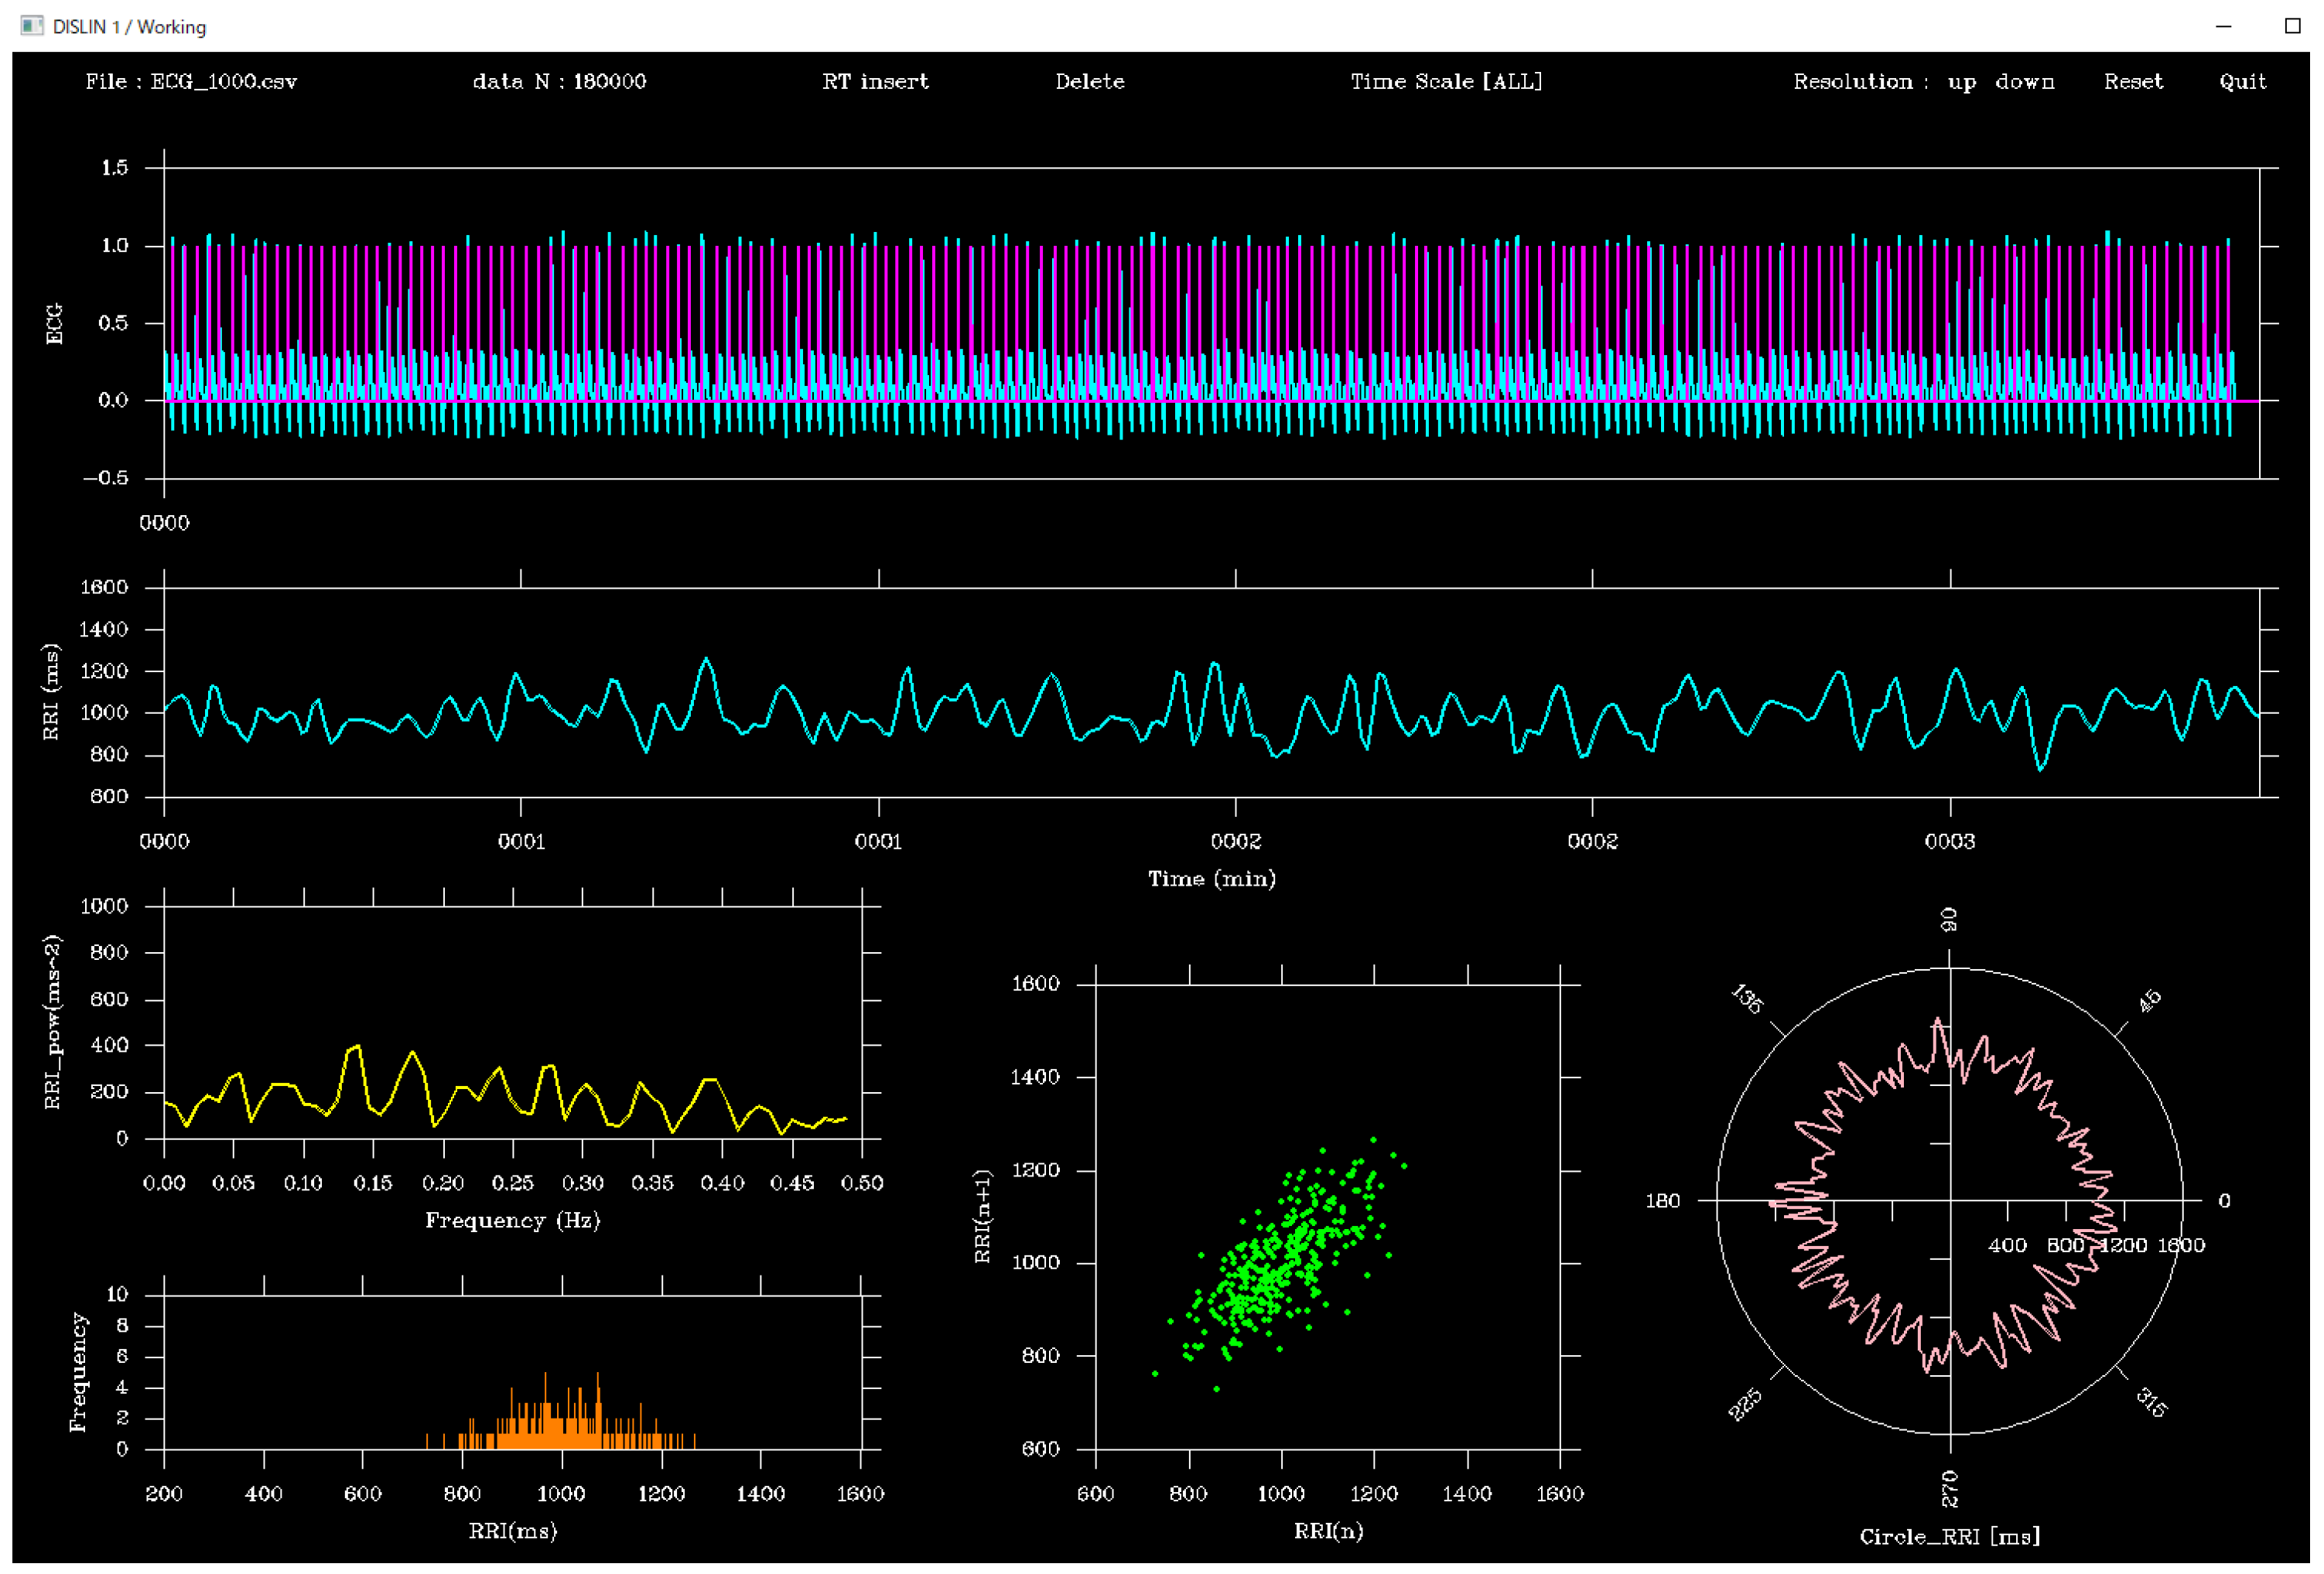
Figure 2.
System flowchart.
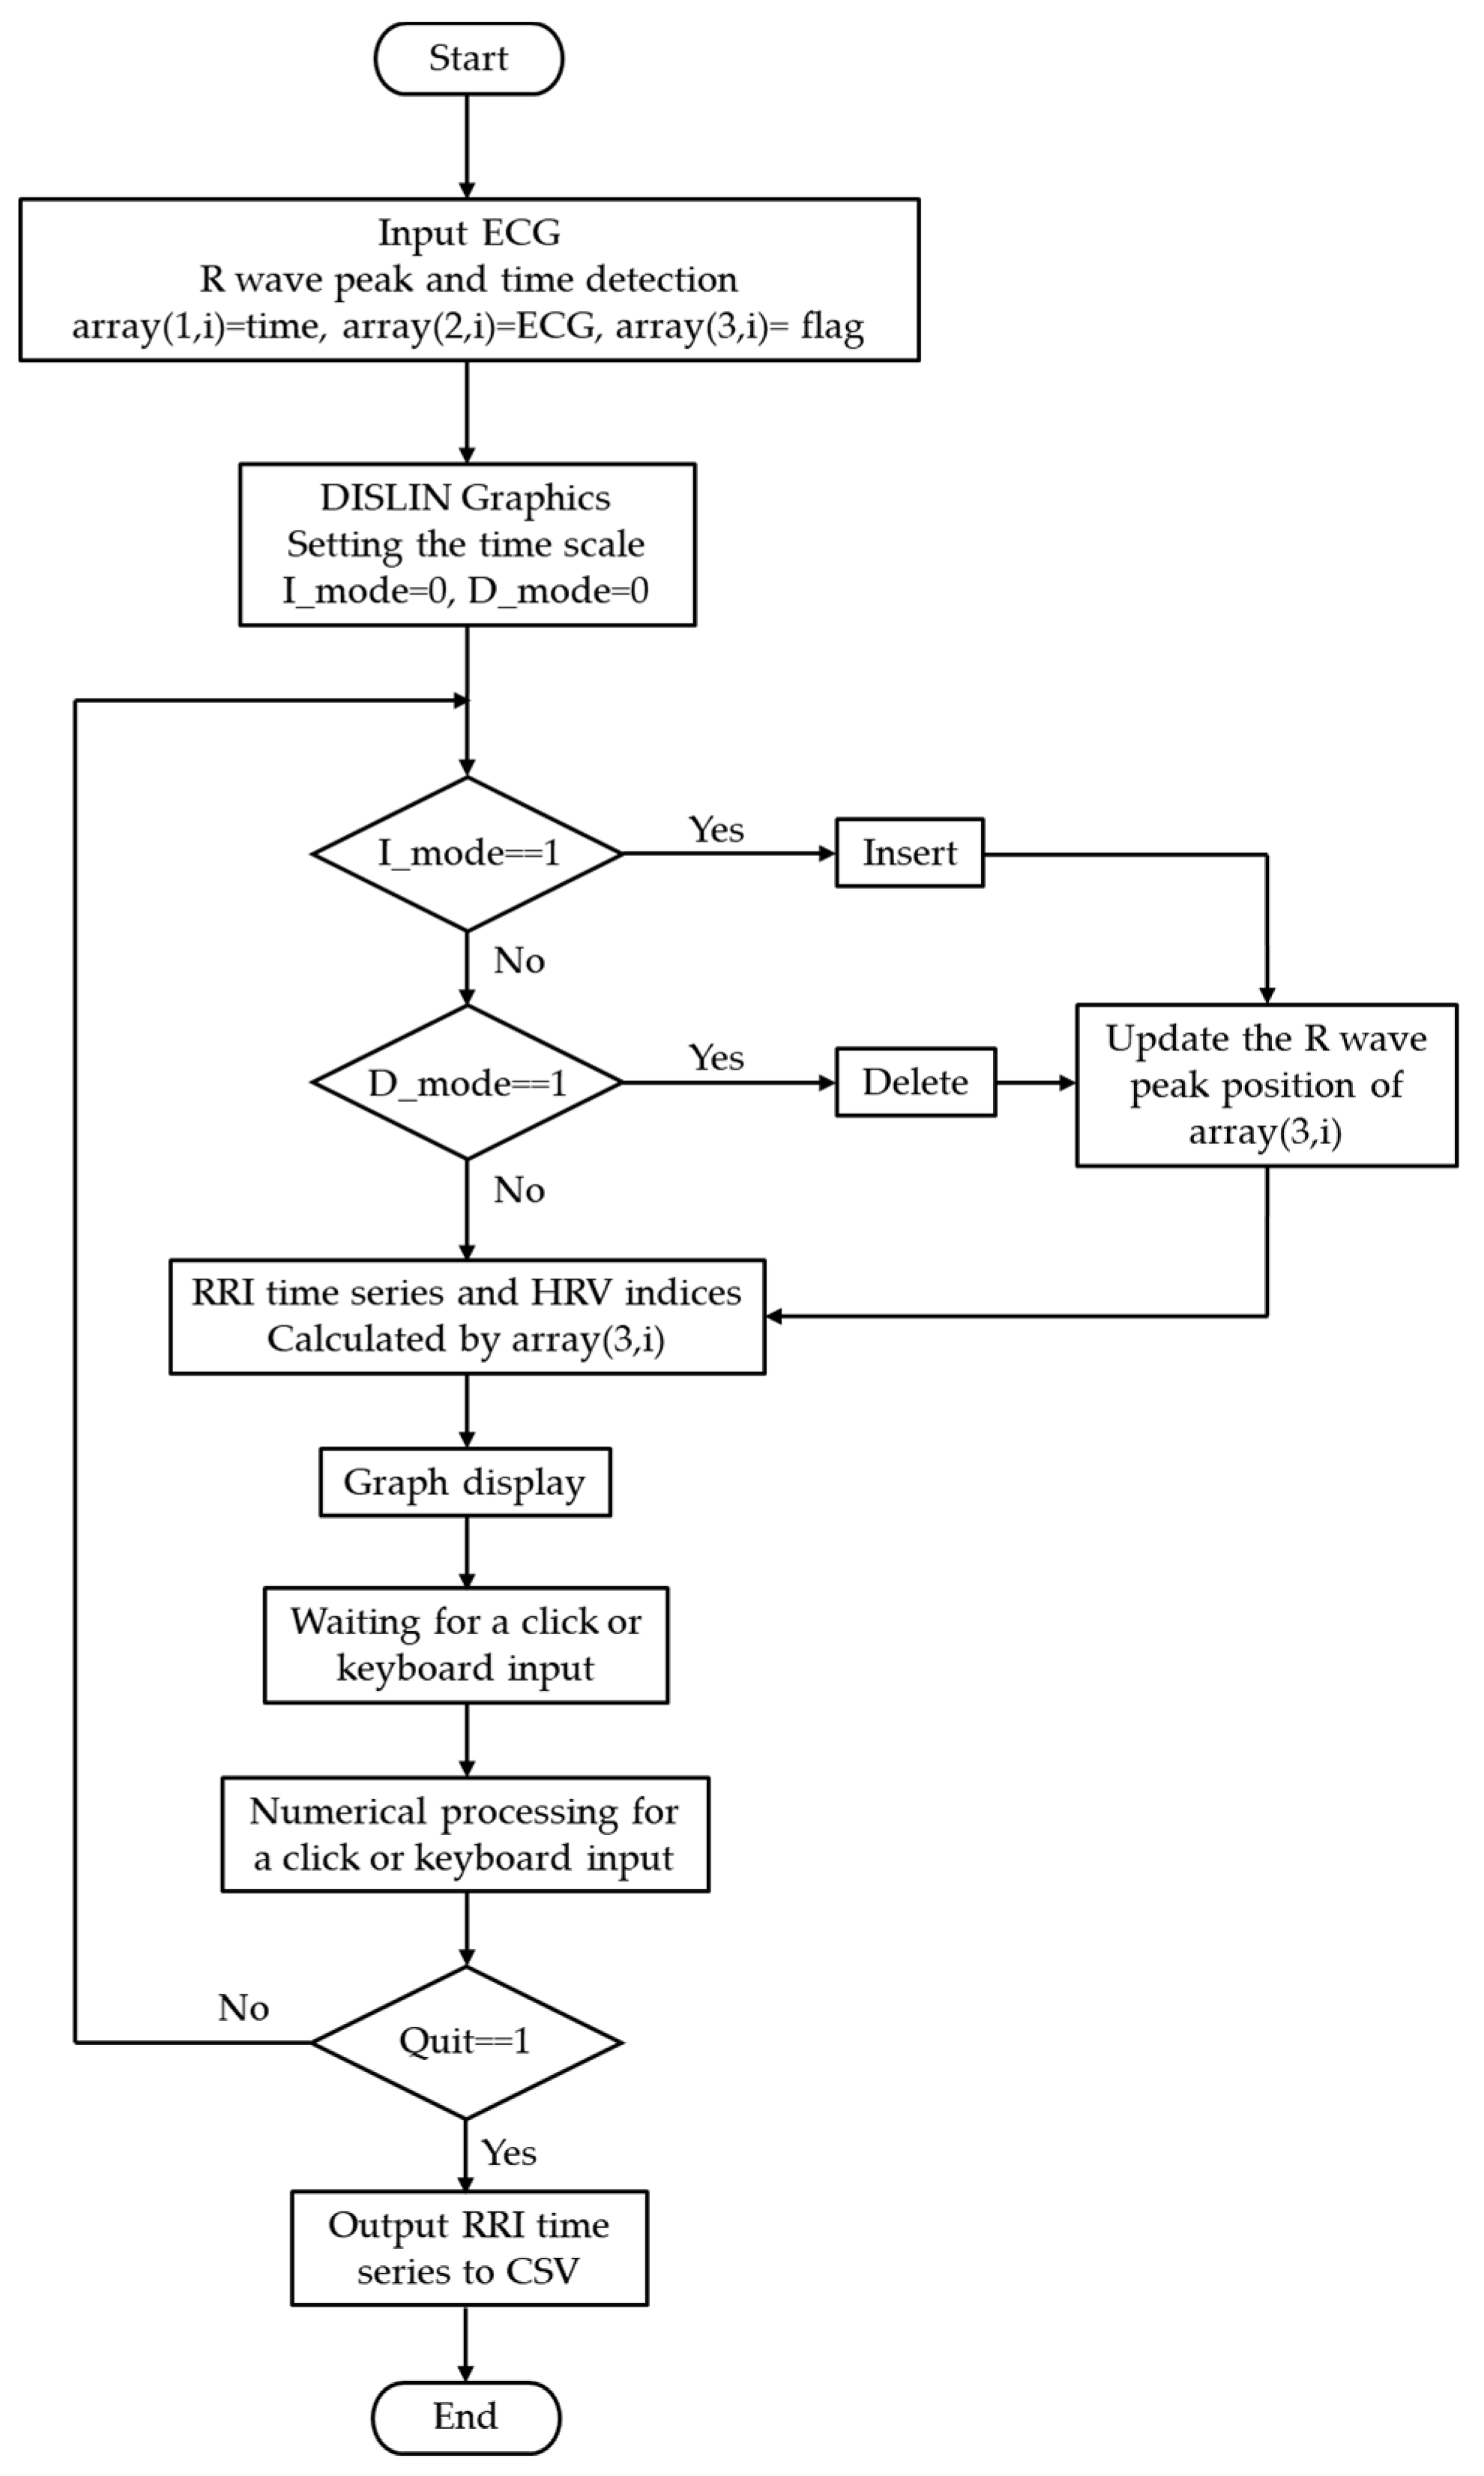
Figure 3.
Comparison before and after insertion/deletion of ECG flags via the GUI. Upper: before editing, Middle: insert mode, Lower: delete mode. Editing the flags alters the RRI time series, which propagates to the other graphs.
Figure 3.
Comparison before and after insertion/deletion of ECG flags via the GUI. Upper: before editing, Middle: insert mode, Lower: delete mode. Editing the flags alters the RRI time series, which propagates to the other graphs.
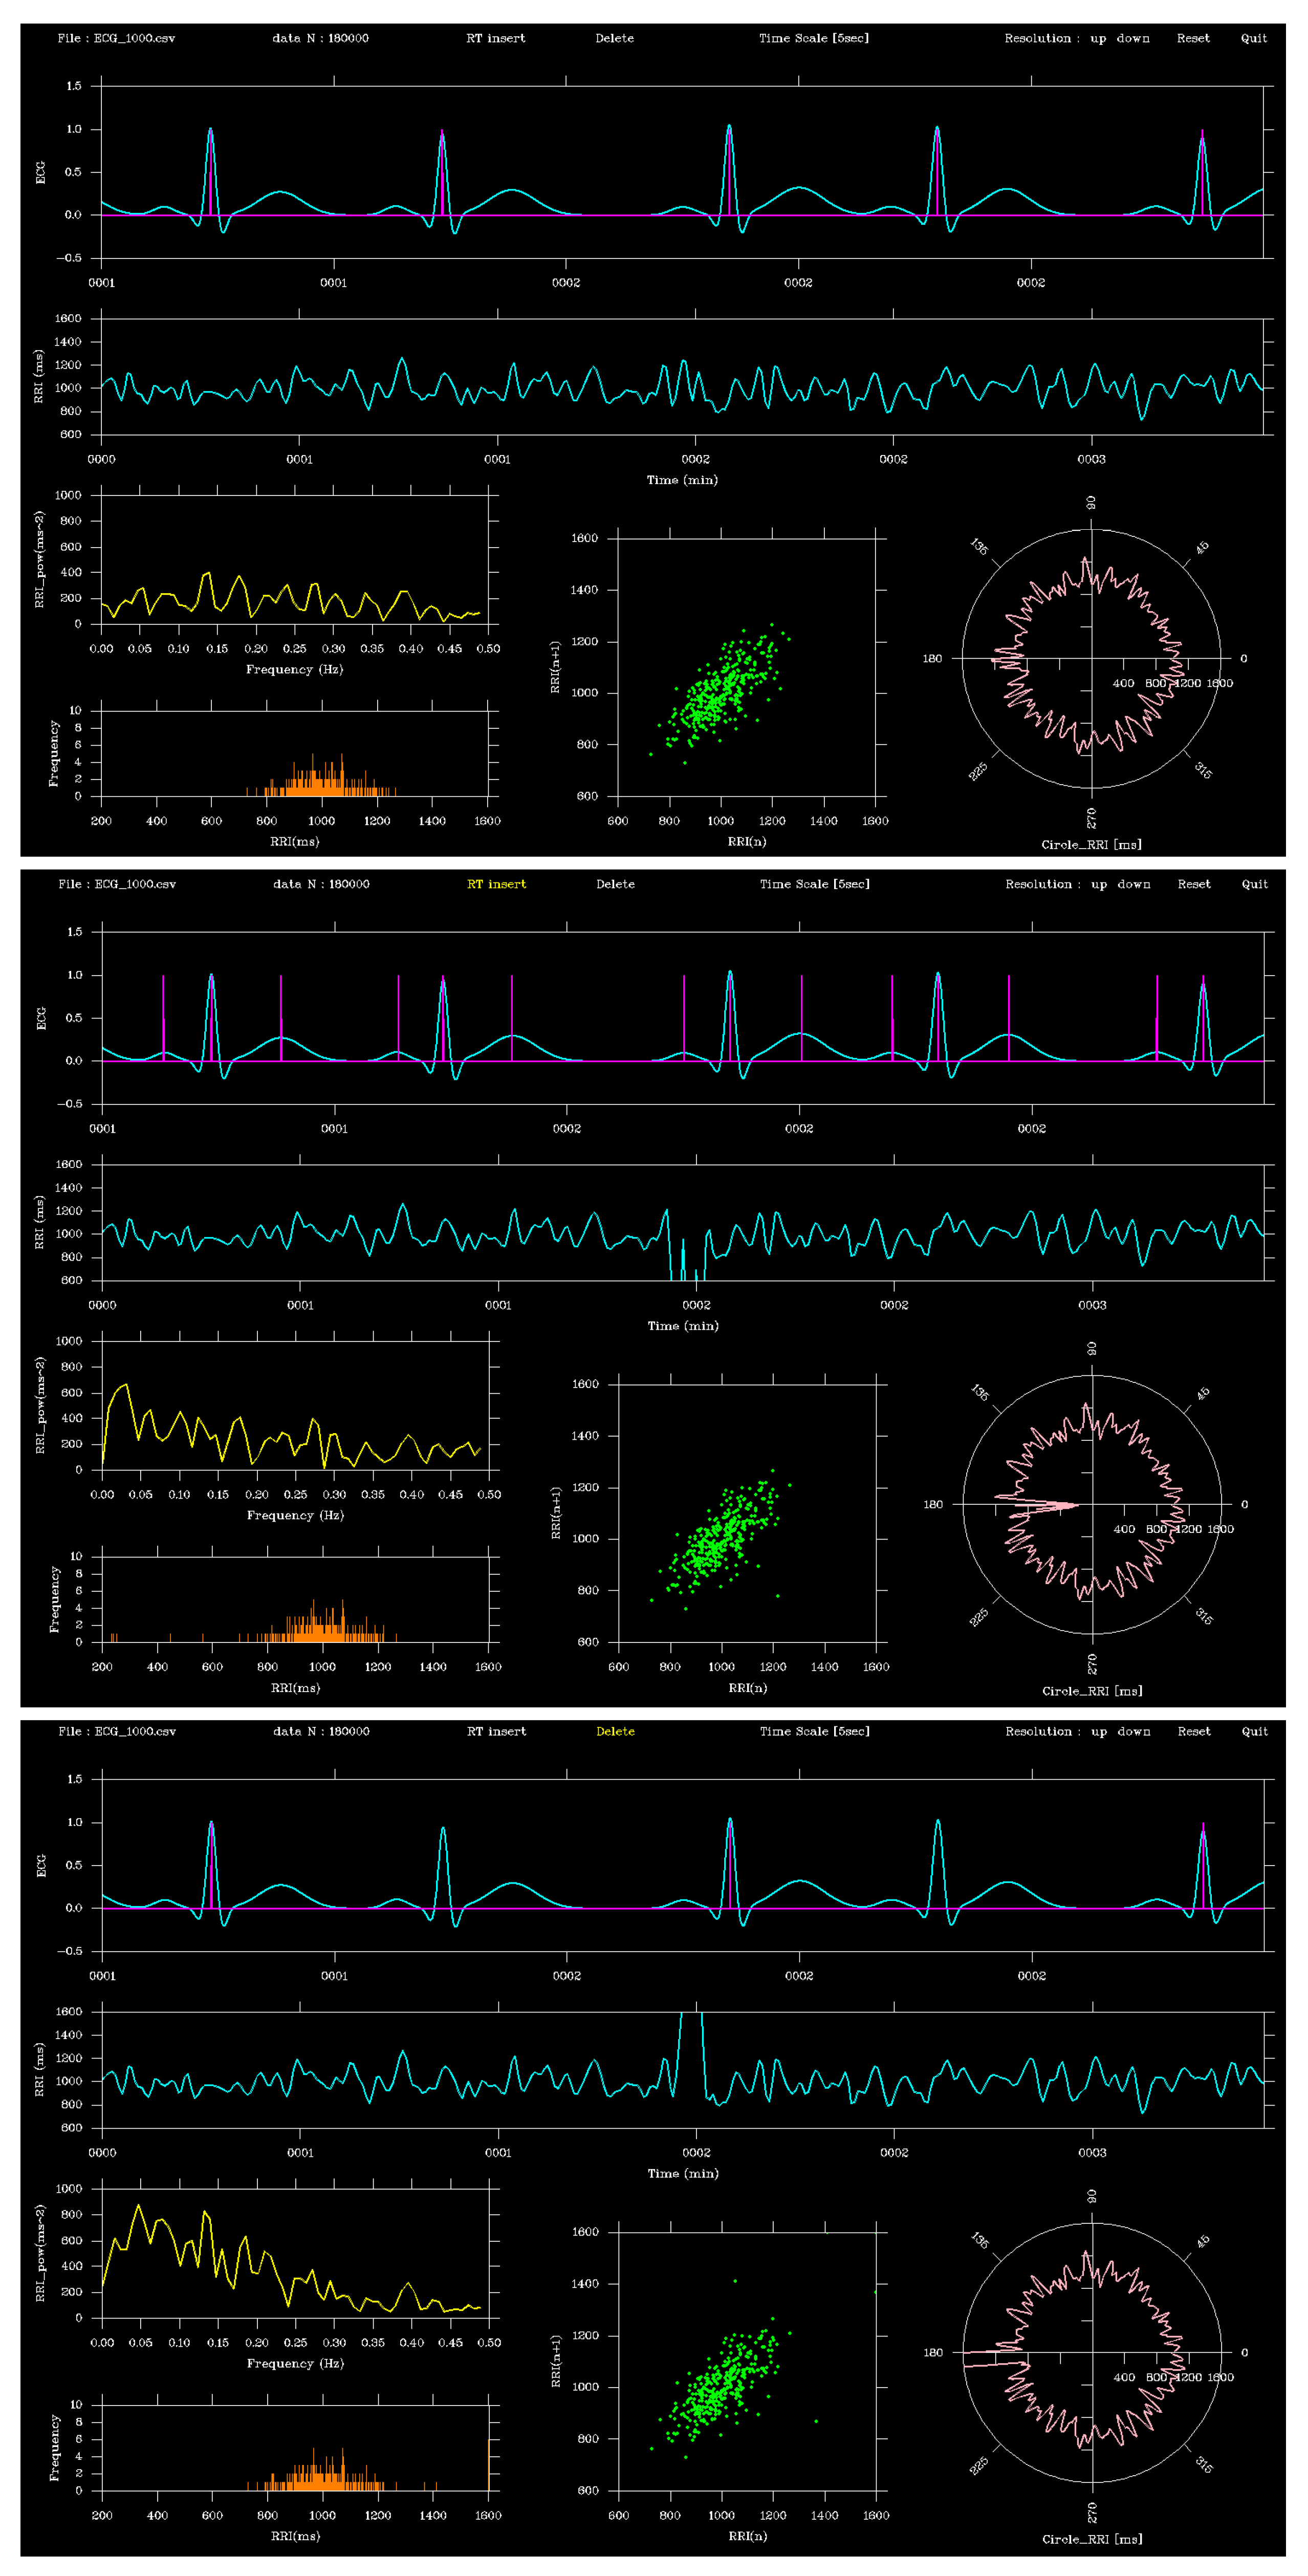
Figure 5.
Comparison of RRI time series obtained from record 115 and 122. The orange line represents the gold-standard RRIs derived from PhysioNet annotations, and the blue line shows RRIs computed from GUI-clicked R-peaks at the 10 s display time scale (MLII lead). Both series were almost identical, indicating sub-sample-level precision of the proposed GUI.
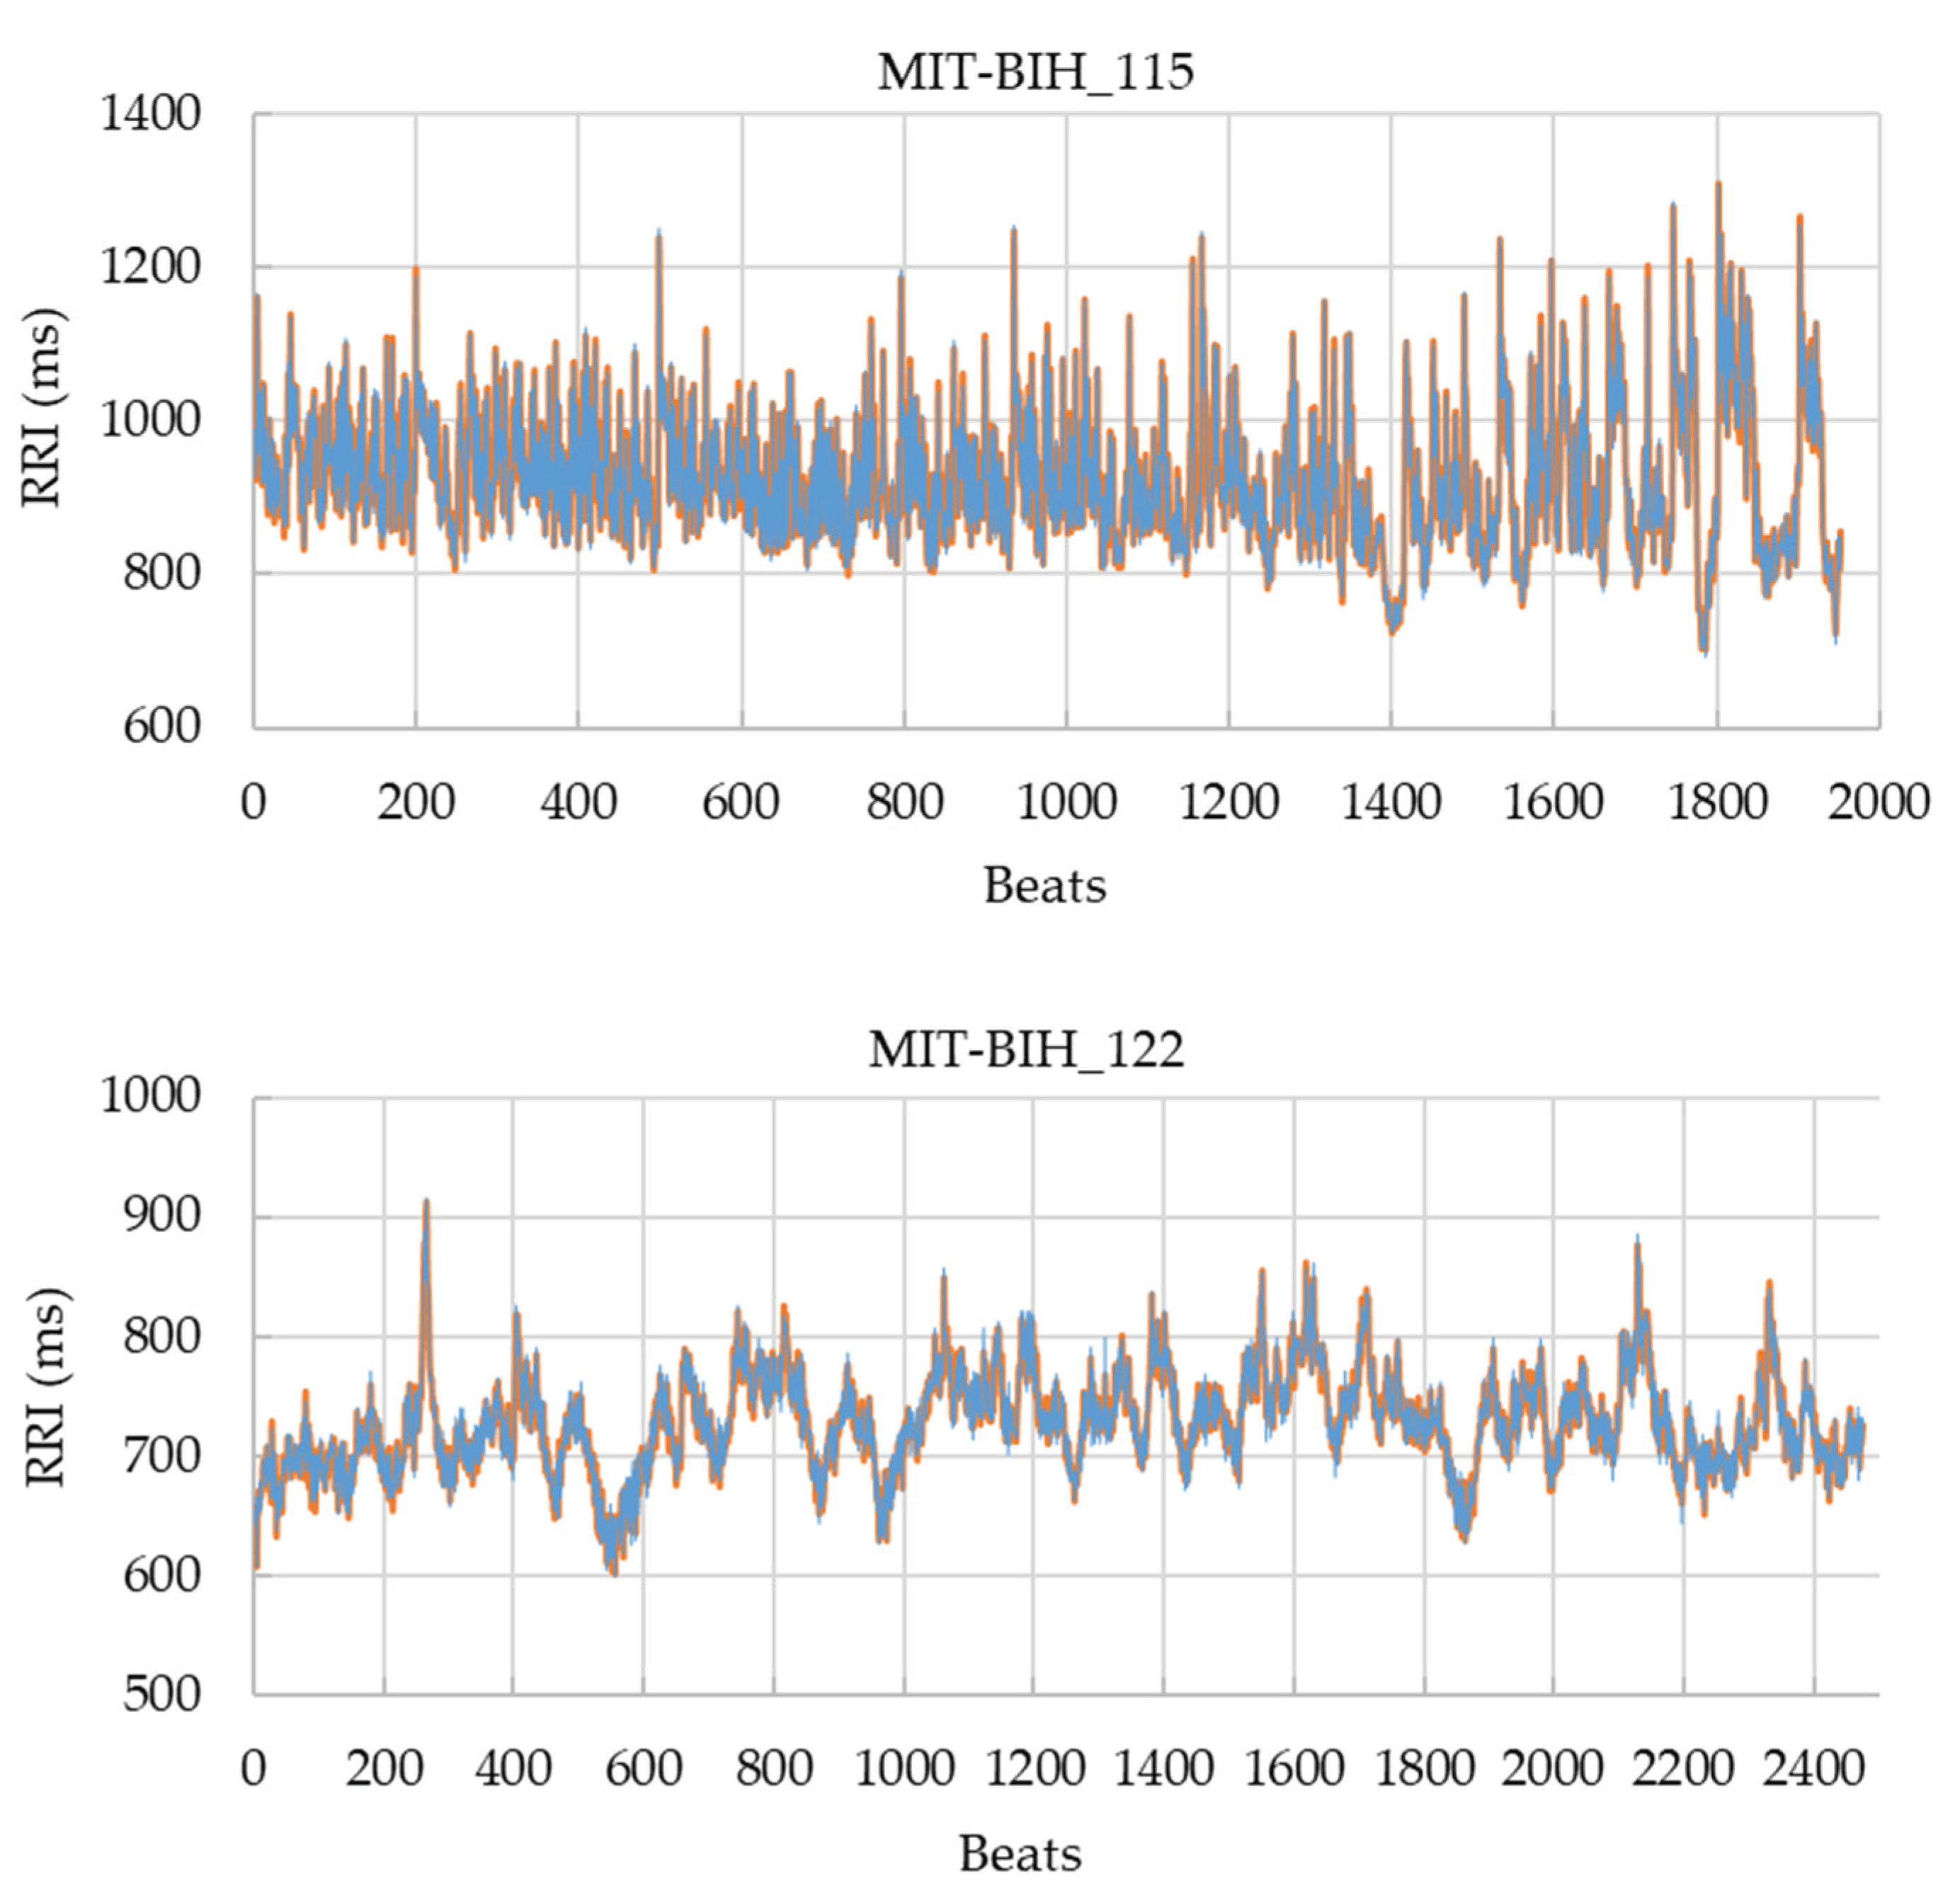

Table 1.
Environmental specifications.
| System Specifications | |
| Operating System | Windows 10, 64-bit |
| Processor | Intel (R) Core (TM) i5-8500 CPU @ 3.00GHz |
| Installed RAM | 16.0 GB |
| Display Specifications | |
| Graphics Card | Intel(R) UHD Graphics 630 (128 MB) |
| Panel Type | 27-inch wide TFT LED, non-glare, ADS panel |
| Maximum Resolution | 1920×1080 |
| Pixel Pitch (H × V) | 0.3114 mm × 0.3114 mm |
| Display Area (H × V) | 597.888 mm × 336.312 mm |
| Maximum Colors | 16.77 million colors |
| Response Time | 14 ms [GTG] (6.1 ms [GTG] with overdrive enabled) |
Table 2.
Parameters of a synthetic ECG dynamic model.
| Wave | tk [s] | Ak | σk [s] |
| P | 0 | 0.15 | 0.025 |
| Q | 0.15 | -0.1 | 0.012 |
| R | 0.2 | 1 | 0.015 |
| S | 0.25 | -0.25 | 0.015 |
| T | 0.5 | 0.35 | 0.05 |
Table 3.
Mean ± SD and 95% CI of simulated RRI and GUI-derived RRI at different sampling frequencies and time scales.
Table 3.
Mean ± SD and 95% CI of simulated RRI and GUI-derived RRI at different sampling frequencies and time scales.
| Sampling frequency [Hz] |
Time scale [s] | GUI_RRI [ms] | Simulation RRI [ms] |
| 125 | 2 | 991±103 (976-1007) | 992±103 (977-1007) |
| 5 | 992±103 (976-1007) | ||
| 10 | 991±102 (976-1007) | ||
| 250 | 2 | 1006±98 (992-1021) | 1007±98 (992-1021) |
| 5 | 1006±98 (992-1021) | ||
| 10 | 1006±98 (992-1021) | ||
| 500 | 2 | 995±94 (981-1009) | 996±94 (982-1010) |
| 5 | 995±94 (981-1009) | ||
| 10 | 995±94 (981-1009) | ||
| 1000 | 2 | 992±100 (977-1007) | 992±100 (977-1007) |
| 5 | 992±100 (977-1007) | ||
| 10 | 992±100 (977-1007) |
Table 4.
Relative errors (Mean ± SD, %) of GUI-derived RRIs compared with simulated RRIs across sampling frequencies and time scales, together with Shapiro-Wilk test results and outlier counts.
Table 4.
Relative errors (Mean ± SD, %) of GUI-derived RRIs compared with simulated RRIs across sampling frequencies and time scales, together with Shapiro-Wilk test results and outlier counts.
| Sampling frequency [Hz] |
Time scale [s] | Relative error [%] | Shapiro-Wilk test | n_outliers (|z|>3) |
|
| W | p-value | ||||
| 125 | 2 | 0.146±0.264 | 0.991 | 0.360 | 0 |
| 5 | 0.362±0.434 | 0.991 | 0.352 | 0 | |
| 10 | 0.694±0.601 | 0.989 | 0.197 | 0 | |
| 250 | 2 | 0.168±0.186 | 0.993 | 0.575 | 2 |
| 5 | 0.372±0.288 | 0.992 | 0.484 | 2 | |
| 10 | 0.674±0.492 | 0.993 | 0.584 | 2 | |
| 500 | 2 | 0.188±0.142 | 0.995 | 0.799 | 0 |
| 5 | 0.372±0.271 | 0.994 | 0.727 | 0 | |
| 10 | 0.649±0.491 | 0.994 | 0.684 | 0 | |
| 1000 | 2 | 0.175±0.132 | 0.990 | 0.259 | 0 |
| 5 | 0.325±0.224 | 0.991 | 0.307 | 0 | |
| 10 | 0.646±0.481 | 0.990 | 0.238 | 0 | |
Table 5.
Operation response time in insert and delete for each sampling time.
| Sampling frequency [Hz] |
Time scale [s] | Insert response time [ms] |
Delete response time [ms] |
| 125 | 2 | 28±10 | 28±10 |
| 5 | 27±17 | 28±12 | |
| 10 | 27±10 | 27±12 | |
| 250 | 2 | 25±8 | 26±10 |
| 5 | 26±16 | 26±10 | |
| 10 | 27±13 | 26±9 | |
| 500 | 2 | 28±9 | 28±9 |
| 5 | 29±14 | 28±14 | |
| 10 | 28±8 | 30±11 | |
| 1000 | 2 | 28±15 | 24±8 |
| 5 | 27±16 | 30±8 | |
| 10 | 27±17 | 29±8 |
Table 6.
Accuracy of manual R-peak clicking for records MIT-BIH dataset under different error tolerances and GUI display time scales.
Table 6.
Accuracy of manual R-peak clicking for records MIT-BIH dataset under different error tolerances and GUI display time scales.
| Record | Time scale [s] | Tolerance of error | |||
| ±10 ms | ±20 ms | ±30 ms | ±40 ms | ||
| MIT-BIH 115 (1952 RRIs) |
2 | 1 | 1 | 1 | 1 |
| 5 | 0.994 (12) | 1 | 1 | 1 | |
| 10 | 0.881 (233) | 0.999 (2) | 1 | 1 | |
| MIT-BIH 122 (2475 RRIs) |
2 | 1 | 1 | 1 | 1 |
| 5 | 0.985 (36) | 1 | 1 | 1 | |
| 10 | 0.828 (426) | 0.992 (20) | 1 | 1 | |
| 115 + 122 combined (4427 RRIs) |
2 | 1 | 1 | 1 | 1 |
| 5 | 0.989 (48) | 1 | 1 | 1 | |
| 10 | 0.851 (659) | 0.995 (22) | 1 | 1 | |
The number in parentheses indicates the number of false negatives.
Disclaimer/Publisher’s Note: The statements, opinions and data contained in all publications are solely those of the individual author(s) and contributor(s) and not of MDPI and/or the editor(s). MDPI and/or the editor(s) disclaim responsibility for any injury to people or property resulting from any ideas, methods, instructions or products referred to in the content. |
© 2025 by the authors. Licensee MDPI, Basel, Switzerland. This article is an open access article distributed under the terms and conditions of the Creative Commons Attribution (CC BY) license (http://creativecommons.org/licenses/by/4.0/).
Copyright: This open access article is published under a Creative Commons CC BY 4.0 license, which permit the free download, distribution, and reuse, provided that the author and preprint are cited in any reuse.


