
Submitted:
01 September 2025
Posted:
02 September 2025
You are already at the latest version
Abstract
This study examines how interaction data from Learning Management Systems (LMS) can be leveraged to predict student performance and enhance academic outcomes through personalized study plans tailored to individual learning styles. The research followed three phases: (i) analyzing the relationship between engagement and performance, (ii) developing predictive models for academic outcomes, and (iii) generating customized study plan recommendations. Clustering analysis identified three distinct learner profiles—high-engagement–high-performance, low-engagement–high-performance, and low-engagement–low-performance—with no cases of high-engagement–low-performance, underscoring the pivotal role of engagement in academic success. Among clustering approaches, K-means produced the most precise grouping. For prediction, Support Vector Machines (SVM) achieved the highest accuracy (68.8\%) in classifying students across 11 grade categories, supported by oversampling techniques to address class imbalance. Personalized study plans, derived using K-Nearest Neighbor (KNN) classifiers, significantly improved student performance in controlled experiments. To the best of our knowledge, this represents the first attempt to align predictive modeling with the full grading structure of undergraduate programs. These findings highlight the potential of integrating LMS data with machine learning to foster engagement and improve learning outcomes. Future work will focus on expanding datasets, refining predictive accuracy, and incorporating additional personalization features to strengthen adaptive learning.
Keywords:
online learning analytics
; fine-grained performance prediction
; student engagement
; personalized study plans
; learning styles
; LMS interaction data
1. Introduction
Over the past two decades, eLearning has progressively evolved into a widely adopted educational paradigm, with its growth accelerating significantly due to the global shift necessitated by the COVID-19 pandemic [1,2,3,4,5]. In response, educational institutions have increasingly embraced online platforms, with Learning Management Systems (LMSs) emerging as a central component in facilitating virtual learning. These platforms support a variety of instructional activities including resource distribution, asynchronous and synchronous communication, collaborative learning, and assessments [6].
Beyond supplementing traditional face-to-face learning, LMSs now serve as the backbone of fully online education environments, offering unprecedented opportunities for self-directed and flexible learning. Consequently, they generate vast amounts of interaction data that reflect student engagement, learning behaviors, and performance patterns. This data-rich environment provides a fertile ground for data-driven educational interventions aimed at improving learning outcomes [7].
Despite these advancements, online learning environments still pose considerable challenges—particularly the lack of face-to-face interaction, which can result in learner isolation, diminished motivation, and inconsistent engagement [8]. Maintaining student interest and ensuring meaningful interaction with course content remain persistent obstacles [9]. Numerous studies have highlighted that student engagement is a key determinant of academic success, strongly correlated with learning outcomes and student satisfaction [10,11]. The same insights are further validated through recent analysis on virtual learning environments, which emphasizes the importance of persistence and consistency in engagement as strong predictors of learning performance [12,13]. Accordingly, numerous successful approaches have been proposed for predicting student performance in online learning environments [14,15]. Despite these developments, technological mechanisms to proactively support engagement and personalization remain underexplored. There is an increasing need for systems that not only predict student performance but also provide actionable, personalized recommendations to enhance learning outcomes—particularly in large-scale online learning environments. As AI continues to be integrated into educational platforms, customized learning experiences are expected to become a fundamental requirement in next-generation Learning Management Systems (LMSs) [16].
In this study, we aim to address this gap by investigating how LMS interaction data can be harnessed to support online learners through personalized study plan recommendations. We conceptualize engagement as the extent of interaction with LMS activities, and performance as the measurable outcome of assessments. The overarching goal is to explore whether personalized, data-driven study plans aligned with individual learning styles can significantly improve student outcomes. The study is guided by the following research questions:
RQ1: What is the nature of the relationship between student engagement with LMS activities and academic performance?
RQ2: How accurately can student performance be predicted based on LMS interaction patterns?
RQ3: How effective are personalized study plans, aligned with learning styles, in enhancing student performance in online learning environments?
The remainder of this paper is organized as follows. Section 2 reviews related work on student engagement, performance prediction, and personalized learning in online education. Section 3 presents the research methodology, including data collection, preprocessing, and model development. Section 4 details the clustering analysis used to explore the relationship between student engagement and academic performance. Section 5 describes the predictive modeling techniques employed to forecast student outcomes. Section 6 introduces the personalized study plan recommendation system and evaluates its effectiveness through a controlled experiment. Section 7 discusses key findings, implications, and limitations, while Section 8 concludes the study and outlines directions for future research.
2. Others’ Work
Over the years, many scholars have examined how student engagement with Learning Management Systems (LMSs) relates to academic performance. These investigations have focused on a variety of engagement indicators—such as login frequency, activity participation, and time spent on learning materials—to understand how online behaviors influence learning outcomes. While these studies offer valuable insights, they often vary in their methods, scope, and practical applicability. In reviewing these works, we focused on how they contribute to understanding the link between engagement and performance in online learning contexts. In the sections that follow, we draw together key findings from this body of work to build a clearer picture of current approaches, and to identify where more reliable, affordable, and scalable solutions could be developed to better support learners in digital environments.
2.1. Student Engagement
Research increasingly recognizes online student engagement as complex and multi-dimensional [17]. Researchers [18] found that behavioral indicators such as logins and participation remain strong predictors of success, while Lawson and Lawson [19] showed that engagement and disengagement can co-exist, undermining binary categorizations. Wang and Yu [20] further demonstrated that longitudinal interaction trajectories, rather than single-time measures, best forecast achievement.
Engagement is also closely tied to self-regulation and academic success [3,18,21,22]. Indicators including resource views, course notes, video access, and MCQs have been widely used. Conijn et al. [23], for example, analyzed 17 blended courses using Moodle LMS, showing that metrics such as session counts, time online, and page views yielded strong predictive power.
Clustering methods have provided new insights into engagement profiles. Johnston et al. [24] and Holicza et al. [25] identified learner groups (e.g., “active” vs. “disengaged”) by combining LMS logs with self-regulated learning data, supporting early-warning systems. Similarly, Du Plooy et al. [26] reported improved academic outcomes in nearly 60% of adaptive, personalized interventions. Yuan et al. [27] showed that sustained patterns across courses and combined short- and long-term interactions yield more reliable predictions than isolated measures.
Overall, engagement is dynamic and context-dependent, unfolding across multiple dimensions and timescales. A meta analysis confirmed that adaptive learning systems significantly enhance both engagement and performance [28] . Yet, a major gap remains: the integration of diverse measures into real-time predictive systems that can deliver timely, personalized interventions for learners and instructors.
2.2. Student Performance
Predicting student performance in e-learning has traditionally relied on interaction logs from virtual learning environments (VLEs). Engagement indicators vary by course design and platform. Pardo et al. [3] used metrics such as resource views, video events, and MCQs to link engagement, self-regulation, and success. Conijn et al. [23] applied multi-level modeling to Moodle data, showing that clicks, session counts, and time online predicted performance. Many researchers have consistently identified correlations between online behaviors and academic outcomes [6,29,30,31,32,33,34].
Recent studies have advanced predictive modeling with more sophisticated approaches [35,36]. A 2024 time-series model integrating behavioral, assessment, and demographic data enabled early detection of at-risk students [37,38]. Holicza et al. [25] compared machine learning models across contexts, showing accuracy varied by dataset. Adaptive tools have also emerged, offering real-time progress analytics and instructor feedback [39].
Together, these findings show an evolution from basic VLE logs to multidimensional, adaptive, and context-aware models. While predictive accuracy continues to improve, is it also noted that the predictions of outcomes are mainly limited to two-classes (eg: pass-fail, good-weak etc), while some others explored the possibility of predicting a few classes (3 to 5). We were unable to locate any study aiming to perform a fine-grained performance outcome, well aligned with the performance grades given at undergraduate programmes (11 classes). The key challenge is developing scalable systems that move beyond prediction to provide timely, actionable interventions.
2.3. Personalized and Adaptive Learning
Adaptive learning has been considered a necessity since many years, and the consideration of different personal characteristics has been prescribed [40]. Recently, the scope of personalized and adaptive learning expanded considerably, with growing emphasis on intelligent and collabora tive systems. For example, Kabudi et al. [41] reviewed approaches that dynamically adjust learning paths, task difficulty, and feedback in response to patterns of student interaction. A cluster-based review published in 2025 further mapped the development of adaptive learning in higher education, identifying emerging trends and trajectories in the field. They highlight the need for implementing learning style based adaptive learning experiences.
Despite these advances, important limitations remain. Hocine [42] observed that many adaptive platforms still lack transparency in explaining how measures of collaboration quality influence system adaptations. This gap highlights the need for clearer frameworks that integrate both individual and collaborative dimensions of learning.
In parallel, the role of artificial intelligence has become increasingly central. A 2025 review emphasized how AI-driven platforms are not only reshaping adaptive pedagogies but also influencing the design of user interfaces [43]. Similarly, a recent study demonstrated that adaptive tools providing personalized feedback and AI-mediated interactions can significantly improve student engagement, particularly among learners with strong digital literacy skills [44].
Taken together, this body of work underscores an important transition: adaptive learning is evolving into more dynamic, AI-integrated ecosystems that personalize experiences with greater precision. Yet, aligning technological sophistication with pedagogical clarity remains a critical frontier for future research.
3. Research Design
The research was carried out in three distinct phases: (1) identifying the relationships among learner engagement, interaction behavior, and academic performance; (2) predicting student performance based on these behavioral indicators; (3) recommending personalized study plans based on individual learning styles. The overall research design concept, highlighting the key artifacts and deliverables associated with each stage of the research process is depicted in Figure 1.
The three components of the research are highly interconnected and heavily reliant on a unified dataset comprising student interaction data and performance records. During the cluster analysis phase, the relationship between student engagement and academic performance was examined using both interaction and performance data. In the student performance prediction phase, engagement and performance metrics were used as inputs to a predictive model, which estimated expected academic outcomes based on current behavioral patterns. Additionally, to facilitate personalized study plan recommendations, individual learning styles were collected and systematically mapped to the corresponding interaction and performance data.
The evaluation of the study plan recommendation was conducted through a controlled experiment. Participants were randomly assigned to either an experimental group or a control group. Prior to the commencement of the experiment, the study procedure was clearly explained to all participants, and informed consent was obtained. Subjects in the experimental group were provided with personalized study plans, while those in the control group did not receive any intervention. To assess the effectiveness of the proposed study plan, the actual academic grades achieved by participants in both groups were compared against their respective predicted grades. The impact of the personalized study plan on academic performance was thus evaluated. Further details of the evaluation procedure are presented in the Study Plan Recommendation section.
3.1. Data Collection and Preprocessing
This study required data from three key perspectives: (1) how students interacted with the learning platform, (2) their academic performance, and (3) their individual learning styles.
Participants (N=846) were selected from the Faculty of Information Technology at the University of Moratuwa, Sri Lanka, using a convenience sampling method. The sample included undergraduates from three consecutive academic years—students in their second, third, and final years. From the wide range of courses offered through the Moodle LMS, six course modules were chosen for this study: Data Mining and Data Warehousing, Human-Computer Interaction, Software Engineering, Object-Oriented Analysis and Design, Management Information Systems, and Database Management Systems. These courses were selected because they posed similar levels of difficulty, helping ensure that students had a fairly uniform learning experience.
- Interaction Data: The interaction data were extracted from Moodle’s system logs. These logs recorded every action performed on the LMS—not just by students, but also by instructors and administrators. Since the focus was on student behavior, the first step was to filter out only the student interactions. Then, the data were cleaned and processed to highlight meaningful learning activities. For each student, the number of interactions with each learning activity was counted using a custom Python program developed specifically for this purpose. The processed data were saved as a .CSV file for use in the later stages of the research.
- Performance Data: The students’ academic performance was recorded based on their final grades for the selected course modules.
- Learning Style Data: To understand each student’s preferred learning style, the VARK questionnaire was used. This tool helped classify students into four categories—Visual, Auditory, Reading/Writing, and Kinesthetic learners.
Finally, using Moodle’s event log fields such as event context, component, and event name, a new dataset was built to support the modeling work in this study. Out of all possible events, twelve features were selected to represent key aspects of student interaction behavior. A detailed description of these features is provided in Table 1.
3.1.1. Data Anonymization, Cleaning, and Transformation
To protect the privacy of participants and prevent direct identification of individual records, each student was assigned a unique identification number. This anonymized ID replaced the original index number and was also used when completing the VARK learning style questionnaire. The mapping between students’ learning styles and their interaction and performance data was established through these anonymized IDs.
Before proceeding to model development and cluster analysis, the combined dataset underwent several preprocessing and enhancement steps. First, missing values in the interaction data—where students had not performed certain actions—were replaced with zero (0), signifying no activity or engagement with the corresponding item. In cases where performance data were missing, the mean value of the respective feature column was imputed using the Weka software.
The resulting dataset included a total of 1,709 records, representing 846 students. As the anonymized student ID did not contribute to the prediction of academic performance, this attribute was excluded from the final dataset.
To address potential outliers, a percentile-based filtering technique was applied using the quantile method in the pandas library. Specifically, values falling below the 0.001 percentile or above the 0.999 percentile within each feature column were considered outliers and were subsequently removed.
Even after outlier removal, the dataset could still contain inconsistencies in scale or distribution that might affect the performance of machine learning models. Therefore, additional data transformation techniques were applied to produce a more symmetrically distributed dataset. These pre-processing and transformation steps were executed using the pandas and scikit-learn libraries in Google Colab, resulting in a clean, well-structured dataset suitable for modeling.
3.2. Selection of Tools and Technologies
This study adopted a structured approach to explore the relationship between student engagement and academic performance in online learning environments. A combination of clustering algorithms, machine learning prediction models, and personalized recommendation techniques was employed. The selection of each method was grounded in its suitability for the dataset and its alignment with the study’s objectives. Together, these techniques enabled a comprehensive analysis of learner behavior, accurate performance forecasting, and the development of tailored study support strategies.

Table 2.
Overview of Modeling Techniques Used in the Study
| Category | Model/Tool Name | Purpose | Key Characteristics | Reasons for Inclusion |
|---|---|---|---|---|
| Clustering | K-Means [45,46] | Partition data by minimizing distance to cluster centroids | Minimizes intra-cluster distance; fast and scalable | Efficient for large datasets; provides clear separation for identifying engagement-performance patterns. |
| Hierarchical Clustering [45,47,48,49] | Group data into hierarchical clusters based on similarity | Tree-based structure; interpretable for nested clusters | Explores nested or tree-like engagement patterns missed by K-Means. | |
| Gaussian Mixture Model [45] | Probabilistic soft clustering using Gaussian distributions | Allows overlapping clusters; probabilistic assignment | Reflects mixed behavior patterns common in student interaction data. | |
| DBSCAN [50,51] | Density-based clustering; detects noise and irregular clusters | No need for predefined clusters; robust to noise | Detects outlier engagement behavior; useful for irregular patterns. | |
| Performance Prediction | Support Vector Machine (SVM) [52] | Multi-class classification via one-vs-one binary classifiers | Handles non-linear boundaries; uses multiple binary classifiers | Strong performance for high-dimensional LMS interaction features. |
| Random Forest [53] | Ensemble of decision trees using majority voting | Robust to overfitting; effective with large data | Interpretable and handles many features with minimal preprocessing. | |
| Softmax Regression [54] | Probabilistic multi-class classification using softmax function | Simple, interpretable; less suited for non-linear patterns | Serves as a baseline model; useful for comparison and clarity. | |
| XGBoost [55] | Boosted decision trees for high accuracy and scalability | Scalable; handles imbalanced data well; parallel processing | Known for high accuracy and efficiency in tabular LMS data. | |
| Recommendation | K-Nearest Neighbor (KNN) [56] | Instance-based recommendation using nearest neighbors | Simple, interpretable; effective for small datasets | Intuitive and works well for personalized recommendations. |
| Neural Networks [56] | Pattern recognition and classification using deep learning | Captures complex, non-linear patterns; data-intensive | Useful for deep modeling of learning behavior if sufficient data exists. | |
| Collaborative Filtering [57] | User-item similarity-based study plan suggestions | Content-independent; based on peer interaction patterns | Leverages behavioral similarities for tailored recommendations. | |
| VARK Questionnaire [57] | Assess students’ learning preferences | Categorizes learners into Visual, Aural, Read/Write, Kinesthetic | Aligns study plans with individual learning modalities for relevance. |
4. Results
4.1. Relationship Between Student Engagement and Academic Performance
Student engagement and academic performance are both highly variable and context-dependent factors. Given the absence of predefined classes or optimal clustering criteria, an exploratory cluster analysis was conducted to uncover patterns in the data. The objective was to identify natural groupings of students based on their interactions with the Learning Management System (LMS) and examine how these groupings relate to academic outcomes.
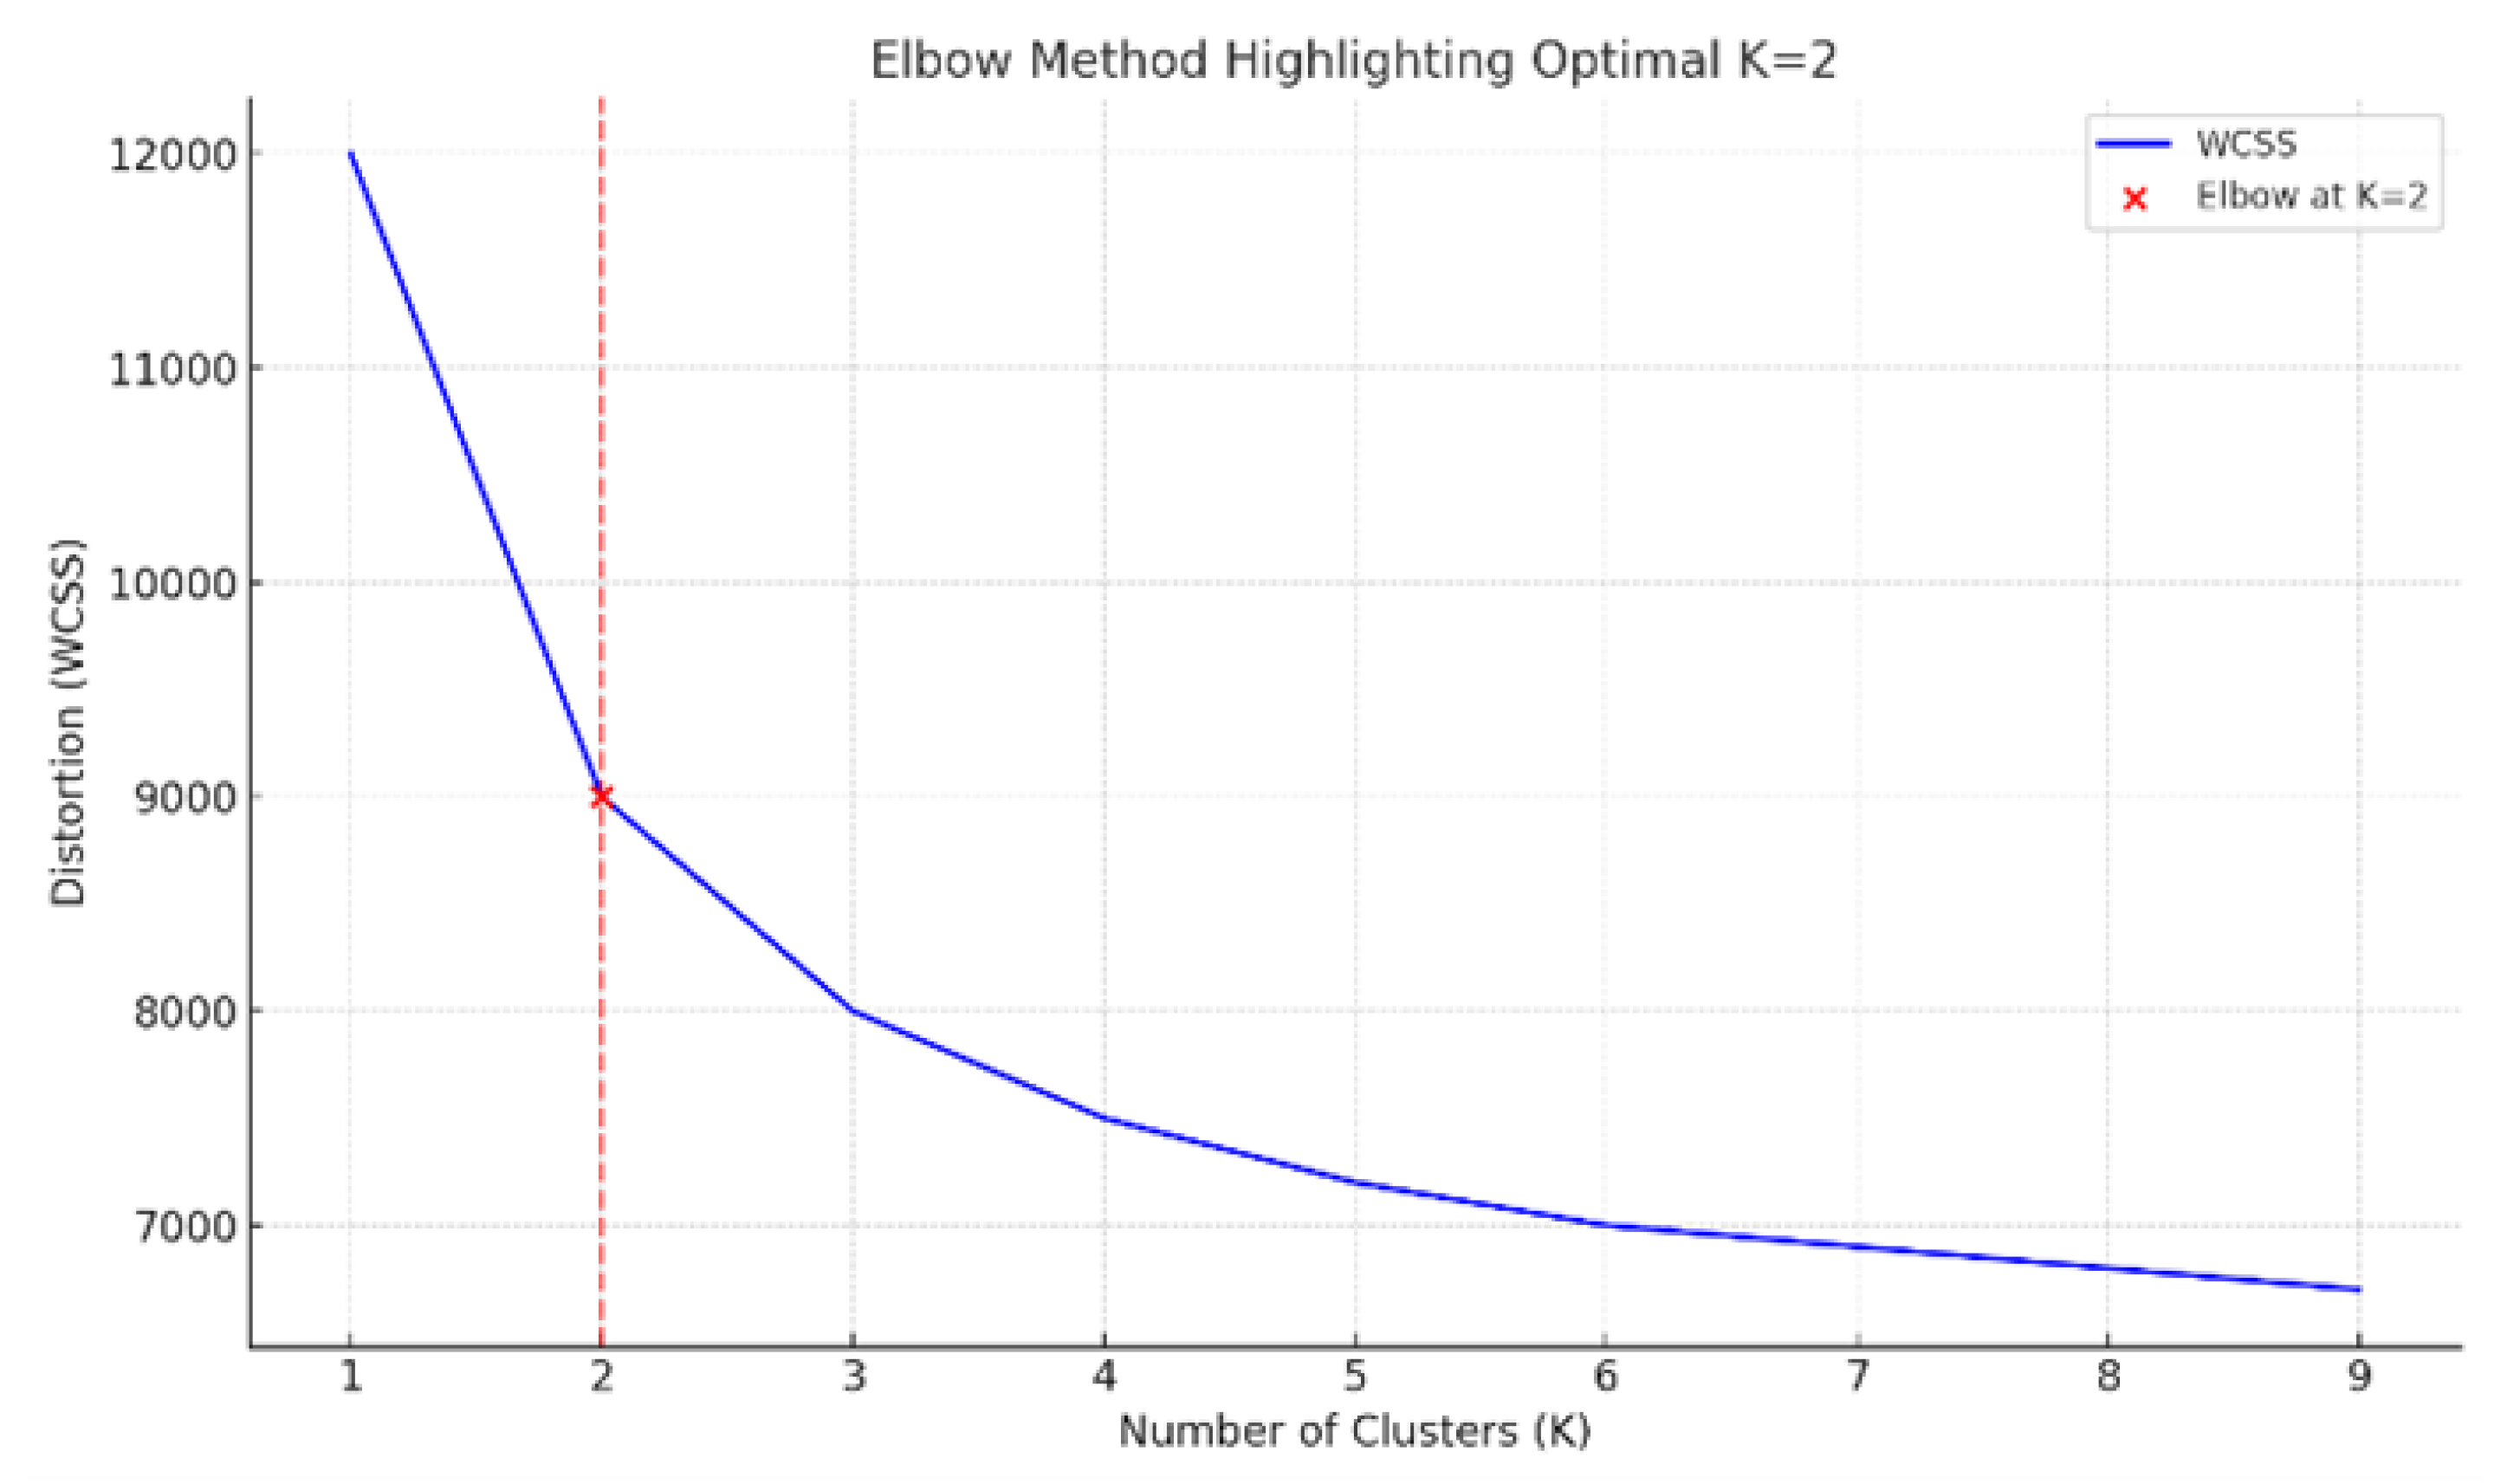
To determine the optimal number of clusters (K), the Elbow Method was employed by evaluating the within-cluster sum of squares (WCSS) across K values ranging from 1 to 10. A pronounced bend at K = 2 indicated a significant reduction in WCSS, suggesting that a two-cluster solution best fits the data. Although minor inflections appeared at K = 3 and K = 6, they were not substantial enough to warrant deviation from the two-cluster solution.
Figure 2.
Application of Elbow Method.
Accordingly, four clustering algorithms were applied with K = 2: K-Means Clustering (KM), Agglomerative Hierarchical Clustering (AHC), Gaussian Mixture Model (GMM), and Density-Based Spatial Clustering of Applications with Noise (DBSCAN). The models were evaluated using three standard cluster evaluation metrics:
Silhouette Score: Assesses how similar an object is to its own cluster compared to other clusters. Higher values indicate better-defined clusters.
Calinski–Harabasz Index (CH Index): Measures the ratio of between-cluster dispersion to within-cluster dispersion. Higher values suggest better performance.
Davies–Bouldin Index (DB Index): Evaluates the average similarity between each cluster and its most similar one. Lower values are preferable.
Each model was compared pairwise to determine the best-performing approach. Initially, AHC was compared to GMM. AHC outperformed GMM in both the Silhouette Score and CH Index, indicating denser and better-separated clusters, despite having a slightly higher DB Index. Consequently, AHC was selected to proceed to the next comparison stage against DBSCAN. The results of each comparison cycle is shown in Table 3
DBSCAN achieved the highest Silhouette Score, suggesting well-separated clusters. However, it performed poorly on the CH and DB Indices, making its overall performance inconsistent. Given this, both AHC and DBSCAN were compared to K-Means for final selection.
K-Means surpassed both AHC and DBSCAN across all metrics: it recorded the second-highest Silhouette Score (0.219318), the highest CH Index (244.933881), and the lowest DB Index (1.954872). These results reflect K-Means’ effectiveness in generating distinct and compact clusters with minimal overlap, making it the most suitable algorithm for this dataset.
To identify patterns of student engagement early in the course, we applied K-Means clustering to interaction data and assignment scores collected during the first two weeks of instruction. The K-Means algorithm was applied with k=2, chosen based on the elbow method and silhouette analysis. The clustering revealed two distinct student groups.
- Cluster 1: Low-engagement group with minimal LMS activity and content interaction, low or no forum engagement.
- Cluster 2: High-engagement group with High frequency of LMS logins and resource views, active participation in discussion forums.
Interestingly, students in the high-engagement cluster demonstrated higher assignment scores during the first two weeks, whereas the low-engagement cluster consistently exhibited lower performance on early assignments.
The identified cluster labels were subsequently employed to examine the association between student engagement and long-term academic performance. For this purpose, final exam grades were consolidated into two categories—high performance and low performance—according to the grade classification presented in Table 4. Grades classified as Excellent and Good (i.e., A+, A, A–, B+, and B) were grouped under the high-performance category, while all remaining grades were categorized as low performance.
Following the analysis, only three distinct relationships between student engagement and academic performance were identified: (1) High engagement–high performance, (2) Low engagement–high performance, and (3) Low engagement–low performance.
Accordingly, only three types of students could be categorized based on the intersection of their engagement level and academic outcomes. The distribution of these student groups within the dataset is presented in Table 5.
Notably, no students with high engagement and low performance were observed in the entire dataset. This absence is a remarkable finding in the context of online education. It reinforces the critical role of sustained student engagement as a key success factor in improving academic outcomes in digital learning environments.
4.2. Performance Prediction Model
A student performance prediction model was developed using interaction log data from the Moodle learning management system, along with students’ academic performance data. The dataset, which had already undergone cleaning, scaling, and balancing, included the “Result” column in categorical format. Since most machine learning algorithms require numerical input, the categorical grades in the Result column were converted to numeric values using the label encoding technique, as outlined in Table 4. Each grade was assigned an integer value from 10 (A+) to 0 (F, I, P, N).
To ensure the features were on a comparable scale, standardization was applied using the StandardScaler function from the Scikit-learn library. This process centers the dataset by transforming each feature to have a zero mean and unit standard deviation. Mathematically, standardization is defined as:
where x is the original value, is the mean of the feature, and is the standard deviation. This transformation is crucial for improving the stability and convergence of machine learning models.
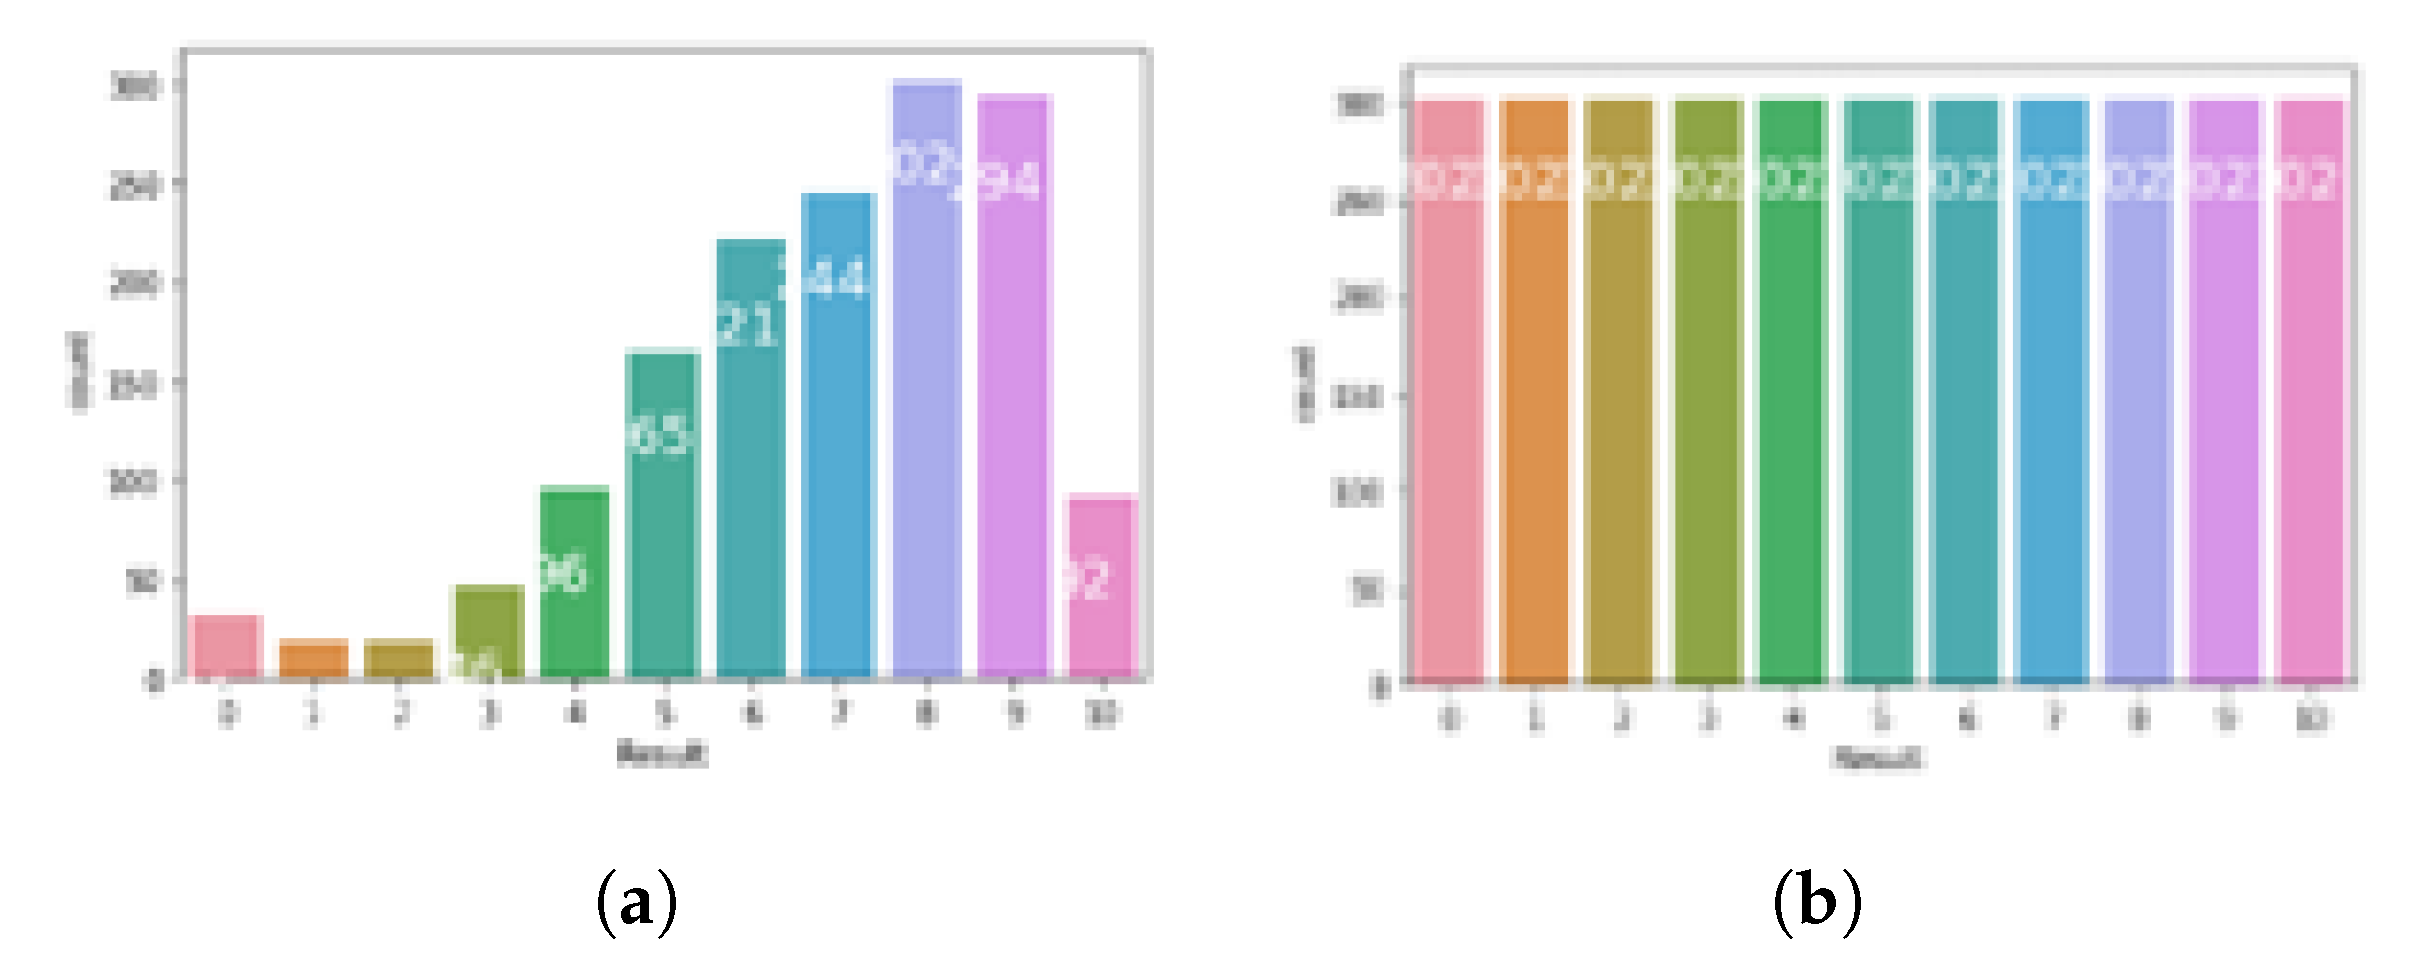
An initial examination of the dataset revealed a significant class imbalance among the target categories in the Result column. Such imbalances can adversely affect model training by biasing predictions toward the majority class and reducing sensitivity to minority classes. To address this issue, we employed the Synthetic Minority Over-sampling Technique (SMOTE), a widely used oversampling method for managing imbalanced datasets.
SMOTE works by generating synthetic examples for the minority class based on the feature space similarities between existing minority instances. This approach improves the balance between classes without simply duplicating existing data, thereby helping machine learning models generalize better. The application of SMOTE was conducted after feature scaling and label encoding, ensuring that the synthetic data aligned with the original data distribution.
Principal Component Analysis (PCA) is a widely used dimensionality reduction technique that identifies patterns in data by analyzing the correlation among features and emphasizing variance. PCA enables the reduction of the feature space while retaining the most significant information. In this study, PCA was used to determine the optimal number of components that can be retained without substantial loss of information.
Figure 3.
Class Distribution: (a) Before SMOTE. (b) After SMOTE.
The dataset included data from five different course modules, each containing varying numbers of submission records. Since these variations could contribute disproportionately to the total variance and potentially bias the model, the number of submissions was normalized to a scale of 10, rather than treating each module submission as a distinct feature. This normalization ensured consistency across modules and improved the effectiveness of PCA.
Before training, the dataset was split into training and test subsets using the train-test-split() function from the Scikit-learn library. Machine learning models were trained on the training set, and their performance was evaluated on the test set. The model achieving the highest classification accuracy was selected as the optimal model for downstream system development.
To assess the impact of oversampling and dimensionality reduction, each machine learning model was tested with and without applying SMOTE and PCA techniques. The resulting accuracies for all combinations are summarized in Table 6.
While accuracy provides a general measure of how many labels were correctly predicted by the model, it does not offer insights into class-specific performance. In imbalanced datasets, high accuracy may be misleading if certain classes dominate the predictions while others are neglected. Therefore, to achieve a more comprehensive evaluation of the classification model, a confusion matrix and a classification report were generated, as presented in Table 7.
These metrics allow for detailed analysis of precision, recall, and F1-score for each class, helping to identify which classes were well-predicted and which were underrepresented in the model’s output.
The performance of the classification models under different preprocessing conditions is summarized in Table 7. Among the tested models, the Support Vector Machine (SVM) achieved the best overall performance, with the highest accuracy (0.69) and average precision (0.74) when trained with SMOTE and without PCA. This suggests that SVM benefits significantly from oversampling techniques that address class imbalance, although the application of PCA slightly reduced its performance. Random Forest also showed consistently strong results across all conditions, with a slight improvement in accuracy and precision when SMOTE was applied without PCA (0.66 and 0.65, respectively), indicating that this model is robust to variations in preprocessing.
In contrast, Softmax Regression exhibited the lowest performance across all metrics. Interestingly, it performed slightly better without SMOTE and PCA, achieving 0.50 in both accuracy and average precision, while SMOTE tended to degrade its results. XGBoost showed an opposite trend compared to SVM; its best performance was observed without SMOTE but with PCA (accuracy of 0.58 and precision of 0.63). The application of SMOTE negatively impacted XGBoost’s performance across all evaluated metrics.
Overall, the results highlight that the effectiveness of preprocessing techniques such as SMOTE and PCA varies by model. While SVM and Random Forest benefited from oversampling, PCA did not consistently improve performance. These findings underscore the importance of model-specific tuning when handling imbalanced and high-dimensional educational datasets.
4.3. Stud Plan Recommendation
The study plan recommender system was designed to utilize multiple input sources, including student interaction data from the Learning Management System (LMS), predicted academic performance, and each student’s learning style. Interaction data were collected via the LMS, while predicted grades were passed from the previously trained performance prediction model. To determine students’ learning styles, the VARK questionnaire was administered to the same cohort of students for whom LMS interaction and performance data were available.
The integration of these data sources was performed in two stages using the student identification number as the common key. First, the interaction data collected for individual course modules were manually combined into a single dataset. This manual preprocessing step was required due to the one-time nature of the data and the non-repetitive structure of each module. Second, learning style data collected through Google Form submissions were decoded from the exported CSV format. Each student’s VARK scores were derived by analyzing their questionnaire responses using a custom Python script. The script computed the individual scores for Visual, Aural, Read/Write, and Kinesthetic modalities and generated a dataset mapping each score to the student’s identification number. In cases where a student was enrolled in multiple modules, their corresponding VARK scores were mapped to each related interaction record.
Since the recommender system is expected to predict study plan outputs as interaction patterns, a well-prepared training dataset was crucial. The output labels were structured for binary classification, indicating the presence or absence of recommended patterns. Given that the recommender system performs multi-label binary classification, additional data transformations were required. The student’s desired grade, provided as text, was encoded numerically using the scale defined in Table 4, where A+ corresponds to 10 and failing or incomplete grades to 0.
Furthermore, student interaction features, which varied across numeric ranges, were binarized to standardize their influence in the model. Each interaction metric was transformed into a binary variable depending on whether it exceeded the mean value across the dataset. This ensured that the model could clearly identify whether a particular interaction was meaningfully expressed by the student.
To identify the most effective model for generating personalized study plans, two machine learning algorithms were tested: the K-Nearest Neighbors (KNN) classifier and a Convolutional Neural Network (CNN). Both models were evaluated using the Hamming loss metric, which is appropriate for assessing performance in multi-label binary classification tasks. The evaluation results are summarized in Table 8.
The results clearly indicate that the KNN classifier outperforms the CNN model, achieving significantly lower Hamming loss values across the dataset. Due to its superior performance and lower computational complexity, the KNN model was selected as the underlying engine for the implementation of the study plan recommender system.
The study plan recommendations are generated using the trained KNN model. The process outlines the full pipeline—from accepting new input data to writing the final recommendations into a structured CSV file. A sample output of a .CSV file, containing recommended study plans for several students, is displayed in Figure 4.
To evaluate the effectiveness of the proposed study plan recommender system, a controlled experiment was conducted using a custom-hosted Moodle platform. The platform simulated a semester-long learning program for an HTML course, with participation from 250 undergraduate students of the Faculty of Information Technology, University of Moratuwa. To incorporate individual learning preferences into the system, the VARK questionnaire was distributed among all participating students to collect data on their learning styles.
From this cohort, a subset of 30 students was selected and randomly divided into two groups. The experimental group received personalized study plan recommendations following their performances in Quiz 1 and Quiz 2, while the control group continued learning without any system-generated study guidance. Both groups proceeded through the remainder of the course under these conditions.
At the end of the course period, a final quiz was administered to all 30 students to assess learning outcomes. The predicted results, based on the machine learning performance model, and the actual quiz scores were recorded for each student in both groups. The difference between actual and predicted results was computed using the encoded grade values defined earlier (Table 4), with point deviation calculated as the difference between actual and predicted grade values.
The results for the control group (students without recommendations) and the experimental group (students with study plan recommendations) are presented in Table 9 and Table 10, respectively. The comparison aims to measure the impact of the study plan recommender system on academic improvement over the baseline predicted outcomes.
An analysis of the performance deviation among the control group revealed that 66.67% of the students experienced a decline in performance compared to their predicted grades. Only 6.67% of students showed an improvement, while 25% maintained their originally predicted performance level. These findings suggest that, in the absence of personalized study plan recommendations, the majority of students failed to meet their expected academic outcomes, with a notable tendency toward performance decline.
The results from the experiment group—students who received personalized study plan recommendations—demonstrate a significant improvement in academic performance. As shown in Table 10, 60% of the students achieved higher actual grades than their predicted results, while 26.67% maintained the same performance level. Only 13.33% of the students exhibited a slight decline in performance.
These findings contrast sharply with the control group, in which the majority of students experienced a decline in academic performance. In contrast, a significantly higher proportion of students in the experiment group demonstrated improved outcomes. This observation is further supported by the comparative analysis illustrated in Figure 5, where the performance deviations between the control and experiment groups are visually contrasted.
The high percentage of performance improvement in the experiment group strongly suggests that the study plan recommender system had a positive impact on student learning outcomes, particularly benefiting those students who were previously predicted to perform at lower levels.
4.3.1. Statistical Analysis of Intervention Effectiveness
To evaluate the effectiveness of the personalized study plan recommendations, an independent two-sample t-test (Welch’s t-test) was conducted. This test compared the deviation between predicted performance and actual final quiz scores for two groups:
- Control group (n = 15): Students who did not receive personalized study plan recommendations.
- Experimental group (n = 15): Students who received recommendations aligned with their learning styles.
The performance difference was calculated as:
A positive difference indicates the student outperformed the prediction; a negative difference indicates underperformance.
Descriptive Statistics and T-Test Results
Table 11 summarizes the key statistics for each group. Note that the t-statistic and p-value describe the statistical relationship between the two groups and therefore are not specific to either one individually.
Since the p-value is less than 0.05, the result is statistically significant. We conclude that the personalized study plan recommendations led to a meaningful improvement in student performance.
Box Plot Interpretation
Figure 6 presents a box plot comparing the distribution of performance differences.
Students who received recommendations demonstrated more consistent performance and frequently exceeded their predicted grades. In contrast, students without recommendations tended to underperform and displayed more variability. This visual evidence aligns with the statistical findings and supports the hypothesis that tailored study support enhances learning outcomes.
The observed gains align with the system’s core objective of providing personalized academic guidance tailored to individual learning styles and interaction behaviors, underscoring its potential effectiveness in real-world educational environments.
5. Discussion
This study was designed to examine how data-driven methods can be used to improve student success in online learning environments. The research addressed three core questions: (1) the relationship between LMS engagement and academic performance, (2) the feasibility of predicting student performance from LMS data, and (3) the impact of personalized study plans tailored to learning styles. The findings corresponding to each research question are summarized below.
5.1. RQ1: What Is the Nature of the Relationship Between Student Engagement with LMS Activities and Academic Performance?
The analysis revealed a strong correlation between students’ engagement patterns and their academic outcomes. K-means clustering identified two clear engagement clusters: high and low engagement. These clusters were not only distinct in terms of LMS interaction metrics but also mirrored differences in formative assessment scores. The high engagement cluster consistently achieved better assignment marks.
When final exam grades were added to the dataset, three distinct engagement-performance profiles emerged: (1) high engagement–high performance, (2) low engagement–high performance, and (3) low engagement–low performance. Notably, no students were found in the high engagement–low performance category, suggesting that consistent interaction with LMS content is a strong predictor of academic success. However, the presence of low-engagement–high-performance students suggests that other latent factors (e.g., prior knowledge, external support) may also influence outcomes.
5.2. RQ2: How Accurately Can Student Performance Be Predicted Based on LMS Interaction Patterns?
Student performance prediction was approached as a multi-class classification task using 14 grade categories. Among the models tested, the Support Vector Machine (SVM) achieved the highest accuracy at 68.8%, especially when the dataset was enhanced with SMOTE to mitigate class imbalance. This is a strong result considering the complexity of the task.
The application of dimensionality reduction (PCA) did not improve model performance and was, in some cases, detrimental. This likely stems from the already limited number of features in the dataset. Thus, while data balancing techniques proved beneficial, further dimensionality reduction is not recommended for similarly constrained datasets. Future models may benefit from richer interaction data, potentially including time-on-task, clickstream sequences, or quiz-level behavior.
5.3. RQ3: How Effective Are Personalized Study Plans, Aligned with Learning Styles, in Enhancing Student Performance in Online Learning Environments?
The effectiveness of personalized study plans was evaluated through a controlled experiment. Students in the experimental group received customized recommendations based on predicted performance and VARK-assessed learning styles, while the control group did not. The experimental group showed significantly better performance: 60% improved their grades compared to only 6.7% in the control group. Only 13.3% of the experimental group saw performance decline, compared to 66.7% in the control group.
Further analysis showed that students predicted to achieve mid-level grades (C+ to B+) benefited the most from recommendations, with nearly all of them improving. High-performing students (A– and above) maintained their performance or improved slightly, with minimal drop-off. These findings suggest that personalized study plans are particularly effective for students at risk of underperformance.
Figure 5 visualizes these group-level differences, reinforcing the positive impact of the study plan recommender system. This section may be divided by subheadings. It should provide a concise and precise description of the experimental results, their interpretation as well as the experimental conclusions that can be drawn.
6. Conclusion and Future Work
This research demonstrates that LMS interaction data can be effectively used to: (1) Detect meaningful student engagement patterns; (2) Predict academic performance at fine-grained level with reasonable accuracy; (3) Recommend personalized study plans that enhance learning outcomes.
However, several areas remain for improvement. The study treated all LMS interactions equally, without weighting their pedagogical value. Future work should investigate the impact of different activity types (e.g., forum participation vs. resource views) on outcomes. Additionally, models tailored to specific courses or subject domains may offer improved predictive performance.
Expanding the dataset and incorporating real-time interaction features will also help to improve model robustness. Lastly, integrating learner feedback into the study plan recommender system could pave the way for adaptive, hybrid recommendation models that further enhance student engagement and success in online learning environments.
Author Contributions
Conceptualization, G.T.I.K.; methodology, G.T.I.K.; software, R.A.A.S, V.CS.V, and P.S.; validation, R.A.A.S, V.CS.V, P.S.. and G.T.I.K; formal analysis, R.AA.S, V.CS.V, P.S.. and G.T.I.K; writing—original draft preparation, G.T.I.K.; writing—review and editing, A.S.A.; supervision, A.S.A;
Funding
This research received no external funding
Institutional Review Board Statement
This study was conducted in accordance with the ethical principles outlined in the Belmont Report, including respect for persons, beneficence, and justice. Ethical approval for this research was obtained from the Research Ethics Committee of the University of Moratuwa (Approval ID: EDN/2023/014), prior to data collection. All procedures involving human participants complied with institutional and national research ethics guidelines. Informed consent was obtained from all participants before participation.
Informed Consent Statement
Informed consent was obtained from all subjects involved in the study. Participants were fully briefed on the purpose of the research, the nature of the data collected (including LMS interactions, performance results, and learning styles), and the voluntary nature of their participation. Anonymity and confidentiality were assured, and participants were informed of their right to withdraw at any point without penalty.
Data Availability Statement
The data presented in this study are available on request from the corresponding author. The data are not publicly available due to institutional data protection policies.
Acknowledgments
The authors would like to express their sincere gratitude to the staff and students of the Department of Information Technology, University of Moratuwa, for their valuable support during the data collection and evaluation phases of this research. This manuscript was language-edited with the assistance of OpenAI’s ChatGPT, which was used to improve grammar, phrasing, and clarity. All content, analyses, and interpretations are the sole work of the authors.
Conflicts of Interest
The authors declare no conflicts of interest.
References
- Calvo-Flores, M.D.; Galindo, E.G.; Jiménez, M.P.; Piñeiro, O.P.; et al. Predicting students’ marks from Moodle logs using neural network models. Current Developments in Technology-Assisted Education 2006, 1, 586–590.
- Picciano, A.G.; Seaman, J.; Allen, I.E. Educational transformation through online learning: To be or not to be. Journal of Asynchronous Learning Networks 2010, 14, 17–35. [CrossRef]
- Pardo, A.; Han, F.; Ellis, R.A. Combining university student self-regulated learning indicators and engagement with online learning events to predict academic performance. IEEE Transactions on Learning Technologies 2016, 10, 82–92. [CrossRef]
- López-Zambrano, J.; Lara, J.A.; Romero, C. Towards portability of models for predicting students’ final performance in university courses starting from moodle logs. Applied Sciences 2020, 10, 354. [CrossRef]
- García-Morales, V.J.; Garrido-Moreno, A.; Martín-Rojas, R. The transformation of higher education after the COVID disruption: Emerging challenges in an online learning scenario. Frontiers in psychology 2021, 12, 616059. [CrossRef]
- Romero, C.; Espejo, P.G.; Zafra, A.; Romero, J.R.; Ventura, S. Web usage mining for predicting final marks of students that use Moodle courses. Computer Applications in Engineering Education 2013, 21, 135–146. [CrossRef]
- Moubayed, A.; Injadat, M.; Shami, A.; Lutfiyya, H. Student engagement level in an e-learning environment: Clustering using k-means. American Journal of Distance Education 2020, 34, 137–156. [CrossRef]
- Nielson, K.B. Self-study with language learning software in the workplace: What happens? 2011.
- Moubayed, A.; Injadat, M.; Shami, A.; Lutfiyya, H. Relationship between student engagement and performance in e-learning environment using association rules. In Proceedings of the 2018 IEEE world engineering education conference (EDUNINE). IEEE, 2018, pp. 1–6.
- Azevedo, R.; Moos, D.C.; Witherspoon, A.M.; Chauncey, A. Issues in the Measurement of Cognitive and Metacognitive Regulatory Processes Used During Hypermedia Learning. In Proceedings of the AAAI Fall Symposium: Cognitive and Metacognitive Educational Systems, 2009.
- Gray, J.A.; DiLoreto, M. The effects of student engagement, student satisfaction, and perceived learning in online learning environments. International Journal of Educational Leadership Preparation 2016, 11, n1.
- Goh, T.T. Learning management system log analytics: the role of persistence and consistency of engagement behaviour on academic success. Journal of Computers in Education 2025, pp. 1–24.
- Johnston, L.J.; Griffin, J.E.; Manolopoulou, I.; Jendoubi, T. Uncovering Student Engagement Patterns in Moodle with Interpretable Machine Learning. arXiv preprint arXiv:2412.11826 2024.
- Yuan, J.; Qiu, X.; Wu, J.; Guo, J.; Li, W.; Wang, Y.G. Integrating behavior analysis with machine learning to predict online learning performance: A scientometric review and empirical study. arXiv preprint arXiv:2406.11847 2024.
- Hubbard, K.; Amponsah, S. Feature Engineering on LMS Data to Optimize Student Performance Prediction. arXiv preprint arXiv:2504.02916 2025.
- Alotaibi, N.S. The impact of AI and LMS integration on the future of higher education: Opportunities, challenges, and strategies for transformation. Sustainability 2024, 16, 10357. [CrossRef]
- Heilporn, G.; Lakhal, S.; Bélisle, M.; St-Onge, C. Student engagement: A multidimensional measurement scale applied to blended course modalities at the university level. Mesure et évaluation en éducation 2020, 43, 1–31. [CrossRef]
- Lin, L.; Wang, F. Research on the relationship between learning engagement and learning performance in online learning. In Proceedings of the Proceedings of the 15th International Conference on Education Technology and Computers, 2023, pp. 201–206.
- Lawson, H.A.; Lawson, M.A. Student engagement and disengagement as a collective action problem. Education Sciences 2020, 10, 212. [CrossRef]
- Wang, J.; Yu, Y. Machine learning approach to student performance prediction of online learning. PloS one 2025, 20, e0299018. [CrossRef]
- Wang, Y.; Cao, Y.; Gong, S.; Wang, Z.; Li, N.; Ai, L. Interaction and learning engagement in online learning: The mediating roles of online learning self-efficacy and academic emotions. Learning and Individual Differences 2022, 94, 102128. [CrossRef]
- Saltmarsh, J.; Zlotkowski, E.; Hollander, E. Indicators of engagement. Higher education and democracy: essays on service-learning and civic engagement 2011, pp. 285–302.
- Conijn, R.; Snijders, C.; Kleingeld, A.; Matzat, U. Predicting student performance from LMS data: A comparison of 17 blended courses using Moodle LMS. IEEE Transactions on Learning Technologies 2016, 10, 17–29. [CrossRef]
- Johnston, L.; Griffin, J.; Manolopoulou, I.; Jendoubi, T. Uncovering Student Engagement Patterns in Moodle with Interpretable Machine Learning. arXiv preprint 2023, [2412.11826].
- Holicza, P.; Bálint; Tóth. Comparative Analysis of Machine Learning Models for Predicting Student Success in Online vs. Offline Contexts. Applied Sciences 2023, 13, 4321. [CrossRef]
- Du Plooy, E.; Casteleijn, D.; Franzsen, D. Personalized Adaptive Learning in Higher Education: A Scoping Review of Key Characteristics and Impact. Heliyon 2024, 10, e20987. [CrossRef]
- Yuan, J.; Qiu, X.; Wu, J.; Guo, J.; Li, W.; Wang, Y. Integrating Behavior Analysis with Machine Learning to Predict Online Learning Performance: A Scientometric Review and Empirical Study. arXiv preprint 2024, [2406.11847].
- Gao, Y. The potential of adaptive learning systems to enhance learning outcomes: a meta-analysis 2023.
- Gkontzis, A.F.; Panagiotakopoulos, C.T.; Kotsiantis, S.; Verykios, V.S. Measuring engagement to assess performance of students in distance learning. In Proceedings of the 2018 9th International Conference on Information, Intelligence, Systems and Applications (IISA). IEEE, 2018, pp. 1–7.
- Mogus, A.M.; Djurdjevic, I.; Suvak, N. The impact of student activity in a virtual learning environment on their final mark. Active Learning in Higher Education 2012, 13, 177–189. [CrossRef]
- Corrigan, O.; Smeaton, A.F.; Glynn, M.; Smyth, S. Using educational analytics to improve test performance. In Proceedings of the European Conference on Technology Enhanced Learning. Springer, 2015, pp. 42–55.
- Hussain, M.; Zhu, W.; Zhang, W.; Abidi, S.M.R. Student engagement predictions in an e-learning System and their impact on student course assessment scores. Computational intelligence and neuroscience 2018, 2018, 6347186. [CrossRef]
- Yadav, S.K.; Pal, S. Data mining: A prediction for performance improvement of engineering students using classification. arXiv preprint arXiv:1203.3832 2012.
- Kedia, P.; Mishra, L. Exploring the factors influencing the effectiveness of online learning: A study on college students. Social Sciences & Humanities Open 2023, 8, 100559. [CrossRef]
- Alsumaidaie, M.S.I.; Nafea, A.A.; Mukhlif, A.A.; Jalal, R.D.; AL-Ani, M.M. Intelligent System for Student Performance Prediction Using Machine Learning. Baghdad Science Journal 2024, 21, 3877–3891. [CrossRef]
- Ahmed, E. Student performance prediction using machine learning algorithms. Applied computational intelligence and soft computing 2024, 2024, 4067721. [CrossRef]
- Chen, H.; Li, X.; Kumar, S. A Multidimensional Time-Series Model for Early-Risk Prediction in Online Learning. Computers & Education 2024, 205, 104553.
- Altabrawee, H.; Ali, O.A.J.; Ajmi, S.Q. Predicting students’ performance using machine learning techniques. JOURNAL OF UNIVERSITY OF BABYLON for pure and applied sciences 2019, 27, 194–205. [CrossRef]
- Kolluru, V.; Mungara, S.; Chintakunta, A.N. Adaptive learning systems: Harnessing AI for customized educational experiences. International Journal of Computational Science and Information Technology 2018, 6, 10–5121. [CrossRef]
- Bimba, A.T.; Idris, N.; Al-Hunaiyyan, A.; Mahmud, R.B.; Shuib, N.L.B.M. Adaptive feedback in computer-based learning environments: a review. Adaptive Behavior 2017, 25, 217–234. [CrossRef]
- Kabudi, T.; Pappas, I.; Olsen, D.H. AI-enabled adaptive learning systems: A systematic mapping of the literature. Computers and education: Artificial intelligence 2021, 2, 100017. [CrossRef]
- Hocine, N. A Systematic Literature Review of Adaptive Learning Systems Based on the Assessment of Collaboration Quality.
- Strielkowski, W.; Grebennikova, V.; Lisovskiy, A.; Rakhimova, G.; Vasileva, T. AI-driven adaptive learning for sustainable educational transformation. Sustainable Development 2025, 33, 1921–1947. [CrossRef]
- Akavova, A.; Temirkhanova, Z.; Lorsanova, Z. Adaptive learning and artificial intelligence in the educational space. In Proceedings of the E3S web of conferences. EDP Sciences, 2023, Vol. 451, p. 06011.
- Jain, A.K.; Dubes, R.C. Algorithms for clustering data; Prentice-Hall, Inc., 1988.
- Ikotun, A.M.; Ezugwu, A.E.; Abualigah, L.; Abuhaija, B.; Heming, J. K-means clustering algorithms: A comprehensive review, variants analysis, and advances in the era of big data. Information Sciences 2023, 622, 178–210. [CrossRef]
- Sasirekha, K.; Baby, P. Agglomerative hierarchical clustering algorithm-a. International Journal of Scientific and Research Publications 2013, 83, 83.
- Murtagh, F.; Contreras, P. Algorithms for hierarchical clustering: an overview. Wiley interdisciplinary reviews: data mining and knowledge discovery 2012, 2, 86–97. [CrossRef]
- Murtagh, F.; Contreras, P. Algorithms for hierarchical clustering: an overview, II. Wiley Interdisciplinary Reviews: Data Mining and Knowledge Discovery 2017, 7, e1219. [CrossRef]
- Khan, K.; Rehman, S.U.; Aziz, K.; Fong, S.; Sarasvady, S. DBSCAN: Past, present and future. In Proceedings of the The fifth international conference on the applications of digital information and web technologies (ICADIWT 2014). IEEE, 2014, pp. 232–238.
- Deng, D. DBSCAN clustering algorithm based on density. In Proceedings of the 2020 7th international forum on electrical engineering and automation (IFEEA). IEEE, 2020, pp. 949–953.
- Hearst, M.A.; Dumais, S.T.; Osuna, E.; Platt, J.; Scholkopf, B. Support vector machines. IEEE Intelligent Systems and their applications 1998, 13, 18–28. [CrossRef]
- Ali, J.; Khan, R.; Ahmad, N.; Maqsood, I. Random forests and decision trees. International Journal of Computer Science Issues (IJCSI) 2012, 9, 272.
- Xu, X.; Huang, S.L. Maximal correlation regression. Ieee Access 2020, 8, 26591–26601. [CrossRef]
- Chen, T.; Guestrin, C. Xgboost: A scalable tree boosting system. In Proceedings of the Proceedings of the 22nd acm sigkdd international conference on knowledge discovery and data mining, 2016, pp. 785–794.
- Dreiseitl, S.; Ohno-Machado, L. Logistic regression and artificial neural network classification models: a methodology review. Journal of biomedical informatics 2002, 35, 352–359. [CrossRef]
- Koren, Y.; Rendle, S.; Bell, R., Advances in Collaborative Filtering. In Recommender Systems Handbook; Ricci, F.; Rokach, L.; Shapira, B., Eds.; Springer US: New York, NY, 2022; pp. 91–142. [CrossRef]
Figure 1.
Research Design.
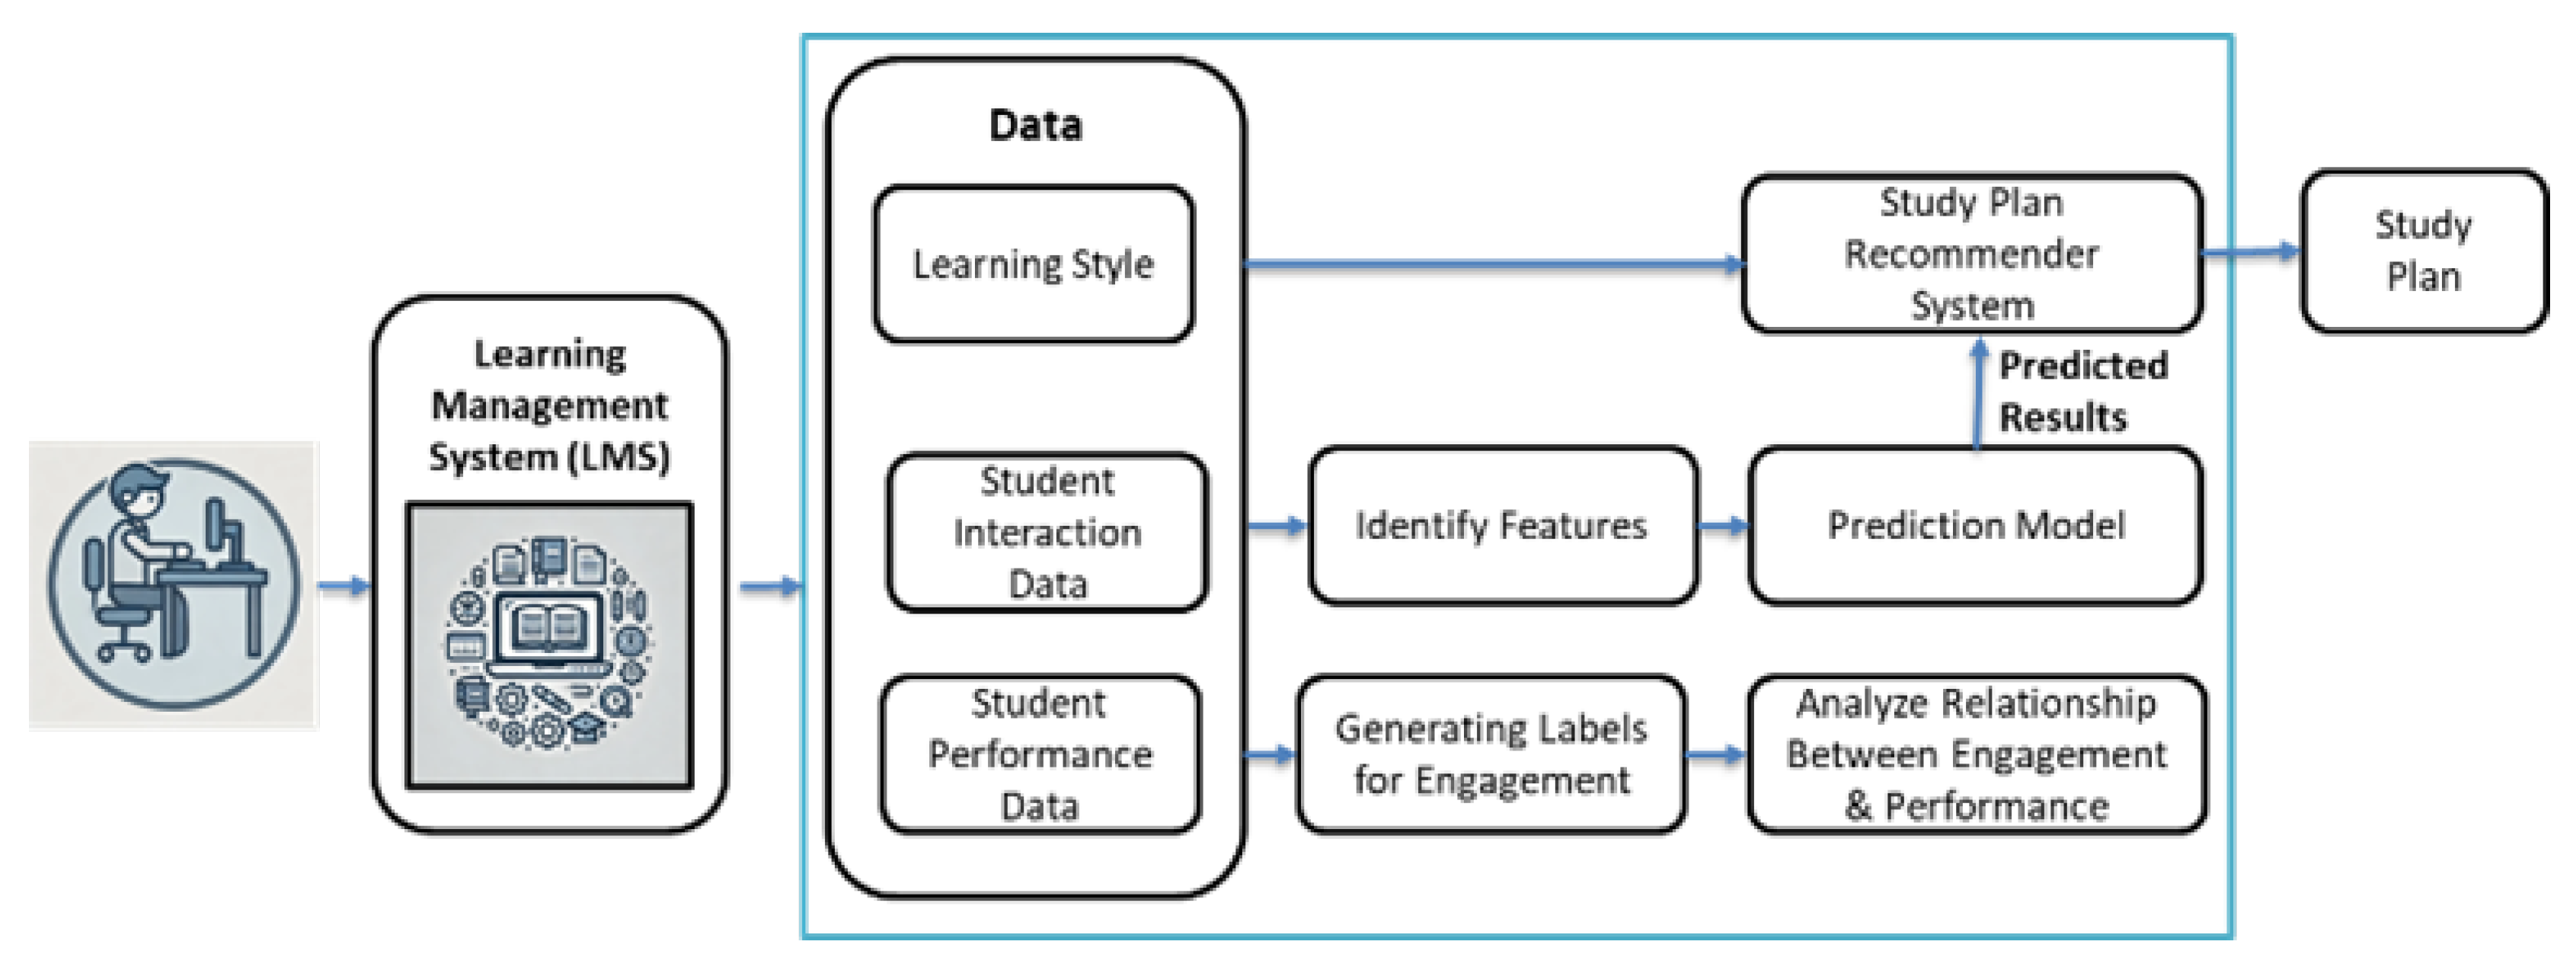
Figure 4.
Recommended Study Plan.
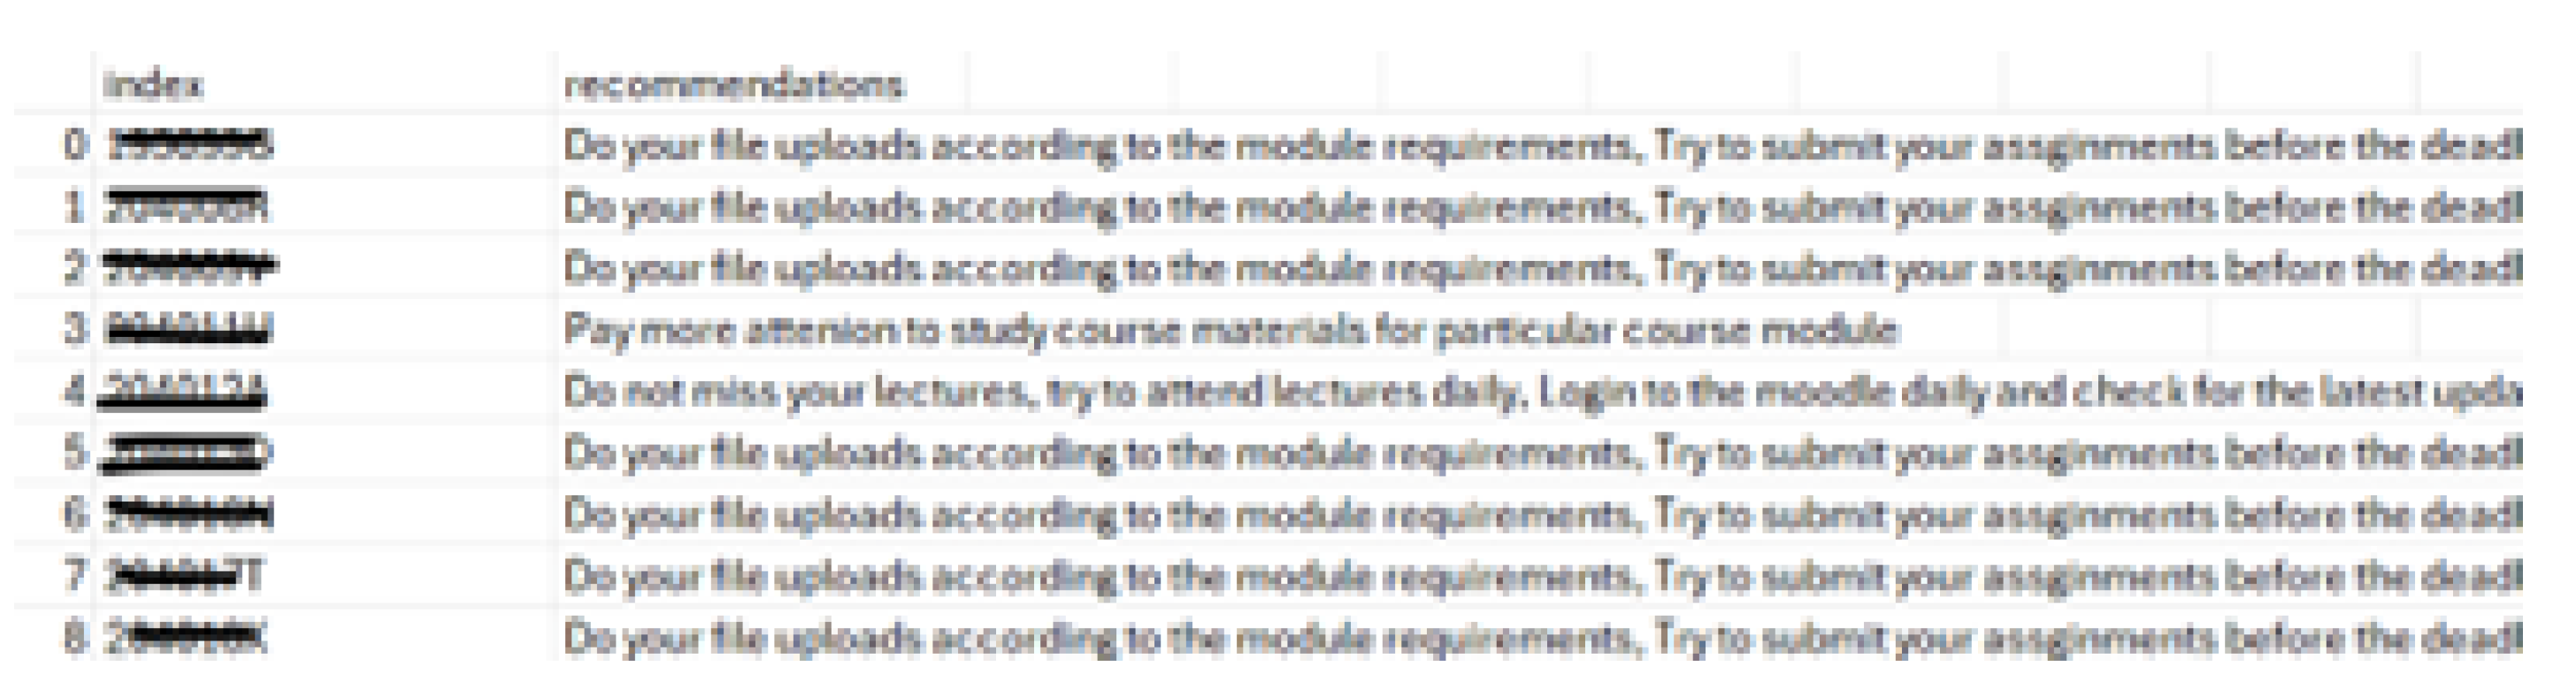
Figure 5.
Comparison of performance outcomes between control and experiment groups.
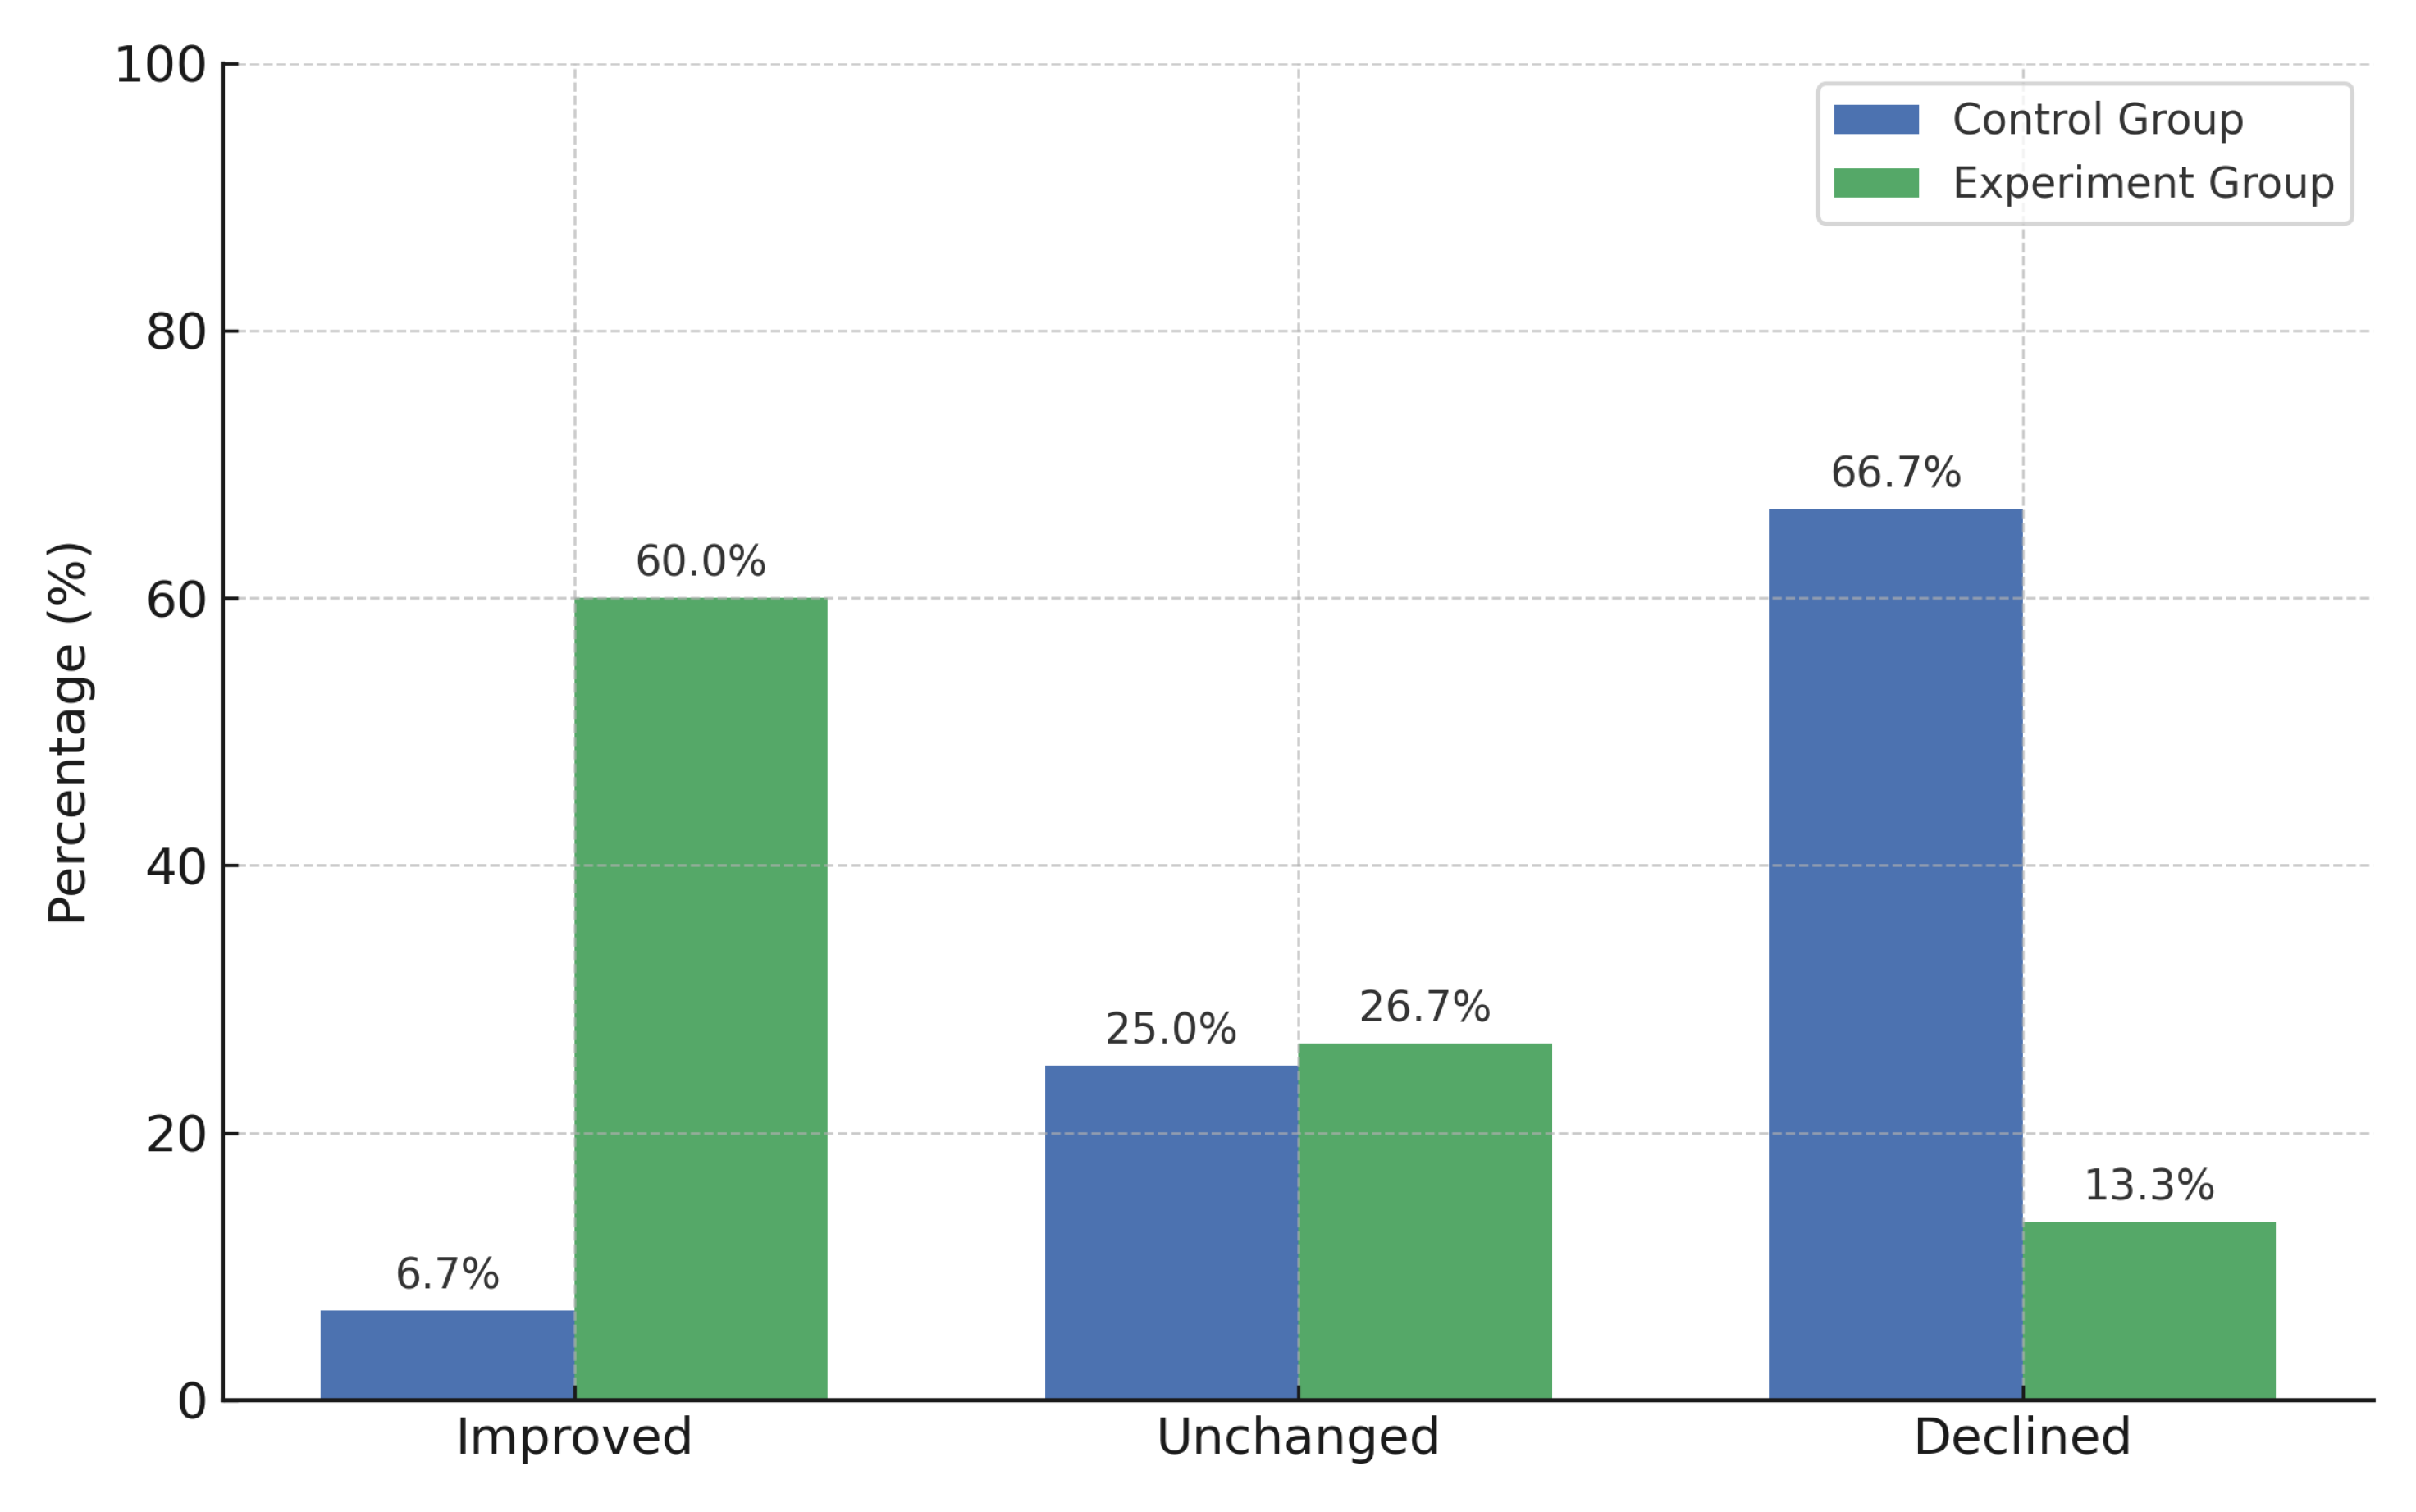
Figure 6.
Box plot showing distribution of score differences (Final Quiz Score - Predicted Score). Students with recommendations had higher medians and tighter distributions.
Figure 6.
Box plot showing distribution of score differences (Final Quiz Score - Predicted Score). Students with recommendations had higher medians and tighter distributions.
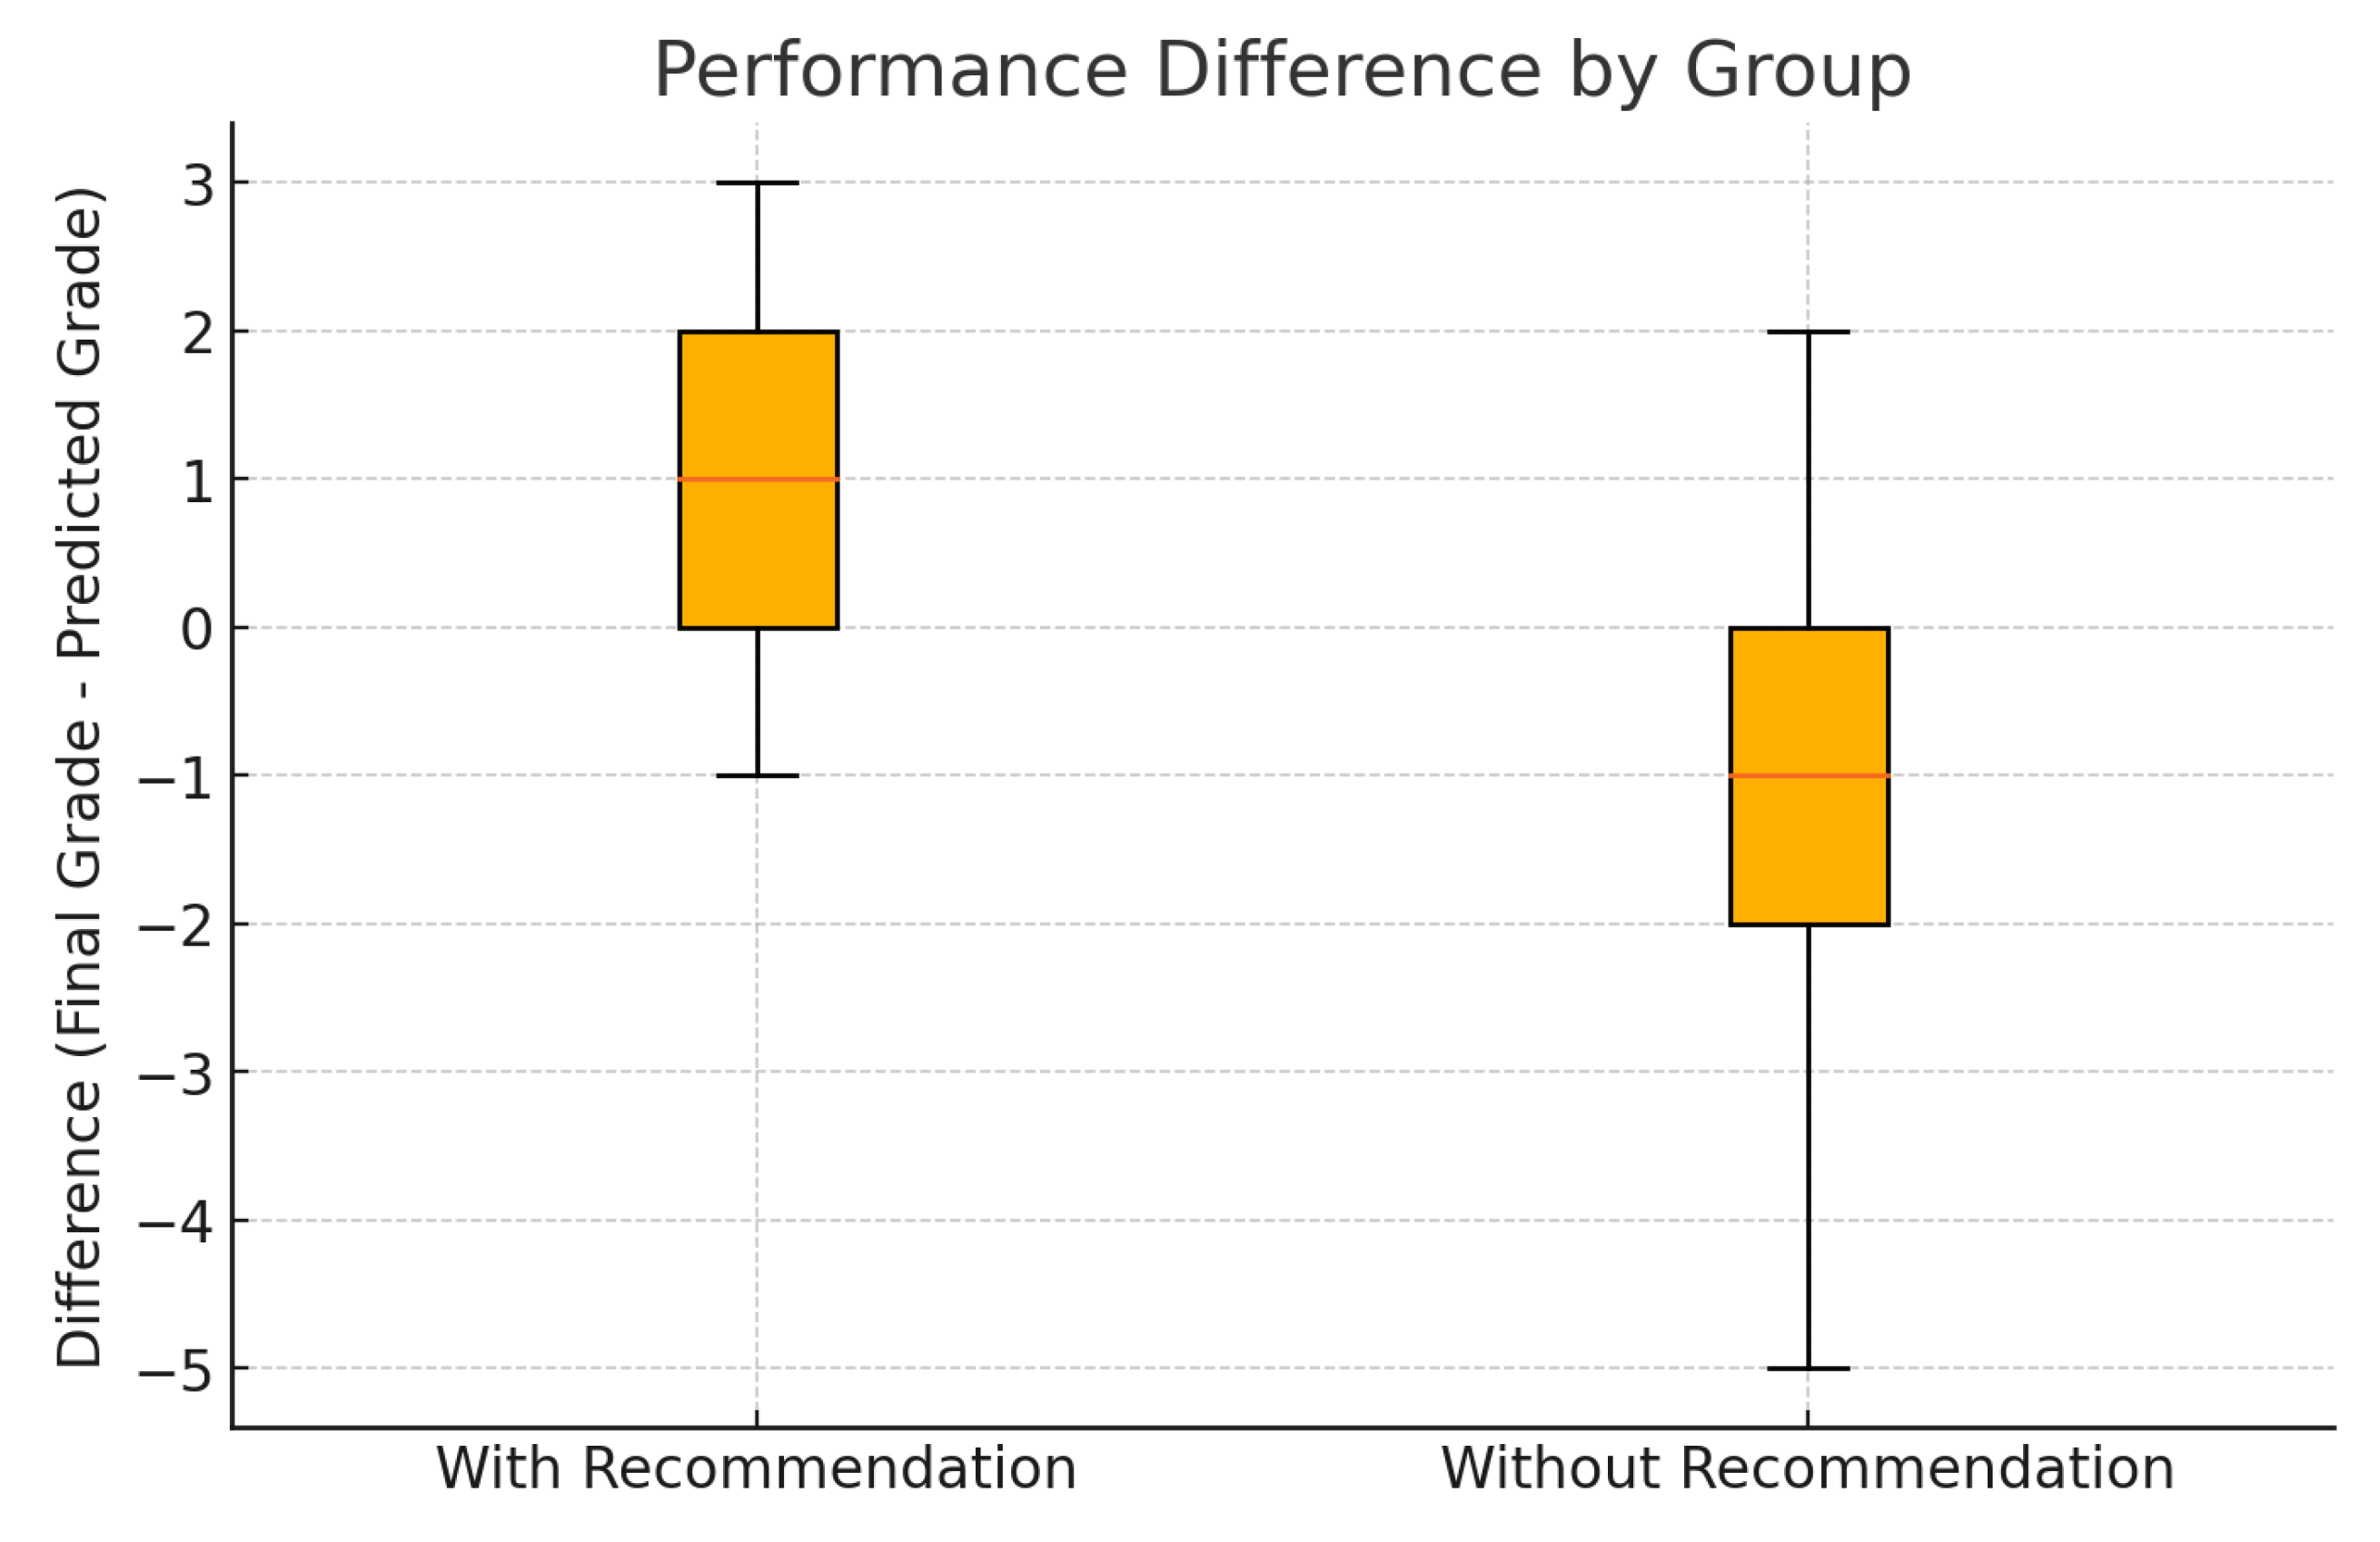
Table 1.
Features Extracted from LMS Interaction Logs
| Feature | Purpose |
|---|---|
| Index No | To uniquely identify and map each record with other related interaction records |
| File Uploads | Total number of files uploaded by the student |
| Submissions | Number of activity submissions made by the student |
| Meeting Connects | Number of times the student connected to scheduled online meetings |
| Course Module Views | Number of times learning activities (e.g., lessons, quizzes) were accessed |
| Course Views | Number of visits to the course homepage |
| Submissions Created | Number of submission attempts initiated by the student |
| Submission Views | Number of times submitted work was reviewed by the student |
| Submission Status Views | Number of times the student viewed the status of their submissions |
| User Profile Views | Number of times the student viewed their own profile |
| Assignment | Continuous assessment marks (used as an input feature) |
| Result | Final grade achieved in the course (used as the target variable) |
Note: The final grade (Result) was used as the target variable in modeling, while the other features served as predictors.
Table 3.
Aggregated Evaluation Matrices for Clustering Models.
| Model | Silhouette Score | CH Index | DB Index |
|---|---|---|---|
| GMM | 0.158949 | 95.959022 | 2.079374 |
| AHC | 0.190290 | 192.126612 | 2.235070 |
| DBSCAN | 0.453314 | 83.250614 | 2.448683 |
| K-Means | 0.219318 | 244.933881 | 1.954872 |
Table 4.
Result Label Encoding.
| Benchmark (%) | Grade | Encoded Value | Category |
|---|---|---|---|
| 85 and above | A+ | 10 | |
| 75–84 | A | 9 | High Performing |
| 70–74 | A− | 8 | |
| 65–69 | B+ | 7 | |
| 60–64 | B | 6 | |
| 55–59 | B− | 5 | |
| 50–54 | C+ | 4 | |
| 45–49 | C | 3 | |
| 40–44 | C− | 2 | Low Perforaming |
| 35–39 | D | 1 | |
| ≤34 | I | 0 | |
| — | F | 0 | |
| — | P | 0 | |
| — | N | 0 |
Table 5.
Student Distribution in Engagement–Performance Clusters.
| Engagement–Performance Cluster | Student Percentage |
|---|---|
| High Engaged–High Performing Students | 49.71% |
| Low Engaged–High Performing Students | 40.67% |
| Low Engaged–Low Performing Students | 9.62% |
Table 6.
Performance prediction accuracies by machine learning model under different preprocessing conditions.
Table 6.
Performance prediction accuracies by machine learning model under different preprocessing conditions.
| SMOTE | PCA | Random Forest | Softmax Regression | Support Vector Machine | XGBoost |
|---|---|---|---|---|---|
| Yes | Yes | 0.647 | 0.4353 | 0.624 | 0.4647 |
| Yes | No | 0.659 | 0.4294 | 0.688 | 0.4588 |
| No | Yes | 0.653 | 0.5000 | 0.676 | 0.5824 |
| No | No | 0.653 | 0.5000 | 0.612 | 0.5529 |
Table 7.
Classification performance metrics by model with and without SMOTE and PCA.
| Model | Metric | SMOTE + PCA |
SMOTE + No PCA |
No SMOTE + PCA |
No SMOTE + No PCA |
|---|---|---|---|---|---|
| Random Forest | Accuracy | 0.65 | 0.66 | 0.65 | 0.65 |
| Avg Precision | 0.61 | 0.65 | 0.64 | 0.65 | |
| Avg Recall | 0.63 | 0.64 | 0.66 | 0.59 | |
| Softmax Regression | Accuracy | 0.44 | 0.43 | 0.50 | 0.50 |
| Avg Precision | 0.42 | 0.42 | 0.50 | 0.50 | |
| Avg Recall | 0.50 | 0.49 | 0.44 | 0.44 | |
| Support Vector Machine | Accuracy | 0.62 | 0.69 | 0.66 | 0.66 |
| Avg Precision | 0.69 | 0.74 | 0.73 | 0.72 | |
| Avg Recall | 0.66 | 0.70 | 0.66 | 0.66 | |
| XGBoost | Accuracy | 0.46 | 0.46 | 0.58 | 0.55 |
| Avg Precision | 0.55 | 0.50 | 0.63 | 0.58 | |
| Avg Recall | 0.57 | 0.49 | 0.60 | 0.47 |
Table 8.
Model performance based on Hamming loss for study plan recommendation. Lower values indicate better multi-label classification.
Table 8.
Model performance based on Hamming loss for study plan recommendation. Lower values indicate better multi-label classification.
| Model | Hamming Loss |
|---|---|
| K-Nearest Neighbor (KNN) | 0.279 |
| Convolutional Neural Network (CNN) | 0.411 |
Table 9.
Comparison of predicted and actual results for the control group (no recommendations).
| No. | Index No | Predicted Result | Actual Result | Deviation |
|---|---|---|---|---|
| 1 | X1 | A+ (9) | B (4) | –5 |
| 2 | X2 | A+ (9) | B (5) | –4 |
| 3 | X3 | A+ (9) | A+ (9) | 0 |
| 4 | X4 | A (8) | B+ (6) | –2 |
| 5 | X5 | A (8) | B+ (6) | –2 |
| 6 | X6 | A (8) | A (8) | 0 |
| 7 | X7 | A− (7) | B+ (6) | –1 |
| 8 | X8 | A− (7) | B+ (6) | –1 |
| 9 | X9 | A− (7) | A− (7) | 0 |
| 10 | X10 | A− (7) | B+ (6) | –1 |
| 11 | X11 | B+ (6) | C+ (3) | –3 |
| 12 | X12 | B+ (6) | A (8) | +2 |
| 13 | X13 | B+ (6) | B+ (6) | 0 |
| 14 | X14 | B+ (6) | B (5) | –1 |
| 15 | X15 | C+ (3) | C (2) | –1 |
Table 10.
Comparison of predicted and actual results for the experiment group (with personalized study plans).
Table 10.
Comparison of predicted and actual results for the experiment group (with personalized study plans).
| No. | Index No | Predicted Result | Actual Result | Deviation |
|---|---|---|---|---|
| 1 | Y1 | A+ (9) | A (8) | -−1 |
| 2 | Y2 | A+ (9) | A+ (9) | 0 |
| 3 | Y3 | A+ (9) | A (8) | =−1 |
| 4 | Y4 | A+ (9) | A+ (9) | 0 |
| 5 | Y5 | A (8) | A (8) | 0 |
| 6 | Y6 | A (8) | A+ (9) | +1 |
| 7 | Y7 | A− (7) | A (8) | +1 |
| 8 | Y8 | C+ (3) | B (5) | +2 |
| 9 | Y9 | C+ (3) | B+ (6) | +3 |
| 10 | Y10 | C+ (3) | B (5) | +2 |
| 11 | Y11 | B+ (6) | A− (7) | +1 |
| 12 | Y12 | B+ (6) | A (8) | +2 |
| 13 | Y13 | B (5) | A− (7) | +2 |
| 14 | Y14 | B+ (6) | A (8) | +2 |
| 15 | Y15 | B+ (6) | B+ (6) | 0 |
Table 11.
Summary of T-test comparing student performance differences between groups. T-statistic and p-value apply to the comparison across groups.
Table 11.
Summary of T-test comparing student performance differences between groups. T-statistic and p-value apply to the comparison across groups.
| Statistic | With Recommendation | Without Recommendation |
|---|---|---|
| Mean Difference | 1.00 | -1.20 |
| Standard Deviation | 1.30 | 1.79 |
| Sample Size | 15 | 15 |
| T-Statistic (comparison) | 3.99 | – |
| P-Value (comparison) | 0.00051 | – |
Disclaimer/Publisher’s Note: The statements, opinions and data contained in all publications are solely those of the individual author(s) and contributor(s) and not of MDPI and/or the editor(s). MDPI and/or the editor(s) disclaim responsibility for any injury to people or property resulting from any ideas, methods, instructions or products referred to in the content. |
© 1996 by the authors. Licensee MDPI, Basel, Switzerland. This article is an open access article distributed under the terms and conditions of the Creative Commons Attribution (CC BY) license (https://creativecommons.org/licenses/by/4.0/).
Copyright: This open access article is published under a Creative Commons CC BY 4.0 license, which permit the free download, distribution, and reuse, provided that the author and preprint are cited in any reuse.


