
Submitted:
26 August 2025
Posted:
26 August 2025
You are already at the latest version
Preprints on COVID-19 and SARS-CoV-2
Abstract
EU production is important on global poultry markets and is concentrated in a few coun-tries, among which Italy. Aim of the study is to investigate the technical efficiency of Ital-ian poultry farms in years 2019-2022 characterized by Covid-19 pandemic and avian in-fluenza that occurred almost simultaneously and that presented poultry farms with im-portant economic challenges. In particular, the study aims to observe how efficiently poultry farms utilized their inputs due to controllable or managerial factors and to exoge-nous shocks and factors beyond the firm's control. Data was retrieved from the RICA da-tabase, the Italian section of the EU Farm Accountancy Data Network. After a descriptive analysis, a Stochastic Frontier Model was applied to the panel data to estimate the pro-duction frontier and firm-specific inefficiency factors. The results reveal the relevance of certain cost categories (feed, water, fuel and electricity) and their increase over the ob-served period. Current and capital costs have a positive and significant impact on the value of production. As regards the determinants of technical efficiency, a greater endow-ment of some inputs (labor, feed, and water) and the size of farms in terms of livestock units are correlated with an improvement in the technical efficiency of farms.
Keywords:
financial items
; technical inefficiency
; fixed effects
; panel data
; FADN
; Italy
; SFA
; COVID-19
1. Introduction
Poultry production plays a central role in the livestock sector. The global production of poultry meat has seen a dramatic rise over the last 50 years, multiplying significantly since 1961. Poultry is the livestock species with the strongest relative change over all the period and compared to the first two decades of the new millennium [1]; from year 2020 to 2023 the increase continued (+7%) and the production value reached an amount of 144.2 million tons, but it was surpassed by that of pig meat production (15%). As regards prospects, according to an OECD-FAO report [2], the global poultry production and demand is expected to increase by 2035, despite the increases in energy and feed costs, because poultry products are a cheaper alternative to other animal proteins. The EU production counts for 9.3% of the global total of poultry meat and is highly concentrated in few countries [3]: in descending order, Poland (20.6%), Spain (12.9%), Germany (11.7%), France (11.5%) and Italy (10%).
As regards Italy, the sector represents 7.8% of the value of the national agricultural production and 3.9% of the agro-industrial turnover, and it constitutes a significant part of the livestock market [4]. From 2019 to 2021, the Italian sector experienced declines in production volumes because of COVID-19 and avian influenza, and it was unable to satisfy the domestic demand. Chicken prices at source found new momentum in 2022, supported by a sharp reduction in supply and an increase in the costs of raw materials which had a significant impact on production costs and net profit, most of all in the first period of COVID-19 lockdown [5,6].
Considering above trends, understanding how efficiently firms utilize their inputs to generate outputs is crucial in economic analysis and takes on greater importance in periods characterized by turbulence that can affect the performances of firms.
Since the beginning of the decade, and especially in the years 2019-2022, several exogenous shocks, such as the pandemic and avian influenza events, have hit the sector at global level and raised the cost of raw materials, mainly energy and feed. The European poultry sector suffered a contraction in production, mainly because of avian influenza (which mostly concerned the northern countries), but it recovered in recent years, on both the demand and the supply sides. A moderate growth in production was recorded in the most important European countries in the poultry sector, such as Poland, Spain and Germany.
The extant literature draws attention to the considerable number of variables that must be given consideration when assessing a farm's technical efficiency. This concept pertains to the efficiency with which farms utilize their inputs to achieve optimal output. This process entails the minimization of waste and the maximization of productivity, given the available resources and technological capabilities [7]. In other words, it is considered that a farm is technically efficient when it operates at maximum output capacity, considering the inputs and technology utilized. Conversely, this denotes the process of attaining the desired level of production with the minimum possible input [8]. That means lower costs and higher profits.
The measurement of technical efficiency is typically accomplished through the utilization of a "frontier" of best-practice farms as a benchmark. This approach serves to indicate the proximity of a given farm's production to its maximum potential.
It is hypothesized that large farms may enhance technical efficiency by leveraging economies of scale [9], thereby facilitating the adoption of novel technologies and optimal management practices [10,11], including planning and organizational strategies [12]. Regarding the inputs employed in production processes, the efficient utilization of fertilizers, energy, water, and labor is imperative [13]. Poultry production systems should be optimized to enhance their energy/resource efficiency by developing the necessary infrastructure across all stages of production; digital technologies may support maximizing production efficiency, most of all in contexts of growing frequency of crises, such as the recent COVID-19 epidemic [14].
As indicated by extant literature, additional variables have been shown to be positively correlated with technical efficiency: these include farmers' level of education and training [15], access to credit, and access to extension and information services [16].
In the context of livestock farming, the measurement of technical efficiency and profitability is predicated on the consideration of key inputs, including feed, labor and land use, with a view to producing outputs such as milk, eggs and meat [17]. A further key objective is the minimization of production costs. It is evident that the costs associated with feeding, labor, and medical care are significant factors in determining the technical efficiency and profitability of a livestock farm. This is of relevance to the poultry sector, where a significant proportion of these costs could be governed by contracts [18].
The analysis of technical efficiency in livestock farming, as in agriculture, facilitates the assessment of the extent to which a farm successfully converts input into outputs (e.g. livestock or crops) and the degree to which those outputs translate into financial performance. This analysis can reveal areas where a farm excels or struggles, thus guiding decisions to improve both technical and financial results. In this regard, certain studies have employed a stochastic frontier production approach to estimate the efficiency of poultry farms [19,20].
In the context of financial assessment, revenues, capital costs, and current costs are the most used items to evaluate the financial results of the technical performance of an agricultural or livestock business.
The financial implications of poultry production have been shown to have a considerable effect on the overall profitability of poultry farming [21]. This has been particularly pronounced during the period of the global pandemic of Coronavirus (SARS-CoV-2). As [22] demonstrated, the production costs enumerated above, market prices, and efficient resource management play a crucial role in determining the profitability of a poultry operation.
Standardized total gross revenue is widely regarded as the total return on an investment prior to any deductions and is frequently used to evaluate the genuine financial implications of an investment, as well as to facilitate a comparative analysis between potential investments. This variable is preferable to net income, as many poultry farms have contracts that could exclude certain business costs, such as veterinary fees, external services, etc., which are borne by the chick owner [23]. Consequently, the cost structure, encompassing both capital and current expenses, incurred by the farmer exhibits variability across different farms.
The survival of many poultry farms is facilitated by using family members as work units, thus avoiding involvement in market risks inherent in contractual arrangements. Family labor is frequently a hidden cost and not considered in calculating farm profitability; however, it is a valuable variable for calculating the technical efficiency of family-run poultry farms, just like standard work units, as well as for large, automated contract farms, which require minimal labor and family labor [24].
The livestock unit is a variable often considered in literature to measure the technical efficiency of a livestock farm. This is done to evaluate productivity [25], production systems or pasture use by different types of herbivores. It is a standardized measure that facilitates the comparison and aggregation of diverse livestock types. Furthermore, it is a variable that is well suited to the two main categories of poultry farms (layers, broilers) to determine overall poultry density, feed management strategies, and feed costs [26].
The utilized agricultural area (UAA) is another factor considered when measuring the technical efficiency of a poultry farm. The land can be used to grow crops for poultry feed and to manage poultry waste which generates valuable soil fertilizer [27]. This affects both large and small farms, including contracted and extensive poultry farms [28]. As feed is one of the main production costs for poultry farms, producing it in-house can provide a competitive advantage [29,30].
As regards the approaches used to investigate firm technical efficiency, researchers have calculated the technical and productive efficiency of poultry farms using both stochastic frontier analysis [18,31] and data envelopment analysis [32,33]. As [18] stated, the choice between the two approaches is dependent on the research objectives, the nature of the farms involved, the available data, and the sample size.
Aim of the study is to investigate the technical efficiency of Italian poultry farms along the time span 2019-2022, and to observe how efficiently they utilized their inputs due to controllable or managerial factors and to exogenous shocks and factors beyond the firm's control. The attention paid to the Italian case is motivated by two types of factors, mentioned above: the importance that the country has in the European poultry sector; and the importance that the poultry sector has in the Italian livestock and agricultural economy. The temporal reference of the analyzes to the years 2019-2022 places emphasis on a period characterized by events, such as the pandemic and avian influenza, that occurred almost simultaneously and that presented poultry farms with important economic challenges.
After a descriptive analysis of the most relevant economic variables observed in the period and of their dynamic, a Stochastic Frontier Model applied to panel data of Italian poultry farms allows to estimate the production frontier and the firm-specific factors of inefficiency over the observed time span.
2. Materials and Methods
2.1. Materials
The data for the analyses were retrieved from the RICA database, the Italian section of the EU Farm Accountancy Data Network (FADN) managed by the CREA, the national Council for Agricultural Research and Economics. The RICA datasets collect detailed technical, economic, and structural information on Italian agricultural enterprises.
The selection of farms was based on two fundamental criteria. The first criterion concerns the Technical-Economic Orientation (TEO): only farms whose main activity falls under poultry farming were included, in accordance with the ISTAT classification of agricultural activities. The second requirement relates to data completeness during the entire observation period, and consistency, meaning that the selected farms present a complete and coherent dataset for all recorded economic and structural variables.
The analyzed sample includes 122 Italian poultry farms observed over the period 2019–2022, for a total of 488 observations in a balanced panel format. For these farms, balance sheet items and some structural data were considered.
The construction of the dataset required a careful selection and organization of variables that are essential for specifying both the production frontier and the inefficiency model.
The whole dataset includes several variables concerning the structural characteristics of the farm and all items included in their financial statements. A preliminary analysis of the literature was useful for selecting the main variables adopted in the studies.
The main variables included in the econometric analysis are described below:
Value of Production (VoP, €): captures the total value of the revenue from livestock production of the farm, expressed in euros. It represents the output of the production function, reflecting the farm’s income-generating capacity from poultry activities;
Current Costs (CurC, €): include all operating expenses incurred in the current year, such as feed, veterinary drugs, energy, routine maintenance and external services. They reflect the short-term intensity of input use;
External Services Costs (ESC, €): include expenses related to ancillary activities, health and veterinary services, and insurance, provided by third parties;
Capital Costs (CapC, €): comprise depreciation of fixed assets and other capitalized expenditures, representing long-term investment in assets;
Livestock Units (LivU): this dimensional variable quantifies the farm’s livestock capital by converting different categories of poultry (e.g., laying hens, broilers) into a standard unit. It serves as a proxy for the scale of poultry production;
Utilized Agricultural Area (UAA, ha): indicates the land area (in hectares) used for agricultural activities. While poultry farming is typically intensive and land-light, UAA may capture integration with on-farm feed production or the management of manure;
Labor Units (LabU): measures total labor input, whether hired or family-based, expressed in standard annual labor units. It reflects the overall labor intensity of the production process;
Family Labor Units (FLU): as a subset of total labor, this variable measures the contribution of family members. It allows differentiation of labor organization strategies and may have implications for technical efficiency;
TEO_Poultry (TEO_P): a categorical variable expressing the principal Technical-Economic Orientation in poultry farming. It was subdivided into two categories: TEO_PMeat, for the firms having the highest VoP share in meat production, and TEO_POther, for firms with principal orientation towards the eggs or mixed meat-eggs production.
2.2. Methods
As previously argued, understanding how efficiently firms utilize their inputs to generate outputs is crucial in economic analysis. Traditionally, production functions represent the maximum possible relationship between inputs and outputs. However, in practice, firms rarely operate at their full potential capacity.
Two methods are mostly used in literature for the estimation of the efficiency of livestock farming, Stochastic Frontier Analysis (SFA) and non-parametric Data Envelopment Analysis (DEA).
Stochastic Frontier Analysis (SFA), a powerful econometric methodology introduced by [34] and developed by [35], measures and explains a firm's deviations from its potential production frontier by focusing on the nature of such deviations.
Other approaches, such as Data Envelopment Analysis (DEA), a non-parametric and deterministic method, attribute every deviation from the estimated efficiency frontier entirely to technical inefficiency. According to the DEA, if a firm fails to achieve the maximum possible output from its inputs, this is solely due to intrinsic managerial or operational shortcomings. These models do not account for the influence of random external factors or measurement errors in the observed data.
In contrast, SFA adopts an approach that explicitly recognizes that deviations from the production frontier may arise from two distinct sources:
1. technical inefficiency: intrinsic shortcomings in the firm’s ability to operate on the frontier due to controllable or managerial factors;
2. stochastic noise: exogenous shocks, measurement errors, or other random factors beyond the firm's control (e.g., weather events, market fluctuations).
This crucial ability to separate technical inefficiency from stochastic noise represents the main advantage of SFA over purely deterministic methods and was the reason that guided the choice of this method instead of the DEA. It allows for a more realistic estimation of inefficiency, free from random disturbances, thereby providing a more accurate and informed picture of productive performance and areas for improvement.
The core principle behind SFA lies in the specification of the production function and in the composition of its error term.
Model is formulated as follows:
Each component of the model can be interpreted as follows:
: represents the value of the livestock output achieved by firm i in period t. It is the variable to be explained;
: this is a vector of explanatory variables (production inputs such as capital, labor, raw materials, and other factors influencing production) for firm i in period t. These are the factors controlled by the firm that affect its productive capacity;
: a vector of unknown coefficients quantifying the impact of each variable in on production, whose estimation is fundamental for defining the potential “frontier”;
: this component captures the “stochastic noise” or random error. It is assumed that the are independent and identically distributed (i.i.d.) random errors following a normal distribution with zero mean and variance , i.e. . These errors represent factors beyond the firm’s control, such as unexpected weather variations, measurement errors in the data, or temporary economic shocks. It is important to emphasize that they are independent of ;
: this is the crucial component representing technical inefficiency in production. Unlike , the are non-negative random variables. This makes sense: a firm can operate below the frontier (positive inefficiency) but cannot produce more than what the stochastic frontier (which already includes noise) allows. The greater the value of , the higher the technical inefficiency.
A key innovation in SFA, particularly evident in the context of panel data and developed by [35], is the assumption that the inefficiency effects are not simply random variables with a fixed distribution (such as the half-normal) but may instead be influenced by firm-specific factors that vary over time. The values are obtained from the truncation (at zero) of a normal distribution with mean and variance . More formally, the technical inefficiency effect can be specified as:
where:
: this is a vector of explanatory variables that influence the technical inefficiency of firm i in period t. These variables may include managerial, structural, or environmental factors, or any element believed to affect the firm's ability to operate efficiently;
: a vector of unknown coefficients that describe the impact of each variable in on inefficiency;
: a random variable defined by the truncation of a normal distribution with mean zero and variance , with truncation point −. This specification ensures that is non-negative, as required by inefficiency theory.
The estimation of the parameters in the SFA model is generally carried out using the Maximum Likelihood Estimation (MLE) method. This approach allows for the simultaneous estimation of both the production frontier parameters and the inefficiency model parameters . The likelihood function is expressed in terms of the variance parameters = +, and the ratio =, which indicates the proportion of the total error variance attributable to inefficiency. A value of close to one suggests that most of the deviation from the frontier is due to technical inefficiency, whereas a value close to zero indicates that stochastic noise prevails.
Once the model parameters are estimated, the ultimate goal is to predict the technical efficiency for each firm and time period. The technical efficiency of production for firm i at observation t is defined as:
The values of range between 0 and 1, where 1 indicates full efficiency (i.e., the firm operates on the stochastic frontier), and values below 1 represent increasing degrees of inefficiency. The prediction of these efficiency scores is based on the conditional expectation of , given the model assumptions, thus providing an estimate of the relative efficiency of each production unit.
In the present study, the production function was specified in a log-linear form, with the logarithm of total farm revenue used as the dependent variable, while the explanatory variables (productive inputs) included in the model are the logarithms of all the considered costs.
The functional form adopted is therefore:
Regarding the technical inefficiency model, in accordance with the specification proposed by [35], it was assumed that inefficiency depends on a set of structural and managerial characteristics of the firm; specifically, the inefficiency term was modelled as:
3. Results and Discussions
The present section is organized firstly giving brief information and descriptive statistics regarding the characteristics of the farms in the sample and the variables used in the econometric analyses; then, econometrics results are presented.
3.1. Descriptive Characteristics of Italian Poultry Farms
Following the selection criteria described in the previous section, the sample was composed of 122 livestock farms for a total of 488 observations over the period 2019-2022.
Most of the units (43%) are in Eastern Italy, the 30% and 18% are located respectively in Southern and Central regions. More than 40% of the firms are in plain areas, 24% and 28% in mountainous and hilly inland areas. About half of the units were established by inheritance; rent (21%), donation (16%) and purchase (10%) are less important as a way of starting the livestock businesses. As for the legal form of the units, 75% of enterprises are sole proprietorship and 22% are simple companies. As regards the employment profile, two types of farms are represented: firms that are managed with exclusive family labor (43%) and farms with a predominance of the family labor units (48%). The livestock entrepreneur has the following main characteristics: young in 13% of firms, female in 24% of enterprises.
The distribution of units by classes of economic dimensions (defined by Reg CE 1248/2008) is as follows: about 40% of units is of a big size (1 million € or above), 26% of firms has between 500 thousand and 1 million €, the 28% fall in the class 100-500 thousand euros, and the remaining percentage has less than 100 thousand €. The sector is highly concentrated and mainly characterized by large-sized organizations: the biggest firms represent almost 73% of the value of livestock output and 84% of the livestock units in the sample.
Table 1 reports some descriptive statistics of the farms in the sample. In the period 2019-2022, the total value of the livestock output shows a slight decrease in the first three years but closes the period with an increase of 17% over the average in the previous three-year period.
The number of livestock units shows annual changes and an up-and-down pattern, but the period closes with a reduction in units compared to year 2019 and to the average size of firms in years 2019-2021. As regards the main cost categories, current costs are very relevant and increase in the period, closing with a surge of about 25% in 2022. Long-term costs and the costs for external services report on average a decrease in the period, maybe because farms try to face the surge in the amount of the current costs.
The characteristics of firms in terms of labor are described as follows: in the investigated population the biggest farms represent 56% of the work units and 47% of family labor units; the medium-large sized units count for 22% of LabU and 25% of FLU; and medium farms weigh 18% and 24% respectively in terms of LabU and FLU. Indeed, livestock farms are not very labor intensive: from the group of the smallest firms to the one with the biggest units in terms of economic dimensions, the average size of farms in the period goes on average from 1.7 to 3.6 LabU, and from 1.3 to 2.0 in terms of family labor units. Furthermore, as reported in Table 1, both labor aggregates do not show changes in the period 2019-2022. At this regard, evidence suggests that the employment of automation and controlled environments in large-scale poultry farming systems results in a reduction in the overall demand for labor [36,37].
Figure 1 reports the mean value and the standard deviation of costs amount by year and cost categories showing the relevance of feed costs, the increase of their amount in the last year and a high standard deviation. The other cost categories reported a slight increase in their absolute amount, and veterinary costs show the highest variability in each year of observation. As emphasized by [38], in the observed period the repercussions of the pandemic and the resultant protracted lockdown have had a substantial impact on the livestock sector, the poultry production system and associated value chains, nutrition, and healthcare costs.
When the amount of costs is expressed in terms of livestock unit (Figure 2), it is evident that all categories reported a strong increase in the last three years 2020-2022, especially the costs for feed and for water, fuel and electricity.
The dynamic of costs described above could reflect the impacts on Italian farms of the epidemic and pandemic events that occurred in the observed period, consistently with some literature.
The surge in chicken feed costs in the period was attributed to the escalating costs of agricultural fertilizers observed during the pandemic years, consequently exerting an indirect influence on the production costs of cereals and, by extension, of feed [39].
Poultry farming is an energy-intensive sector that requires a significant amount of fossil fuel to ensure the desired internal temperature for the health and production level of chickens. Fuel is used for heating and cooling, lighting, ventilation and the functioning of electric motors for the feed lines. These factors translate into high operating costs [40]. Furthermore, the increase in energy costs in years 2020-2022 was exacerbated by the protracted storage times for meat and egg-producing poultry on farms, due to forced transportation slowdowns and a sluggish market during the pandemic; the reduction of production due to the epidemic outbreaks may have impacted on the energy cost per unit of animal.
3.2. The Technical Efficiency of Livestock Farms: Results of the Econometric Analysis
Table 2 reports the parametric estimation results for SFA models (4)-(5).

| 2019 | 2020 | 2021 | 2022 | Global |
| 0.803 | 0.806 | 0.803 | 0.793 | 0.801 |
In the first part of the model, the dependent variable, represented by the poultry farms' VoP (expressed in logarithmic form), is explained by three production inputs: current costs, external services costs and capital costs, also transformed into logarithms. The results show that the first and the last of these cost types have a positive and significant impact on production, confirming their incisive role in creating value.
On the other hand, third-party services do not make a significant contribution to VoP. Veterinary services are essential to ensure animal welfare and as a preventive measure for disease surveillance; during the pandemic years, the provision of these services was very difficult, and costs increased [41]. Access to external services, such as veterinary services, is a particularly important issue for small farms, as they are not covered by the contractual conditions that medium and large poultry farms rely on, making them vulnerable to any crisis. The situation is different for medium and large poultry farms, as they have existing sharecropping contracts, meaning these services are most likely paid for by the chicken owners [5,42]. This could be the reason why the results of the analysis do not highlight a significant role of external costs due to the characteristics of the sample farms analyzed.
The second part of the model concerns the analysis of the determinants of technical efficiency based on the following explanatory variables: LabU, LivU, UAA and TEO_Poultry, the latter coded as a dummy variable (Meat/Other). As can be seen, the selected variables are significantly associated with a reduction in inefficiency, with negative coefficients presenting a p-value of less than 0.05 (apart from UAA, which is significant at 10% level): this implies that a greater endowment of these factors is correlated with a reduction in inefficiency and therefore an improvement in technical efficiency. The TEO_Poultry variable, which is of special interest in this study, is significant in the sense that firms specialized in poultry meat production are less inefficient (or more efficient) than the poultry firms oriented to other outputs.
Utilizing a stochastic frontier production analysis approach, [18] attained analogous outcomes by concurrently estimating TE levels and ascertaining the factors influencing the efficiency of poultry farms in Pakistan. Specifically, the findings indicate a positive correlation between labor units, feed consumption, and water consumption with poultry production value; as in our study, the cost of veterinary services for animal vaccination was found to be insignificant.
Regarding family-run poultry farms, the different functional combinations of activities and resource flows managed by agricultural families allow for good efficiency maintenance as they are not very dependent on external pressures. However, firm organization and efficiency depend on several factors, including the level of mechanization, the integration between crops and livestock, and the market orientation, which is therefore subject to external variables.
The alpha value of 0.564 means that about half of the deviation from the frontier is due to technical (in)efficiency.
Finally, the analysis of technical efficiency shows a constant mean value of the efficiency over the period 2019-2022 with an overall average value of 0.801.
Above findings indicate that in the period of investigation the efficiency of Italian poultry farms was attributable to the management of farms’ assets, the availability of resources, and some characteristics of farms. Although the period observed was characterized by an increase in certain costs (most of all, feed and energy costs), farms demonstrated resilience to the external shocks. This does not mean that poultry farms have not suffered the effects of the external pandemic in the short term, but that they may have developed strategies to address these events through effective resource management that must be maintained and improved by acting on key efficiency factors.
The analyses were based on the EU-IT FADN database that focuses on specific farm types and sizes and may not capture the full spectrum of livestock farm diversity. This could be a limitation of the sample examined, particularly considering the exclusion of small poultry farms, although the poultry sector is mainly characterized by medium- and large-sized farms. A future research direction could consider the size of the farms based on a different data source or on a direct survey, as well as other variables.
4. Conclusions
Aim of the study was to investigate the technical efficiency of Italian poultry farms over the period 2019-2022, and to observe how efficiently they utilized their inputs due to controllable or managerial factors and to exogenous shocks and factors beyond the firm's control. Findings of the study indicate that the observed technical inefficiency of Italian poultry farms was predominantly attributable to the management of the farm's assets, the availability of resources and factors, and the characteristics inherent to the poultry farm. Consequently, firms’ emphasis should be directed at improving the management of capital endowment and costs as well as of current costs.
The findings of the study are corroborated by the stochastic frontier approach, which demonstrates a positive correlation between labor units and both feed consumption and production value. This result implies that the integration of management activities and resources could ensure that optimal levels of efficiency are maintained, thus reducing dependence on external factors and sensitivity to external shocks. Furthermore, the relevance of feed costs and water, fuel and electricity costs and their sharp increase in recent years suggest how crucial the management of these inputs is to improve the economic performance of firms and their resilience, as well as to ensure product quality and safety and animal welfare.
Author Contributions
Conceptualization, M.B.F.; data curation, P.D.R.; formal analysis, L.R., P.D.R. and M.B.F; methodology, L.R. and P.D.R.; supervision, M.B.F; writing—original draft preparation, all authors; writing—review and editing, M.B.F. All authors have read and agreed to the published version of the manuscript.
Funding
This research received no external funding.
Conflicts of Interest
The authors declare no conflicts of interest”.
Abbreviations
The following abbreviations are used in this manuscript:
| DEA | Data Envelopment Analysis |
| FADN | Farm Accountancy Data Network |
| SFA | Stochastic Frontier Analysis |
| TE | Technical Efficiency |
| TEO | Technical-Economic Orientation |
References
- FAO. Poultry meat production. Our World in Data, 2025. https://archive.ourworldindata.org/20250624-125417/grapher/poultry-production-tonnes.html.
- OECD/FAO. OECD-FAO Agricultural Outlook 2025-2034, OECD Publishing: Paris, 2025. https://www.oecd.org/en/publications/oecd-fao-agricultural-outlook-2025-2034_601276cd-en.html.
- European Commission. Market Situation for Poultry. European Union, Bruxelles, 2024. https://circabc.europa.eu/sd/a/cdd4ea97-73c6-4dce-9b01-ec4fdf4027f9/24.08.2017-Poultry.pptfinal.pdf.
- ISMEA. Avicoli e uova. Rome, Italy, 2024. https://www.ismeamercati.it/flex/files/1/a/9/D.b92cb4fbf6d7d5bd7ee2/SchedaAvicoli_2024.pdf.
- Attia, Y.A.; Rahman, M.T.; Hossain, M.J.; Basiouni, S.; Khafaga, A.F.; Shehata, A.A.; Hafez, H.M. Poultry production and sustainability in developing countries under the COVID-19 crisis: Lessons learned. Animals 2022, 12, 644. [Google Scholar] [CrossRef] [PubMed]
- Mishra, P.; Golaviya, A.; Panchal, K.; Hinsu, A.; Yadav, K.; Fournié, G.; …; Dasgupta, R. Exploring the Impact of COVID-19 and the Associated Lockdown on the Production, Distribution, and Consumption of Poultry Products in Gujarat, India: A Qualitative Study, Poultry 2023, 2, 395–410. [CrossRef]
- Emrouznejad, A.; Cabanda, E. Introduction to Data Envelopment Analysis and its Applications. In Osman, I.; Anouze, A.; Emrouznejad A. (Eds.), Handbook of Research on Strategic Performance Management and Measurement Using Data Envelopment Analysis. IGI Global Scientific Publishing. 2015, pp. 235-255. [CrossRef]
- Ruzhani, F.; Mushunje, A. Technical efficiency in agriculture: A decade-long meta-analysis of global research, J. Agric. Food Res., 2025, 19, 01667. [Google Scholar] [CrossRef]
- Shanmugam, K.; Venkataramani, A. Technical Efficiency in Agricultural Production and Its Determinants: An Exploratory Study at the District Level. Indian J. Agr. Econ. 2006, 61. [Google Scholar]
- Trentin, A.; Talamini, D.J.D.; Coldebella, A.; Pedroso, A.C.; Gomes, T.M.A. Technical and economic performance favours fully automated climate control broiler housing. Br. Poult. Sci. 2025, 66, 63–70. [Google Scholar] [CrossRef] [PubMed]
- Workneh, W.M.; Kumar, R. The technical efficiency of large-scale agricultural investment in Northwest Ethiopia: A stochastic frontier approach, Heliyon 2023, 9. [CrossRef]
- Manevska-Tasevska, G.; Hansson, H.; Labajova, K. Impact of Management Practices on Persistent and Residual Technical Efficiency – a Study of Swedish pig farming. Manag. Decis. Econ. 2017, 38, 890–905. [Google Scholar] [CrossRef]
- Radlińska, K. Some Theoretical and Practical Aspects of Technical Efficiency—The Example of European Union Agriculture. Sustainability 2023, 15, 13509. [Google Scholar] [CrossRef]
- Kopler, I.; Marchaim, U.; Tikász, I. E.; Opaliński, S.; Kokin, E.; Mallinger, K. .; Banhazi, T. Farmers’ perspectives of the benefits and risks in precision livestock farming in the EU pig and poultry sectors. Animals 2023, 13, 2868. [Google Scholar] [CrossRef]
- Krasniqi, N.; Blancard, S.; Gjokaj, E.; Aalmo, G.O. Modelling technical efficiency of horticulture farming in Kosovo: An application of data envelopment analysis. Bio-based Appl. Ec. 2023, 12, 183–195. [Google Scholar] [CrossRef]
- Hakim, R.; Haryanto, T.; Sari, D.W. Technical efficiency among agricultural households and determinants of food security in East Java, Indonesia. Sci. Rep. 2021, 11, 4141. [Google Scholar] [CrossRef]
- Dhehibi, B.; Souissi, A.; Frija, A.; Fouzai, A.; Idoudi, Z.; Abdeladhim, M.; Devkota, M.; Rekik, M. Assessing technical efficiency of crop–livestock systems under conservation agriculture: exploring the potential for sustainable system transformation in Tunisia. Managem & Sustainab: An Arab Review 2025. [CrossRef]
- Khan, N.A.; Ali, M.; Ahmad, N.; Abid, M.A.; Kusch-Brandt, S. Technical Efficiency. Analysis of Layer and Broiler Poultry Farmers in Pakistan. Agriculture 2022, 12, 1742. [Google Scholar] [CrossRef]
- Ali, S.; Ali, S.; Riaz, B. Estimation of Technical Efficiency of Open Shed Broiler Farmers in Punjab, Pakistan: A Stochastic Frontier Analysis. J. Econ. Sust. Dev. 2014, 5, 79–88. [Google Scholar]
- Rokhani, M.R.; Kuntadi, E.B.; Suwandari, A.; Yanuarti, R.; Khasan, A.F.; Mori, Y.; Kondo, T. Impact of Contract Farming on the Technical Efficiency of Broiler Farmers in Indonesia. Food Ec. 2023, 25. [Google Scholar] [CrossRef]
- Adaszyńska-Skwirzyńska, M.; Konieczka, P.; Bucław, M.; Majewska, D.; Pietruszka, A.; Zych, S.; Szczerbińska, D. Analysis of the Production and Economic Indicators of Broiler Chicken Rearing in 2020–2023: A Case Study of a Polish Farm. Agriculture 2025, 15, 139. [Google Scholar] [CrossRef]
- Marcu, A.; Vacaru-Opri¸s, I.; Dumitrescu, G.; Ciochină, L.P.; Marcu, A.; Nicula, M.; Pe¸t, I.; Dronca, D.; Kelciov, B.; Mari¸s, C. The influence of genetics on economic efficiency of broiler chickens growth. Anim. Sci. Biotechnol. 2013, 46, 339–346. [Google Scholar]
- Karaman, S.; Taşcıoğlu, Y.; Bulut, O.D. Profitability and Cost Analysis for Contract Broiler Production in Turkey. Animals 2023, 13, 2072. [Google Scholar] [CrossRef]
- Jarmołowicz,W.; Ziebakowski, L. Labor costs and their Conditions in Poland and the European Union. A Comparative Perspective. Stud. Prawno-Ekon. 2018, 107, 281–303. [CrossRef]
- Benoit, M.; Veysset, P. Livestock unit calculation: a method based on energy needs to refine the study of livestock farming systems. INRAE Prod. Anim. 2021, 34, 139–160. [Google Scholar] [CrossRef]
- Arata, L.; Chakrabarti, A.; Ekane, N.; Foged, H.L.; Pahmeyer, C.; Rosemarin, A.; Sckokai, P. Assessment of environmental and farm business impacts of phosphorus policies in two European regions. Front. Sustain. Food Syst. 2022, 6. [Google Scholar] [CrossRef]
- Latruffe, L.; Balcombe, K.; Davidova, S.; Zawalinska, K. Determinants of Technical Efficiency of Crop and Livestock Farms in Poland. Appl. Econ 2004, 1255–1263. [Google Scholar] [CrossRef]
- Yunus, I. Estimation of technical efficiency of broiler production in Peninsular Malaysia: A stochastic frontier analysis. J. Bus. Manag. Account. 2012, 2, 77–96. [Google Scholar] [CrossRef]
- Adewumi, A.; Agidigbo, K.O.; Arowolo, K.O. Profit efficiency of poultry farmers in Irepodun local government area of Kwara state, Nigeria. J. Agripreneurship Sust. Dev. 2022, 5, 45–53. [Google Scholar] [CrossRef]
- Szőllősi, L.; Béres, E.; Szűcs, I. Effects of modern technology on broiler chicken performance and economic indicators – a Hungarian case study. It. J. Animal Sc. 2021, 20, 188–194. [Google Scholar] [CrossRef]
- Jo, H.; Nasrullah, M.; Jiang, B.; Li, X.; Bao, J. A survey of broiler farmers’ perceptions of animal welfare and their technical efficiency: A case study in northeast China. J. Appl. Anim. Welf. Sci. 2022, 25, 275–286. [Google Scholar] [CrossRef]
- Myeki, L.W.; Nengovhela, N.B.; Mudau, L.; Nakana, E.; Ngqangweni, S. Estimation of technical, allocative, and economic efficiencies for smallholder broiler producers in South Africa. Agriculture 2022, 12, 1601. [Google Scholar] [CrossRef]
- Marmelstein, S.; Costa, I.P.D.A.; Terra, A.V.; Silva, R.F.D.; Capela, G.P.D.O.; Moreira, M.Â.L. .; Santos, M.D. Advancing efficiency sustainability in poultry farms through data envelopment analysis in a Brazilian production system. Animals 2024, 14, 726. [Google Scholar] [CrossRef] [PubMed]
- Aigner, D.; Lovell, C.K.; Schmidt, P. Formulation and estimation of stochastic frontier production function models. J. Econometr. 1977, 6, 21–37. [Google Scholar] [CrossRef]
- Battese, G.E.; Coelli, T.J. A model for technical inefficiency effects in a stochastic frontier production function for panel data. Empir. Ec. 1995, 20, 325–332. [Google Scholar] [CrossRef]
- Neethirajan, S. Automated tracking systems for the assessment of farmed poultry. Animals 2022, 12, 232. [Google Scholar] [CrossRef] [PubMed]
- Natsir, M.H.; Mahmudy, W.F.; Tono, M.; Nuningtyas, Y.F. Advancements in Artificial Intelligence and Machine Learning for Poultry Farming: Applications, Challenges, and Future Prospects. Smart Agr. Techn. 2025, 12, 101307. [Google Scholar] [CrossRef]
- Malik, Y.S; Ansari, M.I.; Gharieb, R.; Ghosh, S.; Kumar Chaudhary, R.; Gomaa Hemida, M.; Torabian, D. , Rahmani, F., Ahmadi, H., Hajipour, P., Salajegheh Tazerji, S., 2024. The Impact of COVID-19 Pandemic on Agricultural, Livestock, Poultry and Fish Sectors. Vet. Med. Int. 2024, 1, 5540056. [Google Scholar] [CrossRef]
- Belarmino, L.C.; Pabsdorf, M.N.; Padula, A.D. Impacts of the COVID-19 Pandemic on the Production Costs and Competitiveness of the Brazilian Chicken Meat Chain. Economies 2023, 11, 238. [Google Scholar] [CrossRef]
- Cui, Y.; Xue, X.; Riffat, S. Cost Effectiveness of Poultry Production by Sustainable and Renewable Energy Source. In Meat and Nutrition Chhabi Lal Ranabhat (Ed.), Intechopen 2021. [CrossRef]
- Raihan, A.; Himu, H.A. Global impact of COVID-19 on the sustainability of livestock production. Global Sust. Res. 2023, 2, 1–11. [Google Scholar] [CrossRef]
- Rahman, K.M.M.; Hossain, M.J.; Rana, M.S. Livestock and Poultry Rearing by Smallholder Farmers in Haor Areas in Bangladesh. Impact on Food Security and Poverty Alleviation. Bangladesh J. Agr. Econ. 2020, 41, 73–86. [Google Scholar]
Figure 1.
Mean and standard deviation of the main cost categories (€).
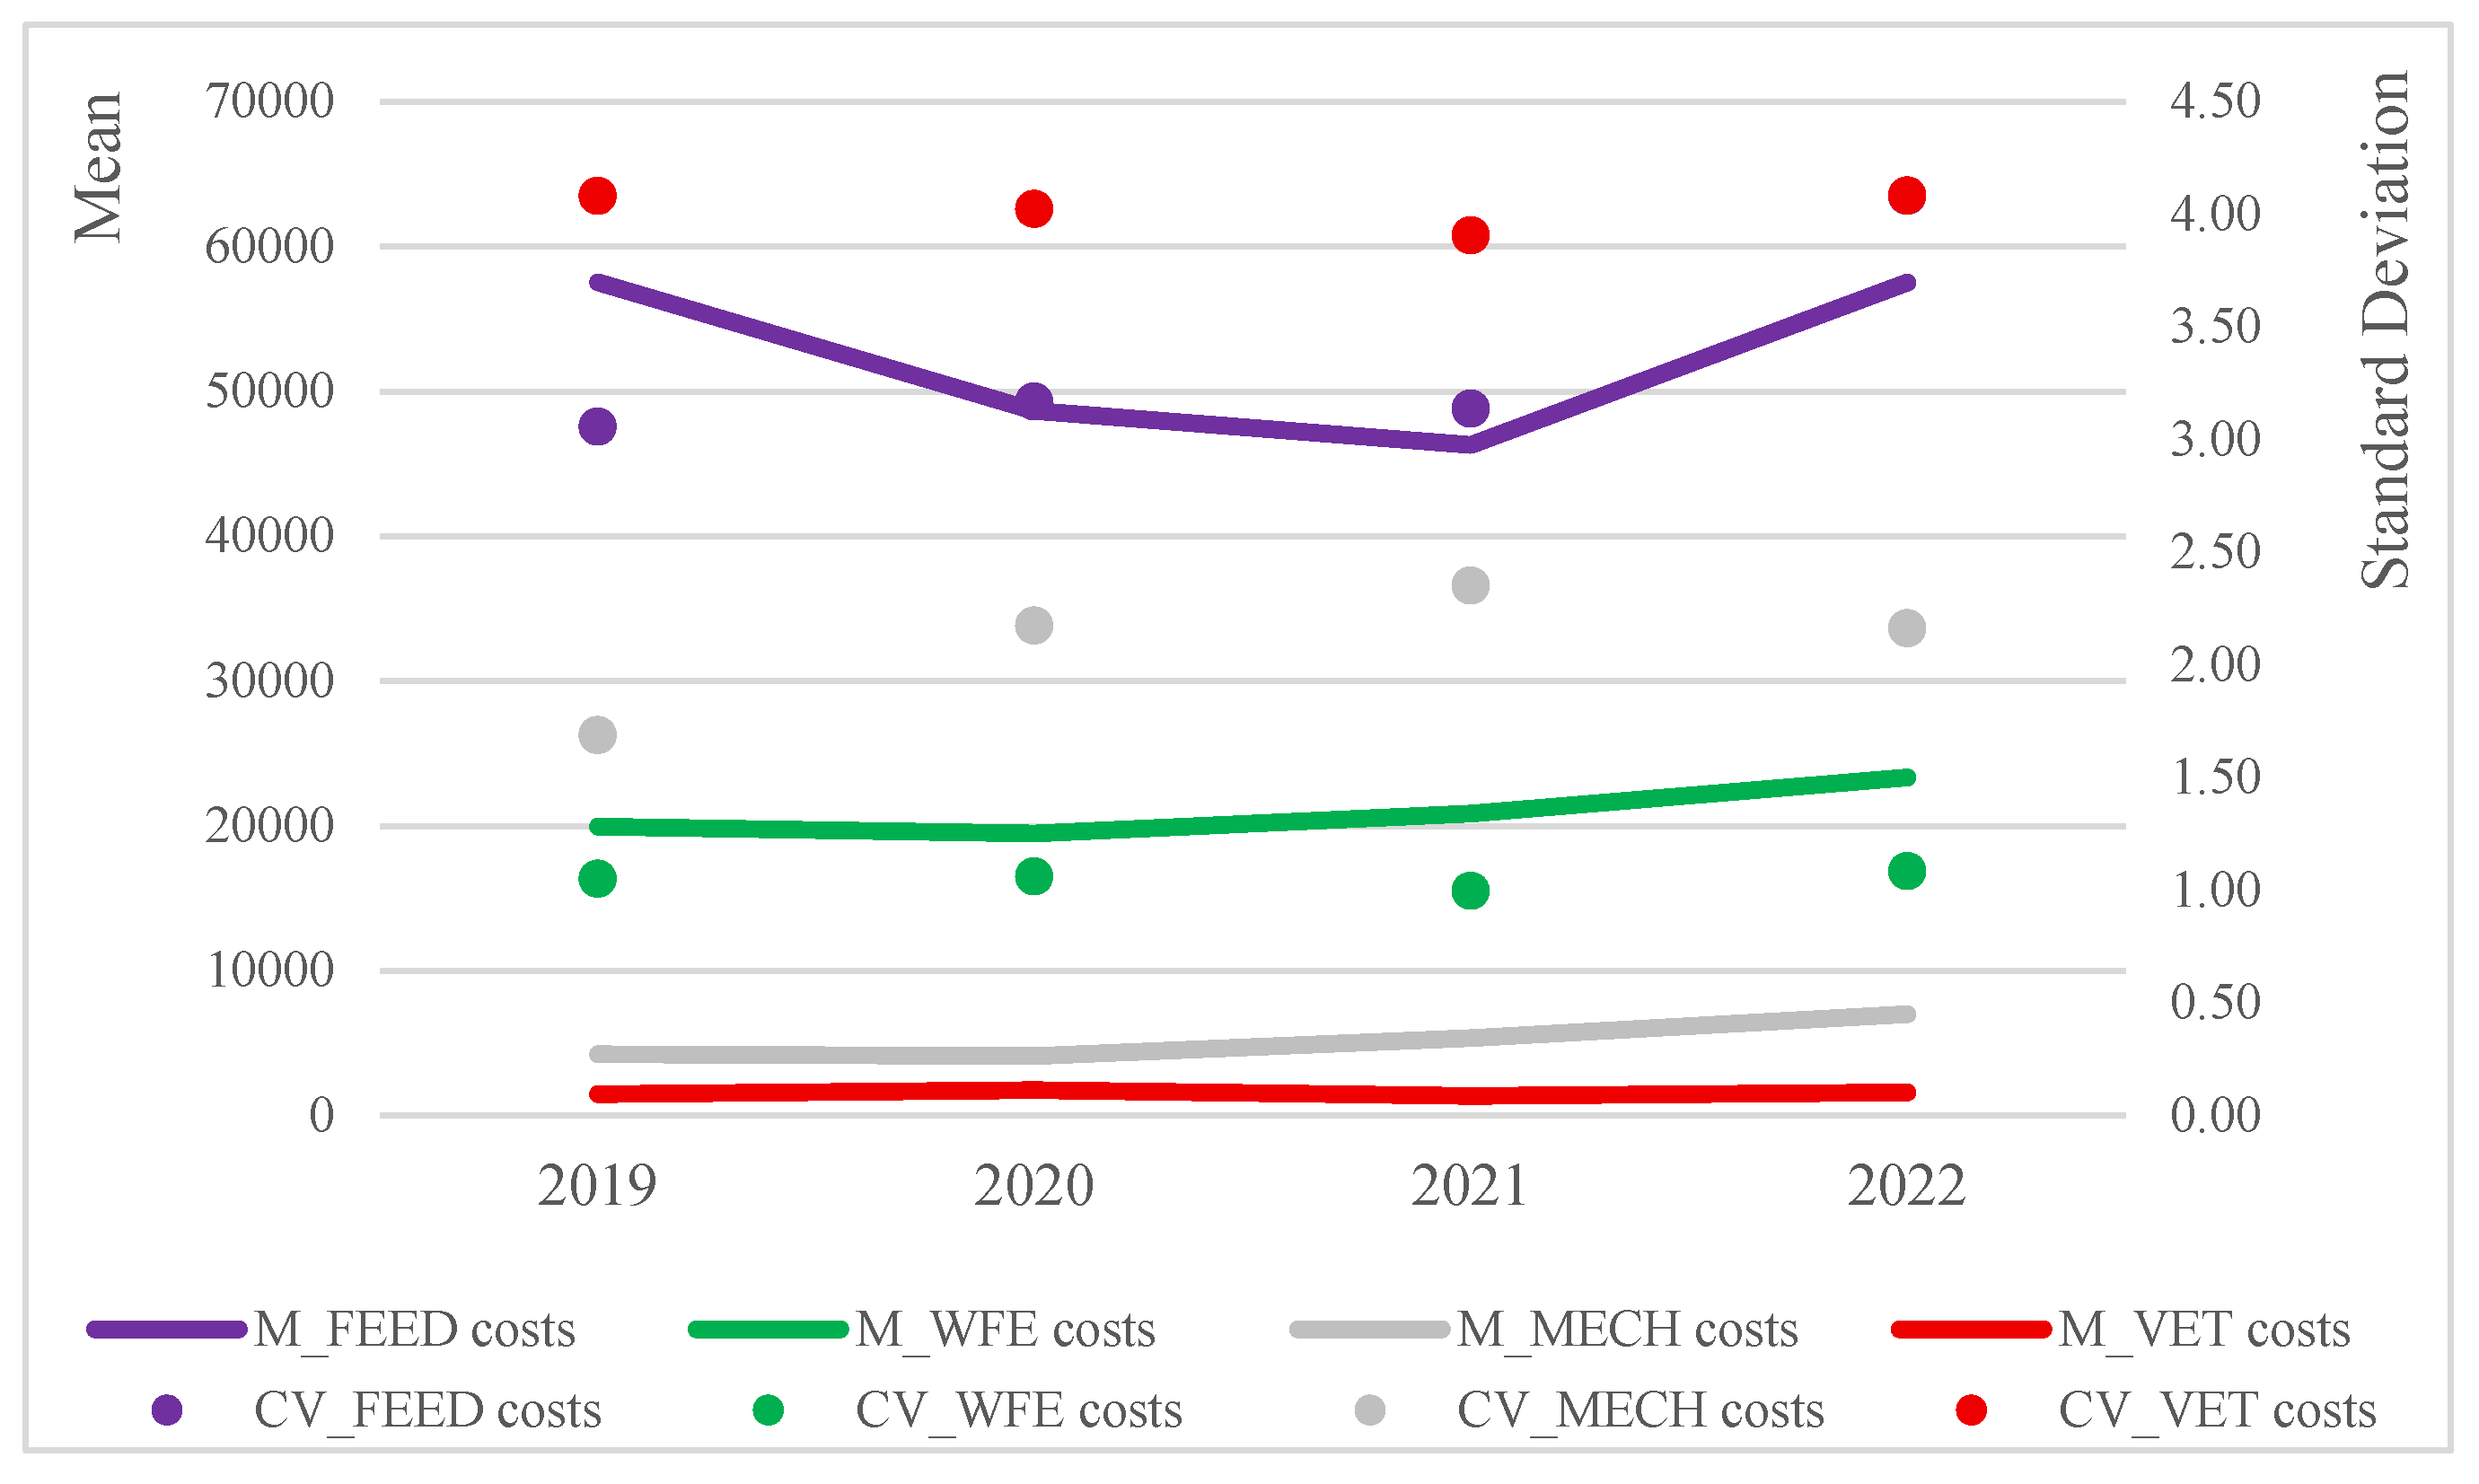
Figure 2.
Mean and standard deviation of the main cost categories by LivUs (€/LivU).
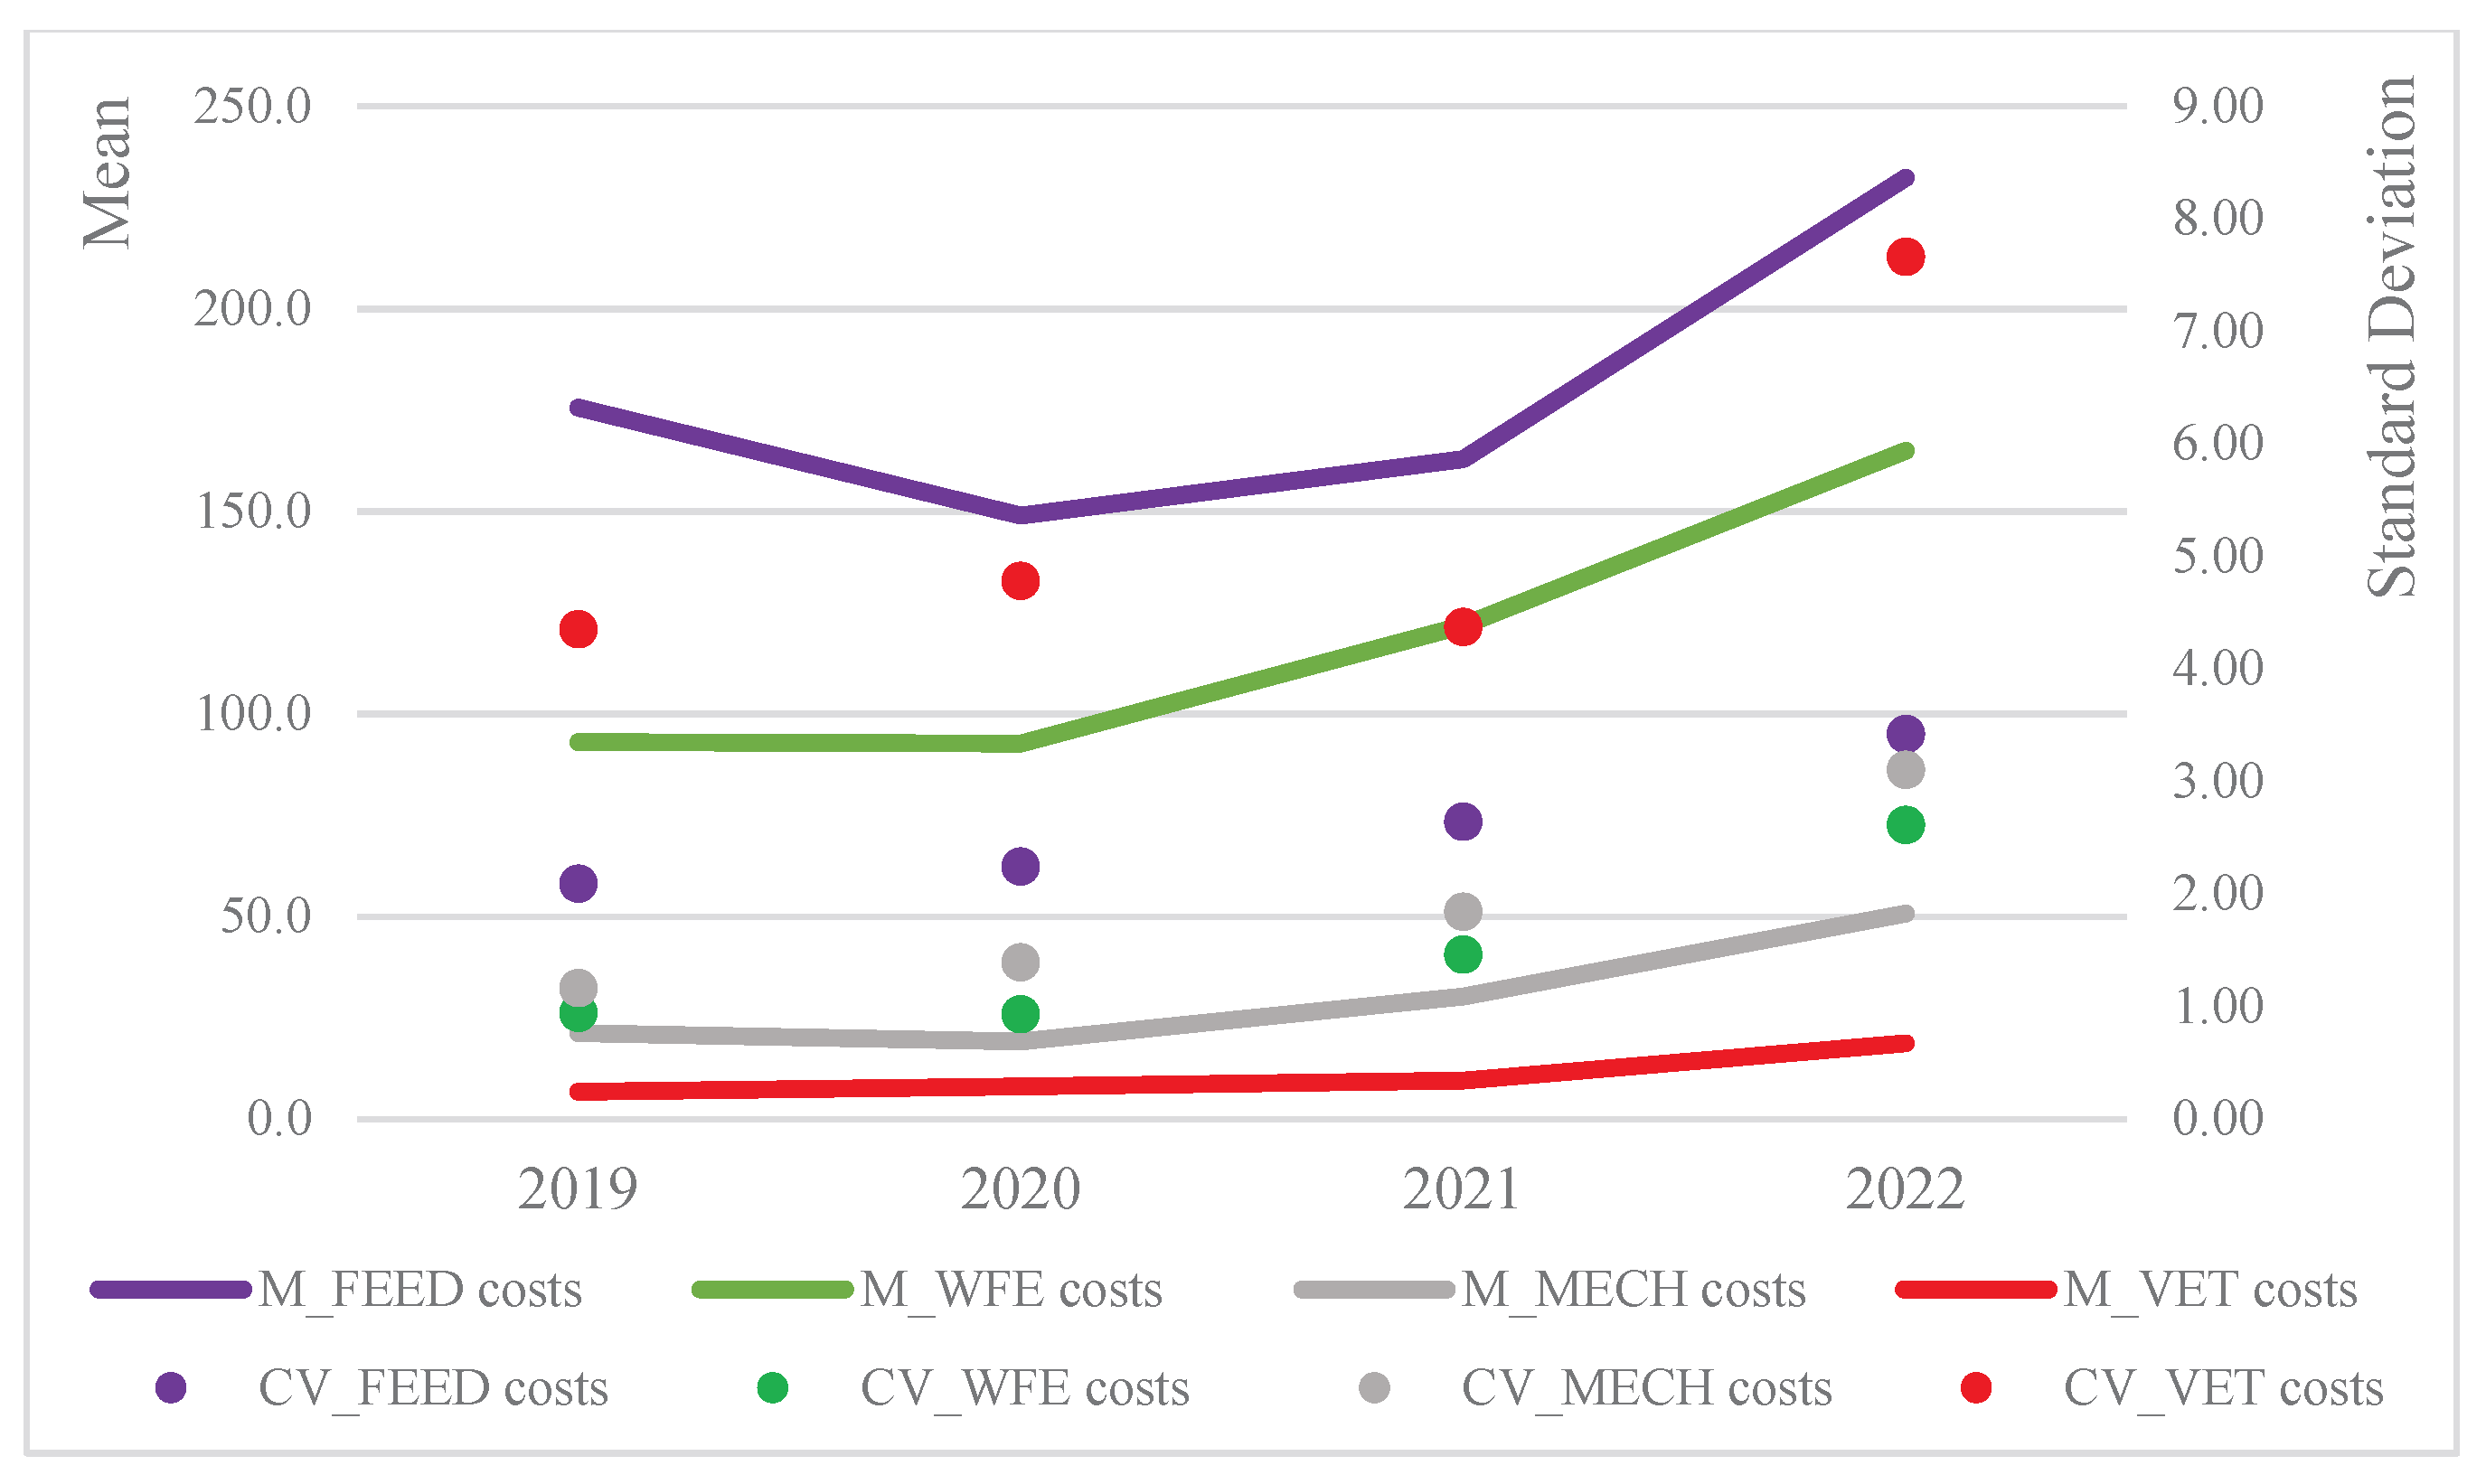
Table 1.
Descriptive statistics of the main structural variables and financial items by year.
| Item | 2019 | 2020 | 2021 | 2022 | ||||
| Mean | Coeff. Variation | Mean | Coeff. Variation | Mean | Coeff. Variation | Mean | Coeff. Variation | |
| LivU | 495.1 | 1.9 | 462.6 | 1.9 | 507.8 | 1.9 | 452.4 | 1.9 |
| LabU | 2.6 | 1.3 | 2.5 | 1.2 | 2.5 | 1.1 | 2.5 | 1.1 |
| FLU | 1.7 | 0.5 | 1.7 | 0.5 | 1.7 | 0.5 | 1.7 | 0.5 |
| UAA | 12.4 | 2.0 | 12.6 | 2.0 | 12.7 | 2.0 | 13.2 | 2.1 |
| VoP (€) | 149535.8 | 3.1 | 148266.8 | 3.3 | 147995.2 | 3.4 | 175240.1 | 3.7 |
| CurC (€) | 138555.6 | 2.2 | 132070.0 | 2.2 | 139736.4 | 2.2 | 174113.7 | 2.8 |
| ESC (€) | 9158.6 | 3.2 | 10252.4 | 3.0 | 9129.7 | 3.4 | 7147.8 | 1.9 |
| CapC (€) | 15291.9 | 1.3 | 14107.4 | 1.1 | 12850.8 | 1.1 | 12255.0 | 1.2 |
Table 2.
Estimation results.
| Item | Estimate | Std. Error | z value | Pr(>|z|) | Signif. |
| (Intercept) | 5.128 | 0.201 | 25.478 | < 0.001 | *** |
| log(CurC) | 0.643 | 0.018 | 35.618 | < 0.001 | *** |
| log(ESC) | -0.010 | 0.008 | -1.162 | 0.245 | |
| log(CapC) | 0.021 | 0.007 | 3.064 | 0.002 | ** |
| Z_(Intercept) | 1.401 | 0.214 | 6.543 | 0.000 | *** |
| Z_LabU | -0.388 | 0.150 | -2.584 | 0.010 | ** |
| Z_LivU | -0.001 | 0.001 | -2.824 | 0.005 | ** |
| Z_UAA | -0.049 | 0.029 | -1.709 | 0.087 | . |
| Z_TEO_PMeat | -0.295 | 0.117 | -2.510 | 0.012 | * |
| sigmaSq | 0.219 | 0.037 | 5.930 | 0.000 | *** |
| alpha | 0.564 | 0.086 | 6.572 | 0.000 | *** |
Scheme 0. ‘**’ 0.01 ‘*’ 0.05 ‘.’ 0.1 ‘ ’ 1. Log likelihood value: -186.9423. Mean efficiency in each year.
Disclaimer/Publisher’s Note: The statements, opinions and data contained in all publications are solely those of the individual author(s) and contributor(s) and not of MDPI and/or the editor(s). MDPI and/or the editor(s) disclaim responsibility for any injury to people or property resulting from any ideas, methods, instructions or products referred to in the content. |
© 2025 by the authors. Licensee MDPI, Basel, Switzerland. This article is an open access article distributed under the terms and conditions of the Creative Commons Attribution (CC BY) license (http://creativecommons.org/licenses/by/4.0/).
Copyright: This open access article is published under a Creative Commons CC BY 4.0 license, which permit the free download, distribution, and reuse, provided that the author and preprint are cited in any reuse.


