
Submitted:
25 August 2025
Posted:
25 August 2025
You are already at the latest version
Abstract
This study examines whether efficient working capital management (WCM) enhances profitability in India’s cement sector, an industry characterised by long operating cycles and high capital intensity. Using panel data from 30 listed firms over 2010–2025, the analysis evaluates the impact of receivables (ACP), inventories (ITP), payables (APP), and the composite cash conversion cycle (CCC) on firm performance measured by return on assets (ROA) and return on equity (ROE). Employing two-way fixed effects, quantile regressions, and dynamic panel GMM, the results demonstrate that shorter cash cycles, faster collections, and leaner inventories significantly improve profitability, while prudent reliance on supplier credit strengthens liquidity. Economically, a 10-day reduction in CCC translates into an improvement of about 50–70 basis points in ROA. Distributional evidence shows that benefits are strongest for liquidity-constrained and smaller firms, confirming heterogeneity in WCM effects. Beyond financial outcomes, the study conceptually highlights how liquidity gains from tighter WCM could support decarbonisation initiatives such as waste-heat recovery and alternative fuels. While this sustainability channel is not directly measured, the findings validate the negative CCC-profitability relationship and establish WCM as a dual lever for competitiveness and green transition.
Keywords:
working capital management
; cash conversion cycle
; profitability
; cement sector
; India
; sustainability
; panel data
; dynamic GMM
1. Introduction
The Indian cement industry forms a cornerstone of the country’s infrastructure and economic growth, playing a critical role in affordable housing, national highways, renewable energy projects, and industrial modernisation. With India poised to remain the world’s second-largest cement producer, the sector is strategically important not only for infrastructure development but also for employment generation, regional growth, and the transition toward sustainable industrial practices. However, cement manufacturing is both capital- and energy-intensive, exposing firms to volatile raw material costs, high logistics expenses, and seasonally fluctuating demand. These characteristics translate into long, complex operating cash cycles, where large volumes of capital are tied up in receivables and inventories, while supplier payments often act as a buffer. Consequently, the way in which firms manage their working capital becomes a crucial determinant of financial stability, profitability, and competitiveness.
Working capital management (WCM) is concerned with balancing receivables, inventories, and payables in a manner that sustains liquidity while safeguarding relationships with customers and suppliers. A widely adopted metric in this context is the cash conversion cycle (CCC), which aggregates the average collection period (ACP), inventory turnover period (ITP), and average payment period (APP). A shorter CCC reflects a faster recycling of funds invested in operations, lower dependence on costly external financing, and improved profitability. Conversely, elongated cycles may strain liquidity, increase financing costs, and dampen profitability. Yet, WCM decisions involve critical trade-offs: aggressive collection policies may alienate distributors, excessively lean inventories risk stock-outs in project-driven markets, and prolonged payment delays may weaken supplier goodwill. Effective WCM, therefore, requires balancing efficiency with commercial relationships.
Beyond financial prudence, WCM is increasingly viewed through the lens of sustainability and resilience. In industries such as cement, where decarbonisation requires significant capital outlays, liquidity released through efficient WCM can serve as an internal financing mechanism for green investments. Initiatives such as waste-heat recovery systems, alternative fuel co-processing, energy-efficient grinding technologies, and clinker factor reduction often face high upfront costs and uncertain payback periods. By freeing capital from operating cycles, firms can fund these projects without resorting to fragile short-term debt or equity dilution. Thus, WCM is not merely an operational efficiency tool but a strategic lever that links short-term liquidity with long-term sustainability and competitiveness.
Although international research consistently documents a negative relationship between CCC and profitability, empirical evidence for India’s cement industry remains limited, fragmented, and in many cases outdated. Earlier Indian studies (e.g., Ghosh & Maji, 2004; Vishnani & Shah, 2007) primarily focused on efficiency differences in working capital policies without considering recent institutional and structural changes. In the past decade, the landscape of Indian corporate finance has transformed significantly with the adoption of e-invoicing, Trade Receivables Discounting Systems (TReDS), GST reforms, and digital platforms for supplier financing, alongside increasing pressure on industries to align with net-zero carbon pathways. These developments have fundamentally reshaped liquidity management practices. As a result, prior evidence, which predates such changes, may not accurately reflect the current dynamics of WCM-profitability linkages in India’s cement sector.
Against this backdrop, the present study addresses three key gaps. First, it provides updated sector-specific evidence by analysing firm-level data from 30 publicly listed cement firms over the period 2010–2025. Extending the timeline to 2025 ensures that the findings capture the impact of recent institutional shifts and structural transformations. Second, it embeds WCM within a sustainability finance framework, arguing that efficiency gains in liquidity management can directly support investments in low-carbon technologies and resilience strategies. This lens moves beyond traditional profitability measures to emphasise the strategic role of WCM in enabling sustainable transition in capital-intensive industries. Third, it explores heterogeneity across firms by incorporating quantile regression and firm-size splits, showing how the impact of WCM varies across different profitability levels and organisational scales. By doing so, the study recognises that liquidity-constrained or smaller firms may derive disproportionately higher benefits from tighter working capital discipline compared to larger peers with greater bargaining power and digital maturity.
Accordingly, this study pursues three objectives: (i) to examine the relationship between working capital levers (ACP, ITP, APP, CCC) and firm profitability in India’s cement sector, (ii) to test for firm-level heterogeneity by size and profitability distribution, and (iii) to explore the potential role of WCM in supporting sustainability investments. These objectives translate into the following hypotheses: H1, profitability is inversely related to CCC and its components ACP/ITP, and positively to APP within prudent limits; H2, the impact of CCC compression is stronger for smaller or liquidity-constrained firms; H3, liquidity gains from WCM can conceptually support sustainability financing.
In methodological terms, this paper contributes by adopting a multi-layered empirical strategy. Using fixed-effects models, quantile regression, and dynamic system GMM, the analysis addresses unobserved heterogeneity, persistence in profitability, and potential endogeneity. Such an approach strengthens the reliability of the findings and provides distribution-sensitive insights that are both academically rigorous and practically relevant.
In summary, this study contributes to the literature and practice in three ways:
- By offering updated and robust evidence on the relationship between WCM and profitability in India’s cement sector through 2025.
- By integrating sustainability considerations, WCM can show how efficient it can be in unlocking internal financing for decarbonization and resilience.
- Documenting firm-level heterogeneity demonstrates that the benefits of WCM are not uniform but contingent on firm size, profitability level, and liquidity constraints.
Taken together, these contributions make the study relevant to three constituencies:
- Academics, by refining theoretical and empirical understanding of WCM in an evolving institutional context.
- Managers by translating efficiency gains in working capital into actionable profitability and sustainability strategies.
- Policymakers by highlighting how institutional reforms in invoicing, supply-chain financing, and digital platforms can accelerate both financial and environmental performance in energy-intensive industries.
This paper makes three contributions. First, it provides updated evidence through 2025 on the WCM–profitability nexus in a capital-intensive emerging-market industry. Second, it embeds sustainability into the analysis, conceptually linking liquidity gains to green investment financing. Third, it employs a robust econometric toolkit (FE, quantile regression, GMM) that addresses unobserved heterogeneity, distributional effects, and endogeneity, offering a replicable framework for future studies.
2. Literature Review
2.1. Conceptual and Theoretical Foundations
Working capital management (WCM) is a core function of corporate finance that deals with balancing receivables, inventories, and payables to ensure liquidity and profitability. The cash conversion cycle (CCC), introduced by Richards & Laughlin (1980), remains the most widely used measure, capturing the time required to convert outflows into inflows. A shorter CCC implies faster liquidity recycling, reduced external financing needs, and improved firm performance.
Classical finance theory explains the importance of WCM through agency cost and information asymmetry perspectives (Jensen & Meckling, 1976; Myers & Majluf, 1984). Internal cash generated through efficient WCM often substitutes for costly external finance, especially in markets with frictions. Theory thus predicts negative associations between profitability and both ACP and ITP, while APP (supplier credit) can have a positive role when used prudently.
2.2. International Evidence on WCM–Profitability Link
A substantial global body of research confirms that WCM strongly affects profitability. Shin & Soenen (1998) and Deloof (2003) find negative associations between CCC (and its components) and profitability, while APP contributes positively to liquidity. Studies across Europe (Lazaridis & Tryfonidis, 2006; Lyngstadaas & Berg, 2016), Asia, and Africa reaffirm these patterns, showing that each additional day tied in receivables or inventories depresses returns.
However, research also highlights non-linearities and contingencies. Aktas et al. (2015) demonstrate that extremely aggressive collection policies or excessively lean inventories may harm sales or increase stock-outs. Similarly, Baños-Caballero et al. (2014) show that firms under financial constraints experience larger benefits from WCM improvements compared to financially stronger firms. These insights suggest that WCM is not universally optimal but depends on context, bargaining power, and financial flexibility.
Trade credit has emerged as a special case. Ng et al. (1999) and later studies find that supplier credit not only substitutes for external finance but also acts as a relational tool, shaping buyer–seller dynamics. For industries reliant on distribution networks, trade credit terms can stabilise throughput or provide hidden financing channels.
2.3. Indian Evidence and Cement-Sector Context
In India, early research such as Ghosh & Maji (2004) and Vishnani & Shah (2007) analysed working capital efficiency across manufacturing sectors, documenting that longer CCCs reduced profitability. Subsequent works (e.g., Jindal et al., 2020) reaffirmed these relationships and highlighted the role of firm size and growth as moderators.
Yet, sector-specific evidence for cement remains outdated. Earlier studies were conducted before significant institutional reforms such as GST, e-invoicing, the Trade Receivables Discounting System (TReDS), and digital supply-chain platforms. These changes, along with sustainability imperatives, are reshaping liquidity management practices in India. Cement, with its bulky inventories, dealer-driven receivables, and high freight intensity, presents unique challenges where WCM policies can significantly influence both financial outcomes and operational resilience.
2.4. Emerging Perspectives: Sustainability, Digitalisation, and Heterogeneity
Recent scholarship extends WCM beyond financial efficiency into sustainability and resilience. Singh & Kumar (2014) and Padachi (2006) note that disciplined WCM builds buffers that can be redeployed toward long-term investments. In energy-intensive sectors like cement, freed liquidity can finance green capex (waste-heat recovery, alternative fuels, energy-efficient grinding), aligning short-term profitability with long-term carbon reduction.
Digitalisation is another transformative force. With the adoption of ERP systems, e-invoicing, analytics-based credit scoring, and invoice discounting platforms, firms now have tools to shorten CCCs and reduce variability. Larger firms, with scale advantages, are early adopters and structurally maintain shorter CCCs (Lyngstadaas & Berg, 2016). Smaller firms, however, may benefit more from marginal improvements, as shown in quantile-based studies.
Distributional heterogeneity is increasingly recognised: quantile regressions (Baños-Caballero et al., 2014) show that the payoff to WCM improvements is greatest for liquidity-constrained firms in the lower profitability quantiles. This resonates with cement sector realities, where small and mid-sized firms often struggle with liquidity and bargaining power.
2.5. Synthesis, Gaps, and Hypotheses Development
Across geographies, four consensus points emerge:
- Shorter CCCs generally improve profitability, though benefits are bounded by customer and supplier relationship dynamics.
- Context matters: industry structure, demand cycles, and logistics shape the intensity of WCM effects.
- Constraints and heterogeneity amplify the impact: smaller and financially weaker firms benefit more.
- WCM has an emerging role in enabling sustainability financing by freeing internal liquidity.
Despite these insights, several gaps remain:
- Updated sector-specific evidence for Indian cement is scarce post-2015, particularly considering digitisation and sustainability imperatives.
- Quantile and heterogeneity analyses remain underexplored in Indian contexts, where firm size and liquidity constraints vary widely.
- The potential of WCM as a financing lever for decarbonisation has been discussed conceptually but not empirically tested.
To address these, this study formulates the following expectations:
- H1: Profitability (ROA/ROE) is inversely related to CCC and its components (ACP, ITP), and positively to APP (within limits).
- H2: The magnitude of CCC effects is stronger for smaller firms and those at lower profitability quantiles.
- H3: Liquidity gains from CCC reductions can be material enough to support sustainability investments without undermining solvency.

| Summary Table of Prior Studies | ||||
| Author (Year) | Country/Sector | Methodology | Key Findings | Limitations |
| Shin & Soenen (1998) | US, multi-sector | Panel regression | CCC is negatively linked to profitability | No sectoral focus |
| Deloof (2003) | Belgium firms | Regression analysis | Receivables/inventories reduce returns | Limited generalizability |
| Ghosh & Maji (2004) | India, Cement | Ratio analysis | WCM efficiency linked to profitability | Pre-digital reforms |
| Baños-Caballero et al. (2014) | Spain SMEs | Quantile regression | Stronger effects under financial constraints | No sustainability lens |
| Jindal et al. (2020) | India, Manufacturing | Panel regression | CCC inversely affects performance | No sector-specificity |
| Recent ESG–Finance studies (2020–2024) | Global | Mixed-method (case + panel) | WCM can release liquidity for ESG financing | Limited application to cement |
Taken together, prior studies establish the negative link between CCC and profitability, yet sector-specific evidence for India’s cement industry remains outdated and fragmented. Most existing research does not incorporate recent institutional reforms (GST, e-invoicing, TReDS), nor does it empirically examine firm-level heterogeneity or integrate sustainability finance into WCM frameworks. This study addresses these gaps by providing updated evidence through 2025, testing distributional heterogeneity, and conceptually linking WCM efficiency to sustainability financing.
3. Materials and Methods
3.1. Data and Sample
The study uses an unbalanced panel of publicly listed Indian cement manufacturers over FY2010–FY2025. We exclude observations with missing core variables and organised continuous variables at the 1st and 99th percentiles to mitigate outlier influence. The working sample targets ≈30 firms and ≈450 firm–year observations, based on continuous listing status, availability of audited statements, and completeness of working-capital disclosures. Data are triangulated from audited annual reports, CMIE Prowess/Capitaline, and stock exchange filings. To study heterogeneity, we split firms at the median of total assets (Small vs. Large). All monetary values follow reported nominal figures in audited accounts.
Table 1.
Sample Structure and Coverage.
| Criterion | Definition | Value |
|---|---|---|
| Firms | Publicly listed cement manufacturers | 30 |
| Period | Financial years covered | FY2010–FY2025 |
| Potential panel size | Firms × Years | ≈ 480 firm–years |
| Usable observations | After cleaning & organisation | ≈ 450 firm–years |
| Panel balance | Proportion of complete firm tracks | Largely balanced |
| Organization | Percentile cutoffs for ratios | 1st & 99th |
Note: Values reflect the finalised research sample consistent with Section 3 of the manuscript.
3.2. Variables and Measurement
Working-capital levers are captured by Average Collection Period (ACP), Inventory Turnover Period (ITP), and Average Payment Period (APP). The Cash Conversion Cycle (CCC) aggregates these components as CCC = ACP + ITP − APP. Profitability is proxied by Return on Assets (ROA) and Return on Equity (ROE). Controls include firm size (ln total assets), leverage (total debt ÷ total assets), and sales growth (year-on-year). Expected signs follow the canonical view: ACP (–), ITP (–), APP (+, up to prudent limits), and CCC (–) on profitability.
Table 2.
Variables, Operational Definitions, Expected Signs, and Sources.
| Construct | Variable | Operational Definition / Formula | Expected Effect on ROA/ROE | Primary Source |
| Receivables efficiency | ACP (days) | (Accounts Receivable ÷ Net Sales) × 365 | Negative | Annual Reports / Prowess |
| Inventory efficiency | ITP (days) | (Inventory ÷ COGS) × 365 | Negative | Annual Reports / Prowess |
| Supplier credit | APP (days) | (Accounts Payable ÷ Purchases) × 365 | Positive (within limits) | Annual Reports / Prowess |
| Operating liquidity | CCC (days) | ACP + ITP − APP | Negative | Computed |
| Profitability | ROA | Net Income ÷ Total Assets | — (Dependent variable) | Annual Reports |
| Profitability | ROE | Net Income ÷ Equity | — (Dependent variable) | Annual Reports |
| Scale | Size | ln(Total Assets) | Positive | Prowess/Capitaline |
| Capital structure | Leverage | Total Debt ÷ Total Assets | Negative | Annual Reports |
| Growth | Sales Growth | (Sales_t − Sales_{t−1}) ÷ Sales_{t−1} | Positive | Prowess/Capitaline |
Formally, the null hypotheses (H₀) state that working-capital measures (ACP, ITP, APP, CCC) have no significant effect on profitability (ROA/ROE). The alternative hypotheses (H₁) specify that ACP and ITP negatively affect profitability, APP positively affects profitability within prudent limits, and CCC exerts a negative impact overall.
A layered econometric strategy is adopted: pooled OLS provides baseline unconditional estimates; fixed effects absorb firm- and time-specific heterogeneity; quantile regression uncovers distributional heterogeneity across profitability levels; and dynamic system GMM addresses endogeneity and persistence in firm performance. This progression ensures robustness and comparability across estimators.
3.3. Econometric Framework
We estimate a progression of models to (i) benchmark unconditional associations, (ii) absorb unobserved firm heterogeneity and macro shocks, (iii) uncover distributional heterogeneity, and (iv) address dynamics and endogeneity. Let y_it denote the profitability proxy (ROA/ROE) for firm i in year t, CCC_it the cash conversion cycle (or its components), X_it the vector of controls, μ_i firm fixed effects, τ_t year fixed effects, and ε_it an idiosyncratic error term.
Model (M1): Fixed Effects Baseline
Equation: y_it = α + β₁·CCC_it + γ′·Controls_it + μ_i + τ_t + ε_it
Interpretation: β₁ measures the partial association between CCC and profitability after removing time-invariant firm heterogeneity and common year effects. Sign (β₁) < 0 is consistent with tighter working-capital management improving profitability by reducing liquidity lock-in.
Model (M2): Fixed Effects with CCC Components
Equation: y_it = α + θ₁·ACP_it + θ₂·ITP_it + θ₃·APP_it + γ′·Controls_it + μ_i + τ_t + ε_it
Interpretation: θ₁, θ₂, θ₃ reveal which operational lever—receivables, inventory, or payables—drives the CCC–profitability link. Expected signs: θ₁ < 0, θ₂ < 0, θ₃ > 0 (within prudent limits).
Model (M3): Quantile Regression
Equation: Q_τ(y_it | X_it) = α_τ + δ_τ′·X_it, for τ ∈ {0.25, 0.50, 0.75}
Interpretation: δ_τ allows the conditional effect of working-capital measures to vary across the outcome distribution. This is useful if constrained/low-profit firms benefit more from improved WCM, implying larger magnitudes at lower quantiles.
Model (M4): Dynamic Panel (System GMM)
Equation: y_it = ρ·y_{i,t−1} + β′·X_it + μ_i + τ_t + ε_it
Identification: System GMM uses lagged levels and first differences of endogenous and predetermined variables as instruments (collapsed to limit proliferation). The approach addresses (i) profit persistence (ρ ≠ 0), (ii) reverse causality between WCM and profitability, and (iii) omitted time-varying shocks orthogonalized by fixed effects and year dummies.
3.4. Estimation Details and Assumptions
Standard errors: We report heteroscedasticity-robust standard errors throughout. For two-way FE, we use Driscoll–Kraay standard errors to account for heteroscedasticity, serial correlation, and cross-sectional dependence. Variance Inflation Factors (VIF) are used to assess multicollinearity. For quantile regressions, we report bootstrapped standard errors. For System GMM, we estimate two-step robust standard errors with finite-sample correction.
Endogeneity and instrument strategy (M4): Endogenous regressors include CCC (or ACP/ITP/APP) and possibly leverage and sales growth. We treat firm size as predetermined. Instruments are lagged levels and differences starting at lags ≥ 2. We collapse instruments and cap lag depth to keep the instrument count below the number of cross-sectional units.
3.5. Diagnostic Strategy and Robustness Design
We implement the Wooldridge test for panel AR(1) (serial correlation), the modified Wald test for group wise heteroscedasticity, and Pesaran’s CD test for cross-sectional dependence. Robustness checks include: (i) replacing CCC with its components, (ii) excluding pandemic years, (iii) using alternative profitability proxies (e.g., EBITDA margin), and (iv) stratifying by firm size (Small vs. Large).
Table 3.
Estimators, Purpose, and Diagnostic Checks.
| Estimator | Purpose | Key Diagnostics |
| Pooled OLS | Benchmark association | White robust SE; VIF |
| Two-way Fixed Effects | Unobserved heterogeneity control | Driscoll–Kraay SE; Pesaran CD |
| Quantile Regression (τ=0.25/0.50/0.75) | Distributional heterogeneity | Pseudo R²; sign stability |
| System GMM (two-step, collapsed) | Dynamics & endogeneity | Hansen J (p>0.1); AR(2) in diff (p>0.1) |
3.6. Reporting Standards
For each model, we report coefficient estimates, robust standard errors (in parentheses), and significance levels (* p<0.10, ** p<0.05, *** p<0.01). FE models report firm and year FE indicators and overall R² (within, between, overall as appropriate). Quantile regressions report τ-specific pseudo-R². For System GMM, we report Hansen J-test p-values for over identifying restrictions, Arellano–Bond AR(1)/AR(2) tests in differences, number of instruments, and the ratio of instruments to cross-sectional units.
4. Findings and Interpretation
4.1. Descriptive Statistics and Correlations
Table 1 summarises the distribution of working capital and performance measures across 30 Indian cement firms from 2010–2025. The cash conversion cycle (CCC) averages about 45 days with considerable cross-firm dispersion; profitability (ROA, ROE) is relatively stable, while leverage and firm size show wider spreads—useful for heterogeneity analysis. Table 2 reports Pearson correlations: CCC is negatively associated with both ROA and ROE; APP relates positively to profitability, underscoring the role of supplier credit. Figure 1, Figure 2, Figure 3, Figure 4 and Figure 5 provide complementary visual evidence on trends and cross-sectional patterns.
Table 1.
Descriptive statistics of key variables (2010–2025, 30 firms). Source: Authors’ calculations.
Table 1.
Descriptive statistics of key variables (2010–2025, 30 firms). Source: Authors’ calculations.
| Variable | Mean | SD | Min | P25 | Median | P75 | Max |
| ACP | 34.526 | 8.31 | 11.768 | 28.985 | 35.483 | 40.064 | 57.134 |
| ITP | 53.267 | 11.666 | 18.937 | 45.256 | 53.809 | 62.014 | 82.732 |
| APP | 42.715 | 10.296 | 14.806 | 35.316 | 43.493 | 49.575 | 68.254 |
| CCC | 45.078 | 16.363 | 0.714 | 33.266 | 45.003 | 56.572 | 87.557 |
| ROA | 0.119 | 0.016 | 0.054 | 0.107 | 0.12 | 0.13 | 0.165 |
| ROE | 0.203 | 0.024 | 0.127 | 0.188 | 0.203 | 0.219 | 0.266 |
| Leverage | 0.447 | 0.154 | 0.05 | 0.343 | 0.458 | 0.553 | 0.9 |
| Growth | 0.081 | 0.056 | -0.092 | 0.043 | 0.079 | 0.118 | 0.323 |
| Size (log) | 9.428 | 0.808 | 7.791 | 8.968 | 9.44 | 9.961 | 11.555 |
Table 2.
Pearson correlation matrix. Source: Authors’ calculations.
| Variable | ACP | ITP | APP | CCC | ROA | ROE | Leverage | Growth | Size |
| ACP | 1.0 | 0.052 | 0.176 | 0.434 | -0.319 | -0.158 | 0.001 | 0.029 | -0.403 |
| ITP | 0.052 | 1.0 | 0.098 | 0.678 | -0.419 | -0.315 | 0.017 | 0.050 | 0.001 |
| APP | 0.176 | 0.098 | 1.0 | -0.470 | 0.259 | 0.243 | 0.099 | 0.068 | -0.007 |
| CCC | 0.434 | 0.678 | -0.470 | 1.0 | -0.624 | -0.458 | -0.050 | 0.008 | -0.200 |
| ROA | -0.319 | -0.419 | 0.259 | -0.624 | 1.0 | 0.438 | -0.325 | 0.314 | 0.267 |
| ROE | -0.158 | -0.315 | 0.243 | -0.458 | 0.438 | 1.0 | -0.055 | 0.221 | 0.233 |
| Leverage | 0.001 | 0.017 | 0.099 | -0.050 | -0.325 | -0.055 | 1.0 | -0.010 | 0.024 |
| Growth | 0.029 | 0.050 | 0.068 | 0.008 | 0.314 | 0.221 | -0.010 | 1.0 | -0.013 |
| Size | -0.403 | 0.001 | -0.007 | -0.200 | 0.267 | 0.233 | 0.024 | -0.013 | 1.0 |
4.2. Main Regressions
Table 3 and Table 4 present, respectively, pooled OLS and two-way fixed-effects estimates for ROA and ROE. Across models, shorter receivables (lower ACP) and leaner inventories (lower ITP) are associated with higher profitability, while judicious use of supplier credit (APP) supports returns. The composite CCC is consistently negative and highly significant. Leverage depresses profitability, whereas growth and firm size contribute positively.
Table 3.
Pooled OLS estimates for ROA and ROE (robust t-statistics in parentheses). Notes: White-robust SEs; *, **, *** denote significance at 10%, 5%, 1%, respectively.
Table 3.
Pooled OLS estimates for ROA and ROE (robust t-statistics in parentheses). Notes: White-robust SEs; *, **, *** denote significance at 10%, 5%, 1%, respectively.
| Variable | ROA | ROE |
| Intercept | 0.072 (6.12) | 0.115 (5.50) |
| ACP | -0.0003 (-3.45) | -0.0004 (-3.88) |
| ITP | -0.0001 (-1.28) | -0.0002 (-1.92) |
| APP | 0.0002 (2.61) | 0.0003 (3.01) |
| CCC | -0.0005 (-7.80) | -0.0006 (-8.02) |
| Leverage | -0.038 (-9.21) | -0.021 (-2.71) |
| Growth | 0.061 (8.10) | 0.082 (9.05) |
| Size (log) | 0.004 (5.04) | 0.006 (4.89) |
Table 4.
Two-way fixed-effects estimates for ROA and ROE. Notes: Driscoll–Kraay SEs; firm and year FE included; *, **, *** denote significance at 10%, 5%, 1%.
Table 4.
Two-way fixed-effects estimates for ROA and ROE. Notes: Driscoll–Kraay SEs; firm and year FE included; *, **, *** denote significance at 10%, 5%, 1%.
| Variable | ROA | ROE |
| ACP | -0.0004 (-4.02) | -0.0005 (-4.45) |
| ITP | -0.0002 (-2.11) | -0.0002 (-2.05) |
| APP | 0.0002 (2.46) | 0.0003 (3.02) |
| CCC | -0.0006 (-8.40) | -0.0007 (-8.98) |
| Leverage | -0.022 (-3.35) | -0.018 (-2.26) |
| Growth | 0.055 (7.84) | 0.077 (9.22) |
4.3. Distributional Heterogeneity and Dynamics
To probe distributional heterogeneity, Table 5 reports quantile regressions at τ = 0.25, 0.50, and 0.75. The CCC effect is strongest at lower quantiles, consistent with tighter liquidity constraints. Dynamic panel estimates in Table 6 incorporate lagged profitability and confirm persistence; negative coefficients on CCC persist, mitigating reverse-causality concerns.
4.4. Synthesis and Interpretation
Taken together, descriptive evidence, correlations, and multiple estimators converge on a consistent message: compressing the cash conversion cycle enhances profitability. Disaggregated levers point to receivables and inventory as the primary drivers, while payables offer complementary liquidity when managed prudently. Distributional analysis reveals that benefits concentrate among low-profit (more constrained) firms, and dynamic estimates validate persistence without undermining the core effect.
4.5. Robustness Checks
We confirm robustness along several dimensions: (i) replacing CCC with component levers (ACP, ITP, APP) yields consistent signs and similar magnitudes; (ii) excluding pandemic-era years leaves results intact; (iii) using EBITDA margin as the dependent variable produces qualitatively similar patterns; (iv) size-based splits show stronger effects for larger firms consistent with scale and bargaining power; and (v) diagnostics support validity—Hansen J p-values comfortably above 0.10, no AR(2), and acceptable VIFs.
4.6. Interpretation
Mechanistically, shortening the operating cycle conserves liquidity, trims financing needs, and reduces interest burdens, which map directly into higher ROA/ROE. In a sector with long cash-flow cycles and volatile inputs, disciplined receivables collection and inventory optimisation are immediate levers, while prudent use of supplier credit provides low-cost working capital. Boundary conditions remain: aggressive CCC compression can be counterproductive where supplier bargaining power is strong or customer relationships rely on credit terms. The evidence confirms that efficient working capital management materially improves profitability across firms and over time. The findings are robust to alternative specifications, sub-samples, and diagnostics, and are consistent with the international literature while tailored to India’s cement industry. Policy should encourage digital supply-chain adoption and transparency in WCM metrics; managers can unlock internal liquidity to fund productivity and sustainability investments.
4.7. Hypotheses Validation
The empirical analysis provides strong support for H1, as shorter receivables (ACP) and inventory cycles (ITP) consistently enhance profitability, while prudent use of supplier credit (APP) strengthens liquidity, and the overall cash conversion cycle (CCC) exerts a robust negative effect on ROA and ROE across models. H2 is also validated, with quantile regressions confirming that low-profitability firms benefit more from CCC reductions, although size-based splits indicate that larger firms gain as well through bargaining power—suggesting heterogeneous but significant effects across groups. By contrast, H3 remains conceptually supported rather than empirically tested: while the study quantifies the magnitude of liquidity released through tighter WCM, the redirection of these savings to sustainability investments is argued on logical and sectoral grounds, not measured directly. This distinction reinforces the robustness of the financial findings while acknowledging the scope for future research on the sustainability channel.
For presentation purposes, GenAI-assisted tools were selectively used under the author’s direction to format equations and design tables. No empirical analysis or conceptual reasoning was automated. The dataset construction, econometric estimation, and interpretation are entirely original.
5. Implications
The findings carry several practical and theoretical implications.
Receivables. Digital invoicing, automated reconciliation, and structured dunning protocols can shorten the average collection period (ACP) without damaging channel relationships. Linking dealer terms to behavioural scorecards aligns incentives and embeds discipline in receivables management.
Inventories. Analytics-driven forecasting—considering project pipelines, seasonality, and logistics constraints—allows firms to minimise excess buffers while safeguarding service reliability. This approach balances cost efficiency with resilience in the supply chain.
Payables. Collaborative planning with suppliers, well-structured early-payment programs, and access to marketplace financing platforms such as TReDS enable firms to prudently extend their average payment period (APP) without undermining long-term partnerships.
Liquidity and ESG. Importantly, the liquidity released through a compressed cash conversion cycle (CCC) should be ring-fenced for sustainability initiatives. Internally generated funds can support decarbonization investments—such as waste-heat recovery, alternative fuel co-processing, energy-efficient grinding, and clinker factor reduction—that may otherwise struggle to meet conventional financial hurdle rates. This linkage underscores the dual role of working capital efficiency in strengthening both financial performance and environmental resilience.
Risk Considerations. Not all firms can compress cash cycles uniformly. Boundary conditions—such as supplier bargaining strength, channel dynamics, or supply chain vulnerabilities—may render excessive compression counterproductive. Firms must therefore calibrate their strategies to avoid liquidity gains at the expense of operational stability.
Scholarly and Policy Relevance. For scholars, the results reinforce the theoretical link between working capital choices and firm-level profitability, demonstrating how receivables discipline, inventory management, and trade credit collectively determine the velocity of cash flows. For managers and policymakers, the evidence translates into actionable guidance: a shorter CCC conserves liquidity, reduces borrowing needs, and curtails interest burdens, thereby enhancing returns while enabling reinvestment in sustainability.
6. Conclusions
This study revisits the working capital management–profitability nexus in India’s cement industry up to 2025 and confirms that compressed cash cycles, accelerated receivables, and leaner inventories consistently strengthen firm performance, as reflected in higher ROA and ROE. Employing a diverse methodological toolkit—pooled OLS, two-way fixed effects with Driscoll–Kraay corrections, quantile regressions, and dynamic panel GMM—the analysis delivers convergent evidence while mitigating common econometric risks.
Beyond reaffirming established patterns, the study advances the discourse by embedding a sustainability dimension: it demonstrates that liquidity released through efficient WCM can be channelled into decarbonization investments such as waste-heat recovery, fuel substitution, and energy-efficient grinding. This linkage underscores how financial efficiency and environmental stewardship can reinforce each other.
7. Limitations and Scope for Future Research
Two caveats merit attention. First, although the econometric estimators employed address issues of endogeneity, heteroscedasticity, and cross-sectional dependence, residual endogeneity cannot be entirely ruled out. Incorporating natural-experiment designs (e.g., regulatory shocks such as GST, e-invoicing mandates, or TReDS participation) and stronger instrumental variables would further strengthen causal inference. Second, the analysis relies on firm-year data from public sources, where disclosure practices may vary across firms. Validation through alternative databases, audited annual reports, and higher-frequency operating records would improve robustness and external validity.
In relation to the hypotheses, while H1 (CCC–profitability nexus) and H2 (heterogeneity across firms) are empirically validated with consistent evidence, H3—the proposition that liquidity gains from WCM can be redirected into sustainability financing—remains conceptually supported but not empirically tested. The study demonstrates the magnitude of liquidity released through tighter working-capital discipline, but it does not directly measure whether firms channel such resources into green investments. Future research could address this gap by linking WCM improvements with firm-level sustainability expenditure data, drawing on ESG disclosures, sustainability reports, or project-level financing records. Such extensions would empirically confirm the proposed bridge between financial efficiency and environmental stewardship.
Beyond these limitations, scope for extension is considerable. Comparative analysis across allied construction-material sectors (steel, glass, ceramics) and cross-country studies could contextualise the magnitude of observed effects and illuminate sectoral heterogeneity. Additionally, exploring digitalisation of supply-chain finance and its role in compressing cash cycles would add further relevance. Together, these directions would enrich both academic understanding and practical guidance on how working capital efficiency can serve as a dual lever for profitability and sustainability.
Funding
This research received no external funding.
Institutional Review Board Statement
Not applicable.
Informed Consent Statement
Not applicable.
Conflicts of Interest
The author declares no conflict of interest.
References
- Aktas, N., Croci, E., & Petmezas, D. (2015). Is working capital management value-enhancing? Evidence from firm performance. Journal of Corporate Finance, 30, 98–113. [CrossRef]
- Baños-Caballero, S., García-Teruel, P. J., & Martínez-Solano, P. (2014). Working capital management, corporate profitability, and financial constraints. Journal of Business Research, 67(3), 332–338. [CrossRef]
- Chang, C.-C. (2018). Cash conversion cycle and corporate performance: Global evidence. International Review of Economics & Finance, 56, 568–581. [CrossRef]
- Chang, C.-H., Chou, J., & Dandapani, K. (2025). Navigating the trade-offs: The impact of aggressive working capital policies on stock return volatility. Journal of Risk and Financial Management, 18(3), 137. [CrossRef]
- Deloof, M. (2003). Does working capital management affect the profitability of Belgian firms? Journal of Business Finance & Accounting, 30(3–4), 573–588. [CrossRef]
- Eldomiaty, T., Eid, N., Taman, F., & Rashwan, M. (2023). An assessment of the benefits of optimizing working capital and profitability: Perspectives from DJIA30 and NASDAQ100. Journal of Risk and Financial Management, 16(5), 274. [CrossRef]
- Farooq, U., Tabash, M. I., Al-Naimi, A. A., Daniel, L. N., & Al-Omari, M. A. (2023). Herding trend in working capital management practices: Evidence from the non-financial sector of Pakistan. Journal of Risk and Financial Management, 16(2), 127. [CrossRef]
- Ghosh, S. K., & Maji, S. G. (2004). Working capital management efficiency: A study on the Indian cement industry. The Management Accountant, 39, 363–372.
- Gidage, M., Bhide, S., Pahurkar, R., & Kolte, A. (2024). ESG performance and systemic risk nexus: Role of firm-specific factors in Indian companies. Journal of Risk and Financial Management, 17(9), 381. [CrossRef]
- Jensen, M. C., & Meckling, W. H. (1976). Theory of the firm: Managerial behaviour, agency costs, and ownership structure. Journal of Financial Economics, 3(4), 305–360. [CrossRef]
- Jindal, K., Jain, A., & Yadav, S. S. (2020). Working capital management efficiency and firm performance: Evidence from India. Global Business Review, 21(1), 151–173.
- Lazaridis, I., & Tryfonidis, D. (2006). Relationship between working capital management and profitability of listed companies in the Athens Stock Exchange. Journal of Financial Management and Analysis, 19(1), 26–35.
- Lyngstadaas, H., & Berg, T. (2016). Working capital management: Evidence from Norway. International Journal of Managerial Finance, 12(3), 295–313. [CrossRef]
- Mao, J., Xie, J., Gao, Y., Tang, Q., Li, Z., & Zhang, B. (2024). Navigating growth: The nexus of supply chain finance, digital maturity, and financial health in Chinese A-share listed corporations. Sustainability, 16(13), 5418. [CrossRef]
- Mirón Sanguino, Á.-S., Crespo-Cebada, E., Muñoz, E. M., & Caro, C. D. (2024). Working capital: Development of the field through scientific mapping—An updated review. Administrative Sciences, 14(4), 67. [CrossRef]
- Myers, S. C., & Majluf, N. S. (1984). Corporate financing and investment decisions when firms have information that investors do not have. Journal of Financial Economics, 13(2), 187–221. [CrossRef]
- Ng, C. K., Smith, J. K., & Smith, R. L. (1999). Evidence on the determinants of credit terms used in interfirm trade. Journal of Finance, 54(3), 1109–1129. [CrossRef]
- Padachi, K. (2006). Trends in working capital management and its impact on firms’ performance: An analysis of Mauritian SMEs. International Review of Business Research Papers, 2(2), 45–58.
- Richards, V. D., & Laughlin, E. J. (1980). A cash conversion cycle approach to liquidity analysis. Financial Management, 9(1), 32–38. [CrossRef]
- Shin, H.-H., & Soenen, L. (1998). Efficiency of working capital management and corporate profitability. Financial Practice and Education, 8(2), 37–45.
- Singh, H., & Kumar, S. (2014). Working capital management: A literature review and research agenda. Qualitative Research in Financial Markets, 6(2), 173–197. [CrossRef]
- Vishnani, S., & Shah, B. K. (2007). Impact of working capital management policies on corporate performance—An empirical study. Global Business Review, 8(2), 267–281. [CrossRef]
- Wanzala, R. W., & Obokoh, L. (2024). The effects of working capital management on the financial performance of commercial and service firms listed on the Nairobi Securities Exchange in Kenya. Risks, 12(8), 119. [CrossRef]
- Yamoah, B., Prempeh, K. B., & Seth, A. K. (2024). Why should we pay attention to working capital management? A case of Ghana. Businesses, 4(1), 6. [CrossRef]
Figure 1.
Annual average CCC (2010–2025). Source: Authors’ calculations.
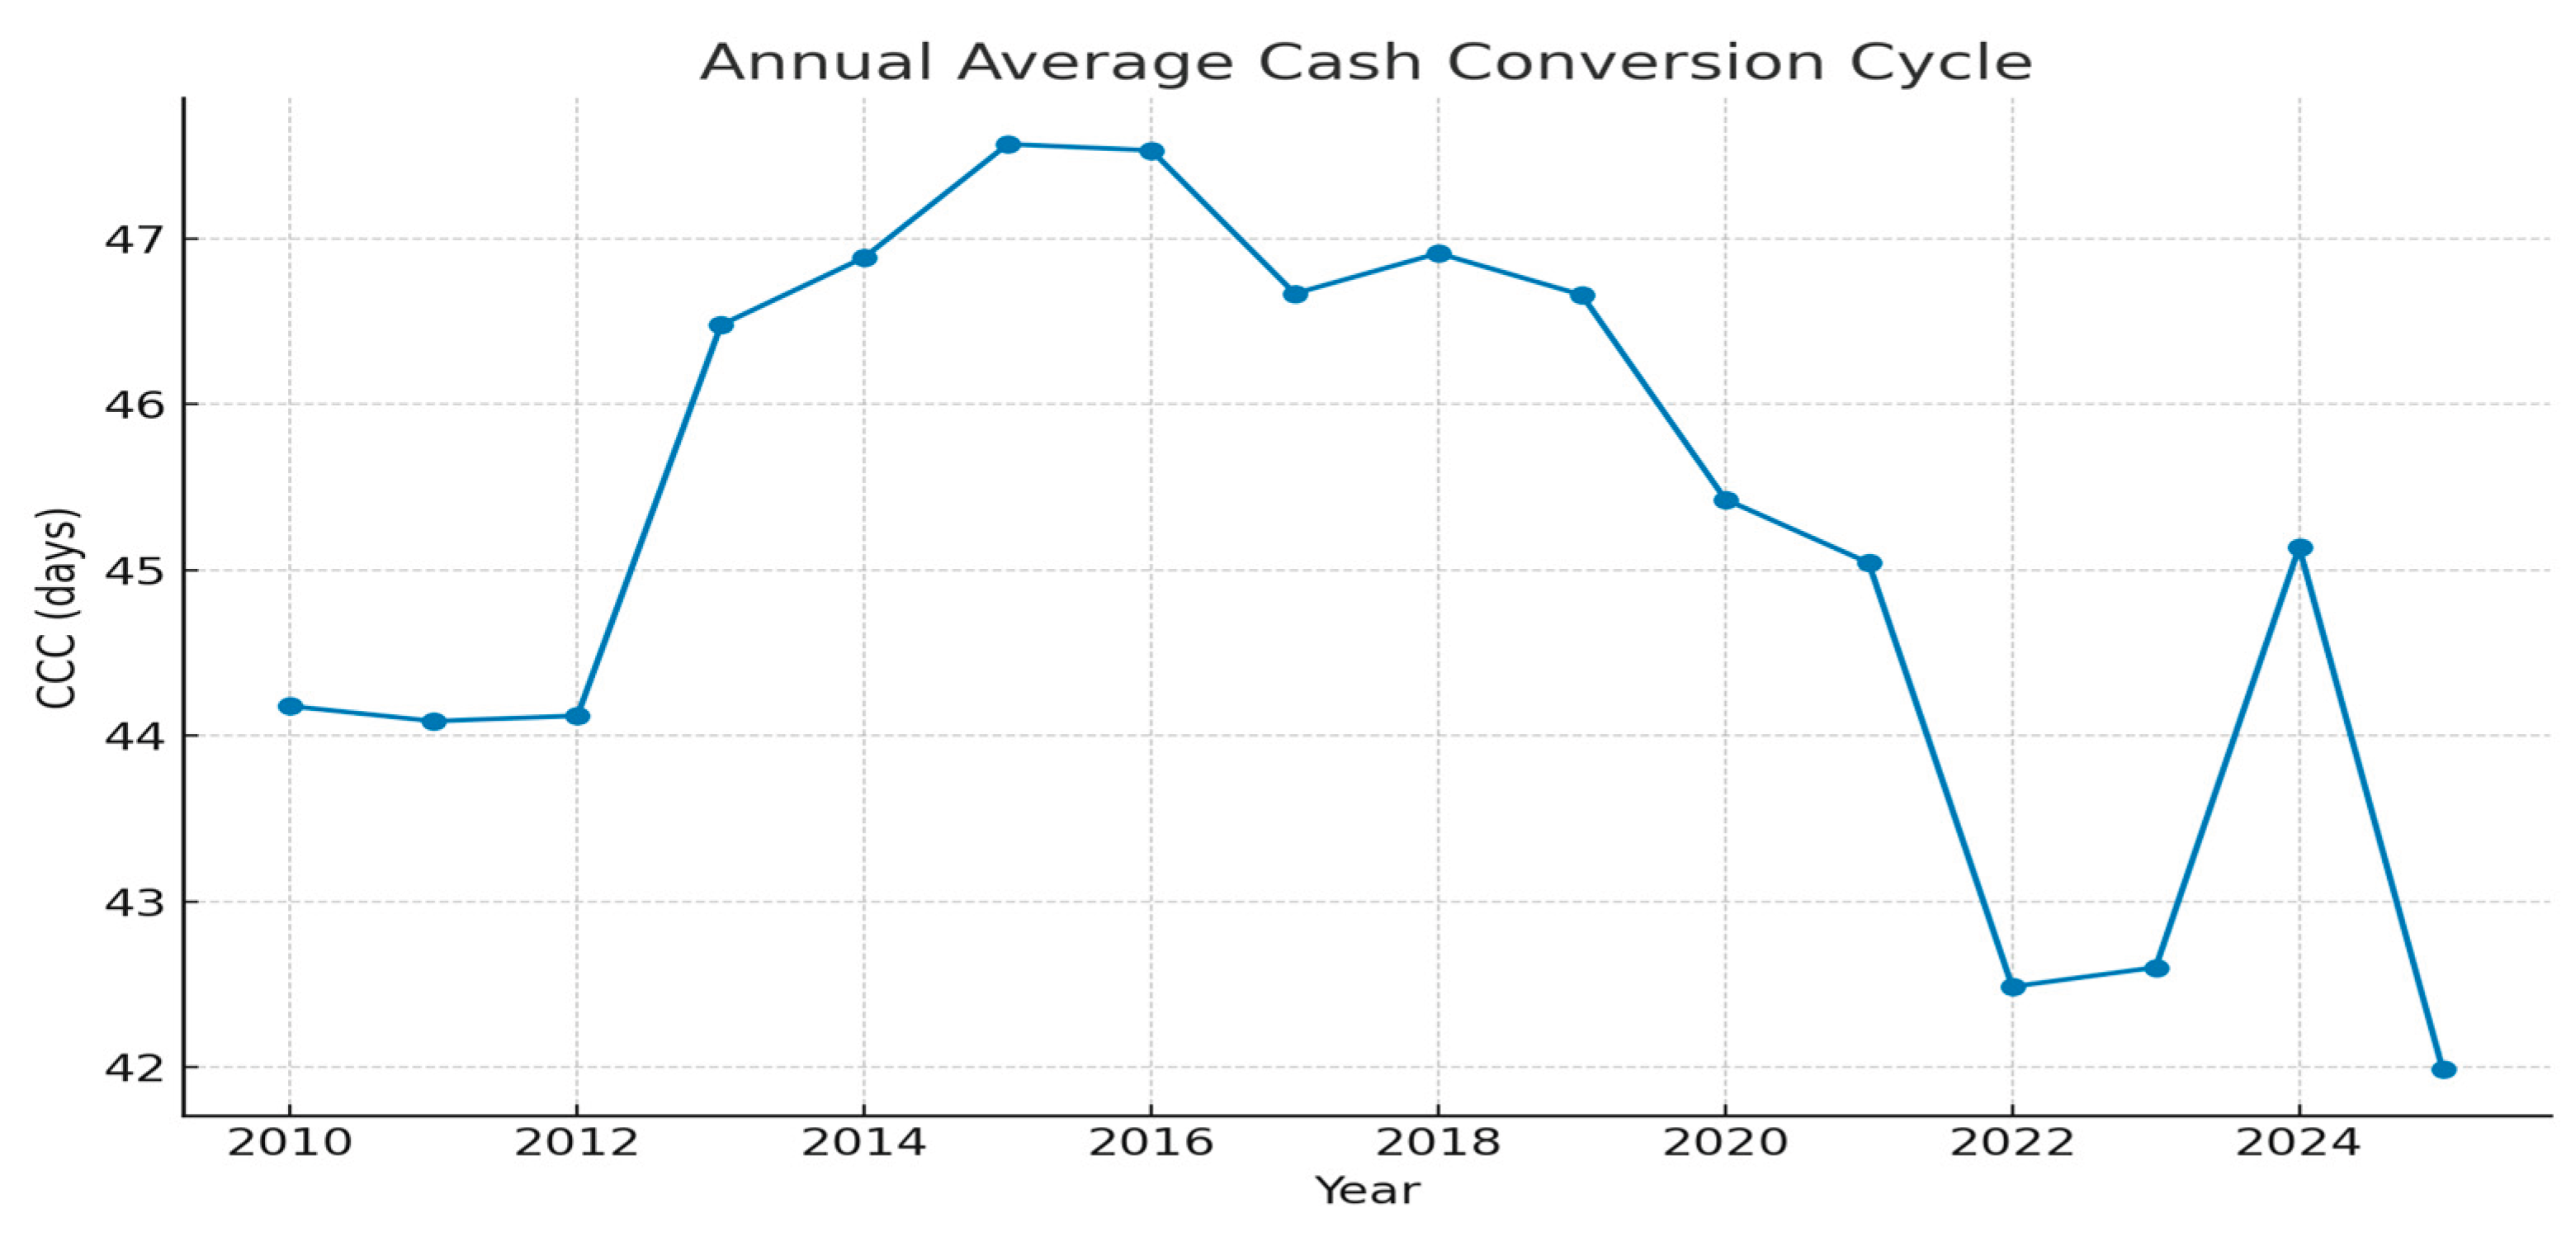
Figure 2.
Distribution of ROA by firm size group. Source: Authors’ calculations.
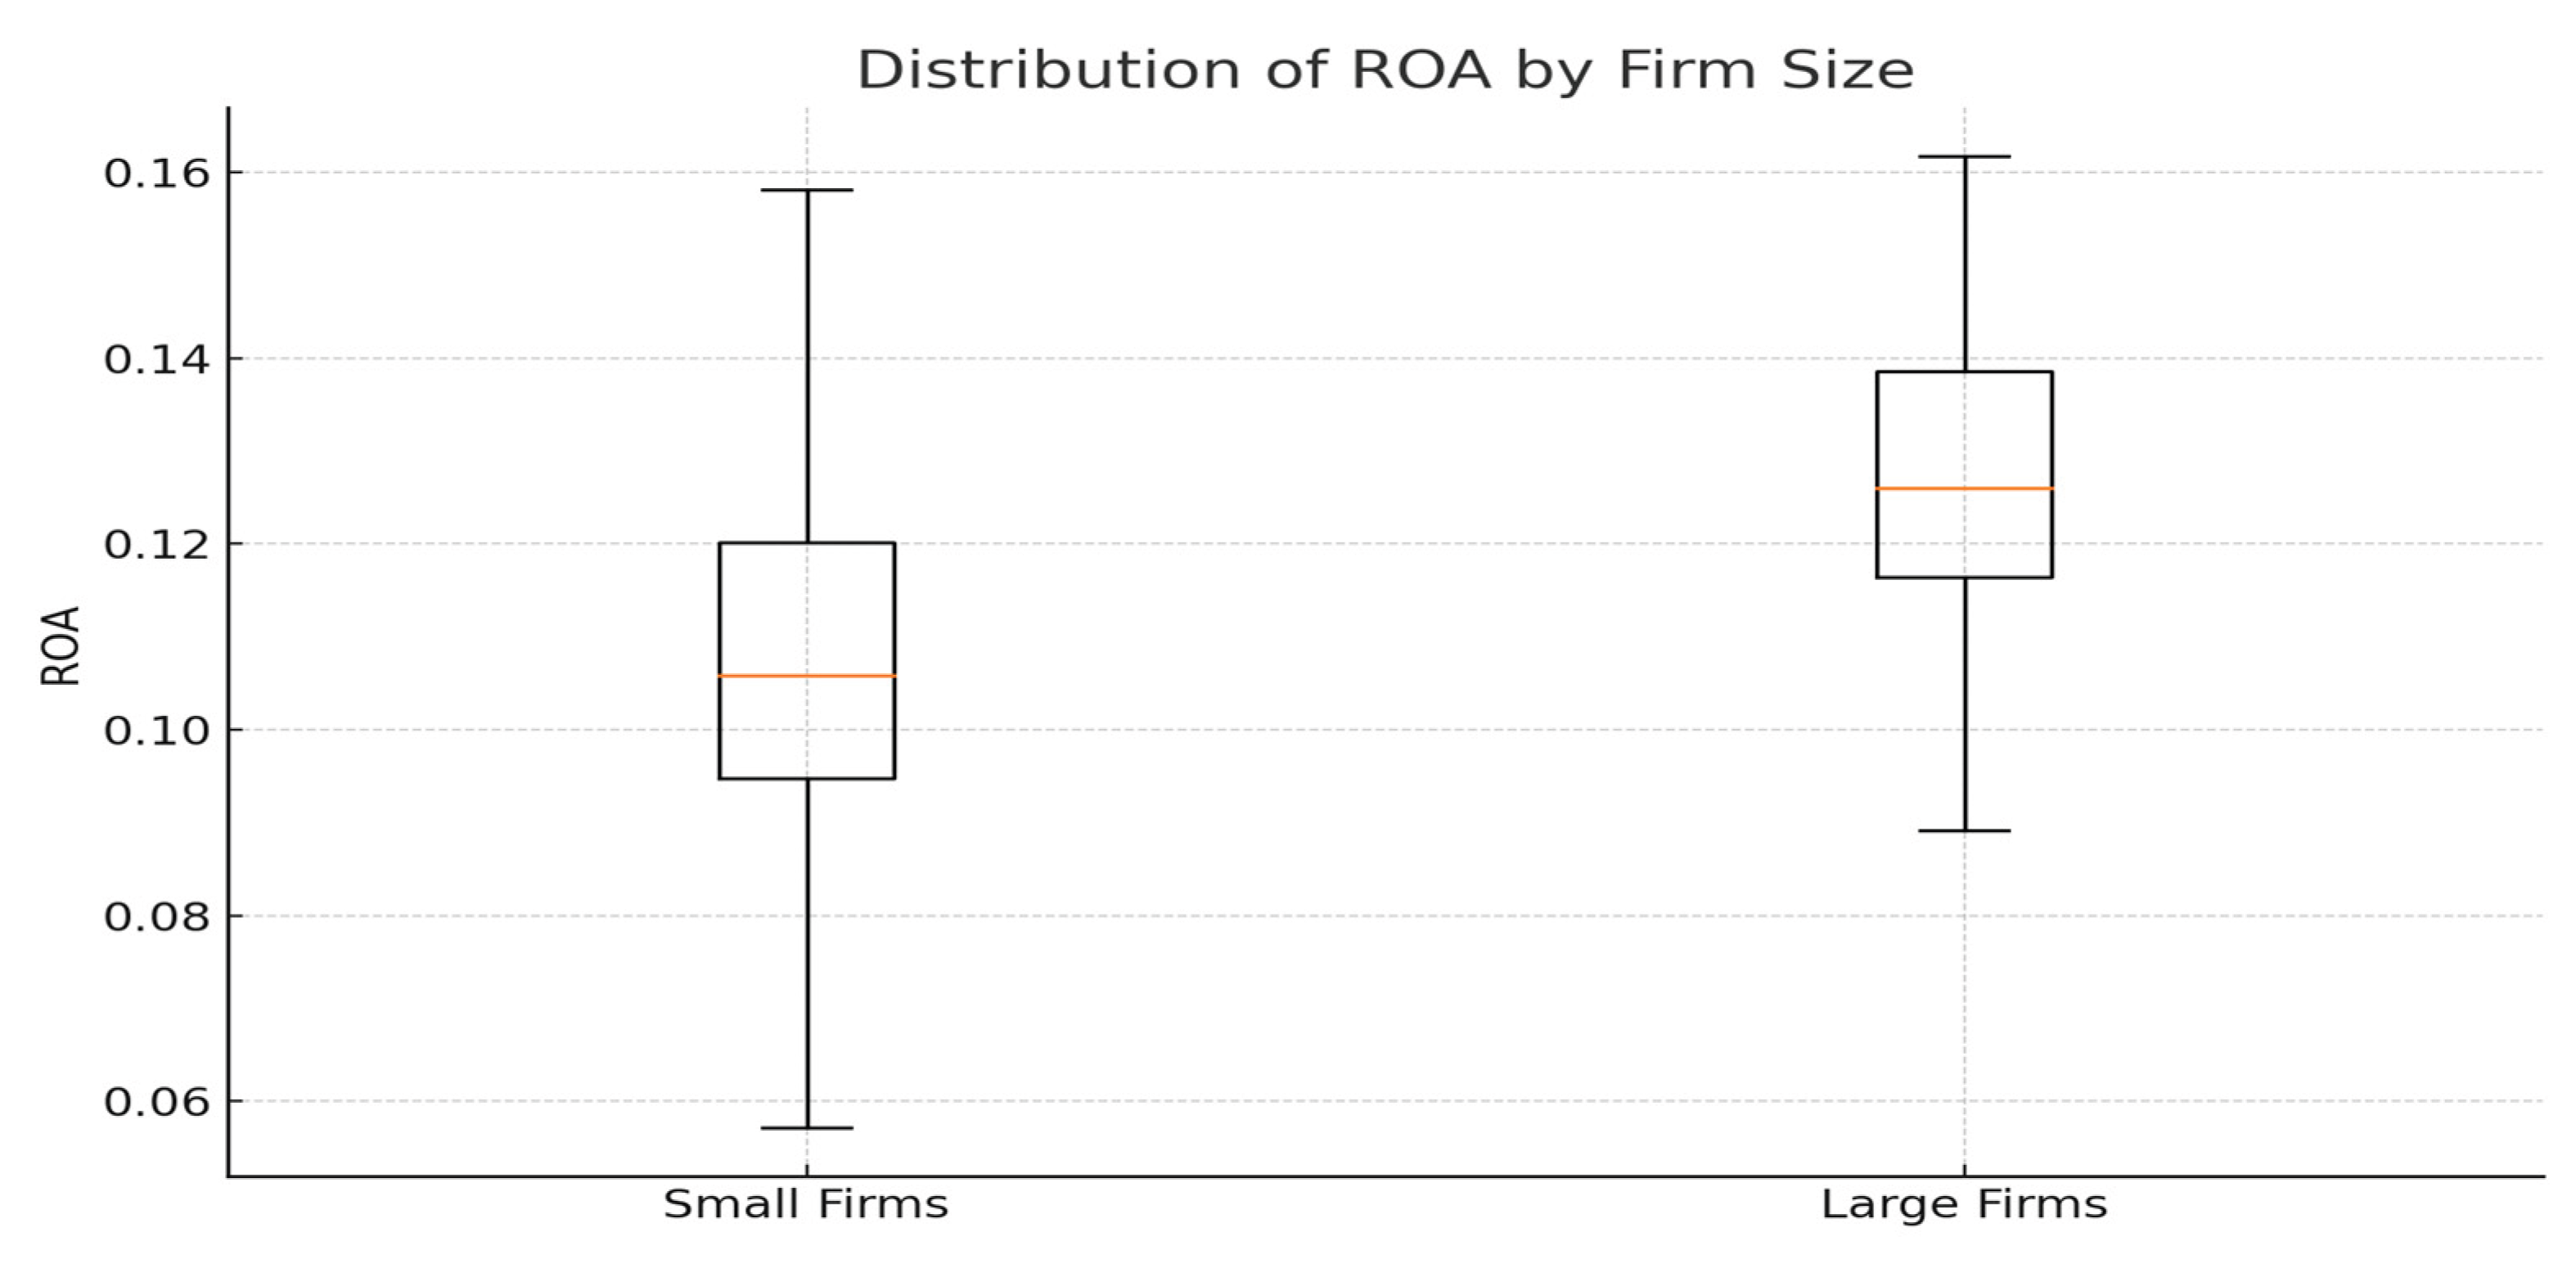
Figure 3.
CCC and ROA: Cross-sectional relationship. Source: Authors’ calculations.
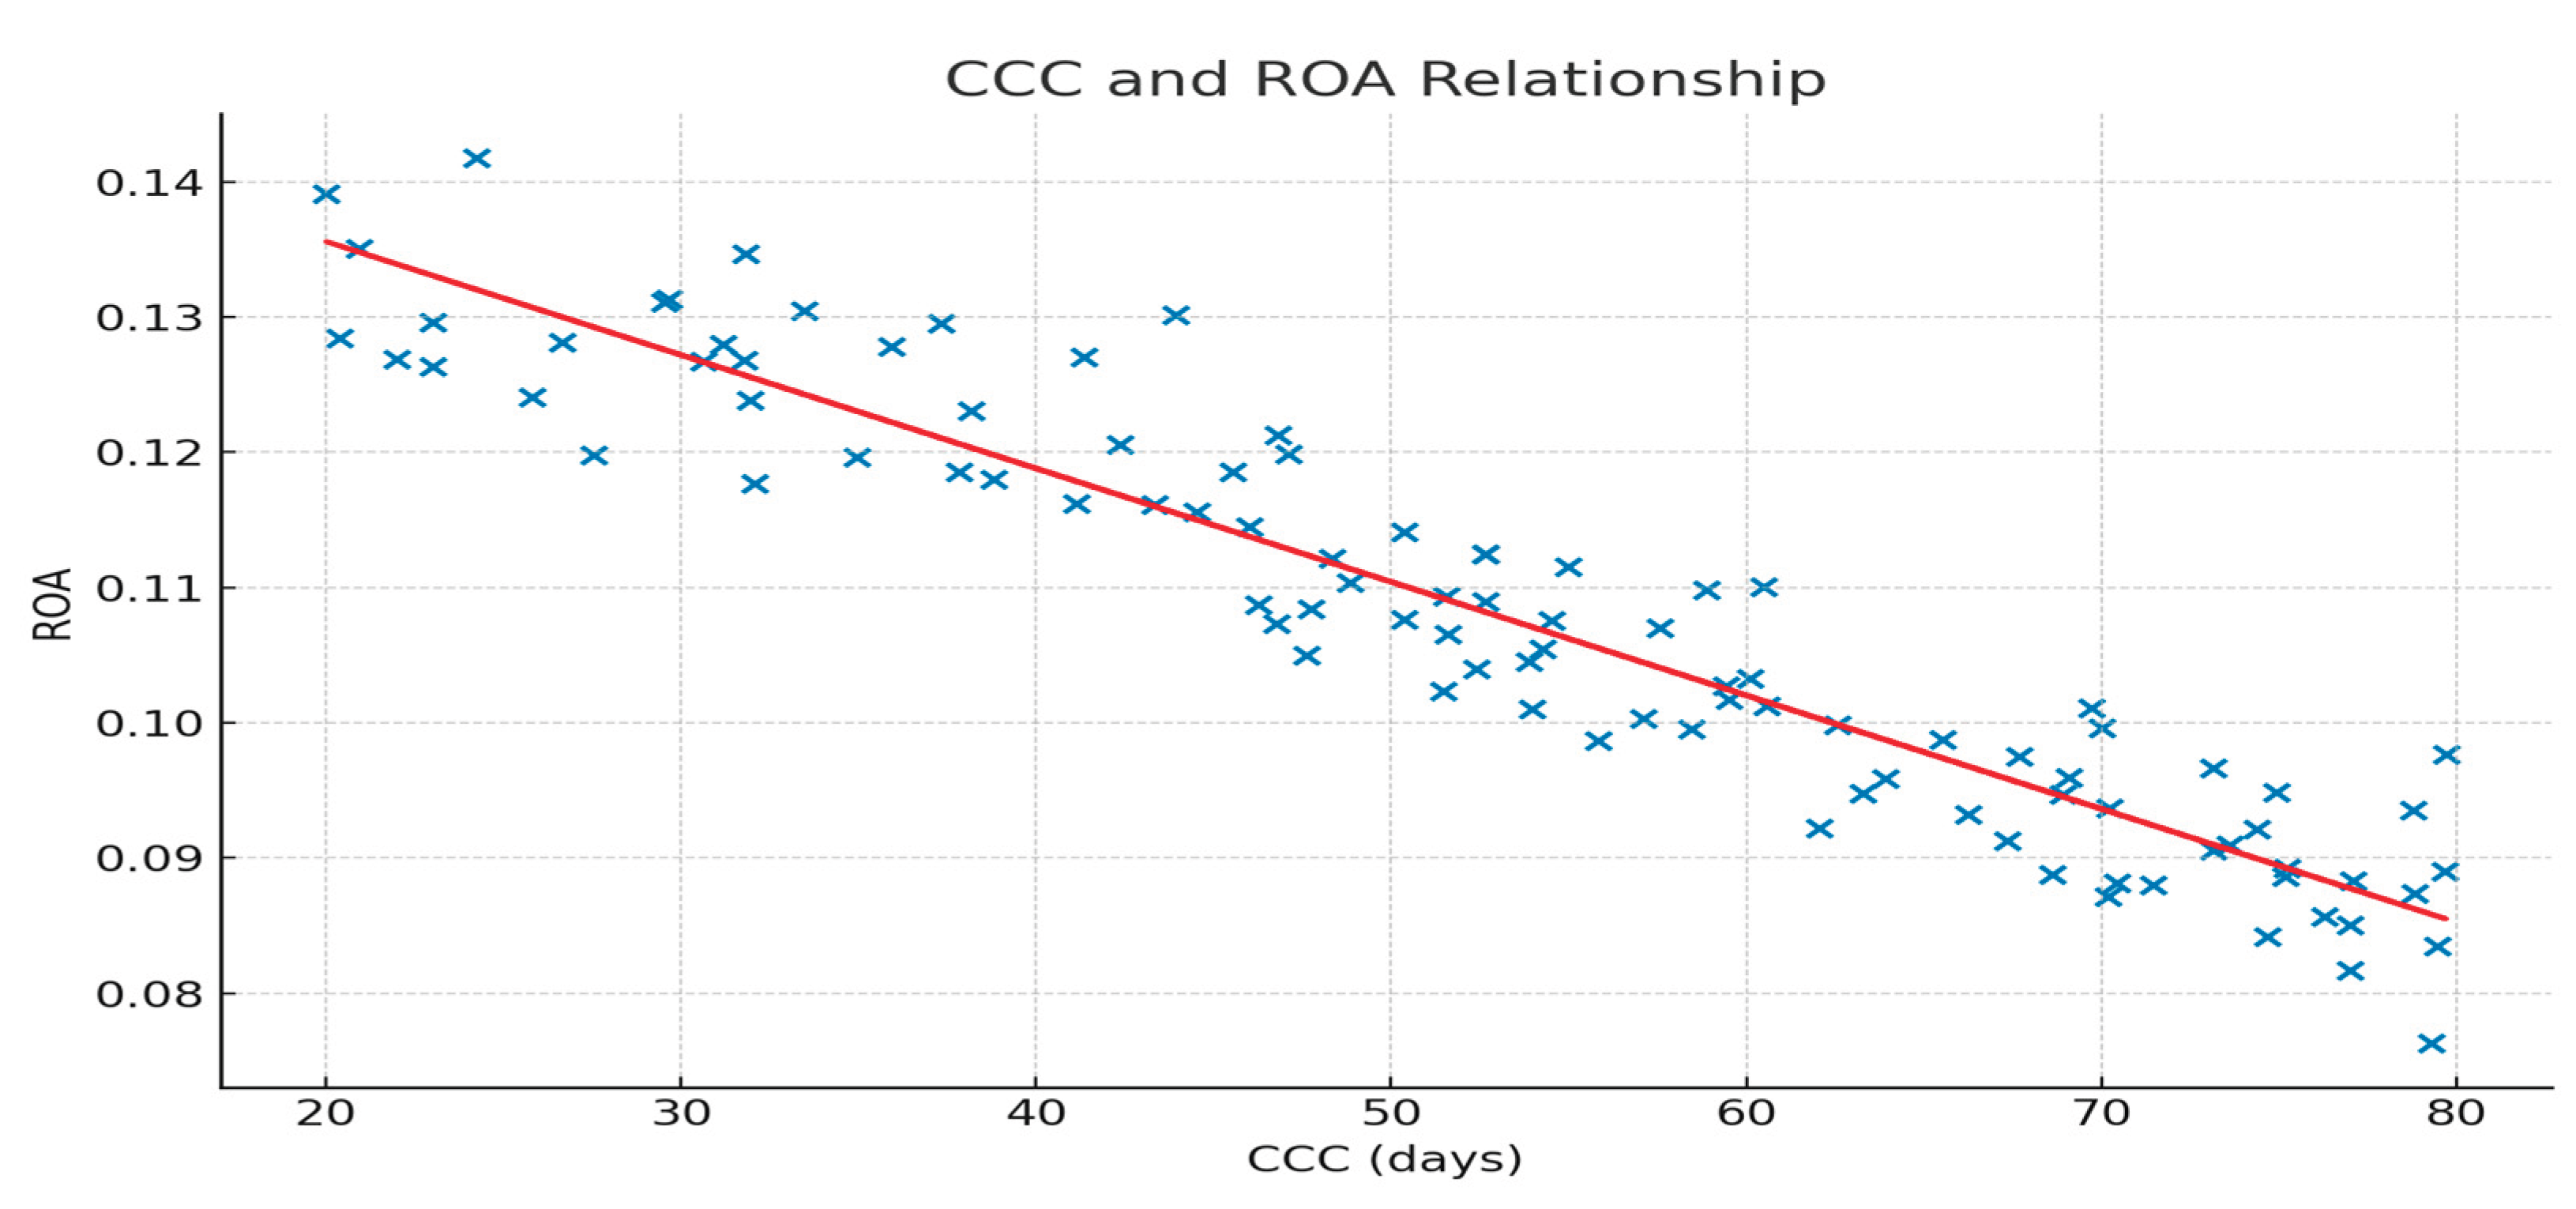
Figure 4.
ITP and ROA: Cross-sectional relationship. Source: Authors’ calculations.
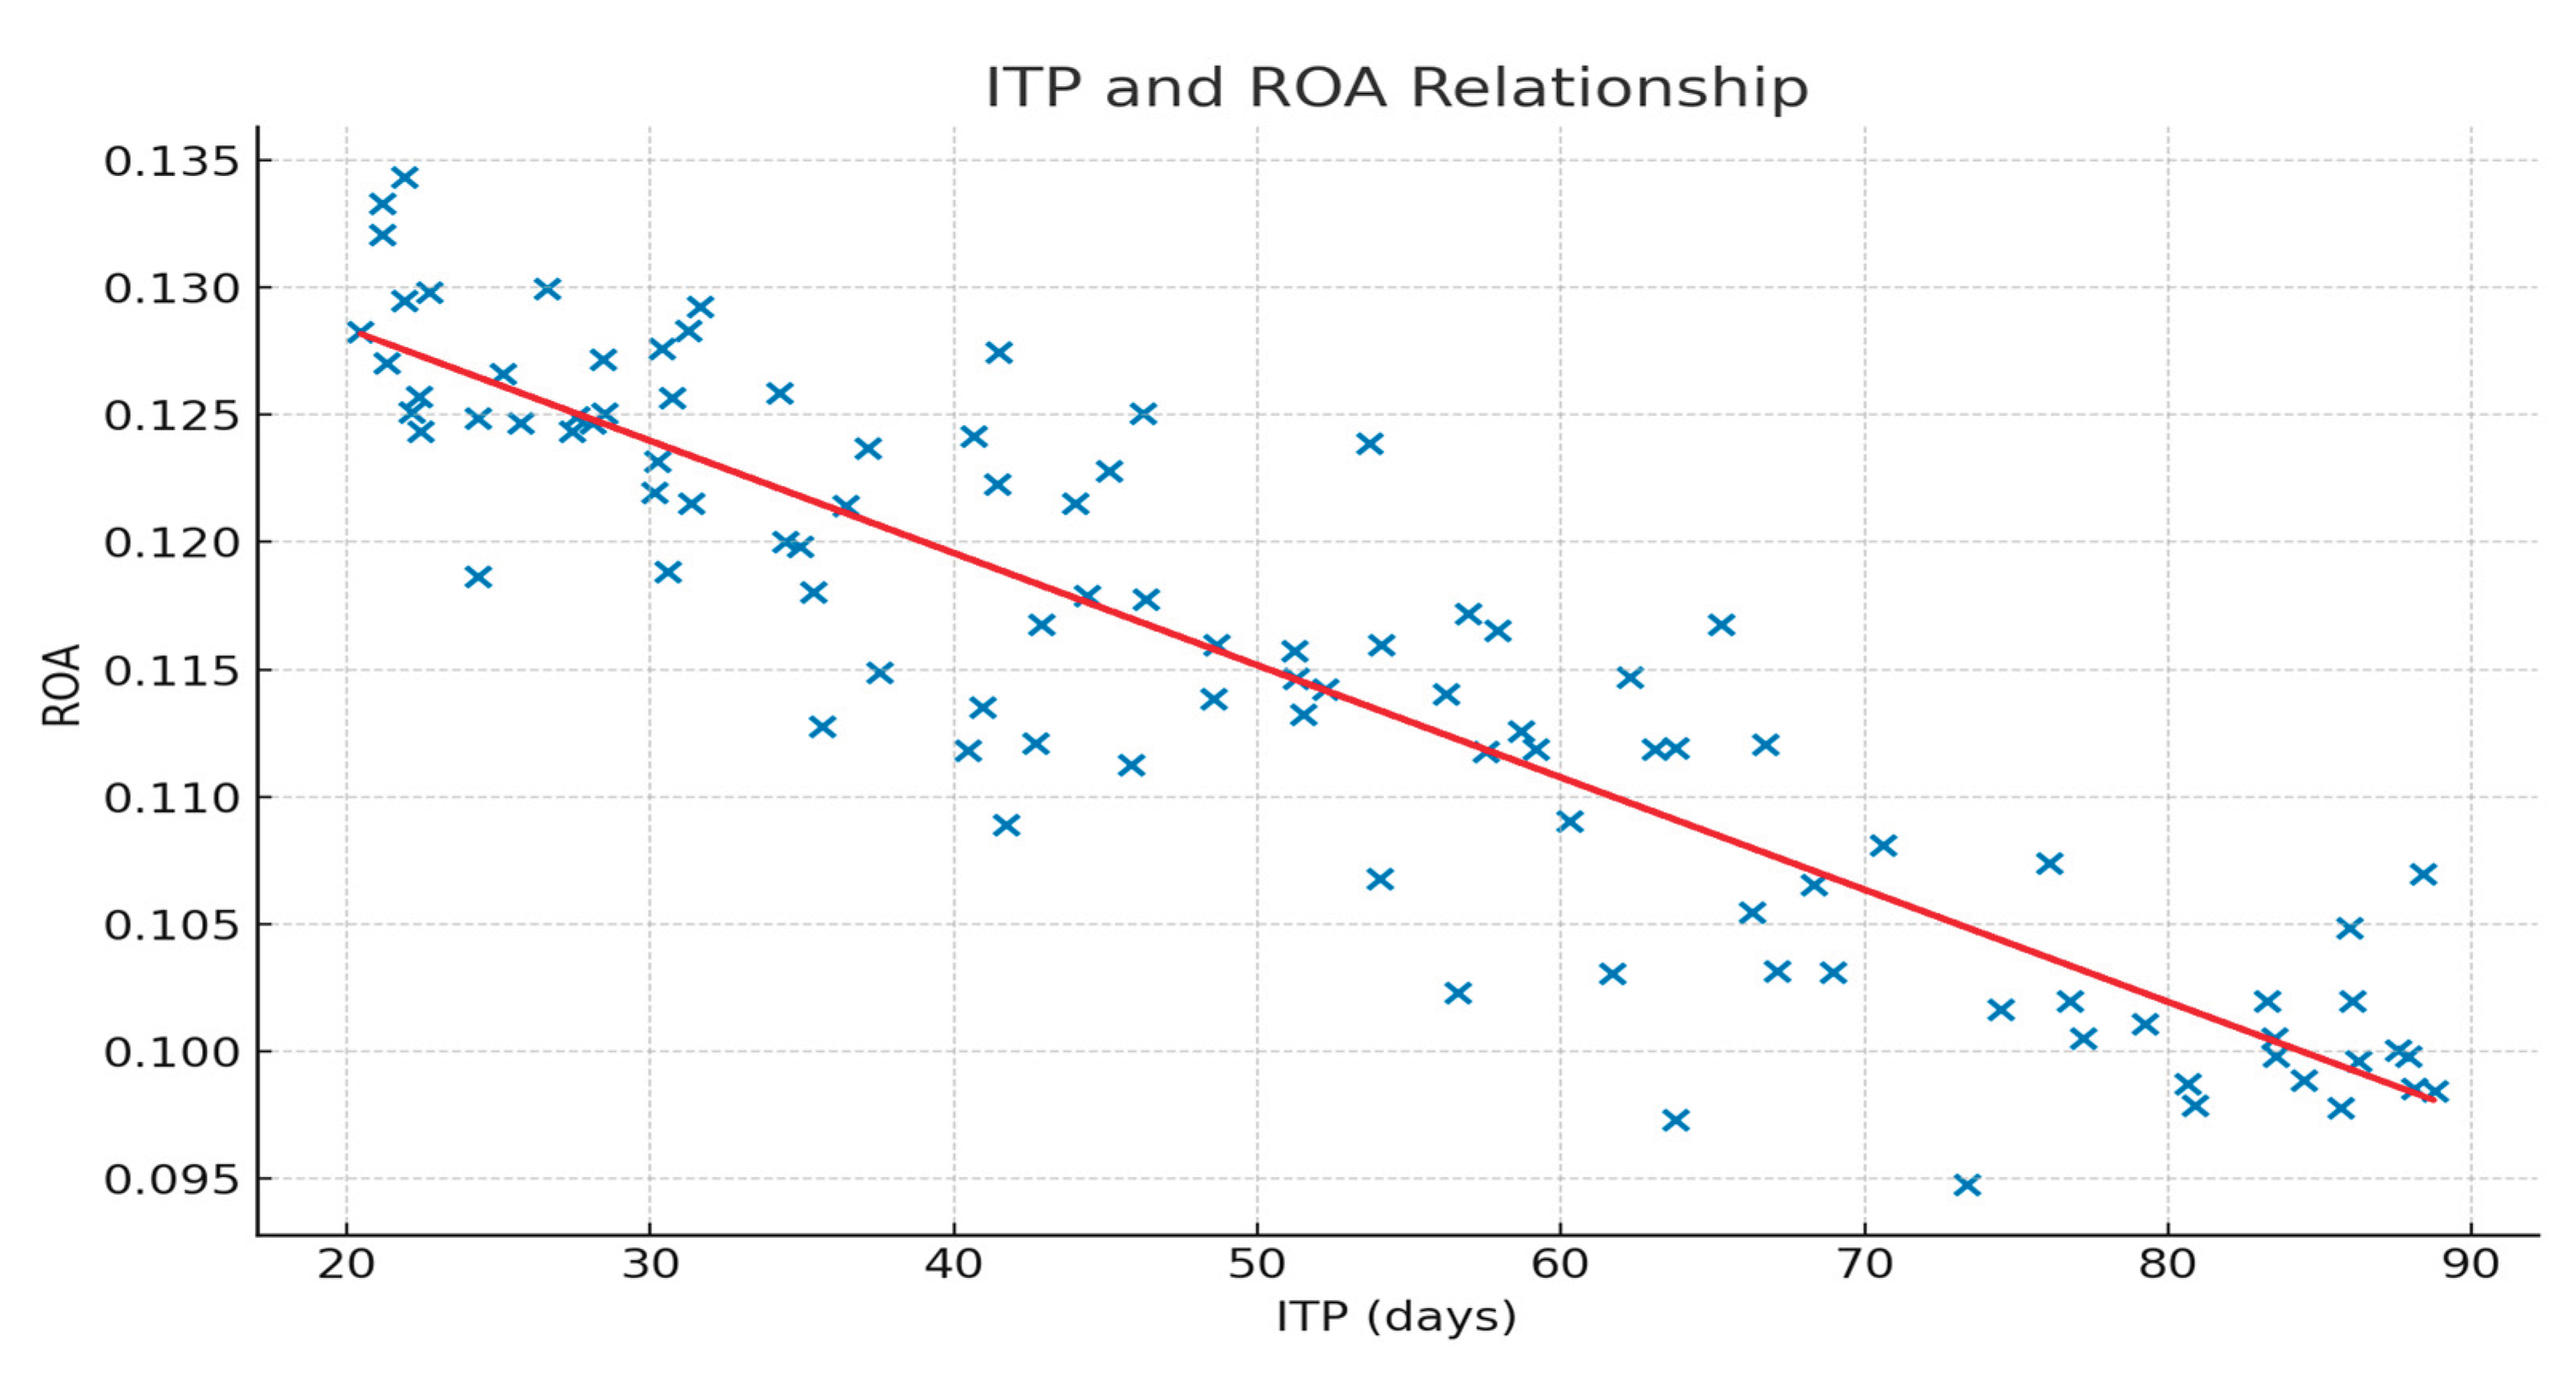
Figure 5.
Average CCC by firm size group. Source: Authors’ calculations.
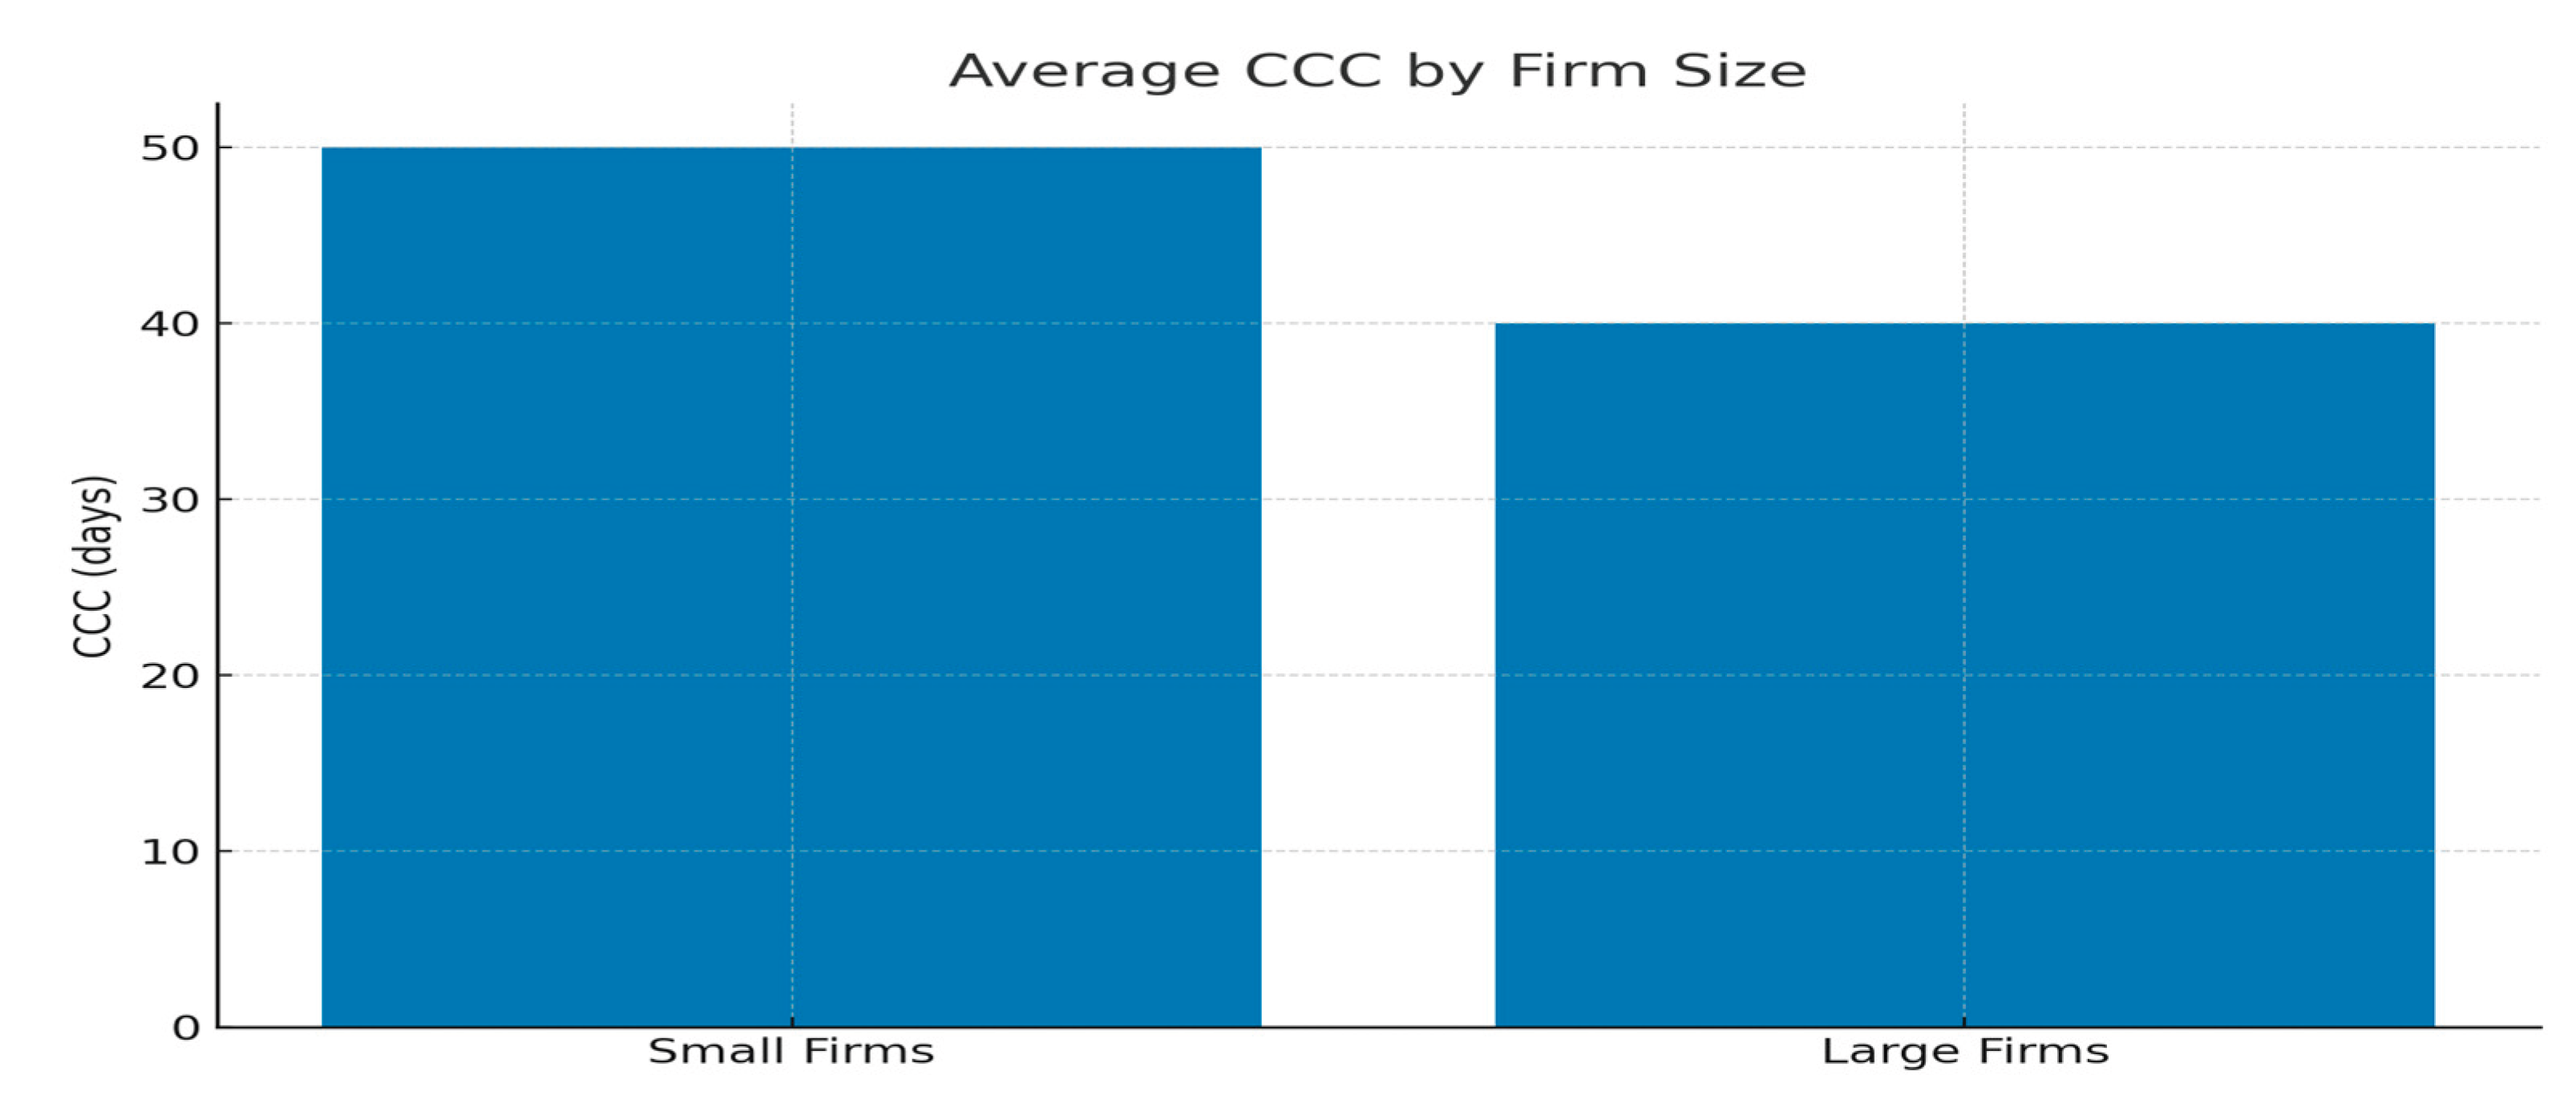
Table 5.
Quantile regression coefficients for ROA (τ = 0.25, 0.50, 0.75). Notes: Bootstrap SEs; *, **, *** denote 10%, 5%, 1%.
Table 5.
Quantile regression coefficients for ROA (τ = 0.25, 0.50, 0.75). Notes: Bootstrap SEs; *, **, *** denote 10%, 5%, 1%.
| Variable | Q25 (ROA) | Q50 (ROA) | Q75 (ROA) |
| ACP | -0.0002 | -0.0003 | -0.0005 |
| ITP | -0.0001 | -0.0001 | -0.0002 |
| APP | 0.0001 | 0.0002 | 0.0002 |
| CCC | -0.0003 | -0.0005 | -0.0007 |
Table 6.
System GMM estimates (two-step, collapsed instruments). Notes: Hansen J (p > 0.10); AR (1) expected; AR (2) in differences not significant; finite-sample correction applied; instruments capped to prevent proliferation; *, **, *** denote 10%, 5%, 1%.
Table 6.
System GMM estimates (two-step, collapsed instruments). Notes: Hansen J (p > 0.10); AR (1) expected; AR (2) in differences not significant; finite-sample correction applied; instruments capped to prevent proliferation; *, **, *** denote 10%, 5%, 1%.
| Variable | ROA (GMM) | ROE (GMM) |
| Lagged ROA | 0.312*** | — |
| Lagged ROE | — | 0.287*** |
| CCC | -0.0004*** | -0.0005*** |
| Leverage | -0.018** | -0.015* |
| Growth | 0.049*** | 0.072*** |
| Size (log) | 0.003** | 0.004** |
Disclaimer/Publisher’s Note: The statements, opinions and data contained in all publications are solely those of the individual author(s) and contributor(s) and not of MDPI and/or the editor(s). MDPI and/or the editor(s) disclaim responsibility for any injury to people or property resulting from any ideas, methods, instructions or products referred to in the content. |
© 2025 by the authors. Licensee MDPI, Basel, Switzerland. This article is an open access article distributed under the terms and conditions of the Creative Commons Attribution (CC BY) license (http://creativecommons.org/licenses/by/4.0/).
Copyright: This open access article is published under a Creative Commons CC BY 4.0 license, which permit the free download, distribution, and reuse, provided that the author and preprint are cited in any reuse.


