
Submitted:
22 August 2025
Posted:
25 August 2025
You are already at the latest version
Abstract
In this work, the influence of the glass fiber on the behavior of the injection molding process of a PA6-based AR15/M4 grip was investigated in a numerical way. The process was realistically modeled using Autodesk Moldflow Insight at different percentages of glass fiber (0%, 15%, 30%, 45%). Simulation results were evaluated such as the temperature distribution, flow time, pressure drop, pumping power, volumetric shrinkage and warpage displacement. Findings indicate that with 15% glass fibers, the material had the shortest fill period (0.62 s), minimal pressure drop (0.0061 MPa) and the lowest power consumption (0.000433 kW), indicating maximum flow efficiency. On the other hand, a 30% GF setup had the largest volumetric shrinkage (17.76% at most) and warpage (Y: 1.213 mm), even though it had better thermal conductivity. The 45% GF material produced the least amount of shrinkage and distortion but necessitated a greater energy consumption compared to 30% GF. Overall, the 15% GF grade provided the highest average of process efficiency and dimensional accuracy, therefore, it is the most appropriate grade for precision molded firearm components.

Keywords:
1. Introduction
2. Materials and Methods
2.1. Material
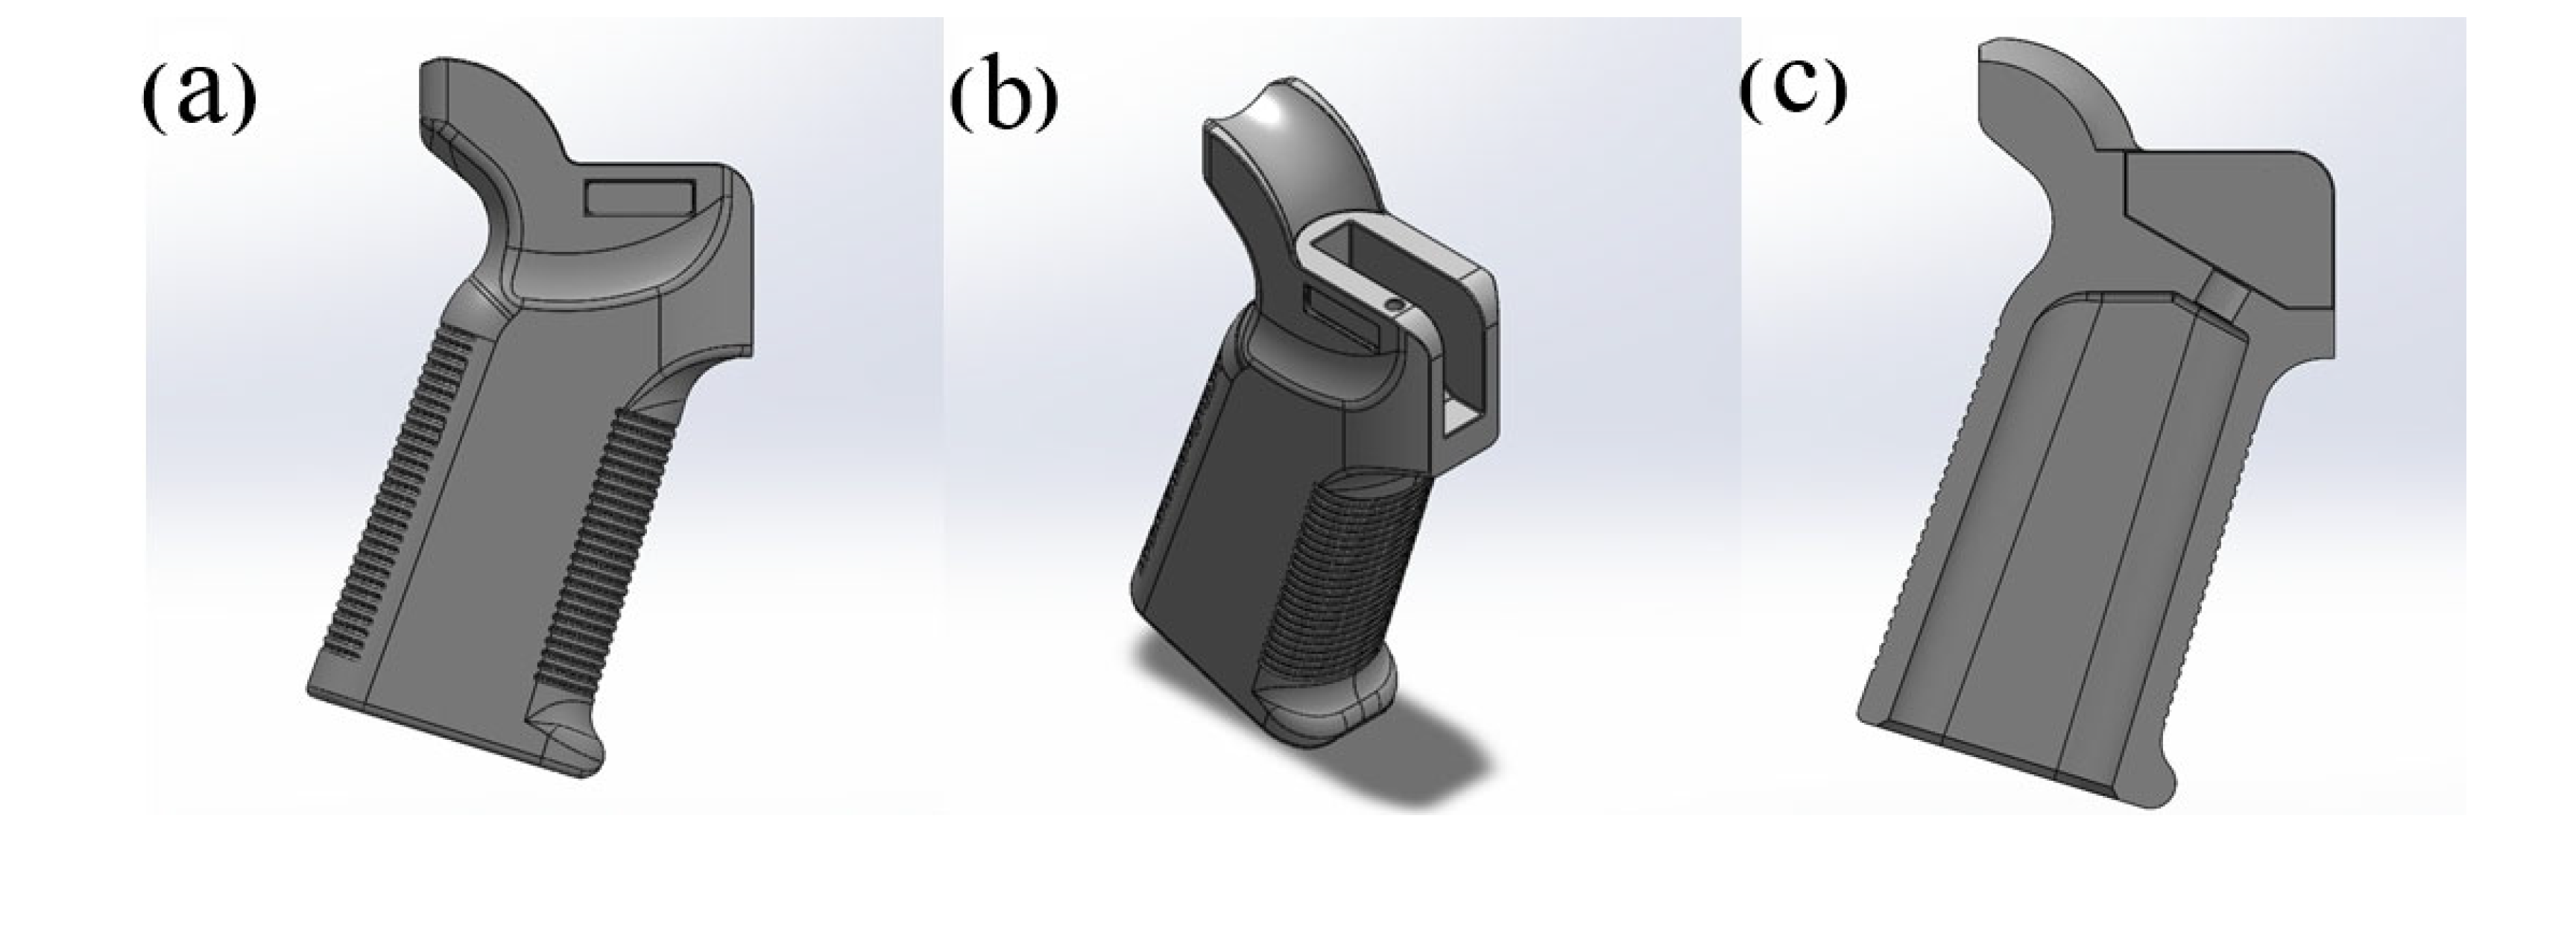
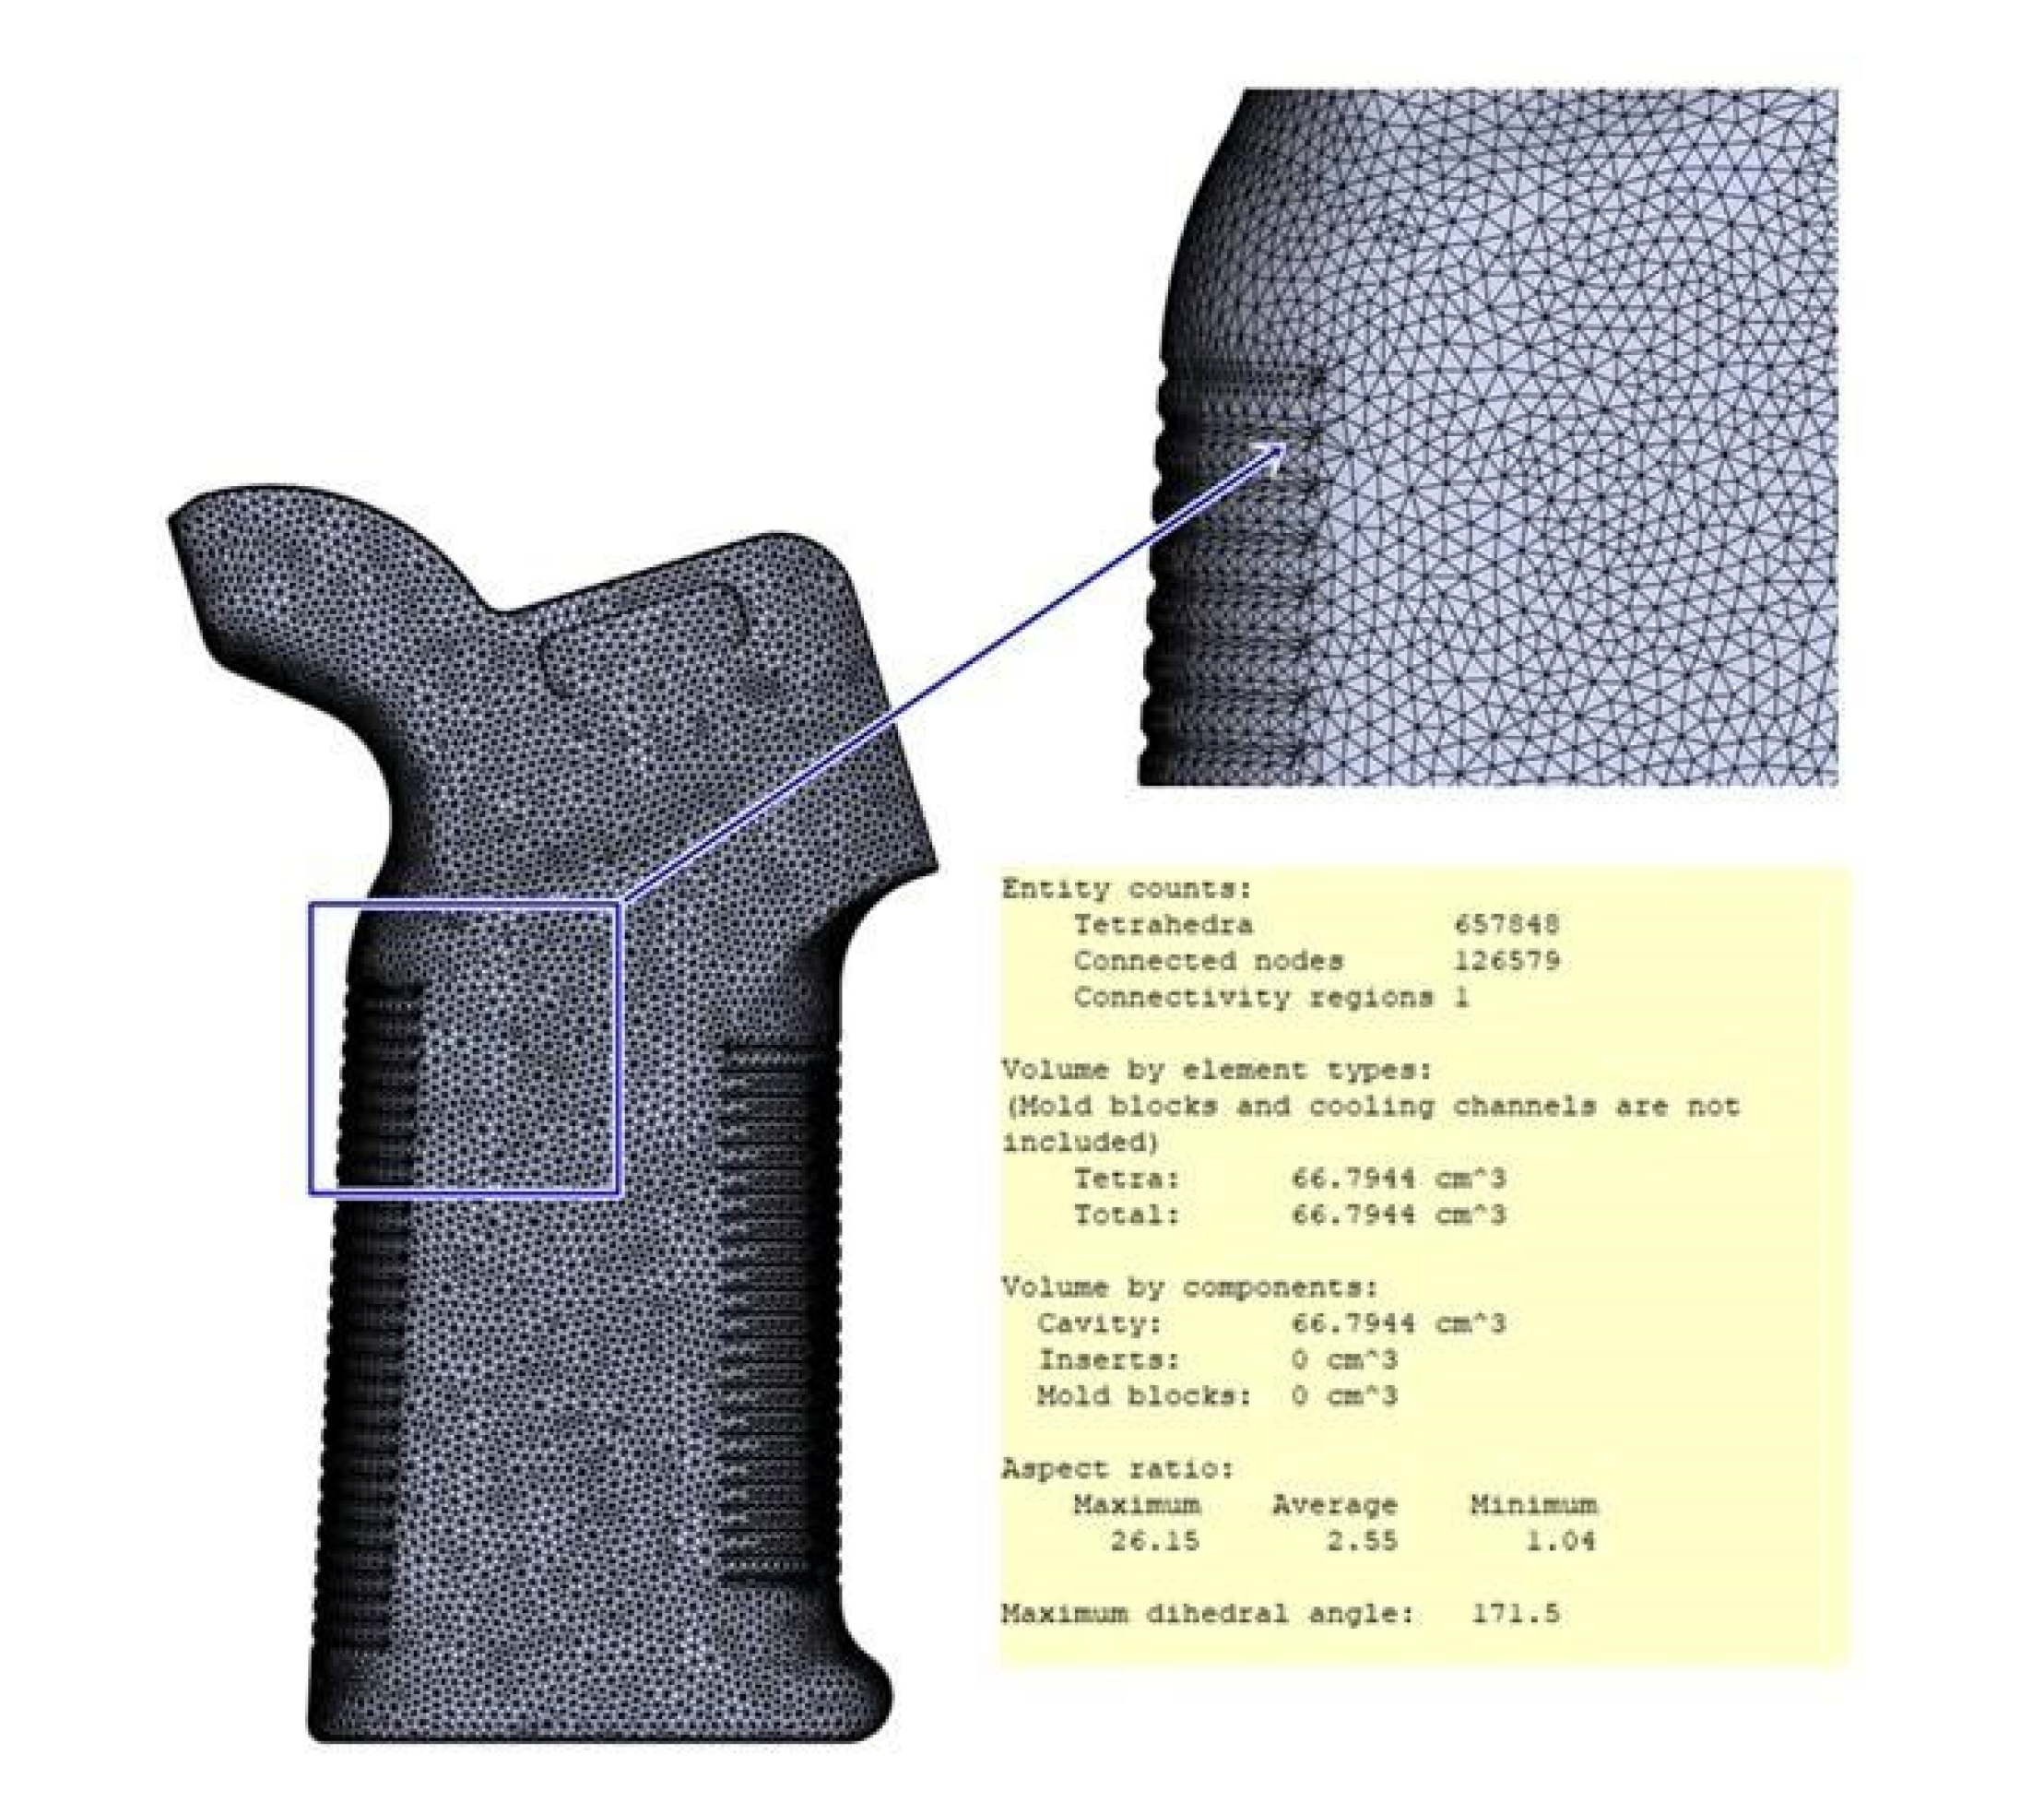
2.2. Model and Mesh
2.3. Process and Machine Setup
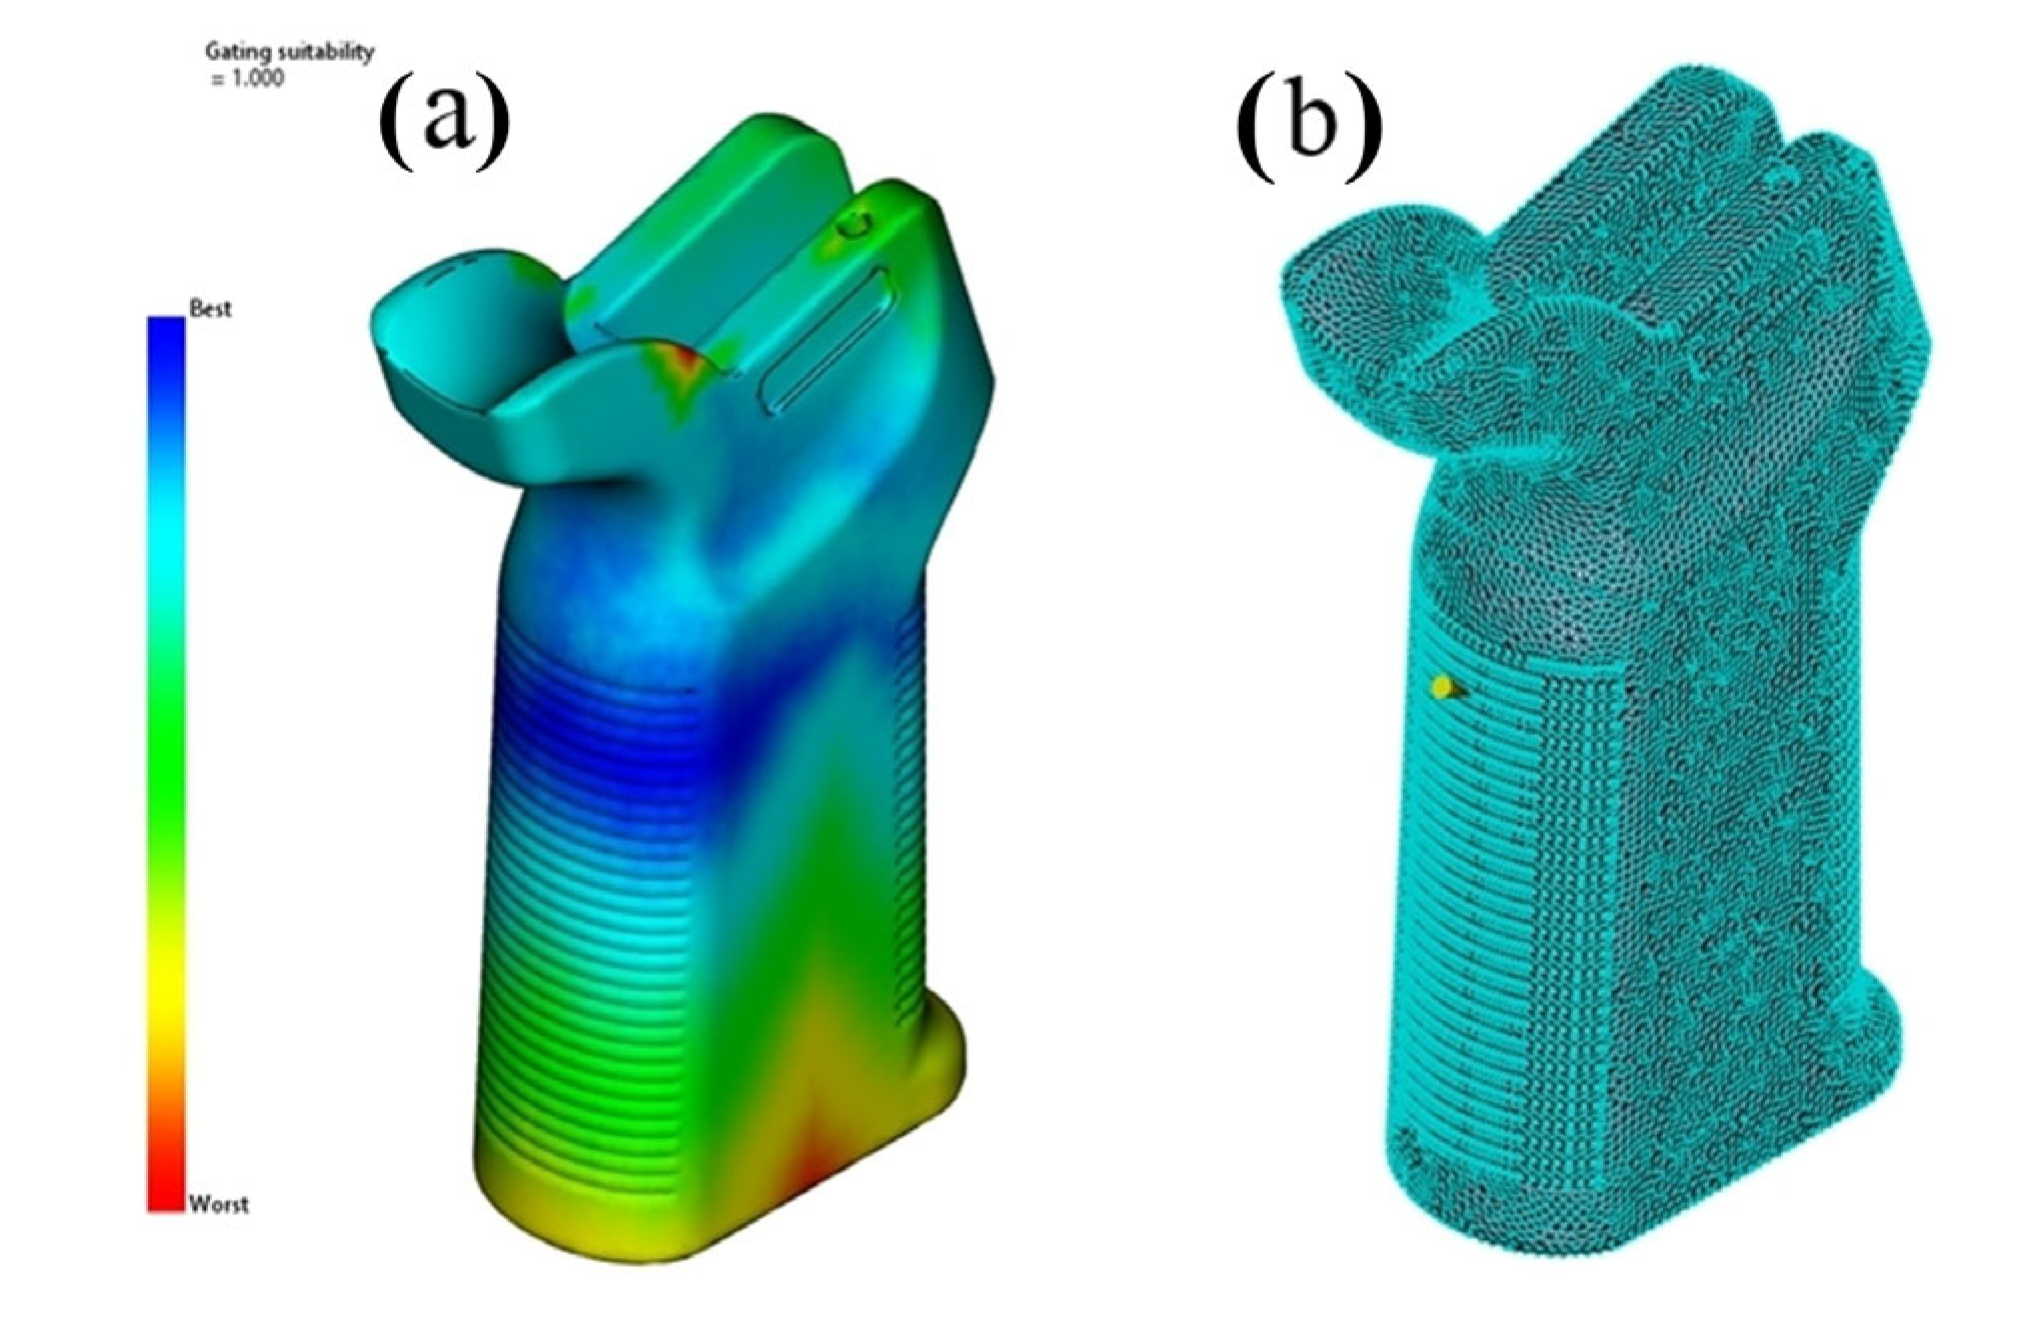
2.4. Gate Location Design
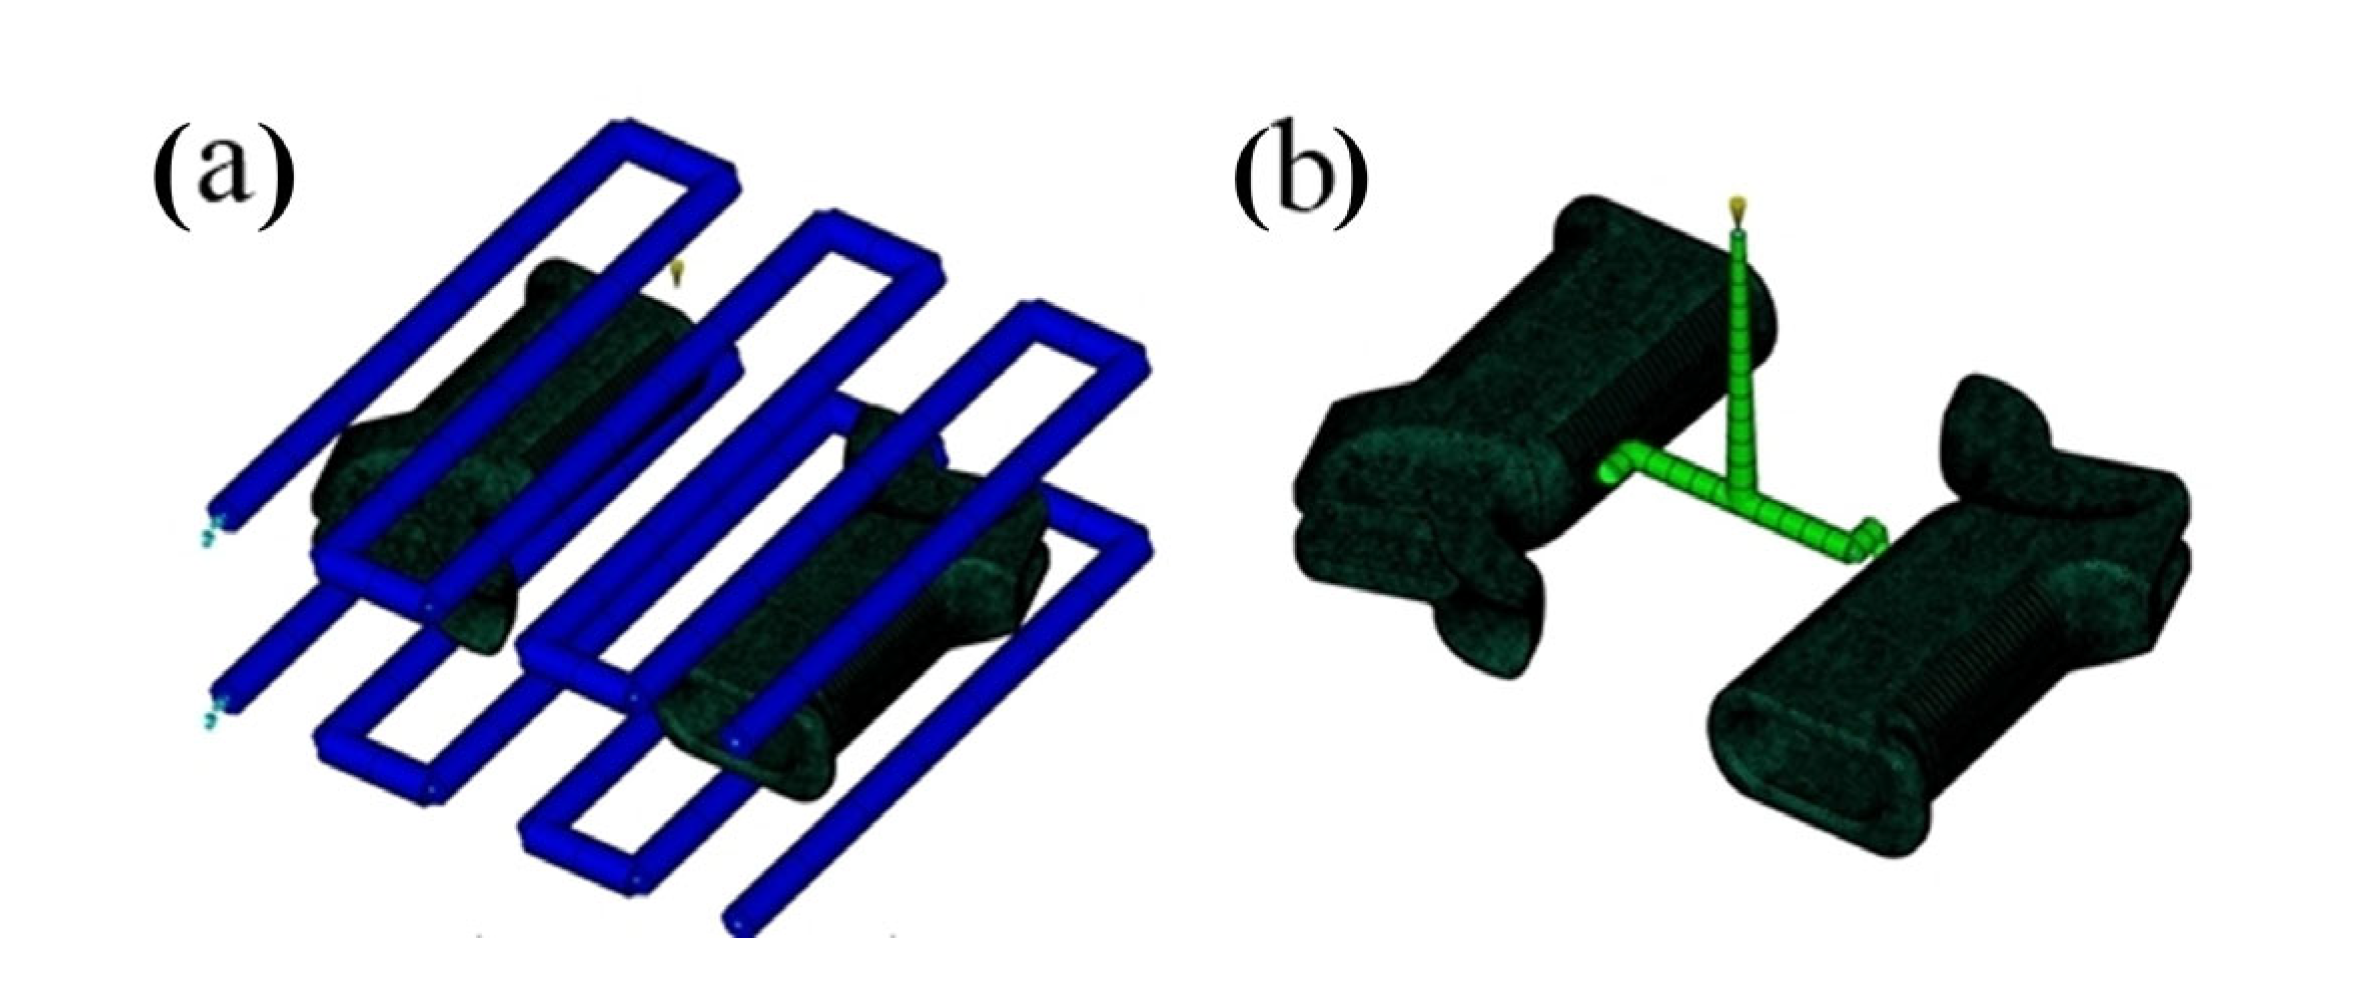
2.5. Cooling Circuit and Runner System Design

| Cooling System Dimensions (mm) | Runner System Dimensions (mm) | ||
|---|---|---|---|
| Part dimension (X) | 167.11 | Spesify the sprue position (X) | -58.42 |
| Part dimension (Y) | 109.05 | Spesify the sprue position (Y) | -40.64 |
| Part dimension (Z) | 28.03 | Parting plane (Z) | -6.56 |
| Channel diameter | 10 | Sprue Orifice diameter | 3 |
| Alignment shape of the circuit | 25 | Runners diameter | 6 |
| Number of channels per part | 3 | Sprue Lenght | 110 |
| Distance between channel centers | 30 | Side Gates orifice diameter | 3 |
| Distance from part edge | 80 | Side Gates Lenght | 8.49 |
| Top and bottom distance |  |
Include angle | 3 |
3. Results
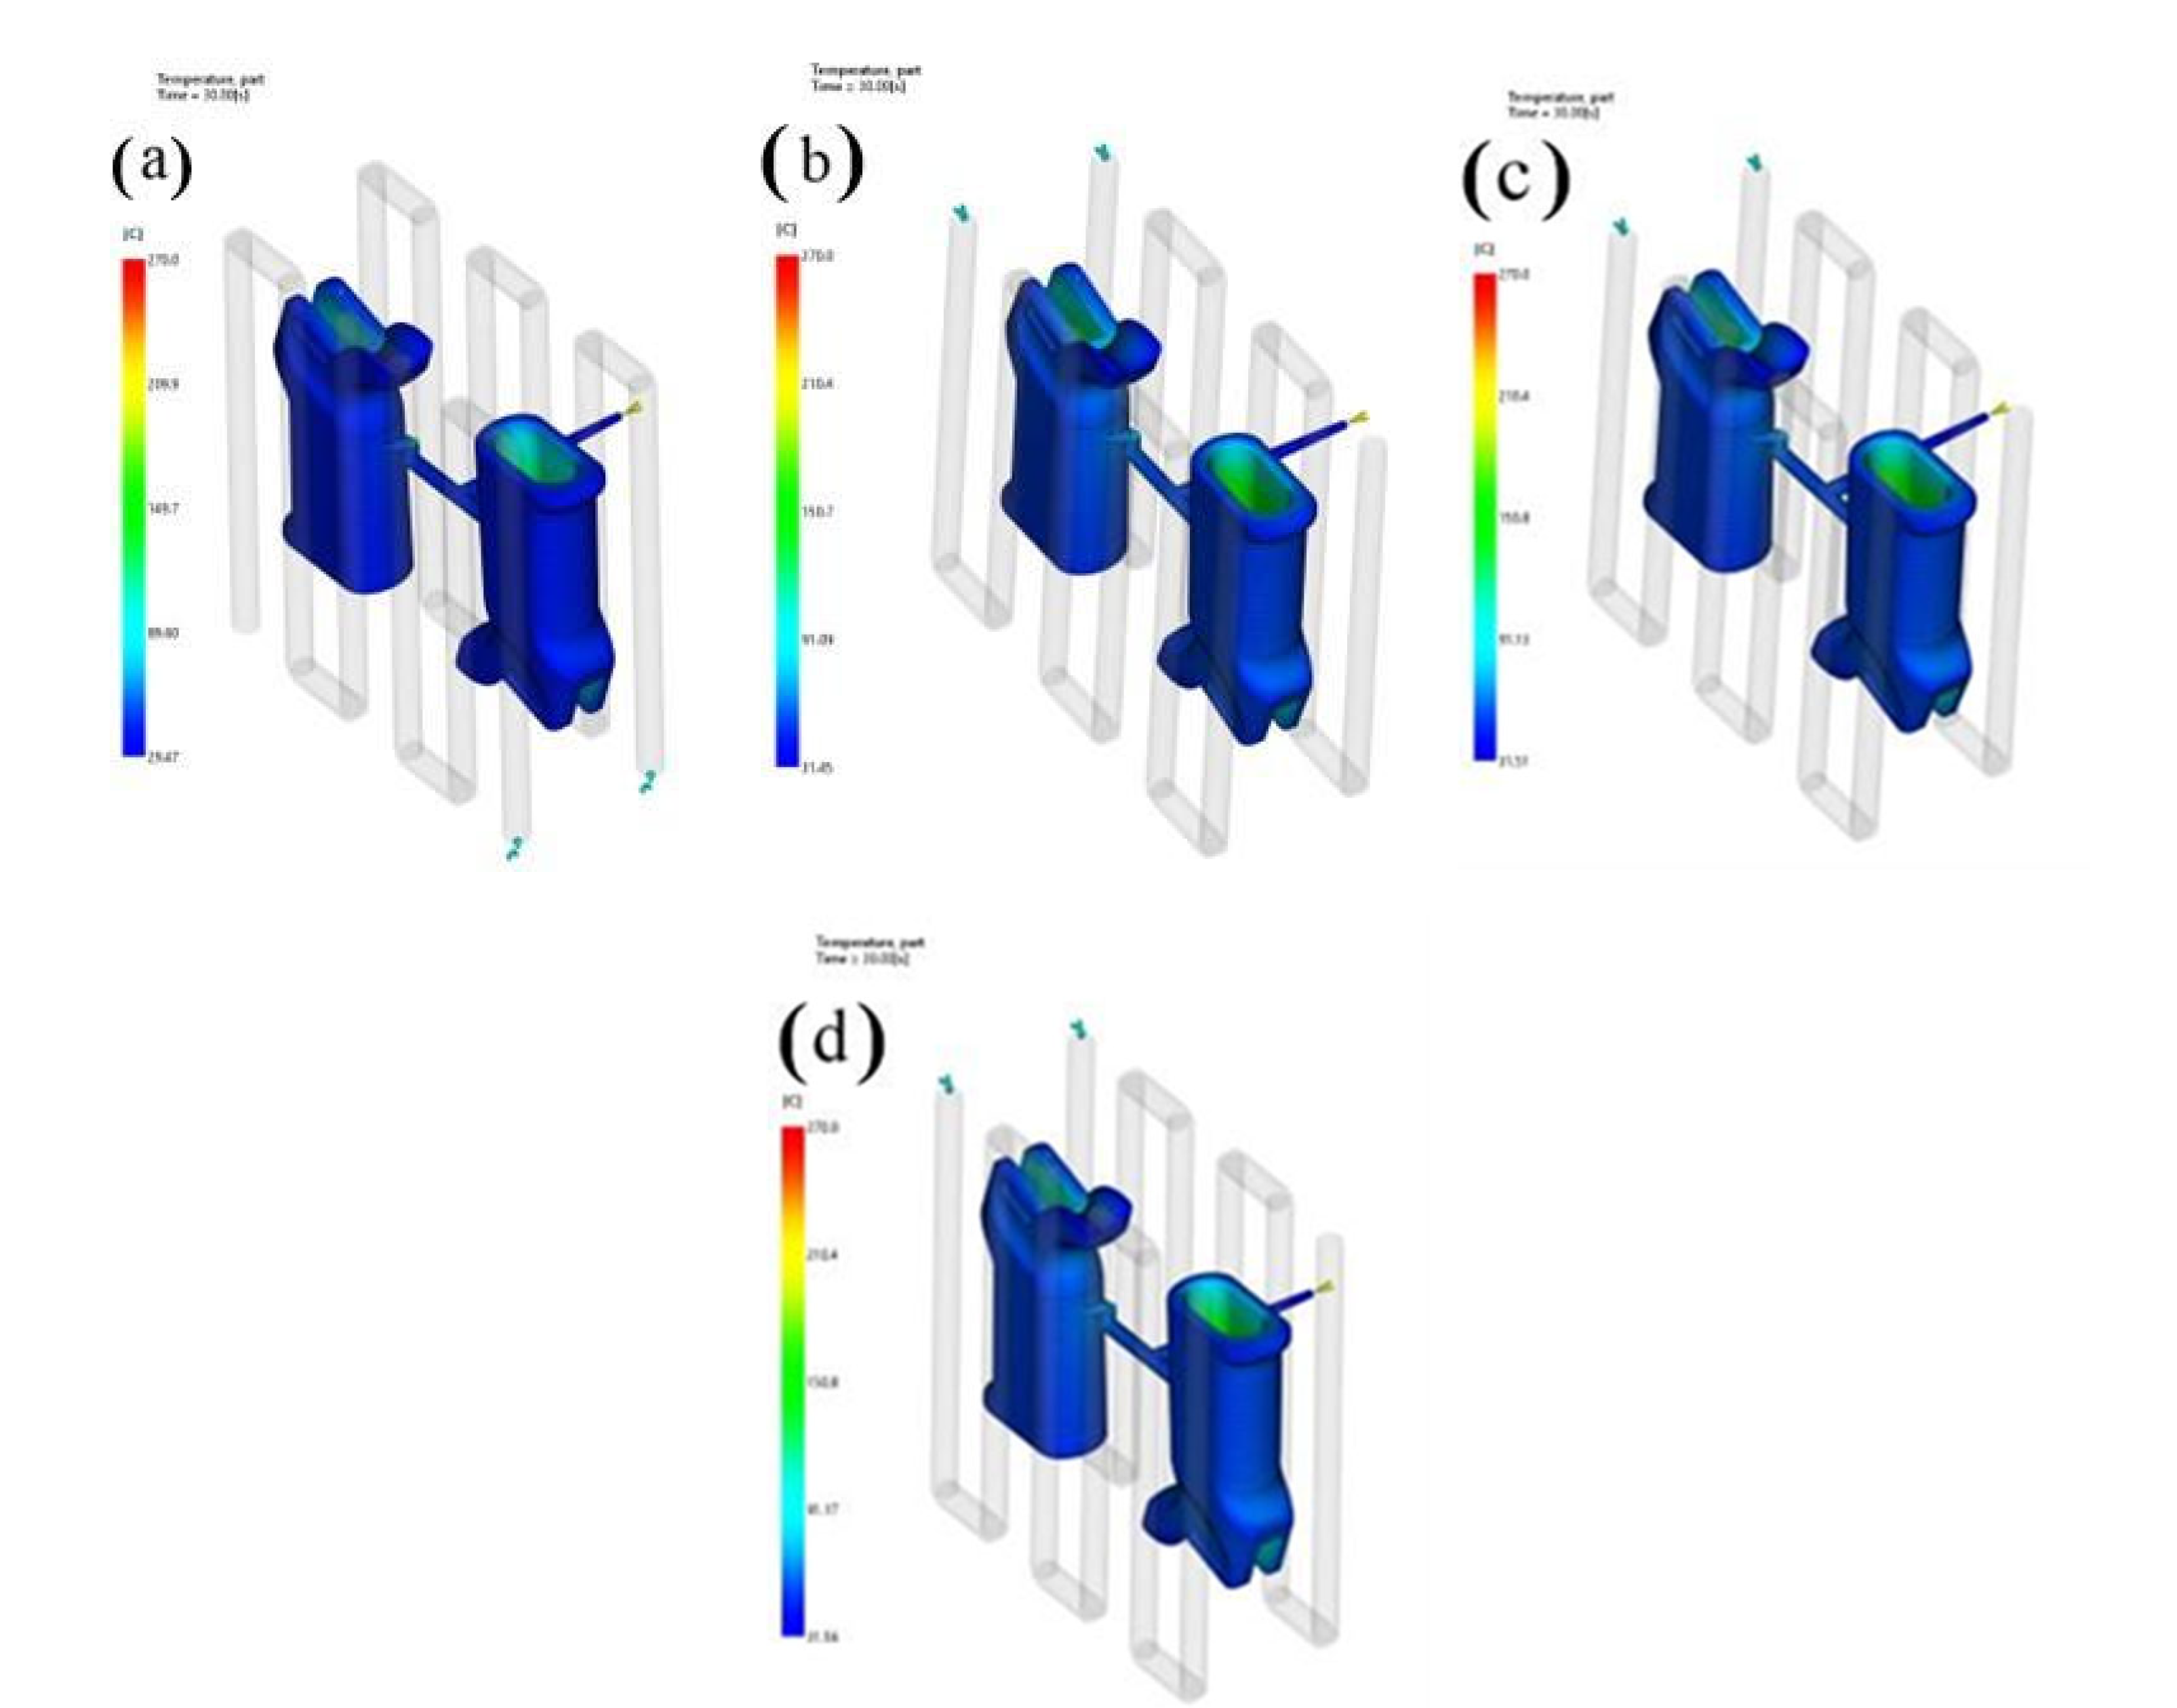
3.1. Temperature Distribution
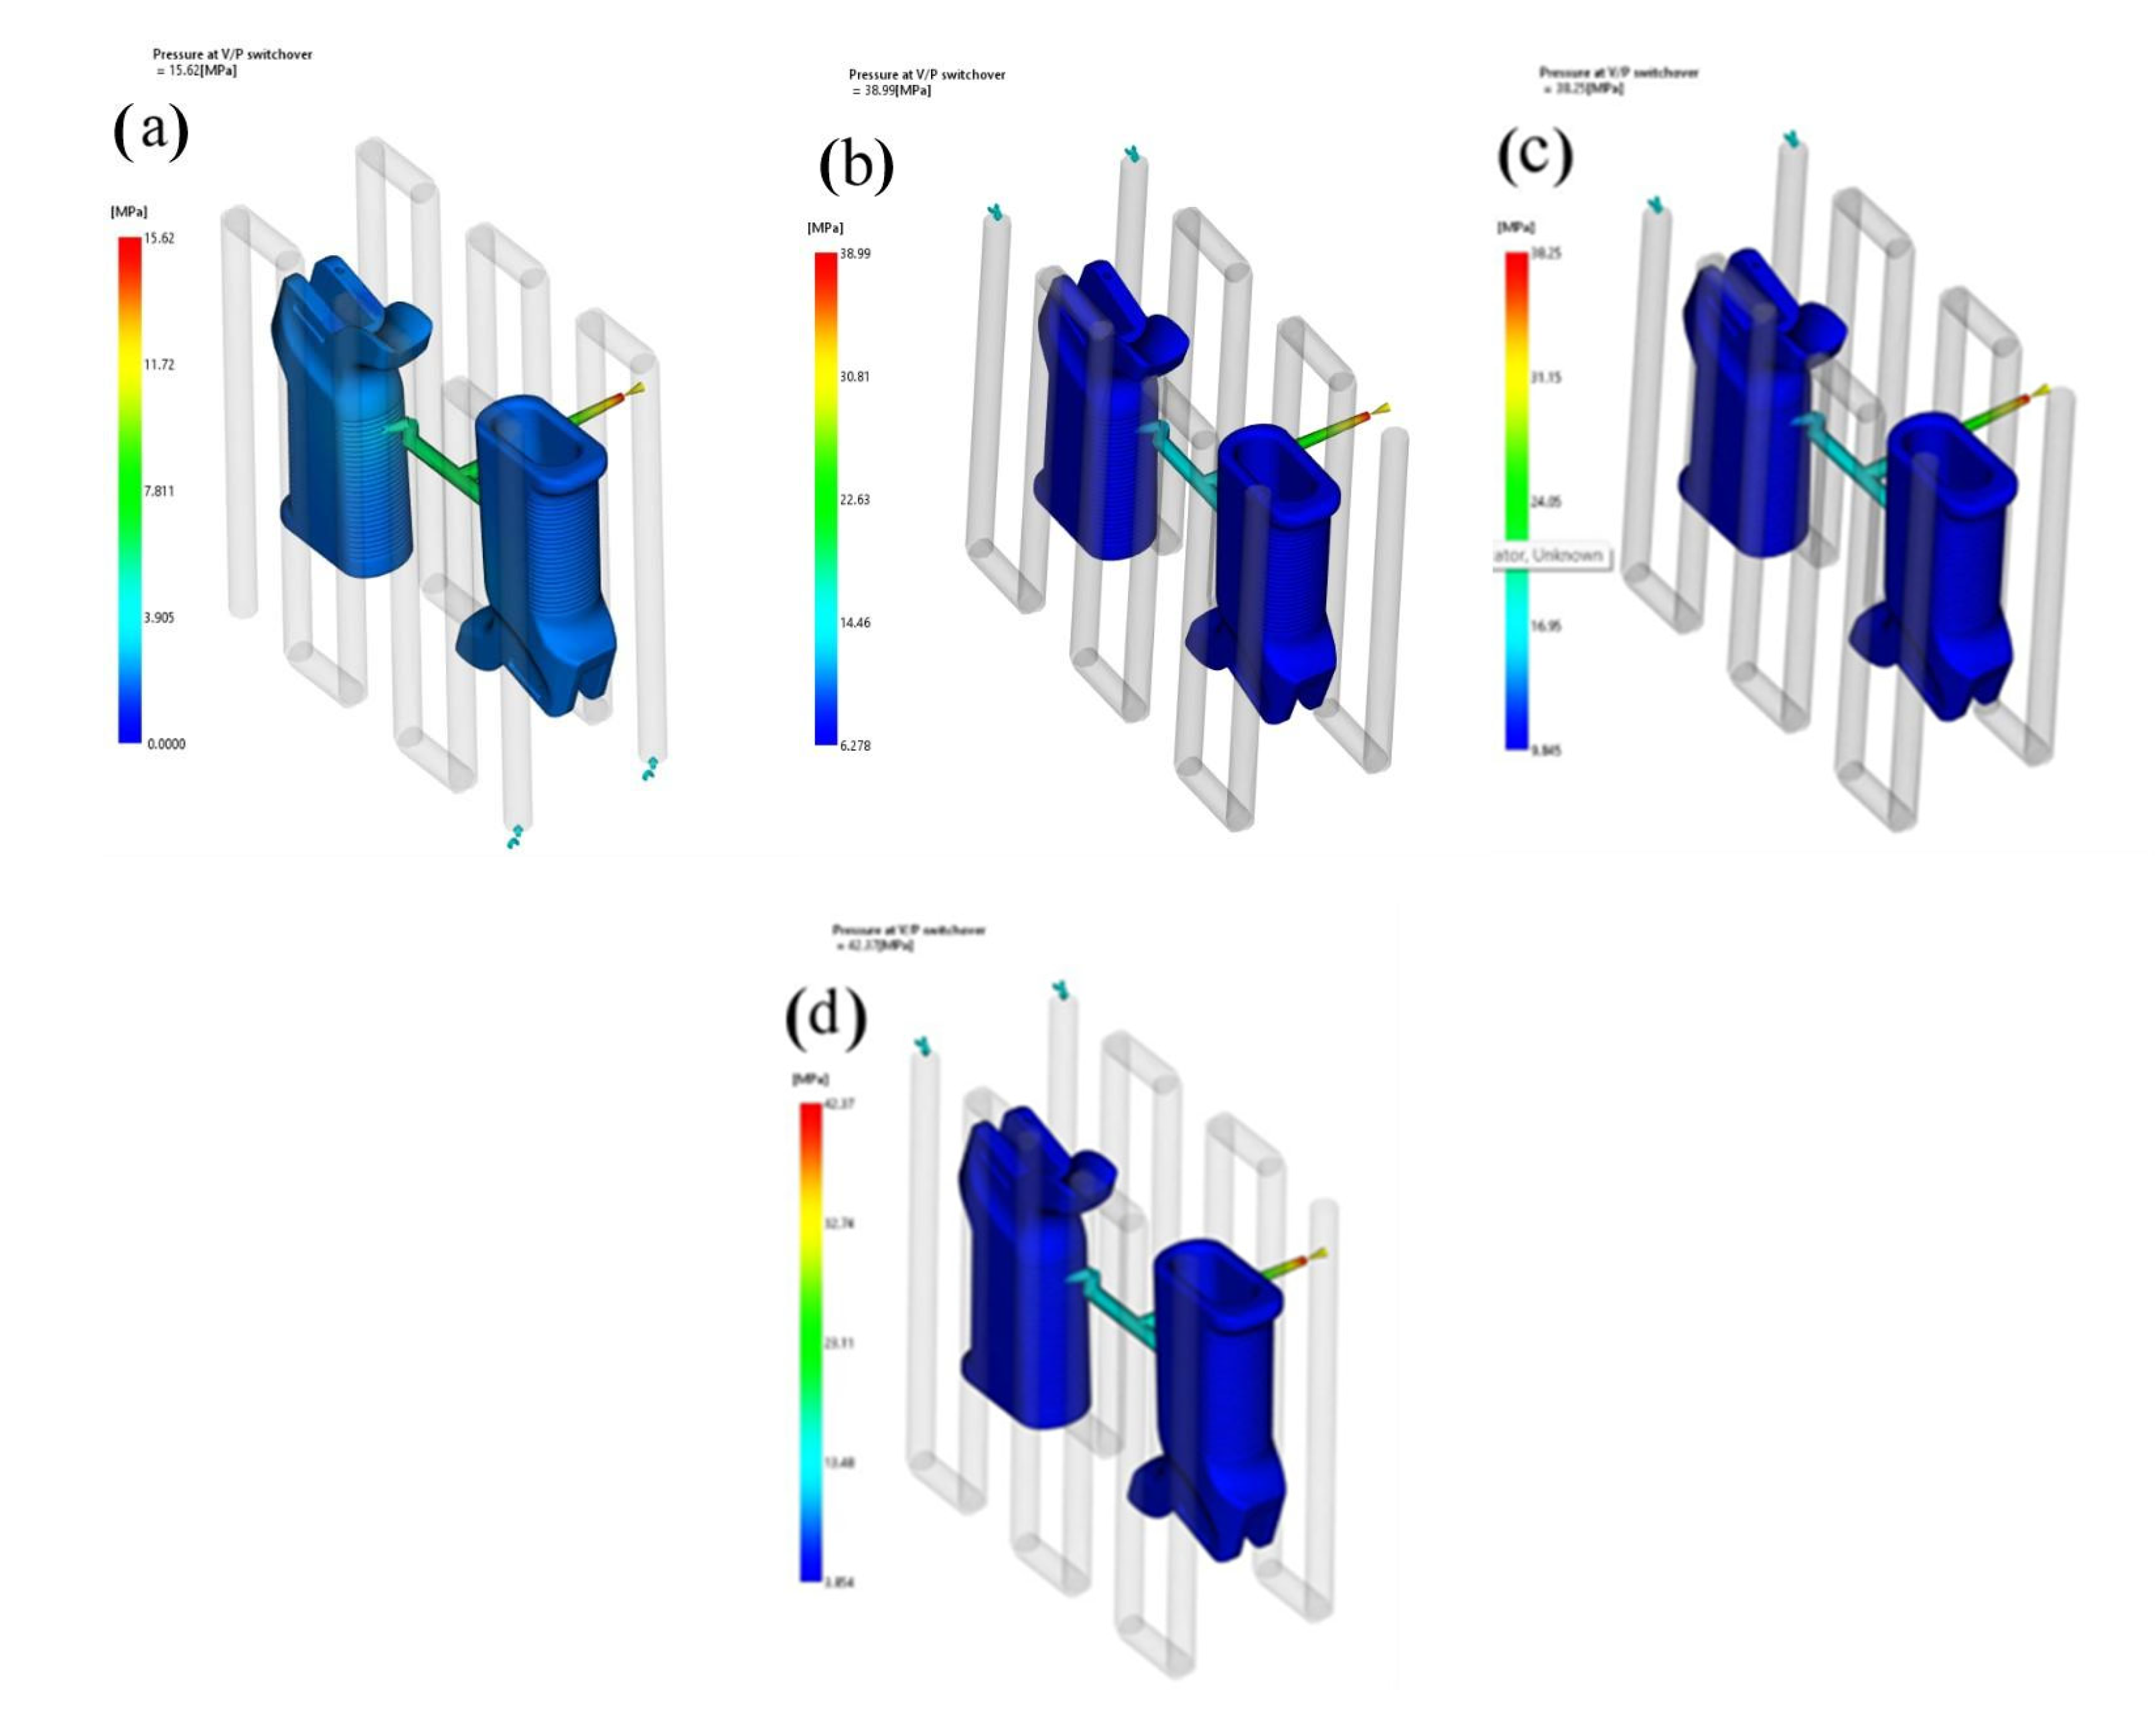
3.2. Flow Behavior and Pressure Characteristics
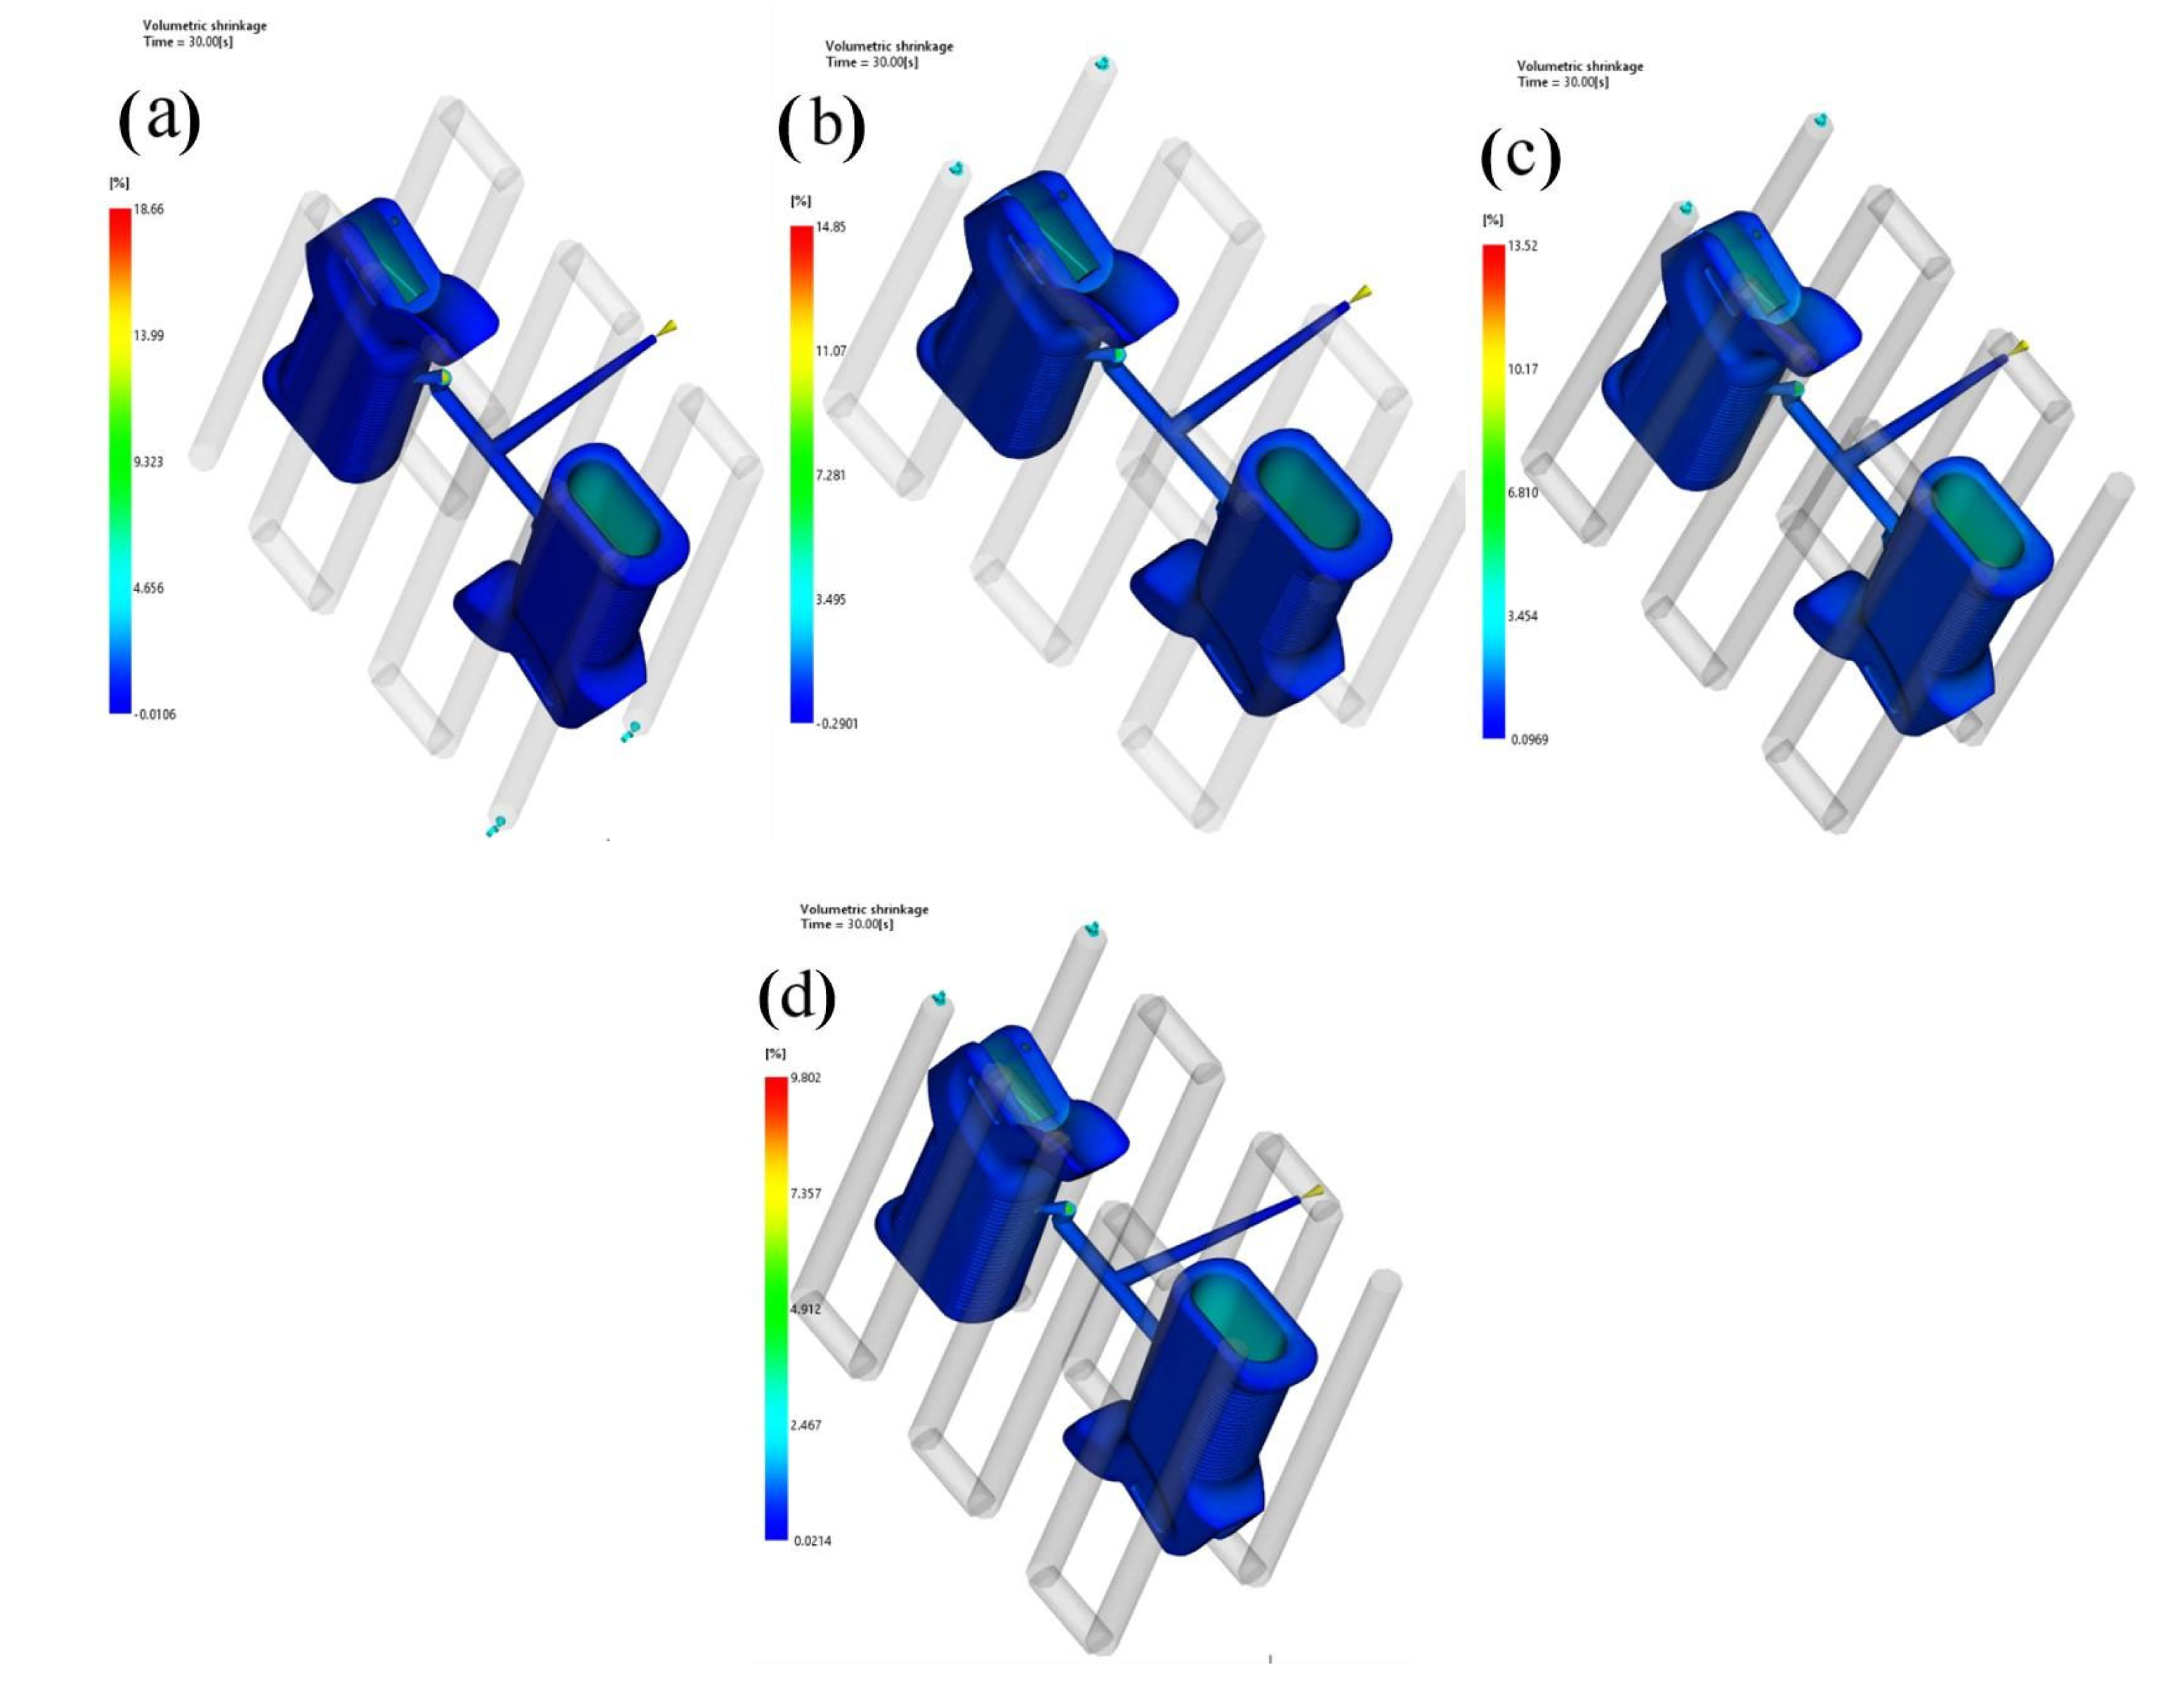
3.3. Volumetric Shrinkage
3.4. Warpage
4. Conclusions
Funding
Institutional Review Board Statement
Data Availability Statement
Conflicts of Interest
Abbreviations
| GF | Glass Fiber |
| PVT CF |
Pressure–Volume–Temperature Carbon Fiber |
| CTE | Coefficient of Thermal Expansion |
| IMT | Injection Molding Technique |
| IDT | Indirect Tooling |
| V/P | Velocity-to-Pressure (switchover) |
| RMS | Root Mean Square |
| LCI | Life Cycle Inventory |
References
- Budiyantoro, C.; Rochardjo, H. S.; Wicaksono, S. E.; Ad, M. A.; Saputra, I. N.; Alif, R. Impact and Tensile Properties of Injection-Molded Glass Fiber Reinforced Polyamide 6–Processing Temperature and Pressure Optimization. Int. J. of Techn. 2024, 15, 597–607. [Google Scholar] [CrossRef]
- Zhou, S.; Hrymak, A. N. Injection Molding of Polymers & Polymer Composites. Polymers. 2024, 16, 1796. [Google Scholar]
- Angulo, C.; Shackleford, L.; Ning, H.; Pillay, S. Comparative study on the mechanical behaviors of compression molded, additively manufactured, and injection molded recycled carbon fiber reinforced rHDPE composites. Comp. Part B: Engineering. 2024, 275, 111323.
- Herrmann, T.; Niedziela, D.; Salimova, D.; Schweiger, T. Predicting the fiber orientation of injection molded components and the geometry influence with neural networks. J. of Comp. Materials. 2024, 58, 1801–1811. [Google Scholar] [CrossRef]
- Juhász, Z.; Pinke, B.; Gonda, B.; Mészáros, L. Effects of carbon-based nanoparticles on the properties of poly (lactic acid) hybrid composites containing basalt fibers and carbon-based nanoparticles processed by injection molding. Polymer Engineering & Science. 2024, 64, 2491-2500.
- Li, X.; Zuo, Z.; Mi, H. Y.; Zhao, P.; Dong, B.; Liu, C.; Shen, C. High-strength, impact-resistant PP/PTFE composite foam with enhanced surface appearance achieved through mold-opening microcellular injection molding. Polymer. 2024, 311, 127527. [Google Scholar] [CrossRef]
- Wu, H.; Qiu, J.; Zhang, G.; Sakai, E.; Zhao, W.; Tang, J.; Guo, S. Distribution and reinforcement effect of carbon fiber at the interface in injection welding of polyamide 6 composites. Polymer Composites. 2024, 45, 1347–1360. [Google Scholar] [CrossRef]
- Zhan, Z.; Wu, W.; Zhao, J.; Guo, Y.; Su, D.; Ge, Y. A multiscale scheme for homogenization to characterize the flexural performances of injection molded short glass fiber reinforced polyether ether ketone composites. Polymer Composites. 2024, 45, 9501–9516. [Google Scholar] [CrossRef]
- Hirsch, P.; John, M.; Leipold, D.; Henkel, A.; Gipser, S.; Schlimper, R.; Zscheyge, M. Numerical simulation and experimental validation of hybrid injection molded short and continuous fiber-reinforced thermoplastic composites. Polymers. 2021, 13, 3846. [Google Scholar] [CrossRef] [PubMed]
- Karl, T.; Zartmann, J.; Dalpke, S.; Gatti, D.; Frohnapfel, B.; Böhlke, T. Influence of flow–fiber coupling during mold-filling on the stress field in short-fiber reinforced composites. Comput. Mechanics. 2023, 71, 991–1013. [Google Scholar] [CrossRef]
- Dogossy, G.; Morauszki, T.; Ronkay, F. Experimental investigation and applicability of multi-stage simulations in the case of a thick-walled injection-moulded composite. Applied sciences. 2022, 12, 8415. [Google Scholar] [CrossRef]
- Chauhan, V.; Kärki, T.; Varis, J. Process Simulation of Compression Molding Process and Effect of Fiber Content on Recycled Polymer Natural Fiber Composites Using Moldflow Analysis. Intelligent and Transformative Production in Pandemic Times. 2023, 207–212. [Google Scholar]
- Li, X. J.; Zuo, Z. M.; Mi, H. Y.; Dong, B. B.; Antwi-Afari; M. F.; Liu, C. T.; Shen, C. Y. A review of research progress on the minimization of weld lines in injection molding. The Int. J. of Advanced Manuf. Techn. 2024, 132, 5179–5210. [Google Scholar] [CrossRef]
- Mokarizadehhaghighishirazi, M.; Buffel, B.; Lomov, S. V.; Desplentere, F. Investigation of microstructural and mechanical properties of weld lines in injection-molded short glass fiber-reinforced polyamide 6. Polymer Composites. 2024, 45, 8905–8920. [Google Scholar] [CrossRef]
- Mrzljak, S.; Delp, A.; Schlink, A.; Zarges, J. C.; Hülsbusch, D.; Heim, H. P.; Walther, F. Constant temperature approach for the assessment of injection molding parameter influence on the fatigue behavior of short glass fiber reinforced polyamide 6. Polymers. 2021, 13, 1569. [Google Scholar] [CrossRef] [PubMed]
- Rochardjo, H. S.; Budiyantoro, C. Manufacturing and analysis of overmolded hybrid fiber polyamide 6 composite. Polymers. 2021, 13, 3820. [Google Scholar] [CrossRef]
- Uyen, T. M. T.; Nguyen, H. T.; Nguyen, V. T.; Minh, P. S.; Do, T. T.; Nguyen, V. T. T. Optimizing the Tensile Strength of Weld Lines in Glass Fiber Composite Injection Molding. Materials. 2024, 17, 3428. [Google Scholar] [CrossRef]
- Nguyen, D. T.; Yu, E., Barry, C.; Chen, W. T. Energy consumption variability in life cycle assessments of injection molding processes: A critical review and future outlooks. J. of Cleaner Production. 2024, 142229.
- Zhao, N. Y.; Liu, J. F.; Su, M. Y.; Xu, Z. B. Measurement techniques in injection molding: A comprehensive review of machine status detection, molten resin flow state characterization, and component quality adjustment. Measurement. 2024, 226, 114163. [Google Scholar] [CrossRef]
- Dağlı, M.; Demirer, A.; Yumat, E. Effect of glass fiber reinforcement on compressive flexibility and dimensional stability in injection-molded polypropylene composite locking ring. Pamukkale Üniversitesi Mühendislik Bilimleri Dergisi. 2025, 22866.
- Liu, D.; Liu, S.; Zhang, S.; Evsyukov, S. A.; Luo, X. Study on the interfacial bonding mechanism of nano-injection molding PPS/PA6@ Al: A molecular dynamics simulation study. Polymer Engineering & Science. 2025, 65, 1055-1069.
- eneziani, M. Composite Injection Molding. 2025, 14, 22-45.
- Karthikeyan, M. K. V.; Kamaraj, L.; Kavipriya, S.; Rathinavelu, V.; Sadagopan, D. K.; Soudagar, M. E. M.; Manickaraj, P. Investigation and chemical processing effect of sisal fiber epoxy composite characteristic enhancement with nano-SiC via injection mold. The Int. J. of Advanced Manuf. Techn. 2024, 132, 2209–2216. [Google Scholar] [CrossRef]
- Zhao, N. Y.; Lian, J. Y.; Wang, P. F.; Xu, Z. B. Recent progress in minimizing the warpage and shrinkage deformations by the optimization of process parameters in plastic injection molding: A review. The Int. J. of Advanced Manuf. Technology. 2022, 120, 85–101. [Google Scholar] [CrossRef]
- Guerra, N. B.; Reis, T. M.; Scopel, T.; de Lima, M. S.; Figueroa, C. A.; Michels, A. F. Influence of process parameters and post-molding condition on shrinkage and warpage of injection-molded plastic parts with complex geometry. The Int. J. of Advanced Manuf. Techn. 2023, 128, 479–490. [Google Scholar] [CrossRef]
- Wilczyński, K.; Wilczyński, K. J.; Buziak, K. Modeling and experimental studies on polymer melting and flow in injection molding. Polymers. 2022, 14, 2106. [Google Scholar] [CrossRef]
- Dekel, Z.; Kenig, S. Micro-injection molding of polymer nanocomposites composition-process-properties relationship. Int. Polymer Processing. 2021, 36, 276–286. [Google Scholar] [CrossRef]
- Baum, M.; Anders, D.; Reinicke, T. Approaches for numerical modeling and simulation of the filling phase in injection molding: A Review. Polymers. 2023, 15, 4220. [Google Scholar] [CrossRef]
- Wang, J.; Mao, Q.; Jiang, N.; Chen, J. Effects of injection molding parameters on properties of insert-injection molded polypropylene single-polymer composites. Polymers. 2021, 14, 23. [Google Scholar] [CrossRef]
- Kuo, C. C.; Qiu, S. X.; Lee, G. Y.; Zhou, J.; He, H. Q. Characterizations of polymer injection molding tools with conformal cooling channels fabricated by direct and indirect rapid tooling technologies. The Int. J. of Advanced Manuf. Techn. 2021, 117, 343–360. [Google Scholar] [CrossRef]
- Fu, H.; Xu, H.; Liu, Y.; Yang, Z.; Kormakov, S.; Wu, D.; Sun, J. Overview of injection molding technology for processing polymers and their composites. ES Materials & Manufacturing. 2020, 8, 3-23.
- Li, K.; Yan, S.; Zhong, Y.; Pan, W.; Zhao, G. Multi-objective optimization of the fiber-reinforced composite injection molding process using Taguchi method, RSM and NSGA-II. Sim. Model practice & theory. 2019, 91, 69-82.
- Amjadi, M.; Fatemi, A. A fatigue damage model for life prediction of injection molded short glass fiber reinforced thermoplastic composites. Polymers. 2021, 13, 2250. [Google Scholar] [CrossRef] [PubMed]
- Lee, J.; Lee, H.; Kim, N. Fiber orientation and strain rate-dependent tensile and compressive behavior of injection molded polyamide-6 reinforced with 20% short carbon fiber. Polymers. 2023, 15, 738. [Google Scholar] [CrossRef]
- Ucpinar Durmaz, B.; Artykbaeva, E.; Aytac, A. Fabrication and performance of short glass fiber reinforced polyamide composites. Int. J. of Polymer Analysis and Charact. 2024, 29, 589–601. [Google Scholar] [CrossRef]
- Artykbaeva, E.; Ucpinar Durmaz, B.; Aksoy, P.; Aytac, A. Investigation of the properties of PA6/PA610 blends and glass fiber reinforced PA6/PA610 composites. Polymer Composites. 2022, 43, 7514–7525. [Google Scholar] [CrossRef]
- Wu, H.; Qiu, J.; Zhang, G.; Sakai, E.; Zhao, W.; Tang, J.; Guo, S. Distribution and reinforcement effect of carbon fiber at the interface in injection welding of polyamide 6 composites. Polymer Composites. 2024, 45, 1347–1360. [Google Scholar] [CrossRef]
- Tan, F.; Birişik, B. Optimization of material and process parameters in the injection molding of piezoresistive card-type pressure sensors using the finite element method. Journal of Scientific Reports-A. 2025, 61, 100-115.
- Tan, F.; Alkan A. Effect of Cooling Parameters on In-Mold Flow Behavior in the Microinjection Molding of Piezoelectric Pumps. Int. J. of Autom. Science & Techn. 2024, 8, 467-475.
- Tan, F. Experimental Investigation of Mechanical Properties for Injection Molded PA66+PA6I/6T Composite Using RSM and Grey Wolf Optimization. El-Cezeri. 2020, 7, 835-847.
- Tan, F.; Alkan, A. Numerıcal investigation of thermal and structural behavior in injection-molded femur implants. Kahramanmaras Sutcu Imam Un. J. of Eng. Sciences. 2025, 28, 1007–1019. [Google Scholar] [CrossRef]

| DSM Japan Engineering Plastics | Novamid 1015G | Novamid 1015G15 | Novamid 1015G30 | Novamid 1015G45 |
|---|---|---|---|---|
| Glass Fiber Ratio (%) | 0 | 15 | 30 | 45 |
| Elasticity Modulus (MPa) | 2910 | 5390.1 | 8802.75 | 12750.1 |
| Poisson Ratio (υ) | 0.386 | 0.4032 | 0.4057 | 0.4002 |
| Shear Modulus (MPa) | 1050 | 1554.91 | 2288.73 | 3189.61 |
| Melt Density (g/cm3 ) | 0.89912 | 1.0576 | 1.2035 | 1.3511 |
| Thermal Expansion Coefficient (1/C) | 8.15e-005 | 4.524e-005 | 2.758e-005 | 1.885e-005 |
Disclaimer/Publisher’s Note: The statements, opinions and data contained in all publications are solely those of the individual author(s) and contributor(s) and not of MDPI and/or the editor(s). MDPI and/or the editor(s) disclaim responsibility for any injury to people or property resulting from any ideas, methods, instructions or products referred to in the content. |
© 2025 by the authors. Licensee MDPI, Basel, Switzerland. This article is an open access article distributed under the terms and conditions of the Creative Commons Attribution (CC BY) license (http://creativecommons.org/licenses/by/4.0/).


