
Submitted:
21 August 2025
Posted:
22 August 2025
You are already at the latest version
Abstract
Emerging pandemics and peak infection periods can overwhelm healthcare systems, especially under limited resource availability such as hospital beds, ventilators, and ICU capacity. This strain may lead to elevated mortality rates and increased healthcare costs. In this paper, we present a novel optimization-based framework that dynamically schedules hospital beds to minimize total healthcare costs, primarily composed of patient rejection costs and associated logistical expenses, while operating under strict resource constraints. Our model accounts for multiple sources of bed supply, including standard hospital beds, in-situ hospital beds, and buffer beds, and incorporates flexible resource sharing to better accommodate patient demand. Recognizing the computational complexity of the resulting optimization model, we propose a reformulation that significantly reduces run-time. We also analyze key structural properties and derive optimal solutions under specific conditions. To account for demand uncertainty, we extend the framework by integrating an SEIRD model to simulate patient demand in future pandemics and to inform proactive bed scheduling. To evaluate the practical utility of our approach, we conduct a case study based on the COVID-19 pandemic in the Northern Virginia (NOVA) region. Our results demonstrate that the proposed framework can reduce total healthcare costs by more than 55%, highlighting its potential in guiding resource allocation and preparedness strategies during health crises.
Keywords:
pandemic
; bed-capacity
; patient admission
; resource sharing
; dynamic optimization
; scheduling
1. Introduction and Motivation
The COVID-19 pandemic exposed the fragility of hospital capacity under prolonged public health emergencies. In many countries, surging infections quickly overwhelmed intensive care units (ICUs) and medical wards, forcing healthcare systems to operate in crisis mode. At the peak on April 12, 2020, for example, over 18,800 hospital beds in England were occupied by COVID-19 patients [1]. Similar scenarios played out globally, with hospitals struggling to provide care for both COVID-19 and non-COVID patients [1]. When demand exceeds supply, healthcare providers face important decisions: how to allocate scarce beds, ventilators, and staff to save the most lives. Some regions resorted to formal triage policies and ethical guidelines to prioritize patients for critical care, aiming to maximize survival and social wellbeing under resource constraints [2]. In practical terms, this meant that access to care could not be guaranteed for all; many hospitals were forced to reject patients or delay treatment for those with lower survival probability, a costly outcome in both human and economic terms. The need to minimize patient rejections while managing limited resources has become a paramount operational challenge in pandemic response.
To avert worst-case outcomes, health systems worldwide implemented extraordinary measures to expand capacity and streamline patient flows. Elective surgeries were canceled all together to free up beds, and dozens of field hospitals (“in-situ" hospitals) were erected in convention centers, sports arenas, and other large venues to absorb overflow demand [1]. For instance, the UK’s National Health Service rapidly established Nightingale hospitals, and U.S. cities converted conference centers into COVID-19 wards. These steps, combined with procuring emergency equipment and redeploying staff, were critical to enhance surge capacity [1]. At the same time, policymakers recognized that better coordination across healthcare facilities could greatly improve system resilience. Rather than letting each hospital operate in isolation, some regions set up centralized coordination centers to balance loads and facilitate inter-hospital transfers. For example, the state of Minnesota established a Medical Operations Coordination Center to redistribute ICU patients across hospitals with available beds [3]. This kind of collaboration of effectively sharing resources and patients, can ensure that a critically ill patient turned away from one overfilled hospital can be transferred to another facility with capacity. Indeed, such load-balancing mechanisms proved essential for preserving critical care access during peak surges [3]. Without them, many beds in less affected areas might remain idle while patients in hot spots are denied care.
In this paper, we develop an integrated optimization framework for dynamic hospital bed allocation in a pandemic. At its core, our approach is a multi-period, multi-hospital resource allocation model that minimizes total healthcare costs under capacity constraints. A central feature is that the objective function attaches a heavy penalty to unmet demand, where essentially, a cost of patient rejection, reflecting the severe health and societal consequences of turning away sick patients. By internalizing this penalty, the model actively strives to avoid scenarios in which patients in need are denied access to beds. Meanwhile, the model also accounts for operational costs of care (for regular and ICU beds in both standard hospitals and field hospitals) as well as logistical costs for moving patients. The proposed framework empowers a coordinated, system-level strategy: a healthcare agency makes strategic decisions on how many patients to allocate to each hospital or pop-up facility, and then hospitals make operational decisions on how to redistribute those patients via transfers or supplementary beds.
We incorporate multiple real-world flexibilities which include the use of buffer beds (temporarily repurposed non-pandemic beds), the opening of in-situ field hospitals to boost capacity, and the option to transfer patients between hospitals and field units. By optimally timing and sizing these interventions, the model can expand effective capacity where it’s most needed, alleviating bottlenecks at overwhelmed sites. Notably, we formulate the patient transfer network with a novel flow-based representation that aggregates inter-hospital transfers through a dummy exchange node. This reformulation is mathematically equivalent to modeling every pairwise transfer, but it dramatically reduces computational complexity. In fact, it cuts the number of decision variables and constraints by an order of magnitude, yielding over a 90% reduction in solution time for large-scale instances. Such tractability is important for practical use, as a regional health authority might be coordinating dozens of hospitals over many weeks, which represents a problem size intractable for a naive formulation.
Another distinctive aspect of our approach is the integration of epidemic dynamics and robust optimization into the resource planning process. We link our allocation model with a compartmental SEIRD (Susceptible–Exposed–Infected–Recovered–Deceased) model to forecast the trajectory of infections and hospitalizations over the planning horizon. This provides a data-driven estimate of the time-varying demand for hospital beds, stratified by patient severity (e.g. mild vs. severe cases). However, rather than taking these forecasts at face value, we acknowledge the considerable uncertainty in pandemic demand. We therefore formulate a robust optimization variant of the model that hedges against worse-than-expected infection scenarios. In the robust model, the demand in each period is allowed to vary within an uncertainty set (e.g. a confidence interval around the SEIRD prediction), and we seek a solution that minimizes the worst-case total cost. This yields a hedging strategy that may deliberately hold extra surge capacity or preemptively distribute patients more conservatively, in order to cushion the impact of a potential demand spike. Importantly, we prove that this robust planning problem can be solved just as efficiently as the deterministic case, essentially by solving a variant of the model with demand set to its upper-bound scenario. In summary, our framework combines predictive modeling (epidemic forecasts) with prescriptive analytics (optimization under uncertainty), enabling policymakers to anticipate demand surges and allocate resources proactively rather than reactively.
We demonstrate the effectiveness of the proposed approach through both theoretical insights and a detailed case study. First, we derive analytical structural properties of the optimal policy in certain regimes. For instance, when patient demand persistently exceeds total capacity, we show that an optimal strategy will utilize all available resources to the fullest, where all hospitals and field units will operate at maximum capacity (including using every buffer bed), as any idle capacity would incur unnecessary shortage costs. Conversely, if overall demand never exceeds supply, the model naturally prioritizes the lowest-cost resources: hospitals are ranked by their per-patient operating cost, and the optimal solution is to fill cheaper hospital beds first (while still ensuring all demand is met), activating higher-cost facilities like field hospitals only if needed. These intuitive yet non-trivial properties provide reassurance about the model’s behavior and offer guidance for decision-makers (e.g., when to trigger the opening of an in-situ hospital or how to distribute buffer beds across hospitals in a worst-case surge). We next apply our model to a real-world scenario based on Northern Virginia (NOVA) during the late-2021 COVID surge. This region experienced a severe capacity crunch, in particular, hospitalizations jumped by over 1000% within two months [4], pushing emergency rooms to their limits, and authorities identified several sites (conference centers, a university arena, etc.) for potential field hospitals. Using data on NOVA’s hospital network, COVID infection rates, and available surge facilities, we compare the performance of our optimized scheduling policy against the current practice. The results show striking improvements: our model reduces total healthcare costs by more than 50% compared to current practice, primarily by sharply cutting the number of patients who must be turned away.
In the optimized solution, virtually no COVID-19 patients with severe symptoms are denied a hospital bed, whereas under the decentralized reactive approach, hundreds of such patients would go untreated at the peak of the wave. This outcome is achieved by a timely reconfiguration of capacity, where the model advises, for example, opening a large field hospital in anticipation of the surge and judiciously using available buffer beds in urban hospitals, as well as a more selective admission policy for mild cases when critical care space is running low. Interestingly, we find that explicit coordination via patient transfers plays a complementary role: by reallocating patients from overcrowded hospitals to those with spare capacity, the system avoids unnecessary bottlenecks and improves overall utilization. Our case study also evaluates the robust optimization strategy under stochastic demand scenarios. Even if the future unfolds worse than the average forecast, the robust plan maintains superior performance, reducing worst-case costs by 39% relative to a non-robust (average-based) plan and markedly limiting the variability of outcomes. In practical terms, this means greater assurance that the health system can withstand surprise surges without resorting to crisis standards of care. These findings underscore the value of proactive, model-driven planning in pandemic management. That is, by integrating epidemiological insight, system-wide coordination, and flexible capacity deployment, our models shows significant gains in efficiency, equity, and resilience.
The contributions of this work are therefore both methodological and practical. We introduce a novel optimization model for pandemic bed management that captures the key complexities of the problem, including multi-tier decision-making, resource sharing, and uncertainty, in a tractable formulation. We provide an equivalent reformulation and analysis that make it feasible to solve large regional instances and to derive clear policy rules. Finally, we translate the model’s prescriptions into real-world impact through a case study, offering evidence-based guidance for health planners. While motivated by COVID-19, our framework is generalizable to future health crises, whether another infectious disease outbreak or any scenario causing a sudden mismatch between patient demand and hospital supply. The proposed approach minimizes the human and economic costs of such mismatches, which can help health systems ensure access to care even in the face of unprecedented surges, avoiding the tragic consequences of uncoordinated or insufficient responses.
The remainder of the paper is organized as follows. In Section 2 we present a comprehensive literature review on the problem of bed scheduling during pandemics. In Section 3 we define the model, notation, optimization problem, proposed equivalent reformulation, structural properties, a robust optimization extension, and patient demand forecasting using an SEIR model.In Section 4, we demonstrate the effectiveness of our framework through a case study based on the COVID-19 outbreak during 2021–2022. Finally, in Section 5 we conclude and propose future directions.
2. Literature Review
The challenge of scheduling hospital beds and optimizing resource management during periods of high demand, such as pandemics, has been extensively explored in the literature. To provide a structured overview, we categorize the relevant research into two main streams. The first focuses on the optimal allocation of hospital beds and ICUs for both pandemic and non-pandemic patients. The second on the other hand, examines broader resource management strategies and resource sharing opportunities during pandemics to improve overall efficiency of the healthcare system.
Allocating pandemic and non-pandemic beds and accepting patients is crucial to reducing healthcare costs. [5] highlights the importance of bed management during the COVID-19 pandemic by employing a data analysis-based model in which the authors studied impactful factors such as length of hospital stay and waiting time. [6] designed a machine learning model to predict such metrics. Specifically, the authors focused on predicting patient in- and out-flow and patient and patient stay time in hospitals during a pandemic. The reported accuracy was 80%. Patient stay time was also estimated using time-series models (e.g., [7,8]). While predictive models can help in assisting bed placement decisions by estimating patient demand. They are not solely enough and need to be accompanied by prescriptive models, which we focus on in this paper, that accordingly allocate hospital beds and ICUs. Between the two (predictive and prescriptive) approaches, assessment schemes, based on discrete-event simulation and scenario analysis, that evaluates the impact of hospital resource allocation strategies on pandemic and non-pandemic patients, were developed (e.g., [9,10]). Optimization-based studies were dedicated to design optimal bed assignment and patient admission controls that consider other factors (e.g., elective and emergent pandemic cases). For example, [11] proposed an MDP formulation to study the problem of optimally admitting arriving patients to ICUs where ICU patients need to be assigned to non-pandemic beds. The authors studied this problem in a single hospital setting. [12] developed a dynamic programming (DP) approach that maximizes the admission of COVID patients while reducing the backlog on non-COVID patients under scarcity of hospital resources. The authors integrate patient health conditions in the decision making process. Similarly, [13] proposed a mixed-linear integer programming to determine optimal schedules of operating rooms during pandemics under patient demand uncertainty. [14] examined the design of a dynamic invitation policy for proactive service systems with limited capacity and finite customer patience. In a similar fashion, [15] developed an optimization model for early disposition actions to generate surge capacity in hospitals. [16] expanded on the previous work, and proposed a DP approach that combines optimal admissions of three classes of patients: COVID-19, emergency, and elective-care patients. Their results suggest that transferring elective patients to private hospitals could be an effective strategy to alleviate overcrowding in public hospitals. Multi-hospital setting was also considered by [17,18]. A key limitation of the aforementioned studies is the assumption that healthcare entities and hospitals operate independently, without coordination. This also implies that strategic-level patient admission decisions made by healthcare agencies cannot be redistributed and reallocated within the system, overlooking significant opportunities for flexibility and capacity expansion.
Another stream of literature which is highly relevant to our problem, is the resource utilization and resource sharing in a pandemic. Several studies have been devoted to such a study, particularly in the context of vaccine, treatment, testing-kit, ventilators, and bed allocation. For instance, [19,20,21] investigate vaccine distribution strategies under supply constraints by embedding an SIR model into an optimization framework. Similarly, [22,23] develop a logistics-based approach for treatment allocation, formulating the problem as a nonlinear mixed-integer program to determine optimal allocations. [24] designed screening strategies to efficiently reduce the number of infections. Their model can be utilized as a planning tool for allocating testing-kits in specific areas. Beyond vaccines, treatments, and testing kits, broader resource allocation frameworks have been proposed. [25] introduce a comprehensive model that considers multiple resource types, including facility size, location, staffing, and transportation. Meanwhile, the allocation of critical medical equipment has also been explored extensively. [26] focus on ventilator distribution during the COVID-19 pandemic, while [27] leverage predictive and prescriptive modeling to optimize ventilator allocation through demand forecasting. For a broader perspective on resource allocation challenges during pandemics, readers may refer to the extensive review by [28] and the references therein. Demand-supply matching was also considered in the literature, using frameworks that integrate demand forecasting using compartmental models and supply of hospital beds. For example, [23,29,30] consider similar frameworks that integrate a scheduling-based optimization problem within a predictive model for forecasting the patient demand and allocating hospital beds. While these frameworks, are deemed closest to our work, they assume that strategic level decisions, i.e., decisions made by healthcare agencies cannot be redistributed in a way that minimizes total cost. This disregards the flexibility of redistributing patients and sharing resources when needed (see, e.g., [31,32,33,34]). To the best of our knowledge, the problem of optimally matching patient demand and bed supply during pandemics, while integrating multiple critical factors has not been fully addressed in the literature. These factors include multiple pandemic response options such as patient prioritization, bed sharing, patient transfers, allocation and redistribution strategies, the use of non-pandemic beds, and the opportunity of opening and operating in-situ hospitals as opportunities for capacity expansion. What further distinguishes our model is its integration of demand forecasts, generated via compartmental models, into a robust optimization framework designed to produce immune solutions that minimize worst-case total healthcare costs.
3. Model Development
In this section, we develop an optimization-based framework for dynamically allocating hospital beds during an emerging pandemic, aiming to minimize total healthcare costs and alleviate strain on hospital capacity.
Consider an emerging pandemic in a population of size N in which the number of infections at time is denoted by , where is the considered time horizon. Infected individuals exhibit varying levels of symptom severity, denoted by , where represents the set of severity levels of symptoms ranging from mild to severe cases. As such, we write
In many instances, both mild and severe cases may require hospitalization. For example, individuals with compromised health, such as the elderly or those with pre-existing respiratory conditions (e.g., asthma, bronchiectasis, or chronic obstructive pulmonary disease) can experience worsening symptoms even from mild infections, thereby increasing their risk of hospitalization [35]. To that end, we define the hospitalization demand of subjects having symptom severity level i at time t, as defined as
Surges in can cause shortages in hospital beds and hence can result in catastrophic healthcare costs. This highlights the urgent need for a well-structured scheduling plan to accommodate the resulting high demand. In what follows, we introduce a multi-period bed scheduling model designed to manage and accommodate patient surges effectively.
In this paper, we consider a two-stage decision making process. The first is strategic and aims to allocate the patient demand over the system supply of hospital beds. Such decisions are often made by healthcare agencies who are in charge of tracking numbers of infections and the bed utilization. These decision variables are denoted by and which define the initial number of patients allocated to a hospital and to an in-situ hospital . To that end, we denote by as the shortage variable for patients of type at time t which can be written as
We denote by as the cost of a shortage, i.e., the cost of rejecting a patient who is in need of hospitalization. This cost is often high and might in many cases dominate all other logistical costs. Decisions must be adjusted accordingly to reduce shortages. Later, in Section 3.2, we present theoretical results on this end. Next, we outline the second level of decision-making within the system, which focuses on efficiently redistributing allocated patients to minimize logistical costs.
We define the set as the set of hospitals, where for every hospital , the associated bed capacity is denoted by . We track the bed utilization for a hospital p at time t using the state variable , and associate it with , which represents the cost of treating a patient. This cost may include expenses related to ICU units, ventilators, serum injections, staffing, operating costs, and other factors. In addition, in this paper we consider that there exists a buffer of beds denoted as B. These beds are often borrowed from beds which are non-pandemic dedicated, i.e., beds for patients with other diseases. This means that B can be allocated to hospitals to boost their bed capacity. This can be modeled as follows,
where is a decision variable that denotes the number of buffer beds allocated to hospital p at time t. Furthermore, in this paper we allow for opening and operating in-situ hospitals. As such, we define the as the set of locations at which in-situ hospitals can be opened and operated. Similar to hospitals, an in-situ hospital has a capacity and a state variable that tracks the bed utilization and denoted as . The cost of treating and accommodating a patient in an in-situ hospital is denoted as . In addition to the costs for a hospital p, in this case, can also include infrastructure (setup, equipment, utilities, sanitation), operations (security, logistics), and administration (regulatory fees, IT) and is often higher than for a hospital p. The decision of opening and operating an in-situ hospital is denoted as and this is often related to the availability of tents. As such, we have
where O is the available number of tents and is the number of tents that can be fit in an in-situ hospital k.
Each hospital can transfer patients of type i at time t to another hospital or to an opened in-situ hospital , represented by and , respectively. These transfers occur for various reasons, including differences in capacity, technology, staff availability, treatment capabilities, and operating costs. This flexibility in patient transfers helps optimize bed utilization and better accommodate patient demand. This directly means that the following holds,
This basically guarantees that all patients transported from a hospital p cannot exceed the current number of patients . The cost of transporting patients between hospitals p and q and between a hospital p and an in-situ hospital k is indicated by and . In general, these costs are relatively smaller than the other problem costs (e.g., shortage).
With the above discussions, we are now ready to model the dynamics of the problem which is defined by the change in the system state with respect to time. To do this, we track the number of beds occupied in a hospital p and an in-situ hospital k as follows,
where and represent the respective recovery rates of patients in hospital p and in-situ hospital k. Since hospitals vary in their treatment capabilities, recovery rates may differ accordingly.
In Figure 1, we present an illustrative example of the underlying mechanism of the problem at time t for patients of type i. In this example, we consider two hospitals, two in-situ hospitals, and buffer beds. The arcs represent the flow of patients in the system. In summary, policy makers face a patient demand due to a pandemic. This demand is initially distributed, i.e., with the variables , , , and . In turn, hospitals make decisions to redistribute patients and transfer them between each other and to in situ hospitals, that is, with variables , , , , , and in case these in-situ hospitals are opened modeled with and . Finally, buffer beds B can be borrowed form hospitals with variables and .
In this paper, we aim to minimize the total healthcare costs. This includes the cost of shortage which reflects the patient rejection cost, and hospital and in-situ hospital operating costs, and cost of patient transport, which reflects logistical costs. More formally, we write our objective function f as follows,
The first two terms correspond to the total per-patient operating costs for both hospitals and in-situ hospitals. The second two terms are associated with the patient transfer cost. Finally, the last term is the cost of demand shortage. This makes f a multi-criterion objective function. Clearly, there is a trade-off: as logistical expenses increase, the cost of demand shortage decreases and vise-versa. This underscores the need for an optimization-based model, which we present in the next section, to effectively balance this trade-off. We refer readers to Table A1, in Appendix A, for a comprehensive summary of the paper’s notation.
3.1. Multi-period Optimization Problem MBSP
With the aforementioned discussions, we are now ready to present our optimization problem in what follows,
Problem MBSP is a multi-period scheduling problem designed to optimally accommodate patient demand during a pandemic while operating under resource constraints. In our problem we consider different resources, which include, beds capacities of hospitals and in-situ hospitals and , buffer beds B, and tents O. The optimal solution of Problem MBSP provides a complete set of information required to optimally accommodate patient demand. Specifically, at every point in time, healthcare policy agents would like to know how many patients of different severity levels to enter the healthcare system ( and ). Hospitals and in-situ hospitals (if opened and operated ) would track the bed utilization ( and ) and would like to know how many non-pandemic beds should be used () and how many patients can be transferred ( and ). As such, solving this optimization model enables an efficient allocation of these limited resources, ultimately minimizing total healthcare costs. We begin with the following assumptions.
Assumption 1.
Assume that for some .
Suppose that the cost of shortage is 0, that is, for all and . Then in this case, no patients should be hospitalized and no one should enter the system, that is, . Consequently, with the initial state conditions, all decision and state variables are trivially set to 0 which means that . Thus, Assumption 1 enriches the problem and highlights its importance for further study. Next, we turn attentions towards the computational aspects of Problem MBSP.
3.1.1. Computational Aspects of Problem MBSP
The decision variables , , , , , , and should theoretically be integers. However, given that this problem deals with large populations, we can safely relax the integrality constraints of these variables. Practically speaking, this implies that the solutions of the relaxed and integer models are sufficiently close. The major benefit of this is that it can drastically reduce the computational complexity of Problem MBSP. Toward that end in Table 1, we explicitly describe the computational aspects of problem MBSP. Notably, as the problem size grows, the number of decision variables and constraints increases polynomially. To illustrate a realistic scenario, we consider the state of Virginia (VA), USA, and report the size of the largest variable, . The number of hospitals in VA is 99 [36]. As such, if the considered time horizon is 7 days and the count of the severity levels is 3, this means the size of is 205,821, which in turn means that Problem MBSP is computationally expensive to solve. Toward that end, in the next section, we propose a more efficient reformulation that allows us to drastically reduce the computational complexity.
3.1.2. An Equivalent Reformulation of (MBSP)
In this section, we present an equivalent reformulation of Problem MBSP under a mild condition. We then present a theoretical result that demonstrates the equivalency of both optimization models. Then, we present a numerical analysis that shows the computational gains of the newly proposed reformulation. We present our reformulation in what next.
In real-world scenarios, the primary cost associated with transferring patients between hospitals and in-situ facilities is the fixed expense of procuring ambulances, while the actual transportation cost is relatively negligible. Therefore, without loss of generality, the following assumption can be made.
Assumption 2.
Assume that and , where g refers to the fixed cost (e.g., ambulance utilization).
In what follows, we rely on the above assumption to construct an equivalent reformulation of (MBSP). The key motive behind this reformulation is to simplify the associated computational aspects. Towards that end, we start by defining a new node 0 as a dummy node for exchanging patients between hospitals and in-situ hospitals. As such, one can lump the number of patients moving out from a hospital p and transferred to all other hospitals, with a decision variable , and lump the number of patients moving into a hospital p from all other hospitals, with . This allows in writing the following equations,
In a similar fashion, we lump the number of patients moving out from any hospital p to all destination in-situ hospitals, with the decision variable , and the number of patients moving into any in-situ hospital k, with . This can be formally expressed as,
Introducing the dummy node 0, necessitates governing flow-balance constraints between patients moving in and out of node 0. This relation is derived as
where Equality (12) is trivial. As can be seen, Equation (13) guarantees that for each time t the total number of patients exchanged is conserved. The aforementioned definitions allow in introducing our proposed reformulation as follows.
Note that Constraint (13) was further simplified by replacing the equality with an inequality (for more details, the readers are referred to the proof of Proposition 1 in Appendix B). We next present our first result in Proposition 1 which simply states that both optimization problems are equivalent.
Proposition 1.
The main premise in the proposed reformulation is to reduce the problem size and consequently the computational complexity. As such, we present in Figure 2 the % improvement in the runtime (in minutes) of Problem MBSP-Equiv over Problem MBSP. We compare the performance on two crucial parts which are the data processing, i.e., building the optimization model components, and the optimization runtime itself. Eventually, both will be used when the proposed framework is implemented. Gurobi solver version 12.0.0 [37], was considered for solving the optimization models. To that end, we vary, the problem size, measured by the number of hospitals which mainly controls the complexity. As noticed, as the problem size increases, (MBSP-Equiv) offers drastic improvements, ranging between 60% and 98%, in the runtime of both the optimization and the data processing which hence favors it computationally over (MBSP).
3.2. Structural Properties of (MBSP-Equiv)
In this section, we present structural properties of (MBSP-Equiv) which provide additional insights on the optimal solution under some conditions. We begin by assuming that , meaning that all in-situ hospitals can be operated if necessary. This allow us to define and as the respective system demand and supply on hospital beds, at time t, which can be written as follows,
where and represents the available beds, i.e., unoccupied, for a hospital p and inistu hospital k at time t. If the , the healthcare system can accommodate all patients throughout the pandemic, minimizing overall patient rejection costs. Conversely, if , policymakers must address the shortfall by prioritizing hospitalizations based on factors such as patient health status, hospitalization costs, and other relevant considerations. Next, we present a theorem that defines the optimal solution under each case. To simplify the exposure of the mathematical equations in the following theorem, we assume that , which means we can drop the subscript i.
Theorem 1.
Suppose that
If , then the following two results hold:
- If , then the optimal solution satisfy the following,
- If , and if and , for all t, we have the following. Define , as a set of hospitals and in-situ hospitals ranked based on their operating costs. Then the optimal solution satisfy the following1,
Condition (14) in Theorem 1 is not too unrealistic. During peak infection periods, the cost of rejecting a patient in need of hospitalization may outweigh other logistical expenses, as such rejections could result in catastrophic outcomes (e.g., patient death). To that end, the results presented in Theorem 1 are insightful and intuitive: First, when the patient demand exceeds the available hospital bed capacity, the optimal strategy is to maximize bed utilization. This entails fully occupying all hospital and in-situ hospital beds while strategically distributing buffer beds across hospitals to accommodate the excess demand and minimize deaths. Second, when patient demand is lower than the available hospital bed supply, the optimal strategy is to fully accommodate the demand while allocating patients efficiently. This is done greedily, prioritizing hospitals and in-situ facilities with the lowest operating costs first, then progressively utilizing higher-cost options until all demand is met.
3.3. A Robust Reformulation
Healthcare agencies often depend on well-established models to forecast disease progression within a population over time, as these methods have demonstrated reliable predictive accuracy. Among the most widely used are compartmental models such as the SIR model and its various extensions. However, in practice, the actual number of infections can significantly diverge from these predictions. Such discrepancies—particularly underestimations—can lead to serious consequences. When predicted infection rates fall short of actual figures, the healthcare system may face a shortage of allocated pandemic beds. This mismatch can result in patient overflow, denial of critical care, and ultimately, increased healthcare costs. Therefore, robust strategies are essential to mitigate the impact of such uncertainties, ensuring adequate preparedness and minimizing the risk of resource shortages.
To that end, in this section, we extend our formulation by considering that the patient demand is is uncertain. To model uncertainty, we consider a robust approach, which means that we assume that the demand where represents a time-dependent confidence interval, with a lower and upper bounds denoted as and . In this paper, we adopt a robust approach. This means that the corresponding formulation is the same as that of (MBSP-Equiv), however the objective function, now denoted as , can be written as
In what follows, we present a proposition that ensures that solving (MBSP-Equiv) under uncertain demand is equivalent to solving the deterministic counter-part simply by setting to its upper bound for all and .
Proposition 2.
The optimal solution to the robust optimization problem, is the solution to the deterministic counter-part, i.e., (MBSP-Equiv), by setting .
The above proposition simply states that the robust optimization problem has the same computational complexity as the deterministic counter-part. This result, while being simple, its significant as it allows in generating solutions that are robust to demand perturbations.
3.4. Simulating Demand on Hospital Beds
To estimate the potential demand arising from future disease outbreaks, we employ a compartmental SEIRD model—one of the widely accepted frameworks in the epidemiological literature. The SEIRD model partitions a total population of size N into five mutually exclusive compartments: Susceptible (S), Exposed (E), Infected (I), Recovered (R), and Deceased (D). These compartments respectively represent the number of individuals who are vulnerable to infection, have been exposed but are not yet infectious, are currently infected, have recovered and acquired immunity, and have succumbed to the disease, all as functions of time t in a time horizon (see, e.g., [38]). The mathematical model is written as follows
Parameter denotes the rate of exposure to infected individuals. and denote the probability and the rate of incubated individuals turning back to susceptible and to infectious respectively. and denote the rates of recovery and mortality. To better model the disease dynamics, we consider in addition to the basic SEIRD model introduced by [38,39,40], a possibility of reinfections at a rate , in which recovered individuals can-rejoin class S, after loosing immunity which for COVID-19 lasts for up to 4 months [41].
Given the number of infections , the corresponding demand can be derived using equations (1) and (2). However, as discussed in Section 3.3, demand is subject to uncertainty and is assumed to lie within the uncertainty set . In the following, we elaborate on the construction of these uncertainty sets, leveraging the SEIRD model as the underlying epidemiological framework.
To that end, note that one of the most critical parameters in the SEIRD model governing disease transmission—namely, —can be subject to uncertainty. This uncertainty is often driven by variations in population compliance with lockdown measures. Factors such as funeral gatherings, children engaging in outdoor activities, high attendance at schools and universities, and unjustified in-person meetings can all cause the actual interaction rate to deviate significantly from its intended level. This simply means that, varying will result in different realizations of and hence . We define and as follows,
where represents an average transmission rate, which can be estimated using historical data on interaction rates across different time periods. Parameter r on the other hand defines the confidence level in which the mean estimate lies in . In addition, it can also be interpreted as a reflection of the decision-maker’s level of conservatism.
4. Case study: COVID-19 Pandemic and Bed Scheduling in Northern Virginia (NOVA)
4.1. Case study setup
In order to show the effectiveness of our framework, we consider a case study that utilizes the data for COVID-19 outbreak in the NOVA area. By September 2021, hospitals in NOVA were already approaching capacity due to the rise in COVID-19 cases and faced additional strain with the arrival of Afghan refugees. According to the Virginia Hospital and Healthcare Association, hospitalizations increased by 1,008% and new cases rose by 1,217% over a two-month period, resulting in severely overcrowded emergency rooms and widespread staffing shortages across the state [4]. To that end, we consider the weekly number of infections reported by Centers for Disease Control and Prevention (CDC) from Oct 2, 2021 till Feb 26, 2022 in NOVA [42]. Recall that the number of infections is translated into patient demand in our model (using (1) and (2)). In Figure 3 we show the weekly patient demand in NOVA. As noticeable, the demand is split into two categories: mild and severe symptoms, i.e., . Given that CDC reports weekly deaths for a given state, we first extract the weekly deaths in the state of Virginia, and then estimate the weekly infections considering that the mortality probability is 2% [43]. To limit the analysis to the NOVA area, we multiply the weekly infections by 30%2[44]. We then, split the number of infections into mild and severe symptoms using the proportions 80% and 20% (resp.) [45]. From the perspective of our model, the key distinction between subjects experiencing mild versus severe symptoms is that mildly symptomatic individuals require hospitalization with standard care beds, whereas those with severe symptoms necessitate intensive care unit (ICU) support and/or mechanical ventilation.
We now present the data collected on existing hospitals and potential in-situ hospital locations, including their associated costs and bed capacities. Table 2 provides a summary of the bed capacities for the ten major hospitals considered in NOVA.
In March 2020, several sites in Northern Virginia (NOVA) were identified for potential field hospitals to expand medical capacity in response to the anticipated COVID-19 surge. Planned facilities included the National Conference Center (approximately 1,000 beds) in the city of Leesburg, the Dulles Expo Center (at least 500 beds), and George Mason University (at least 500 beds) in the City of Fairfax . Additionally, the Hilton Garden Inn in Neabsco Commons, Woodbridge, was considered for conversion with a potential capacity of 200 beds [56]. We summarize the bed capacity of each of those potential in-situ hospitals in Table 3.
We now explain the estimated per patient weekly costs for hospitals and in-situ hospitals, i.e., and (resp.). The cost of hospitalizing a COVID-19 patient depends on illness severity, treatment needs, and length of stay, with median daily costs estimated at approximately $2,337 in 2020 [57], which means that the weekly cost is simply $16,359. Due to limited cost data, we estimate hospital daily costs by ranking facilities based on their technological advancement and ICU capabilities. Key criteria include level of specialized care, affiliation with advanced health systems (e.g., INOVA), and the scale and sophistication of their ICU infrastructure. The middle listed hospital receives the average cost, i.e., $16,359, where as those with a higher (lower) ranks receive an additional (less) $175 weekly costs in a linear fashion. For the potential in-situ hospitals we consider the same average cost across all in-situ hospitals, which is , Costs are reflected in the last column of Table 2 and Table 3. In addition, we note that the per patient transportation cost is considered to be [58].
The only remaining parameters input to Problem MBSP-Equiv are (i) the recovery rate for all hospitals and in-situ hospitals3 assuming that the days of stay for a patient is 10 days [59]. (ii) The non-pandemic weekly beds which is considered to be4 [60].
4.2. Findings and Design Implications
This section presents the results of our case study analysis for the NOVA region during the COVID-19 pandemic, highlighting both the empirical benefits and operational insights derived from implementing the proposed optimization framework. We evaluate system performance under two distinct strategies: the Current Practice (CP), characterized by reactive and decentralized decision-making5, and the Optimized Model, i.e., following (MBSP-Equiv), which employs anticipatory, system-wide scheduling to proactively manage capacity and demand.
Figure 4 presents the expected healthcare costs across both approaches, decomposed into rejection costs, logistical costs. The bar on the right represents the total system cost, which is the sum of both costs. The optimized framework achieves a substantial reduction in total cost, decreasing from over $2,647 billion under CP to approximately $1,161 billion, representing a savings of more than 56%.
While both approaches face the same underlying demand (Figure 3), the optimized model achieves significantly better outcomes by proactively shaping system behavior. One critical difference lies in how each strategy handles early-stage admissions. CP tends to over-admit mild-symptom patients at the onset of the outbreak, rapidly exhausting bed capacity. This front-loaded saturation forces the system to reject a growing number of severe cases in later weeks, when capacity is most needed. In contrast, the optimization model enforces a carefully calibrated trade-off: it limits mild-case admissions early in order to preserve space for high-acuity patients as demand intensifies. This shift from short-term volume maximization to long-term value optimization enables a more balanced and resilient system response.
To better understand this behavior, Figure 5 shows weekly patient rejections disaggregated by symptom severity. CP admits large volumes of mild cases in early weeks, which contributes directly to the rejection of hundreds of severe patients later in the horizon, particularly during the second week of October, when over 355 severe cases are turned away, compared to zero under the optimized model.
The optimized model, by contrast, maintains zero rejections of severe patients across all weeks. This is made possible by deliberately and consistently rejecting a subset of mild-symptom patients, particularly during periods of emerging surge risk. Importantly, this is not a result of conservative planning or rigid rules. Instead, the model embeds a dynamic triage logic in which admissions are guided by the evolving marginal utility of each bed. Every accepted patient is evaluated not only by immediate need, but by the long-term implications for system capacity. This rational prioritization formalizes the type of decision-making that clinicians often carry out under crisis conditions, but does so consistently and at scale. In doing so, it reduces preventable mortality while preserving critical care capacity when it matters most.
Another noteworthy insight from Figure 5 is that the CP approach tends to admit all patients, largely ignoring the associated logistical costs. Specifically, it admits more patients with mild symptoms compared to the optimal solution. This is because the optimal approach carefully balances the trade-offs between the costs of treating severe and mild cases, as well as the logistical costs. As a result, the optimal solution prioritizes a higher admission rate for severe cases, assigns lower priority to mild cases, and maintains a moderate level of logistical burden.
We now turn our attention to the role of patient transfers in the optimal solution. Given that hospital costs were fixed over the planning horizon (see Table 2), the optimal strategy recommended no patient transfers. This outcome is intuitive: transferring patients between hospitals becomes advantageous only when future hospital costs are lower than current ones. Such cost variability enables reallocation from higher-cost to lower-cost facilities, effectively preserving capacity in the more economical hospitals for future admissions. To further investigate this dynamic, we conducted a numerical experiment in which we generated 1,000 randomized hospital cost profiles that varied over time. The results, presented in Figure 6, illustrate the mean weekly transfer activity across hospitals and in-situ facilities, with shaded bands indicating one standard deviation of variability. Interestingly, the mean transfer activity remains largely stable throughout the planning horizon. This consistency reflects an optimal policy that consistently prioritizes freeing capacity at the largest facility—Inova Fairfax Medical Campus—by transferring patients to smaller hospitals and in-situ sites. Doing so allows the system to expand capacity and accommodate more patients. This behavior underscores a key aspect of the optimization logic: minimizing patient rejection costs is prioritized over logistical and transfer costs.
Taken together, these results highlight several critical design insights. First, surge planning should treat capacity not as a static resource to be filled, but as a dynamic buffer that can absorb uncertainty and mitigate downstream risk. Second, structured prioritization, especially under limited resources, is not only ethically sound but operationally essential. Third, system-wide coordination and resource sharing can dramatically reduce total healthcare costs especially especially when tools like transfers and buffer beds are deployed optimally. Ultimately, the proposed framework offers more than just performance improvements; it provides a replicable strategy for achieving both efficiency and equity under crisis. Rather than treating capacity allocation, patient transfers, and admission decisions as siloed operational problems, the model integrates them into a cohesive and adaptive system-level response. It demonstrates that resilience need not depend on overbuilding or reacting to every surge in real time. Instead, it can be built through forward-looking, well-calibrated resource planning. As healthcare systems continue to face increasing volatility—from pandemics to climate-driven disasters—such frameworks offer both operational clarity and ethical direction. Rather than forcing a trade-off between access and cost, this approach shows how both objectives can be achieved in tandem through thoughtful, anticipatory design.
4.3. Sensitivity Analysis
In this section, we evaluate the impact of key model parameters on the metrics of interest, with a particular focus on the patient rejection rate. Figure 7 illustrates how total patient rejections vary with rejection cost under different levels of bed capacity, represented by the number of in-situ hospitals (left figure) and buffer capacities (right figure).
As the cost of rejecting a patient increases, which is a likely scenario during peak infection periods, the optimization model responds by significantly reducing patient rejections. However, this reduction follows a pattern of diminishing returns: it begins steadily and gradually tapers off. This occurs because the system’s capacity becomes increasingly saturated with both severely and mildly symptomatic patients. Another notable observation is that across all scenarios involving different numbers of in-situ hospitals, the rejection rate initially decreases at the same rate. This trend diverges only beyond a certain cost threshold, at which point each scenario begins to show different degrees of improvement. This behavior is intuitive. When the rejection cost is relatively low, the model prioritizes minimizing logistical costs and thus does not fully utilize the additional capacity. As the cost increases, the model shifts focus toward minimizing rejections and starts to leverage the extra capacity. The most significant improvement occurs after opening the first in-situ hospital. This finding reflects our study design, in which NOVA in-situ hospitals are opened incrementally, starting with the facility offering the highest capacity. The National Conference Center, which provides 1,000 beds, is the first to be activated (see Table 3). The patient rejection rate drops by approximately 33% after this first hospital becomes operational.
A similar trend is observed when analyzing patient rejection under varying numbers of buffer beds, which represent the availability of non-pandemic beds. This aspect of the study is important as it helps healthcare decision-makers assess the necessity of allocating non-pandemic beds during an emerging pandemic. As shown in the right figure, an increase of 2,000 buffer beds results in a reduction of patient rejection cost by approximately 55%.
An important question we aim to explore in the following analysis is how changes in the cost associated with mildly symptomatic patients, which is lower than that of severe cases, affect the overall rejection rates for both mild and severe patients. This is a critical consideration because it is essential to ensure that, regardless of which cost parameter is adjusted, even one as low as the cost for mild cases, the optimization model continues to prioritize reducing patient rejection over minimizing logistical costs. As shown in Figure 8, the rejection rate for severely symptomatic patients remains at its minimal level across all values of the mild symptom cost. This suggests that the model absorbs higher logistical costs rather than compromising care for severe cases. This result is encouraging because it provides reassurance to healthcare agencies that the optimization framework consistently gives precedence to patients with severe symptoms, who contribute most significantly to overall healthcare costs.
4.4. Robust Planning under Uncertain Pandemic Demand
While the baseline optimization model offers significant improvements over current practice, it assumes full knowledge of future patient demand, a condition rarely met during real-world pandemics. In practice, demand forecasts are subject to uncertainty stemming from underreporting, variant emergence, or changes in population behavior. In Section 3.3 and Section 3.4, we introduced a robust counterpart to our model, integrated with a compartmental SEIRD framework. This combination enables the prediction of future demand and, in addition, places it within a bounded uncertainty set. To that end, this section employs a simulation-based scheme to assess how demand uncertainty translates into real-world system outcomes. Specifically, we simulate 5,000 stochastic demand trajectories using the SEIRD model6 and evaluate the realized healthcare costs under three decision strategies: Current Practice (CP), the Average-based model, which optimizes against the average demand scenario, and the Robust model. Figure 9 shows the resulting empirical cost distributions. Several insights emerge. First, both optimization-based strategies significantly outperform CP. The mean cost under CP exceeds $950 billion, while the average-based model lowers this to approximately $474 billion, and the robust model further reduces it to about $286 billion. This implies that robust solutions reduce total costs by around 39% and 70% over CP and average-based solutions. More importantly, the robust model exhibits the most concentrated distribution, with a sharper peak and a very thin tail, indicating a substantial reduction in cost variability. This improved consistency reflects a key strength of the robust approach: it not only reduces average cost, but also limits exposure to extreme scenarios. In contrast, the CP and average-based distributions have heavier right tails, with cost realizations exceeding $1,750 and $1,250 billion in the worst cases (resp.). From a policy perspective, this difference in tail behavior is critical. While the average-based strategy performs well on average, it leaves the system vulnerable to rare but devastating demand spikes. The robust model, by contrast, effectively hedges against such events, delivering tighter control over financial risk and operational reliability. In probabilistic terms, it improves the upper quantiles of the cost distribution, by effectively lowering the system’s value-at-Risk under uncertain conditions.
4.4.1. Policy Recommendation
This section mainly evaluates the trade-offs between the deterministic model and its robust variant, highlighting their relative performance and resilience. It helps healthcare decision-makers to answer the question of using the most relevant policy to be followed in emerging pandemics, under different levels of parameter uncertainty, i.e., different levels of accuracy predictions r.
Figure 10 presents a pairwise comparison between the cost of the robust strategy and the cost of the average-based strategy, across increasing values of r. Each red diamond corresponds to the robust model’s cost under a different r value, with its corresponding average-case cost on the horizontal axis. The blue star represents the deterministic solution with no uncertainty (), where both models coincide.
A key insight from this plot is that the cost of the robust strategy shows minimal variation with respect to r, while still offering substantial protection against adverse realizations. At , for example, the robust model incurs an expected cost of roughly $285 million compared to about $413 million under the average-based model. This difference reflects the classic price of robustness: the robust model intentionally incurs slightly higher cost under average-case or deterministic conditions by allocating conservatively reserving capacity and spreading risk to guard against extreme but plausible demand surges. In other words, this is the premium paid to ensure stable system performance when uncertainty materializes. Importantly, the robustness pays off in worst-case realizations: although the average-based strategy performs well under nominal demand, it incurs a significantly higher cost when actual demand surges to the upper bound of the uncertainty set. This crossover, where planning to the mean becomes more expensive than planning conservatively, marks a critical threshold in robustness. Moreover, as r increases, this divergence becomes more pronounced. At , for example, the robust model incurs a cost of just over $294 million, while the average-based model’s cost in the worst-case demand scenario exceeds $699 million. This widening cost gap underscores the growing penalty of ignoring uncertainty at higher levels of variability. The figure also reveals that all robust solutions remain consistently below the 45-degree line, confirming that for any level of uncertainty, the robust model is always less exposed to tail-risk than its average-based counterpart. This positions robust optimization not merely as a theoretical safeguard, but as a cost-effective strategy for real-world settings where the true demand distribution is uncertain and potentially skewed toward worst-case surges.
Together, these results suggest that the robust model offers a compelling balance between preparedness and efficiency. Although it sacrifices marginal cost in the nominal case, it avoids catastrophic outcomes when demand surges beyond forecasts, a scenario not only plausible but common in pandemic dynamics. The robust strategy effectively pays a premium (price of robustness) up front to limit downside risk, leading to more stable operations and predictable financial exposure. In settings where surge capacity is costly, healthcare access is politically sensitive, and forecasting is imperfect, such a strategy offers considerable practical value.
5. Conclusion and Future Directions
This paper addresses the critical challenge of hospital bed scheduling during a pandemic, aiming to minimize total healthcare costs, including those associated with patient rejection and other logistical costs, under limited resource availability. During peak infection periods, hospital capacities can be overwhelmed, potentially leading to higher mortality rates. As such, effective planning and allocation of scarce resources become vital for ensuring adequate care delivery. To this end, we develop an optimization-based framework that captures key dimensions of the bed scheduling problem. Our model incorporates a three-pronged supply mechanism to enhance bed availability. First, we allow for inter-hospital resource sharing, enabling the transfer of patients between hospitals to alleviate local capacity pressures. Second, we model the expansion of capacity through in-situ or field hospitals, which were widely deployed during recent pandemics. Third, we include a buffer of non-pandemic-designated beds that healthcare agencies may temporarily reallocate for pandemic use. Together, these mechanisms form a comprehensive approach to support more adaptive and resilient bed scheduling during public health emergencies. Furthermore, recognizing the planning nature of the problem, we integrate a predictive component into the optimization framework by leveraging an SEIRD compartmental model to forecast disease progression over a planning horizon. This enables the model to anticipate patient demand based on the projected spread of the infection. However, given the inherent variability in human behavior and interactions during a pandemic, patient demand is often highly uncertain. To address this challenge, we extend our framework to a robust optimization formulation that explicitly accounts for such uncertainties, ensuring that the proposed policies remain effective even under adverse or unpredictable conditions.
Given the computational complexity of our model, we develop an equivalent reformulation that reduces runtime by over 90%, making it significantly more scalable. We further analyze key structural properties of the model, which offer useful insights into optimal bed scheduling strategies under specific conditions. To demonstrate the practical value of our approach, we conduct a case study based on COVID-19 data from the Northern Virginia (NOVA) region. Our results show that the proposed method can reduce total healthcare costs by approximately 55% compared to current practices. Moreover, the analysis highlights how strategic utilization of bed resources can balance the trade-off between patient rejection—particularly for severe cases and logistical costs. The study also underscores the benefits of resource sharing among hospitals, which helps better distribute patient loads. A two-way sensitivity analysis is performed to jointly evaluate the impact of rejection costs and the availability of additional resources (e.g., in-situ hospitals and buffer beds) on patient outcomes. Finally, we present a simulation-based analysis for potential future pandemics, demonstrating that robust solutions consistently outperform average-based strategies by around 39%. These findings support the adoption of robust optimization approaches in pandemic planning, regardless of the specific level of risk aversion.
Several promising future research directions emerge from this work. First, the compartmental model used in this study assumes no interventions such as testing, vaccination, or lockdowns that could mitigate the spread of infection and, in turn, alleviate pressure on the healthcare system. A valuable extension would be to embed such interventions into the decision-making framework, allowing them to be treated as control variables within the optimization process. While this would significantly increase the model’s complexity both in terms of formulation and solution—it presents a rich and impactful area for further exploration. Another important direction is to refine decision-making at the hospital level, particularly in how each facility allocates beds between pandemic and non-pandemic patients. In this context, the buffer capacity, which we currently treat as a fixed parameter, could instead be modeled as a hospital-specific decision variable. This enhancement would introduce greater realism to the model, enabling it to support both detailed operational decisions at the hospital level and broader strategic planning across healthcare agencies.
Author Contributions
M.S.E. collected data, wrote the codes implementing the algorithms, and conducted the case study. M.S.E. and H.H analyzed the results and wrote the paper. All authors reviewed the manuscript.
Funding
This research received no external funding.
Data Availability Statement
The dataset used in this study for the NOVA COVID-19 number of infections is available [42]: https://covid.cdc.gov/COVID-data-tracker/##trends_weeklydeaths_weeklydeathratecrude_51. All other data sources are related to our model parameters and can be found in Section 4.1 in which we provide references from published articles and/or websites.
Conflicts of Interest
The authors declare no conflicts of interest.
Appendix A Paper’s Notation
In Table A1 we present a summary of the paper’s notation.

Table A1.
Summary of paper’s notation
| Sets | Definition |
|---|---|
| set of hospitals | |
| set of in-situ hospitals | |
| set of symptom severity level | |
| time horizon | |
| Parameters | Definition |
| cost of accommodating a patient in hospital p at time t | |
| cost of accommodating a patient in an in-situ hospital k at time t | |
| cost of patient transfer from hospital p to hospital q | |
| cost of patient transfer from hospital p to in situ hospital k | |
| cost of demand shortage of patient of type i at time t | |
| patient demand of type i at time t | |
| B | available buffer beds |
| bed capacity of hospital p | |
| bed capacity of an in-situ hospital k | |
| recovery rate in hospital p | |
| recovery rate in an in-situ hospital k | |
| O | available tents |
| number of tents that can be fit in an in-situ hospital k | |
| N | population size |
| number of susceptible subjects at time t | |
| number of exposed subjects at time t | |
| number of infected subjects at time t | |
| number of recovered subjects at time t | |
| number of deceased subjects at time t | |
| , , and | average, lower, and upper bound values of the transmission rate |
| probability of incubated subjects turning back to S | |
| rate of incubated subjects moving to I | |
| recovery rate | |
| mortality rate | |
| re-infection rate | |
| Decision variables | Definition |
| allocated patients of type i to hospital p at time t | |
| allocated patients of type i to an in-situ hospital k at time t | |
| transferred patients of type i from hospital p to hospital q at time t | |
| transferred patients of type i from hospital p to an in-situ hospital k at time t | |
| number of occupied beds in a hospital p at time t | |
| number of occupied beds in an in-situ hospital k at time t | |
| number of buffer beds borrowed by hospital p at time t | |
| whether or not to open an in-situ hospital k |
Appendix A.1. Parameter Values in the SEIRD Model
Appendix B Mathematical proofs
Proof
(Proof of Proposition 1).
Suppose that Problem MBSP has undergone the following modifications,
- Decision variables , , , and , and their associated non-negativity constraints, introduced in Section 3.1.2, are added.
- The balance constraints defined in (13) are added.
Similarly, suppose that Problem MBSP-Equiv has undergone the following modifications,
- Decision variables , , , and , and their associated non-negativity constraints, are added.
- The balance constraints defined in () are added.
Clearly, the resulting modified versions of the above problems, i.e., (MBSP) and (MBSP-Equiv), are the same given that the following two conditions are satisfied.
- (i) The balance constraints (13) and () are equivalent (with the equality replaced by inequality in ()).
- (ii) The objective functions of the modified problems are the same.
Next, we prove that the above conditions, i.e., (i) and (ii), are satisfied.
(i) We can clearly see this condition follows directly from (11) and (12). However, in (MBSP-Equiv), the equality is replaced by an inequality for the following reason. By having a closer look at the objective function, we observe that its increasing in the state variables and for all , , and . But, is decreasing in and and hence decreasing in which is the left hand side of the inequality. In a similar fashion we can show that, is increasing in and is increasing in , in which is the right hand side of the inequality. This means that the optimal solution dictates that this constraint is tight.
(ii) We prove that this condition is satisfied in what follows. For simplicity, we only deal with the different terms, i.e., the terms related to the cost of exchanging patients, as the remaining terms are exactly the same.
where (A1) and (A2) are the respective objective functions of the modified version of (MBSP) and (MBSP-Equiv).
As such, given that the modifications 1-3, i.e., the additional decision variables and constraints are redundant for the original problem (MBSP), we conclude that the resulting modified versions have the same optimal objective function as . In addition, since the modifications 1-2 applied to (MBSP-Equiv) are also redundant, we have that , thereby completing the proof. □
Proof of Theorem 1
We first start by proving We prove Theorem 1.1 and then we prove we shift attentions to proving Theorem 1.2. In the following two proofs, we consider the assumption presented in Section 3.2, i.e., , means .
Theorem 1.1:
We prove Theorem 1.1 by contradiction. As such, suppose there exists a solution such that for all . Note that any feasible solution to Problem MBSP-Equiv can be written as follows,
where , , , , , , , and . Now, we compute the difference in the objective function value between and such that satisfies (17), as follows:
where the last term directly follows from . Now with , and with , , , , , , , and and by Condition 16, we have that
This implies that which contradicts the fact that is optimal. Therefore, we deduce that
This concludes that a solution satisfying (17) under Condition 16 and the condition , is optimal to Problem MBSP-Equiv, thereby completing the proof.
Theorem 1.2:
We now prove the second result of Theorem 1 in what follows. To that end, given that , and given Condition 16, the optimal solution is to satisfy the demand, i.e, we have that
Now that the dominating shortage cost is zero, the question becomes, how to optimally distribute the number of patients over the available resources, given their respective costs. In addition, since is increasing in all transferring variables , , and for all , then in the optimal solution we have . This implies that, the problem reduces to a knapsack problem, with bounded variables, which can be written as follows,
The optimal solution to the above optimization problem can be obtained by solving for every point in time t, a simple knapsack optimization problem, by optimally distributing over the hospitals, and then update the state variables using the dynamic equation of . The solution to each knapsack can be retrieved by a greedy algorithm, that dictates ranking the hospital resources in an increasing order, of their operating costs, which is defined in , and filling these resources up to their upper bounds (for more details, readers are referred to [67,68]). Assuming without loss of generality, that the lowest cost is for a hospital and not for an in-situ hospital, This means that for , all buffer beds can be used for hospital , with an increased capacity of . This implies that . As such, the left over demand needs to be covered iteratively according to the optimal greedy approach, as follows
This directly implies that , and hence since the cost of opening an in-situ hospital is 0, then the optimal solution is to set for all , thereby completing the proof. □
Proof of Proposition 2
The robust formulation of the objective function
This is simply because the only term that depends on is the shortage part. Notice that f is clearly increasing in and hence we have that
This implies that solving the deterministic counter-pert, i.e., Problem MBSP-Equiv by setting for all and , is equivalent to solving the robust formulation, with , thereby completing the proof. □
References
- McCabe, R.; Schmit, N.; Christen, P.; D’Aeth, J.C.; Løchen, A.; Rizmie, D.; Nayagam, S.; Miraldo, M.; Aylin, P.; Bottle, A.; et al. Adapting hospital capacity to meet changing demands during the COVID-19 pandemic. BMC medicine 2020, 18, 1–12. [CrossRef]
- Emanuel, E.J.; Persad, G.; Upshur, R.; Thome, B.; Parker, M.; Glickman, A.; Zhang, C.; Boyle, C.; Smith, M.; Phillips, J.P. Fair allocation of scarce medical resources in the time of Covid-19, 2020.
- Baum, K.D.; Vlaanderen, L.; James, W.; Huppert, M.J.; Kettler, P.; Chell, C.; Shadiow, A.; Strike, H.; Greenlee, K.; Brown, D.; et al. The Minnesota Medical Operations Coordination Center: a COVID-19 statewide response to ensure access to critical care and medical-surgical beds. Chest 2024, 165, 95–109. [CrossRef]
- Masters, K. The COVID-19 surge is overwhelming emergency rooms across Virginia 2021. [Online; Accessed 26-April-2025].
- He, Y.; Zhou, A.; Zeng, Z.; Ma, L.; Wei, Y. Bed Management Strategies in Hospital during the COVID-19 Pandemic 2024.
- Bertsimas, D.; Pauphilet, J.; Stevens, J.; Tandon, M. Predicting inpatient flow at a major hospital using interpretable analytics. Manufacturing & Service Operations Management 2022, 24, 2809–2824. [CrossRef]
- Kim, S.H.; Chan, C.W.; Olivares, M.; Escobar, G.J. Association among ICU congestion, ICU admission decision, and patient outcomes. Critical care medicine 2016, 44, 1814–1821. [CrossRef]
- McCoy, T.H.; Pellegrini, A.M.; Perlis, R.H. Assessment of time-series machine learning methods for forecasting hospital discharge volume. JAMA network open 2018, 1, e184087–e184087. [CrossRef]
- Melman, G.; Parlikad, A.; Cameron, E. Balancing scarce hospital resources during the COVID-19 pandemic using discrete-event simulation. Health Care Management Science 2021, 24, 356–374. [CrossRef]
- Kaplan, E.H. OM Forum—COVID-19 scratch models to support local decisions. Manufacturing & Service Operations Management 2020, 22, 645–655. [CrossRef]
- Ouyang, H.; Argon, N.T.; Ziya, S. Allocation of intensive care unit beds in periods of high demand. Operations research 2020, 68, 591–608. [CrossRef]
- D’Aeth, J.C.; Ghosal, S.; Grimm, F.; Haw, D.; Koca, E.; Lau, K.; Liu, H.; Moret, S.; Rizmie, D.; Smith, P.C.; et al. Optimal hospital care scheduling during the SARS-CoV-2 pandemic. Management Science 2023, 69, 5923–5947. [CrossRef]
- Arab Momeni, M.; Mostofi, A.; Jain, V.; Soni, G. COVID19 epidemic outbreak: operating rooms scheduling, specialty teams timetabling and emergency patients’ assignment using the robust optimization approach. Annals of Operations Research 2022, pp. 1–31.
- Yom-Tov, G.B.; Yedidsion, L.; Xie, Y. An invitation control policy for proactive service systems: Balancing efficiency, value, and service level. Manufacturing & Service Operations Management 2021, 23, 1077–1095. [CrossRef]
- Mills, A.F.; Helm, J.E.; Wang, Y. Surge capacity deployment in hospitals: effectiveness of response and mitigation strategies. Manufacturing & Service Operations Management 2021, 23, 367–387.
- Ma, X.; Zhao, X.; Guo, P. Cope with the COVID-19 pandemic: Dynamic bed allocation and patient subsidization in a public healthcare system. International Journal of Production Economics 2022, 243, 108320. [CrossRef]
- Zamani, H.; Parvaresh, F. Patient admission control and bed allocation during a pandemic using dynamic programming and simulation. Journal of Modelling in Management 2025. [CrossRef]
- Marquinez, J.T.; Sauré, A.; Cataldo, A.; Ferrer, J.C. Identifying proactive ICU patient admission, transfer and diversion policies in a public-private hospital network. European Journal of Operational Research 2021, 295, 306–320. [CrossRef]
- Zhou, Y.; Yang, K.; Zhou, K.; Liang, Y. Optimal vaccination policies for an SIR model with limited resources. Acta Biotheoretica 2014, 62, 171–181. [CrossRef]
- Jang, J.; Kwon, H.D.; Lee, J. Optimal control problem of an SIR reaction–diffusion model with inequality constraints. Mathematics and Computers in Simulation 2020, 171, 136–151. [CrossRef]
- Dasaklis, T.K.; Rachaniotis, N.; Pappis, C. Emergency supply chain management for controlling a smallpox outbreak: the case for regional mass vaccination. International Journal of Systems Science: Operations & Logistics 2017, 4, 27–40.
- Büyüktahtakın, İ.E.; des Bordes, E.; Kıbış, E.Y. A new epidemics–logistics model: Insights into controlling the Ebola virus disease in West Africa. European Journal of Operational Research 2018, 265, 1046–1063. [CrossRef]
- Liu, M.; Zhang, D. A dynamic logistics model for medical resources allocation in an epidemic control with demand forecast updating. Journal of the Operational Research Society 2016, 67, 841–852. [CrossRef]
- Shams Eddin, M.; El-Amine, H.; Aprahamian, H. The impact of early large-scale screening on the evolution of pandemics. IISE Transactions 2025, 57, 509–523. [CrossRef]
- Anparasan, A.; Lejeune, M. Analyzing the response to epidemics: concept of evidence-based Haddon matrix. Journal of Humanitarian Logistics and Supply Chain Management 2017, 7, 266–283. [CrossRef]
- Mehrotra, S.; Rahimian, H.; Barah, M.; Luo, F.; Schantz, K. A model of supply-chain decisions for resource sharing with an application to ventilator allocation to combat COVID-19. Naval Research Logistics (NRL) 2020, 67, 303–320. [CrossRef]
- Bertsimas, D.; Boussioux, L.; Cory-Wright, R.; Delarue, A.; Digalakis, V.; Jacquillat, A.; Kitane, D.L.; Lukin, G.; Li, M.; Mingardi, L.; et al. From predictions to prescriptions: A data-driven response to COVID-19. Health Care Management Science 2021, 24, 253–272. [CrossRef]
- Queiroz, M.M.; Ivanov, D.; Dolgui, A.; Fosso Wamba, S. Impacts of epidemic outbreaks on supply chains: mapping a research agenda amid the COVID-19 pandemic through a structured literature review. Annals of Operations Research 2022, 319, 1159–1196. [CrossRef]
- Long, E.F.; Nohdurft, E.; Spinler, S. Spatial resource allocation for emerging epidemics: A comparison of greedy, myopic, and dynamic policies. Manufacturing & Service Operations Management 2018, 20, 181–198. [CrossRef]
- Yin, X.; Büyüktahtakın, I.E. A multi-stage stochastic programming approach to epidemic resource allocation with equity considerations. Health Care Management Science 2021, 24, 597–622. [CrossRef]
- Arora, H.; Raghu, T.; Vinze, A. Resource allocation for demand surge mitigation during disaster response. Decision Support Systems 2010, 50, 304–315. [CrossRef]
- Wenninger, A.; Pick, M.; Lahr, M. Patient transfers to and from critical access hospitals during the COVID-19 pandemic, 2023.
- Pecoraro, F.; Luzi, D.; Clemente, F. The efficiency in the ordinary hospital bed management: A comparative analysis in four European countries before the COVID-19 outbreak. Plos one 2021, 16, e0248867. [CrossRef]
- Betto, F.; Garengo, P. A circular pathway for developing resilience in healthcare during pandemics. International Journal of Production Economics 2023, 266, 109036. [CrossRef]
- Association, A.L. Learn About COVID-19 2024. [Online; Accessed February-2025].
- Statista. Number of hospitals in Virginia in 2022, by ownership type 2024. [Online; Accessed March-2025].
- Gurobi Optimization, LLC. Gurobi Optimizer Reference Manual, 2023.
- Tatsuki, O.; Naoki, H.; Igarashi, Y. Optimal COVID-19 testing strategy on limited resources. PLOS ONE 2023, 18, e0281319. [CrossRef]
- Keeling, M.J.; Rohani, P. Modeling infectious diseases in humans and animals; Princeton university press, 2008.
- Weitz, J.S.; Dushoff, J. Modeling post-death transmission of Ebola: challenges for inference and opportunities for control. Scientific reports 2015, 5, 8751. [CrossRef]
- CDC. What is COVID-19 reinfection? 2023. [Online; Accessed February-2025].
- CDC. COVID Data Tracker 2025. [Online; Accessed 15-April-2025].
- Mathieu, E.; Ritchie, H.; Rodés-Guirao, L.; Appel, C.; Gavrilov, D.; Giattino, C.; Hasell, J.; Macdonald, B.; Dattani, S.; Beltekian, D.; et al. Mortality Risk of COVID-19. Our World in Data 2020. https://ourworldindata.org/mortality-risk-covid.
- NVRC. NOVA Region Dashboard 2024. [Online; Accessed 27-April-2025].
- Chang, M.C.; Park, Y.K.; Kim, B.O.; Park, D. Risk factors for disease progression in COVID-19 patients. BMC infectious diseases 2020, 20, 1–6. [CrossRef]
- Inova. Inova Fairfax Medical Campus 2025. [Online; Accessed 27-April-2025].
- Reston. Reston Hospital Center 2025. [Online; Accessed 27-April-2025].
- Senatra. Sentara Northern Virginia Medical Center 2025. [Online; Accessed 27-April-2025].
- Inova. Inova Fair Oaks Hospital 2025. [Online; Accessed 27-April-2025].
- VHC. VHC Health 2025. [Online; Accessed 27-April-2025].
- Inova. Inova Mount Vernon Hospital 2025. [Online; Accessed 27-April-2025].
- Inova. Inova Alexandria Hospital 2025. [Online; Accessed 27-April-2025].
- Medstar. MedStar National Rehabilitation Hospital 2025. [Online; Accessed 27-April-2025].
- StoneSprings. StoneSprings Hospital Center 2025. [Online; Accessed 27-April-2025].
- HCA. HCAVA 2025. [Online; Accessed 27-April-2025].
- Smith, M. Field hospital sites identified in Northern Virginia for expected surge 2020. [Online; Accessed 27-April-2025].
- Tucker, K. Study: COVID-19 Hospitalization Costs, Outcomes In 2020 Improved Over Time 2022. [Online; Accessed 4-May-2025].
- Health, F. FAIR Health Releases Study on Ground Ambulance Services 2022. [Online; Accessed 17-May-2025].
- Alimohamadi, Y.; Yekta, E.M.; Sepandi, M.; Sharafoddin, M.; Arshadi, M.; Hesari, E. Hospital length of stay for COVID-19 patients: a systematic review and meta-analysis. Multidisciplinary respiratory medicine 2022, 17, 856. [CrossRef]
- Castagna, F.; Xue, X.; Saeed, O.; Kataria, R.; Puius, Y.A.; Patel, S.R.; Garcia, M.J.; Racine, A.D.; Sims, D.B.; Jorde, U.P. Hospital bed occupancy rate is an independent risk factor for COVID-19 inpatient mortality: a pandemic epicentre cohort study. BMJ open 2022, 12, e058171. [CrossRef]
- NVRC. Population of Northern Virginia Data 2024. [Online; Accessed June-2025].
- Yang, Z.; Zeng, Z.; Wang, K.; Wong, S.S.; Liang, W.; Zanin, M.; Liu, P.; Cao, X.; Gao, Z.; Mai, Z.; et al. Modified SEIR and AI prediction of the epidemics trend of COVID-19 in China under public health interventions. Journal of thoracic disease 2020, 12, 165. [CrossRef]
- Wu, Y.; Kang, L.; Guo, Z.; Liu, J.; Liu, M.; Liang, W. Incubation period of COVID-19 caused by unique SARS-CoV-2 strains: a systematic review and meta-analysis. JAMA network open 2022, 5, e2228008–e2228008. [CrossRef]
- Team, A.M.K. COVID-19: recovery time 2025. [Online; Accessed June-2025].
- CDC. Prioritizing COVID-19 contact tracing mathematical modeling methods and findings 2020. [Online; Accessed 4-January-2021].
- Liu, Y.; Rocklöv, J. The reproductive number of the Delta variant of SARS-CoV-2 is far higher compared to the ancestral SARS-CoV-2 virus. Journal of travel medicine 2021, 28, taab124. [CrossRef]
- Kellerer, H.; Pferschy, U.; Pisinger, D.; Kellerer, H.; Pferschy, U.; Pisinger, D. Multidimensional knapsack problems; Springer, 2004.
- Martello, S.; Toth, P. Knapsack problems: algorithms and computer implementations; John Wiley & Sons, Inc., 1990.
| 1 | We assume, without loss of generality, that one of the hospitals has the lowest operating cost among all hospitals and in-situ hospitals. |
| 2 | This is based on the fact that the proportion of NOVA population in Virginia is 30%. |
| 3 | Due to lack of data, we assume that the recovery rate is the same across all hospitals and and in-situ hospitals. |
| 4 | The buffer of 898 was mainly estimated from the 68% pandemic hospital bed usage reported by [60]. |
| 5 | The current practice solution is derived using a myopic algorithm that assigns incoming patients to available beds following the allocation policy outlined in Theorem 1. |
| 6 | The values of the parameters of the SEIRD model along with the associated references are presented in Appendix A.1
|
Figure 1.
Diagram showing an illustrative example of flow of patients in a healthcare system.
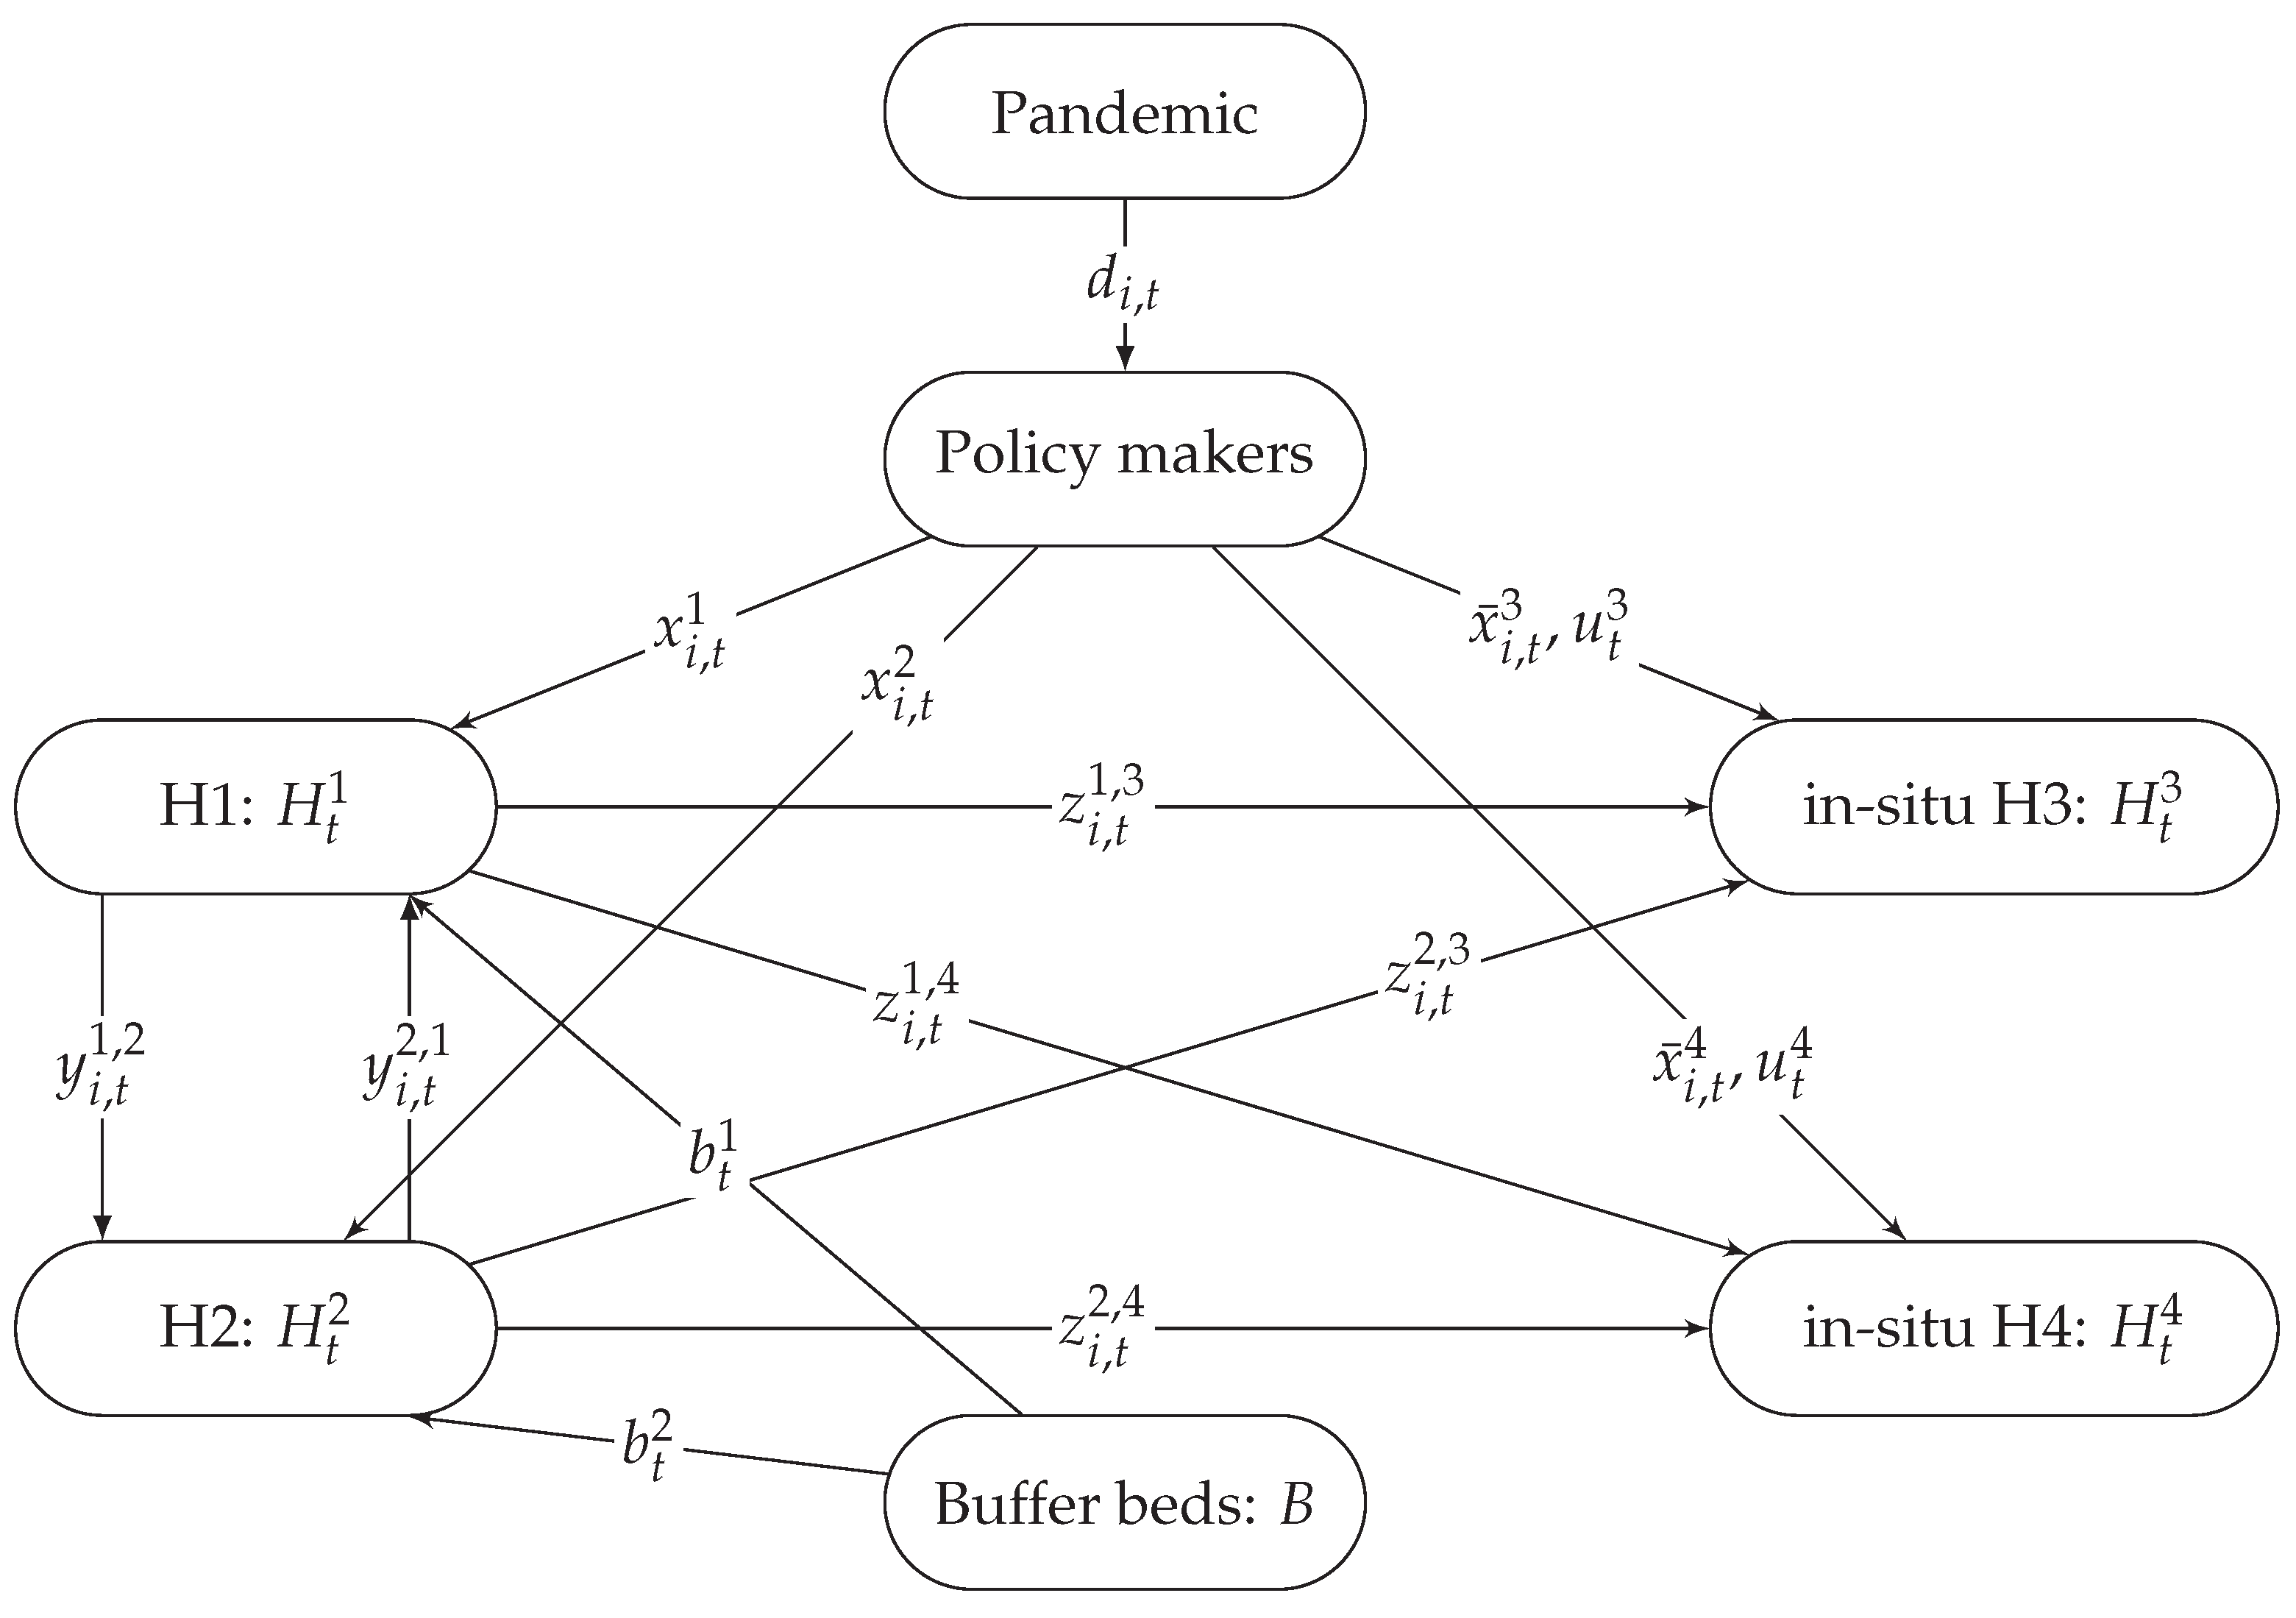
Figure 2.
Reduction in the optimization and data processing run time as a function of problem size (number of hospitals).
Figure 2.
Reduction in the optimization and data processing run time as a function of problem size (number of hospitals).
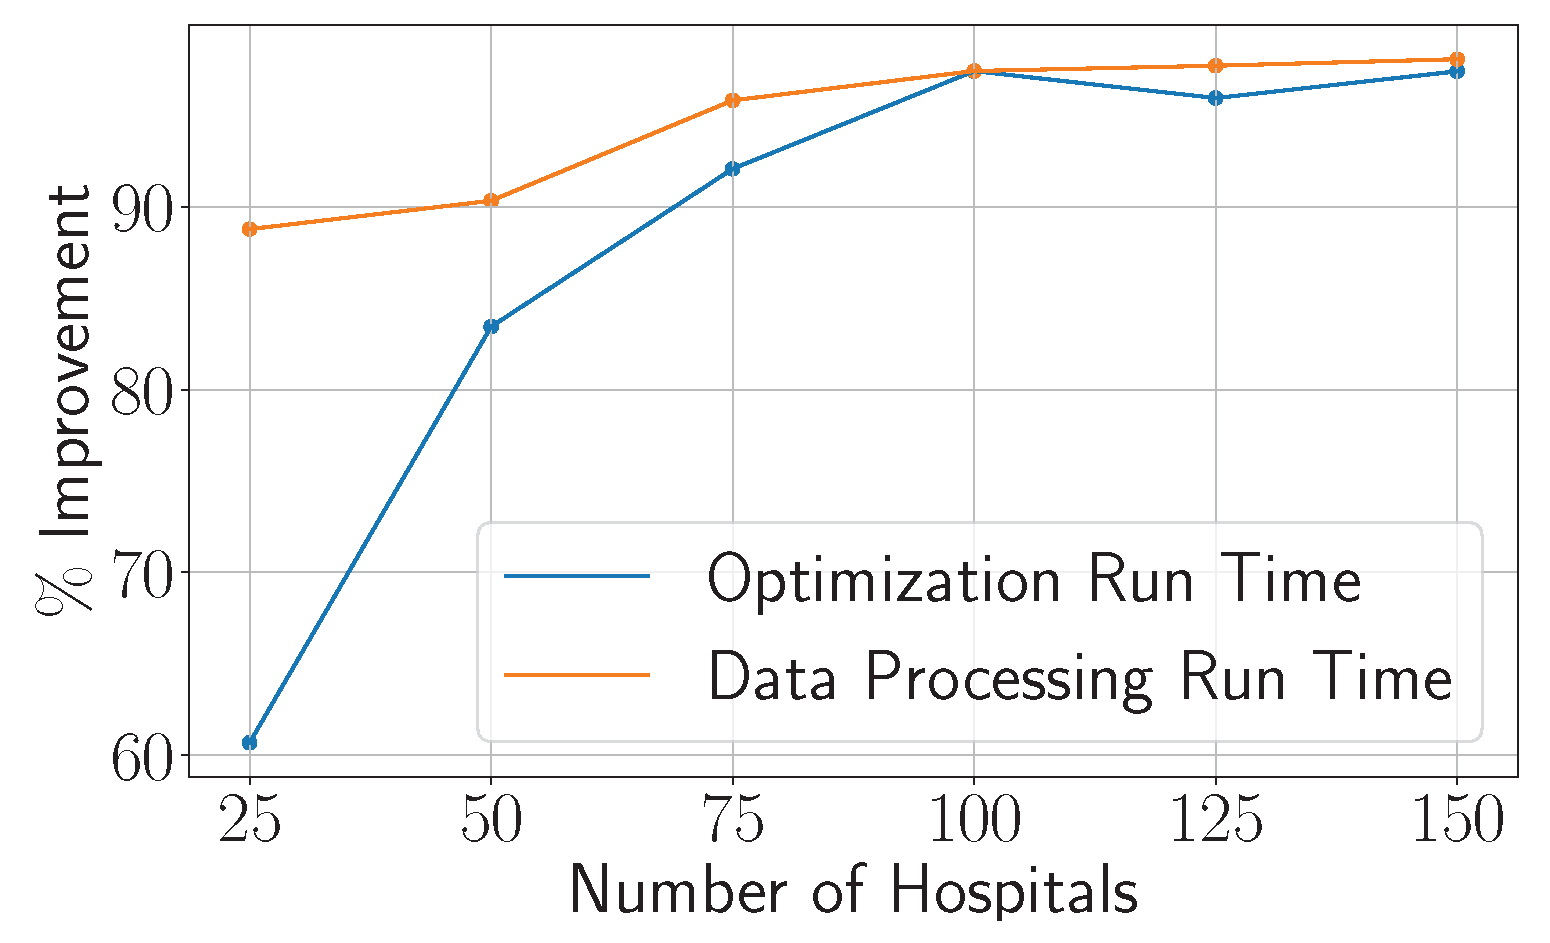
Figure 3.
Weekly patient demand for mild and severe cases from Oct 2, 2021 till Feb 26, 2022 [42].
Figure 3.
Weekly patient demand for mild and severe cases from Oct 2, 2021 till Feb 26, 2022 [42].
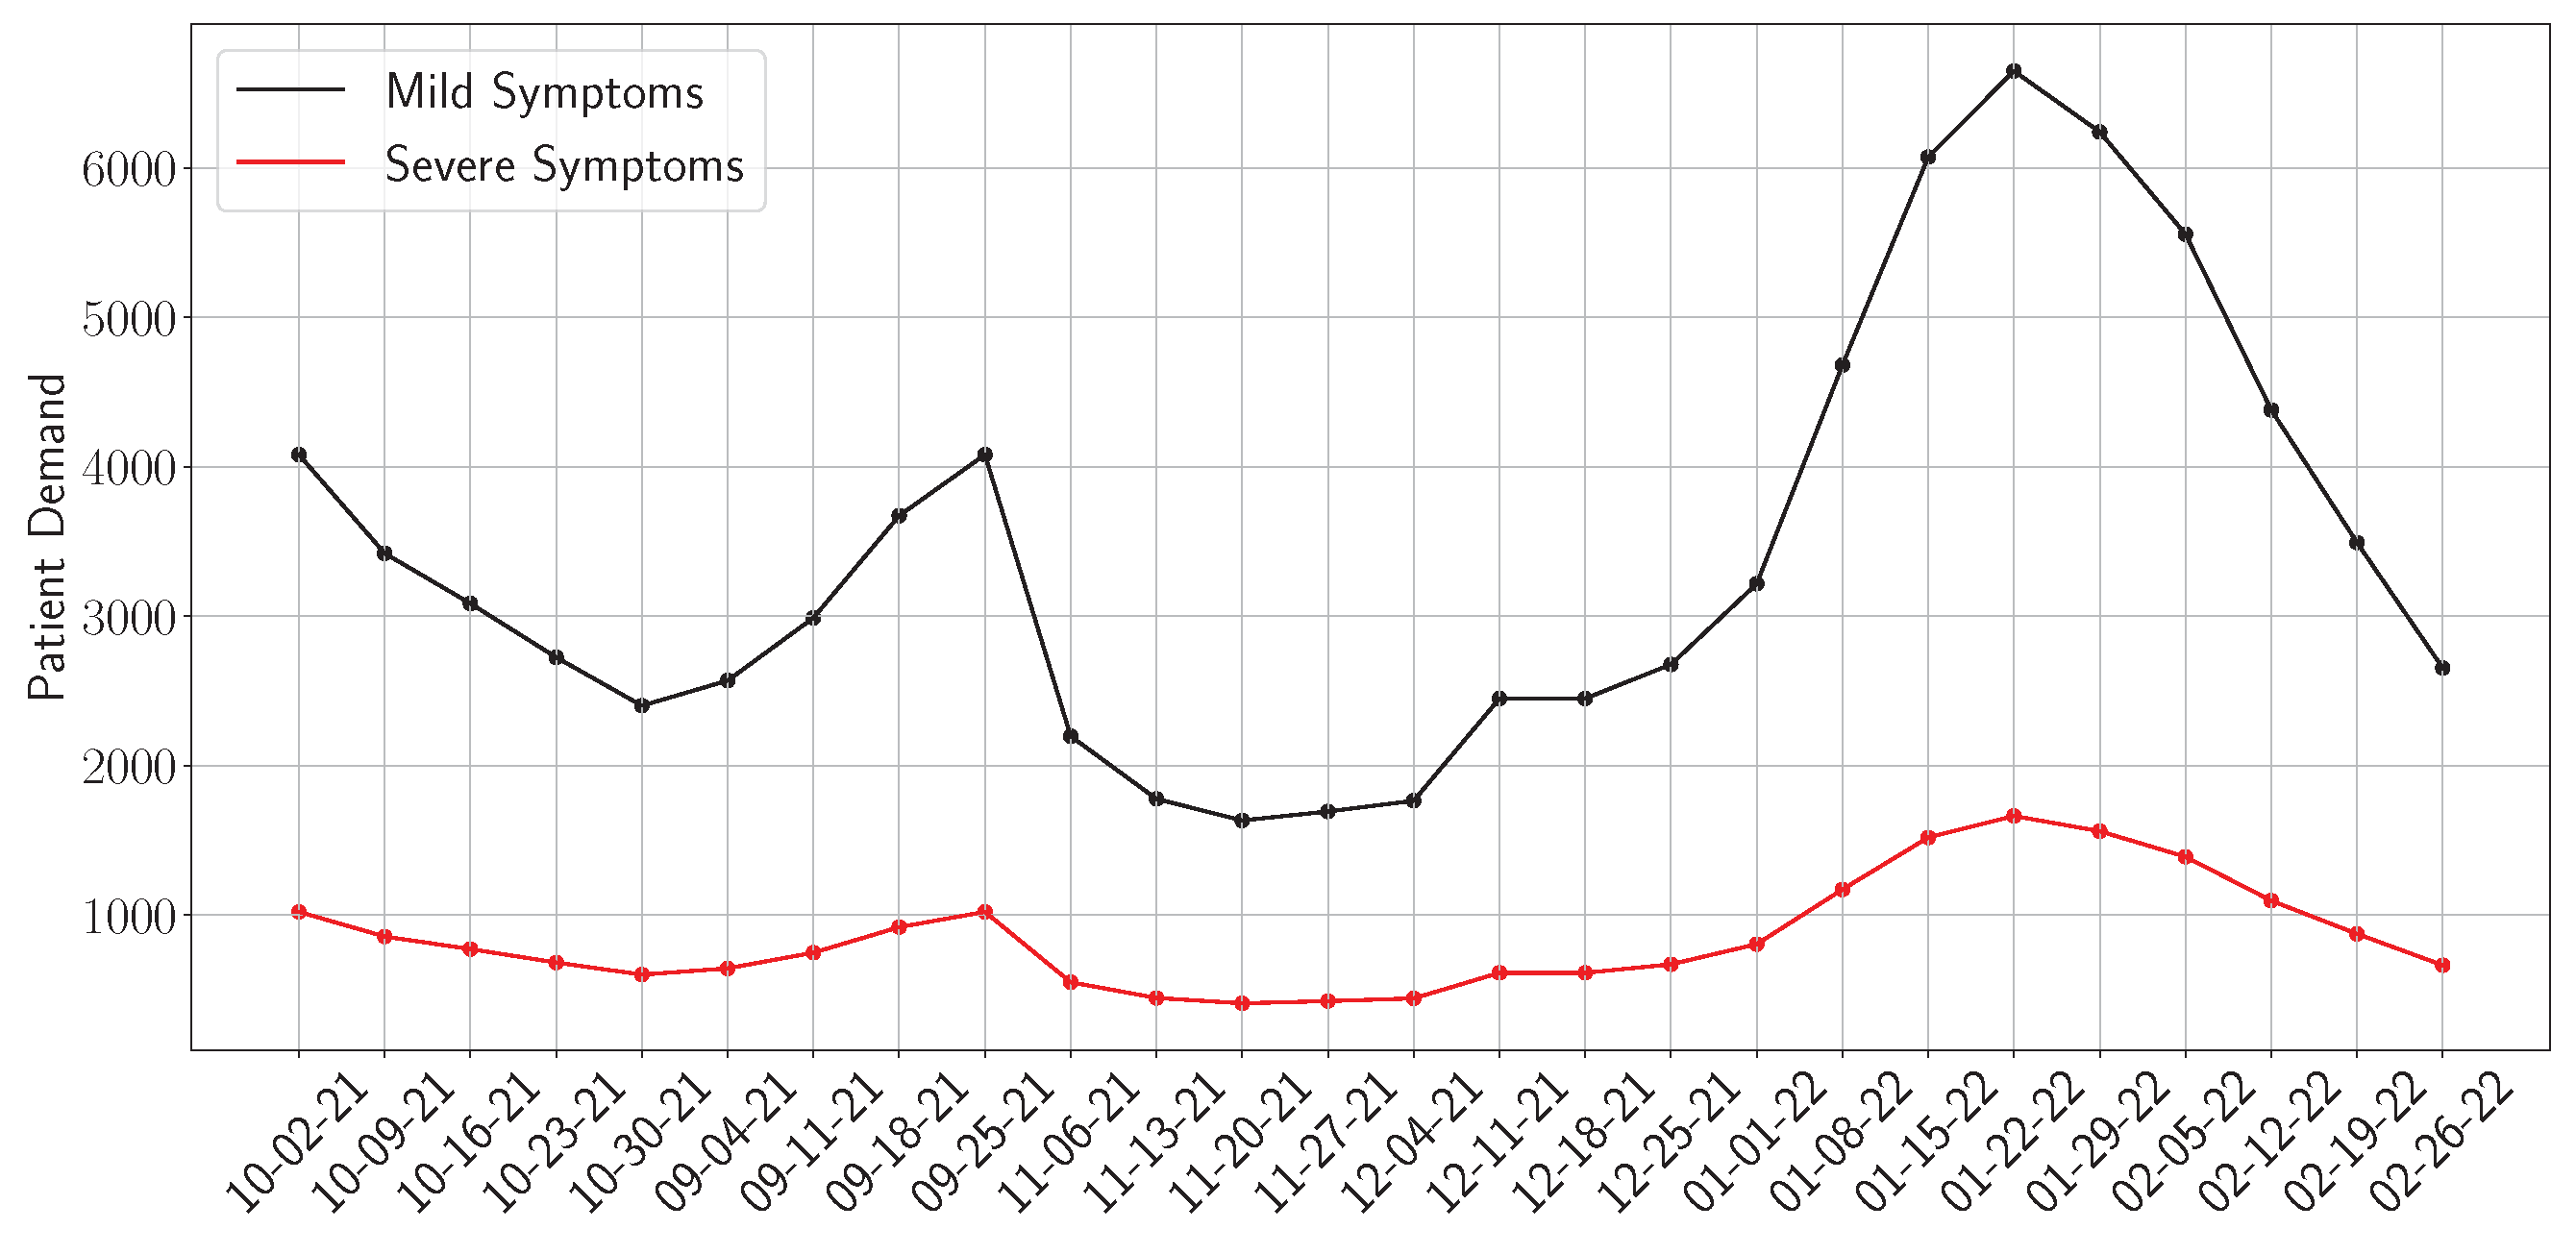
Figure 4.
Expected healthcare costs under current practice (CP) and the proposed optimization model.
Figure 4.
Expected healthcare costs under current practice (CP) and the proposed optimization model.
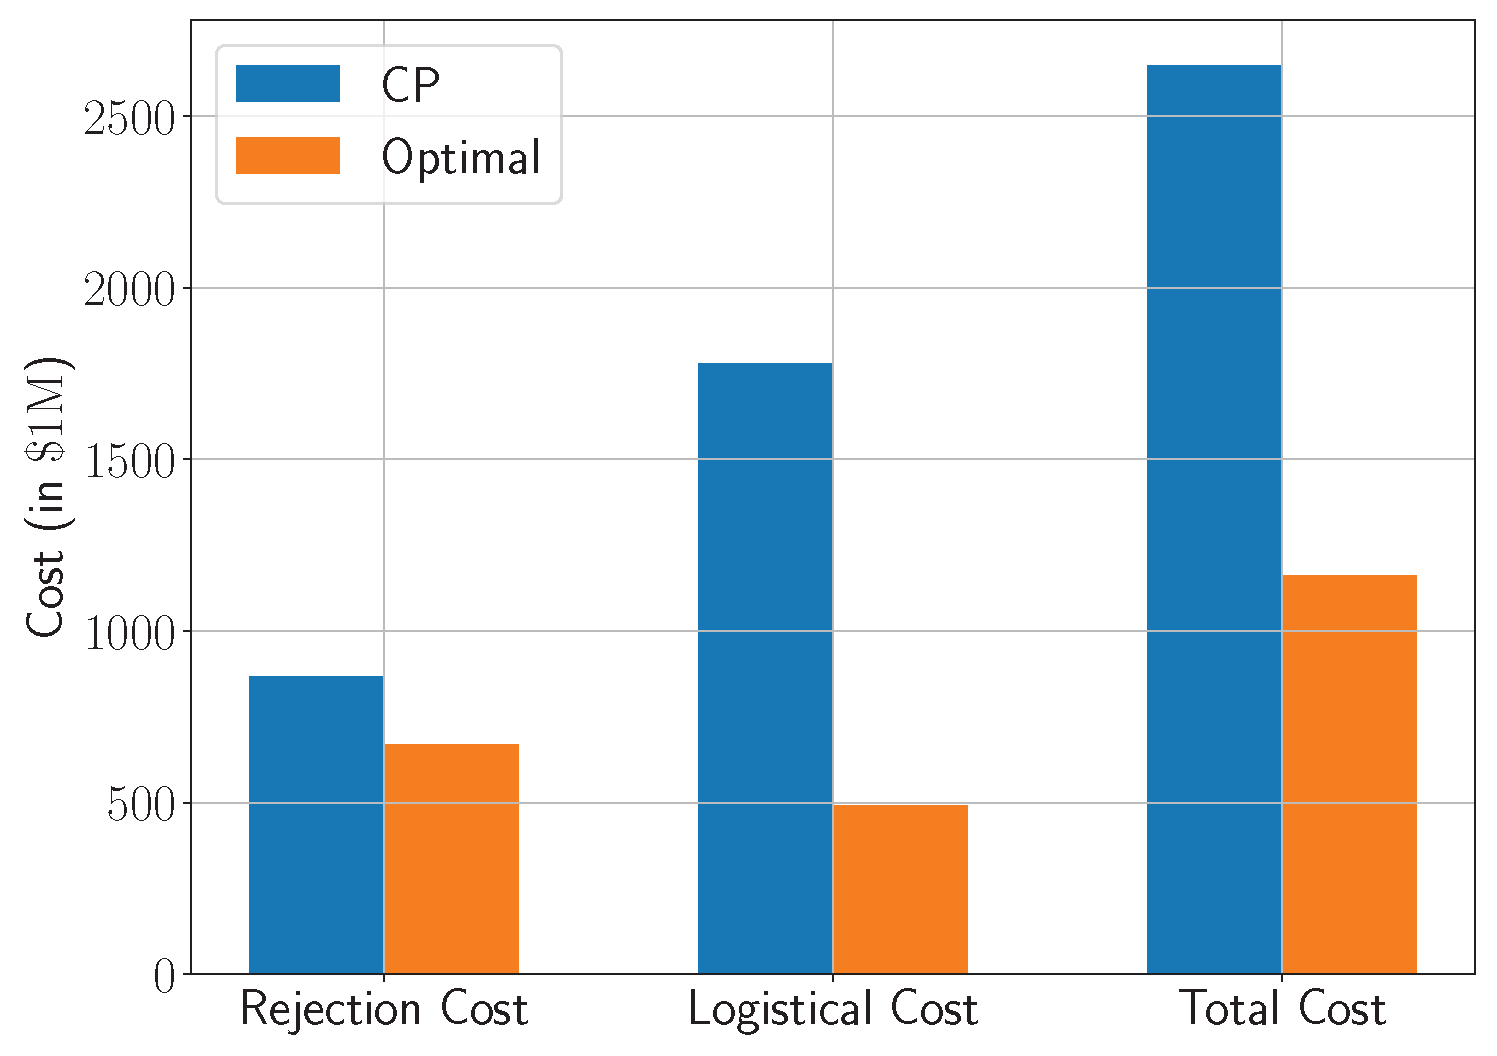
Figure 5.
Weekly patient rejections under current practice (CP) and the optimized scheduling model, by severity of symptoms.
Figure 5.
Weekly patient rejections under current practice (CP) and the optimized scheduling model, by severity of symptoms.
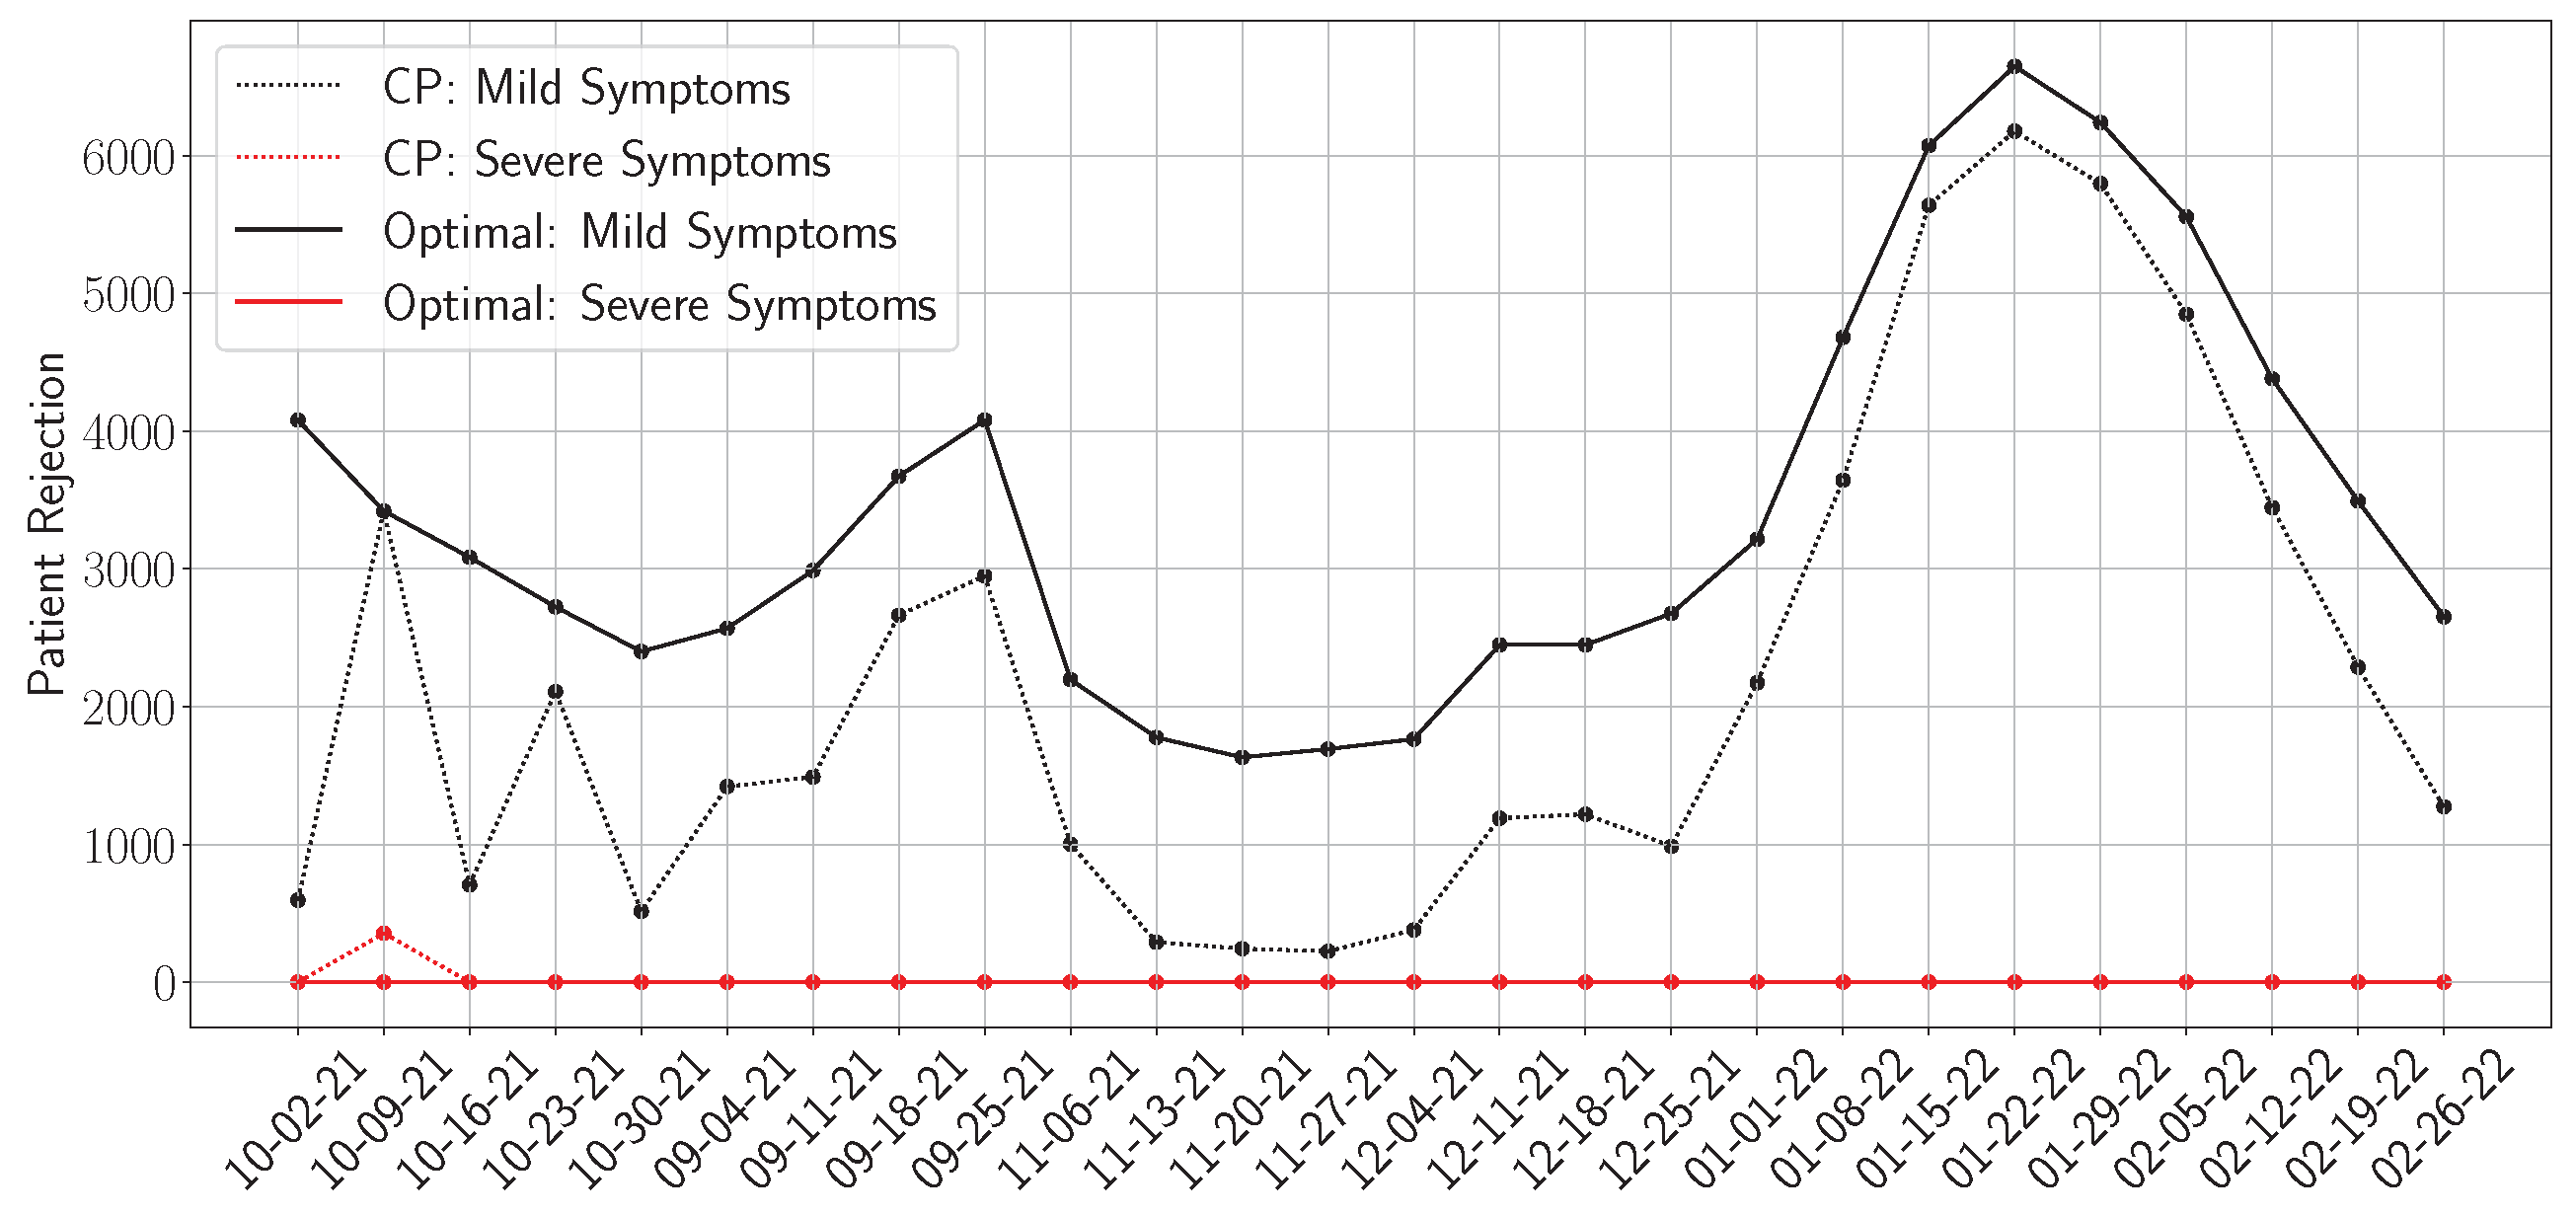
Figure 6.
Weekly patient transfers under the optimized model. The shaded region represents ±1 standard deviation across transfer realizations.
Figure 6.
Weekly patient transfers under the optimized model. The shaded region represents ±1 standard deviation across transfer realizations.
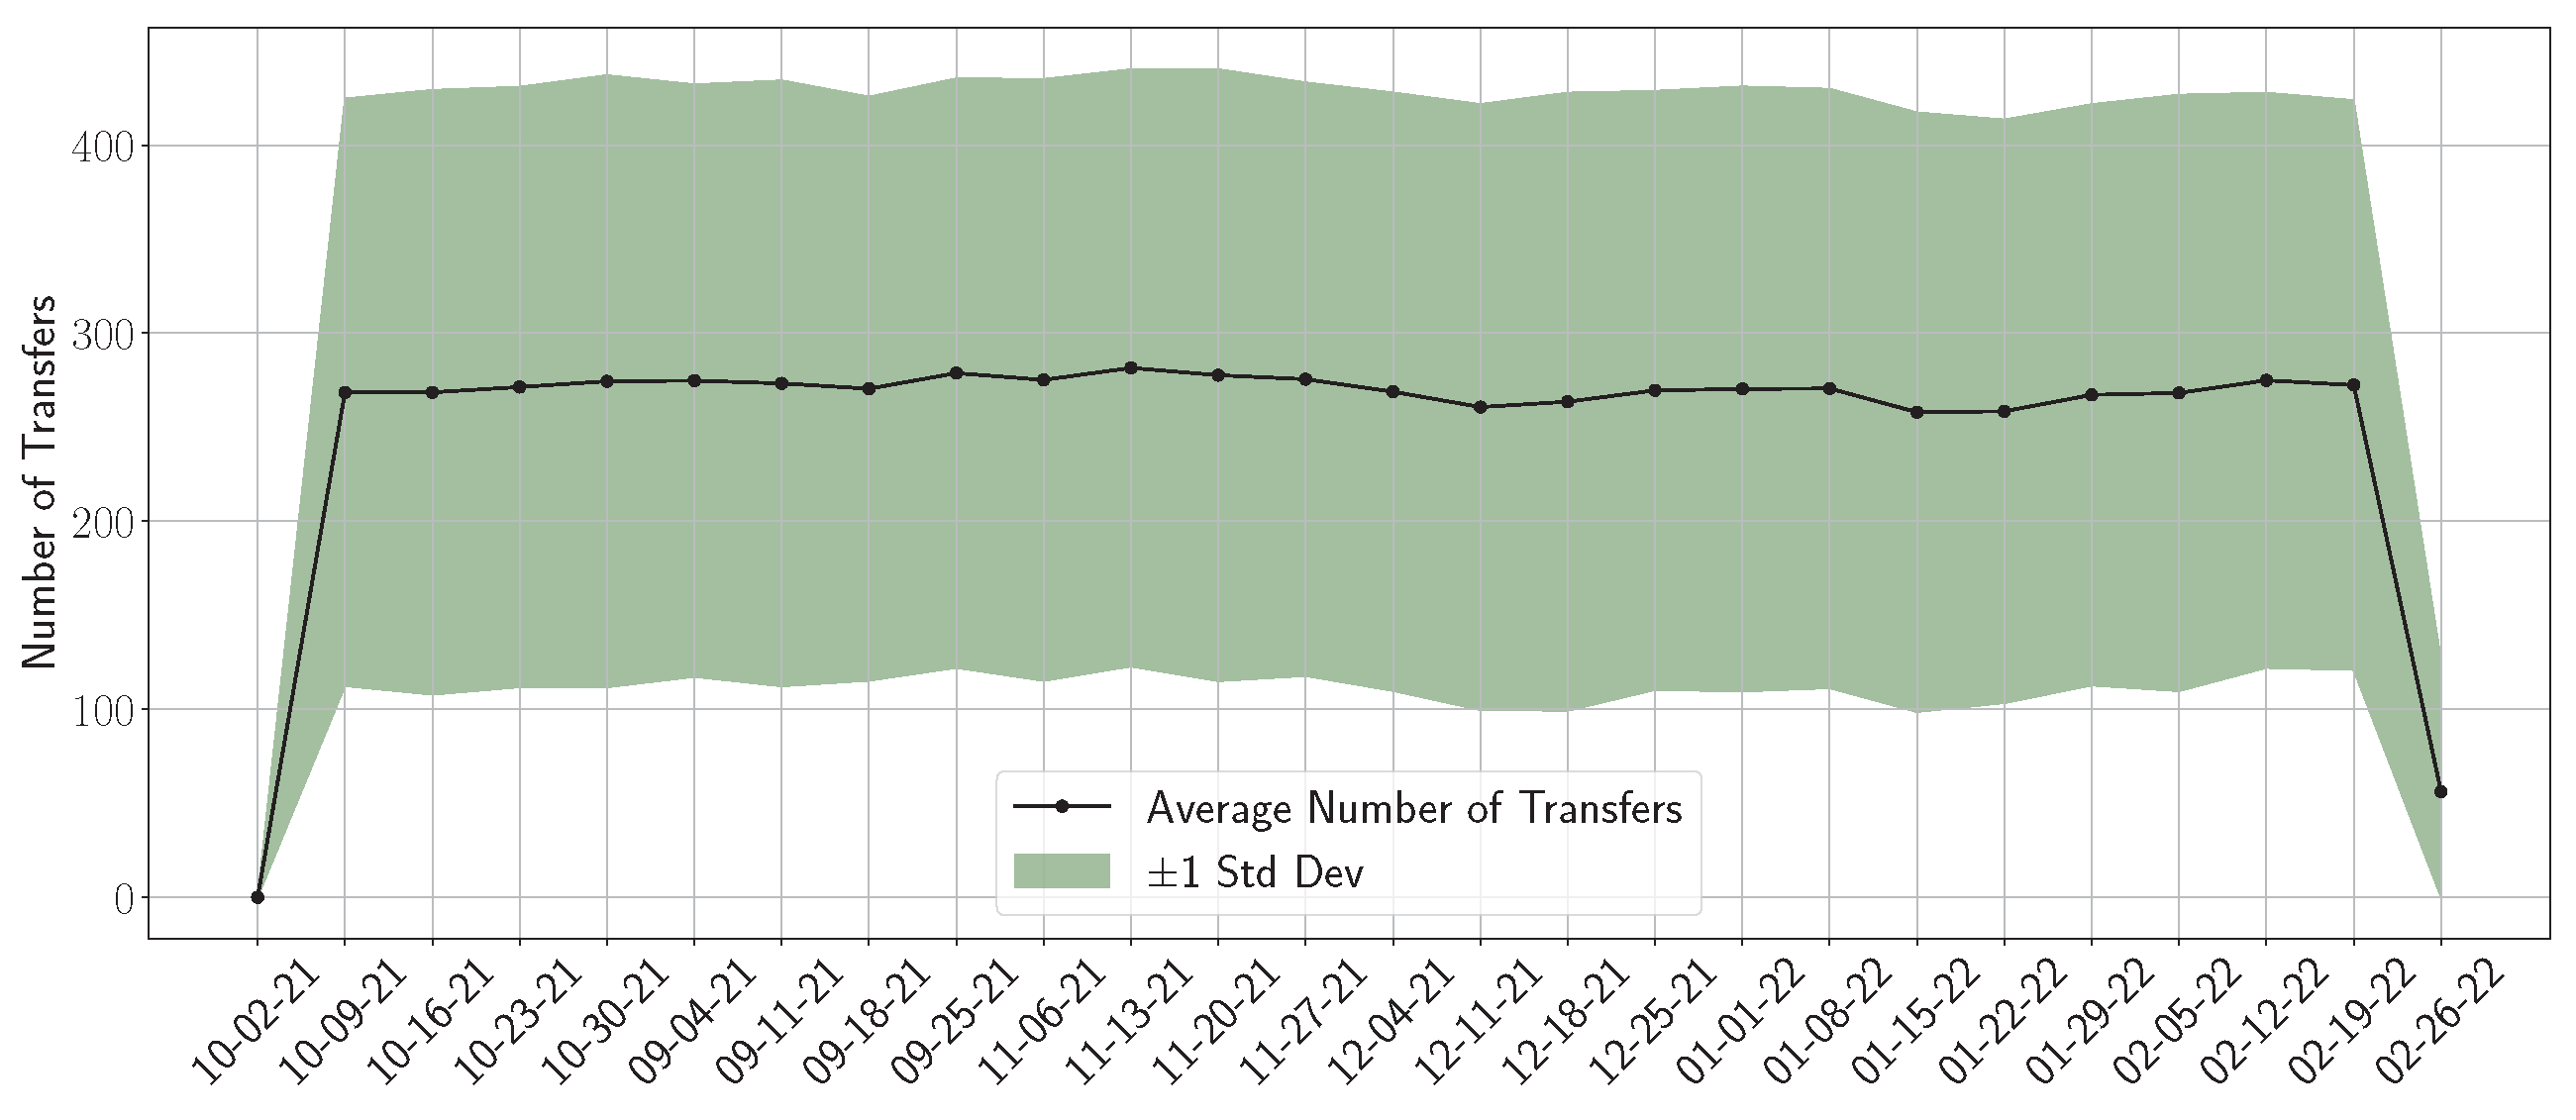
Figure 7.
Variation of the total patient rejection as a function of rejection cost under different levels of bed capacity depicted by the number of in-situ hospitals (left figure) and buffers (right figure). .
Figure 7.
Variation of the total patient rejection as a function of rejection cost under different levels of bed capacity depicted by the number of in-situ hospitals (left figure) and buffers (right figure). .
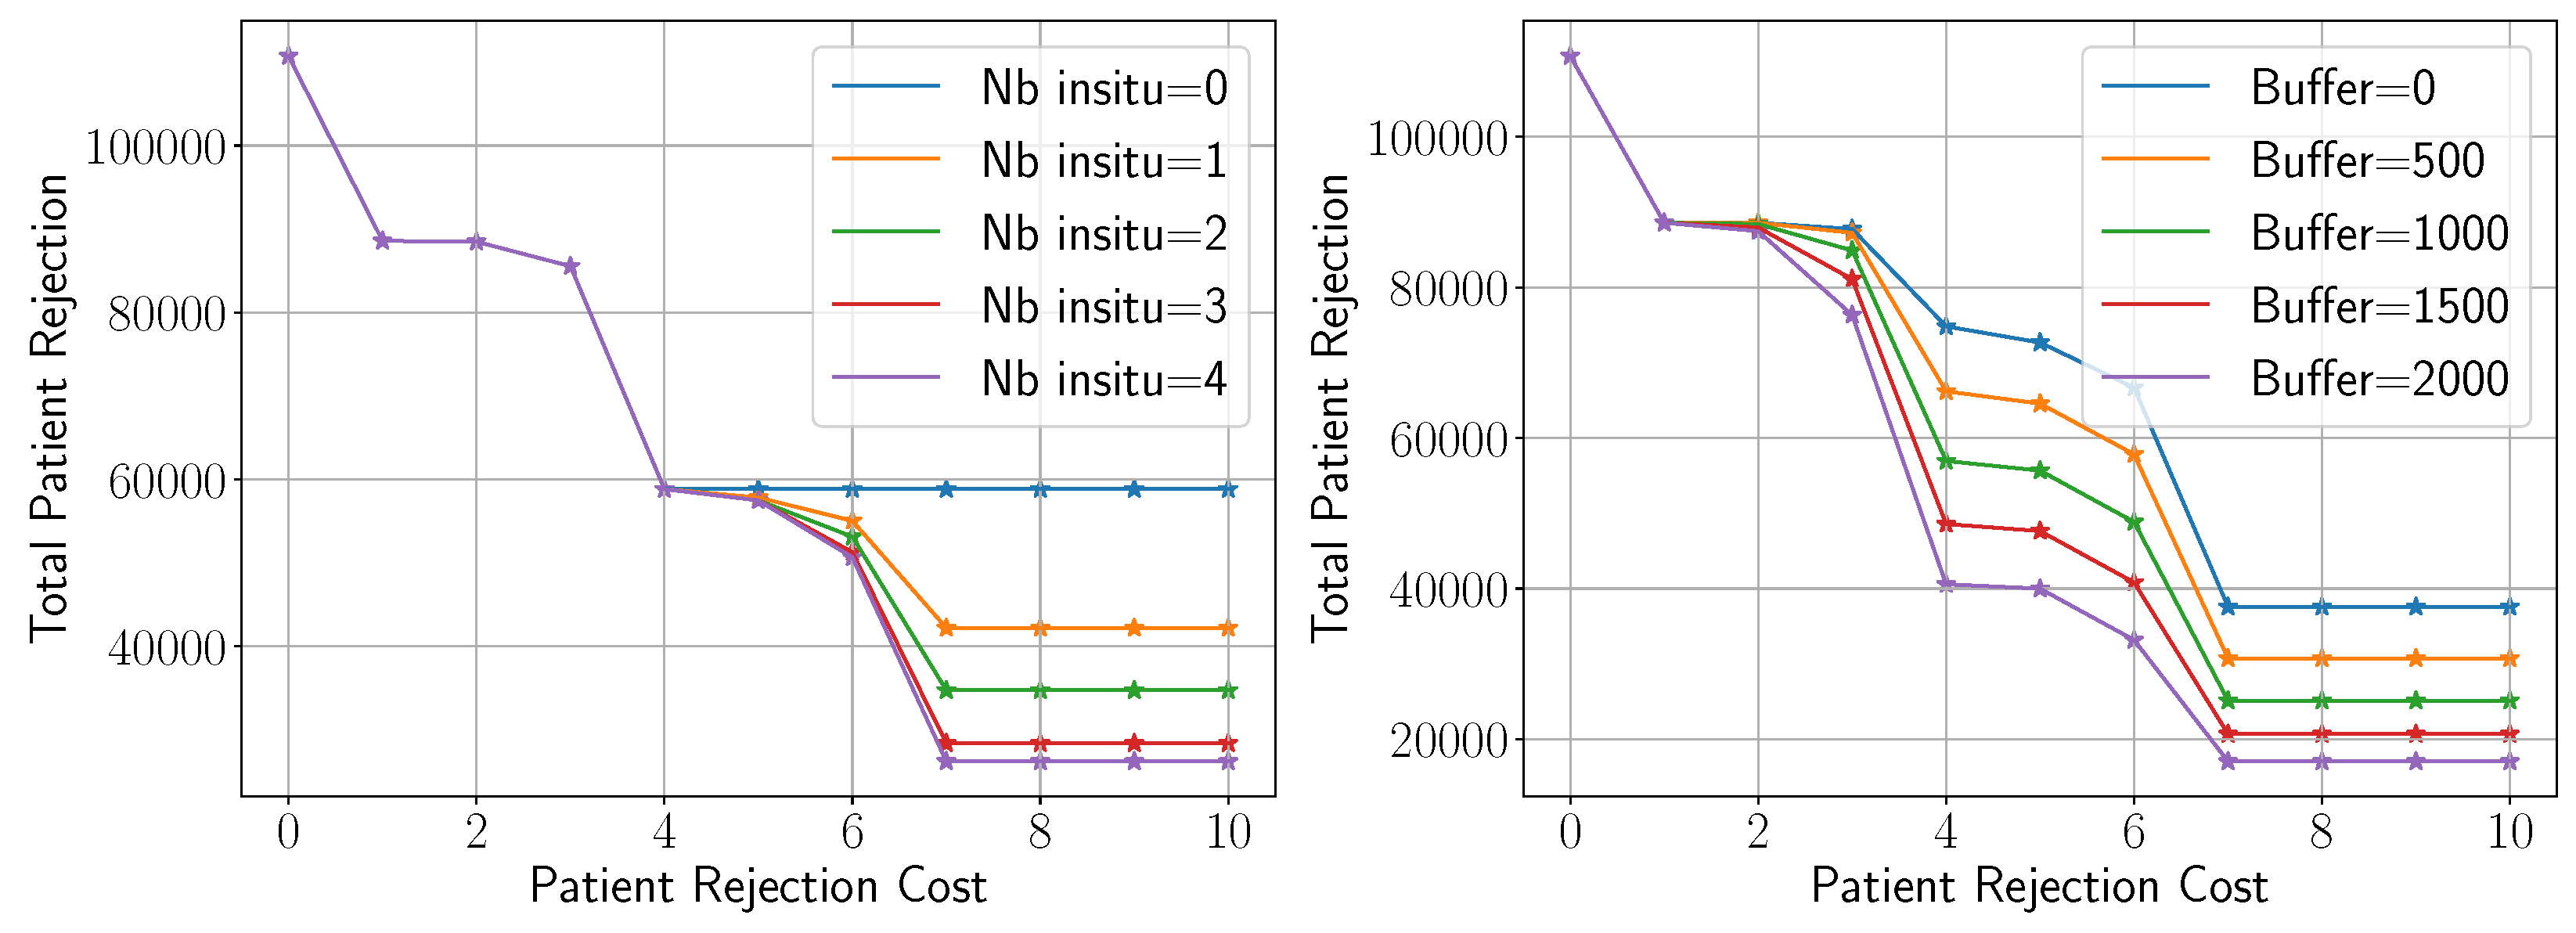
Figure 8.
Impact of the cost of mild symptoms on the mild and severe rejection rates.
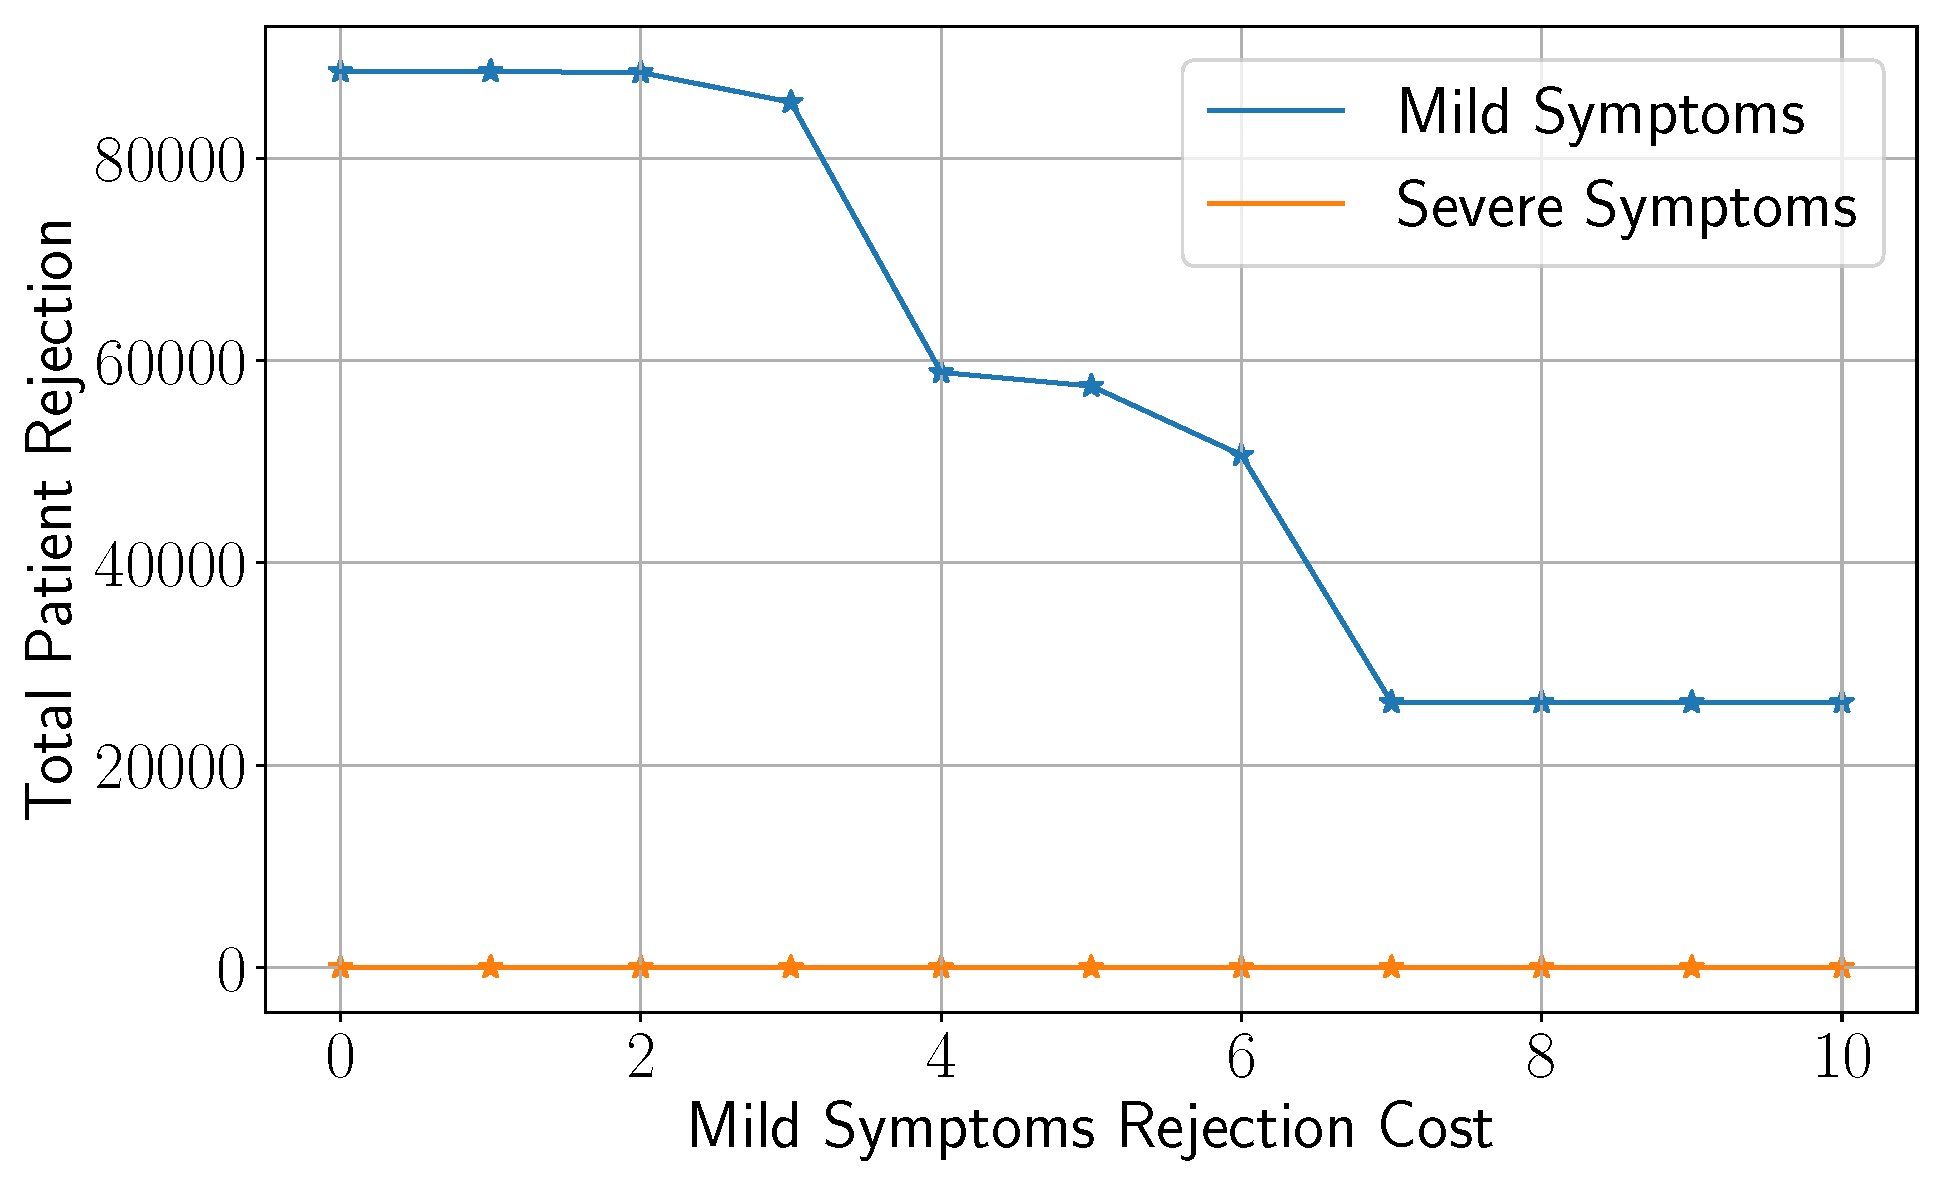
Figure 9.
Empirical cost distributions under stochastic demand for three strategies: Current Practice, Average-based model, and Robust model. Vertical lines indicate mean costs.
Figure 9.
Empirical cost distributions under stochastic demand for three strategies: Current Practice, Average-based model, and Robust model. Vertical lines indicate mean costs.
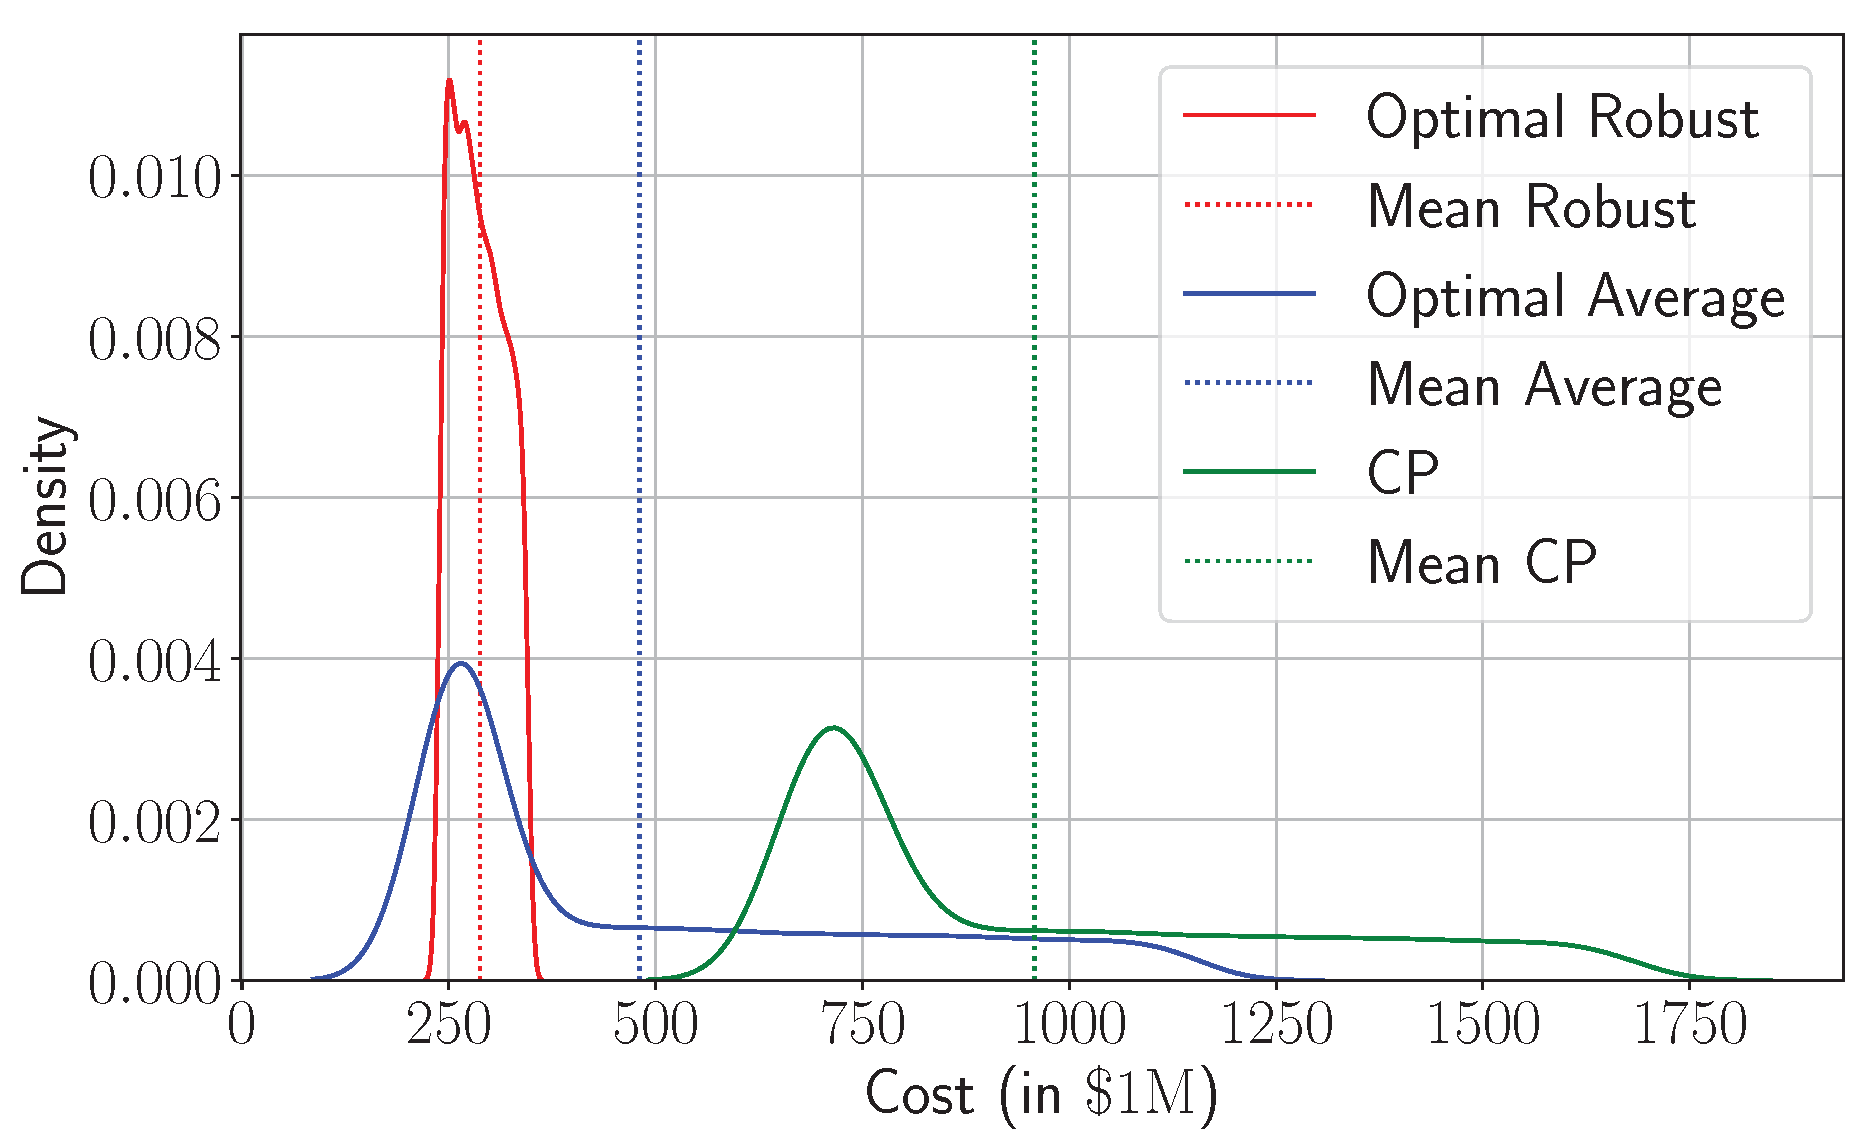
Figure 10.
Trade-off between the cost of the average-based model and its robust counterpart as a function of the uncertainty parameter r.
Figure 10.
Trade-off between the cost of the average-based model and its robust counterpart as a function of the uncertainty parameter r.

Table 1.
Computational aspects of Problem MBSP
Table 1.
Computational aspects of Problem MBSP
| Decision variables | Type | Size |
|---|---|---|
| continuous | ||
| continuous | ||
| continuous | ||
| continuous | ||
| continuous | ||
| binary | ||
| continuous | ||
| continuous | ||
| Constraints | Type | Size |
| Equation (3) | inequality | |
| Equation (4) | inequality | |
| Equation (5) | inequality | |
| Equation (6) | equality | |
| Equation (7) | equality | |
| Binary | - | |
| Non-negativity | inequality | sum of the size of decision variables |
Table 2.
Bed capacity of the ten major hospitals in NOVA
| Hospital Name | City | Number of Beds | Reference | Estimated Cost |
|---|---|---|---|---|
| Inova Fairfax Medical Campus | Falls Church | 928 | [46] | $1,7234 |
| Reston Hospital Center | Reston | 243 | [47] | $16,709 |
| Sentara Northern Virginia Medical Center | Woodbridge | 183 | [48] | $16,884 |
| Inova Fair Oaks Hospital | Fairfax | 174 | [49] | $16,534 |
| Virginia Hospital Center | Arlington | 343 | [50] | $17,059 |
| Mount Vernon Hospital | Alexandria | 219 | [51] | $16,184 |
| Alexandria Hospital | Alexandria | 318 | [52] | $16,009 |
| National Rehabilitation Hospital | Washington, D.C. | 137 | [53] | $15,834 |
| StoneSprings Hospital Center | Sterling | 124 | [54] | $16,359 |
| Westfields Hospital | Chantilly | 140 | [55] | $15,659 |
Table 3.
Bed capacity of potential in-situ hospitals in NOVA
| Facility Name | City | Number of Beds | Reference | Estimated Cost |
|---|---|---|---|---|
| National Conference Center | Leesburg | 1,000 | [56] | $32,718 |
| Dulles Expo Center | Fairfax | 500 | ||
| George Mason University | Fairfax | 500 | ||
| Hilton Garden Inn | Woodbridge | 200 |
Disclaimer/Publisher’s Note: The statements, opinions and data contained in all publications are solely those of the individual author(s) and contributor(s) and not of MDPI and/or the editor(s). MDPI and/or the editor(s) disclaim responsibility for any injury to people or property resulting from any ideas, methods, instructions or products referred to in the content. |
© 2025 by the authors. Licensee MDPI, Basel, Switzerland. This article is an open access article distributed under the terms and conditions of the Creative Commons Attribution (CC BY) license (http://creativecommons.org/licenses/by/4.0/).
Copyright: This open access article is published under a Creative Commons CC BY 4.0 license, which permit the free download, distribution, and reuse, provided that the author and preprint are cited in any reuse.


