
Submitted:
20 August 2025
Posted:
21 August 2025
You are already at the latest version
Abstract
Investors have a great appetite for their money to positively impact society and the environment. Sustainable and Responsible Investing (SRI) is a means to achieve this impact. However, there is significant cynicism of investment managers. Investors question whether investment managers are genuine about sustainability and whether their investment processes are effective. Into this maelstrom of uncertainty enters the United Nation’s Principles for Responsible Investing (PRI). As an intergovernmental organisation, they champion global sustainability concerns. Their goal is to improve investment practices by signaling to investors which investment managers have quality SRI processes. If the PRI signaling is effective it will attract more flows to the funds managed by PRI signatories. This would motivate investment managers to sign the PRI and maintain their inclusion as signatories. In turn, PRI could influence and improve the SRI processes of these investment managers. This paper applies a longitudinal analysis of the flows to funds managed by PRI signatories. The results raise doubts that PRI is effective at attracting fund flows to their signatories. Fortunately, signaling theory provides insights as to why this might be occurring as well as pathways to improve PRI’s signaling power.

Keywords:
environmental
; social & governance
; socially responsible investing
; principles for responsible investing
; endogeneity
; fund flows
; system GMM
; signalling theory
1. Introduction
Significant debate persists over the ability of intergovernmental organisations (IGO’s) to activate capital market support for socially responsible investing (SRI). Unfortunately, there is an absence of empirical research to inform this debate. This paper attempts to fill this research gap by analysing the impact of a major IGO initiative, the United Nation’s Principles for Responsible Investing (PRI), on attracting investment into SRI funds. However, this task highlights an important technical issue which is hampering the ability of academic research to contribute to significant global debates. Empirical methods have not usually accounted for endogeneity problems. It is therefore likely that empirical literature misinforms key stakeholders and decision makers. In contrast, this paper adopts a sophisticated econometric technique to resolve the endogeneity concern and thereby produces robust answers to these critical questions. The results of these techniques raise doubts that the PRI initiative has been effective at advancing SRI.
The criticisms of IGO effectiveness range from arguments that IGO’s are instruments for domination by stronger states (Pauly, 1999) through to the IGO’s are a tool for other countries to control stronger states like the US (Call et al., 2017). In addition to these ideological criticisms, there is some emerging empirical evidence showing that the major IGO initiative for SRI investing, the PRI, has been successful (Motta and Uchida, 2018). However, that evidence only relates to the time leading up to the launch of the PRI. In contrast, by analysing the flows since inception of the PRI, this paper casts doubt on the PRI to influence fund flows. These findings therefore motivate the search for new strategies to improve the effectiveness of the PRI and other IGO’s. Potential strategies identified in this paper include: establishing IGO autonomy (Manulak, 2017), employing new frameworks to improve how IGO’s signal quality SRI (Bergh et al., 2014), and improving the mechanisms for collaboration - ranging from information sharing to coordinated action and conflict resolution (Galaz et al., 2012).
The PRI is a deserving target for analysis because of its size and potential. Kofi Annan, the Secretary-General of the United Nations, launched the PRI with the express aim of motivating investment managers to create a sustainable global financial system. The six principles of the PRI focus on incorporating ESG issues into the signatories’ investment processes and promote similar implementation across the industry. Since its launch, the PRI has proven popular and assets under management by PRI signatories grew to US$86.3 trillion by 2019. However, this initial momentum will need to be maintained if the PRI is to achieve significant influence over the investment industry. This paper attempts to find the value to fund managers of signing the PRI and thereby measures its influence on investors and the industry. The results can have important implications for how IGO’s approach initiatives like the PRI as well as the strategic decisions of investment managers.
Endogeneity is an issue which potentially undermines the contribution by academic research to the important challenges facing society. Adopting innovative methods to accommodate for endogeneity is dramatically recasting our knowledge of how capital markets work (Griffin et al., 2015; Schultz et al., 2010; Wintoki et al., 2012). Fund flow analysis is especially susceptible to endogeneity. Fund flow modelling exhibits all the main forms of endogeneity: dynamic endogeneity, simultaneity and unobserved heterogeneity. This paper applies a system generalized method of moments (GMM) approach with instruments selected to mitigate the three main forms of endogeneity.
The purpose of this paper is to ascertain whether the PRI will continue to be successful at marshalling funds towards SRI. The results will indicate whether the PRI has an ongoing role in progressing SRI investment practices. Fund flow data is therefore constructed by merging the comprehensive set of fund data from the Centre for Research in Security Prices Mutual Fund Database with the names of the PRI investment manager signatories. All the funds described as SRI funds (e.g. environmental, responsible and ethical etc.) are also identified. The sample should therefore reveal the drivers behind flows to those funds managed by PRI signatures and those specifically targeting SRI investors.
This paper paves the way for further evaluation of whether IGO’s successfully motivate capital market support for progressive environmental and social development. The paper demonstrates a more reliable methodology than typically used in empirical literature. System GMM is applied to resolve the endogeneity issues encountered in finance research. The findings indicate the PRI is not successful at attracting flows to the funds managed by PRI signatories. In addition to contributing more robust findings, this paper also applies an innovative framework to understand the issue of IGO impact on capital markets. Signalling theory enables a deeper understanding of what will improve the success of IGO initiatives such as the PRI. The theory identifies key aspects of successful signalling: the signal cost, the information problem, signal confirmation and pareto optimizing solutions (Bergh et al., 2014). Breaking down the process into these elements enables successful strategies to be identified to improve the PRI’s signalling.
The following section reviews the relevant literature and establishes the contributions of this paper. Section Three details the source and preparation of the SRI mutual fund data. Sections Four and Five examine the endogeneity concerns and links them to the appropriate system GMM structure. The final two sections present the empirical results and discuss their relevance.
2. Literature Review
Significant debate persists over the ability of intergovernmental organisations (IGO’s) to activate capital market support for socially responsible investing (SRI). Unfortunately, there is an absence of empirical research to inform this debate. This paper attempts to fill this research gap by analysing the impact of a major IGO initiative, the United Nation’s Principles for Responsible Investing (PRI), on attracting investment into SRI funds. However, this task highlights an important technical issue which is hampering the ability of academic research to contribute to significant global debates. Empirical methods have not usually accounted for endogeneity problems. It is therefore likely that empirical literature misinforms key stakeholders and decision makers. In contrast, this paper adopts a sophisticated econometric technique to resolve the endogeneity concern and thereby produces robust answers to these critical questions. The results of these techniques raise doubts that the PRI initiative has been effective at advancing SRI.
The criticisms of IGO effectiveness range from arguments that IGO’s are instruments for domination by stronger states (Pauly, 1999) through to the IGO’s are a tool for other countries to control stronger states like the US (Call et al., 2017). In addition to these ideological criticisms, there is some emerging empirical evidence showing that the major IGO initiative for SRI investing, the PRI, has been successful (Motta and Uchida, 2018). However, that evidence only relates to the time leading up to the launch of the PRI. In contrast, by analysing the flows since inception of the PRI, this paper casts doubt on the PRI to influence fund flows. These findings therefore motivate the search for new strategies to improve the effectiveness of the PRI and other IGO’s. Potential strategies identified in this paper include: establishing IGO autonomy (Manulak, 2017), employing new frameworks to improve how IGO’s signal quality SRI (Bergh et al., 2014), and improving the mechanisms for collaboration - ranging from information sharing to coordinated action and conflict resolution (Galaz et al., 2012).
The PRI is a deserving target for analysis because of its size and potential. Kofi Annan, the Secretary-General of the United Nations, launched the PRI with the express aim of motivating investment managers to create a sustainable global financial system. The six principles of the PRI focus on incorporating ESG issues into the signatories’ investment processes and promote similar implementation across the industry. Since its launch, the PRI has proven popular and assets under management by PRI signatories grew to US$86.3 trillion by 2019. However, this initial momentum will need to be maintained if the PRI is to achieve significant influence over the investment industry. This paper attempts to find the value to fund managers of signing the PRI and thereby measures its influence on investors and the industry. The results can have important implications for how IGO’s approach initiatives like the PRI as well as the strategic decisions of investment managers.
Endogeneity is an issue which potentially undermines the contribution by academic research to the important challenges facing society. Adopting innovative methods to accommodate for endogeneity is dramatically recasting our knowledge of how capital markets work (Griffin et al., 2015; Schultz et al., 2010; Wintoki et al., 2012). Fund flow analysis is especially susceptible to endogeneity. Fund flow modelling exhibits all the main forms of endogeneity: dynamic endogeneity, simultaneity and unobserved heterogeneity. This paper applies a system generalized method of moments (GMM) approach with instruments selected to mitigate the three main forms of endogeneity.
The purpose of this paper is to ascertain whether the PRI will continue to be successful at marshalling funds towards SRI. The results will indicate whether the PRI has an ongoing role in progressing SRI investment practices. Fund flow data is therefore constructed by merging the comprehensive set of fund data from the Centre for Research in Security Prices Mutual Fund Database with the names of the PRI investment manager signatories. All the funds described as SRI funds (e.g. environmental, responsible and ethical etc.) are also identified. The sample should therefore reveal the drivers behind flows to those funds managed by PRI signatures and those specifically targeting SRI investors.
This paper paves the way for further evaluation of whether IGO’s successfully motivate capital market support for progressive environmental and social development. The paper demonstrates a more reliable methodology than typically used in empirical literature. System GMM is applied to resolve the endogeneity issues encountered in finance research. The findings indicate the PRI is not successful at attracting flows to the funds managed by PRI signatories. In addition to contributing more robust findings, this paper also applies an innovative framework to understand the issue of IGO impact on capital markets. Signalling theory enables a deeper understanding of what will improve the success of IGO initiatives such as the PRI. The theory identifies key aspects of successful signalling: the signal cost, the information problem, signal confirmation and pareto optimizing solutions (Bergh et al., 2014). Breaking down the process into these elements enables successful strategies to be identified to improve the PRI’s signalling.
The following section reviews the relevant literature and establishes the contributions of this paper. Section Three details the source and preparation of the SRI mutual fund data. Sections Four and Five examine the endogeneity concerns and links them to the appropriate system GMM structure. The final two sections present the empirical results and discuss their relevance.
3. Socially Responsible Investing Mutual Fund Data
The fund flow data for this article were compiled by merging the CRSP Mutual Fund Database with the list of investment manager signatories for the UN PRI to produce fund data for funds managed by PRI signatories. The data include monthly observations for total net assets (TNA), holding period returns, fund expense ratios, dates of inception, and flags for closed funds. The CSRP Mutual Fund Database style code is used to identify the funds categorized as US domestic equity funds. The relevant styles include large-, mid-, small-, and micro-cap, growth, income, and growth and income.
The PRI maintain a comprehensive list of investment manager signatories, retaining information regarding when they signed the PRI and, if they were subsequently excluded, the dates that they were removed from the list . The names of the investment managers on the PRI list (identified as account IDs) were matched to the three relevant columns of the CSRP Mutual Fund Database: the full name of the fund, the management company name, and the fund advisor name. In some cases, the fund name and the fund advisor columns identified investment managers contributing to the management process (in addition to the listed management company). If there was a PRI signatory contributing to the fund’s investment process, this warranted that the fund be included as a PRI fund. This is due to the extensive scope of SRI commitment that each manager makes when they sign the PRI.
Funds described as SRI funds were identified by searching the CSRP Mutual Fund Database fund names. The key search terms were based on the systematic literature review conducted by Daugaard (2020) and included terms such as ESG, values, social, impact, sustainable, and ethical. Shortened forms were used to capture related word structures (e.g., “sustain” to capture “sustainable”, “sustainably”, “sustainability” and so on). Entire fund suites for some management companies were included when those firms specialized in only offering SRI funds. For example, investment managers who are exclusively SRI managers include Domini, Pax, Trillium, Walden, Praxis, Parnassus, and Calvert. The search results were reviewed to remove funds that were identified by the search terms but were not SRI funds. For example, the search term “sustain” captured Principal’s “sustainable momentum index” exchange-traded fund (ETF); however, the ETF follows a momentum strategy and is not an SRI fund.
Data were cleaned by removing 24,098 observations wherein TNA and expense ratios were not recorded (i.e., stored as –99 or 0 in the CSRP Mutual Fund Database). A further 523 observations were removed that contained duplicate fund IDs and dates. The TNA observations were trimmed at the 0.5th and 99.5th percentiles to remove outliers. The expense ratios were trimmed at the 99.5th percentile and any values less than zero were removed.
The merged CSRP Mutual Fund Database and PRI databases create a unique sample of US equity funds. The funds managed by PRI signatories and those described as SRI funds were identified with relevant indicator variables. This collection of data is appropriate for applying regression analysis with PRI and SRI indicator variables. Table 1 reports the number of funds with PRI and SRI indicators. The funds not identified as PRI or SRI are classified as conventional funds. These data are relevant for examining the impact of signing the PRI on both conventional and SRI funds.
The fund numbers documented in Table 1 show the significant growth of domestic equity mutual funds has been plateauing. This slowdown in growth can be attributed to the rise in popularity of exchange traded funds (Hill et al., 2015). There are uniquely divergent patterns observed for funds managed by PRI signatories compared to SRI funds. At the inception of the PRI, there were understandably few funds managed by PRI signatories. However, this number has experienced phenomenal growth over the period analysed. In contrast, the number of funds identified as SRI has continued to represent only a small proportion of the total market. Despite earlier hopes for sustained growth in the SRI market (eg Renneboog et al. (2008b)), the numbers remain relatively low. This may be due to the more conventional funds responding to the demands by investors for more sustainable investment practices (Hartzmark & Sussman, 2019).
4. Endogeneity in Fund Flow Analysis
Endogeneity is a critical challenge for financial research. Significant empirical “truths” have been subsequently debunked through recognition of endogeneity (Griffin et al., 2015; Schultz et al., 2010; Wintoki et al., 2012). Empirical finance frequently encounters endogeneity issues which undermine identification and interpretation of the true causal relationships (Roberts and Whited, 2013). There are three major forms of endogeneity encountered in finance literature: dynamic endogeneity, simultaneity and unobserved heterogeneity (Schultz et al., 2010; Wintoki et al., 2012). All three forms are relevant to this article because they are all encountered in fund flow analysis.
Dynamic endogeneity arises when prior values of the dependent variable influence regressor values which then affect the current value of the dependent variable. An example of this is lagged fund flows. They are employed to model fund flow regressors such as returns (Renneboog et al., 2011; Wermers, 2003). Further, lagged fund flows are frequently employed to directly explain fund flows (Chiang and Huang, 2017; Coval and Stafford, 2007; Warther, 1995). In this context, Gruber (1996, p. 800) suggests the lagged fund flows are actually proxying for “other variables besides past performance that might account for future cash flows” (e.g. marketing effort and general reputation).
Simultaneity occurs when two variables are simultaneously impacted by each other. Contemporaneous monthly returns have a positive influence on the fund flows for the same month (Edelen and Warner, 2001; Warther, 1995).
Unobserved heterogeneity is commonly encountered across most econometric applications. It occurs if the relationship between the dependent variable and regressors is affected by an unobservable variable. In the present modelling there may be additional missing regressors which explain both the regressors and model errors (e.g. changes in pension regulations affecting both expense ratios and fund flows).
The principal solution for endogeneity is the use of instrumental variables (Baum, 2006). The two criteria for an effective instrument are that: the instrument is correlated with the model’s endogenous variables, and the instrument is uncorrelated with the model’s error term. This article applies instruments within the system GMM methodology. System GMM is preferred because of its improved treatment of endogenous issues compared to pooled OLS, fixed effects panel and difference GMM. System GMM contains the benefits of difference GMM (where the differencing eliminates fixed effects) and adds the benefit of additional instruments (by combining both a differenced version of the model with a levels version). Internal (rather than external) instruments are implemented because of their ready availability within the existing regressor and dependent variable data sets. The dynamic endogeneity issue will be resolved by including lagged fund flows in the regression model. However, including the lagged dependent variable in panel regressions is likely to create biased standard errors (Nickell, 1981). The choice of system GMM will accommodate for this bias through the appropriate choice of lagged regressors as instruments (Arellano and Bond, 1991).
The first criteria for a successful instrument (i.e. correlation with the model’s endogenous variables) is a typical trait for many of the instruments generated. For example, there is likely correlation between current returns and lagged fund flows. However, the more critical issue is to identify those instruments which are uncorrelated with the model’s errors. Therefore, to identify the best potential instruments, the regressors are grouped according to their relationship with the errors: are they endogenous, exogenous or predetermined regressors? Endogenous variables which are assumed to be correlated with the model’s error term (Woolridge, 2009). Contemporaneous fund returns is a variable encountered in literature which is assumed to be endogenous (Benson et al., 2010). While endogenous variables are clearly contributing to the model’s endogeneity, lags of these variables can potentially mitigate endogeneity issues.
An exogenous variable is assumed to be uncorrelated with model errors. They can potentially produce the most effective instruments for removing endogeneity. Age is a control variable encountered in fund flow literature (Bollen, 2007; El Ghoul and Karoui, 2017; Pollet and Wilson, 2008) which is assumed to be exogenous. This is because it is determined by time passing and not determined by other variables. Unfortunately, finding further exogenous variables is difficult because of the many forms of endogeneity. Some indicator variables are argued to be exogenous (e.g. fund style categories). In the present case, the SRI variable (indicating that a fund is described as an SRI fund) might be argued to be exogenous because it could represent the original and continuing nature of the investment vehicle. In contrast, the PRI variable (indicating the fund is managed by a PRI signatory) is more likely to be endogenous. The choice to sign the PRI is potentially influenced by lagged fund flows and therefore correlated with model errors. Specifically, poor fund flows can potentially motivate an investment manager to sign the PRI in the hope of subsequently attracting more funds. This argument could also be potentially levelled at the SRI indicator. For example, a series of poor fund flows could motivate the investment manager to rename the fund an SRI fund. However, whether the indicator variables are defined as endogenous or exogenous, they will be excluded from the instrumentation process because their persistence is likely to contribute to further bias in the coefficient estimates (Roodman, 2009a).
In contrast to assuming complete exogeneity, many variables can more easily be assumed sequentially exogenous. This only requires their lag values to be uncorrelated with current errors. Lag values of these variables would therefore produce useful instruments for managing endogeneity. Sequential exogenous is commonly assumed for predetermined regressors. In the context of fund flows, predetermined regressors include lagged fund flows (Chiang and Huang, 2017; Coval and Stafford, 2007; Gruber, 1996; Warther, 1995), lagged returns (Benson et al., 2010; Carhart, 1997; Chevalier and Ellison, 1997; Goetzmann and Peles, 1997; Gruber, 1996; Ippolito, 1992; Sirri and Tufano, 1998) and control variables such as size (Berk and Green, 2004; Bollen, 2007; Pollet and Wilson, 2008; Renneboog et al., 2011; Sirri and Tufano, 1998) and fees (Sirri and Tufano, 1998).
Table 2 lists the regressors categorised as endogenous, exogenous or predetermined regressors. The table also identifies the most appropriate lags to be applied to each category for instrumenting following Roodman (2009a) and (Schultz et al., 2010). To generate the most appropriate instruments from the endogenous variables, the second and subsequent lagged variable levels will be used in the differences equation and the first and subsequent lagged differences are used in the levels equation. For the exogenous variables, the most appropriate instruments will be derived from the contemporaneous variables for both the differences and levels equations. For the predetermined variables, the most appropriate instruments will be derived from the first and subsequent lagged variable levels in the differences equation and the contemporaneous and subsequent lagged differences in the levels equation.
This table lists the regressors employed in the fund flow model and categorises their regressor type. Specifically, the regressors are categorised according to whether they are endogenous, exogenous or predetermined variables. The reasoning for each categorisation is presented along with the appropriate lags of each variable for instrumentation. PRI is an indicator variable for funds managed by investment managers who have signed the PRI and have not been excluded from the signatory list; SRI is in an indicator variable for funds described as socially responsible investing funds; return is the monthly holding period return; age is the age of the fund; expense is the expense ratio; size is the log of the fund’s total net assets; lagged fund flow is the dollar amount flowing into or out of a fund over the previous month; and lagged return is the return over the previous month.
The dynamic system GMM model contains both a levels equation and a differences equation:
where: is the dollar amount flowing to fund over month ; is a vector of endogenous variables (e.g. return); is a vector of coefficients for the endogenous variables; is a vector of exogenous variables (e.g. age); is a vector of coefficients for the exogenous variables; is a vector of pre-determined variables (e.g. expense); is a vector of coefficients for the pre-determined variables; is a vector of pre-determined lagged variables (e.g. lagged returns); is a vector of coefficients for the pre-determined lagged variables; and are the relevant error terms; and ∆ is the time-differencing operator.
The moment conditions from this system of equations will produce the following instruments:
where: ∆ is the time-differencing operator; is the dollar amount flowing to fund over month ; is a vector of endogenous variables; is a vector of coefficients for the endogenous variables; is a vector of exogenous variables; is a vector of coefficients for the exogenous variables; is a vector of pre-determined variables; and is a vector of coefficients for the pre-determined variables; is a vector of pre-determined lagged variables; is a vector of coefficients for the pre-determined lagged variables; are the maximum lag lengths of instruments created for the , , and groups of regressors for the differences equations; and are the maximum lag lengths of instruments created for the , , and groups of regressors for the levels equations.
When applying the GMM method, the empirical context will usually deliver more instruments than there are regressors. This means when estimating the model, there are more equations than there are unknown coefficients. This system is described as overidentified and cannot be exactly solved. The GMM method therefore identifies coefficients which minimise their combined correlation with the model errors. This can be done by solving the problem:
where: M is a weighting matrix of the correlations between coefficients and the model errors
To derive efficient estimates for the coefficients , , and from Equation 2, M will need to be the inverse of the variance-covariance matrix, Ω-1. This will create lower weights for the conditions which have the greatest contribution to variance. GMM uses a simple homoscedastic estimate of Ω to identify consistent estimates of the coefficients (assuming independent and identically distributed errors). These coefficients are employed to better estimate Ω and thereby re-estimate the coefficients. This two-step estimation procedure is attributed to Hansen (1982). It produces consistent and efficient coefficient estimates (which allow for heteroskedasticity and serial correlation) and is robust to the potential unobservable heterogeneity, simultaneity and dynamic endogeneity (Roodman, 2009a).
Holtz-Eakin et al. (1988) developed the accepted method for creating the matrix of internal instrument variables. It contains individual instruments from every lag for every time period. Where there is a missing observation, zeroes are included to fill the matrix. Because the instrumenting variables are only used at one observation period, when combined with lags of the instrumenting variables, there are many zeros required to fill the matrix. This process produces a matrix which is predominantly zeroes (Roodman, 2009b). A similar pattern emerges for the instrument matrix created for the levels equation (although only one lag is typically used for each period).
One of the challenges with implementing system GMM is the choice of how many instruments to incorporate. “The number of instruments in difference and system GMM tends to explode with T” (Roodman, 2009a, p. 128). In the present case the monthly data commences in April 2006 and can therefore generate thousands of instruments. While the literature does not contain specific guidance on how many instruments to select, Mátyás (1999) demonstrates that additional instruments will only improve asymptotic efficiency if they contribute extra information to that contained in the existing moment conditions. This is likely to motivate imposing constraints on the instrumental choice where they are considered unlikely to provide further explanatory power. Therefore, lags of the instrumented variables are limited to those most likely to improve estimation efficiency.
Roodman (2009b) and Bontempi and Mammi (2015) provide suggestions on how to impose constraints. In addition to limits on the number of lags employed, the instrument variable matrix can be collapsed to a single vector. This adds the selected lagged variables for each time period and has the effect of squashing the matrix and removing many of the zeros.
Endogeneity is therefore addressed by using instrumental variables in the system GMM structure. However, the problem of significantly over identifying the required coefficients (by having far too many instruments) is managed by adding the instruments across time periods and limiting the instrumenting lags. The predetermined variables (i.e. expense and size) have instruments commencing at the first lag through to the fifth lag for the difference equation and therefore from the second to the sixth lag for the levels equation. Lagged fund flows and returns are likely to less static than expense and size and a longer series of lags has the potential to provide more explanatory information. Therefore, lags commencing at the first lag through to the eighth lag are employed for lagged fund flows. The lag series is extended by an additional lag for returns because the lags are instrumenting for both the contemporaneous and lagged return values. This combination enables a workable solution for fund flow analysis and addresses the endemic endogeneity issues of dynamic endogeneity, simultaneity and unobserved heterogeneity.
5. System GMM Regression Model
The main aim of this analysis is to evaluate whether signing the PRI is advantageous for investment managers. Specifically, the regression model ascertains if there is a positive flow of funds attributable to the PRI designation. Of note, the method applied here accommodates for the three main forms of endogeneity: dynamic endogeneity, simultaneity and unobserved heterogeneity. By accommodating for these econometric issues, it is possible that the results with differ to and improve upon previous literature.
Fund flows are measured in dollars units (rather than percentage change). The reasons for this choice are motivated by Fant and O'Neal (2000). The results will thereby reveal the full dollar impact of investors responding to the PRI signature across funds and for the industry. This measure should also avoid biases from scaling (Kim, 1999). However, the use of dollar fund flows will require heteroskedasticity-consistent standard errors (White, 1980). The fund flows will therefore be calculated as:
where is the dollar amount flowing into or out of fund over month ; is the total net assets as at the last trading day of month for fund ; and is the monthly holding period return over month for fund .
The main focus of regression equations used in fund flow literature has been to model flow to performance relationships (Berk and Green, 2004; Fant and O'Neal, 2000; James and Karceski, 2006). In this context, the primary regressors have been contemporaneous and lagged returns, and lagged fund flows. Contemporaneous returns are expected to have a positive influence on fund flows because “Investors are quick to recognize the high performing funds and money follows” (Benson et al., 2010, p. 65). Lagged returns also have a positive impact (Carhart, 1997; Chevalier and Ellison, 1997; Goetzmann and Peles, 1997; Gruber, 1996; Ippolito, 1992; Sirri and Tufano, 1998). ‘Mutual fund consumers chase returns, flocking to funds with highest recent returns’ (Sirri and Tufano, 1998, p. 1590). Lagged fund flows is also encountered as a regressor in fund flow literature (Chiang and Huang, 2017; Coval and Stafford, 2007; Gruber, 1996; Warther, 1995). Time effects are also included to accommodate for other variables which are constant across funds but change through time. For example, tax changes and consumption preferences can make investing more or less attractive in different periods.
Conventional control variables for fund flow analysis found in literature include expense ratios, size and age. ‘Consumers are fee-sensitive in that lower-fee funds and funds that reduce their fees grow faster’ (Sirri and Tufano, 1998, p.1590). Size (logged) is included because it is likely to affect fund flows either directly or by impacting performance (Bollen, 2007; Pollet and Wilson, 2008; Renneboog et al., 2011; Sirri and Tufano, 1998). Berk and Green (2004) argue that size negatively impacts fund flows because either successful funds raise their fees, or their performance is affected by diseconomies of scale. The age of a fund is also a commonly employed control variable in the fund flow literature (El Ghoul and Karoui, 2017; Pollet and Wilson, 2008). Analysis by (Bollen, 2007) reveals the average fund flows on younger funds is great than the average on older funds. Negative coefficients are therefore anticipated across all these control variables.
The dynamic system GMM model introduced in the previous section contains two equations: differences and levels. For fund flow analysis, the components of the endogenous (i.e. PRI, SRI and Return), exogenous (age) and pre-determined (expense, size, lagged fund flow and lagged return) variable groups take the form:
where: is the dollar amount flowing into or out of fund over month ; is the coefficient for the regressor; is an indicator variable for funds managed by investment managers who have signed the PRI and have not been excluded from the signatory list; is an indicator variable for funds described as socially responsible investing funds; and are relevant interaction variables; is the monthly holding period return; is the expense ratio over the month; is the log of fund size at the beginning of month; is the age of fund at the beginning of month; and are the relevant error terms; and is the time-differencing operator. The instrumental variables are:
To ensure the robustness of the results, the tests are performed across sectors of the fund universe: retail and institutional investor types, investment styles (e.g. growth, income etc.), and investment categories (e.g. small caps, large caps etc.).
The coefficients for the indicator variable and the interaction variable are the key results relevant to this article. They will indicate whether signing the PRI attracts additional funds to (1) the full set of an investment manager’s funds, and (2) the SRI funds managed by the investment manager. The results will therefore reveal whether it is advantageous for investment managers to sign the PRI.
6. Empirical Results
If signing the United Nations’ Principles for Responsible Investing attracts new fund flows, more investment managers will be motivated to sign. This would pave the way for the PRI to successfully influence the investment decision making processes across the funds management industry. This paper attempts to estimate the value of signing the PRI. However, there are significant econometric challenges with identifying the causational forces driving fund flows. The three major forms of endogeneity are all encountered in fund flow analysis: dynamic endogeneity, simultaneity and unobserved heterogeneity. This paper therefore resolves these concerns by applying a System Generalised Method of Moments (GMM) approach to understand what really drives fund flows.
6.1. Univariate Analysis
The univariate statistics for the regressor variables and correlation coefficients between these variables are presented in Table 3. The mean monthly returns are similar for all funds, PRI funds and SRI funds. This is consistent with empirical literature comparing SRI and conventional fund returns (Daugaard, 2019) and also consistent with the non-significant correlation between the SRI indicator and the return variable. There is a negative average monthly fund flow observed across the full collection of funds. This is consistent with the trend away from mutual funds to ETFs over the past decade. However, PRI and SRI funds have achieved positive average fund flows in the face of the industry-wide trend. SRI funds are generally younger than other funds. This explains their smaller size (despite their larger average fund flows).
This table presents the univariate statistics and correlation coefficients for regressor variables. The data covers monthly observations from April 2006 to February 2018. The statistics presented include the number of observations (N), mean average, standard deviations (St. dev.), median average, skew and kurtosis. Panel A shows univariate statistics for all 7628 funds. Panel B shows statistics for the 3553 funds managed by signatories to the Principles of Responsible Investing (PRI). Panel C shows statistics for the 175 funds described as socially responsible investing (SRI) funds. Panel D shows the Pearson correlation coefficients across the regressor variables for all the funds. Correlation coefficients significant at the 1% level are indicated by ***. Returns are calculated as holding period returns per month. Fund flows are measured as the monthly change in total net assets adjusted for monthly returns. SRI and PRI are indicator variables for funds described as SRI funds and funds managed by PRI signatories respectively. Expense is the expense ratio from the most recent reporting period. Age is the number of months since the fund’s inception. Size is the natural log of the fund’s total net assets.
The fund flow correlation statistics are broadly in line with existing literature and suggest positive coefficients for the PRI and SRI indicator variables. Fund flows are positively correlated with returns. This is consistent with the flow-performance relationship documented in empirical literature (Berk and Green, 2004; Ferreira et al., 2012). Fund flows are negatively correlated with the control variables (consistent with the empirical literature documented in the previous section). The flows are positively correlated with the SRI and PRI indicator variables. This relationship is the focus of the current regression analysis. Specifically, this paper tests whether this relationship is causal: does signing the PRI cause increased fund flows for SRI and conventional funds?
6.2. Multivariate Regression Analysis
To estimate the value of signing the PRI, fund flows are regressed against an indicator variable for funds managed by PRI signatories. An indicator variable is also included for funds described as socially responsible investing (SRI) funds (and an interaction term) to see whether SRI funds place a special value on the PRI signature. The significance of the coefficients on these variables should indicate the value of signing the PRI to conventional and SRI investors.
Table 4 shows the results of regressing funds flows employing a System GMM approach. The coefficients for the PRI indicator variable and the PRI x SRI interaction term are not significantly different from zero. These results imply that a fund being managed by a PRI signatory does not attract funds from either conventional or SRI investors. This contrasts with the results from the base-line regressions using pooled OLS and dynamic panel methods. In those two approaches there are positive coefficients for the PRI indicator variable (at a 1% level for OLS and 5% level for the dynamic panel). There is also a significant coefficient for the PRI x SRI interaction term under the dynamic panel approach (at a 1% level). However, the base-line methods do not completely accommodate for the endogeneity issues encountered in fund flow analysis. The OLS method is susceptible to biases from dynamic endogeneity, simultaneity and unobserved heterogeneity. While the panel regression does correct for unobserved heterogeneity, its coefficients are potentially biased by dynamic endogeneity and simultaneity. It is therefore likely the apparently positive coefficients of the base-line methods are not reliable indications of the importance of the PRI signature. The system GMM results provide evidence that, after accommodating for the existing exogenous issues, signing the PRI does not attract additional fund flows. These results are preferable to the base-line findings, however, it is important to note that Demsetz (1983) predicted there would be no significant results if simultaneity is present. The true relationship will be disguised in panel analysis unless applied at a granular level (e.g. each fund potentially experiences a different impact for its manager signing the PRI). Less sophisticated econometric techniques (e.g. natural experiments) can also be considered for future research.
The System GMM results also suggest there are not significant fund flows attributable to funds described as SRI funds. This is consistent with the base-line results. However, it should be noted that these insignificant results could be due to positive preferences for SRI funds (i.e. from SRI investors) being counter balanced by negative preferences from conventional investors. A more convincing test would therefore take the form of natural experiments. The experiments would link exogenous events with SRI choices. An exogenous time-series of ESG events could be selected based on their likely impact on SRI fund selection. This would enable a more direct test of SRI fund preferences.
This table reports the results of regressing fund flows on indicator variables for funds described as socially responsible investing funds (SRI) and funds managed by PRI signatories (PRI). The period of analysis is from April 2006 to February 2018. Fund flow is calculated as the monthly change in total net assets (TNA) adjusted for monthly holding period returns. Columns (1) presents the results for System Generalized Methods of Moments (GMM). Columns (2) and (3) present base-line results for comparison using pooled Ordinary Least Squares and Dynamic Panel Fixed Effects respectively. All the regressions include control variables (lagged and contemporaneous returns, lagged flows, lagged size (log of TNA), expense and age. The coefficients for the control variables were consistent with empirical literature.
The other typical regressor variables for fund flow analysis (contemporaneous and lagged returns, lagged fund flows, expense, size and expense ratios) all generated coefficients which were largely in line with existing empirical literature. Similar results were obtained for the regressions across fund types (retail and institutional), fund categories (large, mid, small and micro caps), and investment styles (growth, income, and growth & income).
In summary, the results show that, after accommodating for endogeneity, causal relationships between the indicator variable for PRI signatories and the PRI x SRI interaction term become insignificant. This suggests that the results from the OLS and panel regressions are spurious, and signing the PRI is not likely to drive additional fund flows.
7. Discussion
The aim of this study is to identify the impact on fund flows caused by an investment manager signing the PRI. The comprehensive set of fund data from the CRSP MFDB is therefore matched with the PRI investment manager signatory list. Unfortunately, fund flow analysis is not straight forward. Fund flow analysis exhibits all three major forms of endogeneity problems: dynamic endogeneity, simultaneity and unobserved heterogeneity. This means the coefficients can be unreliable. A system GMM approach is therefore applied because it addresses these endogeneity issues. The major results show there is no significant impact on fund flows from investment managers signing the PRI.
7.1. Interpreting the Main Results
The PRI indicator was not statistically significant. This result reveals that conventional funds managed by PRI signatories do not attract additional fund flows compared to those funds not managed by PRI signatures. This appears to contrast with the findings of Hartzmark and Sussman (2019) where there is a preference by investors for conventional funds with higher Morningstar ESG ratings. The contradiction could be due to the PRI not successfully communicating to investors the ESG merits of their signatories, compared to the ratings communicated by Morningstar. This issue could be further examined by surveying investors as to their understanding of what the PRI signature represents. On a similar vein, the portfolios of PRI signatories could be evaluated in relation to their Morningstar ratings.
The PRI x SRI interaction term was also not significant. This means SRI investors do not prefer PRI designated managers over non PRI designated managers. This result differs with the findings of Li and Humphrey (2017) where SRI funds received positive flows following the manager signing the PRI. However, their positive results may be due to endogeneity issues from missing regressors. For example, the PRI signing could correspond with missing explanatory variables such as the marketing effort of the funds. In contrast, this paper employs methods which explicitly address this issue.
The System GMM results also show no significant flows to funds described as SRI funds. Despite this result being consistent with the base-line results, it is still a surprise. SRI investors are likely to be a distinct element of the investor market. Previous literature has shown that investors in SRI funds exhibit different characteristics than conventional investors. The inflows of SRI investors are more sensitive to past positive returns and their outflows are less sensitive to past negative returns (Bollen, 2007; Marti-Ballester, 2015; Renneboog et al., 2011), they have more stable fund flows (Peifer, 2011) and are more loyal to their choices (Benson and Humphrey, 2008; El Ghoul and Karoui, 2017). Given these distinct attributes of SRI investors it would be anticipated that there would be additional fund flows associated with funds described as SRI funds. A possible explanation for this surprise result is that the positive flows from SRI investors could be offset by negative preferences from conventional investors. Empirical literature also documents the preferences for non-SRI funds. For example, Hong and Kacperczyk (2009) examines preferences for funds with significant exposures to “sin stocks”. Therefore, a more convincing test of whether there are distinct fund flows associate with SRI funds should take the form of natural experiments. For example, exogenous events could be selected for their likely impact on SRI fund selection. This would be a more direct test for positive flows from SRI investors.
The insignificant results for the PRI indicator and PRI x SRI interaction terms also contrast with the OLS and dynamic panel results reported in this paper. However, the OLS and panel methods are subject to endogeneity issues which may be the source of their results. In contrast, these issues are appropriately addressed by the System GMM methodology.
7.2. Signalling Theory
SRI fund flows is a fertile area of research for applying signalling theory from management literature (Spence, 1973, 2002). Signalling theory deals with how individuals reduce uncertainty of strategic decisions in situations of incomplete and asymmetrical information. “In response, stakeholders seek out signals – observable actions that provide information about unobservable attributes” (Bergh et al., 2014, p. 1335). This theory is relevant to the context of an investor selecting an SRI fund. Bergh et al. (2014) provides an example where, if only high-quality new ventures secure venture capitalist funding, then this funding is a signal for distinguishing between high- and low-quality ventures. In a similar way, the designation of an SRI fund by a designating agent (e.g. the PRI) could distinguish high- and low-quality SRI processes.
A key element of signalling theory is the presence of a separating equilibrium. This usually means choices are motivated by expectations, costs and evidence associated with an observable signal. In the current context the signal occurs when an investment manager signs the PRI. A separate equilibrium for this signal would be demonstrated by a statistically significant positive coefficient for the PRI indicator variable or the PRI x SRI interaction term. However, the current results imply that signing the PRI does not create a signal of quality for SRI investors.
The potential reasons for the insignificant results identify research trajectories which extend the applications of signalling theory, increase our understanding of SRI fund flow drivers and identify improved policies for the PRI and other SRI designating agents. The reasons for the results reflect the essential aspects of a separating equilibrium: signal cost, an information problem, signal confirmation and pareto optimizing solutions Bergh et al. (2014). The natural research trajectories include
- Testing whether the signal cost encountered to gain the PRI designation is substantial enough. A sufficient cost is necessary to create a distinction between quality and non-quality SRI processes. Note that the cost is not necessarily just about licensing and is likely to include structural and portfolio reorganisation. An example of this cost is documented by Li and Humphrey (2017) in the form of increased portfolio turnover by investment managers preparing to sign the PRI.
- The information problem in this case is whether the communication about the SRI quality of PRI signatories is clearly conveyed to investors. This looks to be a major challenge here because the results for the PRI designation differ to those documented for other designating agents. For example, Hartzmark and Sussman (2019) find a positive impact on fund flows in response to Morningstar’s “salient” presentation of SRI information.
- Signal confirmation relates to measuring the quality of SRI outcomes and evaluating whether they are clearly demonstrated to investors. This trajectory includes identifying the most appropriate measurement approach as well as testing that the channel of information is effective.
- Pareto optimizing solutions occur where the recipient successfully uses the signal to identify products. The solutions depend on the signalling costs and the expectations of investors and funds. This element will motivate a range of potential theory development as well as applied empirical testing.
Considering optimizing solutions reveals the potentially rich knowledge that signalling theory can reveal about SRI fund flows. The “quality” in signalling theory is normally consistently understood by all the participating actors. However, quality of an SRI fund is in the eye of the beholder. For an SRI investor a quality SRI process increases their utility (Renneboog et al., 2008). However, a successful SRI process can potentially have a negative impact on the utility of a conventional investor (Hong and Kacperczyk, 2009). This negative impact could be by way of the expenses attracted by carrying out the SRI research and the reduced return efficiency from applying screens and thereby reducing the investment opportunity set. In particular, the “sin” stocks (with higher costs of capital) are likely to be excluded stocks. Signalling theory places significant emphasis on the role of ‘separating equilibrium’ (Bergh et al., 2014). In the context of SRI fund flow analysis, an array of equilibrium points is likely because of the variety of applicable utility functions in addition to the costs associated with quality signals.
A focus on signalling theory emphasises the presence of endogeneity issues. The signal being analysed is intentionally proxying for unobserved qualities (Kirmani and Rao, 2000). The signal is therefore likely to be correlated with missing regressors (as well as the error term). While the system GMM is one potential methodology to mitigate the endogeneity issues, a purer solution involves identifying quasi- natural experiments. In the present case this would require identifying exogenous shocks which drive fund flows to SRI funds and then testing to see whether the PRI signatures generate higher flows following the shocks. Alternatively, qualitative research in the form of interviews could be conducted with respect to the expectations and preferences of SRI investors.
7.3. Alternative Interpretations and Further Research
The results reveal a lack of interest by investors for the guidance provided by a globally recognised international alliance concerned with social good (i.e. the United Nations). The results advance our knowledge on the interrelationship between global social concerns and capital markets. The findings point to a disconnect between the mechanisms for promoting social concerns and the actual preferences and behaviour of investors. Further research could increase our understanding of this disconnect and provide potentially resolutions. There are a range of insightful frameworks which could potentially be applied to explain this phenomenon. The results could be explained by: the signalling theory discussed earlier, an imbalance between SRI and non-SRI investors in an asset pricing context (Heinkel et al., 2001), the use of a legitimizing perspective (Haigh and Hazelton, 2004), or determining if the SRI designations represent effective “swords” for SRI change or merely “banners” to motivate further action (Statman, 2000).
The lack of significant results found here could also simply be fuelled by a distrust of the UN by US investors. A negative attitude towards the United Nations by Americans is reflected in recent surveys possibly echoing the sentiment that “the U.N. is a tool used by other countries, including America’s enemies, to curb U.S. interests” (Call et al., 2017). This potential explanation leads to the potential for future empirical research contrasting the PRI with the influence of designations from other NGO’s (e.g. US SIF) and commercial agents (e.g. MSCI and Sustainalytics).
Although the System GMM model accommodates for the endogeneity issues (which undermine the relevance of the base-line models), there are econometric issues encountered when applying System GMM to fund flow data, fund flow control variables and fund indicator variables. These issues are reflected in the Sargan-Hansen and Arellano-Bond test results and the indicator coefficient levels. Although the coefficients for the PRI indicator variable and PRI x SRI interaction term are not statistically significantly, their values appear unusually large. This may be attributed to the regressor variables containing high levels of persistence and result in near-collinearity and a near-singular correlation matrix. A cleaner solution to these issues will be to adopt a natural approach.
In conclusion, the major results of this paper show that signing the PRI does not attract additional fund flows to either SRI or conventional funds. This result contrasts with previous literature where simpler econometric methods were employed. The results are important because they raise the prospect that signing the PRI is not an effective signal of SRI quality. This motivates further research to determine how the PRI designation could become more effective. This paper therefore prompts the quest for better information reporting and actions to drive quality socially responsible investing.
Conflicts of Interest
The author declares no conflicts of interest.
References
- Akerlof, G.A., 1978. The market for “lemons”: Quality uncertainty and the market mechanism, Uncertainty in economics. Elsevier, pp. 235-251.
- Arellano, M., Bond, S., 1991. Some tests of specification for panel data: Monte Carlo evidence and an application to employment equations. The review of economic studies 58, 277-297. [CrossRef]
- Baum, C.F., 2006. An Introduction to Modern Econometrics Using Stata. Stata Press, College Station, Texas.
- Benson, K.L., Faff, R.W., Smith, T., 2010. The simultaneous relation between fund flows and returns. Australian journal of Management 35, 51-68. [CrossRef]
- Benson, K.L., Humphrey, J.E., 2008. Socially responsible investment funds: Investor reaction to current and past returns. Journal of Banking & Finance 32, 1850-1859. [CrossRef]
- Bergh, D.D., Connelly, B.L., Ketchen Jr, D.J., Shannon, L.M., 2014. Signalling theory and equilibrium in strategic management research: An assessment and a research agenda. Journal of Management Studies 51, 1334-1360.
- Berk, J.B., Green, R.C., 2004. Mutual fund flows and performance in rational markets. Journal of Political Economy 112, 1269-1295. [CrossRef]
- BliegeBird, R., Smith, E., Alvard, M., Chibnik, M., Cronk, L., Giordani, L., Hagen, E., Hammerstein, P., Neiman, F., Bird, R., 2005. Signaling theory, strategic interaction, and symbolic capital. Current anthropology 46, 221-248.
- Bollen, N.P., 2007. Mutual fund attributes and investor behavior. Journal of Financial and Quantitative Analysis 42, 683-708. [CrossRef]
- Bontempi, M.E., Mammi, I., 2015. Implementing a strategy to reduce the instrument count in panel GMM. The stata journal 15, 1075-1097. [CrossRef]
- Call, C.T., Crow, D., Ron, J., 2017. Is the UN a Friend or a Foe? The Brookings Institution, October 3.
- Carhart, M.M., 1997. On persistence in mutual fund performance. The Journal of Finance 52, 57-82.
- Chevalier, J., Ellison, G., 1997. Risk Taking by Mutual Funds as a Response to Incentives. Journal of Political Economy 105, 1167-1200. [CrossRef]
- Chiang, M.-H., Huang, H.-Y., 2017. Do mutual fund flows drive the disposition behaviour of fund managers? Investment Analysts Journal 46, 311-323. [CrossRef]
- Connelly, B.L., Certo, S.T., Ireland, R.D., Reutzel, C.R., 2011. Signaling theory: A review and assessment. Journal of management 37, 39-67. [CrossRef]
- Coval, J., Stafford, E., 2007. Asset fire sales (and purchases) in equity markets. Journal of Financial Economics 86, 479-512. [CrossRef]
- Daugaard, D., 2019. Emerging new themes in environmental, social and governance investing: A systematic literature review. Accounting & Finance. [CrossRef]
- Demsetz, H., 1983. The structure of ownership and the theory of the firm. The Journal of Law and Economics 26, 375-390. [CrossRef]
- Edelen, R.M., Warner, J.B., 2001. Aggregate price effects of institutional trading: a study of mutual fund flow and market returns. Journal of Financial Economics 59, 195-220. [CrossRef]
- El Ghoul, S., Karoui, A., 2017. Does corporate social responsibility affect mutual fund performance and flows? Journal of Banking & Finance 77, 53-63. [CrossRef]
- Fant, L.F., O'Neal, E.S., 2000. Temporal changes in the determinants of mutual fund flows. Journal of Financial Research 23, 353-371. [CrossRef]
- Ferreira, M.A., Keswani, A., Miguel, A.F., Ramos, S.B., 2012. The flow-performance relationship around the world. Journal of Banking & Finance 36, 1759-1780. [CrossRef]
- Galaz, V., Crona, B., Österblom, H., Olsson, P., Folke, C., 2012. Polycentric systems and interacting planetary boundaries—Emerging governance of climate change–ocean acidification–marine biodiversity. Ecological Economics 81, 21-32.
- Goetzmann, W.N., Peles, N., 1997. Cognitive dissonance and mutual fund investors. Journal of Financial Research 20, 145-158. [CrossRef]
- Griffin, P.A., Jaffe, A.M., Lont, D.H., Dominguez-Faus, R., 2015. Science and the stock market: Investors' recognition of unburnable carbon. Energy Economics 52, 1-12. [CrossRef]
- Gruber, M.J., 1996. Another Puzzle: The Growth in Actively Managed Mutual Funds. The Journal of Finance 51, 783-810.
- Haigh, M., Hazelton, J., 2004. Financial markets: a tool for social responsibility? Journal of Business Ethics 52, 59-71. [CrossRef]
- Hansen, L.P., 1982. Large sample properties of generalized method of moments estimators. Econometrica: Journal of the Econometric Society, 1029-1054. [CrossRef]
- Hartzmark, S.M., Sussman, A.B., 2019. Do investors value sustainability? A natural experiment examining ranking and fund flows. The Journal of Finance. [CrossRef]
- Heinkel, R., Kraus, A., Zechner, J., 2001. The effect of green investment on corporate behavior. Journal of Financial and Quantitative Analysis 36, 431-449. [CrossRef]
- Holtz-Eakin, D., Newey, W., Rosen, H.S., 1988. Estimating vector autoregressions with panel data. Econometrica: Journal of the Econometric Society, 1371-1395. [CrossRef]
- Hong, H., Kacperczyk, M., 2009. The price of sin: the effects of social norms on markets. Journal of Financial Economics 93, 15-36. [CrossRef]
- Ippolito, R.A., 1992. Consumer reaction to measures of poor quality: Evidence from the mutual fund industry. The Journal of Law and Economics 35, 45-70. [CrossRef]
- James, C., Karceski, J., 2006. Investor monitoring and differences in mutual fund performance. Journal of Banking & Finance 30, 2787-2808. [CrossRef]
- Jandhyala, S., Phene, A., 2015. The role of intergovernmental organizations in cross-border knowledge transfer and innovation. Administrative Science Quarterly 60, 712-743. [CrossRef]
- Kim, J.-H., 1999. Spurious correlation between ratios with a common divisor. Statistics & Probability Letters 44, 383-386. [CrossRef]
- Kirmani, A., Rao, A.R., 2000. No pain, no gain: A critical review of the literature on signaling unobservable product quality. Journal of marketing 64, 66-79. [CrossRef]
- Laidroo, L., Sokolova, M., 2015. International banks’ CSR disclosures after the 2008 crisis. Baltic Journal of Management. [CrossRef]
- Li, Y., Humphrey, J.E., 2017. Commitment to change or greenwashing? How signing the Principles for Responsible Investment affects flow to mutual funds,.
- Manulak, M.W., 2017. Leading by design: Informal influence and international secretariats. The Review of International Organizations 12, 497-522. [CrossRef]
- Marti-Ballester, C.P., 2015. Investor reactions to socially responsible investment. Management Decision 53, 571-604. [CrossRef]
- Matten, D., Moon, J., 2008. “Implicit” and “explicit” CSR: A conceptual framework for a comparative understanding of corporate social responsibility. Academy of management Review 33, 404-424.
- Mátyás, L., 1999. Generalized method of moments estimation. Cambridge University Press.
- Motta, E.M., Uchida, K., 2018. Institutional investors, corporate social responsibility, and stock price performance. Journal of the Japanese and International Economies 47, 91-102. [CrossRef]
- Pauly, L.W., 1999. Good governance and bad policy: the perils of international organizational overextension. Review of International Political Economy 6, 401-424. [CrossRef]
- Peifer, J.L., 2011. Morality in the financial market? A look at religiously affiliated mutual funds in the USA. Socio-Economic Review 9, 235-259. [CrossRef]
- Pollet, J.M., Wilson, M., 2008. How does size affect mutual fund behavior? The Journal of Finance 63, 2941-2969. [CrossRef]
- Renneboog, L., Ter Horst, J., Zhang, C., 2008. The price of ethics and stakeholder governance: the performance of socially responsible mutual funds. Journal of Corporate Finance 14, 302-322. [CrossRef]
- Renneboog, L., Ter Horst, J., Zhang, C.D., 2011. Is ethical money financially smart? Nonfinancial attributes and money flows of socially responsible investment funds. Journal of Financial Intermediation 20, 562-588. [CrossRef]
- Roberts, M.R., Whited, T.M., 2013. Endogeneity in empirical corporate finance1, Handbook of the Economics of Finance. Elsevier, pp. 493-572.
- Roodman, D., 2009a. How to do xtabond2: An introduction to difference and system GMM in Stata. The stata journal 9, 86-136. [CrossRef]
- Roodman, D., 2009b. A note on the theme of too many instruments. Oxford Bulletin of Economics and statistics 71, 135-158. [CrossRef]
- Rozeff, M.S., 1998. Stock splits: Evidence from mutual funds. The Journal of Finance 53, 335-349. [CrossRef]
- Schultz, E.L., Tan, D.T., Walsh, K.D., 2010. Endogeneity and the corporate governance-performance relation. Australian journal of Management 35, 145-163. [CrossRef]
- Sirri, E.R., Tufano, P., 1998. Costly Search and Mutual Fund Flows. The Journal of Finance 53, 1589-1622. [CrossRef]
- Spence, M., 1973. Job market signaling. Quarterly Journal of Economics 87, 355-374. [CrossRef]
- Spence, M., 2002. Signaling in retrospect and the informational structure of markets. American Economic Review 92, 434-459. [CrossRef]
- Statman, M., 2000. Socially responsible mutual funds (corrected). Financial Analysts Journal 56, 30-39. [CrossRef]
- Warther, V.A., 1995. Aggregate mutual fund flows and security returns. Journal of Financial Economics 39, 209-235. [CrossRef]
- Wermers, R., 2003. Is money really'smart'? New evidence on the relation between mutual fund flows, manager behavior, and performance persistence. New Evidence on the Relation between Mutual Fund Flows, Manager Behavior, and Performance Persistence (May 2003).
- White, H., 1980. A heteroskedasticity-consistent covariance matrix estimator and a direct test for heteroskedasticity. econometrica 48, 817-838. [CrossRef]
- Wintoki, M.B., Linck, J.S., Netter, J.M., 2012. Endogeneity and the dynamics of internal corporate governance. Journal of Financial Economics 105, 581-606. [CrossRef]
- Woolridge, J.M., 2009. Introductory Econometrics: A Modern Approach,(5e). South-Western, Michigan State University 378, 57.

Table 1.
Number of funds per year.
| Year |
All funds (1) |
PRI (2) |
SRI (3) |
| 2006 | 3175 | 17 | 68 |
| 2007 | 3574 | 129 | 82 |
| 2008 | 3845 | 294 | 90 |
| 2009 | 4037 | 401 | 95 |
| 2010 | 4280 | 745 | 101 |
| 2011 | 4615 | 1022 | 102 |
| 2012 | 4968 | 1208 | 108 |
| 2013 | 5432 | 1586 | 112 |
| 2014 | 5809 | 2011 | 112 |
| 2015 | 6260 | 2611 | 131 |
| 2016 | 6719 | 2871 | 150 |
| 2017 | 7370 | 3489 | 173 |
| 2018 | 7294 | 3430 | 172 |
Table 1 shows the number of funds categorized as US domestic equity funds in the Center for Research in Security Prices (CRSP) Mutual Fund Database from 2006 to 2018. The style categories include large-cap funds, mid-cap funds, small-cap funds, micro-cap funds, growth and income funds, growth funds and income funds. Column 1 shows all funds, Column 2 shows the number of funds managed by Principles for Responsible Investing (PRI) signatories and Column 3 shows the number of funds described as socially responsible investing (SRI) funds..
Table 2.
Endogenous, exogenous and predetermined regressors variables.
| Regressors variables | Endogenous, exogenous or predetermined categorisation | Instruments for difference equations | Instruments for levels equations |
| PRI | Indicator variable not used for instrumentation. | No instruments generated because persistent indicators can contribute to further bias in estimating coefficients. | |
| SRI | Indicator variable not used for instrumentation. | No instruments generated because persistent indicators can contribute to further bias in estimating coefficients. | |
| Return | Endogenous. Contemporaneous returns and fund flows simultaneously impact each other. | 2nd lag and deeper | 1st lag and deeper |
| Age | Exogenous. Fund age is determined by time and not by other variables. It is therefore uncorrelated with model errors. | Contemporaneous | Contemporaneous |
| Expense | Pre-determined. Lagged fund expense ratios are assumed to be correlated with past errors but exogenous to the error term. | 1st lag and deeper | Contemporaneous and deeper |
| Size | Pre-determined. Fund size is assumed to be correlated with past errors but exogenous to current errors. | 1st lag and deeper | Contemporaneous and deeper |
| Lagged fund flow | Predetermined. Past fund flows affect current returns which affect current fund flows. Therefore, lagged fund flows should impact current errors. | 1st lag (which will become 2nd lag of fund flow) and deeper | Contemporaneous (which will become 1st lag of fund flow) and deeper |
| Lagged return | Pre-determined. Missing regressors (e.g. fund style categories) could cause correlation between past return and current return. This combined with simultaneity between contemporaneous return and fund flows will make lagged returns an endogenous variable. | 1st lag (which is the same as the 2nd lag of return) and deeper | Contemporaneous (which is the same as the 1st lag of return) and deeper |
Table 3.
Descriptive statistics and correlation coefficients for regressor variables.
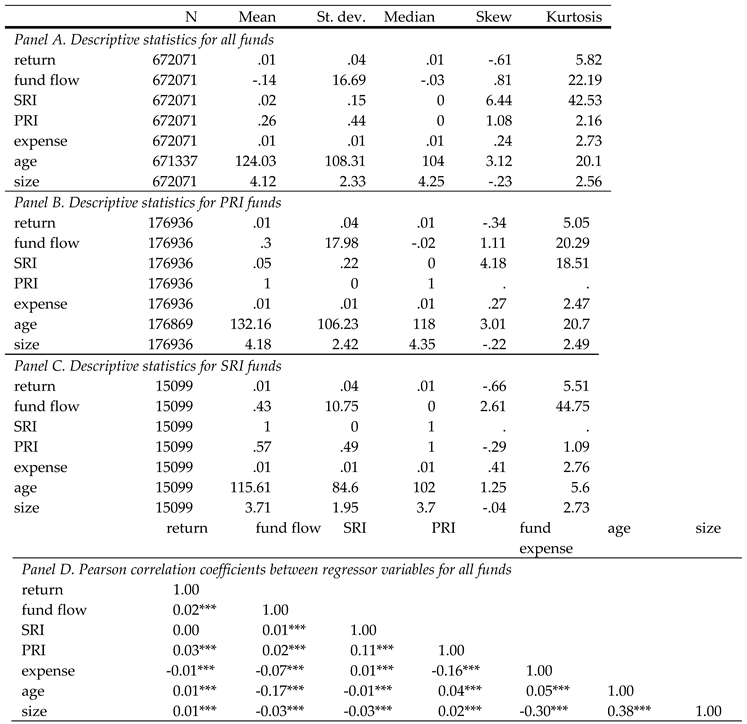 |
Table 4.
Mutual fund flows and the impact of PRI signatures.
| System GMM (1) |
OLS (2) |
Dynamic Panel (3) |
|
| PRI | 8.422 | 0.215*** | 0.326*** |
| (7.133) | (0.0389) | (0.131) | |
| SRI | 41.062 | -0.0717 | |
| (210.6) | (0.170) | ||
| PRI x SRI | -197.7 | 0.370 | 1.865** |
| (269.6) | (0.225) | (0.721) | |
| Adj R-squared | 0.289 | 0.183 | |
| Sargan test | 3118 | ||
| Hansen test | 409 | ||
| Arellano-Bond AR(1) | -31.29*** | ||
| Arellano-Bond AR(2) | 4.51** | ||
| Number of instruments | 32 | ||
| F statistic | 29 | 29,226 | 425 |
| Number of funds | 7,548 | 7,548 | 7,548 |
Disclaimer/Publisher’s Note: The statements, opinions and data contained in all publications are solely those of the individual author(s) and contributor(s) and not of MDPI and/or the editor(s). MDPI and/or the editor(s) disclaim responsibility for any injury to people or property resulting from any ideas, methods, instructions or products referred to in the content. |
© 2025 by the authors. Licensee MDPI, Basel, Switzerland. This article is an open access article distributed under the terms and conditions of the Creative Commons Attribution (CC BY) license (http://creativecommons.org/licenses/by/4.0/).
Copyright: This open access article is published under a Creative Commons CC BY 4.0 license, which permit the free download, distribution, and reuse, provided that the author and preprint are cited in any reuse.


