
Submitted:
16 August 2025
Posted:
18 August 2025
You are already at the latest version
Abstract
Arthritis is a prevalent and disabling condition that affects millions of people globally. This study aimed to investigate the associations between blood levels of trace elements (TEs), lifestyle factors, and arthritis. Data from NHANES 2011–2023 were analyzed via a complex survey-weighted design. We assessed the associations between blood concentrations of lead, cadmium, mercury, selenium, and manganese and arthritis status. Logistic regression models were employed, with TEs categorized into quartiles. Dose‒response relationships were evaluated via restricted cubic spline (RCS) modeling. Compared with those without arthritis, individuals with arthritis had significantly higher blood concentrations of lead and cadmium (both P < 0.001) and significantly lower levels of selenium (P = 0.007) and manganese (P < 0.001). After adjusting for confounders, individuals in the highest quartile of blood cadmium had reduced odds of arthritis [OR: 0.80; 95%CI: 0.70–0.90; P < 0.001], although RCS modeling revealed a significant nonlinear dose‒response relationship (P for nonlinearity = 0.001). The highest quartile of selenium was also associated with a reduced risk of arthritis [OR: 0.91; 95%CI: 0.83–0.99; P = 0.048]. Manganese showed a similar inverse association. These findings highlight the potential role of environmental exposure and lifestyle in arthritis development.
Keywords:
heavy metals
; micronutrients
; arthritis
; osteoarthritis
; human studies
1. Introduction
Arthritis, which encompasses various inflammatory and degenerative joint disorders, is a leading cause of disability worldwide [1,2]. Osteoarthritis (AO), in particular, is a major public health challenge that can cause significant problems for individuals and society [3], with age and obesity being significant contributing factors [2]. The impact of arthritis on global health is both substantial and multifaceted. The pathogenesis of these joint diseases involves complex interactions among cartilage, subchondral bone, and inflammatory processes [2,4,5]. Current treatment strategies often focus on symptom management rather than disease progression, highlighting the need for research on therapeutic modalities that target osteoarticular structural elements to delay disease progression and potentially reduce the need for joint replacement[2]. The etiology of arthritis is multifactorial and involves a complex interplay between environmental exposure, metabolic factors, and lifestyle determinants.
Both toxic and essential trace elements (TEs) have been implicated in the development and progression of arthritis. Heavy metals such as cadmium (Cd) and lead (Pb) can induce oxidative stress and inflammation, potentially contributing to joint degeneration [6,7]. In particular, Cd depletes cellular antioxidants and increases reactive oxygen species production, which may lead to tissue damage in the joints. Essential TEs such as selenium (Se) and manganese (Mn) appear to play protective roles in joint health. For example, Se has been found to antagonize the pro-oxidant effects of toxic metals and may help maintain antioxidant defenses [8]. Mn, along with Zn, has been observed to be lower in hemodialysis patients than in healthy controls, suggesting its importance in overall health [9]. However, the exact dose‒response relationships remain unclear, and potential nonlinear associations require further investigation.
In addition to environmental exposure, lifestyle factors, including obesity, smoking, diabetes, and socioeconomic status, are well-established contributors to arthritis [10]. Excess body weight increases mechanical stress on joints and alters metabolic pathways [11,12,13], whereas smoking and diabetes have been associated with impaired cartilage repair and increased inflammation [14,15]. Socioeconomic disparities further modulate disease risk through differential access to health care, diet, and occupational exposure. However, despite the growing recognition of these individual lifestyle determinants, there remains a significant research gap in understanding how they interact with TE exposure to influence the onset and progression of arthritis. Lifestyle factors may alter the absorption, metabolism, and toxicity of TEs, potentially exacerbating or mitigating their effects on joint tissues. However, few studies have systematically explored these interactions in humans.
Given the complex interplay between lifestyle factors and TE exposure in the development of arthritis, there is a clear need for studies investigating their combined effects at the population level. While mechanistic insights often require experimental or longitudinal designs, nationally representative cross-sectional datasets, such as a nationally representative sample from the National Health and Nutrition Examination Survey (NHANES), provide a unique opportunity to explore associations between lifestyle behaviors, TE status, and arthritis outcomes. By leveraging the breadth and depth of NHANES data, this study aimed to identify the associations among TE exposure, lifestyle factors, and arthritis, with a particular focus on OA. By employing both traditional regression models and restricted cubic splines (RCSs), this study sought to provide a more nuanced understanding of the dose‒response relationships and potential nonlinear effects of TEs on arthritis development. This analysis not only bridges the current research gap but also lays the groundwork for more in-depth mechanistic and longitudinal investigations in the future.
2. Materials and Methods
2.1. Study Population
This study used data from NHANES, a nationally representative survey of the civilian, noninstitutionalized U.S. population, conducted by the National Center for Health Statistics (NCHS) of the Centers for Disease Control and Prevention (CDC) (wwwn.cdc.gov › nchs › nhanes). The NHANES employs a complex, multistage probability sampling design to ensure national representativeness. For this analysis, we included five NHANES cycles from 2011-2023, covering the following periods: 2011-2012, 2013-2014, 2015-2016, 2017-2020 (the NHANES combined these years into a single cycle due to COVID-19-related disruptions), and 2021-2023 (newly released cycle).
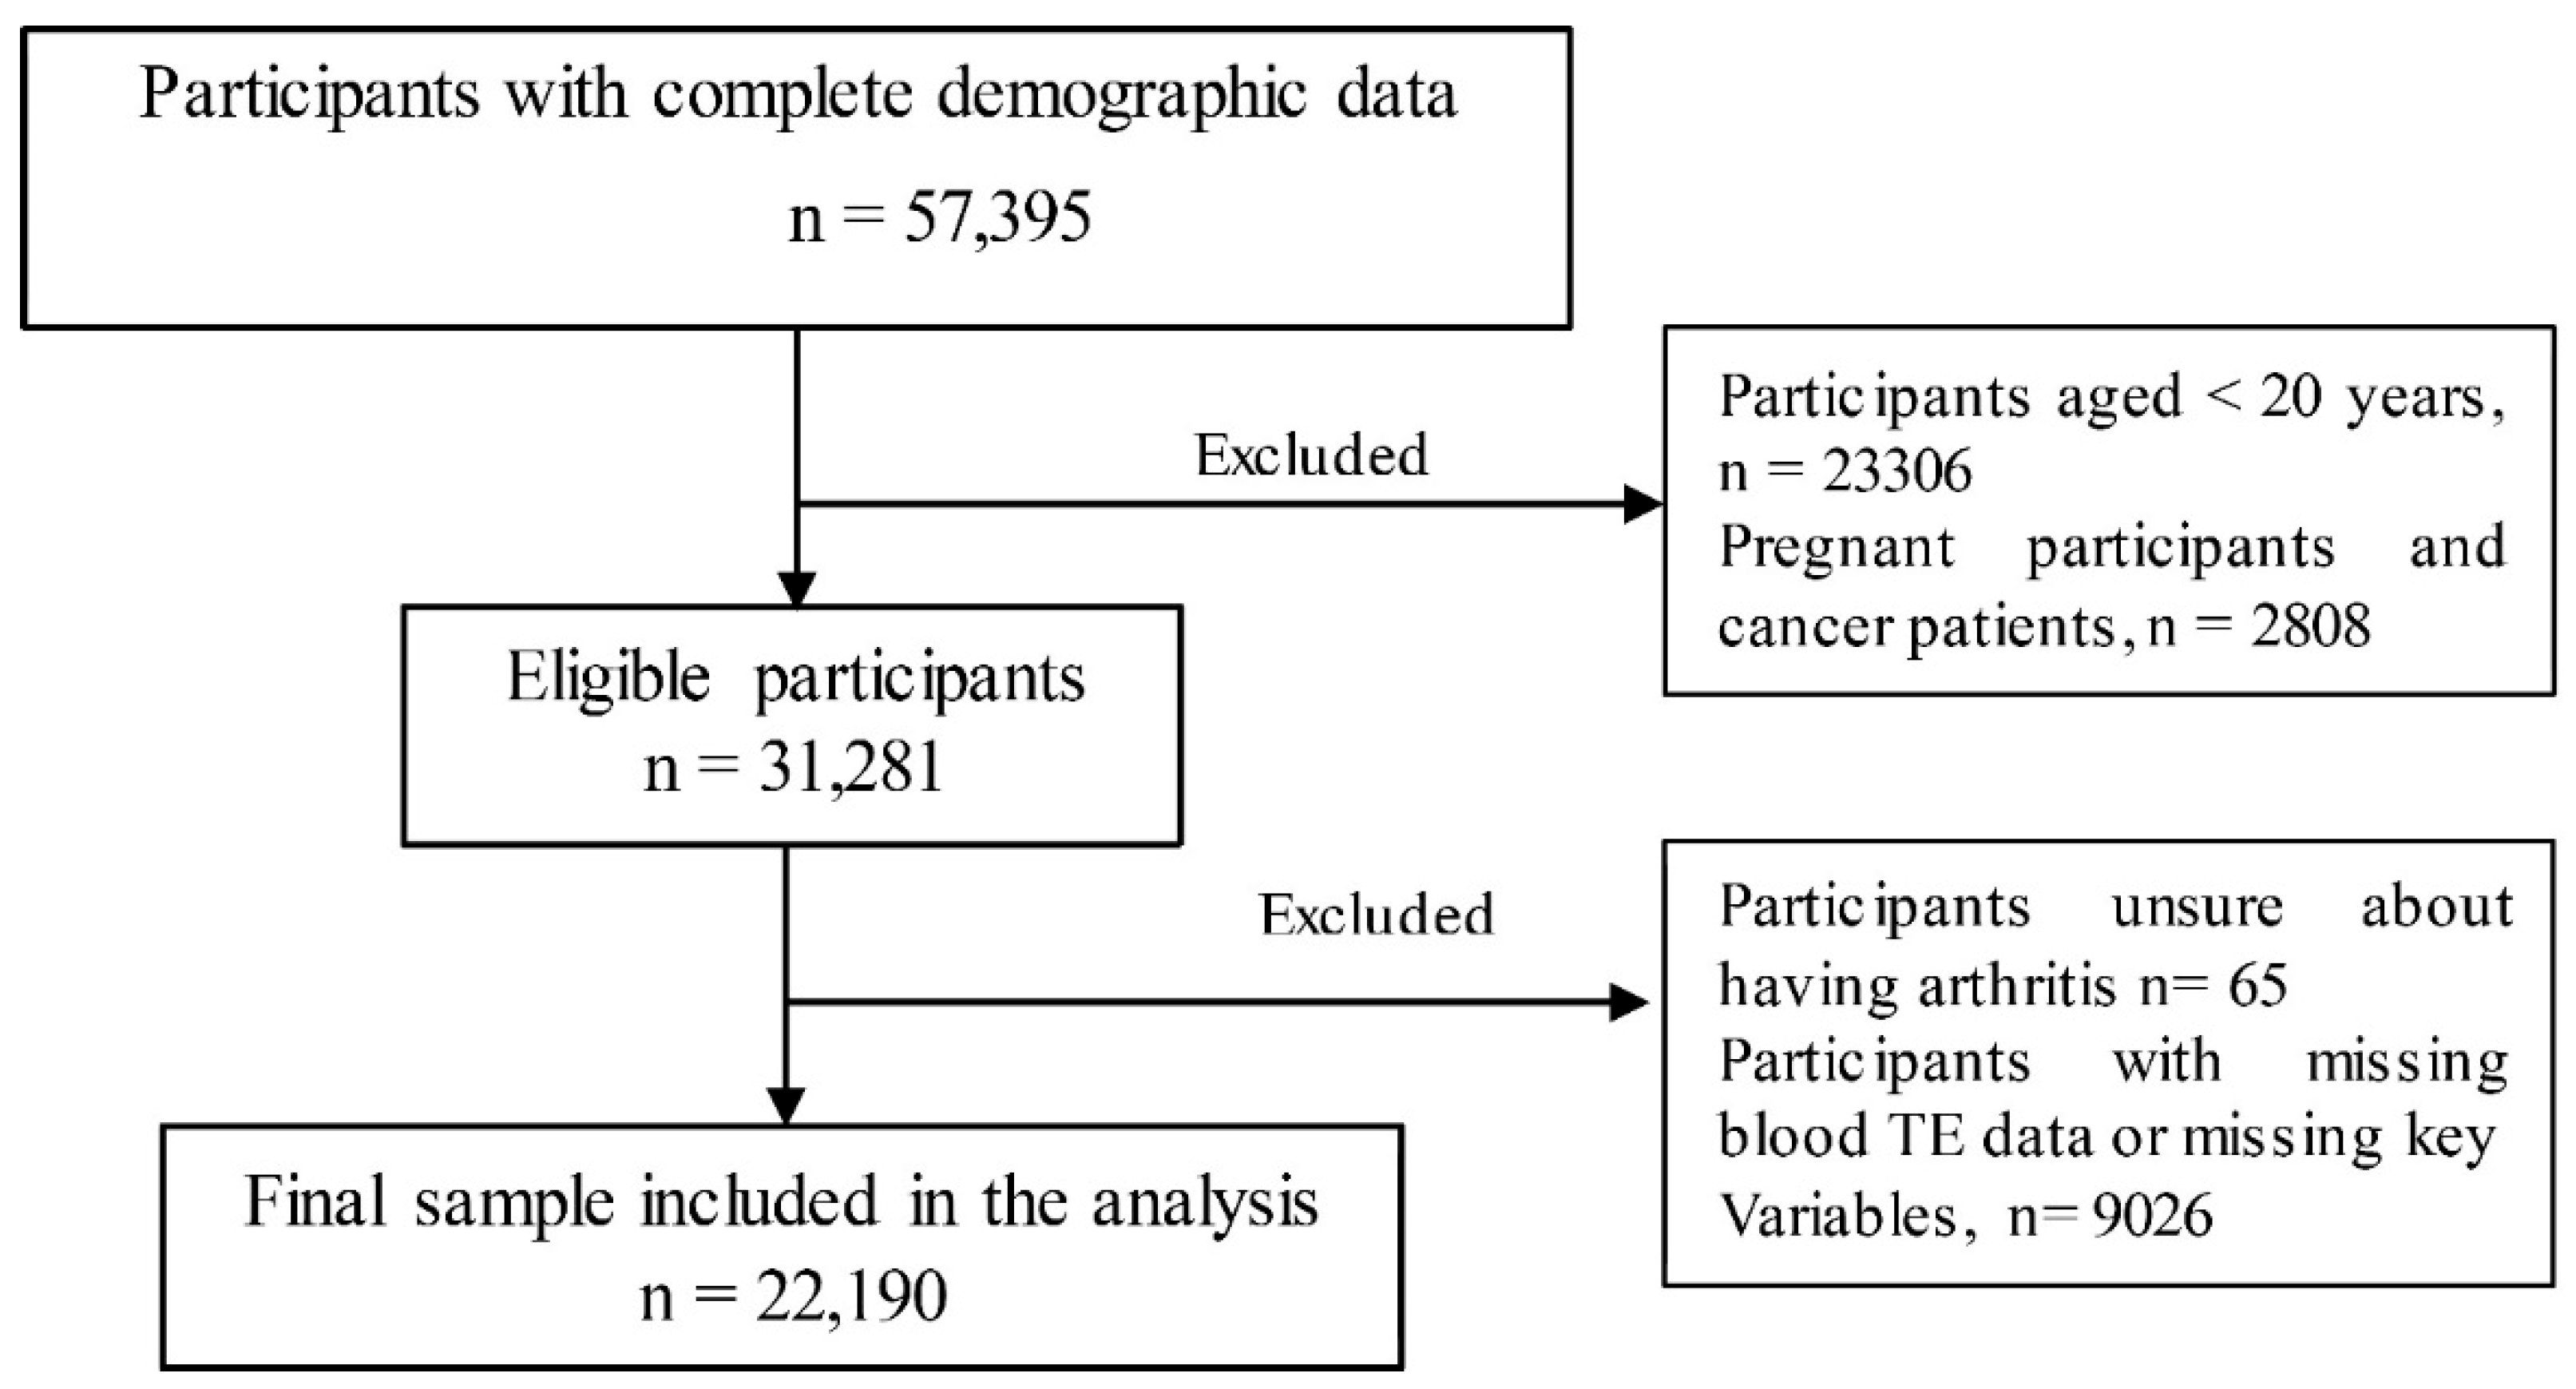
A total of 57,395 participants were included in the survey across five cycles. After individuals who did not meet the diagnostic criteria for arthritis and those without TE blood test results were excluded, a final sample of 22,190 participants was included in the analysis (Figure 1).
Figure 1.
Flowchart of participant selection from the NHANES database across five cycles (2011–2023) for arthritis analysis.
Figure 1.
Flowchart of participant selection from the NHANES database across five cycles (2011–2023) for arthritis analysis.
2.2. Arthritis
Arthritis was identified on the basis of responses to the National Health and Nutrition Examination Survey program. The participants were asked, "Has a doctor or other healthcare professional ever told you that you have arthritis?" Those who responded "yes" were asked to specify the type of arthritis they had been diagnosed with, including OA, rheumatoid arthritis (RA), psoriatic arthritis (PA), or other forms of arthritis. This self-report measure has been widely used in epidemiological studies to assess the prevalence of arthritis in population-based surveys. While self-reported arthritis diagnosis is subject to recall bias, previous validation studies have suggested moderate agreement with clinical diagnoses.
2.3. Trace Element Measurement
TE data were obtained from the NHANES laboratory dataset. Whole-blood concentrations of lead Pb, Cd, total mercury (Hg), Mn, and Se were measured via inductively coupled plasma‒mass spectrometry (ICP‒MS). This method provides high sensitivity and precision for detecting TEs in biological samples.
Blood samples were first vortexed to ensure the uniform distribution of cellular components before a small aliquot was extracted for analysis. To prevent coagulation, EDTA-treated collection tubes were used. Samples with visible clots were excluded because of concerns regarding measurement accuracy.
The blood was diluted (1:1:48) with a solution containing tetramethylammonium hydroxide (TMAH), Triton X-100, ammonium pyrrolidine dithiocarbamate (APDC), and ethyl alcohol. This preparation step facilitates metal ionization, reduces matrix effects, and prevents instrument clogging. Internal standards (rhodium, iridium, and tellurium) were used for calibration and quality control. The diluted sample was introduced into the ICP ionization source, where argon plasma at 6000–8000 K vaporized and ionized the samples. The ions were then passed through a dynamic reaction cell (DRC), which was pressurized with methane (CH₄) for selenium and oxygen (O₂) for manganese and mercury to reduce interference. Finally, the quadrupole mass filter selected specific ion masses for detection, and elemental concentrations were determined by comparing sample signals to calibration standards, which are highly accurate and widely validated for trace element analysis in population-based studies.
2.4. Covariate and Health-Related Assessment
The demographic factors considered in this study included age, sex, race, and the family income‒poverty ratio (FIR). Age was recorded at the time of screening, while sex was categorized as either male or female. Race was classified into five groups: Mexican American, other Hispanic, non-Hispanic White, non-Hispanic Black, and other race (including multiracial). The FIR was used as an economic indicator and categorized into three groups: ≤1.30, 1.31–3.50, and >3.50, representing different socioeconomic levels.
Lifestyle-related factors, such as body mass index (BMI), smoking status, and diabetes status, were also assessed. BMI was categorized into four groups: underweight (<18.5 kg/m²), healthy weight (18.5–24.9 kg/m²), overweight (25.0–29.9 kg/m²), and obese (≥30.0 kg/m²). Smoking status was determined on the basis of self-reported responses: participants who answered "Every day" or "Some days" to the question "Do you now smoke cigarettes?" were classified as "current smokers," those who answered "yes" to "smoked at least 100 cigarettes in life" were considered "ever smokers," and all others were classified as "never smokers". Diabetes status was determined on the basis of self-reported diagnoses or clinical assessments. These lifestyle factors were adjusted in the analysis to account for their potential influence on health outcomes.
2.5. Statistical Analysis
All the statistical analyses were conducted via R software (version 4.4.3, https://www.r-project.org/). Sociodemographic characteristics were summarized via appropriate descriptive statistics, with continuous variables presented as the means with standard deviations (SDs) and categorical variables presented as percentages. Comparisons between participants with and without arthritis were performed via independent t tests for continuous variables and chi-square tests for categorical variables. Pearson’s correlation was employed to examine associations between BMI and TE concentrations.
Given the use of NHANES data, complex survey analysis methods, including stratification, clustering, and weighting, were applied to account for the complex survey design. This approach ensures that the estimates are representative of the U.S. population. Survey weights were applied to all analyses, and the Taylor series linearization method was used to estimate standard errors.
The relationship between the TE concentration and arthritis risk was assessed via binary logistic regression models. Model 1 estimated unadjusted odds ratios (ORs) with 95% confidence intervals (CIs), whereas Model 2 was adjusted for key confounders, including age, sex, race, FIR, BMI, diabetes status, and smoking status. The findings are presented as ORs with 95% CIs, and the results were visualized via forest plots. To explore potential nonlinear associations, RCS regression was conducted, incorporating three to five knots to capture dose‒response trends.
Subgroup analyses were performed to evaluate the effects of lifestyle factor modifications, including smoking status, BMI, and diabetes. Interaction terms were introduced into the logistic regression models to assess the combined influence of TEs and lifestyle factors on arthritis risk.
Further analyses focused on OA cases, examining TE concentrations and their associations with OA across quartiles. Adjusted ORs for OA risk by TE quartile were estimated via logistic regression, with findings illustrated in forest plots. Additionally, RCS regression was applied to determine the potential nonlinear dose‒response relationships between TEs and OA risk. All the statistical tests were two-tailed, and a P value < 0.05 was considered statistically significant.
3. Results
3.1. Participants' Characteristics and Lifestyle Factors According to Arthritis Status
Among the study participants, 29% (n=6435) were diagnosed with arthritis, 45.9% (n=2952) of whom had OA. The participants with arthritis were significantly older (60.56 ± 0.26 years) compared to those without arthritis (43.61 ± 0.29 years, P < 0.001). The sex distribution also differed, with a greater proportion of females in the arthritis group (60.17% vs. 47.96%, P < 0.001). Obesity was more prevalent among those with arthritis (48.0% vs. 35.36%, P < 0.001), suggesting that a higher BMI is associated with increased arthritis risk. Additionally, diabetes was more common in the arthritis group (19.56% vs. 7.73%, P < 0.001), further supporting the relationship between metabolic conditions and arthritis.
Smoking history also differed significantly, with more participants with arthritis being ever smokers (33.22% vs. 21.67%, P < 0.001). These findings highlight key sociodemographic and lifestyle factors, such as age, sex, BMI, diabetes, and smoking, that are strongly associated with arthritis, reinforcing their relevance for both public health strategies and future research on arthritis prevention and management (Table 1).
3.2. Concentration of TEs by Arthritis Status
The concentrations of TEs were notably different between participants with and without arthritis. Specifically, the Pb and Cd levels were significantly greater in the arthritis group than in the control group, with P values less than 0.001. Se and Mn levels were lower in the arthritis group than in the control group, with Se showing a significant difference (P = 0.007), whereas Mn was significantly lower, with a P value of less than 0.001 (Table 2).
3.3. Correlations Between Body Mass Indices and TEs
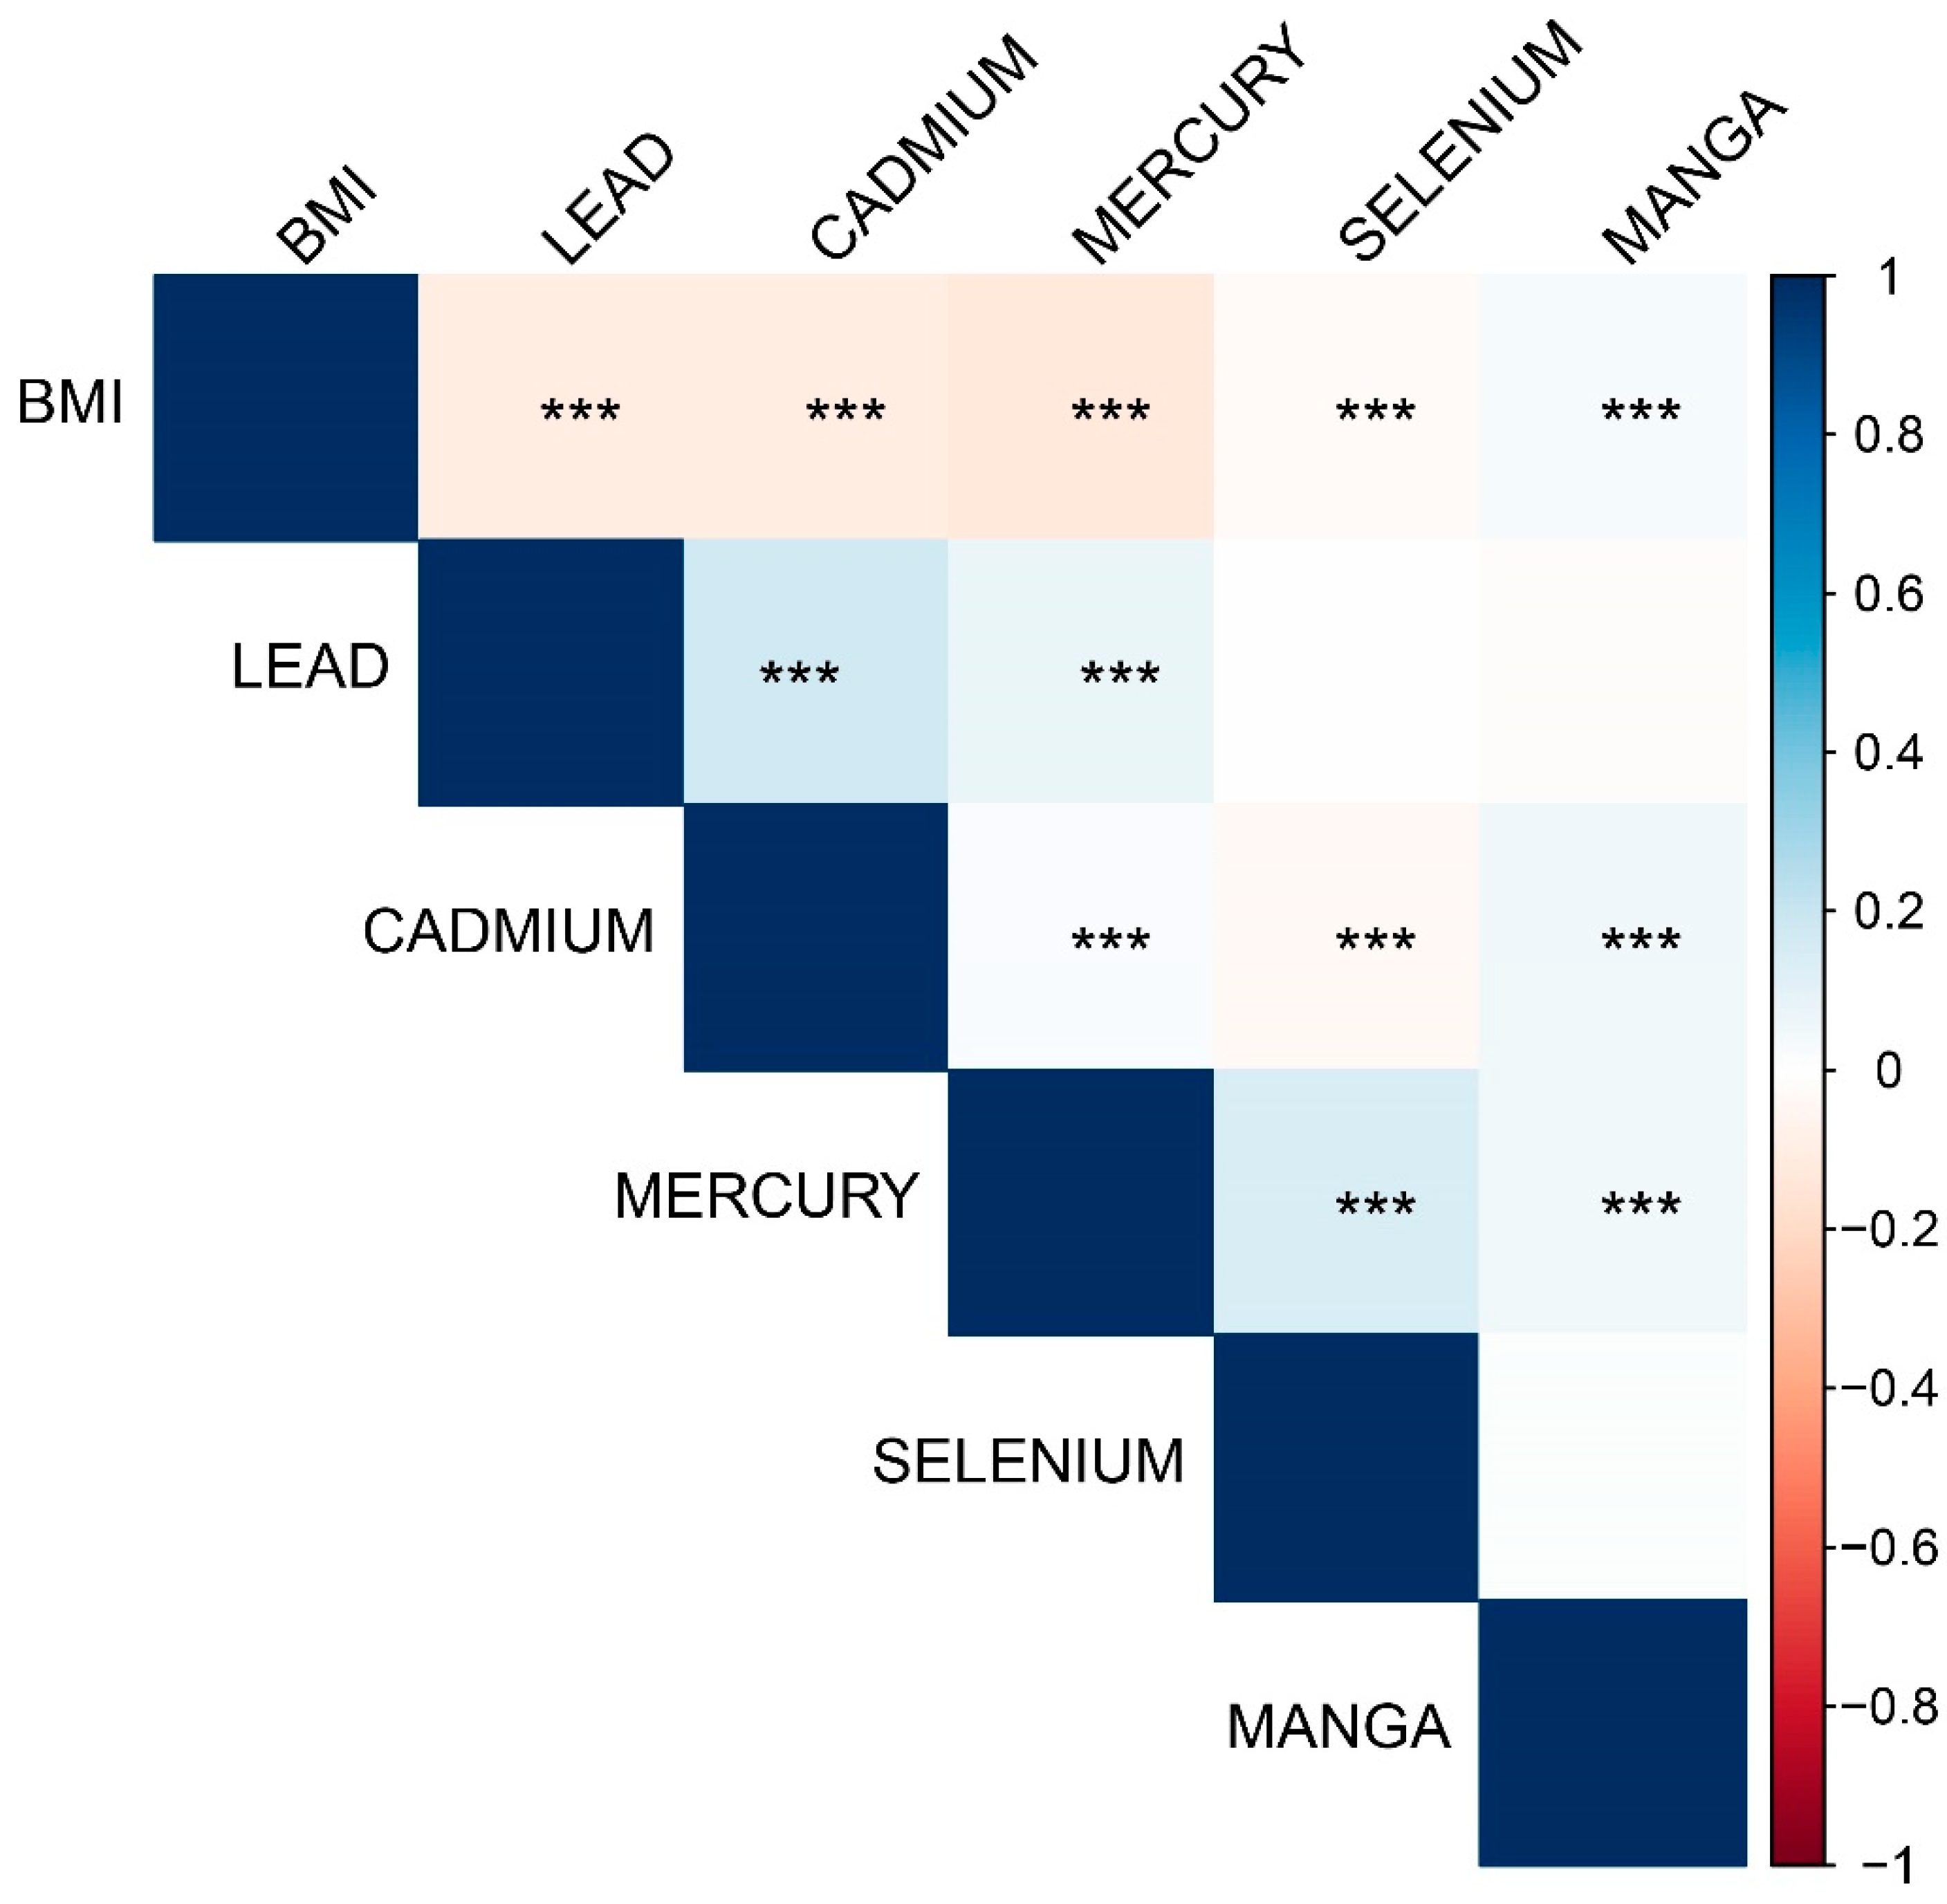
Significant correlations were observed between body mass index (BMI) and various trace elements. BMI was negatively correlated with blood Pb, blood Cd, and blood Hg and positively correlated with blood Mn (all P < 0.001). Blood Pb was positively correlated with blood Cd (P < 0.001) and weakly positively correlated with blood Hg (P < 0.001) but not significantly correlated with Se (P = 0.459) or Mn (P = 0.068). Blood Cd was weakly correlated with Hg and Se, whereas blood Hg was positively correlated with Se (P < 0.001) and negatively correlated with Mn (Figure 2).
Figure 2.
Correlations between body mass index and trace elements (TEs). *** P < 0.001.
3.4. Associations Between TEs and Arthritis in All Subjects
The adjusted analysis revealed significant associations between certain TEs and arthritis risk. Pb exposure, after controlling for confounders, was not significantly related to arthritis across all quartiles, with the highest quartile (Q4) yielding an OR of 0.91 (95% CI: 0.81–1.03; P = 0.122). In contrast, Cd exhibited a notable inverse relationship with arthritis risk in the higher quartiles, with ORs of 0.79 (95% CI: 0.71 - 0.88; P < 0.001) for Q3 and 0.80 (95% CI: 0.70 - 0.90; P < 0.001) for Q4.
Se and Mn exposure showed protective associations with arthritis. For Se, the ORs for both Q3 (0.85; 95% CI: 0.78–0.94; P = 0.001) and Q4 (OR: 0.91; 95% CI: 0.83–0.99; P = 0.048) were significant in Model 2, indicating a potential protective effect against arthritis. Mn also demonstrated protective trends, with significant inverse associations for Q3 (OR: 0.90; 95% CI: 0.82–0.99; P = 0.035) and Q4 (OR: 0.88; 95% CI: 0.79–0.97; P = 0.009), suggesting that higher Mn levels are inversely related to arthritis risk. Table 2 provides a detailed breakdown of the adjusted odds ratios across the quartiles for each TE.
These findings are consistent with the forest plot shown in Figure 3, which illustrates the adjusted odds ratios for the association between TEs and arthritis in the higher quartiles compared with the reference group. The detailed results from both the table and the forest plot provide complementary insights into how these TEs influence arthritis risk.
Figure 3.
Forest plot depicting the adjusted odds ratios (ORs) and 95% confidence intervals (CIs) for the associations between TEs and arthritis adjusted for age, sex, race, family income‒poverty ratio (FIR), BMI, diabetes status, and smoking status.
Figure 3.
Forest plot depicting the adjusted odds ratios (ORs) and 95% confidence intervals (CIs) for the associations between TEs and arthritis adjusted for age, sex, race, family income‒poverty ratio (FIR), BMI, diabetes status, and smoking status.
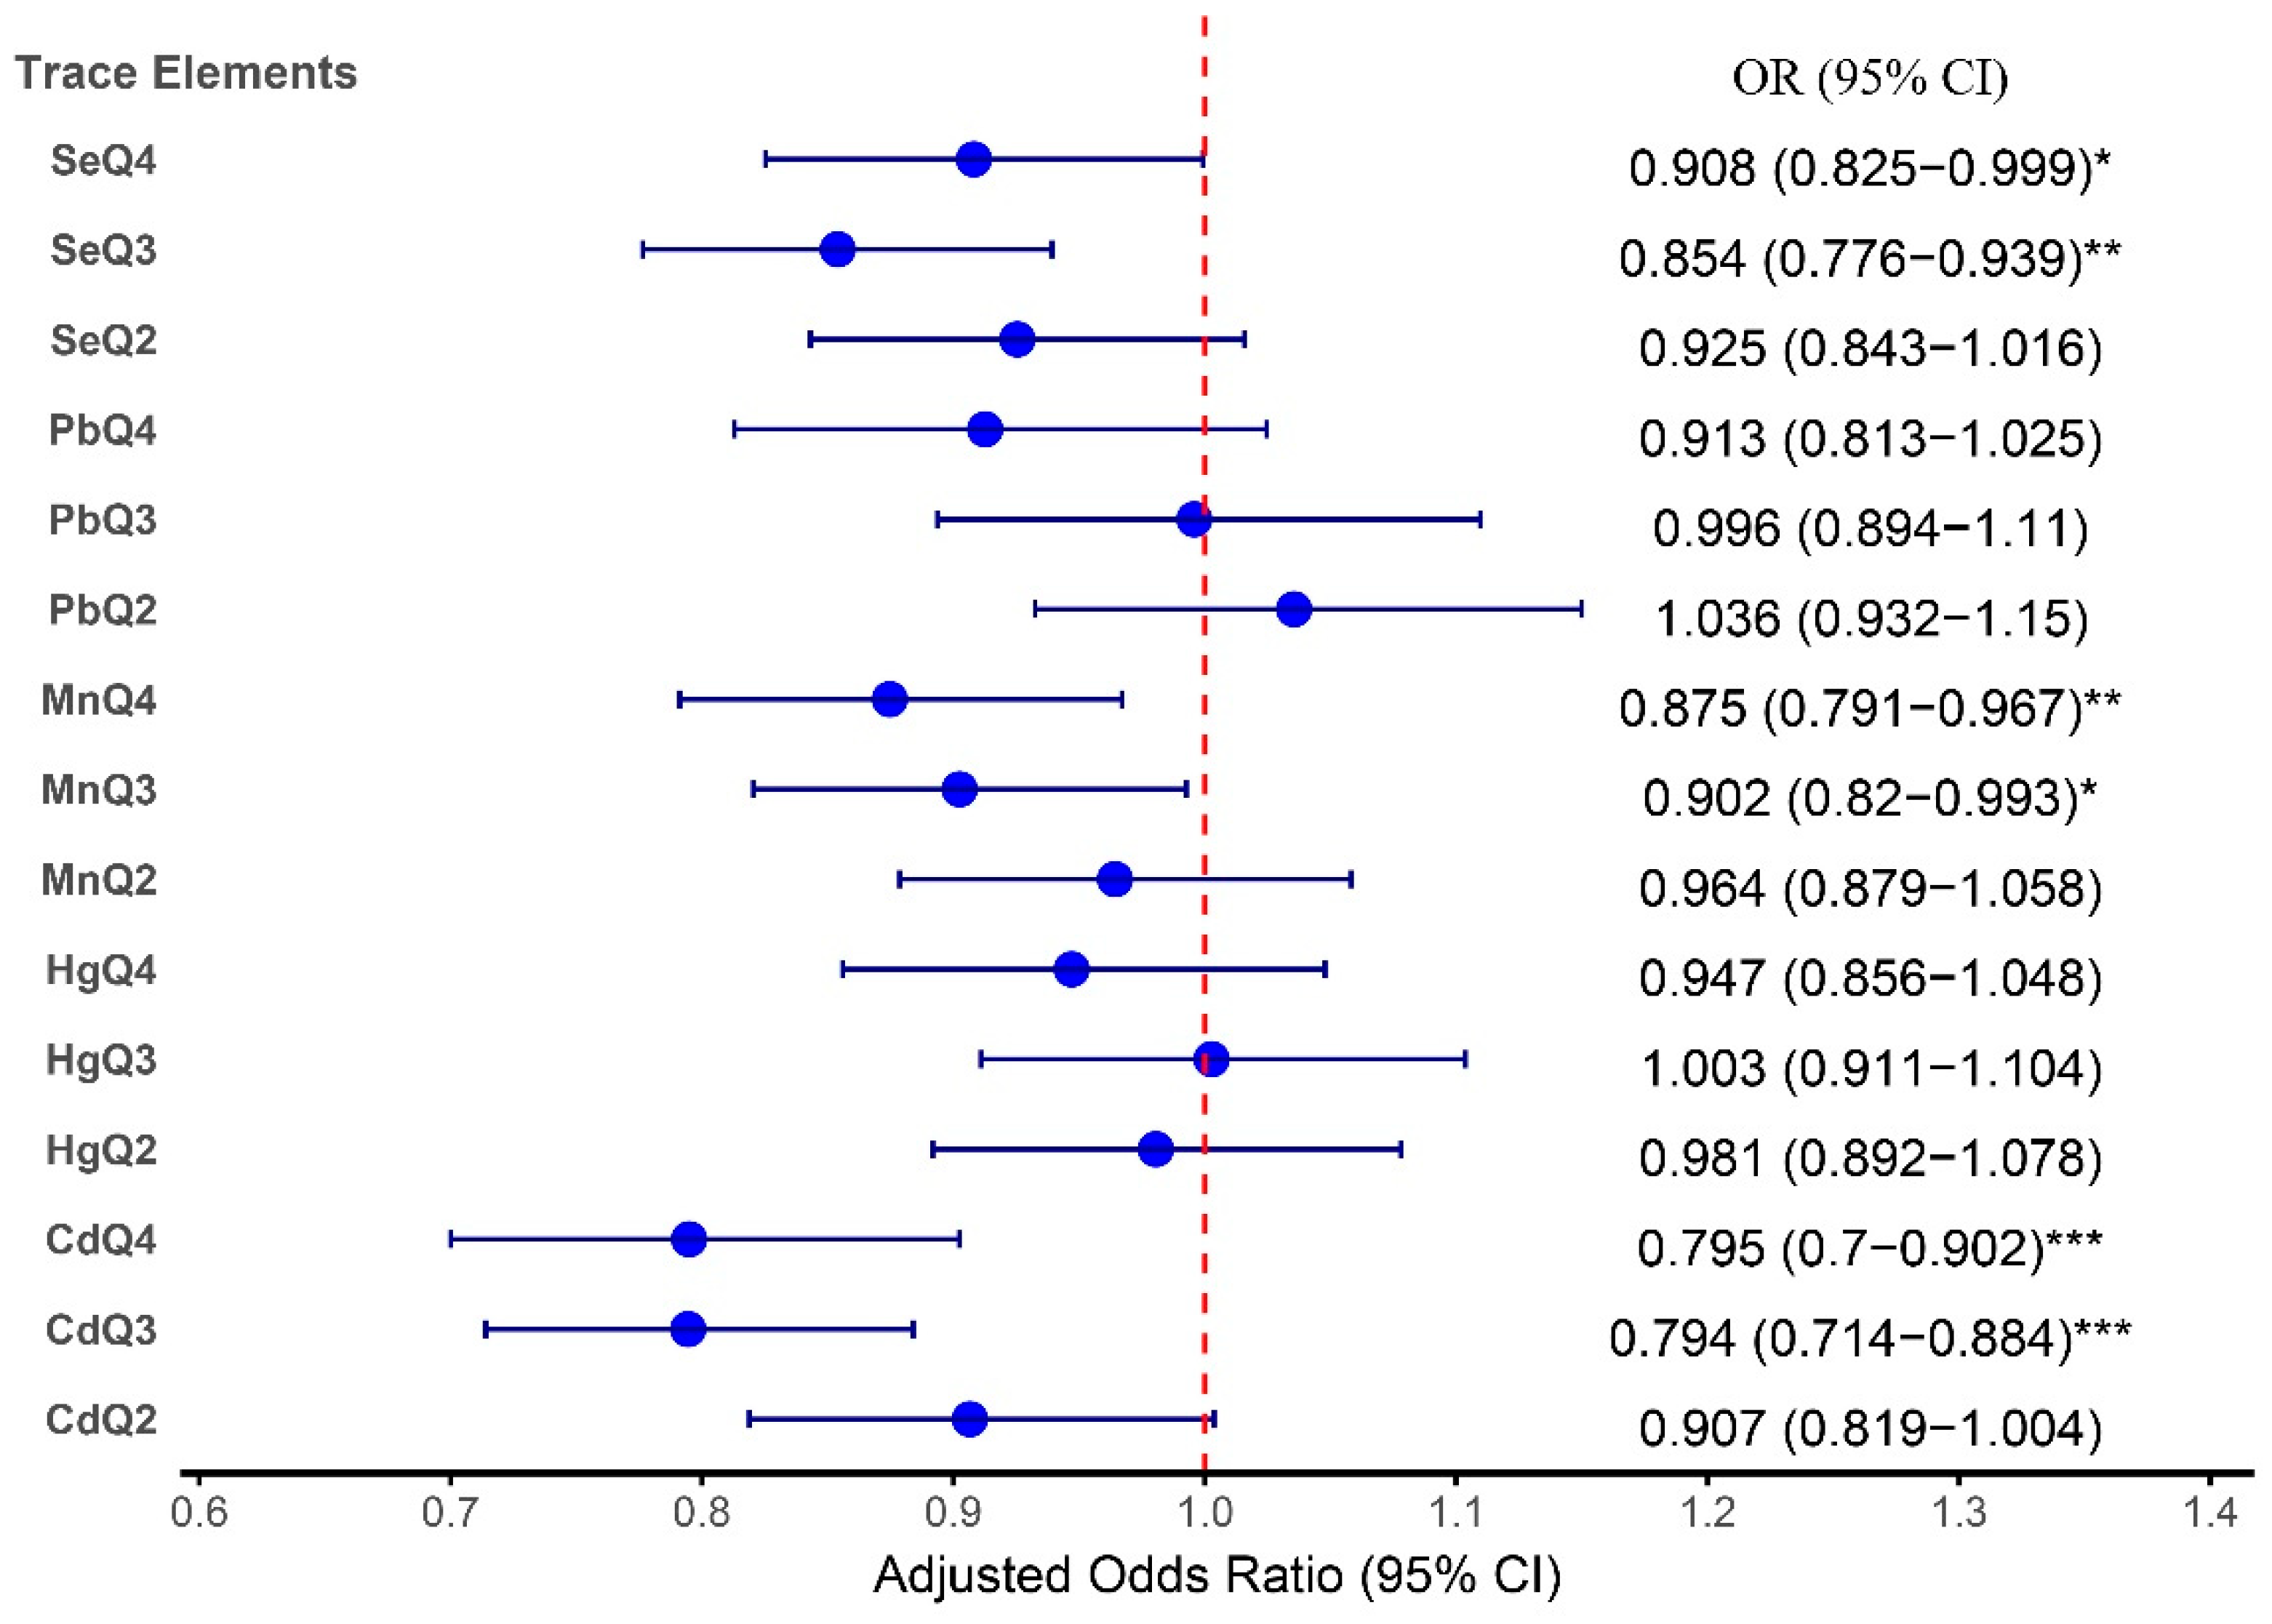
Figure 4 presents RCS curves illustrating the nonlinear associations between blood concentrations of Pb, Cd, Hg, Se, and Mn and arthritis risk. The solid lines represent the estimated ORs, whereas the shaded areas indicate the 95% confidence intervals. The reference point is set at the median concentration of each TE.
Figure 4.
Restricted cubic spline (RCS) curves for the association between TEs and arthritis risk.
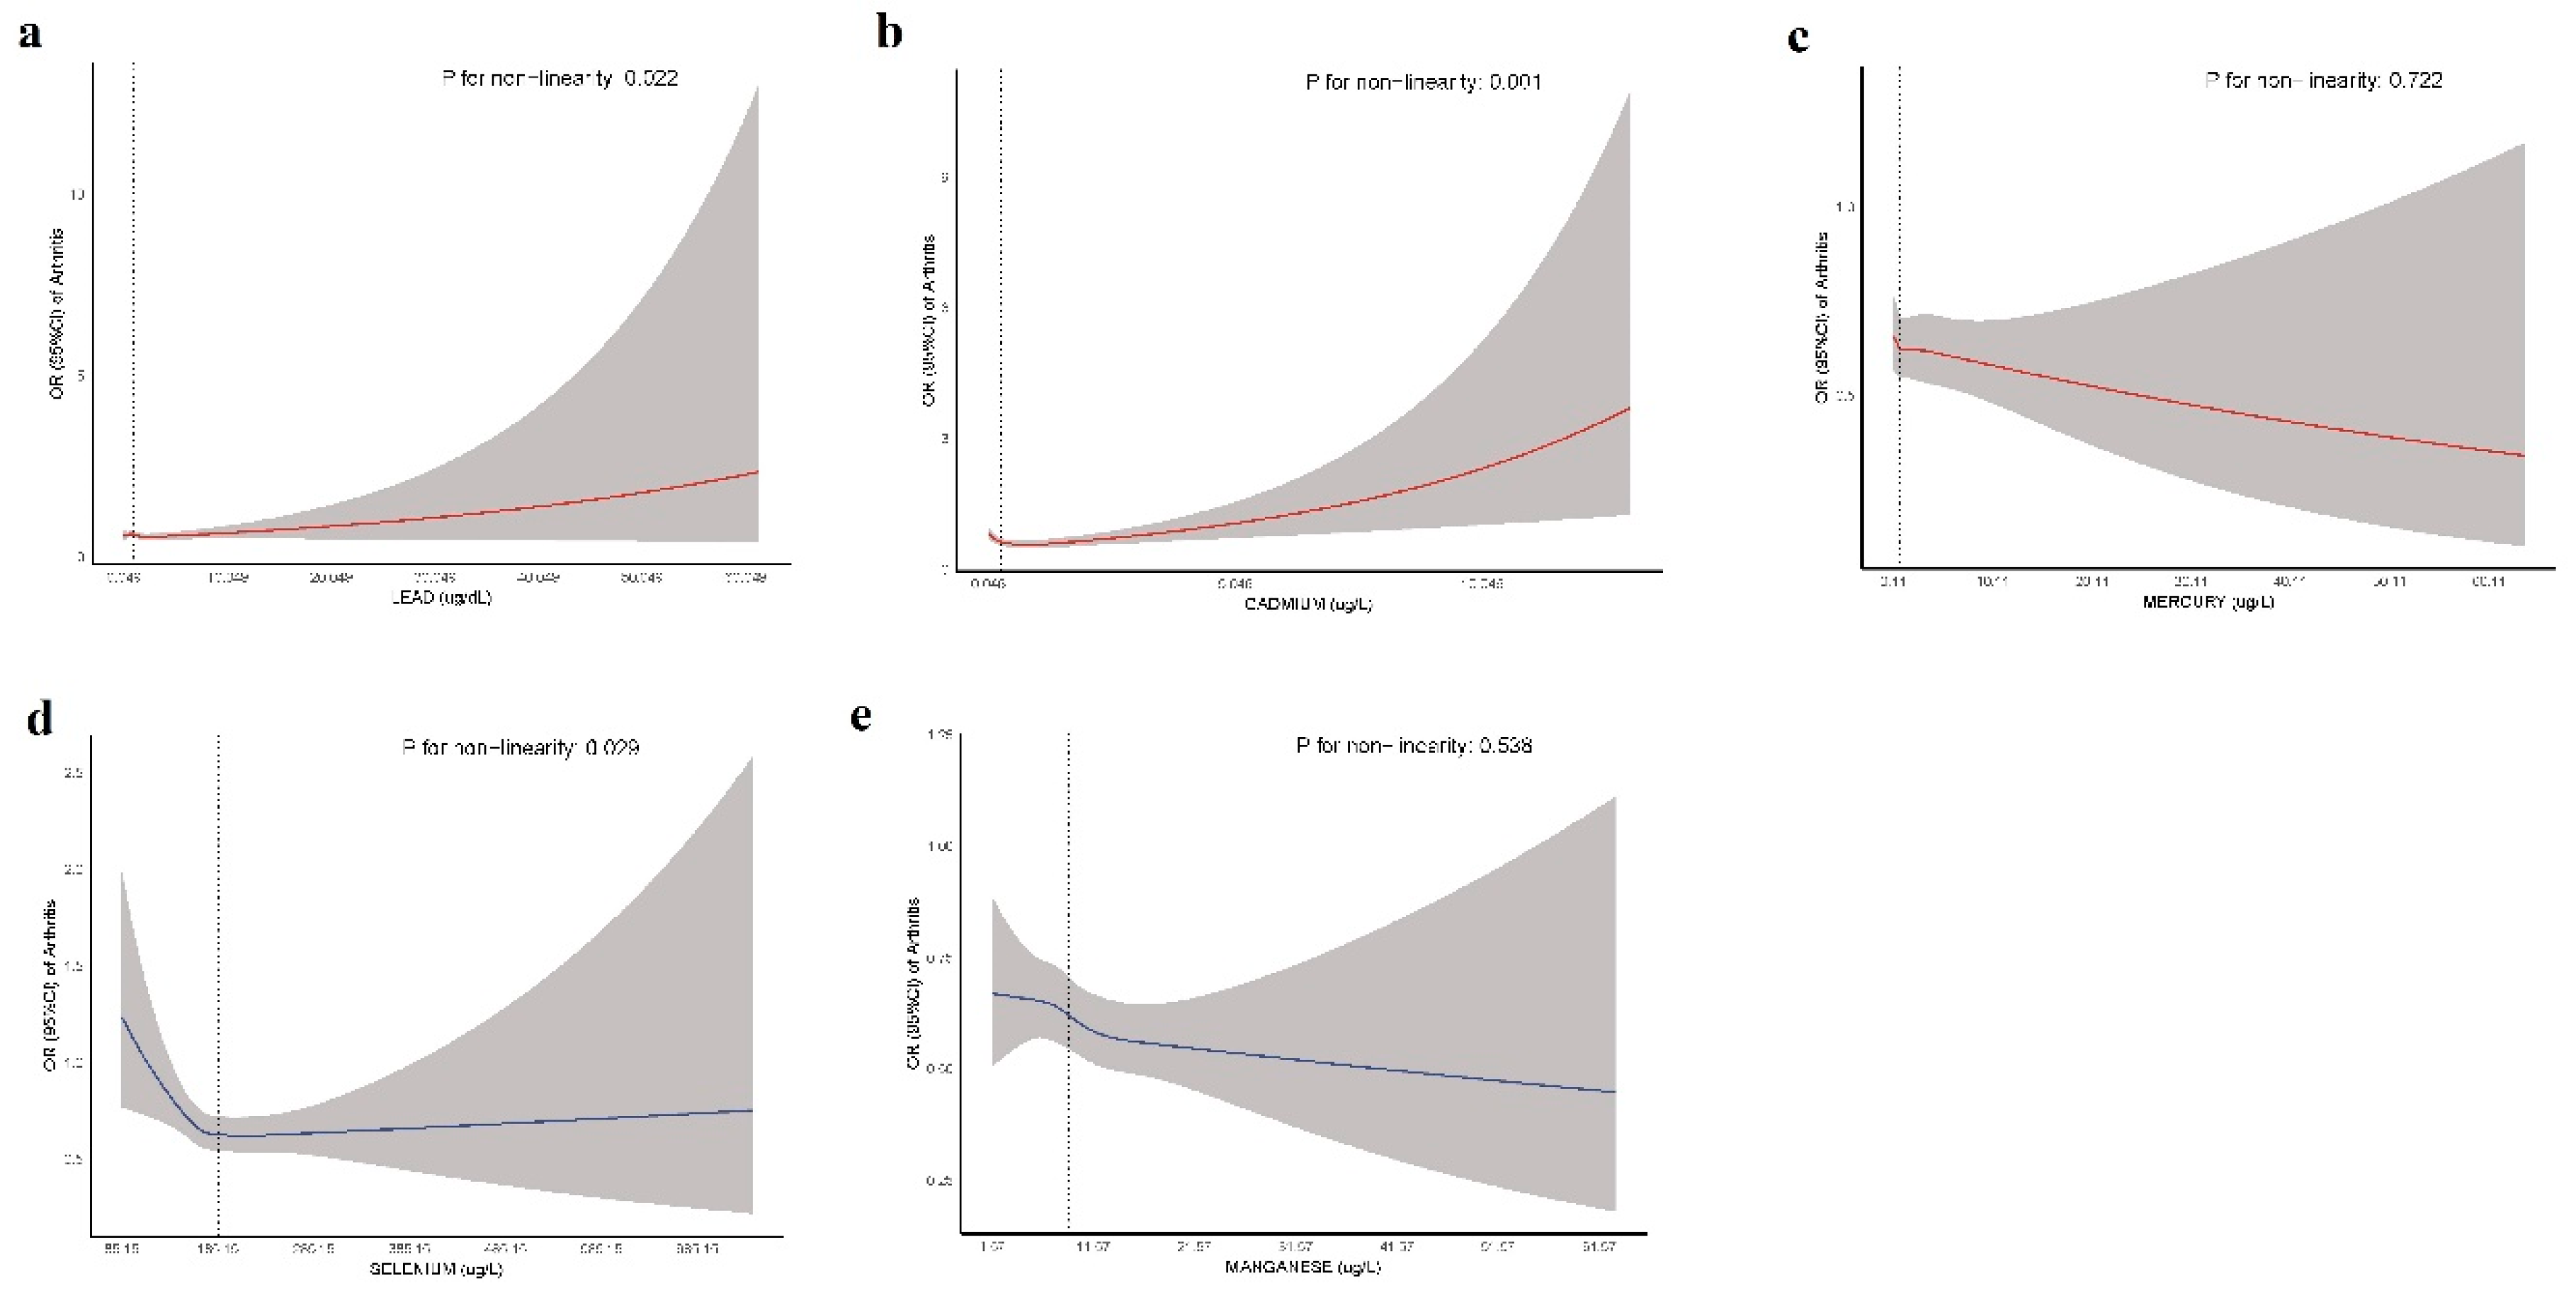
A significant nonlinear relationship was observed for Pb (P = 0.022), Cd (P = 0.001), and Se (P = 0.029), suggesting a complex dose‒response pattern. In contrast, Hg (P = 0.722) and Mn (P = 0.538) showed no evidence of nonlinearity, indicating a more stable association across exposure levels. Notably, Cd exhibited a threshold effect, where lower concentrations were associated with reduced arthritis risk, but at higher concentrations, the risk progressively increased. Similarly, Se demonstrated a U-shaped relationship, implying potential protective effects at moderate concentrations but an increased risk at both lower and higher concentrations. These findings highlight the importance of considering dose‒response patterns when evaluating environmental risk factors for arthritis.
3.5. Associations Between Lifestyle Factors and Arthritis
Obesity was strongly associated with an increased risk of arthritis, with individuals classified as obese having more than twice the risk compared with those who were underweight (OR: 2.26; 95% CI: 1.54–3.33; P<0.001). Overweight individuals had a moderately increased risk, but the association was not statistically significant after adjustment (OR: 1.41; 95% CI: 0.96–2.07; P=0.075). No significant associations were detected for those in the healthy weight category.
Individuals with diabetes had a significantly greater risk of arthritis (OR: 1.29; 95% CI: 1.14–1.46; P <0.001), whereas those with borderline diabetes presented an increased crude risk that was attenuated after adjustment (OR: 1.24; 95% CI: 0.93–1.64; P=0.135). Smoking status was inversely associated with arthritis in the adjusted model; ever smokers had a lower risk than did current smokers (OR: 0.65; 95% CI: 0.54–0.78; P <0.001), and never smokers had the lowest risk (OR: 0.46; 95% CI: 0.38–0.54; P <0.001).
Higher socioeconomic status, as measured by the FIR, was associated with a lower risk of arthritis. Compared with those in the lowest category, individuals in the highest FIR category (>3.5) had a significantly reduced risk (OR: 0.78; 95% CI: 0.71–0.85; P <0.001), and those in the middle category (1.31–3.50) also had a reduced risk (OR: 0.79; 95% CI: 0.73–0.86; P <0.001) (Table 4).

Table 3.
Associations between TEs and Arthritis.
| TEs | Q1 | Q2 OR (95% CI) |
P value | Q3 OR (95% CI) |
P value | Q4 OR (95% CI) |
P value |
|---|---|---|---|---|---|---|---|
| Pb | |||||||
| Model 1 | Reference | 1.69 (1.48 - 1.92) | <0.001 | 2.20 (1.90 - 2.53) | <0.001 | 2.48 (2.16 - 2.86) | <0.001 |
| Model 2 | Reference | 1.04 (0.93 - 1.15) | 0.514 | 0.99 (0.89 - 1.11) | 0.939 | 0.91 (0.81 - 1.03) | 0.122 |
| Cd | |||||||
| Model 1 | Reference | 1.58 (1.41 - 1.78) | <0.001 | 1.94 (1.73 - 2.16) | <0.001 | 2.17 (1.94 - 2.42) | <0.001 |
| Model 2 | Reference | 0.91 (0.82-1.00) | 0.059 | 0.79 (0.71 - 0.88) | <0.001 | 0.80 (0.70-0.90) | <0.001 |
| Hg | |||||||
| Model 1 | Reference | 1.06 (0.95 - 1.19) | 0.305 | 1.08 (0.96 - 1.22) | 0.209 | 1.00 (0.89 - 1.13) | 0.944 |
| Model 2 | Reference | 0.98 (0.89 - 1.08) | 0.684 | 1.01 (0.91 - 1.10) | 0.955 | 0.95 (0.86 - 1.05) | 0.291 |
| Se | |||||||
| Model 1 | Reference | 0.80 (0.71 - 0.91) | <0.001 | 0.70 (0.62 - 0.79) | <0.001 | 0.79 (0.69 - 0.89) | <0.001 |
| Model 2 | Reference | 0.93 (0.84 - 1.02) | 0.103 | 0.85 (0.78 - 0.94) | 0.001 | 0.91 (0.83 - 0.99) | 0.048 |
| Mn | |||||||
| Model 1 | Reference | 0.87 (0.78 - 0.98) | 0.022 | 0.78 (0.69 - 0.88) | <0.001 | 0.77 (0.68 - 0.88) | <0.001 |
| Model 2 | Reference | 0.96 (0.87 - 1.06) | 0.443 | 0.90 (0.82-0.99) | 0.035 | 0.88 (0.79 - 0.97) | 0.009 |
| Model 2: adjusted for age, gender, race, family income-poverty ratio, BMI, Diabetes, and Smoking status; Q, quartile | |||||||
Table 4.
Associations between lifestyle factors and arthritis risk.
| Lifestyle factors | OR (95% C.I.) | P value | Adj.OR (95% C.I.) | P value | |
|---|---|---|---|---|---|
| BMI | Underweight | Ref | Ref | ||
| Healthy weight | 1.10 (0.79 - 1.52) | 0.545 | 1.12 (0.76 - 1.64) | 0.553 | |
| Overweight | 1.57 (1.15 - 2.16) | 0.006 | 1.41 (0.96 - 2.07) | 0.075 | |
| Obesity | 2.28 (1.65 - 3.14) | < 0.001 | 2.26 (1.54 - 3.33) | < 0.001 | |
| Diabetes | No | Ref | Ref | ||
| Yes | 2.98 (2.69 - 3.30) | < 0.001 | 1.29 (1.14 - 1.46) | < 0.001 | |
| Borderline | 2.21 (1.74 - 2.80) | < 0.001 | 1.24 (0.93 - 1.64) | 0.135 | |
| Smoking status | Current smoker | Ref | Ref | ||
| Ever smoker | 1.38 (1.23 - 1.56) | < 0.001 | 0.65 (0.54 - 0.78) | < 0.001 | |
| Never smoker | 0.71 (0.63 - 0.79) | < 0.001 | 0.46 (0.38 - 0.54) | < 0.001 | |
| FIR | ≤1.30 | Ref | Ref | ||
| 1.31–3.50 | 0.961 (0.89 - 1.03) | 0.267 | 0.79 (0.73 - 0.86) | < 0.001 | |
| >3.5 | 0.83 (0.77 - 0.89) | < 0.001 | 0.78 (0.71 - 0.85) | < 0.001 | |
| Adj.: adjusted for age, gender, race, TEs; FIR: family income to poverty ratio | |||||
3.6. Interaction Effects of TEs and Lifestyle Factors on Arthritis Risk
The interaction analysis explored the potential modifying effects of diabetes, BMI, and smoking status on the relationship between TE exposure and arthritis. For Pb, Cd, Hg, Se, and Mn, no significant interactions were observed with diabetes or BMI categories, suggesting that these factors do not substantially alter the associations between these TEs and arthritis risk. Specifically, for Pb, the interactions with diabetes and smoking status showed no significant associations, with P values above 0.05 for most groups. Similarly, for Cd, no significant interactions were found, although the association with arthritis in never smokers was notably reduced (OR: 0.42; 95% CI: 0.30–0.59; P < 0.001), indicating a potential protective effect of Cd in this group.
In contrast, while Hg, Se, and Mn did not significantly interact with diabetes, BMI, or smoking status, some trends were observed, particularly for Se, where P values approached significance in the obesity and overweight groups. For Hg, the interactions with smoking status and BMI had no strong influence on the association with arthritis. Overall, these results indicate that the effects of TEs on arthritis risk are largely independent of diabetes and BMI status, with smoking status potentially modulating the effect of Cd [Supplementary Table 1].
The findings highlight the complexity of the associations between TE exposure and arthritis, suggesting that while certain lifestyle factors, particularly smoking, may influence these relationships, the overall effect is relatively stable across different subgroups. This underlines the importance of considering individual factors, such as smoking history, when assessing the impact of environmental exposure on arthritis risk.
3.7. Subgroup Analysis of Arthritis: TE Concentrations in OA Patients
In this study, we examined the concentrations of TEs in individuals with and without OA. Pb levels were significantly greater in the OA group than in the non-OA group, with mean concentrations of 1.31 µg/dL (±0.05) and 1.09 µg/dL (±0.02), respectively (P < 0.001). The median levels also showed a notable difference (1.01 µg/dL; IQR 0.69–1.56 vs. 0.80 µg/dL; IQR 0.51–1.29), indicating an association between elevated Pb levels and OA. Similarly, Cd concentrations were significantly greater in the OA group (mean 0.48 µg/L, ±0.02 vs. 0.41 µg/L, ±0.01; P < 0.001), with median values also different (0.31 µg/L; IQR 0.20–0.54 vs. 0.25 µg/L; IQR 0.16–0.44).
In contrast, the Hg and Se levels did not differ significantly between the OA and non-OA groups (P = 0.978 and P = 0.183, respectively). The Hg concentrations were nearly identical (mean ± SD: 1.37 µg/L vs. 1.35 µg/L), whereas the Se concentrations were comparable (mean ± SD: 189.31 µg/L vs. 190.45 µg/L). These findings suggest that there is no clear association between these elements and OA. Mn levels were significantly different, with the OA group exhibiting slightly lower concentrations (mean ± SD: 9.45 µg/L vs. 9.76 µg/L; P = 0.005), although further investigation is needed to clarify its potential role in OA (Table 5).
3.8. Association Analysis of TEs with OA across Quartiles
This analysis investigates the associations between TE concentrations and OA across quartiles via both crude (Model 1) and adjusted (Model 2) models. Model 1 provides unadjusted estimates, whereas Model 2 accounts for potential confounders, such as lifestyle and health-related factors, to better elucidate the true relationships between trace elements and OA, as indicated in Table 6.
In the crude model (Model 1), Pb showed a strong, positive dose‒response association with OA, with odds ratios significantly increasing across quartiles: Q2 (OR: 1.772; 95% CI: 1.513–2.079; P<0.001), Q3 (OR: 2.322; 95% CI: 1.952–2.762; P <0.001), and Q4 (OR: 2.532; 95% CI: 2.133–3.005; P <0.001). However, after adjusting for confounding factors in Model 2, this relationship weakened considerably, with ORs becoming nonsignificant. This suggests that the crude association may largely reflect confounding factors rather than a direct causal relationship.
Similarly, Cd demonstrated significant positive associations in the crude model, with ORs increasing across quartiles: Q2 (OR: 1.629; 95% CI: 1.410–1.882; P<0.001), Q3 (OR: 2.058; 95% CI: 1.735–2.442; P<0.001), and Q4 (OR: 1.954; 95% CI: 1.668–2.289; P<0.001). However, after adjustment in Model 2, the associations were attenuated, with a notable decrease in ORs, especially in Q3 (OR: 0.731; 95% CI: 0.633–0.844; P<0.001) and Q4 (OR: 0.696; 95% CI: 0.587–0.826; P<0.001). These findings suggest that the effect of Cd on OA may be influenced by other factors, such as sociodemographic characteristics or health behaviors.
Hg exhibited a more modest and less consistent relationship with OA. In the crude model, a significant association was observed for Q2 (OR: 1.230; 95% CI: 1.055–1.434; P=0.009), but no significant associations were observed in the adjusted model, with ORs across quartiles failing to reach statistical significance. This finding indicates that mercury may have a minimal or confounded effect on OA risk.
With respect to Se and Mn, both of which are essential TEs, the crude analysis suggested a potential protective effect against OA. Specifically, Se had a significant inverse relationship with Q2 (OR: 0.711; 95% CI: 0.605–0.836; P<0.001) and Q3 (OR: 0.825; 95% CI: 0.716–0.951; P=0.008), whereas Mn had a significant inverse relationship with Q3 (OR: 0.783; 95% CI: 0.661–0.927; P=0.005). However, after adjustment for confounders in Model 2, these associations diminished and became nonsignificant across all quartiles, suggesting that the protective effects of Se and Mn may be confounded by other factors.
These findings are consistent with the forest plot shown in Figure 5, which illustrates the adjusted odds ratios for the associations between TEs (Pb, Cd, Hg, Se, and Mn) and OA across quartiles. The plot demonstrated that Cd was significantly associated with OA, whereas the associations for Pb, Hg, Se, and Mn were weaker or not significant after adjustment. This aligns with the results presented in Table 7, emphasizing the stronger association between Cd and OA risk. Additionally, the RCS analysis further supported these findings. The P values for nonlinearity indicate significant nonlinear associations for Pb (P=0.006), Cd (P=0.001), and Se (P=0.02), whereas Hg (P=0.716) and Mn (P=0.191) did not show significant nonlinear relationships with OA (Figure 6).
Figure 5.
Forest plot illustrating the adjusted odds ratios (ORs) for the associations between TEs and OA across quartiles.
Figure 5.
Forest plot illustrating the adjusted odds ratios (ORs) for the associations between TEs and OA across quartiles.
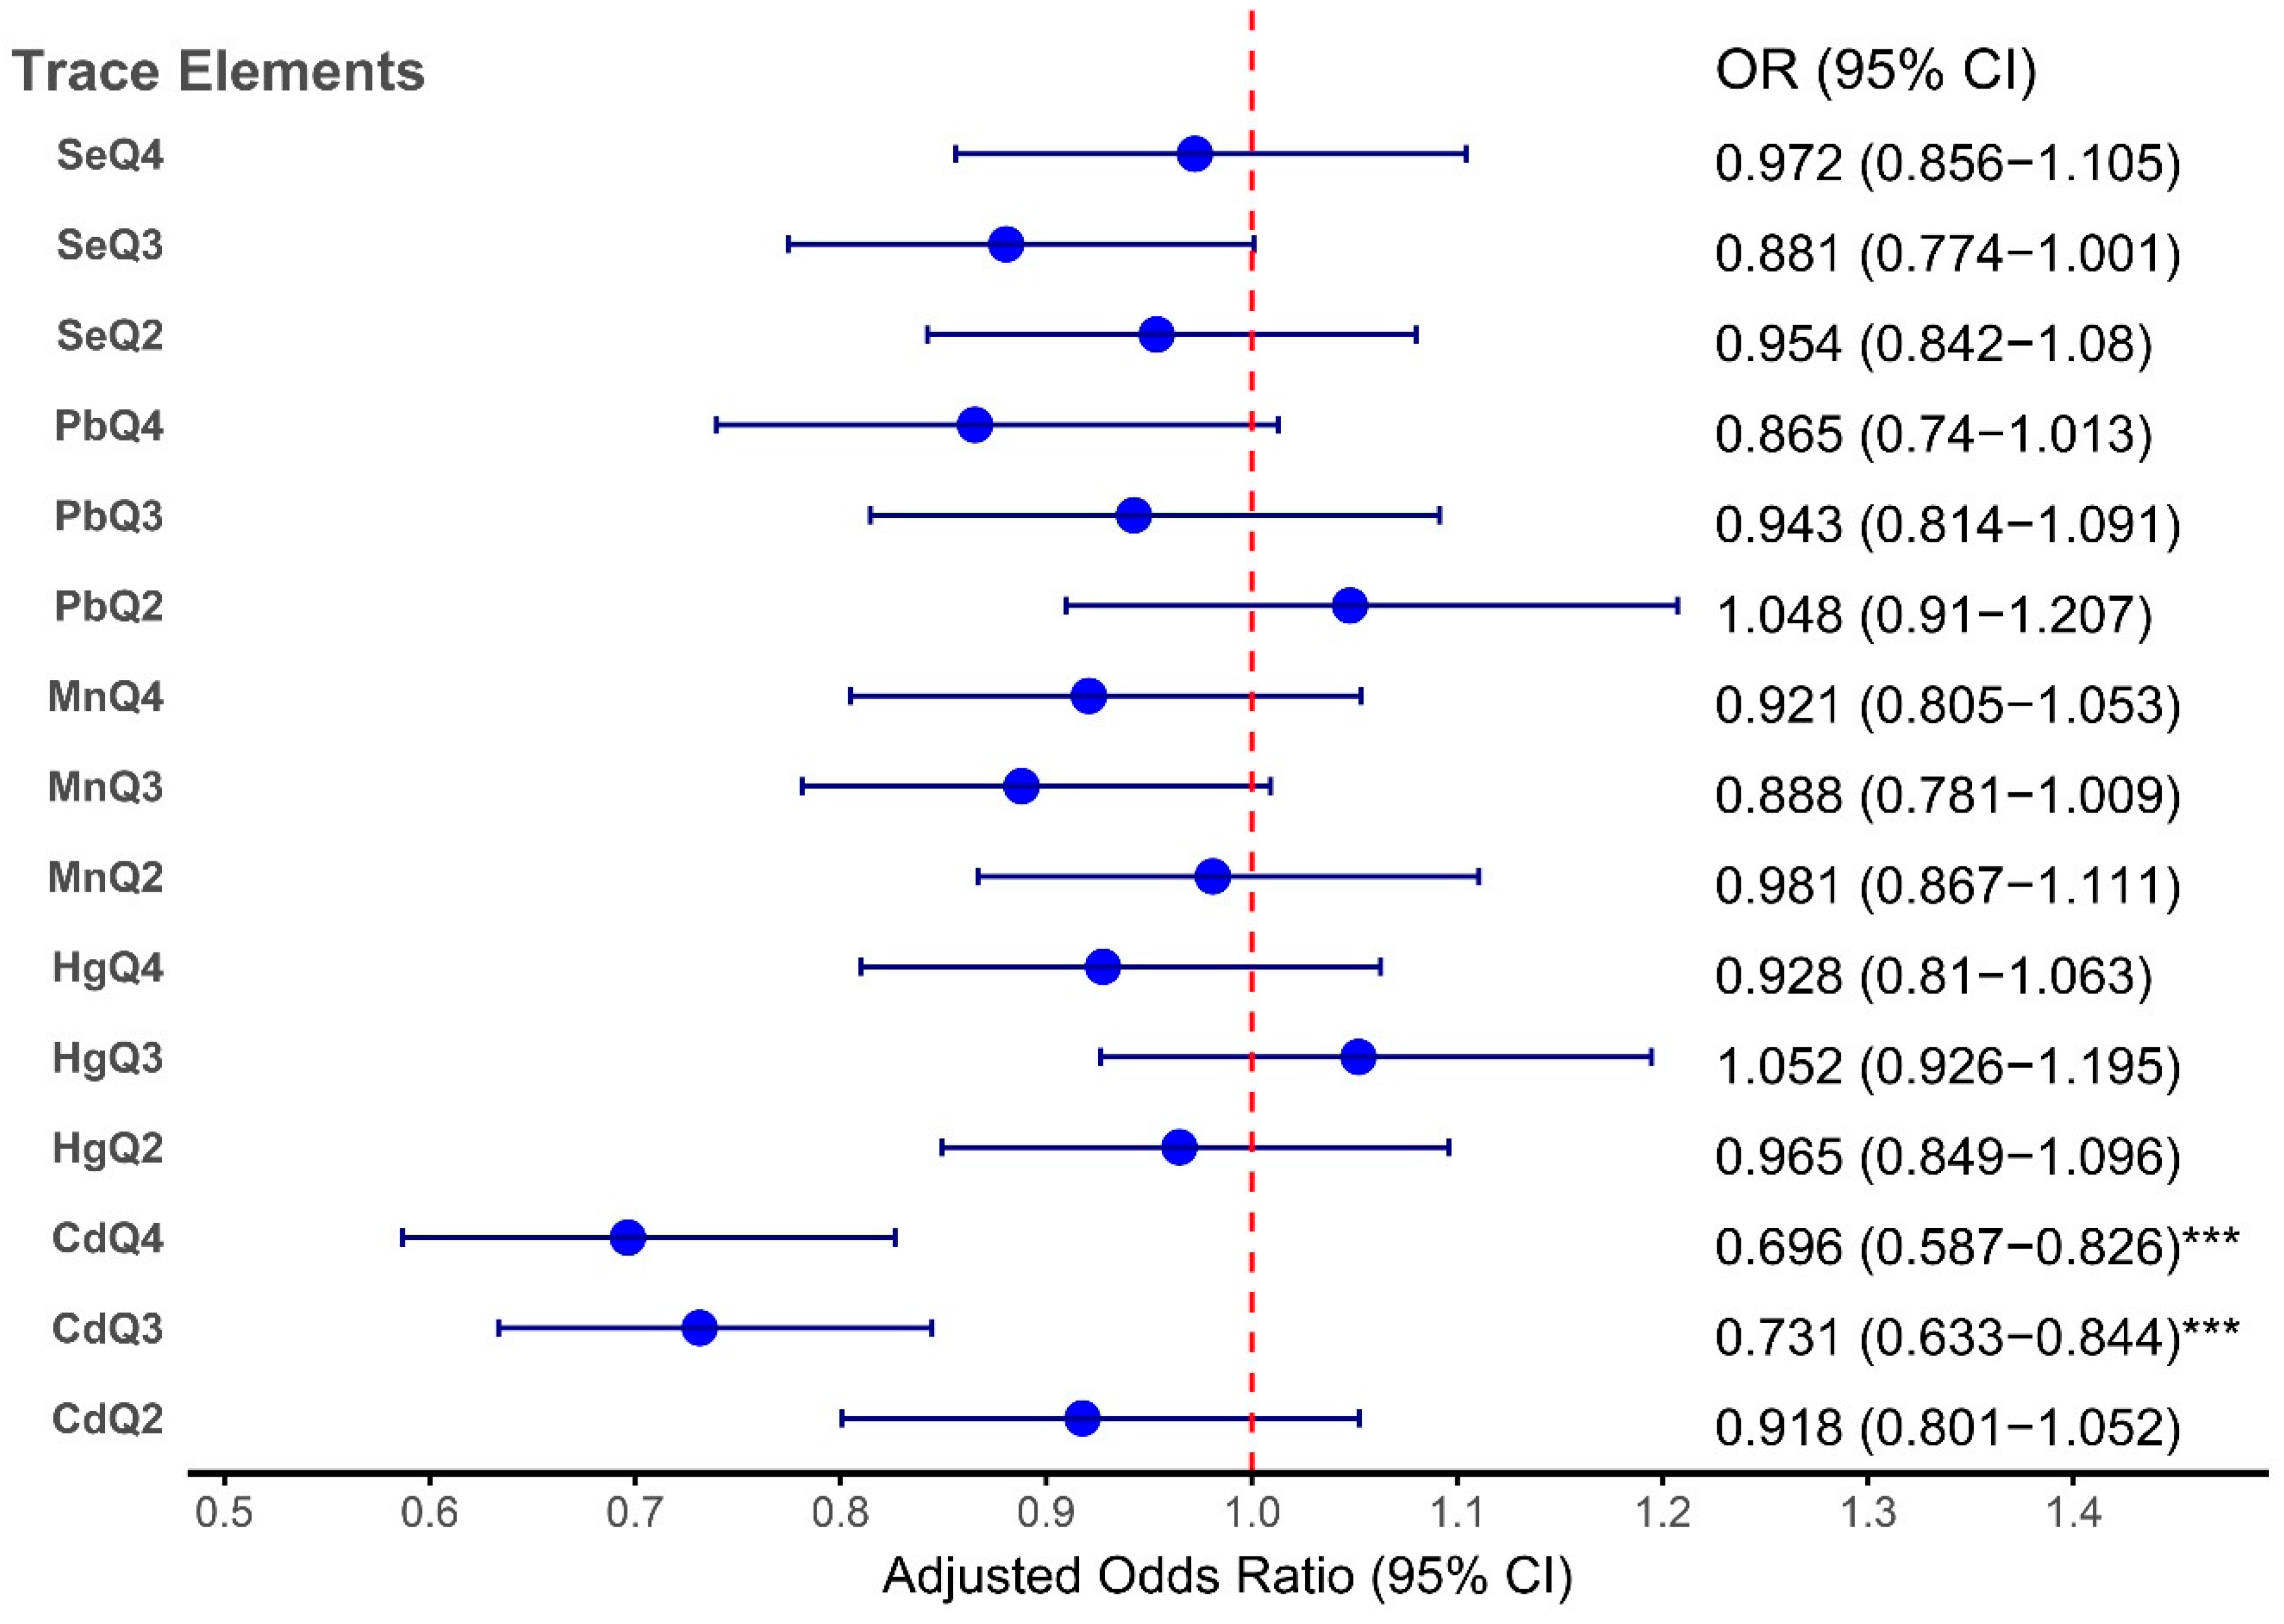
Figure 6.
RCS analysis revealed a nonlinear association between TEs and OA risk.
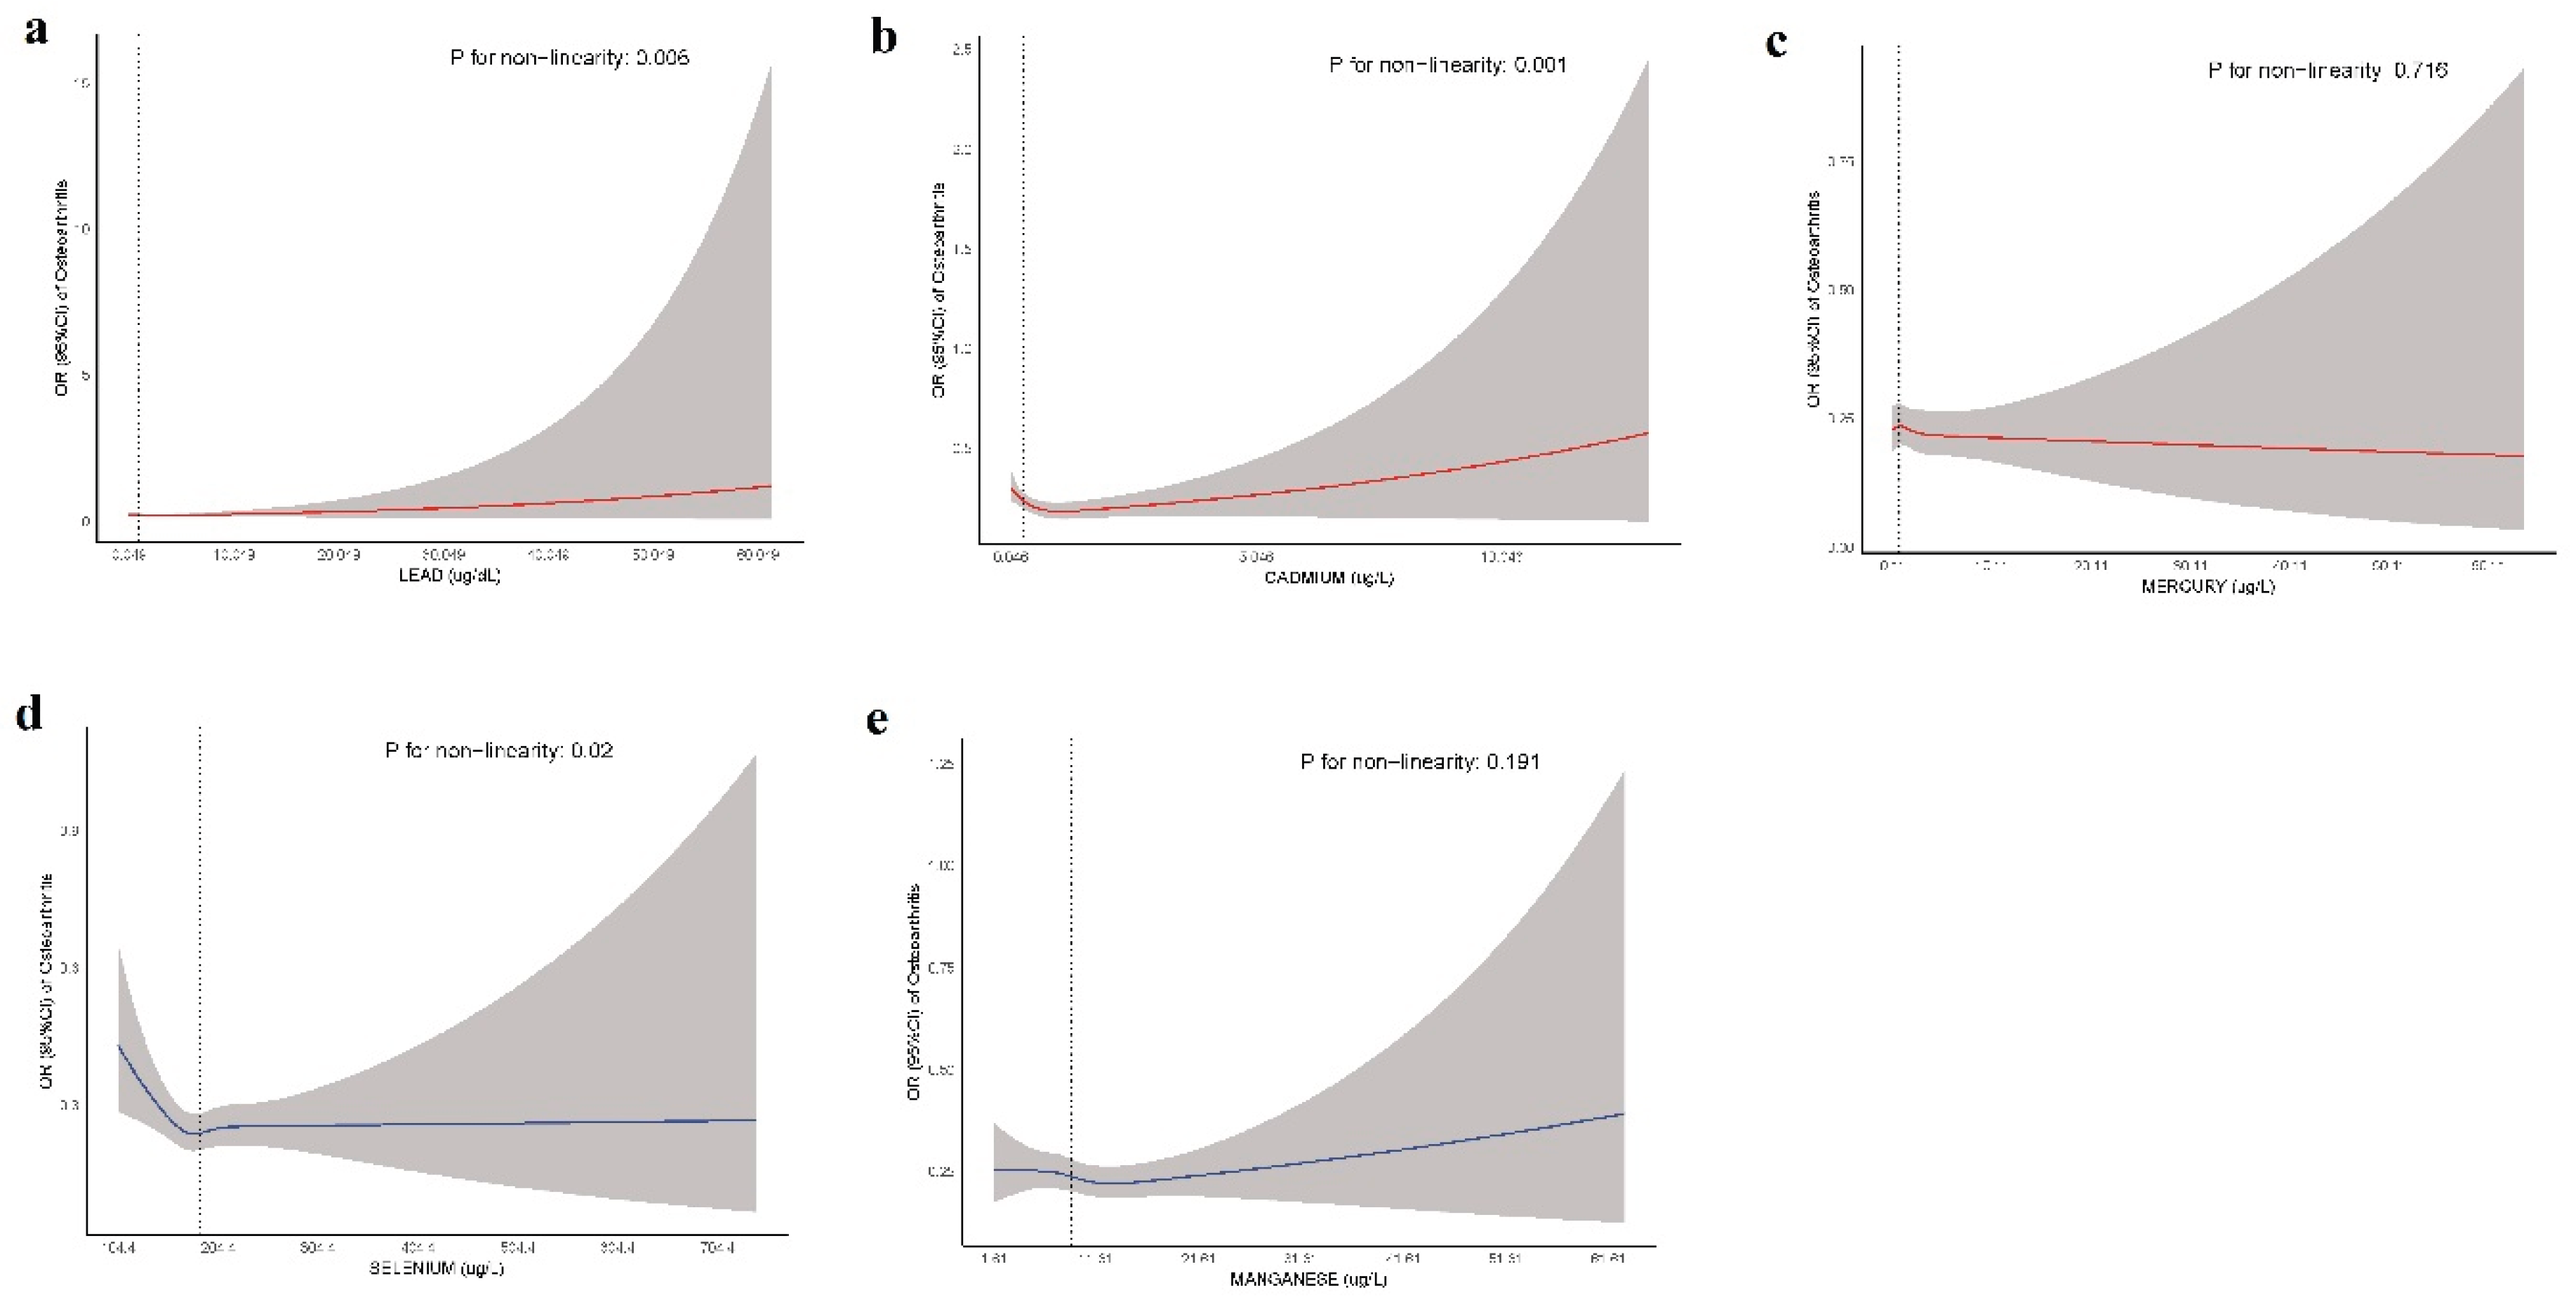
Table 7.
Associations between Lifestyle Factors and Osteoarthritis in All Subjects.
| Lifestyle factors | OR (95% C.I.) | P value | Adj.OR (95% C.I.) | P value | |
|---|---|---|---|---|---|
| BMI | Underweight | Ref | Ref | ||
| Healthy weight | 1.146 (0.688 - 1.908) | 0.595 | 1.151 (0.668 - 1.982) | 0.613 | |
| Overweight | 1.603 (0.986 - 2.605) | 0.056 | 1.487 (0.890 - 2.482) | 0.134 | |
| Obesity | 2.396 (1.423 - 4.032) | 0.001 | 2.576 (1.491 - 4.453) | 0.001 | |
| Diabetes | No | Ref | Ref | ||
| Yes | 3.053 (2.656 - 3.508) | <0.001 | 1.417 (1.217 - 1.649) | <0.001 | |
| Borderline | 2.245 (1.690 - 2.987) | <0.001 | 1.289 (0.888 - 1.872) | 0.185 | |
| Smoking status | Current smoker | Ref | Ref | ||
| Ever smoker | 1.743 (1.447 - 2.099) | <0.001 | 0.743 (0.598 - 0.924) | 0.009 | |
| Never smoker | 0.864 (0.731 - 1.020) | 0.084 | 0.533 (0.442 - 0.643) | <0.001 | |
| FIR | ≤1.30 | Ref | Ref | ||
| 1.31–3.50 | 1.188 (1.017 - 1.387) | 0.029 | 0.779 (0.659 - 0.919) | 0.004 | |
| >3.5 | 1.267 (1.031 - 1.558) | 0.025 | 0.883 (0.711 - 1.097) | 0.266 | |
3.9. Associations Between Lifestyle Factors and OA
The associations between lifestyle factors and OA risk are presented in the table, with both crude and adjusted ORs considered. The BMI category was significantly positively associated with OA, particularly obesity, with an adjusted OR of 2.576 (95% CI: 1.491–4.453; P = 0.001). Overweight individuals also had a higher, although nonsignificant, risk (OR: 1.487; 95% CI: 0.890–2.482; P = 0.134). Diabetes was significantly associated with OA, with individuals diagnosed with diabetes showing a markedly greater risk (OR: 1.417; 95% CI: 1.217–1.649; P < 0.001), whereas those with borderline diabetes had no significant association (OR: 1.289; 95% CI: 0.888–1.872; P = 0.185).
Compared with current smokers, ever smokers had a significantly lower risk of OA in the adjusted model (OR: 0.743; 95% CI: 0.598–0.924; P = 0.009), whereas never smokers had a strong protective effect (OR: 0.533; 95% CI: 0.442–0.643; P < 0.001). Finally, FIR showed a significant association, with individuals in the 1.31–3.50 range having a reduced risk of OA in the adjusted model (OR: 0.779; 95% CI: 0.659–0.919; P = 0.004), whereas those with a ratio greater than 3.5 had no significant difference in risk (OR: 0.883, 95% CI: 0.711–1.097; P = 0.266) (Table 7).
These findings highlight significant associations between obesity, diabetes, smoking status, and family income and osteoarthritis risk, with the potential for targeting modifiable lifestyle factors in OA prevention and management strategies.
4. Discussion
This study offers comprehensive insights into the complex interplay between TEs, lifestyle factors, and the risk of arthritis, with a particular focus on OA. Our findings demonstrate significant associations between arthritis incidence and exposure to toxic heavy metals, such as Pb, Cd, and Hg, and essential trace elements, such as Se and Mn. These results emphasize the multifactorial nature of arthritis, where metabolic imbalances and behavioral risk factors, such as BMI, smoking, diabetes, and poor dietary patterns, may synergistically influence disease development and progression [16,17]. The potential role of TEs in arthritis pathogenesis is increasingly recognized in environmental and clinical research. In this study, we employed both quartile stratification and RCS models to explore the dose‒response relationships between individual element exposure and arthritis risk. This approach allowed us to capture potential nonlinear associations that may be overlooked by traditional models.
The relationship between Pb exposure and arthritis, particularly in the context of quartile analysis, revealed a complex interplay between crude associations and adjusted models. According to the quartile analysis, lead was positively associated with arthritis in the crude models. However, these associations were attenuated after adjusting for potential confounders. Notably, Pb was not significantly associated with arthritis risk in the adjusted models, highlighting the importance of controlling for confounding factors in epidemiological studies [18,19]. Similarly, in the case of OA, Pb exposure was positively associated with disease risk in the crude quartile models, but the association weakened after adjusting for confounders. Nevertheless, the nonlinear relationship observed in the RCS analysis indicated that higher levels of lead exposure contributed to arthritis pathology. This suggests that while lower levels of Pb may not significantly impact arthritis risk, higher levels could still contribute to joint issues, which is consistent with the findings of previous studies [18,20]. These RCS findings reinforce the possibility of a dose-dependent relationship between Pb exposure and arthritis [18]. Conversely, some studies suggest that the effects of Pb exposure may be overstated at lower levels, emphasizing the need for careful interpretation of data and consideration of other environmental factors that could influence the risk of arthritis [19].
Our analysis revealed a complex, nonlinear relationship between Cd exposure and the risk of arthritis. In the crude quartile models, higher Cd levels were significantly associated with increased odds of arthritis compared with the lowest quartile, suggesting a potentially detrimental effect of Cd exposure. However, after adjusting for key confounders, including age, sex, race/ethnicity, BMI, RIF, smoking status, and diabetes, the strength of the association diminished and, in some cases, reversed. This attenuation indicates that the observed associations in the crude models may have been confounded by these underlying variables, particularly smoking, which is a well-known source of Cd exposure and a risk factor for arthritis [21,22].
Notably, the RCS analysis provided additional insight into this relationship, revealing a statistically significant nonlinear dose‒response curve (p for nonlinearity = 0.001). The spline showed that, at low to moderate Cd concentrations, the odds of arthritis remained relatively stable or slightly decreased. However, a sharp increase in the risk of arthritis was observed at higher exposure levels. This finding aligns with the literature on environmental toxicology, emphasizing the importance of exposure thresholds for understanding health impacts [23]. This nonlinear trend suggests that, while Cd may not pose a substantial risk at low exposures, it could become a significant contributor to arthritis pathogenesis beyond a certain threshold.
The discrepancy between the quartile and RCS analyses in exposure studies highlights the limitations of categorizing continuous variables. Quartile stratification can obscure nonlinear dose‒response trends and fail to detect threshold or saturation effects, especially when associations are modified by confounders, such as smoking and obesity [24,25]. In contrast, RCS models treat exposure as a continuous variable, effectively capturing subtle patterns and revealing that arthritis risk increases significantly at relatively high levels of Cd exposure, suggesting a potential threshold effect [26]. Thus, our findings highlight the value of flexible modeling approaches in revealing nuanced exposure‒outcome relationships that may otherwise remain hidden in traditional analyses.
Conversely, Se exhibited a clear protective association with arthritis, which remained significant even after adjusting for key confounders. RCS analysis further supported this finding by revealing a significant nonlinear dose‒response relationship, indicating that the protective effects of Se may vary depending on the exposure level. At moderate Se concentrations, the odds of arthritis appeared to decrease; however, higher Se concentrations did not necessarily increase protection, suggesting a threshold or plateau effect. These findings are consistent with those of some studies reporting that the Se content in patients with arthritis is significantly lower than that in normal controls [27,28]. In addition, these findings are consistent with those of prior studies showing that the anti-inflammatory and antioxidant properties of Se may help mitigate cartilage damage and joint inflammation [29,30,31]. Furthermore, Se has been shown to suppress proinflammatory cytokine expression and oxidative stress, both of which contribute to arthritis pathogenesis.
In the context of OA, Se showed no significant associations in the adjusted quartile models, which is consistent with the findings of a previous study [27]. However, RCS analysis revealed a nonlinear association, suggesting that the relationship between Se and OA may be more complex and dose dependent. Adequate Se levels are known to support chondrocyte function and reduce oxidative stress, which is crucial for joint health [32,33,34]. Excessive Se intake can negate the health benefits of Se and potentially harm joint tissues, particularly in OA. While Se is recognized for its anti-inflammatory properties and positive effects on bone health, recent studies indicate that high levels of Se may increase the risk of OA [32,35].
Among lifestyle factors, obesity emerged as a strong risk factor for arthritis, with individuals classified as obese showing significantly greater odds of developing the condition, which is in line with the findings of a previous study [36]. Studies have indicated that excess body weight exacerbates mechanical stress on weight-bearing joints, such as the knees and hips, while also inducing systemic inflammation [36,37]. Obesity increases the secretion of proinflammatory cytokines and adipokines, which contribute to joint degradation, cartilage loss, and inflammation, further increasing the risk of developing arthritis, particularly osteoarthritis [37,38]. The negative effects of obesity on joint health are well documented, as the increased mechanical load on joints accelerates wear and tear, particularly in individuals with preexisting joint conditions[39,40].
Diabetes remained a significant independent predictor of arthritis in our study, further supporting its role in metabolic dysfunction and chronic inflammation as contributors to joint degeneration. Diabetes is associated with elevated levels of advanced glycation end products (AGEs), which promote inflammation and oxidative stress, both of which are key contributors to the development and progression of arthritis [41,42,43]. Additionally, diabetes often co-occurs with obesity, further compounding the effects of metabolic dysfunction on joint health and increasing the risk of arthritis [44].
In addition, current smokers exhibit an increased risk of arthritis, which is consistent with previous studies that highlighted the detrimental effects of smoking on joint health [45]. Smoking exacerbates systemic inflammation and increases the production of matrix metalloproteinases and enzymes that degrade cartilage, thus accelerating joint damage and increasing the risk of arthritis [46]. Chronic exposure to toxins in cigarette smoke may also interfere with cartilage repair processes, contributing to the long-term progression of arthritis.
Furthermore, socioeconomic status, assessed via the FIR, demonstrated an inverse association with arthritis, suggesting that lower income levels may contribute to greater disease burden. This likely reflects disparities in healthcare access, which are crucial in managing chronic conditions, such as arthritis. Lower-income individuals may face barriers to receiving appropriate medical care, resulting in delayed diagnosis and inadequate treatment [10,47]. This association is compounded by lifestyle factors prevalent in lower-income populations, which can exacerbate the symptoms and progression of arthritis.
Overall, these findings underscore the multifactorial nature of arthritis, which arises from the complex interplay between environmental exposure, metabolic dysfunction, and lifestyle-related determinants. Toxic trace elements, such as Cd and Pb, may increase the risk of arthritis through mechanisms involving oxidative stress, inflammation, and immune dysregulation. In contrast, essential trace elements, such as Se and Mn, appear to exert protective effects, likely through their antioxidant and anti-inflammatory effects on joint tissue homeostasis. The contrasting roles of these elements emphasize the importance of dose, context, and biological function in determining their impact on disease risk. Furthermore, metabolic and lifestyle-related risk factors, particularly obesity and diabetes, remain central to arthritis pathophysiology, as they contribute to both mechanical joint stress and systemic inflammation. Socioeconomic disparities, as reflected in income and access to care, were also associated with an increased arthritis burden, highlighting the influence of social determinants of health. These findings reinforce the need for integrated prevention strategies to address both environmental exposure and modifiable behavioral risks.
Future research should prioritize mechanistic investigations to clarify how trace elements interact with metabolic pathways in joint degeneration and explore targeted public health interventions. Addressing these modifiable risk factors, particularly through improved nutrition, weight management, and equitable healthcare access, could have meaningful effects on arthritis prevention and management across diverse populations.
Strengths and Limitations
This study had several notable strengths. First, it leverages data from the NHANES, a large, nationally representative sample of the U.S. population, thereby enhancing the external validity and generalizability of the findings. Second, the analysis employed complex weighted survey methods, which account for the NHANES's multistage, stratified sampling design. This ensured that the estimates were unbiased and accurately reflected the national population. Third, the combination of quartile analysis and RCS models allowed for a comprehensive exploration of both linear and nonlinear dose‒response relationships, providing greater insight into subtle exposure patterns that might be missed in simpler models. Additionally, the inclusion of both toxic (Pb, Cd, and Hg) and essential (Se and Mn) trace elements enabled a more holistic assessment of environmental exposure. The study also accounted for a wide range of demographic, behavioral, and clinical confounders, which increased the robustness of the observed associations.
However, this study had several limitations. First, the cross-sectional design of the NHANES precludes causal inference, limiting its ability to establish temporal relationships between trace element exposure and arthritis outcomes. Second, the trace element levels were assessed from single blood samples, which may not fully represent chronic or long-term exposure. Third, the arthritis diagnosis was based on a self-reported physician diagnosis, which may introduce misclassification or recall bias. Additionally, although multiple covariates were included, residual confounding may persist due to unmeasured variables, such as physical activity levels, occupational exposures, dietary intake, or genetic predisposition. Finally, while RCS models provide a flexible way to assess nonlinear associations, their results can be sensitive to model specifications and sample distributions, especially in subgroups with extreme exposure levels.
5. Conclusion
This study highlights the intricate interplay between environmental exposure, metabolic conditions, and lifestyle factors in shaping the risk of arthritis. Our findings suggest that toxic trace elements, such as Cd and Pb, are associated with increased arthritis susceptibility, particularly at relatively high exposure levels, as demonstrated by nonlinear dose‒response patterns. Conversely, essential elements such as Se and Mn may exert protective effects, although their relationships with arthritis and osteoarthritis vary according to the exposure level and modeling approach.
Moreover, lifestyle and metabolic factors, especially obesity, diabetes, smoking status, and socioeconomic status, remain significant and potentially modifiable contributors to the risk of arthritis. The use of complex survey-weighted analysis enhances the generalizability of these results to the broader U.S. population and adds credibility to the observed associations.
Overall, these findings underscore the multifactorial etiology of arthritis and call for integrated public health strategies that target environmental, behavioral, and metabolic risk factors. Future longitudinal and mechanistic studies are needed to elucidate the causal pathways and support targeted interventions for arthritis prevention and management.
Supplementary Materials
The following supporting information can be downloaded at the website of this paper posted on Preprints.org.
Author Contributions
Abebe Feyissa Amhare: Conceptualization; Methodology; Formal analysis; Validation; Writing – original draft; Writing – review & editing. Lichun Qiao: Methodology; Software; Formal analysis; Validation; Data curation; Writing – review & editing. Huan Deng: Methodology; Software; Formal analysis; Validation; Data curation; Writing – review & editing. Wei Wang: Data curation; Supervision; Writing – review & editing. Jing Han: Data curation; Supervision; Project administration; Writing – review & editing.
Ethical approval
Analyses were based on NHANES data that approved by the National Center for Health Statistics (NCHS) Ethics Review Board (ERB). More detailed information located on the NHANES website. Written informed consent was obtained from each participant before their inclusion on the NHANES database. This study uses only secondary data analyses without any personal information identified using statistical data from the NHANES website; no further ethical approval for conducting the present study is required.
Consent to Participate
Not applicable.
Consent to Publish
Consent was given by all the authors.
Funding
The authors declare that no funds, grants, or other support were received during the preparation of this manuscript.
Declaration of Competing Interest
The authors declare that they have no known competing financial interests or personal relationships that could have appeared to influence the work reported in this paper
References
- U.C. Gupta, S.C. Gupta, S.S. Gupta, Clinical Overview of Arthritis with a Focus on Management Options and Preventive Lifestyle Measures for its Control, Current Nutrition & Food Science 18(5) (2022) 476-486.
- M. Fusco, S.D. Skaper, S. Coaccioli, G. Varrassi, A. Paladini, Degenerative joint diseases and neuroinflammation, Pain Practice 17(4) (2017) 522-532. [CrossRef]
- Z. Wang, Z. Xiao, C. Sun, G. Xu, J. He, Global, regional and national burden of osteoarthritis in 1990-2021: a systematic analysis of the global burden of disease study 2021, BMC Musculoskelet Disord 25(1) (2024) 1021.
- S. Roškar, I. Hafner-Bratkovič, The role of inflammasomes in osteoarthritis and secondary joint degeneration diseases, Life 12(5) (2022) 731. [CrossRef]
- J.A. Buckwalter, D.T. Felson, Post-traumatic arthritis: definitions and burden of disease, Post-traumatic arthritis: pathogenesis, diagnosis and management, Springer2015, pp. 7-15.
- M. Balali-Mood, K. Naseri, Z. Tahergorabi, M.R. Khazdair, M. Sadeghi, Toxic Mechanisms of Five Heavy Metals: Mercury, Lead, Chromium, Cadmium, and Arsenic, Front Pharmacol 12 (2021) 643972. [CrossRef]
- S. Lu, L. Ren, J. Fang, J. Ji, G. Liu, J. Zhang, H. Zhang, R. Luo, K. Lin, R. Fan, Trace elements are associated with urinary 8-hydroxy-2'-deoxyguanosine level: a case study of college students in Guangzhou, China, Environ Sci Pollut Res Int 23(9) (2016) 8484-91. [CrossRef]
- I. Zwolak, H. Zaporowska, Selenium interactions and toxicity: a review. Selenium interactions and toxicity, Cell Biol Toxicol 28(1) (2012) 31-46. [CrossRef]
- M. Tonelli, N. Wiebe, B. Hemmelgarn, S. Klarenbach, C. Field, B. Manns, R. Thadhani, J. Gill, Trace elements in hemodialysis patients: a systematic review and meta-analysis, BMC Med 7 (2009) 25. [CrossRef]
- C. Schäfer, G. Keyßer, Lifestyle factors and their influence on rheumatoid arthritis: a narrative review, Journal of clinical medicine 11(23) (2022) 7179. [CrossRef]
- M. Magliano, Obesity and arthritis, Menopause Int 14(4) (2008) 149-54.
- U. Nedunchezhiyan, I. Varughese, A.R. Sun, X. Wu, R. Crawford, I. Prasadam, Obesity, Inflammation, and Immune System in Osteoarthritis, Front Immunol 13 (2022) 907750.
- A. Courties, O. Gualillo, F. Berenbaum, J. Sellam, Metabolic stress-induced joint inflammation and osteoarthritis, Osteoarthritis and cartilage 23(11) (2015) 1955-1965. [CrossRef]
- A. Courties, J. Sellam, Osteoarthritis and type 2 diabetes mellitus: what are the links?, Diabetes research and clinical practice 122 (2016) 198-206. [CrossRef]
- S. Amin, J. Niu, A. Guermazi, M. Grigoryan, D.J. Hunter, M. Clancy, M.P. LaValley, H.K. Genant, D.T. Felson, Cigarette smoking and the risk for cartilage loss and knee pain in men with knee osteoarthritis, Ann Rheum Dis 66(1) (2007) 18-22. [CrossRef]
- G. Peat, M.J. Thomas, Osteoarthritis year in review 2020: epidemiology & therapy, Osteoarthritis and Cartilage 29(2) (2021) 180-189. [CrossRef]
- H.I. Afridi, F.N. Talpur, T.G. Kazi, D. Brabazon, Estimation of toxic elements in the samples of different cigarettes and their effect on the essential elemental status in the biological samples of Irish smoker rheumatoid arthritis consumers, Environmental monitoring and assessment 187 (2015) 1-16. [CrossRef]
- A.E. Nelson, X.A. Shi, T.A. Schwartz, J.-C. Chen, J.B. Renner, K.L. Caldwell, C.G. Helmick, J.M. Jordan, Whole blood lead levels are associated with radiographic and symptomatic knee osteoarthritis: a cross-sectional analysis in the Johnston County Osteoarthritis Project, Arthritis research & therapy 13 (2011) 1-9. [CrossRef]
- I.H. Wilson, S.B. Wilson, Confounding and causation in the epidemiology of lead, International Journal of Environmental Health Research 26(5-6) (2016) 467-482.
- W. Fan, Z. Pi, K. Kong, H. Qiao, M. Jin, Y. Chang, J. Zhang, H. Li, Analyzing the impact of heavy metal exposure on osteoarthritis and rheumatoid arthritis: an approach based on interpretable machine learning, Frontiers in Nutrition 11 (2024) 1422617.
- I. Markiewicz-Górka, M. Chowaniec, H. Martynowicz, A. Wojakowska, A. Jaremków, G. Mazur, P. Wiland, K. Pawlas, R. Poręba, P. Gać, Cadmium body burden and inflammatory arthritis: a pilot study in patients from lower silesia, Poland, International Journal of Environmental Research and Public Health 19(5) (2022) 3099. [CrossRef]
- D. Hutchinson, Cadmium, one of the villains behind the curtain: has exposure to cadmium helped to pull the strings of seropositive rheumatoid arthritis pathogenesis all along?, International journal of rheumatic diseases 18(5) (2015) 570. [CrossRef]
- H. Liu, M. Liu, L. Qiao, Z. Yang, Y. He, M. Bao, X. Lin, J. Han, Association of blood cadmium levels and all-cause mortality among adults with rheumatoid arthritis: The NHANES cohort study, Journal of Trace Elements in Medicine and Biology 83 (2024) 127406. [CrossRef]
- S. May, C. Bigelow, Modeling nonlinear dose-response relationships in epidemiologic studies: statistical approaches and practical challenges, Dose-response 3(4) (2005) dose-response. 003.04. 004. [CrossRef]
- C. Bennette, A. Vickers, Against quantiles: categorization of continuous variables in epidemiologic research, and its discontents, BMC medical research methodology 12 (2012) 1-5. [CrossRef]
- L. Desquilbet, F. Mariotti, Dose-response analyses using restricted cubic spline functions in public health research, Statistics in medicine 29(9) (2010) 1037-1057. [CrossRef]
- T. Guan, Z. Wu, C. Xu, G. Su, The association of trace elements with arthritis in US adults: NHANES 2013–2016, Journal of Trace Elements in Medicine and Biology 76 (2023) 127122. [CrossRef]
- N. Yu, F. Han, X. Lin, C. Tang, J. Ye, X. Cai, The association between serum selenium levels with rheumatoid arthritis, Biological trace element research 172 (2016) 46-52. [CrossRef]
- H.-L. Cheng, C.-C. Yen, L.-W. Huang, Y.-C. Hu, T.-C. Huang, B.-S. Hsieh, K.-L. Chang, Selenium lessens osteoarthritis by protecting articular chondrocytes from oxidative damage through Nrf2 and NF-κB pathways, International journal of molecular sciences 25(5) (2024) 2511. [CrossRef]
- J.R. O'Dell, S. Lemley-Gillespie, W.R. Palmer, A.L. Weaver, G.F. Moore, L.W. Klassen, Serum selenium concentrations in rheumatoid arthritis, Annals of the rheumatic diseases 50(6) (1991) 376-378. [CrossRef]
- Y. Li, S. Zhu, J. Luo, Y. Tong, Y. Zheng, L. Ji, Z. He, Q. Jing, J. Huang, Y. Zhang, The protective effect of selenium nanoparticles in osteoarthritis: in vitro and in vivo studies, Drug Design, Development and Therapy (2023) 1515-1529. [CrossRef]
- Y. Sun, Z. Wang, P. Gong, W. Yao, Q. Ba, H. Wang, Review on the health-promoting effect of adequate selenium status, Frontiers in Nutrition 10 (2023) 1136458. [CrossRef]
- D. Kang, J. Lee, C. Wu, X. Guo, B.J. Lee, J.-S. Chun, J.-H. Kim, The role of selenium metabolism and selenoproteins in cartilage homeostasis and arthropathies, Experimental & molecular medicine 52(8) (2020) 1198-1208. [CrossRef]
- S. Wang, L. Geng, G. Zhao, P. Meng, L. Yuan, X. Guo, Effectiveness of Selenium on Chondrocyte Glycoprotein Glycosylation Which Play Important Roles in the Pathogenesis of an Endemic Osteoarthritis, Kashin–Beck Disease, Biological Trace Element Research 200(4) (2022) 1531-1537. [CrossRef]
- H. Mollazadeh, M. Salesi, A systematic review and meta-analysis of the association between selenium and osteoarthritis, (2025). [CrossRef]
- E. Baah, M. Kohlmeier, Obesity and the Development of arthritis among adults in the united States using nHaneS Data, Clinical Medicine Insights: Arthritis and Musculoskeletal Disorders 17 (2024) 11795441241264820.
- J. Sellam, F. Berenbaum, [Osteoarthritis and obesity], Rev Prat 62(5) (2012) 621-4.
- W. Mrugała, B. Skierkowski, S. Mrugała, M. Muciek, J. Kawka, K. Filipek, F. Czyżewski, K. Baranowska, A. Baranowska, N. Zalewska, Obesity impact on bones and joints health, Journal of Education, Health and Sport 75 (2024) 55986-55986. [CrossRef]
- Y.Z. Lim, A.E. Wluka, Y. Wang, F.M. Cicuttini, Obesity and Joint Disease, Adipose Tissue and Adipokines in Health and Disease (2014) 325-339.
- J. Molina, E.L. Morgan, Obesity and orthopedic issues, StatPearls [Internet], StatPearls Publishing2023.
- A.F. Mendes, S.C. Rosa, A.T. Rufino, M. Ribeiro, F. Judas, Diabetes-induced osteoarthritis: role of hyperglycemia in joint destruction, BMC Musculoskeletal Disorders 16 (2015) 1-2. [CrossRef]
- T. Chowdhury, A. Bellamkonda, N. Gousy, P.D. Roy, The association between diabetes mellitus and osteoarthritis: does diabetes mellitus play a role in the severity of pain in osteoarthritis?, Cureus 14(1) (2022). [CrossRef]
- V. Gupta, S.S.E. Santhi, S. Ravi, E.A. Ramanan, Rheumatological and musculoskeletal complications in diabetes patients, Journal of Endocrinology and Metabolism 12(4-5) (2022) 117-124. [CrossRef]
- H. Nadella, A.W. Bloom, M.D. Beckler, M.M. Kesselman, The overlap of diabetes and osteoarthritis in American populations, Cureus 15(4) (2023). [CrossRef]
- D. Bedeković, D. Kirner, I. Bošnjak, S. Novak, The Correlation between Cigarette Smoking and Rheumatoid Arthritis: An Eight-Year, Prospective, Clinical, Observational, Cohort Study, (2023).
- J.S. Coblyn, Cigarette Smoking and Risk for Rheumatoid Arthritis, NEJM Journal Watch (2019) NA49548.
- N.D.C. Sacilotto, C. Albuquerque, R.N. Giorgi, A. Vargas-Santos, S. Radominski, I. Pereira, M.D.R. Guimarães, M. Bertolo, P. Louzada Jr, M. Sauma, AB0640 impact of socioeconomic class on management outcomes of rheumatoid arthritis under real life conditions, Annals of the Rheumatic Diseases 83 (2024) 1606-1607. [CrossRef]
Table 1.
Distribution of socio-demographic characteristics and lifestyle factors by arthritis status (t test and chi-square test results).
Table 1.
Distribution of socio-demographic characteristics and lifestyle factors by arthritis status (t test and chi-square test results).
| Demographic Characteristics and lifestyle |
No arthritis (n=15755) |
Arthritis (n=6435) |
P value* |
|---|---|---|---|
| Age, years (mean ± SD) | 43.61± 0.29 | 60.56 ± 0.26 | < 0.001 |
| Gender (%) |
< 0.001 |
||
| Male | 52.04 | 39.83 | |
| Female | 47.96 | 60.17 | |
| BMI (%) |
< 0.001 |
||
| Underweight | 1.65 | 0.98 | |
| Healthy weight | 28.80 | 18.95 | |
| Overweight | 34.19 | 32.07 | |
| Obesity | 35.36 | 48.00 | |
| Race (%) |
< 0.001 |
||
| Mexican American | 9.61 | 4.38 | |
| Other Hispanic | 8.31 | 5.33 | |
| Non-Hispanic White | 60.50 | 72.65 | |
| Non-Hispanic Black | 11.10 | 10.36 | |
| Other Race - Including Multi-Racial | 10.48 | 7.28 | |
| Diabetes (%) |
< 0.001 |
||
| No | 90.16 | 76.52 | |
| Yes | 7.73 | 19.56 | |
| Borderline | 2.07 | 3.88 | |
| Smoking Status (%) |
< 0.001 |
||
| Current smoker | 16.83 | 18.63 | |
| Ever smoker | 21.67 | 33.22 | |
| Never smoker | 61.50 | 48.15 | |
| FIR (%) |
0.061 |
||
| ≤1.30 | 19.76 | 20.78 | |
| 1.31–3.50 | 39.58 | 41.41 | |
| >3.5 | 40.66 | 37.81 |
* t test for comparing means and Chi-square (X²) tests for categorical data, FIR: family income-to-poverty ratio
Table 2.
Distribution of TEs (heavy metals and micronutrients) by arthritis status.
| TEs | Total mean | No arthritis (n=15755) |
Arthritis (n=6435) |
Diff. | 95% CI | P value |
|---|---|---|---|---|---|---|
| Pb (ug/L) | 1.16 ± 0.02 | 1.10 ± 0.02 | 1.33 ± 0.04 | 0.237 | 0.17 – 0.31 | < 0.001 |
| Cd (ug/L) | 0.44 ± 0.01 | 0.41 ± 0.01 | 0.53 ± 0.02 | 0.112 | 0.08 – 0.14 | < 0.001 |
| Hg (ug/L) | 1.35 ± 0.05 | 1.37 ± 0.05 | 1.30 ± 0.06 | -0.066 | -0.14 – 0.01 | 0.096 |
| Se (ug/L) | 189.97 ± 0.62 | 190.45 ± 0.67 | 188.62 ± 0.74 | -1.826 | -3.14 – -0.51 | 0.007 |
| Mn(ug/L) | 9.67 ± 0.04 | 9.76 ± 0.05 | 9.42 ± 0.07 | -0.339 | -0.51 – -0.17 | < 0.001 |
| Diff: Difference in mean | ||||||
Table 5.
Subgroup Analysis of TE Concentrations in the OA and Non-OA Groups.
| TEs | No osteoarthritis case | Osteoarthritis | P value | ||
|---|---|---|---|---|---|
| Mean ± SD | Median (IQR) | Mean ± SD | Median (IQR) | ||
| Pb (ug/dL) | 1.09 ± 0.02 | 0.80 (0.51 : 1.29) | 1.31± 0.05 | 1.01 (0.69 : 1.56) | <0.001 |
| Cd (ug/L) | 0.41 ± 0.01 | 0.25 (0.16: 0.44) | 0.48 ± 0.02) | 0.31(0.20 : 0.54) | <0.001 |
| Hg (ug/L) | 1.35 ± 0.05 | 0.70 (0.33 : 1.48) | 1.37 ± 0.08 | 0.74 (0.35 : 1.43) | 0.978 |
| Se (ug/L) | 190.5 ± 0.67 | 173.3 (188: 204) | 189.31 ± 0.89 | 186 (170:203.8) | 0.183 |
| Mn(ug/L) | 9.76 ± 0.05 | 7.37 (9.11: 11.3) | 9.45 ± 0.09 | 8.84 (7.14: 10.98) | 0.005 |
Table 6.
Crude and Adjusted Associations between TEs and OA across Quartiles.
| TEs | Q1 | Q2 OR (95% CI) |
P value | Q3 OR (95% CI) |
P value | Q4 OR (95% CI) |
P value |
|---|---|---|---|---|---|---|---|
| Pb | |||||||
| Model 1 | Reference | 1.772 (1.513 -2.079) | <0.001 | 2.322 (1.952 - 2.762) | <0.001 | 2.532 (2.133 - 3.005) | <0.001 |
| Model 2 | Reference | 1.048 (0.91-1.207) | 0.518 | 0.943 (0.814-1.091) | 0.429 | 0.865 (0.74-1.013) | 0.071 |
| Cd | |||||||
| Model 1 | Reference | 1.629 (1.410 - 1.882) | <0.001 | 2.058 (1.735 - 2.442) | <0.001 | 1.954 (1.668 - 2.289) | <0.001 |
| Model 2 | Reference | 0.918 (0.801-1.052) | 0.218 | 0.731 (0.633-0.844) | <0.001 | 0.696 (0.587-0.826) | <0.001 |
| Hg | |||||||
| Model 1 | Reference | 1.052 (0.916 - 1.208) | 0.470 | 1.230 (1.055 - 1.434) | 0.009 | 1.060 (0.914 - 1.230) | 0.436 |
| Model 2 | Reference | 0.965 (0.849-1.096) | 0.582 | 1.052 (0.926-1.195) | 0.435 | 0.928 (0.81-1.063) | 0.279 |
| Se | |||||||
| Model 1 | Reference | 0.821 (0.706 - 0.955) | 0.011 | 0.711 (0.605 - 0.836) | <0.001 | 0.825 (0.716 - 0.951) | 0.008 |
| Model 2 | Reference | 0.954 (0.842-1.08) | 0.455 | 0.881 (0.774-1.001) | 0.052 | 0.972 (0.856-1.105) | 0.666 |
| Mn | |||||||
| Model 1 | Reference | 0.883 (0.764 - 1.0194) | 0.088 | 0.815 (0.698 - 0.951) | 0.009 | 0.783 (0.661 - 0.927) | 0.005 |
| Model 2 | Reference | 0.981 (0.867-1.111) | 0.763 | 0.888 (0.781-1.009) | 0.069 | 0.921 (0.805-1.053) | 0.229 |
Disclaimer/Publisher’s Note: The statements, opinions and data contained in all publications are solely those of the individual author(s) and contributor(s) and not of MDPI and/or the editor(s). MDPI and/or the editor(s) disclaim responsibility for any injury to people or property resulting from any ideas, methods, instructions or products referred to in the content. |
© 2025 by the authors. Licensee MDPI, Basel, Switzerland. This article is an open access article distributed under the terms and conditions of the Creative Commons Attribution (CC BY) license (https://creativecommons.org/licenses/by/4.0/).
Copyright: This open access article is published under a Creative Commons CC BY 4.0 license, which permit the free download, distribution, and reuse, provided that the author and preprint are cited in any reuse.


