
Submitted:
14 August 2025
Posted:
15 August 2025
You are already at the latest version
Abstract
The objective of this study is to overcome the technical limitations of conventional detection technologies in sensing dynamic stress and multi-physical field distributions. To this end, it proposes a novel approach to address the ambiguous damage evolution mechanism of multi-layer subgrade structures on expressways under dynamic load-temperature coupling effects. The establishment of a distributed sensing monitoring system based on ultraweak FBG Array, in conjunction with the design of a dual-grating sensing network for strain and temperature, has enabled the study to achieve high-precision monitoring of the entire strain field and temperature field of the subgrade structure. This system offers several advantages, including distributed measurement, long-term stable operation, and convenient installation. It effectively addresses the difficulties in achieving full-domain distributed monitoring and the life-span issues associated with traditional electrical sensors. Multi-parameter coupling analysis, which is based on dynamic loading tests and long-term monitoring data, revealed the dynamic response patterns of roadbed structures under the combined effects of modulus differences, burial depth effects, temperature gradients, and load parameters. This analysis verified the mechanical sensitivity of flexible subgrades and the mechanism of interlayer stress redistribution. The research findings provide innovative solutions for intelligent diagnosis throughout the entire lifecycle of highways, driving a technological leap toward real-time and comprehensive road health monitoring.
Keywords:
grating array sensing
; expressway
; multi-physics field coupling monitoring
; dynamic response mechanism
1. Introduction
As the backbone of modern transportation networks, the structural health of expressways directly impacts the efficiency of the national economy and public travel safety [1]. With the deepening implementation of China's “Transportation Powerhouse” strategy, by the end of 2023, the total length of expressways in operation nationwide had exceeded 177,000 kilometers, accounting for 76% of inter-city freight transportation and 58% of passenger transportation volume. However, under the dual pressures of surging traffic volume (with an annual growth rate of 6.8%) and heavy-load vehicles (with an axle load exceeding the limit rate of 12.3%), early-built highways have entered a concentrated major repair phase. In 2024 alone, the budget for pavement maintenance reached 32 billion yuan. This severe situation has placed higher demands on pavement structural performance monitoring technology, necessitating the establishment of a scientific and precise preventive maintenance decision-making system [2,3].
Under the coupled effects of complex climate and traffic conditions, pavement structures exhibit typical nonlinear damage characteristics. In regions like Fujian, which are characterized by high rainfall and humidity, annual precipitation reaches 1,800–2,000 mm, and humidity remains above 75% for extended periods. This unique environment leads to traditional semi-rigid bases being prone to thermal contraction cracks and erosion damage [4,5]. In response, a new composite flexible base course structure has emerged, featuring a layered design comprising “dense-graded asphalt aggregate + graded aggregate + cement-stabilized aggregate.” This design enhances structural durability through a balanced combination of rigid and flexible mechanical properties. However, engineering practice has shown that the interlayer coordination deformation mechanism of such structures is not yet fully understood [6,7], especially under the coupled effects of dynamic wheel loads and temperature gradients, where interlayer contact states are prone to progressive deterioration, leading to reflective cracks and interlayer slippage [8,9]. Research by the U.S. Federal Highway Administration (FHWA) indicates that interlayer failure accounts for 34% of early damage, directly reducing pavement service life by 30%-40%.
Traditional pavement performance assessment primarily relies on quasi-static testing equipment such as the falling weight deflectometer (FWD) [10]. This technique measures surface deflection by applying a transient impact load (typical pulse width of 30 ms) and uses elastic layered theory to calculate the modulus of each structural layer. However, numerous studies have shown that FWD test results exhibit significant discrepancies from actual dynamic responses [11]: first, its loading frequency of 0.1 Hz is far below the actual traffic load spectrum (10–50 Hz), failing to reflect the material's viscoelastic properties; second, deflection metrics inherently represent the cumulative effect of deformation across structural layers, making it difficult to analyze interlayer stress redistribution processes; furthermore, the U.S. SHRP program validation found [12] that modulus inversion results are sensitive to test temperature (with a coefficient of variation up to 28%), severely impacting assessment reliability. More critically, traditional methods can only perform point-based inspections during maintenance cycles (typically every 2–3 years), failing to capture the time-varying patterns of structural performance.
In terms of sensor technology, single-point resistive strain gauges can measure local strain [13,14], but they have insufficient spatial resolution (measurement point spacing >2m), low survival rate (construction damage rate >40%), and a sharp decline in signal-to-noise ratio in electromagnetic interference environments. Piezoelectric sensors, while offering dynamic response advantages, suffer from significant temperature drift (0.5%/°C) and poor long-term stability. A team from the University of Michigan attempted to install 200 piezoelectric elements on the I-94 highway, but 63% of the sensors failed within six months [15,16]. These technical limitations make it difficult for existing monitoring systems to meet the requirements for analyzing the strain field across the entire multi-layer structure, severely hindering the in-depth study of the mechanical response mechanisms of road surfaces.
In recent years, fiber optic sensing technology has brought revolutionary breakthroughs to infrastructure monitoring. Fiber Bragg gratings (FBGs) can achieve absolute measurements of strain and temperature thanks to their wavelength encoding characteristics, and are resistant to electromagnetic interference and corrosion [17,18]. Japan's Hanshin Expressway was the first to attempt to install FBG sensors in 2005, successfully monitoring micro-strain fluctuations caused by heavy vehicles. However, traditional FBG systems are limited by grating density (typically >5m spacing), making it difficult to meet the demands of precise monitoring of road structures [19,20]. The research team has innovatively developed weak reflectivity fiber Bragg grating (WFBG) array technology [21], which suppresses crosstalk to below -60 dB through an ultra-low reflectivity design. Combined with time-division/wavelength-division multiplexing technology, this enables distributed measurements of thousands of measurement points on a single fiber, with spatial resolution improved to the 2-meter level.
To address the unique requirements of road engineering, this study overcame three major technical challenges: first, a flexible packaging process was developed to adjust the elastic modulus of the sensor optical cable to match that of the asphalt mixture, ensuring coordinated deformation; second, an innovative optical cable installation method was developed, with differentiated burial schemes designed for different structural layers based on construction temperatures (high temperatures for the asphalt layer vs. ambient temperatures for the stabilized layer); finally, specialized demodulation equipment was developed to significantly increase the sampling frequency, enabling the complete capture of strain-time curves under vehicle axle loads. These technological innovations were validated in the actual engineering project on the Quannan Expressway, where the average daily traffic volume reaches 12,600 vehicles, with heavy-duty vehicles accounting for 15%, providing an ideal testing ground for studying the correlation between dynamic loads and structural responses. This study holds three theoretical values: first, it establishes the first comprehensive multi-layer strain and temperature database for composite flexible base layers, filling the gap in measured data on interlayer contact mechanics; second, it reveals the coupled interaction mechanism between vehicle speed, material stiffness, and interlayer state, thereby improving the dynamic response theoretical model; third, it proposes new performance evaluation indicators for pavement based on the spatiotemporal distribution of strain, driving a shift in testing paradigms from “surface defect identification” to “intrinsic mechanism diagnosis.”
2. Principle
The essence of a fiber Bragg grating (FBG) is the creation of a periodic refractive index modulation structure within the core of an optical fiber. The physical formation mechanism involves the photorefractive effect induced by ultraviolet laser light [22]. When interference fringes of a specific wavelength act on germanium-doped quartz optical fiber, the core material undergoes permanent structural reorganization, forming a refractive index modulation zone with a period of Λ (as shown in Figure 1). According to coupled mode theory, this periodic structure induces phase matching between forward and backward guided modes, and when the Bragg condition is satisfied, characteristic wavelength reflection occurs:
In the formula: is the center wavelength of the fiber optic grating; is the effective refractive index of the fiber core; is the grating period.
When external temperature or strain causes changes, drift occurs. By detecting the amount of drift, parameter sensing can be achieved.
Traditional FBG typically have high reflectivity (>10%), enabling absolute value measurements. However, when used in array multiplexing, they are prone to spectral overlap and multi-grating crosstalk issues, limiting their distributed sensing capabilities. To overcome this bottleneck, this study employs weak reflectivity fiber Bragg grating (WFBG) technology [23,24], WFBG maintains the sensing principle while reducing reflectivity to the order of parts per thousand, significantly reducing optical path crosstalk and enabling large-scale array multiplexing. WFBG array sensing networks commonly employ wavelength-division and time-division multiplexing techniques [25,26]. Figure 2 shows the principle diagram of a grating array distributed sensing system.
The principle of roadbed structural response monitoring based on grating array sensing involves embedding weak reflectivity Bragg gratings (WFBG) in optical fibers to construct a high-density distributed sensing network. Combined with a layered deployment strategy, the grating array is embedded in multiple structural layers of the roadbed to achieve synchronous, high-precision sensing of strain and temperature. The WFBG used in this study features low reflectivity and low crosstalk characteristics, supports wavelength-division/time-division multiplexing technology, and enables the deployment of thousands of measurement points on a single optical fiber, with spatial resolution reaching the 2-meter level. The sensing system detects the wavelength shift of each grating to infer local average strain, and incorporates temperature-compensated gratings to eliminate thermal drift effects, ensuring data accuracy [27]. Combining high-frequency sampling with time-domain demodulation technology enables the capture of the entire strain process under vehicle loading, revealing interlayer stress redistribution, material nonlinear response, and fatigue evolution processes. This method features high sensitivity, strong interference resistance, and excellent long-term stability, making it suitable for roadbed structural health monitoring under complex climatic and heavy-load traffic conditions. It provides technical support for achieving precise diagnosis and full-lifecycle assessment of multi-layer structures.
3. Experimental Design and Monitoring Plan
3.1. Typical Flexible Subgrade Structure Composition
This study focuses on a typical composite flexible base asphalt pavement in Fujian Province. Given the complex service environment of the southeastern coastal region, characterized by heavy rainfall, high temperatures (with surface temperatures reaching up to 60°C in summer), and heavy traffic loads, the subgrade structure has been optimized through design. The structure employs a six-layer composite system, arranged from top to bottom as follows: modified asphalt concrete anti-skid surface layer (AC-16C), medium-grade modified asphalt concrete base layer (AC-20C), dense-graded asphalt-stabilized crushed stone upper base layer (ATB-25), graded crushed stone lower base layer, 3% cement-stabilized crushed stone subbase layer, and natural soil subgrade. Among these, the graded crushed stone layer serves as a flexible transition layer, connecting the upper asphalt structure with the lower semi-rigid water-stabilized layer, forming a “flexible upper layer and rigid lower layer” stress gradient structure, effectively alleviating reflective cracks caused by sudden changes in layer stiffness.
The design modulus, thickness, and splitting strength of each structural layer are shown in Table 1, reflecting their comprehensive performance advantages in terms of load-bearing capacity, durability, and temperature adaptability. The overall structure combines high modulus load-bearing capacity with flexible energy dissipation functionality, making it suitable for long-term service requirements in southern regions under the combined effects of high-frequency dynamic loads and significant temperature gradients. This provides a clear structural foundation for subsequent monitoring and performance evaluation.
3.2. Deployment Plan
To achieve precise sensing of multi-layer strain and temperature responses within the subgrade structure, this study designed and implemented a systematic sensor cable layout plan in a 50-meter test section. The overall layout follows the principles of “layered embedding, directional deployment, and differentiated construction” to ensure that the grating array accurately reflects mechanical changes under real-world conditions. The specific deployment scheme of the optical cables within the roadbed structure is shown in Figure 3.
Considering the construction characteristics of different structural layers, the layout plan was optimized accordingly. The technical details are as follows:
- High-temperature conditions for ATB-25 upper and lower layers: The paving temperature of the ATB layer can reach 160–180°C, and traditional epoxy encapsulation is prone to failure due to thermal degradation. To ensure the stability of the sensor optical cable under high-temperature conditions, a high-temperature-resistant slot-cutting process is adopted: after the surface layer has cooled to a constructable temperature, a specialized slot-cutting device is used to excavate a rectangular slot measuring 4 cm (width) × 3 cm (depth). After laying the optical cable, the slot is filled and sealed with asphalt cold patch material.
- Granular Base Course and Cement-Treated Base to resist mechanical damage: The middle and lower layers are at risk of being crushed by the tracks of the paver during construction. Longitudinal cable laying can avoid equipment operation paths, while transverse laying requires enhanced protection. This involves excavating a protective trench with dimensions of 5 cm (width) × 4 cm (depth) using a pre-cut slot method, and then backfilling with cement mortar after cable laying to enhance mechanical resistance and stability.
- Subgrade:In the soil layer,trenches are dug and cables are laid. The trench dimensions are 10 cm (width) × 25 cm (depth).After laying the optical cable, the original soil is used to backfill the trench in layers and compacted to ensure the burial depth, positioning accuracy, and long-term stability.
Figure 4 shows the actual scene of the sensor cable layout during the construction process of each structural layer. This layered layout strategy not only effectively ensures the environmental adaptability and structural coupling performance of the sensors, but also provides a technical foundation for the long-term stable collection of data and structural status assessment.
3.3. System Configuration and Data Acquisition Plan
To monitor the dynamic response of multi-layer roadbed structures on expressways under various loads and environmental conditions before and after traffic operation, this study developed a complete distributed data acquisition system based on weak reflectivity fiber Bragg grating (WFBG) technology. The system primarily comprises five functional modules: grating array sensing network, grating signal demodulation system, edge computing preprocessing, network transmission channel, and intelligent analysis software, as shown in Figure 5 The system is designed around three core objectives: comprehensive structural state sensing, high-frequency demodulation, and intelligent decision support. It leverages multi-physics field sensing, high-speed edge processing, and intelligent platform integration to ensure highway structural safety and operational efficiency.
The system consists of the following five core components:
- Grating Array Sensing Network: This section constitutes the first sensing layer of the system, primarily composed of fiber optic grating strain sensing cables and temperature sensing cables deployed across various structural layers. By adopting weak reflectivity grating (WFBG) array technology, the system can deploy thousands of measurement points on a single fiber optic cable, meeting the real-time monitoring requirements for multi-layer, multi-dimensional, and multi-parameter monitoring of roadbed structures. The sensing network achieves high-density, long-term, and highly sensitive sampling of structural conditions, with strong resistance to electromagnetic interference and high temperature and humidity, demonstrating excellent engineering adaptability.
- Grating Signal Demodulation System: This module is the data collection hub of the entire system. It uses a high-speed spectral demodulator to convert the optical signals transmitted from the sensing network into raw electrical signals containing physical quantity information such as strain and temperature. The demodulation process supports wavelength division/time division multiplexing demodulation mechanisms and has high-frequency sampling capabilities to ensure distortion-free capture of the entire dynamic response process.
- Edge computing and data preprocessing: The demodulated raw electrical signals will undergo preliminary analysis and preprocessing by the edge computing server to extract key feature indicators, such as peak strain, strain frequency spectrum, and structural response curves. The edge server is deployed in a roadside machine room, supporting local rapid computation and data caching, effectively alleviating transmission pressure and improving response efficiency.
- Network transmission channel: The system uses a low-latency, high-reliability industrial communication network to transmit edge preprocessing results back to the upper-level high-speed cloud platform via 4G/5G, dedicated lines, or fiber optic links, ensuring data real-time and integrity, and constructing a structure-communication-computing integrated closed loop.
- Intelligent Analysis Software Platform: This module is deployed on a high-speed cloud platform and integrates a variety of intelligent functions, including structural condition sensing, dynamic response analysis, health assessment, early warning and prediction, and service life assessment. The platform enables functional modules such as “multi-layer strain field visualization,” “multi-time-period load-temperature coupling diagnosis,” and “zoned health risk warning,” and provides data support and decision-making basis for operational needs such as smart mobility, smart management, smart maintenance, and smart guidance.
3.4. Load Test Plan
3.4.1. Controlled Loading Tests Before Opening to Traffic
This study utilized a 48-ton dual-wheel, four-axle standard heavy-duty truck (geometric parameters shown in Figure 6) to conduct on-site dynamic loading tests on a 50-meter monitoring section of newly constructed pavement. The dynamic loading experiments were designed with three variable controls: driving speed (10, 20, 30 km/h), driving direction (forward and reverse), and lane position (3rd and 4th lanes). Three repeated vehicle loading tests were conducted within the 50-meter monitoring section to eliminate random errors, and dynamic strain time-history curves of the internal structural layers of the subgrade were simultaneously recorded to analyze the stress propagation patterns under different operating conditions.
3.4.2. Actual Traffic Load Monitoring After Opening to Traffic
After the road is opened to traffic, dynamic response data is continuously collected through a buried strain sensor network, and a strain response database is constructed based on long-term monitoring data. To eliminate the impact of vehicle parameter randomness, data screening criteria are set:
- Vehicle gross weight > 10 tons;
- Maximum tensile strain of graded crushed stone layer > 5 με
For traffic load events that meet the screening criteria, segmented processing is performed according to the set time window (e.g., 00:00–2:00, 08:00–10:00, and the entire day cycle). For each time segment, the strain time history data recorded by the sensors deployed in each structural layer are extracted. The peak values of tensile strain and compressive strain are calculated, and the average values for that time segment are further determined. Ultimately, a multi-time segment strain response average envelope curve is constructed to describe the typical load transfer characteristics and stress evolution patterns between structural layers under different traffic flow conditions.
3.4.3. Actual Traffic Temperature Monitoring After Opening to Traffic
Following the reopening of the road to traffic, this study conducted long-term monitoring of the temperature field post-traffic resumption to assess the thermal response characteristics of the structure under environmental changes. Based on the measured data from June 1 to October 20, a systematic comparison and analysis were conducted between the fiber optic temperature sensing results and the temperature values measured by the electrical measurement method to verify the accuracy and sensitivity of the fiber optic temperature measurement technology in a dynamic thermal environment. Furthermore, a layered temperature evolution database for the structure was established to provide support for research on multi-physics field coupling mechanisms.
4. Experimental Results and Data Analysis
4.1. Strain Propagation Patterns in Roadbeds Under Dynamic Loads
Smooth filtering was applied to the experimental loading data prior to traffic opening, with a sliding window size of 3. Data from measurement points at a relative mileage of 30 m are shown in Figure 7. It can be observed that under the influence of vehicle moving loads, the longitudinal strain within the road structure exhibits an asymmetric distribution characterized by alternating tensile and compressive strains. The specific characteristics are detailed in Table 2
After applying a smoothing filter to the pre-opening test loading data, the peak tensile and compressive strain values at each measurement point were selected to plot the average strain envelope curve for the entire four-lane section, as shown in Figure 8. The test results indicate that the envelope curves of the various structural layers are generally consistent in shape, but exhibit differentiated speed sensitivity. The peak tensile and compressive strain values decrease as vehicle speed increases. When the vehicle speed is increased to 30 km/h, the reduction in peak tensile and compressive strain values for each layer is as shown in Table 3.
To quantify the degree of consistency of the envelope curves of different structural layers at different vehicle speeds, this paper introduces the similarity coefficient index for analysis. The similarity coefficient is calculated using the Pearson correlation coefficient (PCC), whose mathematical expression is as follows:
In this context, xi and yi represent the strain peak values at the i-th measurement point under two different vehicle speeds, respectively, and μ is the mean value of the corresponding sequence, with n denoting the total number of measurement points. The correlation coefficient r ranges from -1 to 1. When r approaches 1, it indicates that the two data sequences are highly linearly correlated, meaning that the strain envelope curves have essentially the same shape. By calculating the similarity of the strain envelope curves under the two vehicle speeds of 10 km/h and 30 km/h, the similarity coefficients for each structural layer are obtained as shown in Table 3. The results show that the similarity coefficient for the water-stabilized layer is the highest (0.9815), indicating that its response morphology remains highly stable at different vehicle speeds. In contrast, the similarity coefficient for the soil layer is relatively low (0.9625), which may be attributed to its loose material structure and complex stress diffusion pathways.
The interlayer response differences stem from the nonlinear coupling effect between the dynamic modulus of the material and the load application time. Theoretical analysis indicates that increasing vehicle speed reduces the load dwell time by 36.7% (30 km/h vs. 10 km/h), significantly weakening the strain accumulation effect in viscoelastic materials (graded crushed stone) and enhancing their dynamic response sensitivity compared to semi-rigid base layers (ATB, cement-stabilized layer). Monitoring data from distributed fiber optic grating arrays confirm that speed control can reduce the fatigue damage rate of granular layers. The multi-level synchronous monitoring technology achieves precise capture of dynamic responses through the synergistic effects of spatial resolution and sampling frequency, providing high spatio-temporal resolution observational methods to support dynamic optimization design of pavement structures.
4.2. Layered Characteristics of Structural Thermal Response to Temperature Gradients
Analysis of the temperature data collected by the temperature-sensitive optical cable was conducted, focusing on the relative mileage of 30 meters. The temperatures measured by the fiber optic temperature measurement method and the electrical measurement method at 12:00 PM each day were compared over the long term, as shown in Figure 9. The experimental results indicate that the overall trends in temperature field changes across all layers measured by the fiber optic temperature measurement method and the electrical measurement method are consistent, and both methods confirm that the temperature field of the road structure exhibits layered differences. When analyzed by layer, for the ATB layer and graded layer: the maximum temperature measured by the optical method was higher than that measured by the electrical method, while the minimum temperature was basically consistent with the electrical method. In terms of amplitude of change, the optical method was slightly higher than the electrical method; for the stabilized layer and soil layer: throughout the observation period, the measurement results and amplitude of change of the optical method and electrical method were basically consistent. The above results indicate that in the shallow layers of the roadbed structure, the optical measurement method, due to its rapid thermal response and strong interference resistance, can sensitively capture transient temperature changes (such as the thermal reflection effect of the asphalt layer); in the deep layers, due to the homogenization of the medium and thermal inertia, the monitoring results of the two methods tend to converge.
Based on long-term observations of the temperature time-history curves of each structural layer at relative mile markers 10m and 30m along the test section (Figure 10(a,b) June–November 2024, sampling interval of 10 minutes) and short-term observations (Figure 10(c,d), June 10, 2024) of the temperature field distribution along the test section, the following conclusions can be drawn:
- The layering pattern of the temperature field is distinct: temperature variations across layers exhibit consistency in long-term trends and seasonal fluctuations, but the amplitude of short-term daily temperature fluctuations decreases with increasing burial depth. Among these, the ATB layer, as a shallow structural layer, is most significantly influenced by external environmental factors (such as temperature fluctuations and solar radiation), exhibiting the most pronounced temperature fluctuations. Compared to the graded layer, the ATB layer exhibits a wider daily temperature variation range. For example, on June 10, its daily maximum temperature was significantly higher than that of the graded layer, while its daily minimum temperature was notably lower. This phenomenon clearly reflects the rapid response characteristic of the shallow structural layer to surface thermal conditions.
- Consistency at different mileage locations: The thermal response patterns at the 10 m and 30 m measurement points are highly consistent, indicating that the layered differences in the road temperature field can be regarded as a spatially uniform phenomenon, primarily dominated by burial depth and unrelated to the local location of the mileage points.
A comparison and analysis of temperature data collected at 12:00 on July 5 and August 15 revealed that, as shown in Figure 11, the temperature distributions at different locations within the same structural layer at the same time were highly consistent, indicating that the system exhibits excellent spatial consistency and can accurately reflect the layered characteristics of the temperature field across the entire test section. Additionally, the temperature distribution patterns at different times exhibit smooth changes, with clear temperature differences between layers, demonstrating the stability and high repeatability of the sensing system during long-term operation. This characteristic enables fiber optic temperature measurement technology to be used for continuous tracking and precise assessment of road structure temperature fields, showcasing significant engineering application value.
4.3. Verification of the Stability of Sensor Systems in Long-Term Service
As shown in Figure 12, through strain analysis of vehicle traffic on a four-lane highway during three typical time periods (0–2 a.m., 8–10 a.m., and the entire day) on October 26, 2024, it was found that the mean strain envelope curves of the ATB layer, graded layer, stabilized layer, and subgrade soil layer exhibited significant consistency in terms of morphological characteristics and amplitude range. Specifically, the maximum strain fluctuation amplitude for the ATB layer and graded layer is ±5με (Figure 12(a,b)), while the strain amplitude for the stabilized layer remains stable within ±1.5με (Figure 12(c,d)). The envelope waveforms of all structural layers exhibit over 90% alignment across different time periods, indicating that the fiber optic grating sensing system possesses excellent temporal stability.
Further comparison of traffic data from October 26 and December 26 reveals (Figure 13) that the strain envelope curves for the ATB layer, graded layer, and stabilized layer remain highly consistent, but the subgrade layer exhibits localized changes in certain areas. Notably, the maximum tensile/compressive strain of the ATB layer on December 26 was lower than that in October, while the maximum tensile/compressive strain of the water-stabilized layer and subgrade layer showed minimal changes. Temperature gradient analysis indicates that the influence of external temperature on the subgrade decreases with burial depth, resulting in lower temperature sensitivity of the deep subgrade layer.
5. Conclusion
This study innovatively employs weak-reflective Bragg grating (WFBG) array sensing technology to establish a real-time monitoring system for the entire multi-layer structure of highways, focusing on elucidating the dynamic response mechanisms of composite flexible base pavement under the coupled effects of dynamic loads and temperature. Through differentiated deployment techniques, high-precision demodulation, and long-term data mining, the system addresses the technical bottlenecks of traditional detection methods in terms of spatio-temporal resolution, environmental robustness, and interlayer mechanical analysis. The main conclusions are as follows:
- Grating array sensors feature convenient installation, high survival rate, and extended service life (the system has been in stable operation for over two years).
- Compared with electrical sensors, grating array sensors enable distributed full-field measurement of strain and temperature with high accuracy, providing reliable technical support for continuous monitoring of strain and temperature fields.
- Analysis of grating array monitoring data has revealed preliminary mechanisms governing highway subgrade structural responses to modulus variations, burial depth effects, temperature gradients, loading parameters, and vehicle speeds.
This achievement provides high-resolution data support for intelligent diagnosis of pavement structures, which can promote the transformation of maintenance decisions from “damage-driven” to “mechanical state-driven” and support the construction of a “digital twin pavement” platform. Future efforts should focus on deepening the integration of multi-source data (including FWD, radar, etc.), exploring strain-damage mapping models, expanding research on adaptability in special environments such as cold regions and coastal areas, and constructing an integrated intelligent road system combining “monitoring-diagnosis-prognosis.”
Author Contributions
Qiuming Nan:Conceptualization,Writing-review&editing,Methodology.Suhao Yin:Writing-review&editing,Writing-origi-nal draft,Formal analysis.Yinglong Kang:Investigation,Data curation,Conceptualization.Juncheng Zeng:Project administra-tion, Funding acquisition,Conceptualization.Sheng Li:Writing-review&editing,Conceptualization.Lina Yue:Writing-review&editing, Project administration.Yan Yang:Methodology, Data curation.
Funding
The research reported in this paper was supported by the National Natural Science Foundation of China (Grant No. U2433209), Major Program (JD) of Hubei Province, China (Grant No. 2023BAA017), and the Unveiling and Leading Technology Project (ZLGS-1, Traffic Safety of the Yangtze River Bridge Project Based on Array Grating Fiber Optic Sensing Technology).
Conflicts of Interest
The authors declare that they have no known competing financial interests or personal relationships that could have appeared to influence the work reported in this paper.
References
- W.Chen,“Health monitoring of highway bridge structures based on non-destructive testing technology,”Transportation Technology and Management,4(12),1-3(2023).
- W.Hua, Lu. W.Hua, Lu.Yaobang, F.Guofeng, et al.,“Research and Application of Big Data Platform for Tunnel Structural Health Management,”tunnel construction43(8),1425-1437(2023).
- Z.Xiaoding,“Research on Health Monitoring Technology for Expressway Bridge Structures,”City Intelligence 20,199-201(2023).
- H.Min, L. H.Min, L.Panpan, Y.Gang, et al., “Decision Support System for Tunnel Operation and Maintenance Basedon BIM and Tunnel Whole Life Cycle Information,” Tunnel Construction 37(4), 394-400(2017).
- N.Qian, L. N.Qian, L.Yang, M.Huilin, “Mechanical Response and Applicable Layer Analysis of High Modulus Asphalt Pavement Structure,” Transportation Science & Technolgy 50(5),13-18(2024).
- C.Guangwei, M. C.Guangwei, M.Yonglei, Z.Dingyi, “Method for identifying the interlayer contact state of asphalt pavement based on FWD deflection basin parameters and durability assessment,” Science and Technology and Engineering 24(24), 10508-10519(2024).
- W.Runhua, Z. W.Runhua, Z.Haihu, “Mechanical Performance Analysis of Asphalt Pavements Considering Interlayer Contact Conditions,” Science and Technology and Engineering 22(25),11203-11211(2022).
- L.Ling, Z. L.Ling, Z.Yu, Z.Yongbo, “Estimation of asphalt pavement fatigue performance considering interlayer contact conditions,” Journal of Dalian University of Technology 61(3), 280-287(2021).
- L.Qun, L. L.Qun, L.Tingyu, C.Yuliang, “Study on the Influence of Interlayer Contact Condition on the Performance of Rigid-Flexible Composite Pavement Structures,” highway engineering 45(6), 181-184+206(2025).
- Z.Weitian, Y. Z.Weitian, Y.Qun, “Fatigue performance assessment of old cement concrete pavements based on three-dimensional ground-penetrating radar and drop hammer deflectometer,” Journal of Tongji University (Natural Science Edition) 5, 732-740 (2025).
- L.Zhichao, L. L.Zhichao, L.Huiwen, L.Tianci, et al., “Experimental Study on the Evaluation of Subgrade Modulus Using a Drop Weight Deflectometer,” Highway 70(3), 62-69(2025).
- L.Bo, G. L.Bo, G.Xiao, Z.Gui, et al., “High-temperature rheological and fatigue performance testing of recycled asphalt undergoing secondary aging,” Highway 69(12), 366-372(2024).
- Z.Jianping, L. Z.Jianping, L.Chuntao, T.Zhaoyang, “Research on the Application of Distributed Fiber Optic Strain Sensors for Monitoring Concrete Structure Strain in Tunnels,” Sichuan Architecture 44(6), 113-116(2024).
- J.Hongwei, “Structural health monitoring based on resistive strain gauges,” Heilongjiang Water Conservancy Science and Technology 40(08), 49-51(2012).
- Spencer, B.F., Jr.; Hoskere, V.; Narazaki, Y. Advances in Computer Vision-Based Civil Infrastructure Inspection and Monitoring. Engineering 2019, 5, 199–222. [Google Scholar] [CrossRef]
- Yozo Fujino,Dionysius, M. Siringoringo,Yoshiki Ikeda,Tomonori Nagayama,Tsukasa Mizutani.High Performance Structures: Building Structures and Materials—Review Research and Implementations of Structural Monitoring for Bridges and Buildings in Japan[J].Engineering,(6),2019.
- H.Junbin, D. H.Junbin, D.Peng, T.Jinsong, “Progress in the Preparation, Demodulation, and Application of Weakly Reflective Fiber Bragg Grating Arrays,” Advances in Lasers and Optoelectronics 58(17),62-79(2021).
- W.Yu, L. W.Yu, L.Nian, Z.Yixuan, et al., “Research on grating array pipeline leak detection and localization methods based on delay estimation,” Optics& Optoelecteonic Techno;ogy 21(6), 44(2023).
- C,Jiahui, F.Haiwei, C.Miao, et al., “Temperature sensing demodulation system based on weak reflection fiber grating,” Optical communications research (03), 82-87(2025).
- J.Zhengze, H. J.Zhengze, H.Wenzhu, Z.Yuanjing, et al., “High-Spatial-Resolution High-Accuracy OFDR Distributed Sensors Based on Seamless fs-WFBG Array”[J].Photonics12(4), 352(2025).
- D.Langni, L. D.Langni, L.Yanbing, L.Hua, et al., “Performance of intelligent CFRP tendon based on long gauge FBG sensing technology,” Journal of Railway Science & Engineering 21(7), 2815-2826(2024).
- S.Yi, G. S.Yi, G.Jianfei, L.Chaozheng, et al., “Leakage Monitoring Model for Concrete Panel Rockfill Dams Based on Fiber Bragg Grating Sensing Technology,” Journal of Sensing Technology, 36(2),329-336(2023).
- G.Hongchan, Y. G.Hongchan, Y.Gaofei, H.Junbin, et al., “Preparation of weak reflection gratings in conventional optical fibers based on phase mask templates,” laser technology 46(2), 149-154(2022).
- K.Hanpeng, N. K.Hanpeng, N.Zhaojun, C.Xuefeng, et al., “OPGW pole tilt monitoring array based on weak reflection fiber optic grating,” Optical and Optoelectronic Technology 22(1), 46-51(2024).
- D.Wenfang, “Research on Fiber Optic Grating Demodulation System Based on Time-Division Wavelength-Division Multiplexing Technology,” MA.Eng Thesis,.Anhui University of Science and Technology(2023).
- B.Jilong, Z. B.Jilong, Z.Xianmin, C.Kangsheng, et al., “Research on FBG Sensor Network Technology,” optical communication technology 25(2), 84-89(2001).
- Y.Yingping, W. Y.Yingping, W.Guoqing, J.Zhentao, et al., “Structural displacement and strain field inversion method based on inverse finite element method,” Sensors and microsystems 43(7), 114-117(2024).
Figure 1.
FBG Schematic Diagram.
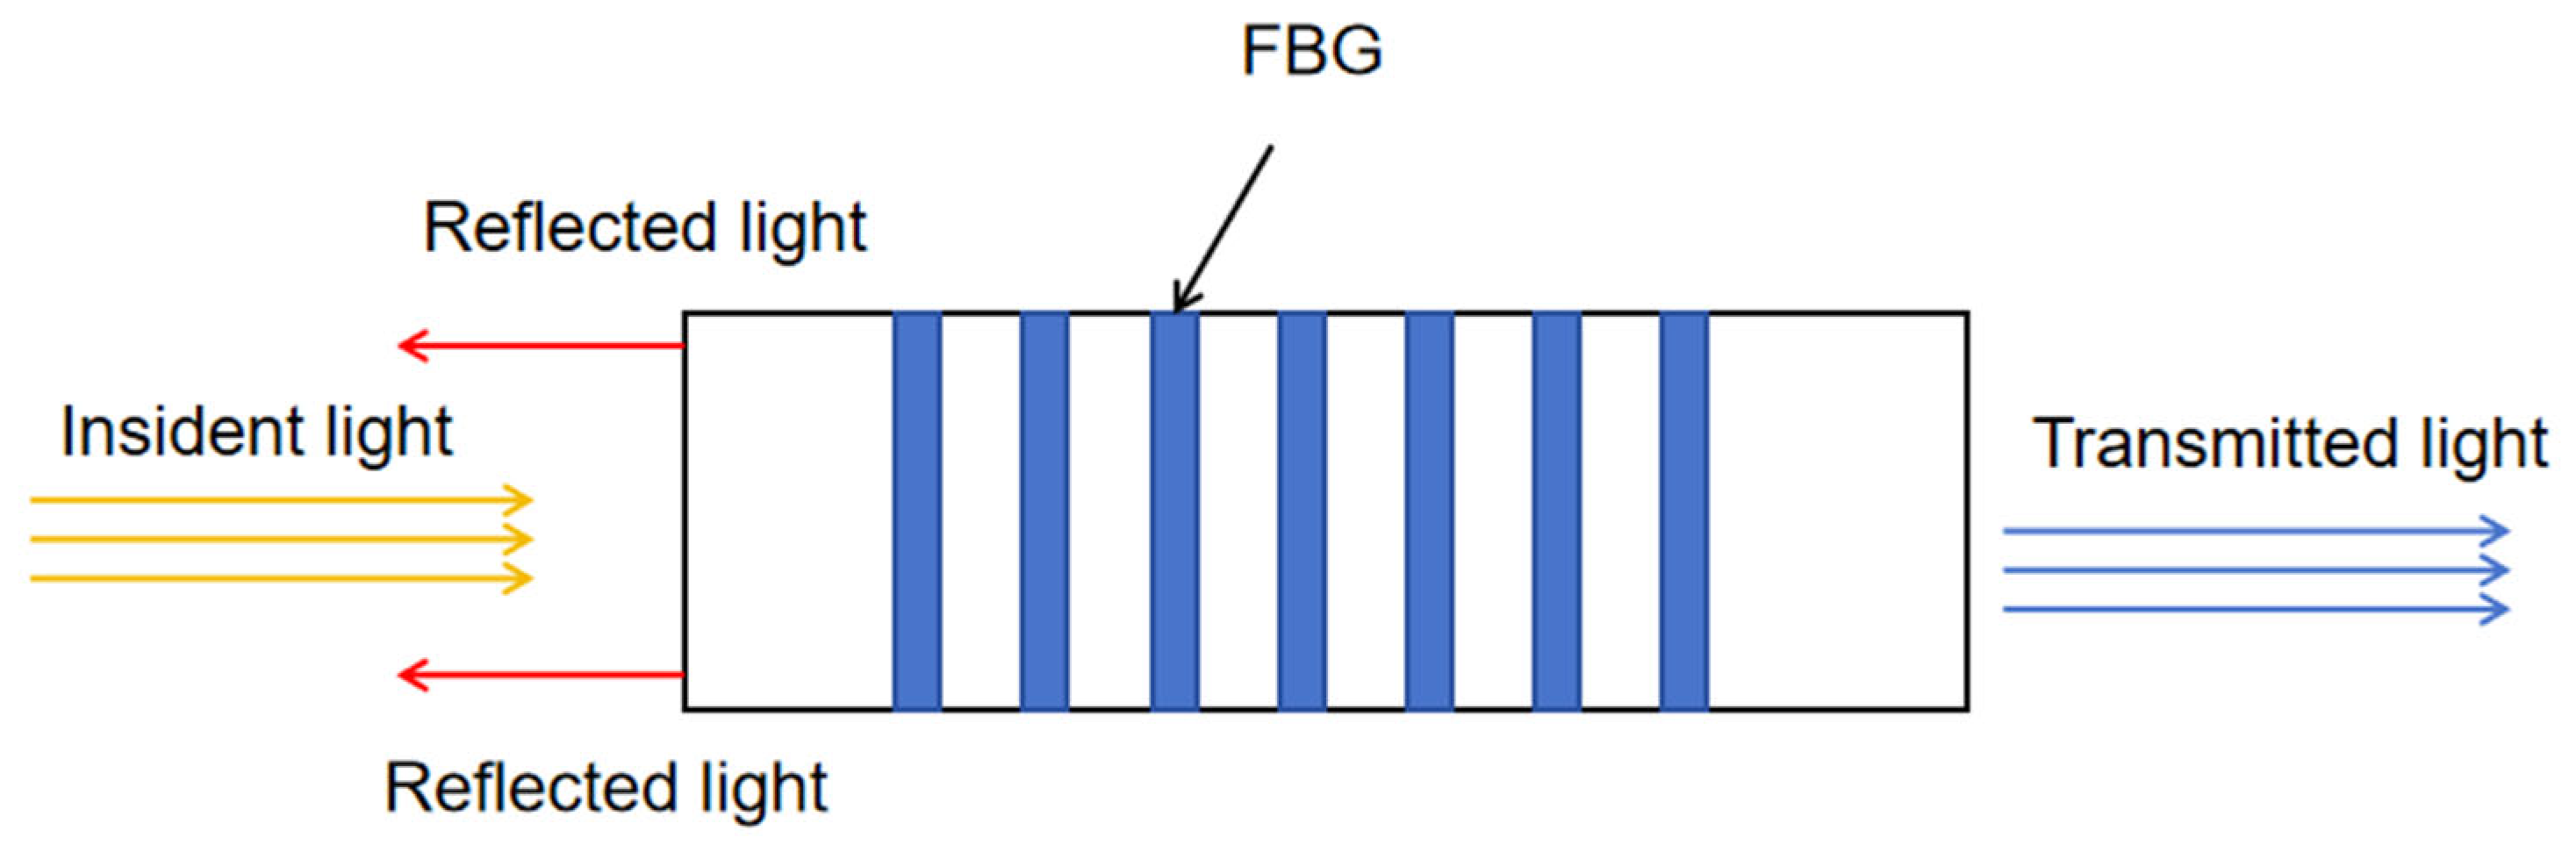
Figure 2.
Schematic Diagram of Grating Array Distributed Sensing System.
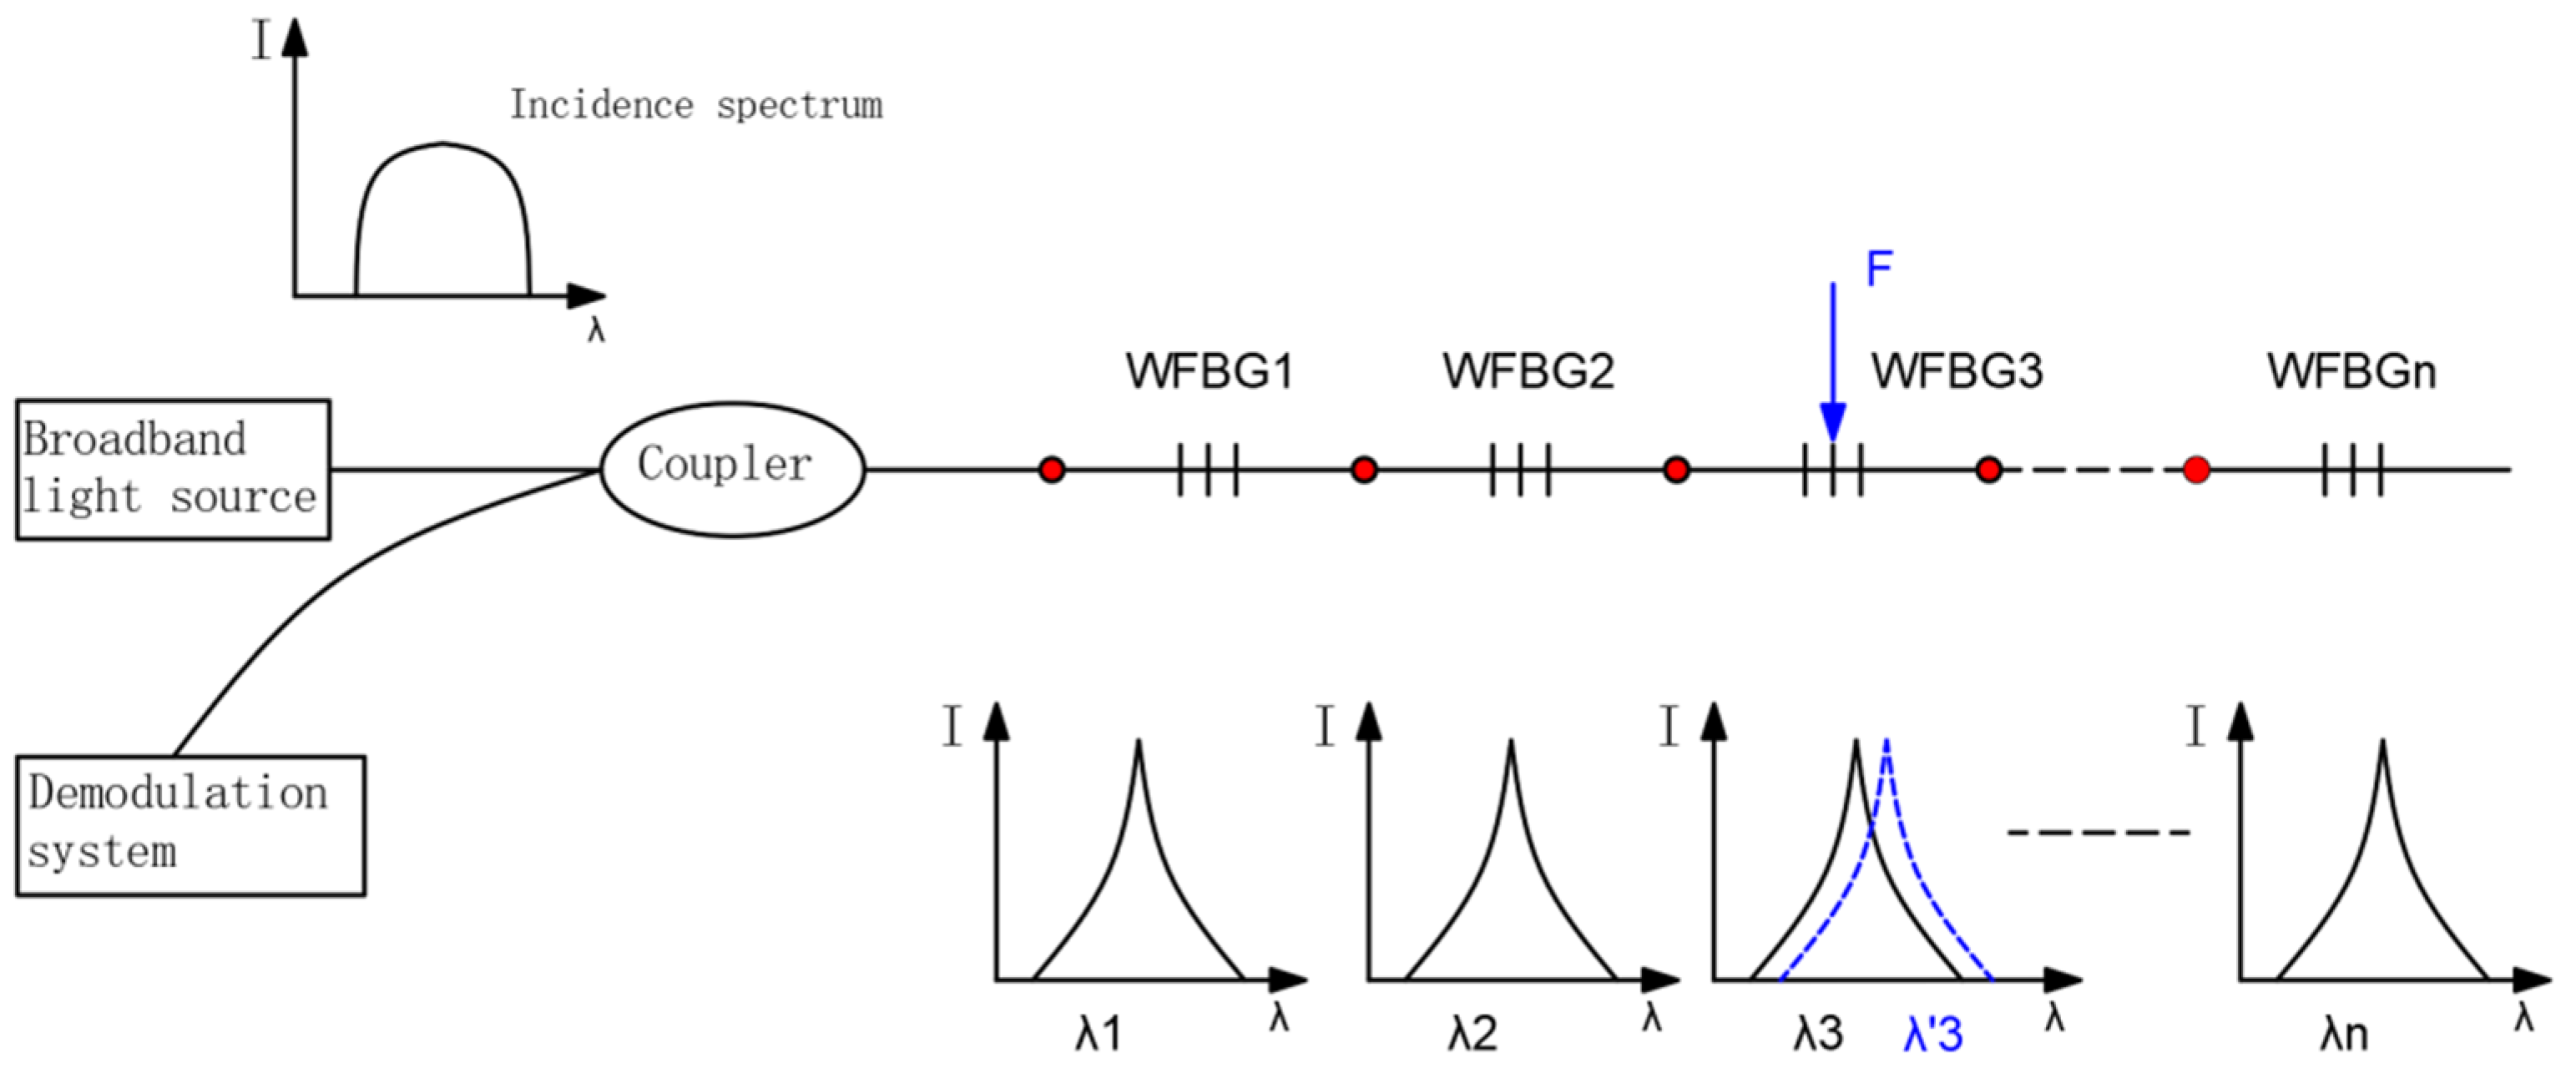
Figure 3.
Optical Sensing Cable Deployment Location Diagram. (a)Typical Cross-section of Highway Subgrade;(b)Plan View of Highway Subgrade.
Figure 3.
Optical Sensing Cable Deployment Location Diagram. (a)Typical Cross-section of Highway Subgrade;(b)Plan View of Highway Subgrade.
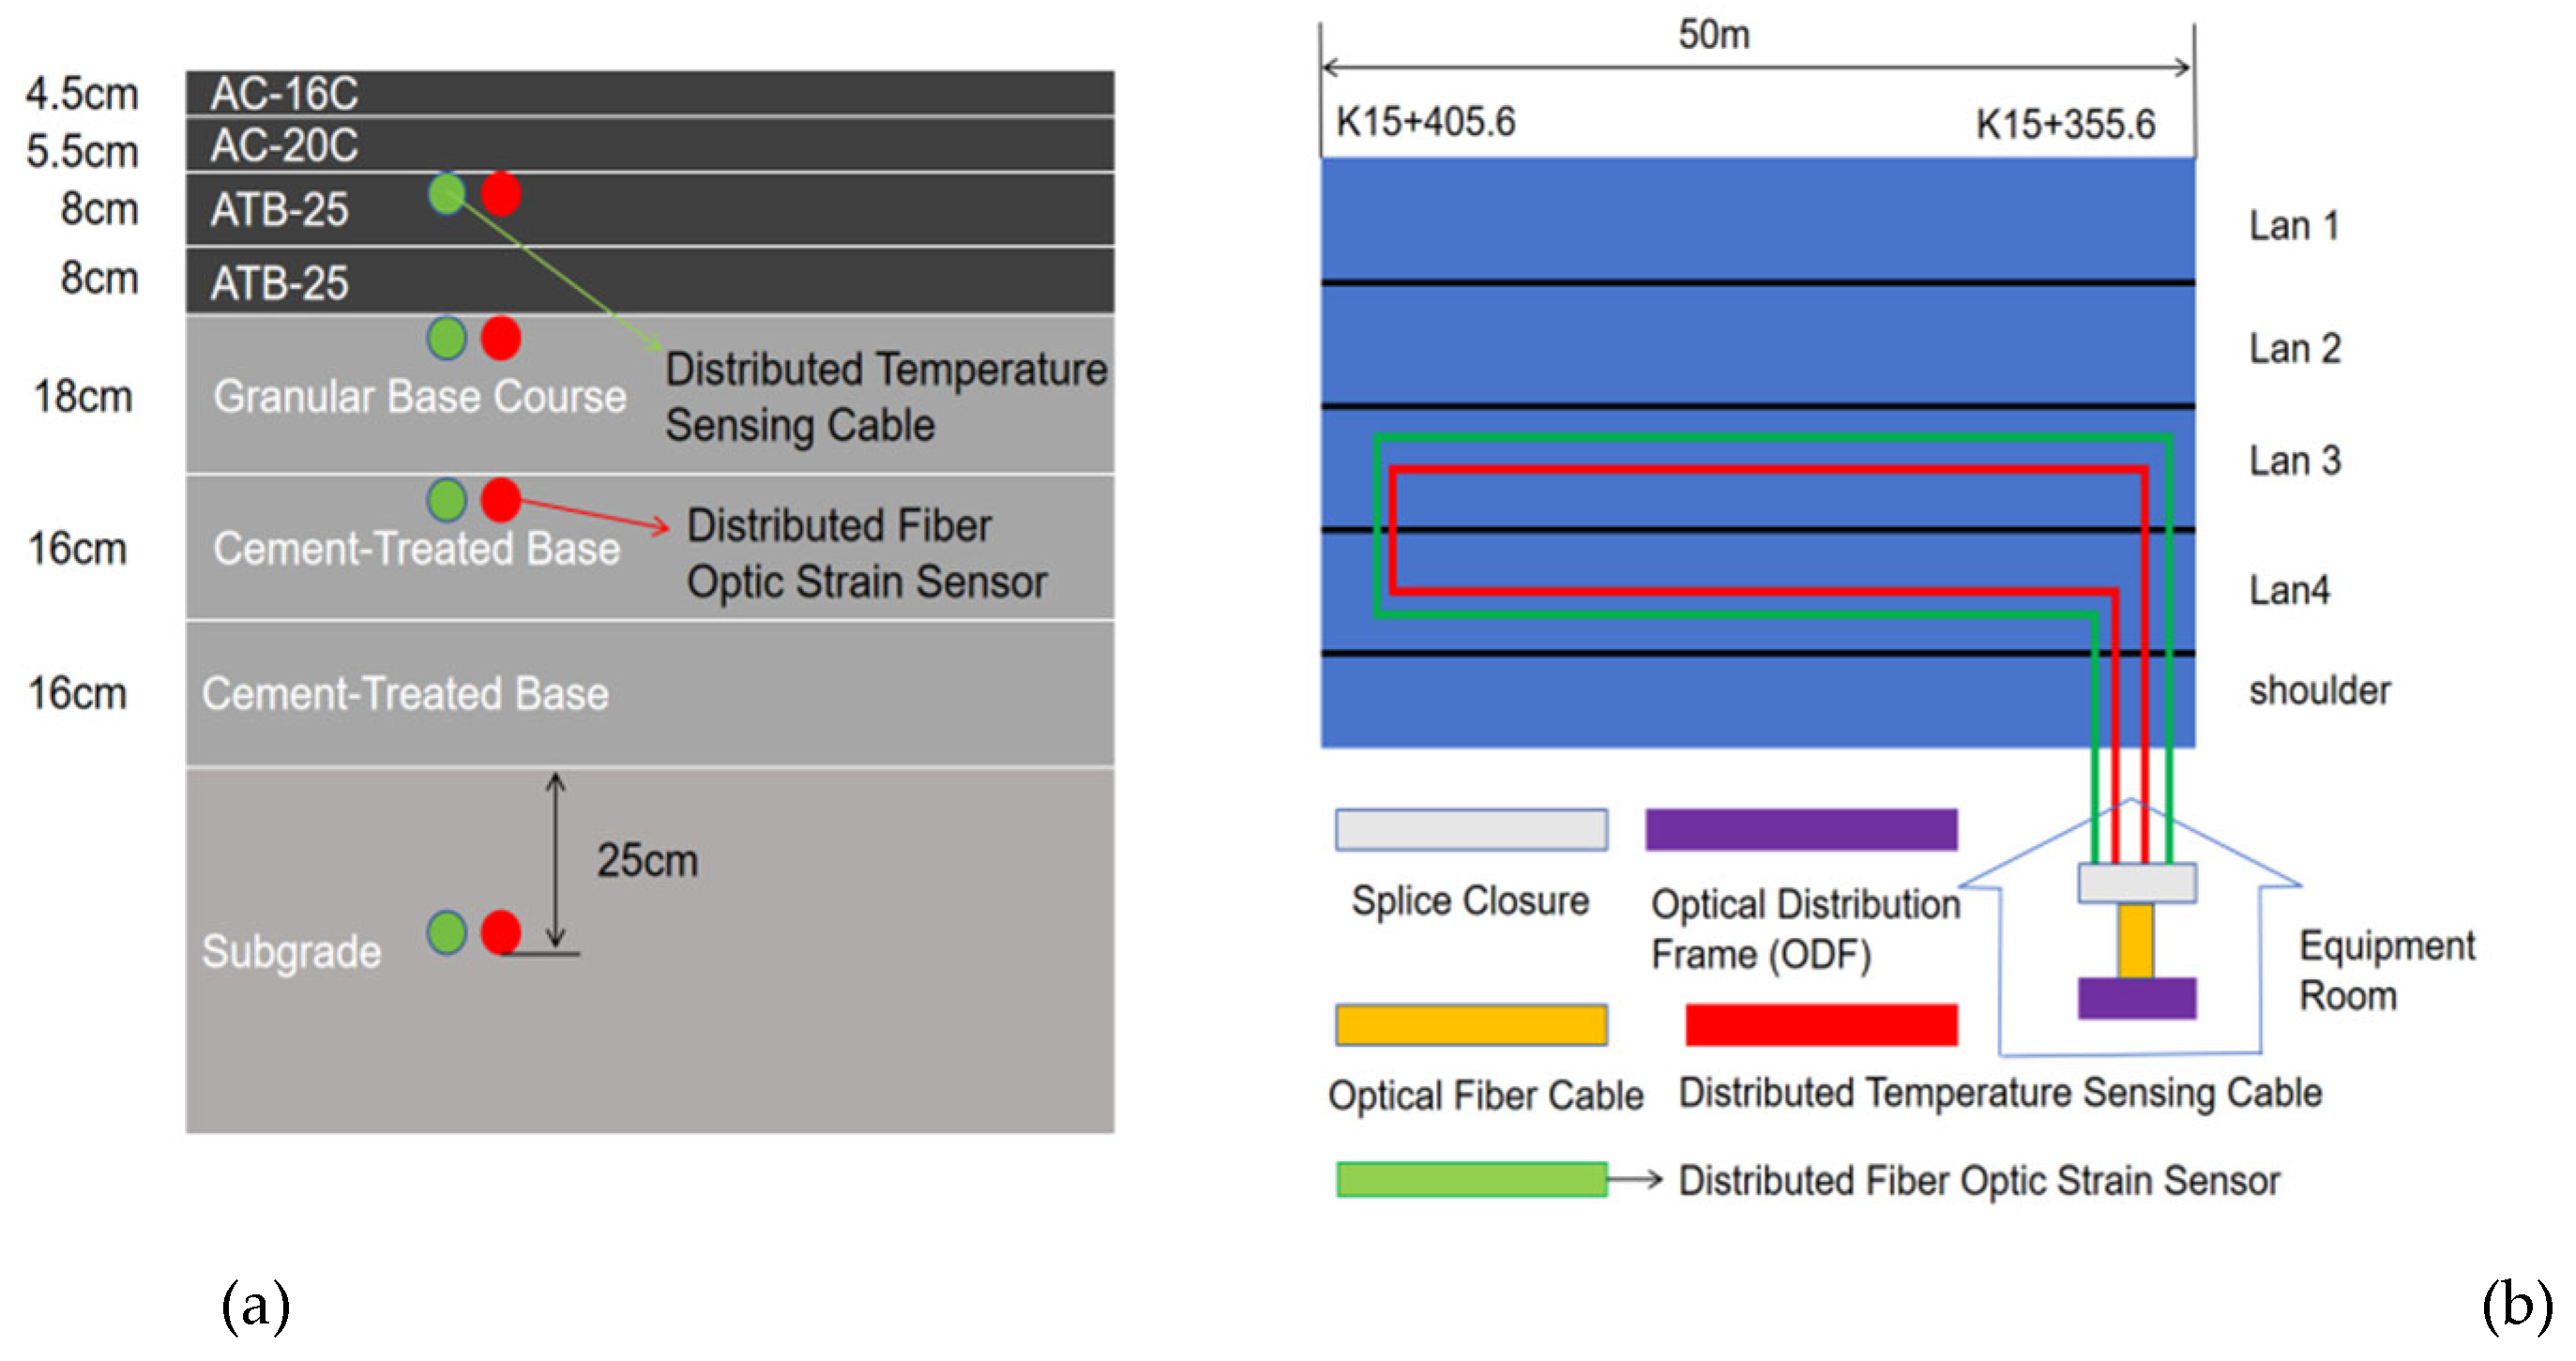
Figure 4.
Four-layer Roadbed Paving at Site. (a)ATB-25; (b) Granular Base Course; (c) Cement-Treated Base; (d) Subgrade.
Figure 4.
Four-layer Roadbed Paving at Site. (a)ATB-25; (b) Granular Base Course; (c) Cement-Treated Base; (d) Subgrade.
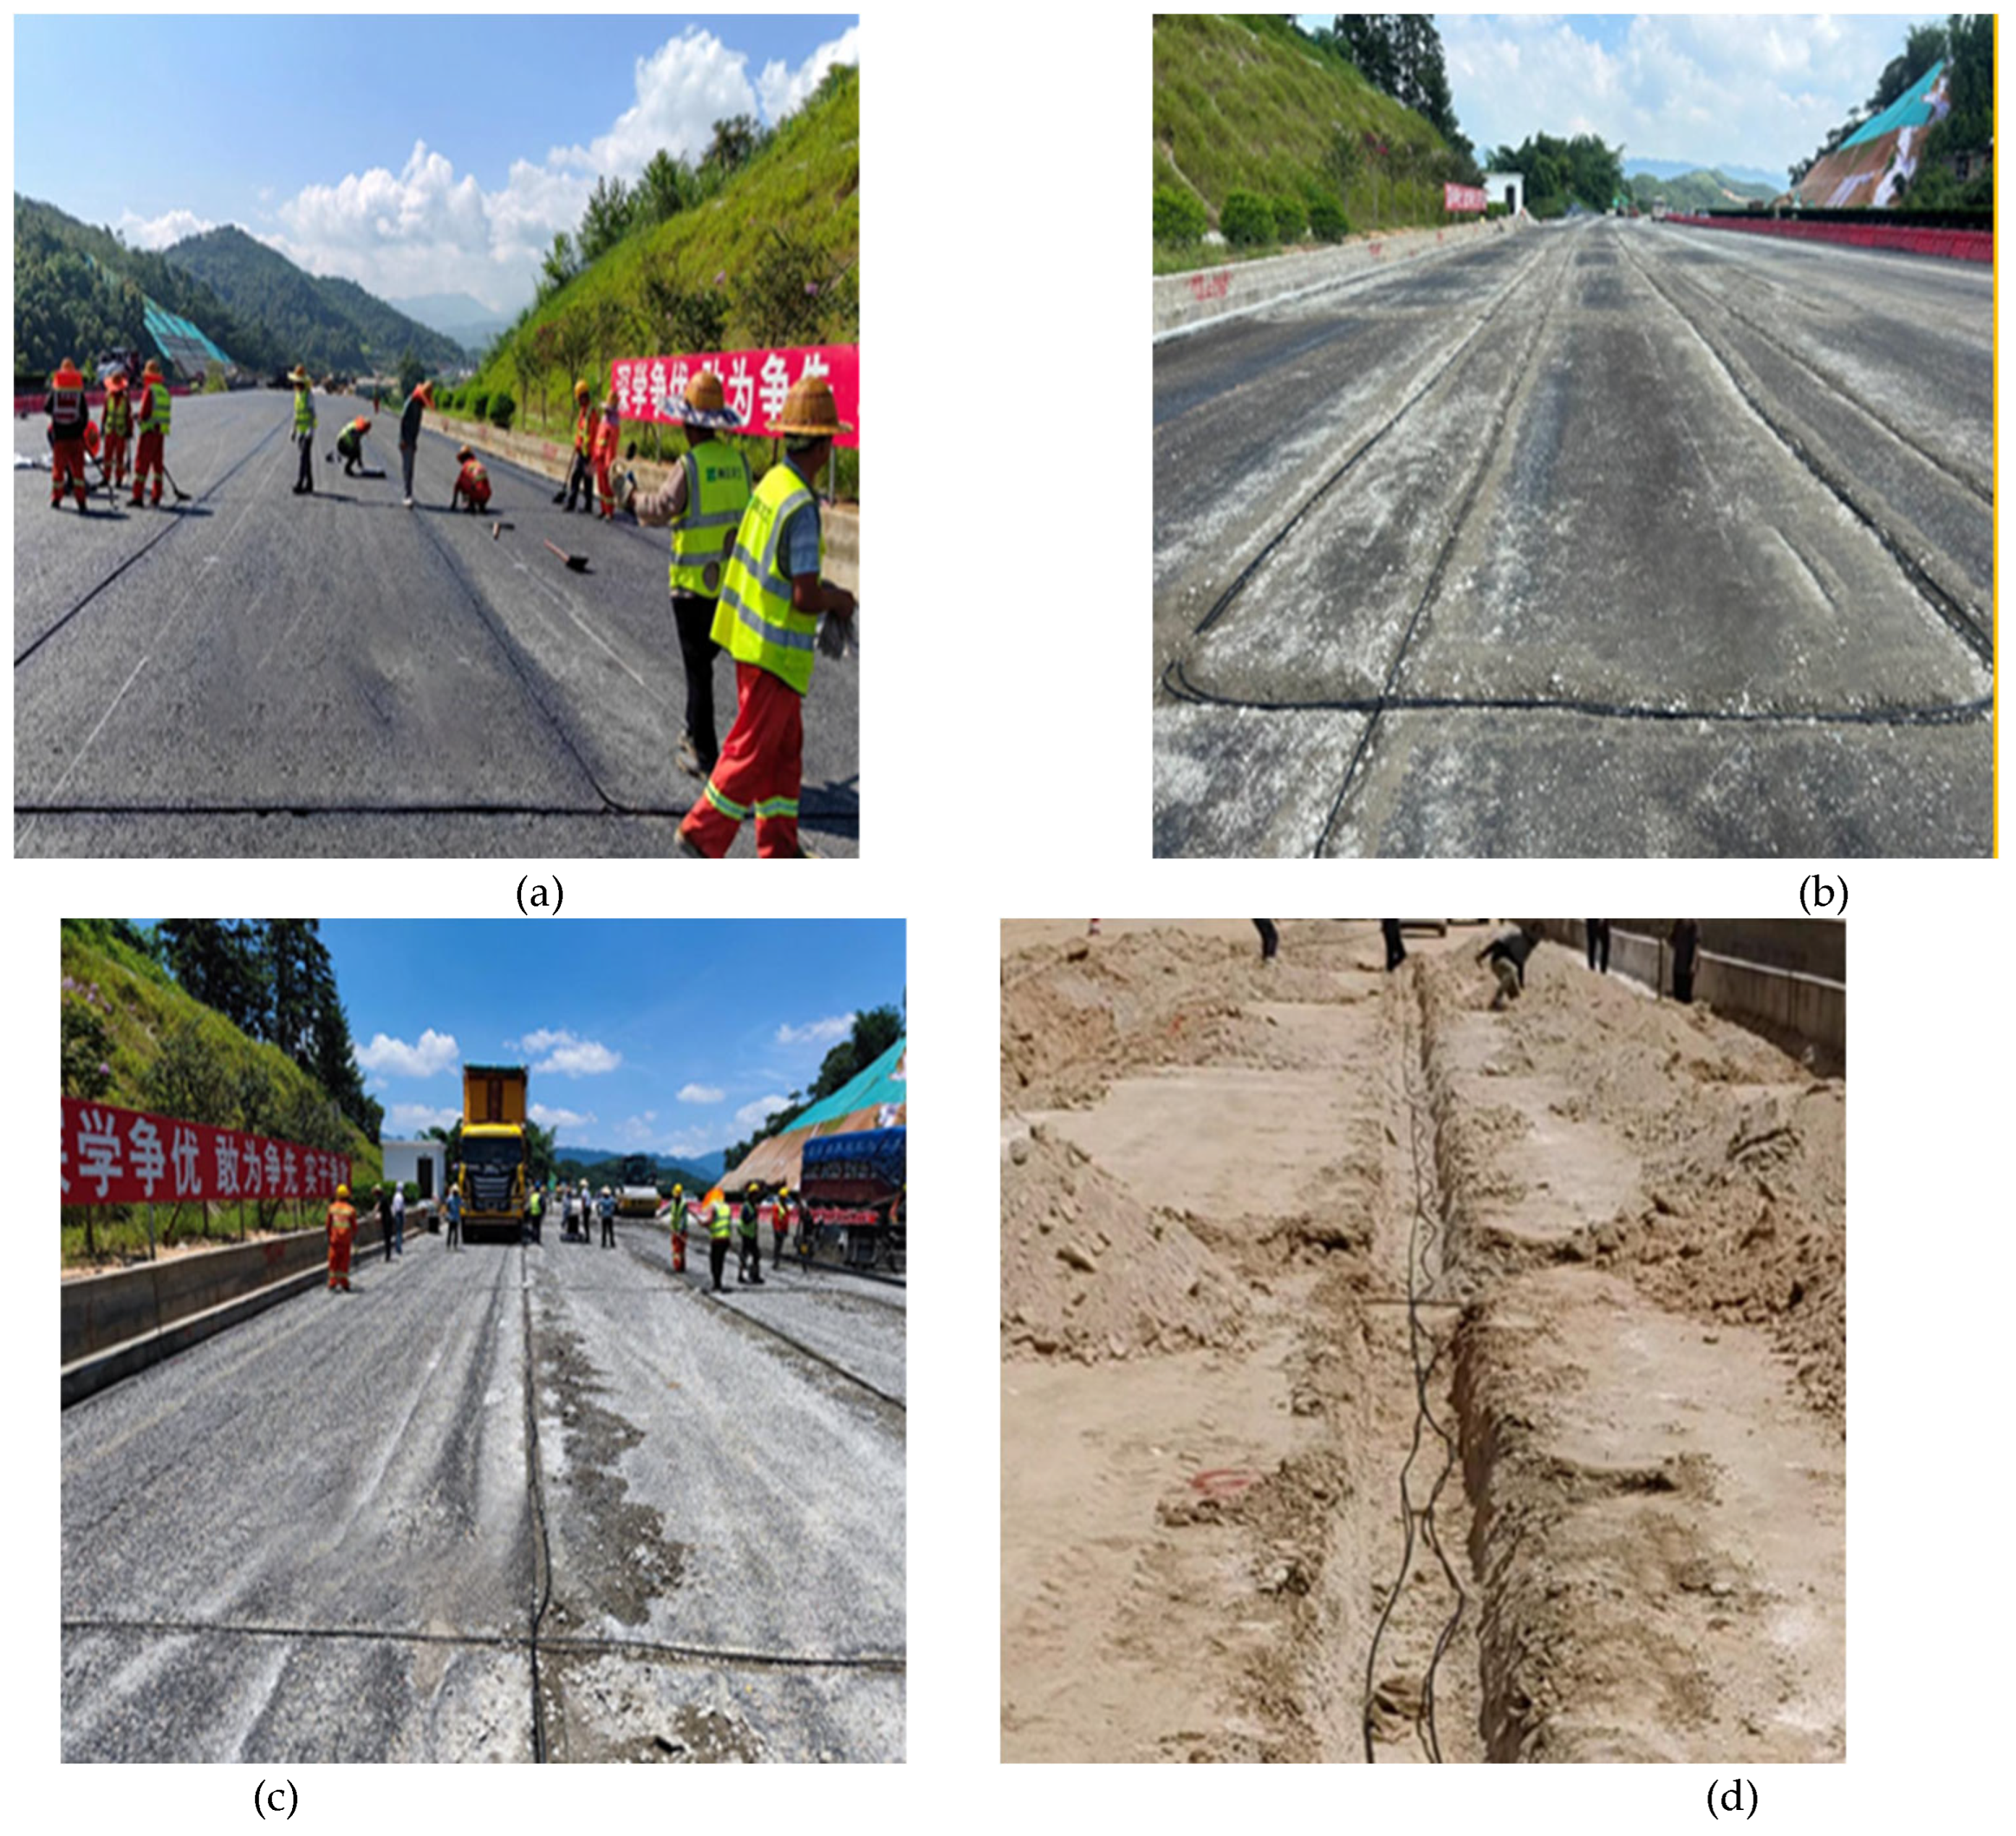
Figure 5.
Interactive System Block Diagram.
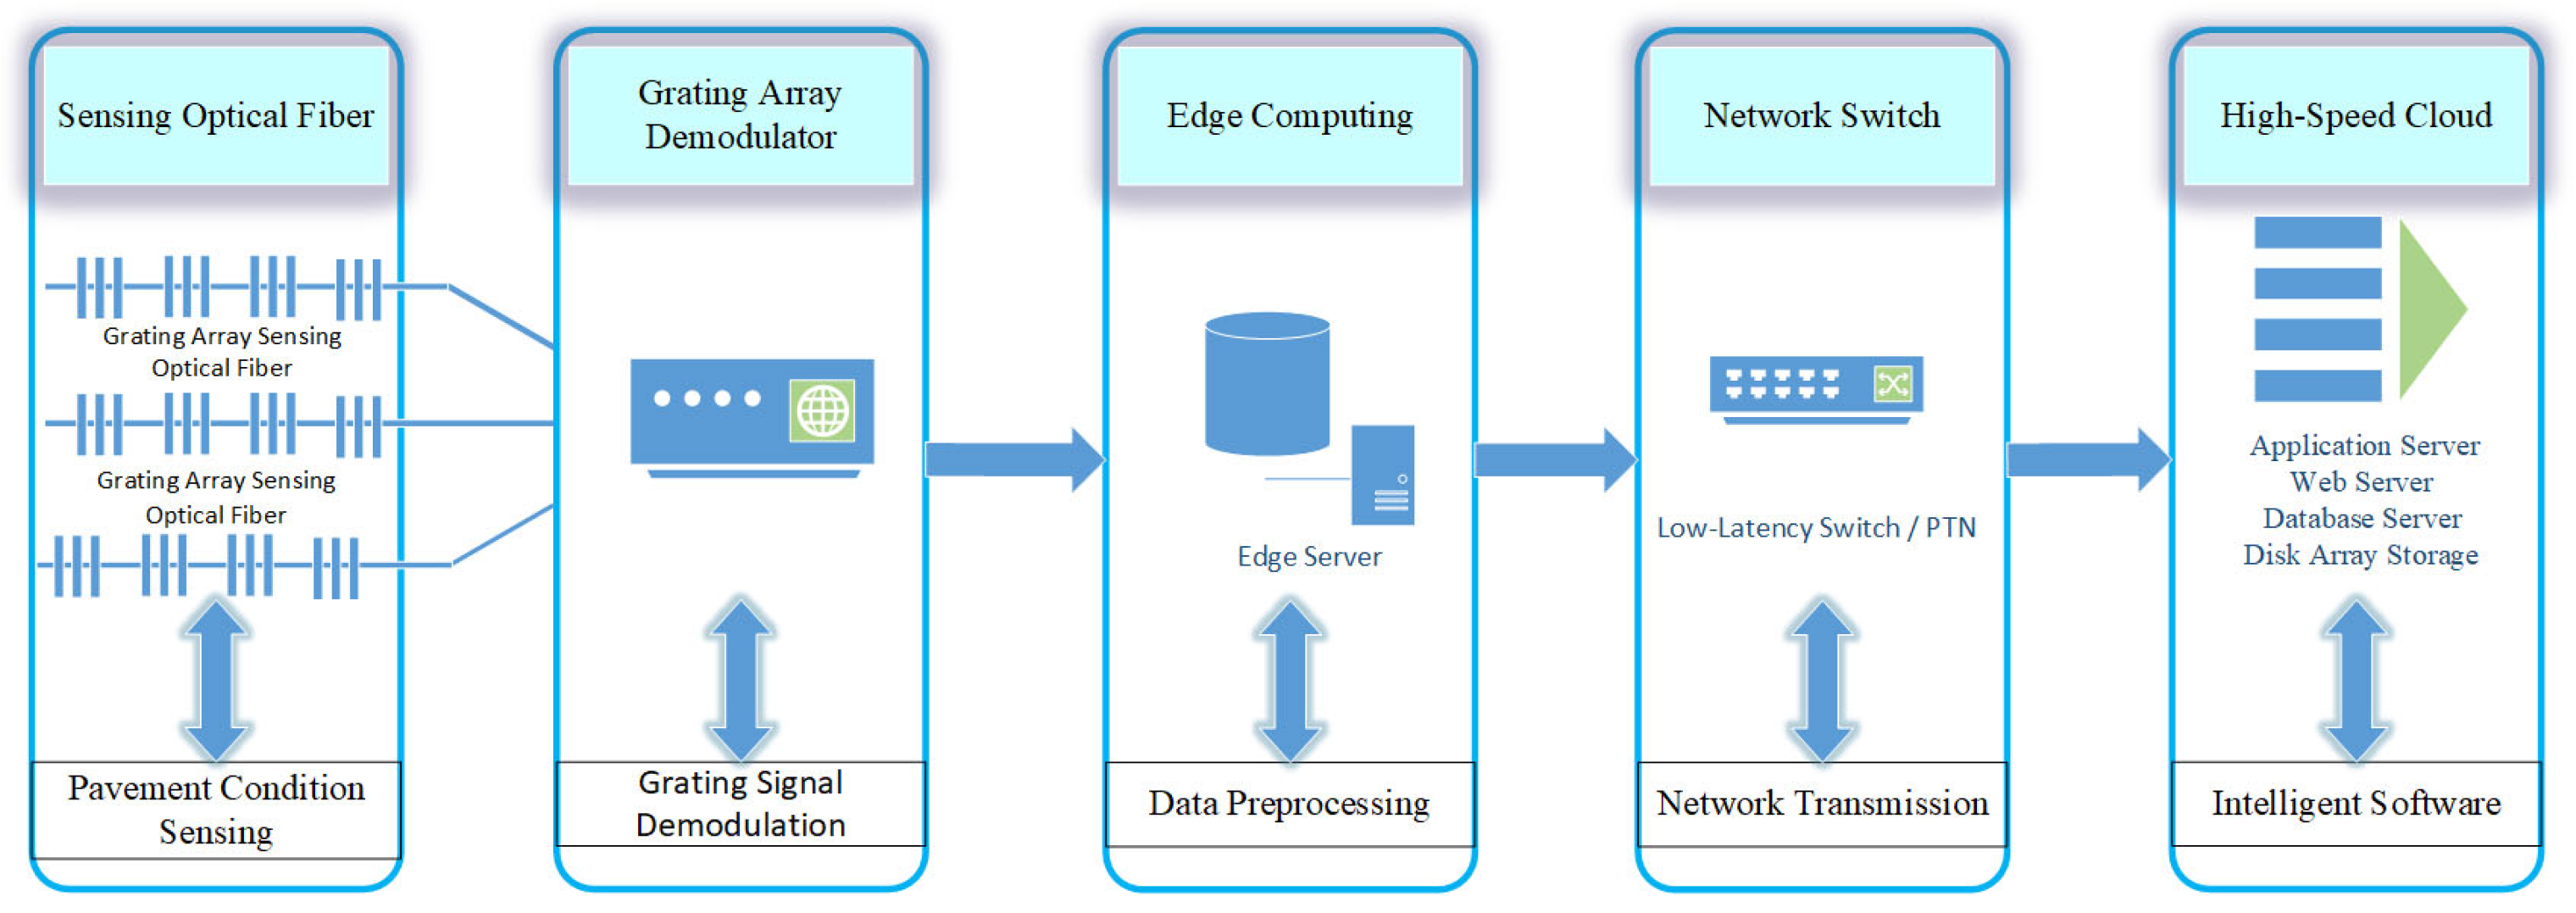
Figure 6.
Experimental Vehicle Dimensions.
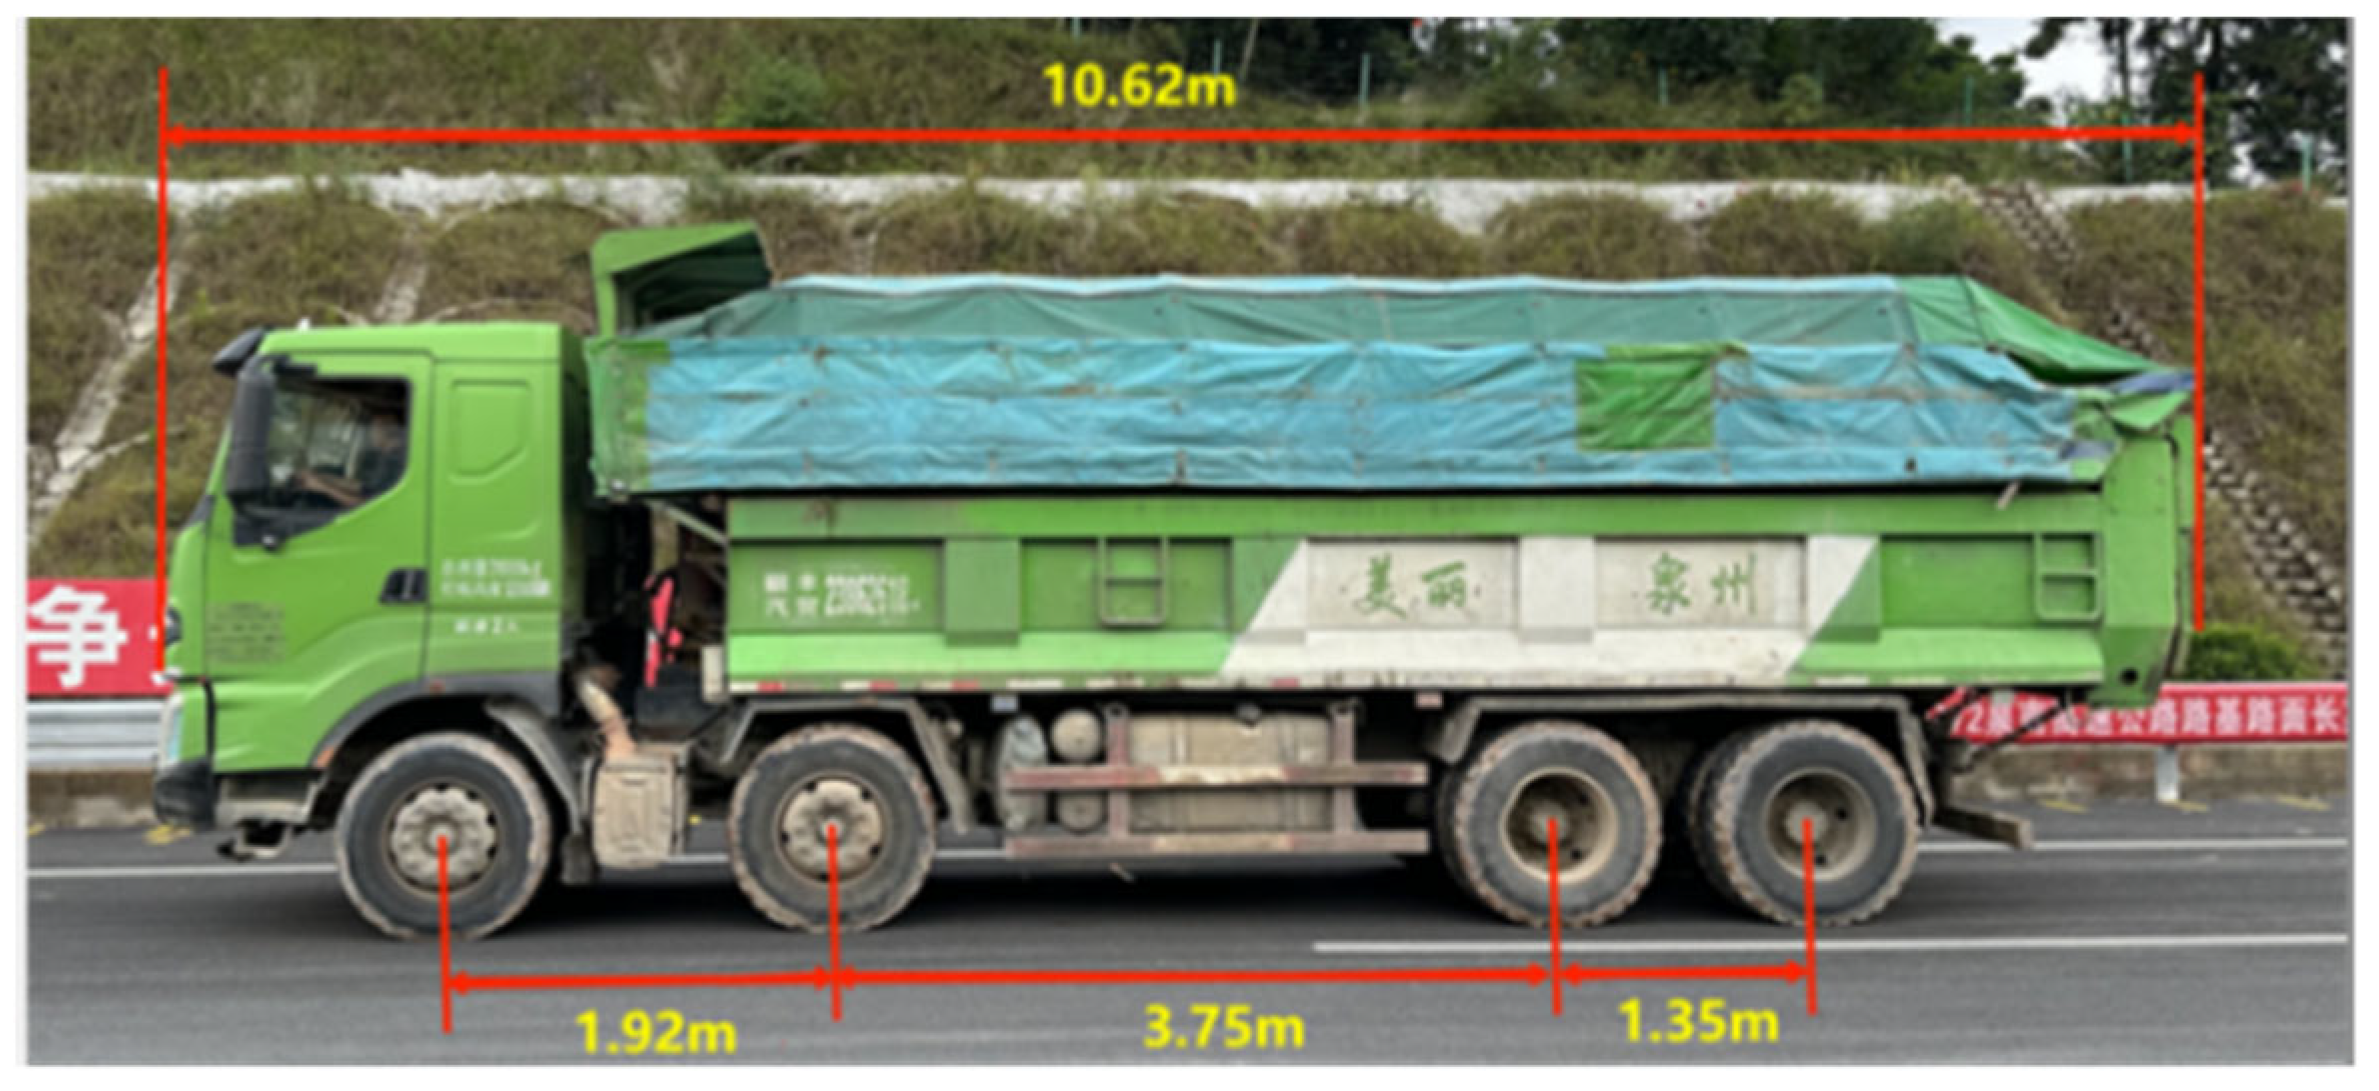
Figure 7.
Time-History Curves for Four-Layer Pavement System (a)ATB-25; (b) Granular Base Course; (c) Cement-Treated Base; (d) Subgrade.
Figure 7.
Time-History Curves for Four-Layer Pavement System (a)ATB-25; (b) Granular Base Course; (c) Cement-Treated Base; (d) Subgrade.
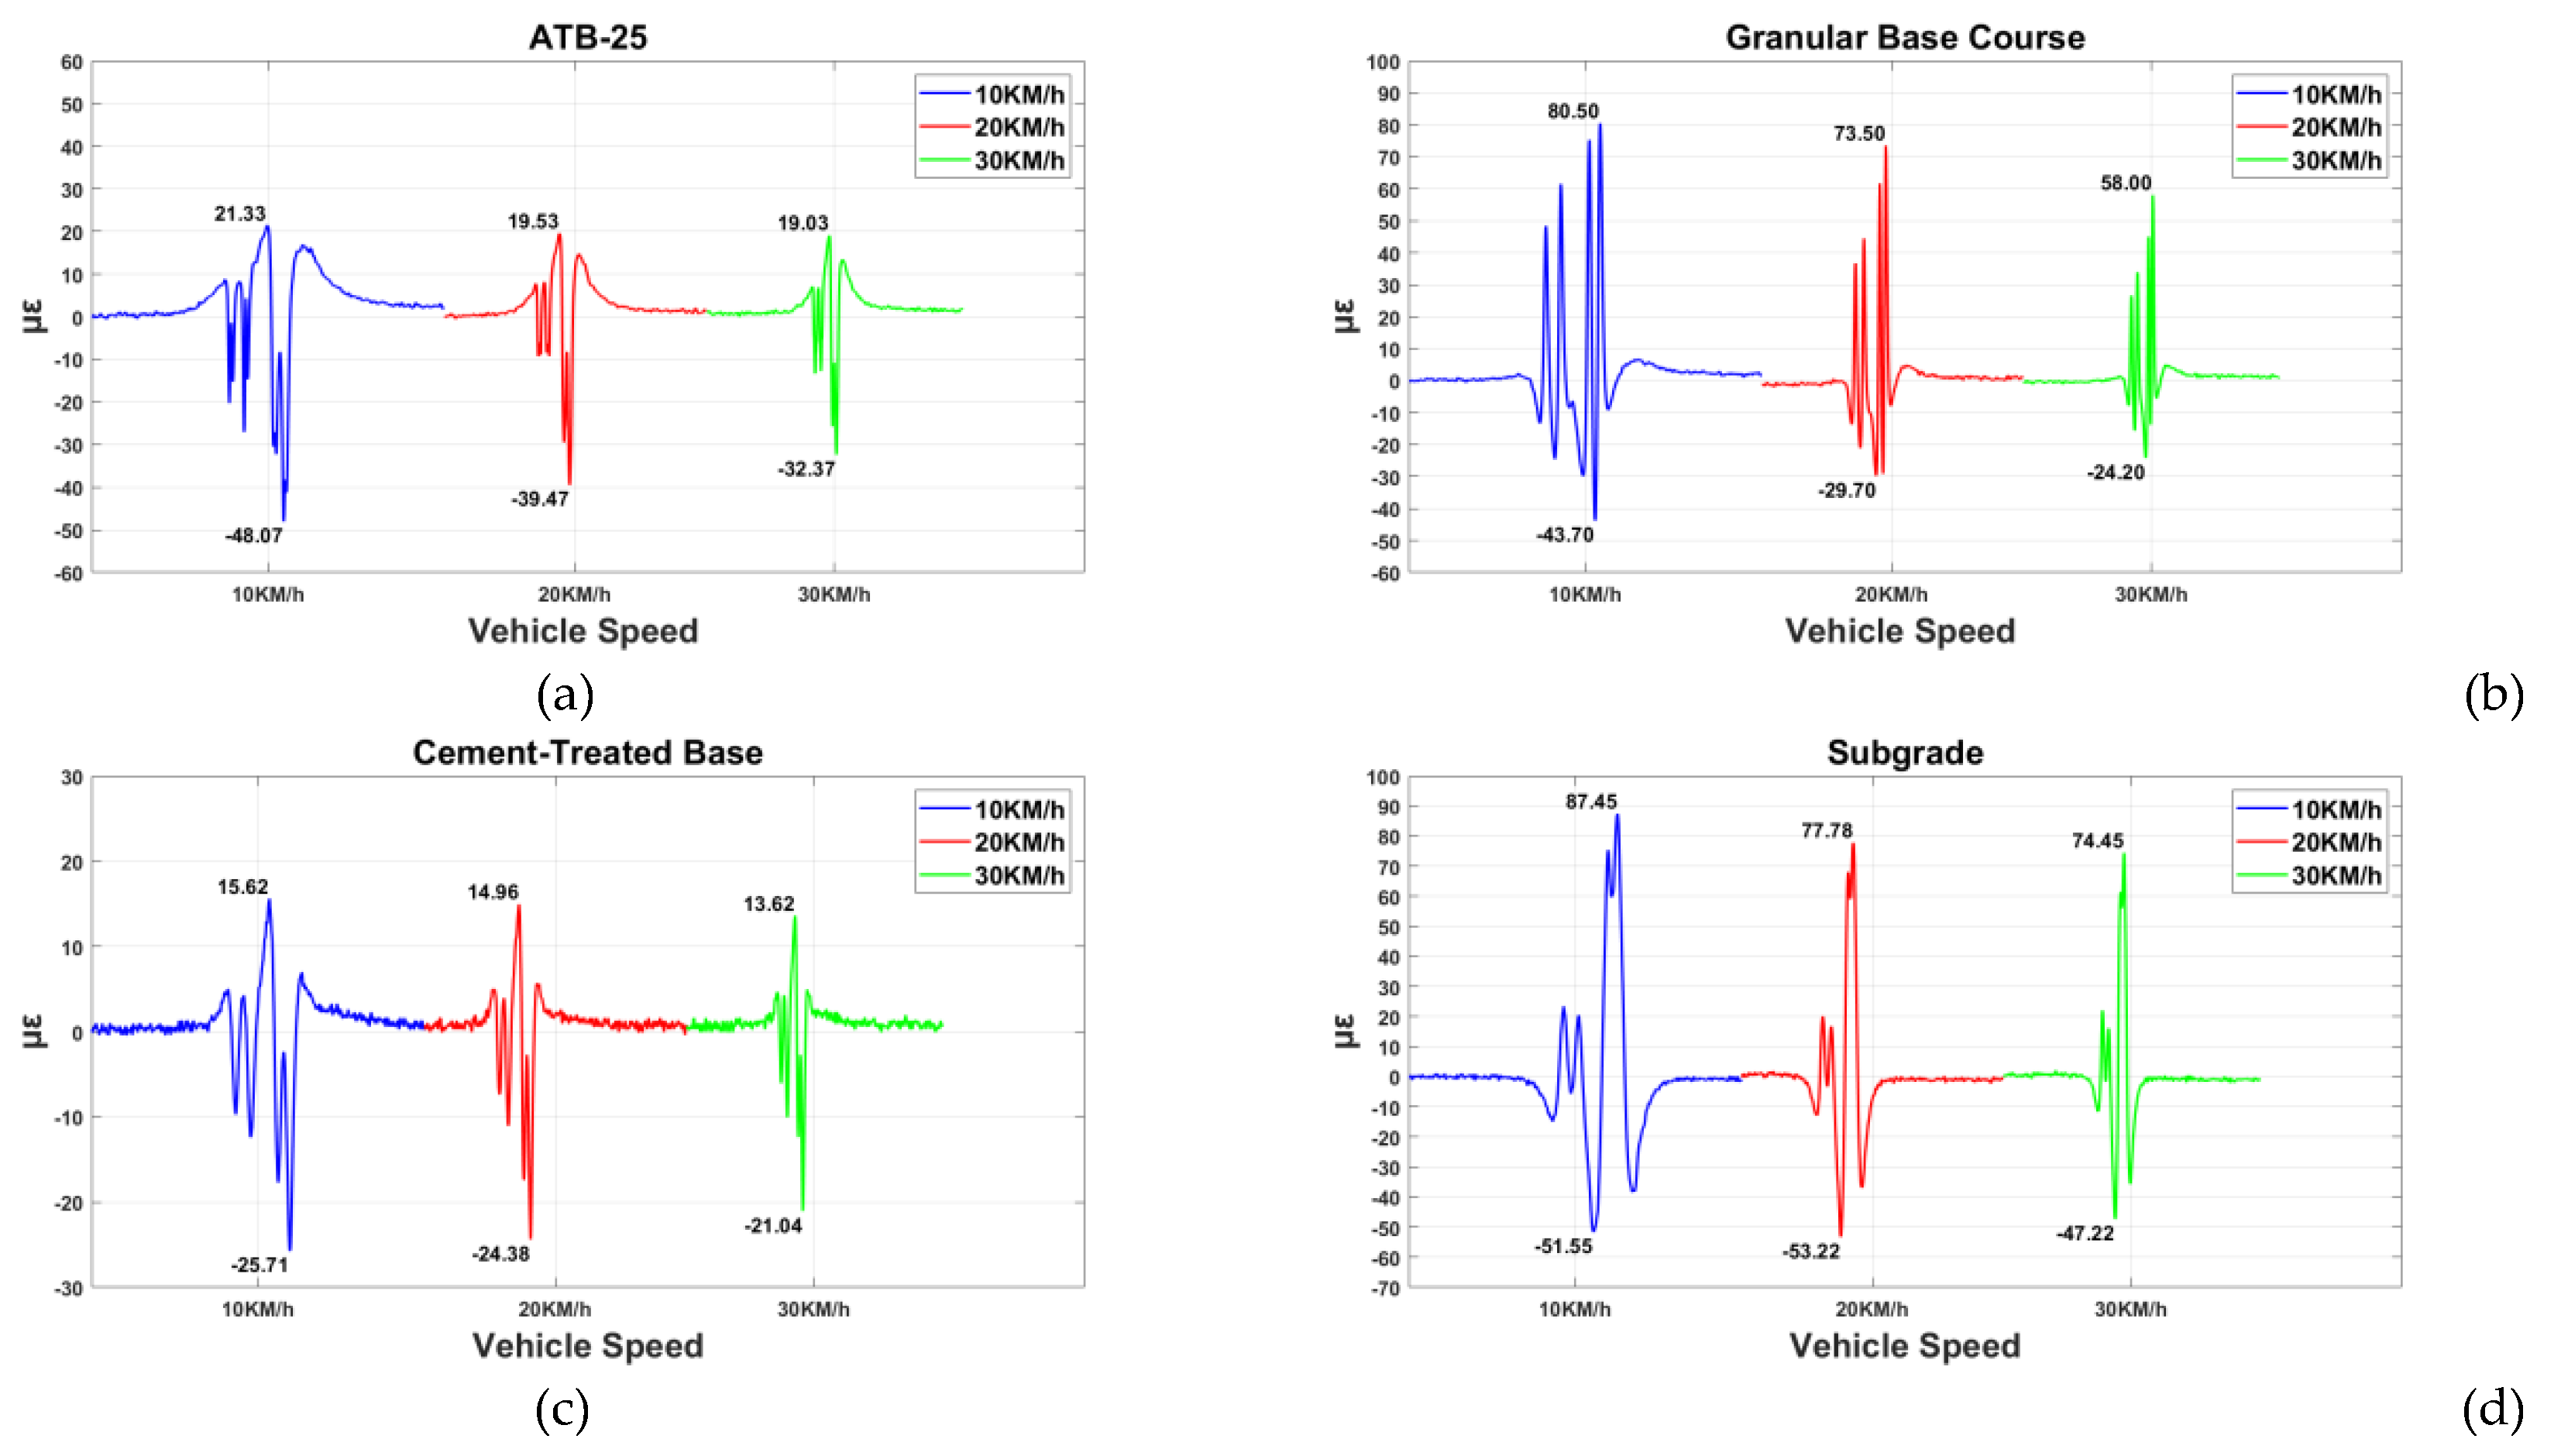
Figure 8.
Dynamic Strain Envelope Contours of Four-Lane Roadbed Layers under Variable Speeds (a)ATB-25; (b) Granular Base Course; (c) Cement-Treated Base; (d) Subgrade.
Figure 8.
Dynamic Strain Envelope Contours of Four-Lane Roadbed Layers under Variable Speeds (a)ATB-25; (b) Granular Base Course; (c) Cement-Treated Base; (d) Subgrade.
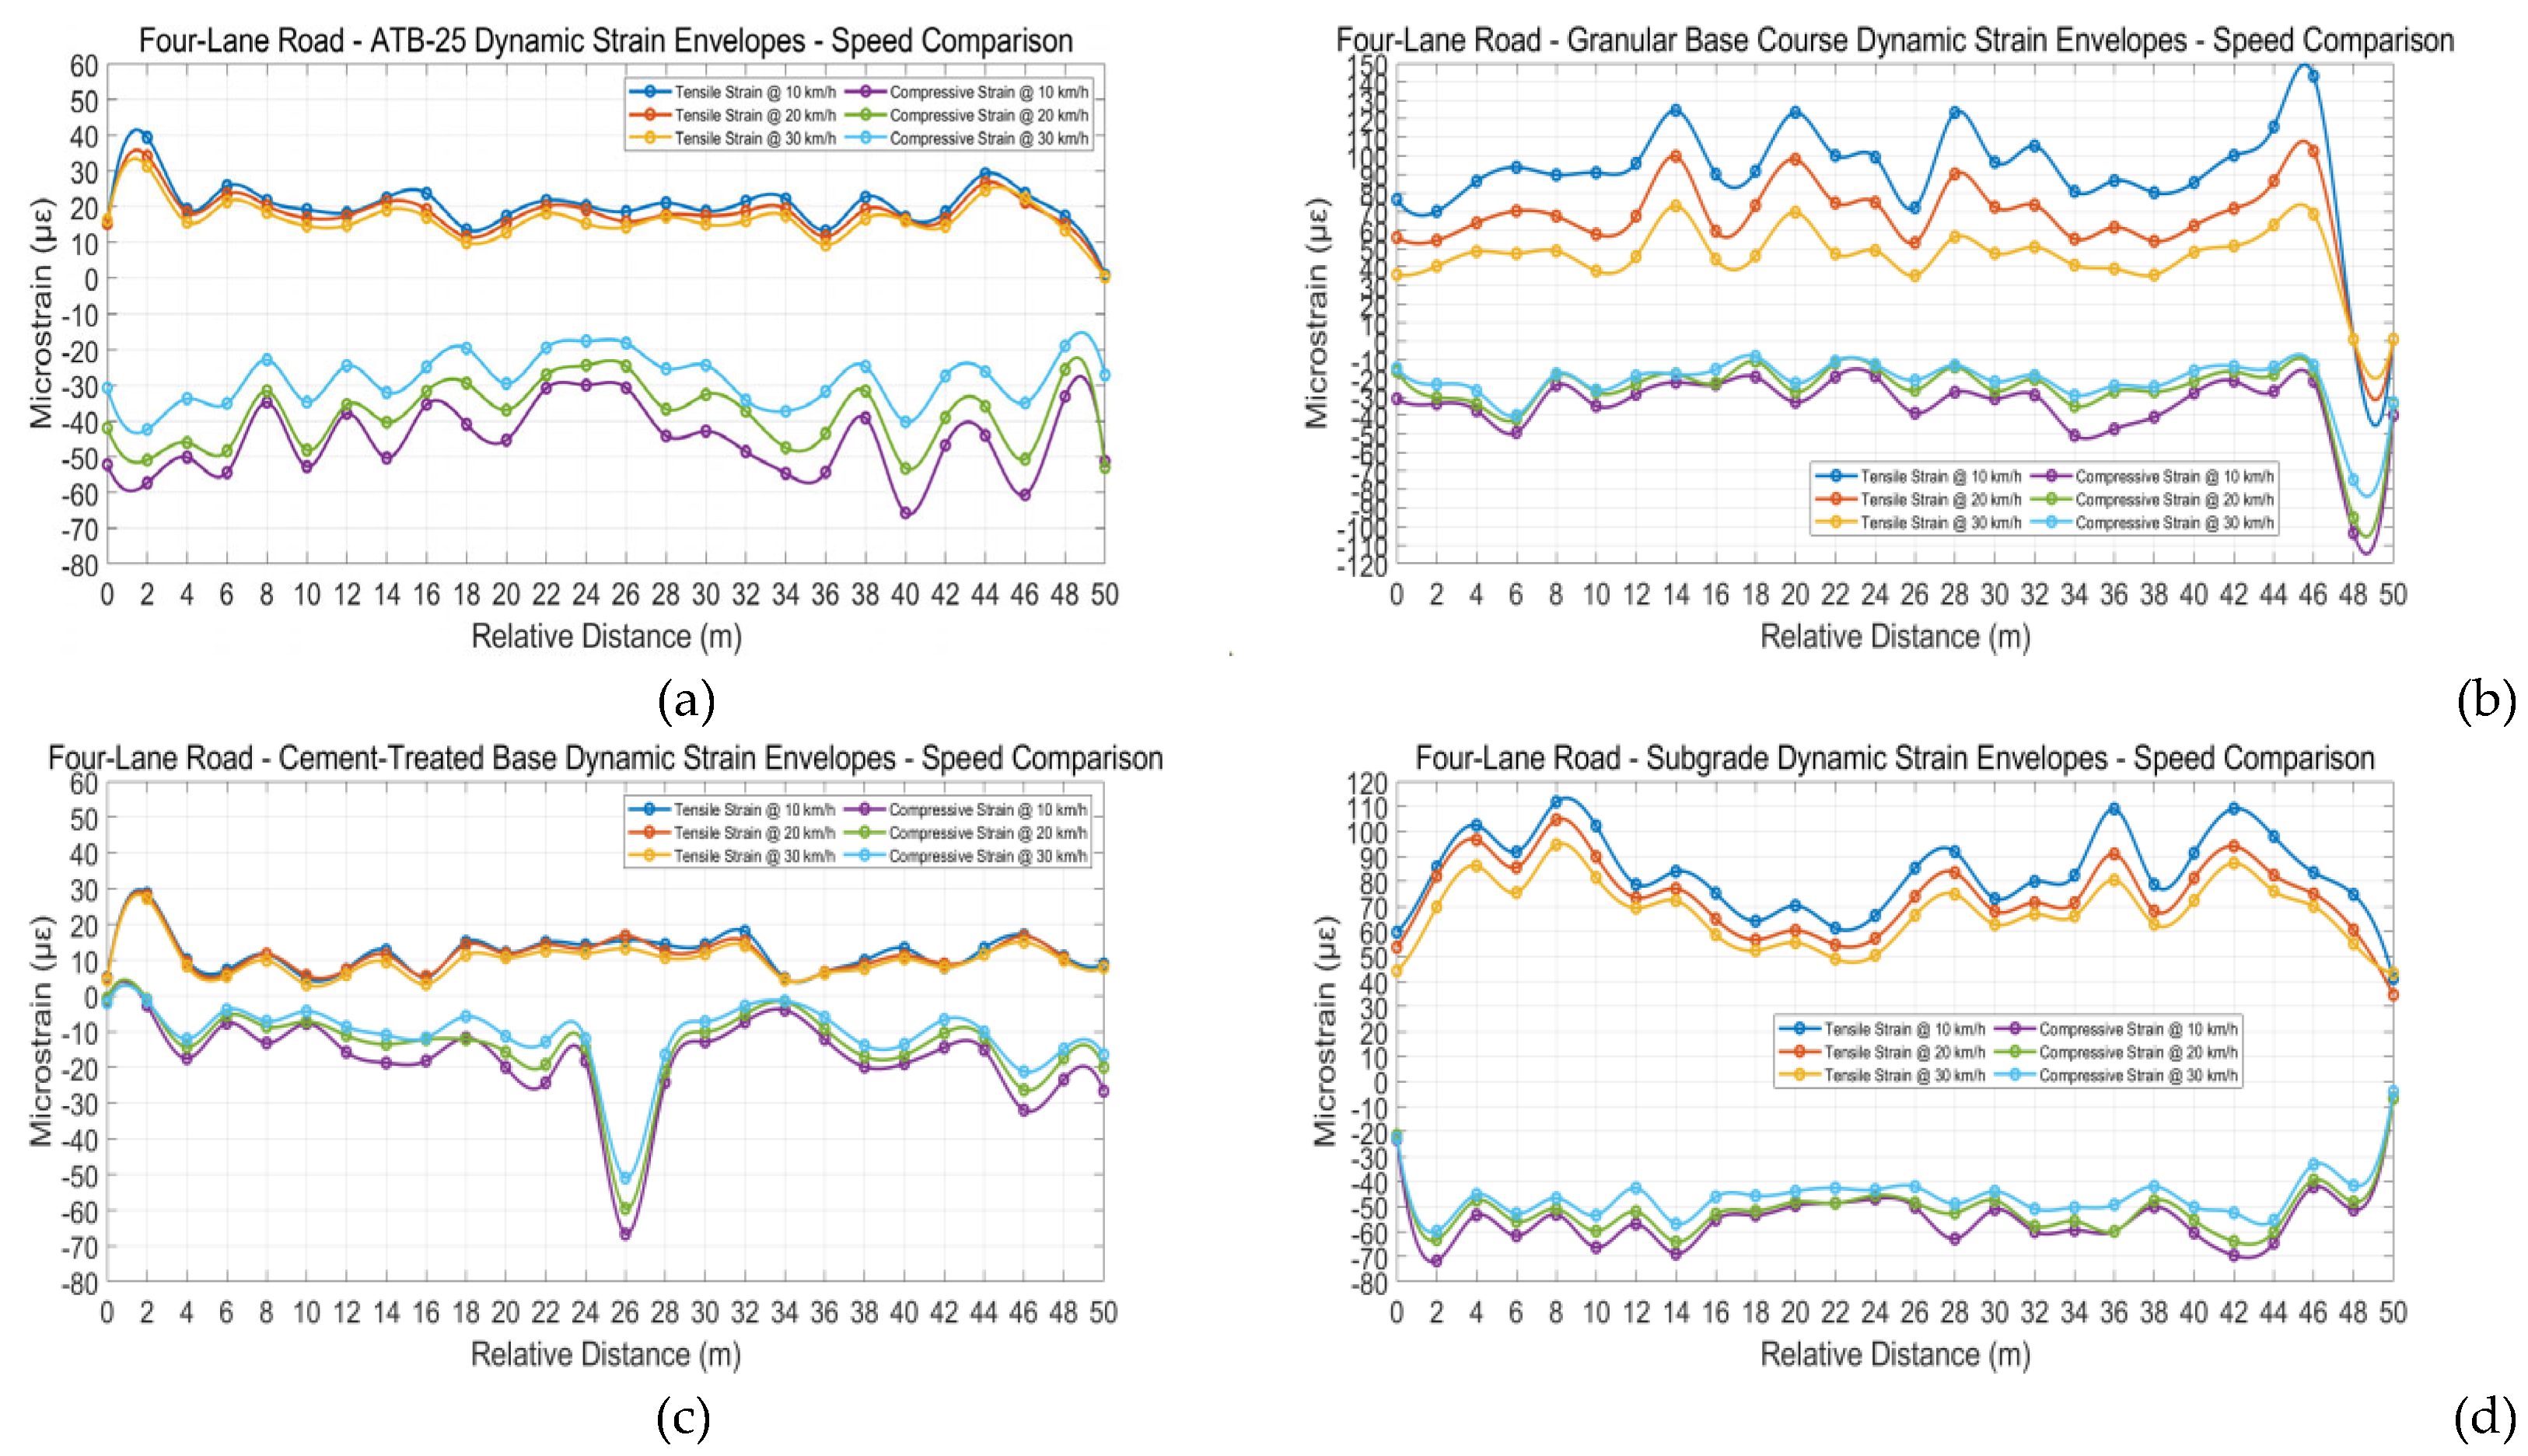
Figure 9.
Comparative Analysis of Long-Term Monitoring Data: Fiber Optic Thermometry vs. Electrical Resistance Sensing (a)ATB-25; (b) Granular Base Course; (c) Cement-Treated Base; (d) Subgrade.
Figure 9.
Comparative Analysis of Long-Term Monitoring Data: Fiber Optic Thermometry vs. Electrical Resistance Sensing (a)ATB-25; (b) Granular Base Course; (c) Cement-Treated Base; (d) Subgrade.
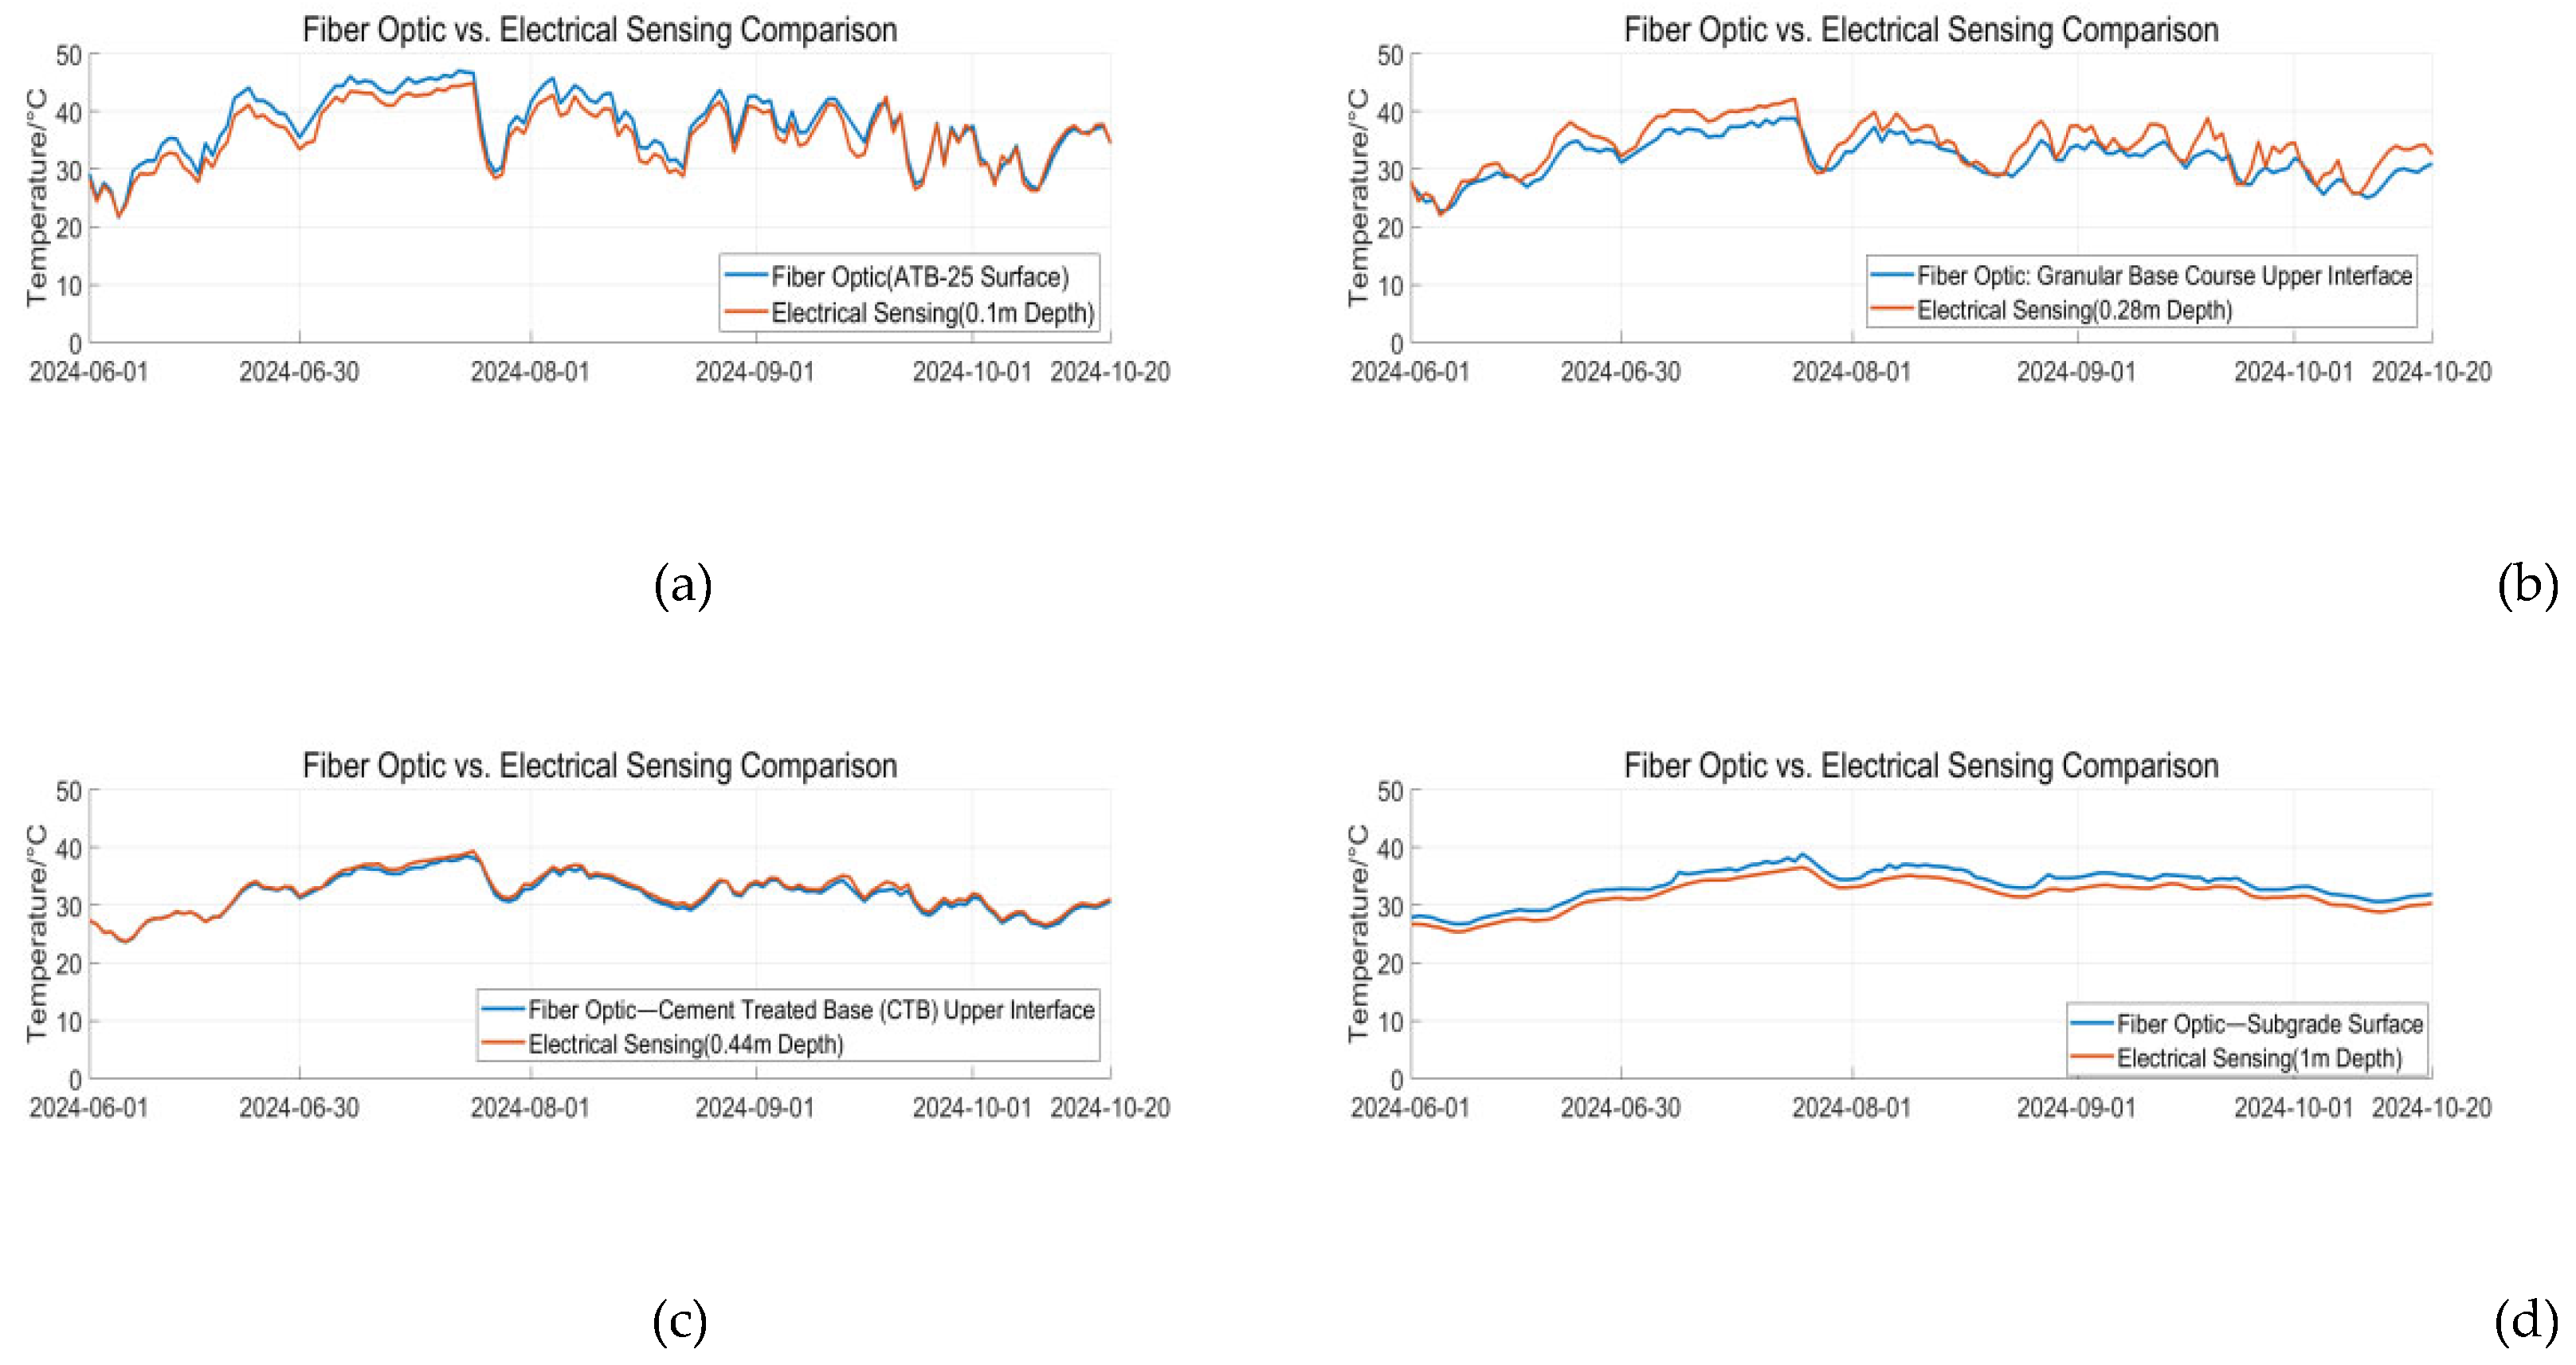
Figure 10.
Temperature Time-History Curves at Different Chainages(a)Multi-layer Temperature Comparison at Chainage 10m; (b)Multi-layer Temperature Comparison at Chainage 30m; (c)Multi-layer Temperature Comparison at Chainage 10m; (d)Multi-layer Temperature Comparison at Chainage 30m.
Figure 10.
Temperature Time-History Curves at Different Chainages(a)Multi-layer Temperature Comparison at Chainage 10m; (b)Multi-layer Temperature Comparison at Chainage 30m; (c)Multi-layer Temperature Comparison at Chainage 10m; (d)Multi-layer Temperature Comparison at Chainage 30m.
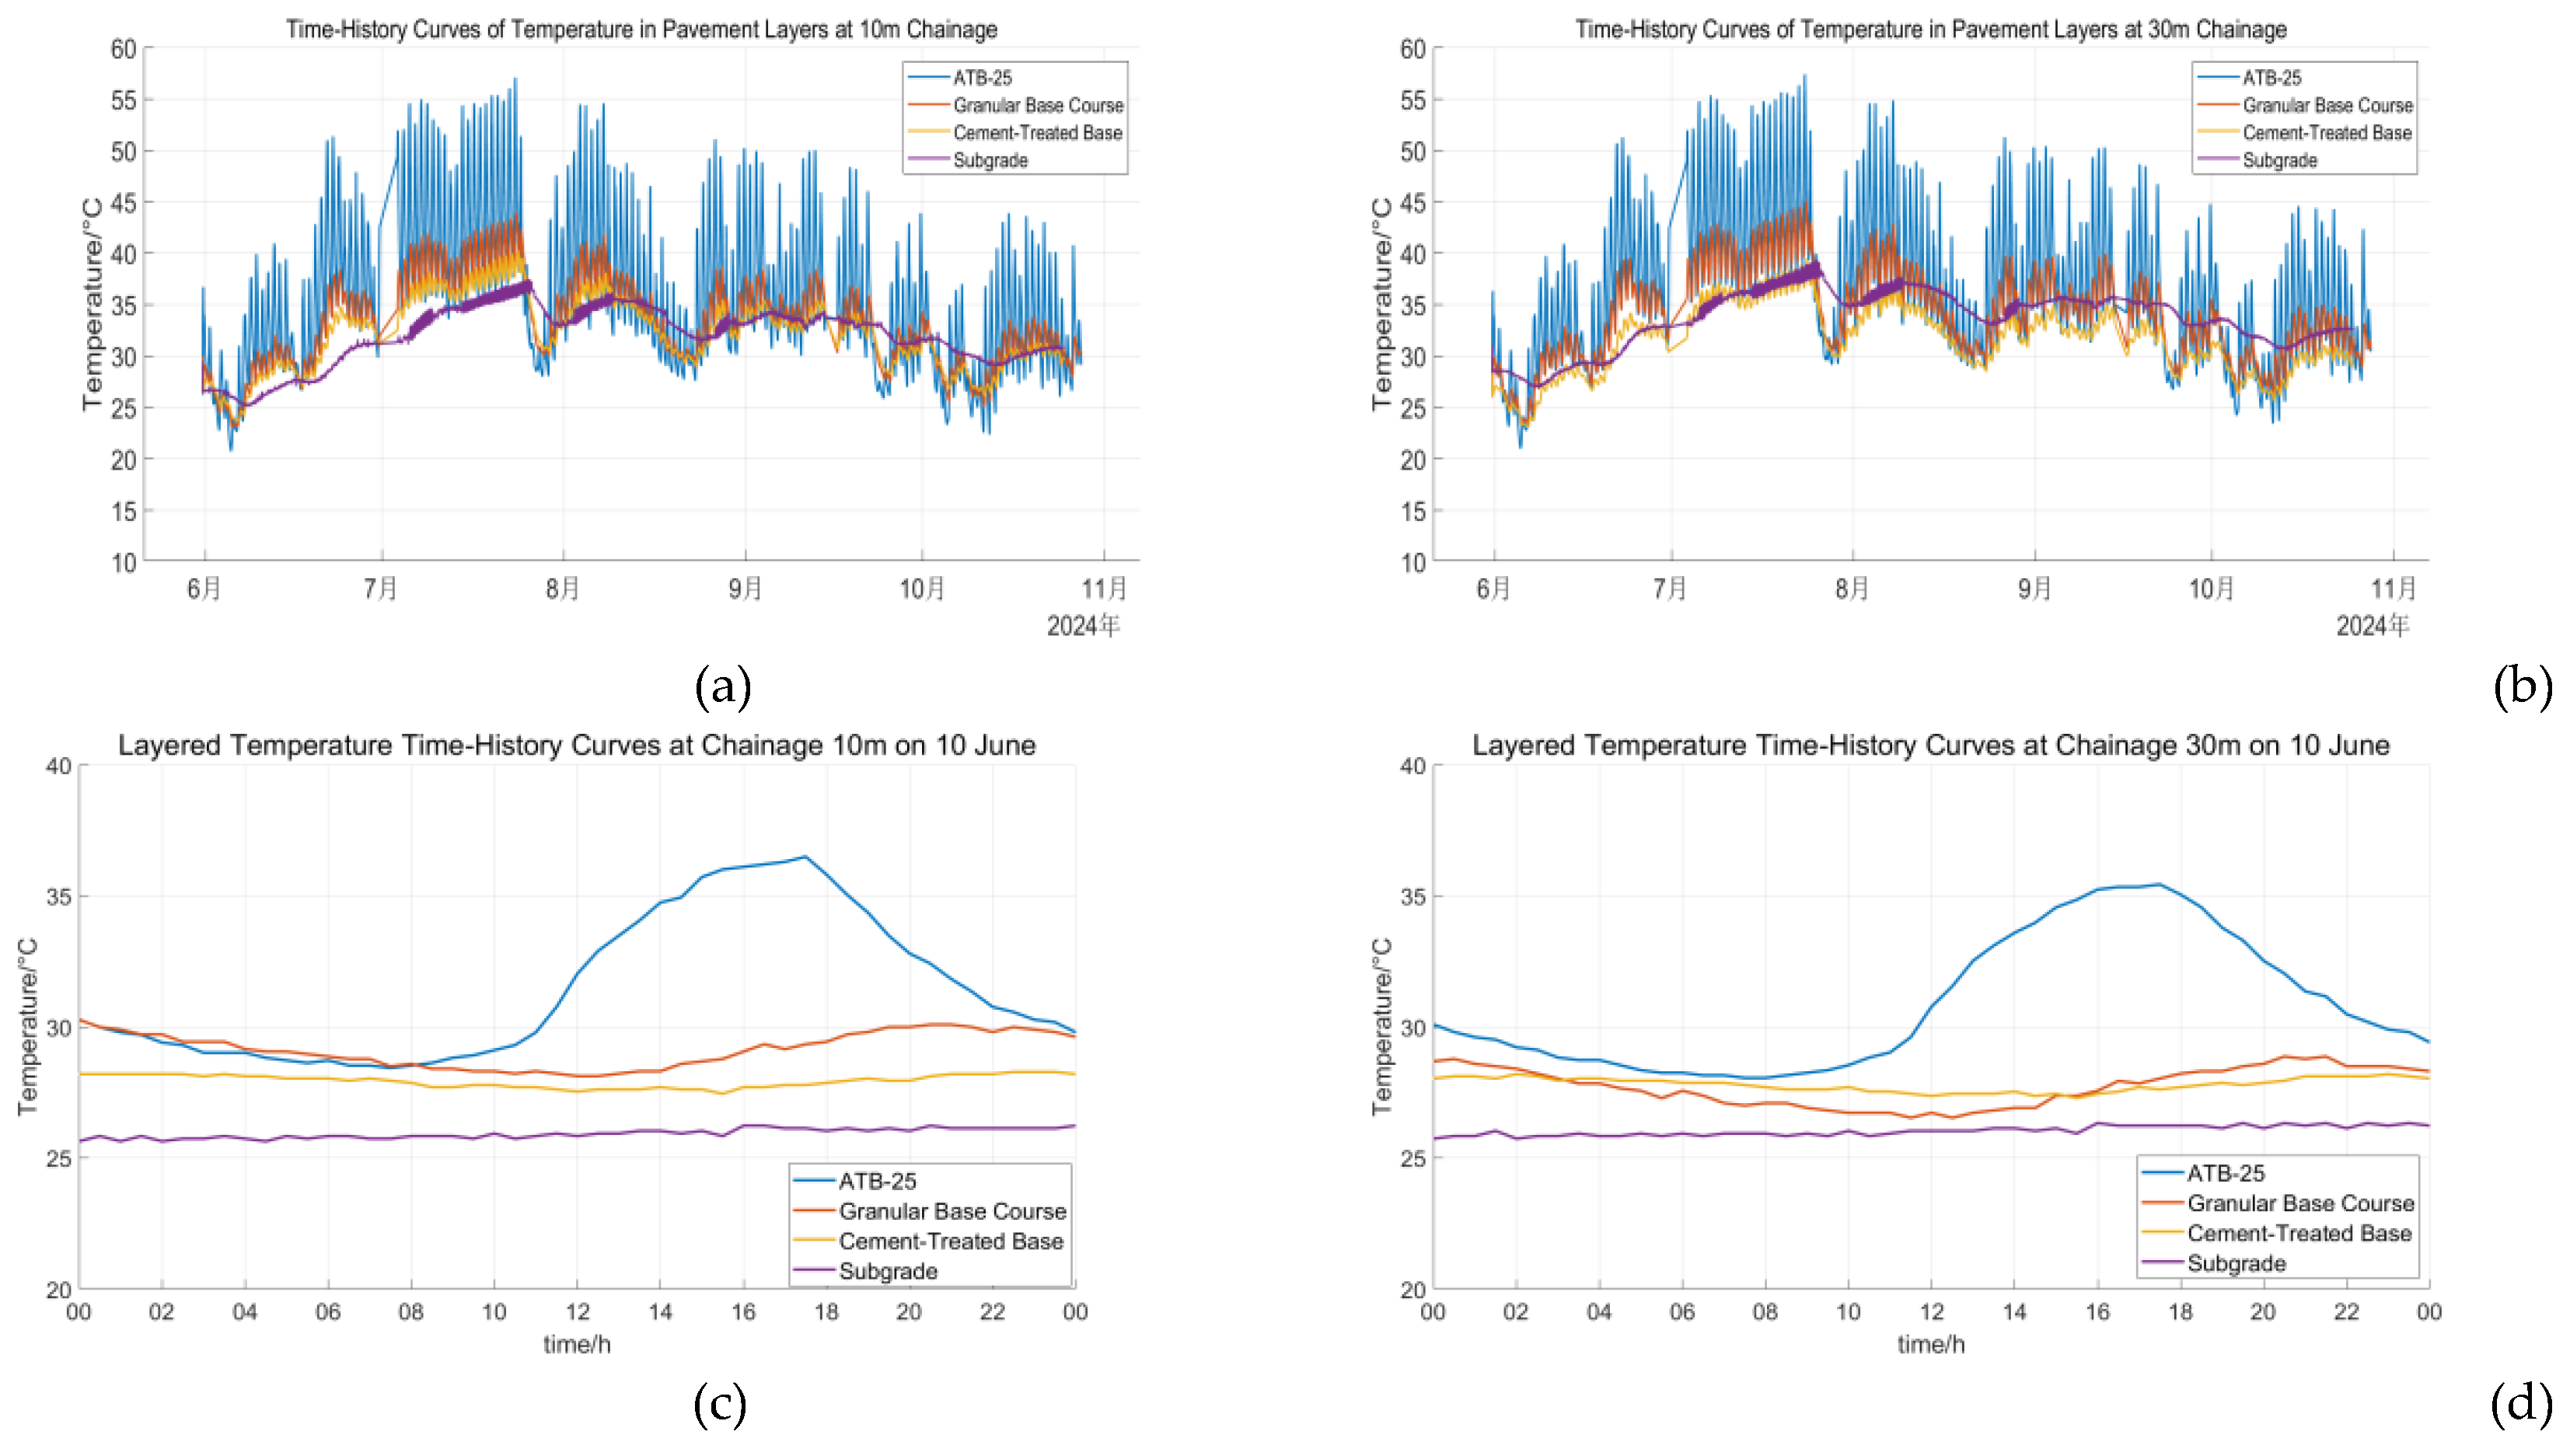
Figure 11.
Temperature distribution comparison diagram.
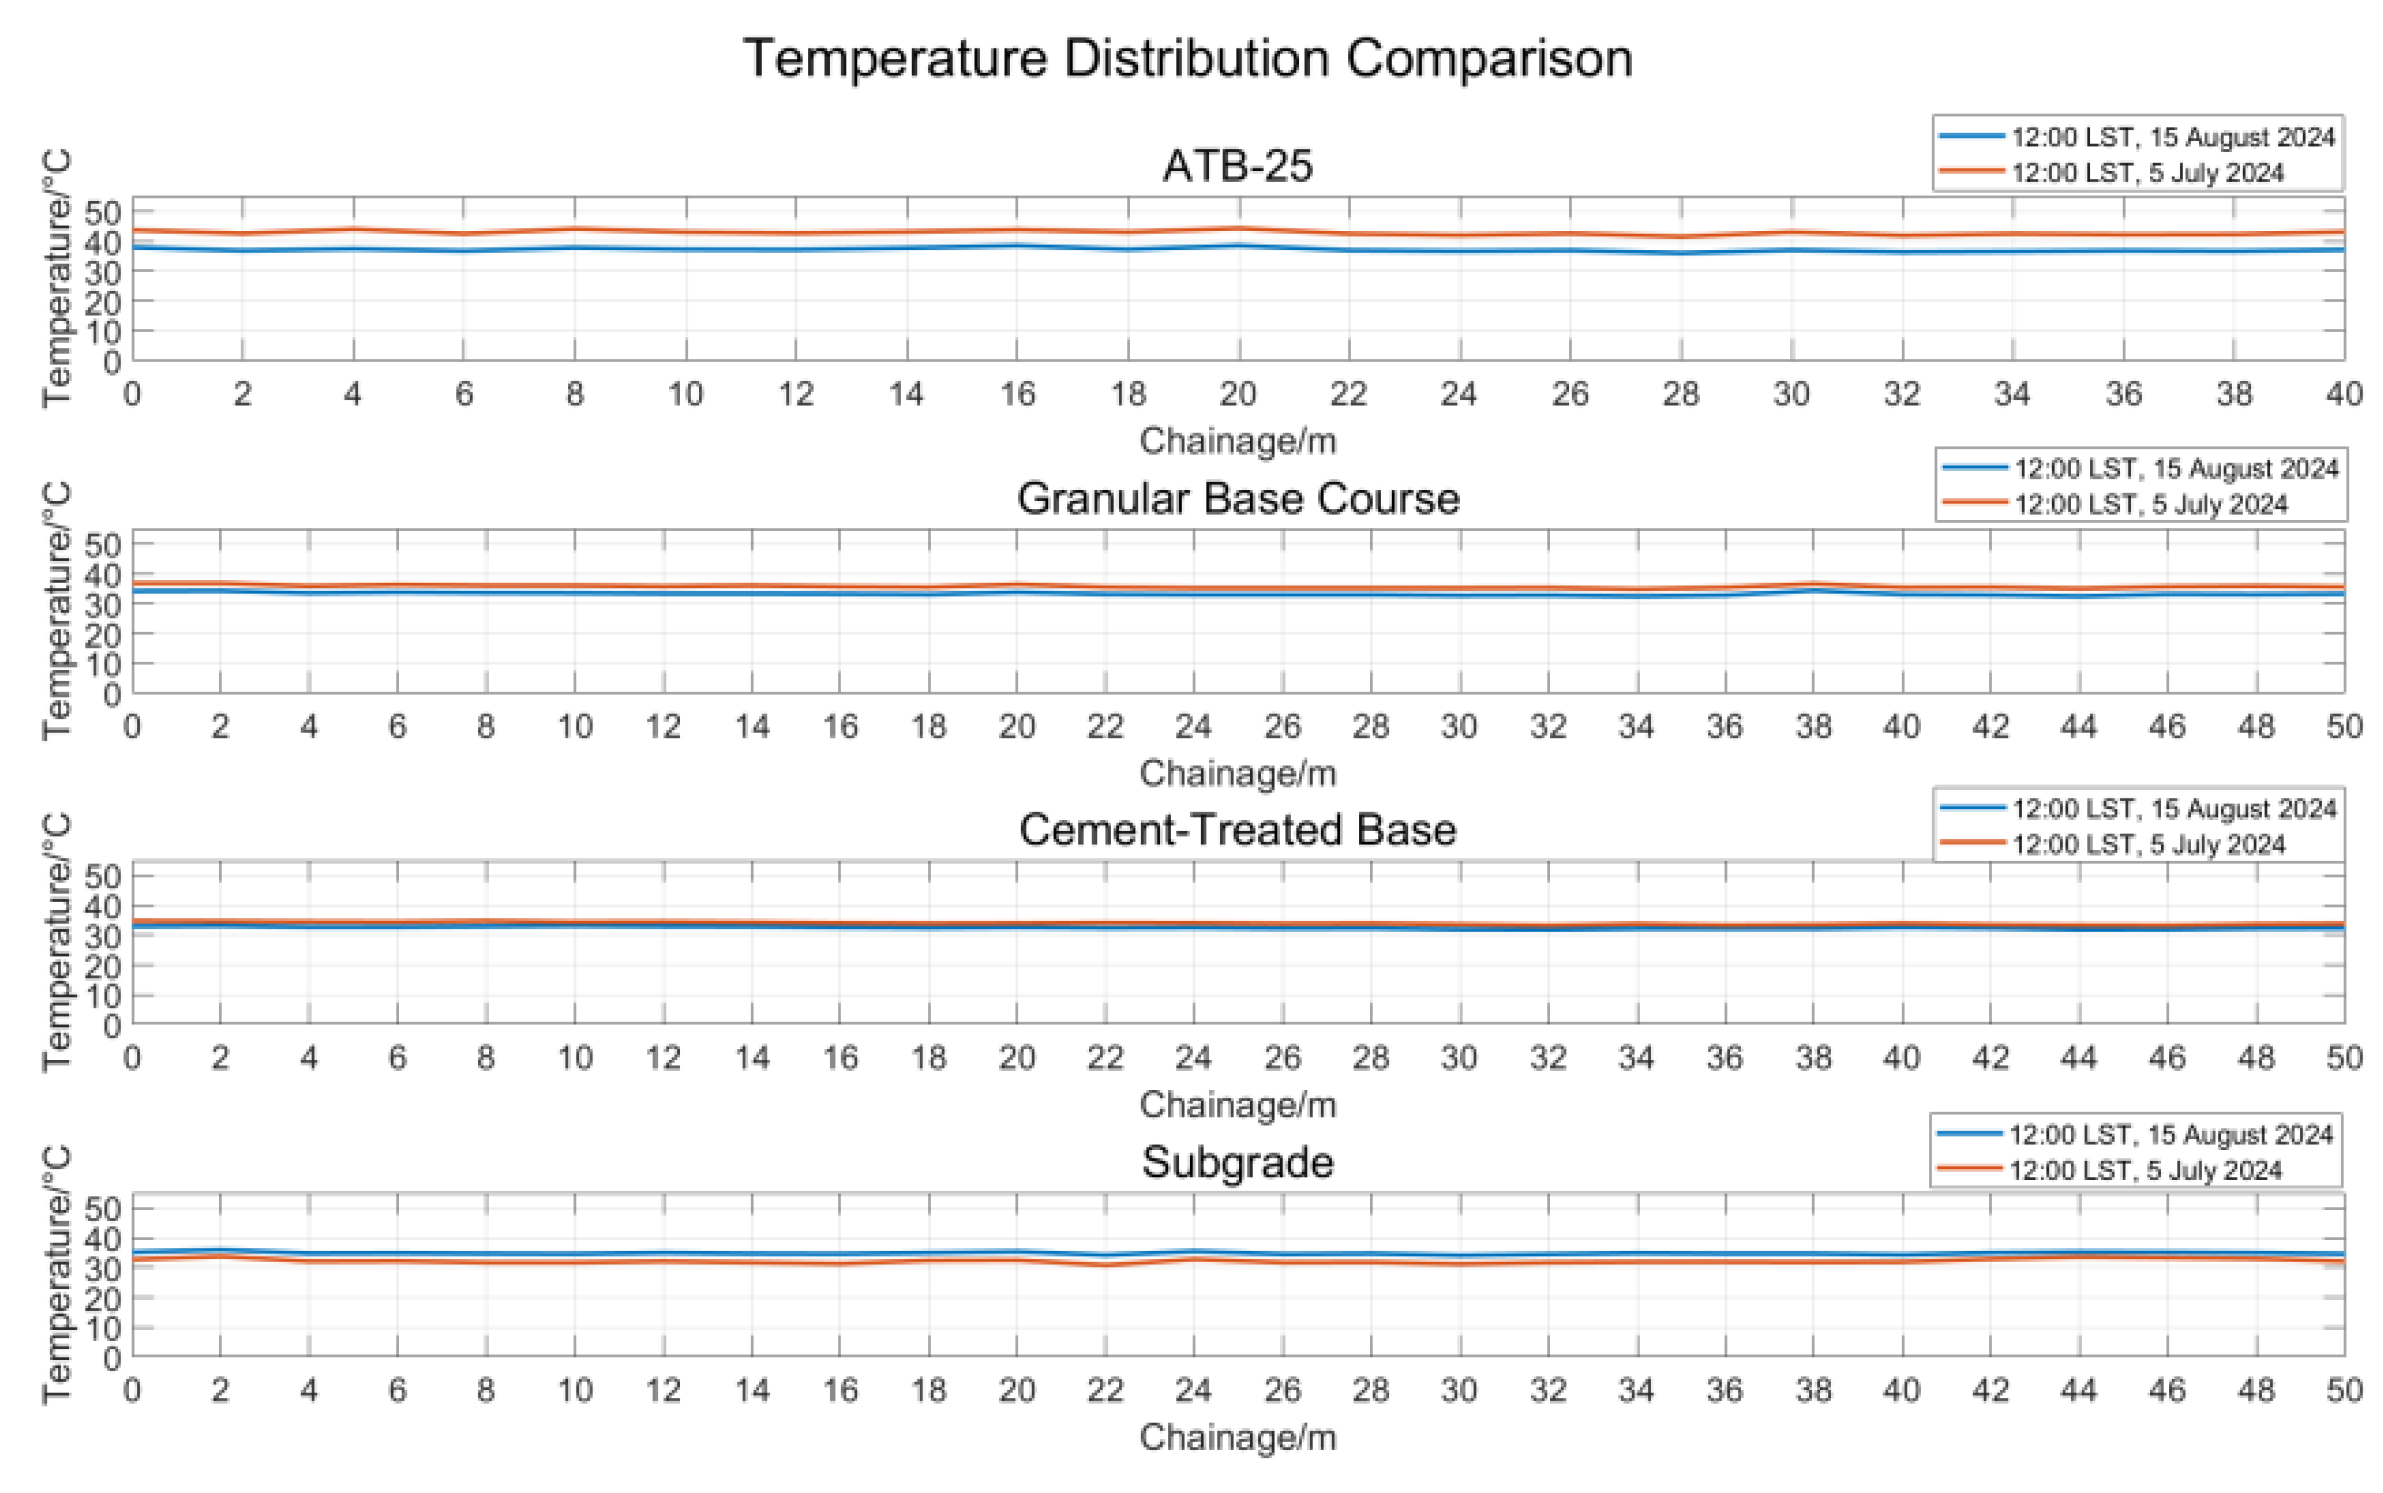
Figure 12.
Time-Resolved Dynamic Strain Envelopes in Multilayered Pavement (Four-Lane Road) (a)ATB-25; (b) Granular Base Course; (c) Cement-Treated Base; (d) Subgrade.
Figure 12.
Time-Resolved Dynamic Strain Envelopes in Multilayered Pavement (Four-Lane Road) (a)ATB-25; (b) Granular Base Course; (c) Cement-Treated Base; (d) Subgrade.
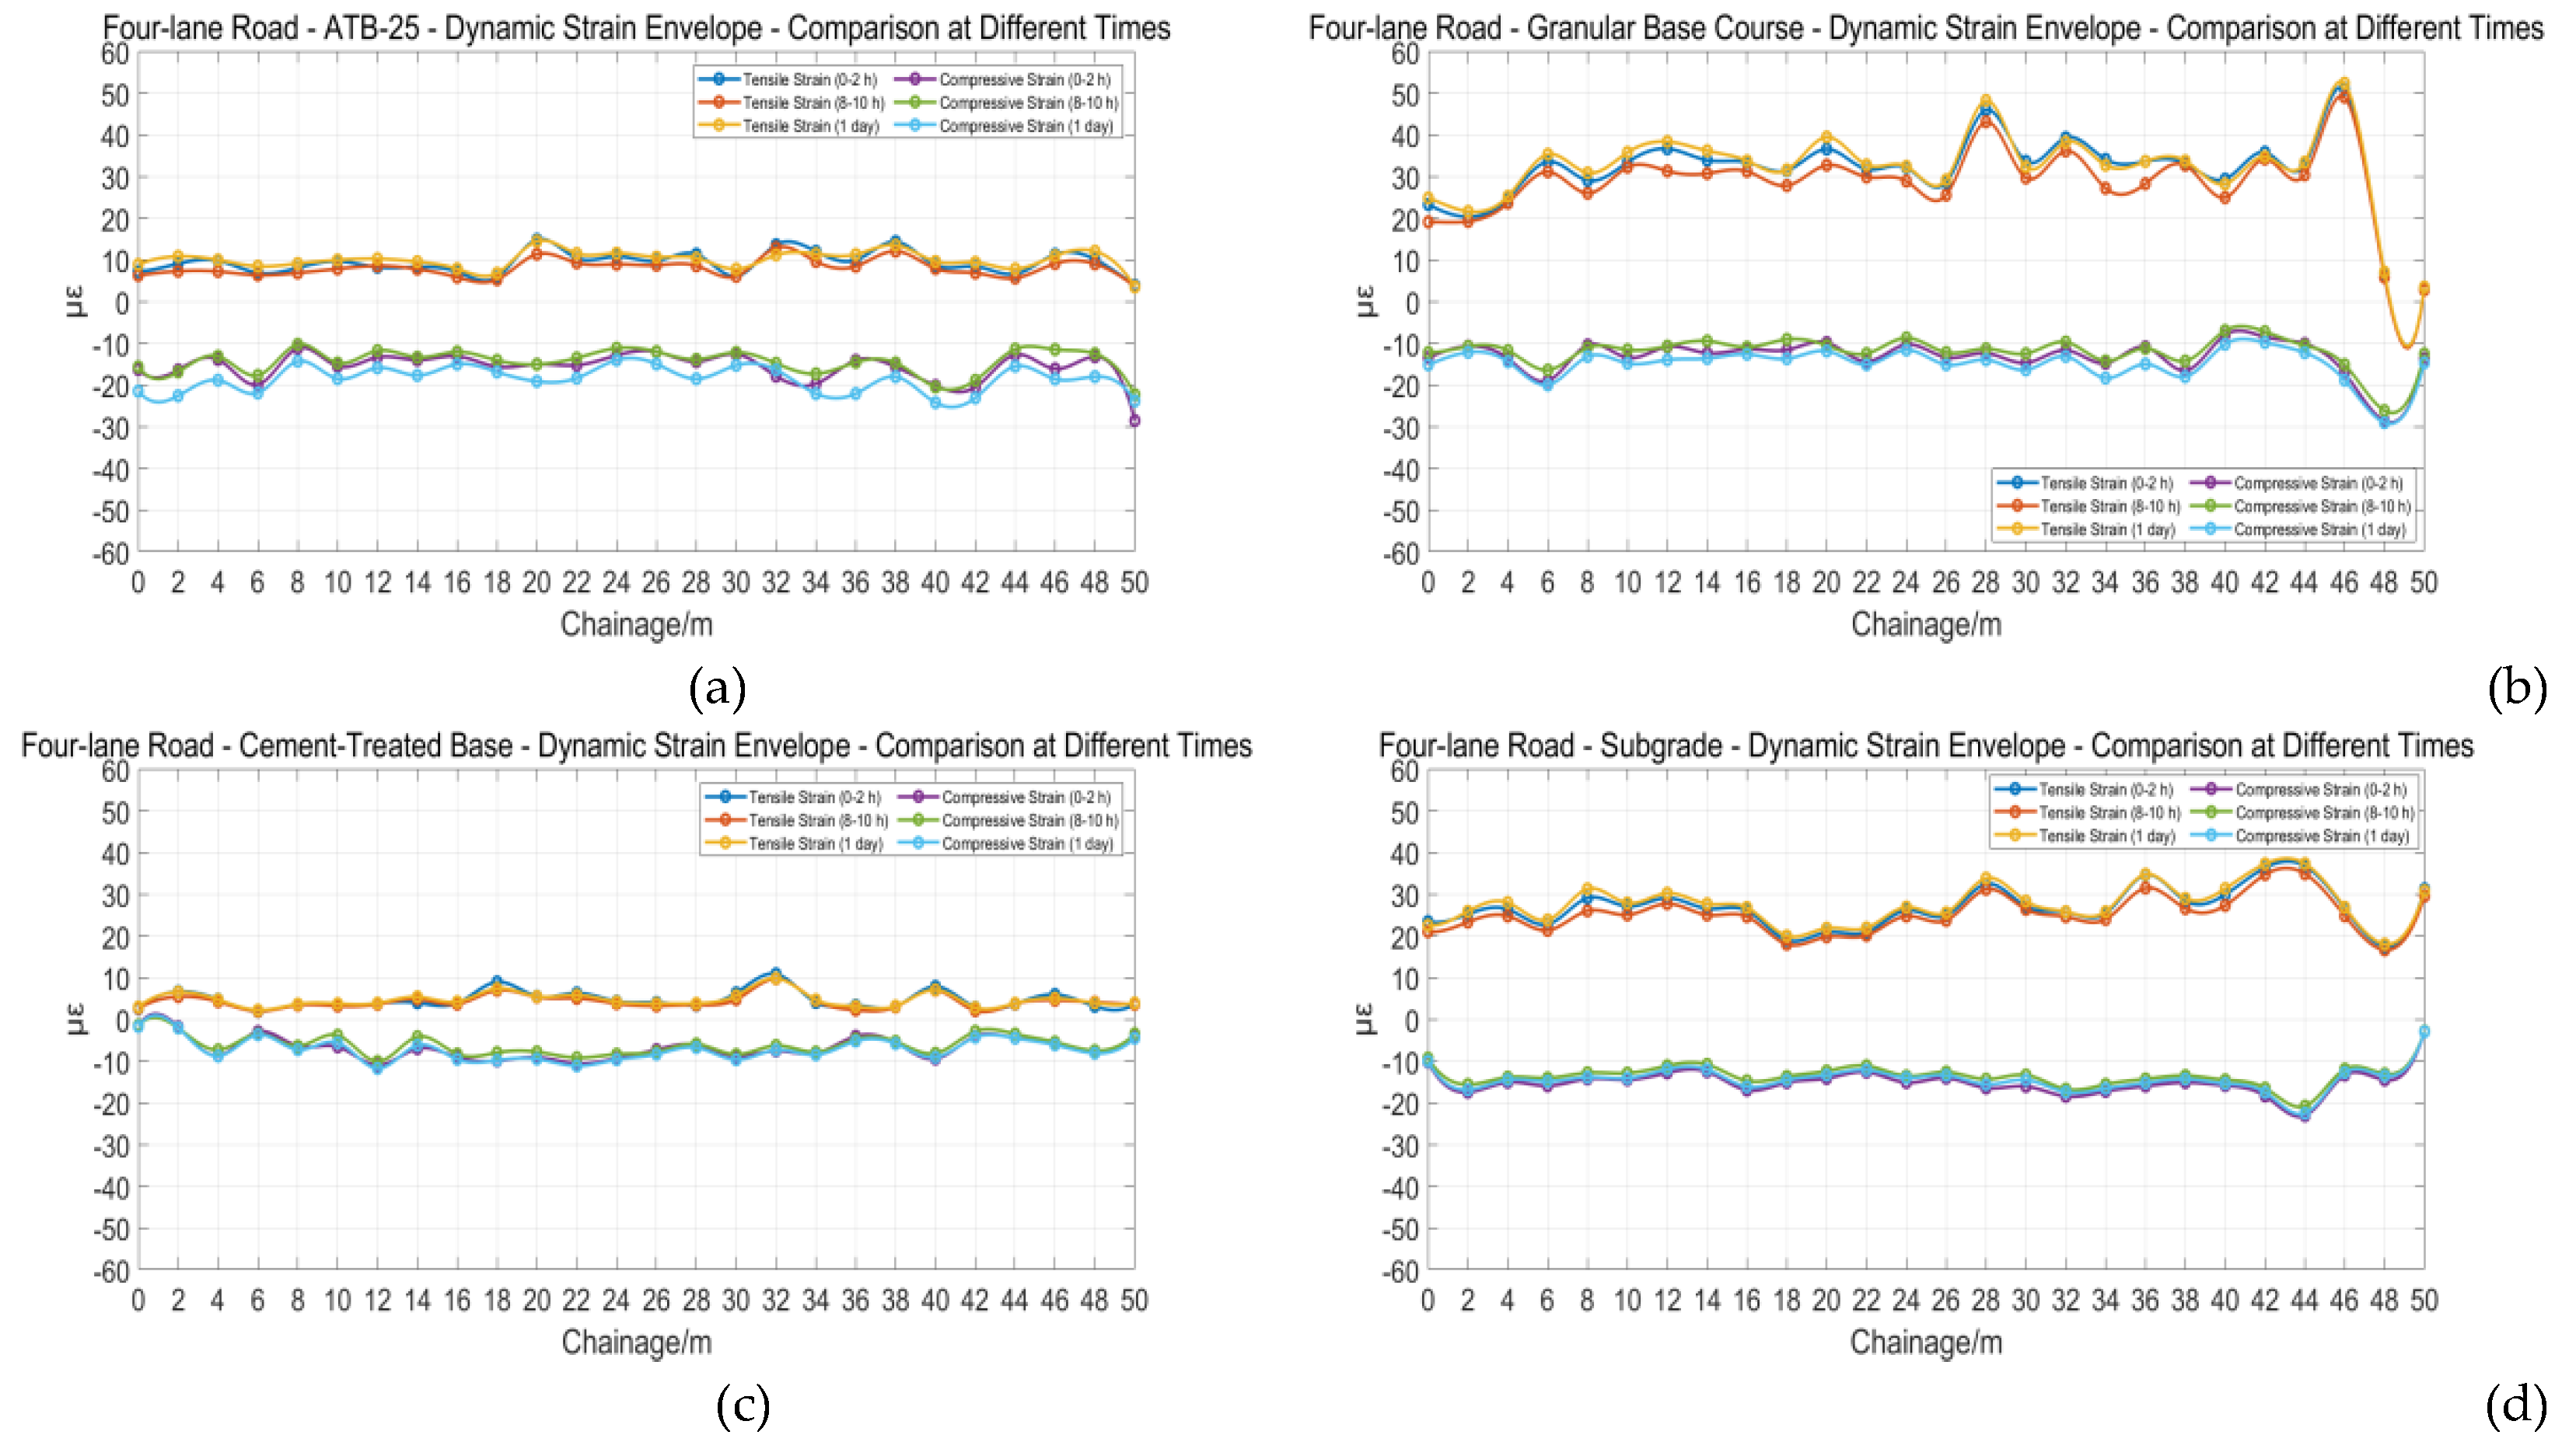
Figure 13.
Bitemporal Strain Response Variability Across Pavement Strata (Four-Lane Road) (a)ATB-25; (b) Granular Base Course; (c) Cement-Treated Base; (d) Subgrade.
Figure 13.
Bitemporal Strain Response Variability Across Pavement Strata (Four-Lane Road) (a)ATB-25; (b) Granular Base Course; (c) Cement-Treated Base; (d) Subgrade.
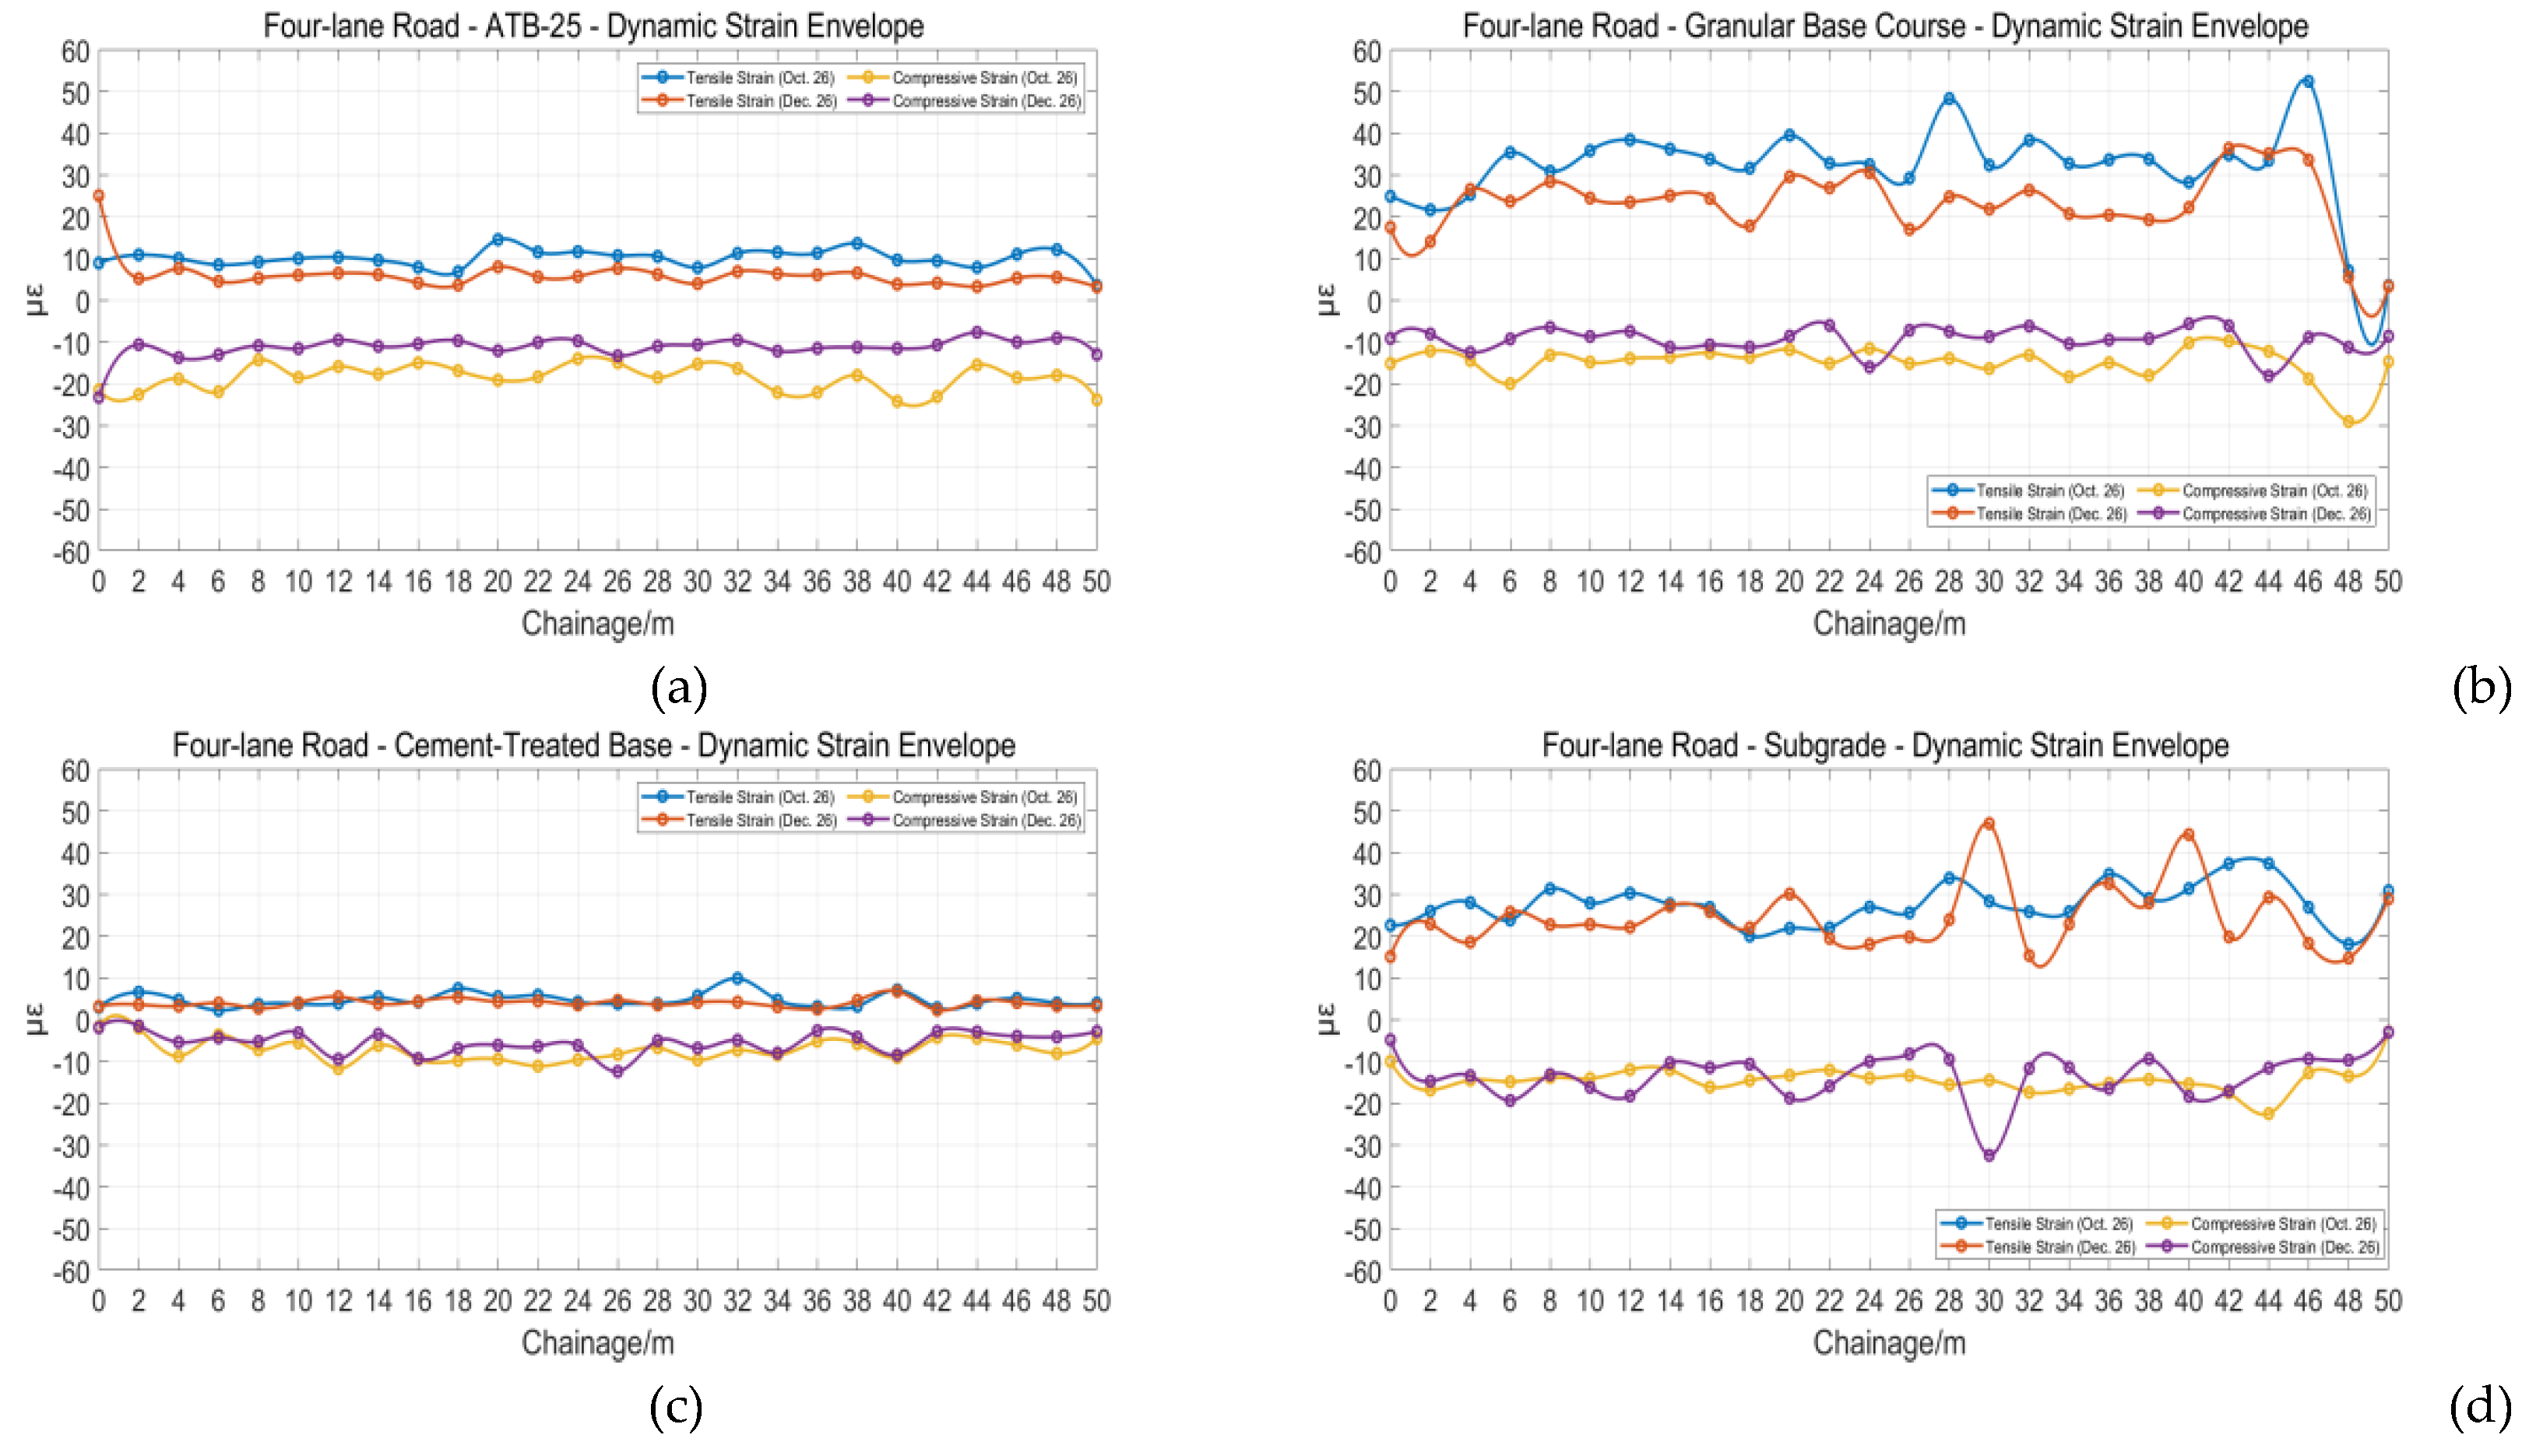

Table 1.
Subgrade Material Properties.
| Material Name | Design Modulus(MPa) | Pavement Thickness(cm) | Tensile Splitting Strength(MPa) | |
| 20℃ | 15℃ | |||
| AC-16C Modified Asphalt Concrete (Anti-skid Wearing Course) | 1300 | 1900 | 4.5 | 1.1 |
| AC-20C Medium-graded Modified Asphalt Concrete (Binder Course) | 1200 | 1800 | 5.5 | 1.0 |
| ATB-25 Dense Graded Asphalt Treated Base (Upper Base) | 1200 | 1400 | 16 | 0.8 |
| Graded Crushed Stone (Lower Base) | 400 | 18 | — | |
| 3% Cement Stabilized Gravel (Subbase) | 1000(Deflection Calculation) | 32 | 0.8 | |
| 2400(Tensile Stress Calculation) | ||||
| Earthwork Subgrade | 40.5 | — | — | |
Table 2.
Dynamic Strain Response.
| Structural Layer | Dominant Strain Type | Characteristic Value( με @10km/h) |
| ATB-25 | Compressive | -48.07 |
| Granular Base Course | Tensile | 80.50 |
| Cement-Treated Base | Compressive | -25.71 |
| Subgrade | Tensile | 87.45 |
Table 3.
Strain Response to Vehicle Speed in Layered Pavement System.
| Structural Layer | Tensile Strain Reduction | Compressive Strain Reduction | Sensitivity Ranking | Similarity Coefficient |
| ATB-25 | 10.8% | 32.7% | 2 | 0.9654 |
| Granular Base Course | 27.9% | 44.6% | 1 | 0.9660 |
| Cement-Treated Base | 12.8% | 18.2% | 3 | 0.9815 |
| Subgrade | 14.8% | 11.3% | 4 | 0.9625 |
Disclaimer/Publisher’s Note: The statements, opinions and data contained in all publications are solely those of the individual author(s) and contributor(s) and not of MDPI and/or the editor(s). MDPI and/or the editor(s) disclaim responsibility for any injury to people or property resulting from any ideas, methods, instructions or products referred to in the content. |
© 2025 by the authors. Licensee MDPI, Basel, Switzerland. This article is an open access article distributed under the terms and conditions of the Creative Commons Attribution (CC BY) license (http://creativecommons.org/licenses/by/4.0/).
Copyright: This open access article is published under a Creative Commons CC BY 4.0 license, which permit the free download, distribution, and reuse, provided that the author and preprint are cited in any reuse.


