
Submitted:
13 August 2025
Posted:
14 August 2025
You are already at the latest version
Abstract
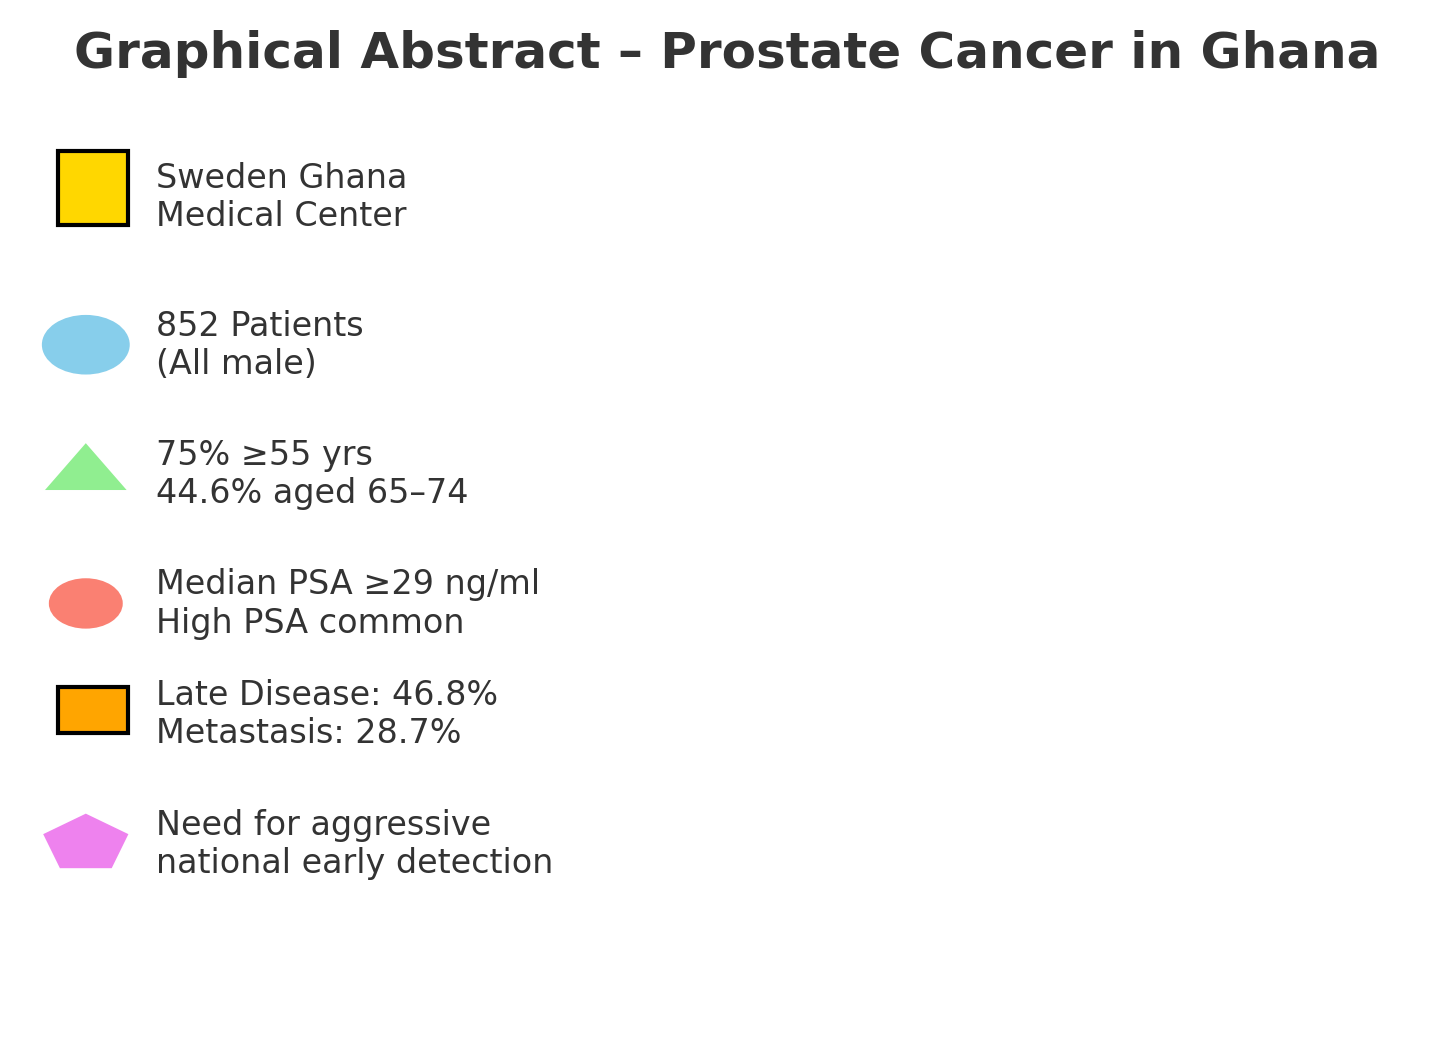
Background: Despite the globally acknowledged elevated prostate cancer risk among men of African descent, limited data exist on how incidence, severity, and outcomes differ across Ghana’s ethnic and demographic groups. This study investigates clustering patterns, risk profiles, stage at diagnosis, and treatment outcomes among patients at Sweden Ghana Medical Center in Accra. By examining PSA levels alongside physical and socio-demographic factors, the research aims to improve local detection and management and help in efforts to address the rising prostate cancer burden. Objective: This study investigates the trends, geospatial distribution, demographic/physical determinants, disease characteristics, and treatment outcomes of prostate cancer patients at the Sweden Ghana Medical Centre (SGMC) to provide insights into the Ghanaian context. Methods: An analysis of retrospective data from 852 prostate cancer patients who visited SGMC from 2011 to 2023 was conducted. Demographic information, disease characteristics (clinical stage, risk stratification, and PSA levels) and treatment outcomes (PSA response and incidence of toxicity) were studied. Results: Study participants were all males, mostly aged ≥55 years (75%), with a modal age of 65–74 years (44.6%). For prostate cancer (PCa) patients, 55.52% were Akan, and 14.91% Ewe, 13.38% were Ga, 7.63% were northern Ghanaian Ethnicities. Most had high PSA levels and BMI >24.5 kg/m² (79.48%), with 59.3% classified as overweight. Urban dwellers predominated (74.79%). Metastasis rate was 28.7%, late disease rate was 46.8%, high risk localized disease rate was 44.8%, and treatment success/response rate was 22.8% (for sustained PSA drop-to-Nadir/drop to ≤ 0.5ng/ml) or 53.8% (for 50%-PSA drop). Disease trends were rising; with a 10% PCa registration rate over the 12-year period. Majority of PCa patients were married (70.6%; OR = 1.73, p < 0.001), of high socioeconomic status (59.3%; OR = 1.59–3.30, p < 0.001), were of professional occupations (40.38%) or retirees (21.60%), and were Sedentary (56.5%; OR = 0.89, p < 0.039). PSA distributions showed a median ≥29 ng/ml (explaining over 50% of cases) and a Q3 PSA of ≥12.9 ng/ml (explaining at least 75%). PCa was associated with Age >65, OR = 2.12–2.51 (p < 0.001); weight-to-height ratio (OR = 1.23, p = 0.0022); PSA (OR = 1.02, p < 0.001); a positive family history (OR = 2.18–4.49, p < 0.001), Ethnicity, OR = 0.799 (p < 0.001) compared to Akan, Body Weight, (OR = 1.008/kg (p = 0.026). Alcohol (31.3%; OR = 0.81, p = 0.042) and tobacco use (8.6%; OR = 0.37, p < 0.01) were weakly linked. Comorbidities were rare, with hypertension (10.55%) most frequent. BMI correlated directly with high-risk localized PCa, but inversely with metastasis. Ga and Ewe ethnicities had lower odds of high-risk DRE disease than Akan (OR = 0.52, p = 0.049). Conclusions: Though limited by secondary data, Age, elevated PSA, family history, linear-weight-to-height ratio, Ethnicity, marital status, sedentary occupation, and high socio-economic status were identified as key determinants of prostate cancer. Late presentation and poor outcomes were rife. Aggressive measures on all fronts are needed to prevent, and diagnose more early-stage prostate cancer, nationally, to improve prostate cancer outcomes.
Keywords:
prostate cancer trends
; geospatial distribution
; clinicopathological features
; disease determinants
; disease severity
; treatment outcomes
; PSA
; ethnicity
; anthropometry
Introduction
Prostate cancer remains a critical global health concern, ranking as one of the most diagnosed cancers among men worldwide. However, its impact is disproportionately severe in populations of African descent, particularly in Ghana. In Ghana, prostate cancer constitutes the leading cause of cancer-related deaths in men, with an alarming case-fatality rate of over 50%. Ghana recorded 2,129 new cases and 1,117 deaths attributed to prostate cancer in 2020 alone [1]. This high mortality rate is primarily driven by late-stage presentation, with approximately 85% of cases diagnosed at advanced, less treatable stages compared to Western countries where 80% of patients present early. Late diagnosis constrains therapeutic options and dramatically lowers survival rates, reflecting systemic challenges in healthcare access, awareness, and early detection within Ghana [2,3].
Ghana’s population is characterized by marked ethno-demographic diversity. The country is home to over seventy ethnic groups, including major groups such as the Akan (47.5%), Mole-Dagbon (16.6%), Ewe (13.9%), Ga-Dangme (7.4%), and others [4]. This ethnic heterogeneity presents a unique opportunity to explore potential variations in prostate cancer incidence, disease severity, and treatment outcomes among the population. Evidence from global studies suggests significant ethnic and genetic disparities influencing prostate cancer risk, with African American and African men having notably higher incidence and mortality rates [5,6,7,8,9,10]. Yet, specific investigations into how these disparities manifest within Ghana are sparse, leaving a critical gap in understanding the disease’s epidemiology and pattern of clustering across the nation’s ethnic groups.
Moreover, current health promotion efforts aimed at prostate cancer prevention and early detection have been insufficiently targeted and often do not consider the sociocultural diversity of Ghana’s population. This lack of tailored messaging weakens the effectiveness of public health campaigns, limiting their reach and impact, especially among high-risk groups [2]. In this context, health promotion strategies must be informed by robust, locally derived epidemiological data that take ethnic and demographic differences into account.
Genetically, variations known to influence prostate cancer risk have been documented in African and African-descended populations. For example, polymorphisms in androgen receptor genes (e.g., V89L) and cytochrome P450 enzymes (CYP3A4*1B) exhibit variable frequencies among ethnic groups, which may contribute to ethnic disparities in vulnerability to prostate cancer [6]. However, these genetic and biochemical insights have not been systematically studied within the Ghanaian population, leaving much to be uncovered about hereditary and ethnic factors influencing the disease locally.
Given these multidimensional challenges, the current study aims to bridge existing knowledge gaps by investigating the demographic and clinical patterns of prostate cancer among patients attending the Sweden Ghana Medical Centre, Accra. Specifically, it examines whether distinct clustering of prostate cancer cases exists according to ethnicity and other demographic factors, and how these differences influence disease severity at presentation, risk profiles, and treatment outcomes.
This research seeks to support the development of more effective, equitable health promotion strategies and healthcare policies. Targeted screening programs that prioritize high-risk groups, culturally appropriate awareness campaigns, and improved access to diagnostic tools could collectively reduce the high morbidity and mortality associated with prostate cancer in Ghana [8,9,10,11,12,13,14,15,16,17,18,19,20,21]. It also seeks to provide data driven insights that could guide resource allocation in public health endeavors at the national level.
General objective: This study investigates the trends, geospatial distribution, demographic/physical determinants, disease characteristics, and treatment outcomes of prostate cancer patients at the Sweden Ghana Medical Centre (SGMC) to provide insights into the Ghanaian context.
Previous presentation:
Thesis; Obeng F. Prostate cancer disease determinants, disease severity, and treatment outcomes in Ghana: retrospective study, SGMC-2023 [MPH thesis]. Kpong (Ghana): Ensign Global College; 2024. 120 p., [20].
Conference Paper(Poster Presentation): Obeng F, Sutherland E, Ofori-Boateng M, et al. Prostate cancer disease determinants, disease severity, and treatment outcomes in Ghana: retrospective study, SGMC-2023 [poster]. UHAS Annual Conference; 2024 Jul; Ho, Ghana. Ho (Ghana): University of Health and Allied Sciences; 2024., [20].
Methods and Materials
Conceptual Framework
The study’s conceptual framework, guided by the Socio-Ecological Model [7], intricately examines some of Ghana’s prostate cancer determinants. This model interconnects individual (genetic/behavioural), interpersonal, and societal aspects, each shaping diverse health outcomes [1,11,12,13,14,15,16,20].
Individual factors age, ethnicity and gender, BMI, behaviour/habits, are key to prostate cancer risk. Genetic influences, particularly within ethnic contexts, play a role. Lifestyle, healthcare access, awareness, and the biomedical problem of PSA’s imperfections in early disease detection [9], all influence incidence, and these may affect the disease stage at detection and severity as well. Ultimately, the treatment outcomes, including toxicity/risk of side effects, are affected in tandem as well.
Interpersonal dynamics encompass cultural and social forces driving health behavior. Norms, family structures, and support networks (in this study, measured by marital status and occupation/work environment), shape attitudes towards screening and treatment and would influence how early or late a patient presents for treatment; and ultimately, the treatment outcomes. Geographical location, place of work and occupation may all affect geographical accessibility, financial accessibility and therefore treatment effectiveness, in as much as it can affect the health-seeking behaviour (including voluntary screening and uptake of regular health check-ups by individuals); and therefore, how early or late the disease is diagnosed [1,11,12,13,14,15,16,20,21,22,23,24,25,26,27,28,29]. Educational level has similar effects, but this study could not obtain that data from our secondary data source: even though it may largely be alluded from/through the occupations data which we have. However, this study did not analyse directly for educational level. Crucially, the framework highlights core factors: age, ethnicity, occupation, residence, marital status, BMI, alcohol/tobacco use, family history (genetics/hereditary), Prostate Specific Antigen (PSA) levels, and disease stage. While limited by retrospective data, these aspects are captured. In essence, this conceptual framework attempts to unravel Ghana’s prostate cancer complexity, holistically [1,11,12,13,14,15,16,20,21,22,23,24,25,26,27,28,29], Figure 1.
Study Design and Setting
This was a retrospective analytical study conducted at the Sweden Ghana Medical Centre (SGMC), Accra, analyzing secondary data from prostate cancer patients over a twelve-year period spanning March 20, 2011, to March 19, 2023. The study adopted a quantitative census approach, including all eligible prostate cancer patients who accessed care at SGMC during this period. The facility is a specialized center providing prostate cancer diagnosis, treatment, and follow-up services.
Study Population
All patients who presented to SGMC for prostate cancer care between March 20, 2011, and March 19, 2023, and met the predefined inclusion criteria were considered for the study.
Inclusion Criteria
Male patients with histopathological confirmed prostate adenocarcinoma.
Patients who receive any form of treatment for prostate adenocarcinoma, regardless of disease stage.
Exclusion Criteria
Patients with rare histological variants of prostate cancer (including small cell carcinoma, transitional cell carcinoma, squamous cell carcinoma, neuroendocrine carcinoma, prostate sarcoma), representing approximately 5% of prostate cancer cases.
Patients with secondary cancers affecting the prostate gland.
Data Sources and Extraction
Data was extracted from SGMC’s electronic health records using a standardized data collection template developed in Microsoft Excel to ensure uniformity and accuracy. Data extraction was independently performed by two reviewers with cross-validation to minimize selection and misclassification biases.
Study Variables
Independent Variables
Demographic: age, ethnicity, occupation, marital status, body mass index (BMI).
Behavioral: alcohol use, tobacco use.
Medical history: family history of prostate, breast, bladder or other cancers, and presence of comorbidities.
Dependent Variables
Clinical disease characteristics: digital rectal examination (DRE) stage at diagnosis, prostate-specific antigen (PSA) levels at diagnosis and highest recorded PSA, International Society of Urological Pathology (ISUP) grade, risk category/stratum, presence and site of metastasis.
Treatment parameters: type and intent of treatment (curative vs. palliative), radiation dose received (in Grays), hormonal therapy type, number of treatment modalities.
Outcomes: PSA post-treatment levels, PSA resolution metrics (including per Gray of radiation and per treatment modality), incidence of PSA failure, type of adjuvant therapy administered, and treatment-related toxicity.
These variables were selected to describe patient demographics, disease severity, treatment regimens, and clinical outcomes comprehensively.
Sample Size and Sampling
This study utilized a census sampling method, including all eligible patients within the study period. No sample size calculation was performed, as the aim was to analyze the entire population of prostate cancer patients seen at SGMC during the study timeframe.
Data Collection Tool
A standardized Microsoft Excel spreadsheet developed for the study, to ensure consistency and accuracy, was used for data collection. The data collection tool is presented under the Appendix section of this paper.
Data Management
Permission and ethical clearance were obtained from SGMC management and clinical departments before data access. Patient confidentiality and data privacy were strictly maintained; all data were de-identified prior to analysis. Electronic data files were stored on password-protected computers, and physical records were secured under lock and key. No facility names are disclosed in publications arising from this data.
Statistical Analysis
Data were initially cleaned and managed using Microsoft Excel before importation into Stata version-17 (StataCorp LP, College Station, TX, USA) for analysis.
Descriptive Analysis: Frequencies, proportions, means, medians, standard deviations, and interquartile ranges summarized demographic and clinical characteristics.
Bivariate Analysis: Chi-square and Fisher’s exact tests were used to assess associations between categorical variables. Continuous variables were analyzed using t-tests or Mann-Whitney U tests as appropriate.
Multivariate Analysis: Logistic regression models examined independent predictors of key outcomes, including disease severity (based on ISUP grade, stage, and PSA at diagnosis) and treatment outcomes (PSA resolution, treatment failure). Odds ratios (ORs) and 95% confidence intervals (CIs) were reported. Statistical significance was set at α = 0.05.
Modeling and Evaluation: Receiver Operating Characteristic (ROC) curves evaluated the predictive performance of PSA combined with demographic and clinical variables in detecting disease. Correlation analyses complemented regression results to understand variable relationships.
Bias and Confounding
To minimize selection bias, all patient records meeting eligibility within the study period were exhaustively reviewed without exclusion beyond criteria. Misclassification bias was addressed by standardized data collection procedures and cross-validation by independent reviewers. Potential confounding variables such as age, ethnicity, and comorbidities were controlled during multivariate analysis.
Ethical Approval
This study was reviewed and approved by the Ghana Health Service Research Ethics Committee (GHS-REC) under the protocol number GHS-ERC: 043/09/23. Prior to data collection, written informed consent was obtained from the guardians of all participating children, ensuring that they fully understood the purpose, procedures, potential risks, and benefits of the study (Except for the part of the study that used retrospective data from hospital electronic records). All research activities were conducted in strict compliance with the ethical principles outlined in the Declaration of Helsinki regarding research involving human participants.
Results
The study involved prostate cancer patients with an average age of 67.5 years (median of 68.0 years, with a standard deviation of 8.2 years. Age ranged from a minimum of 45 years to a maximum of 91 years. The median PSA at diagnosis was 29.0 ng/ml.
From Figure 2, the ages of the clients were normally distributed. With the modal age of 65 to 74 constituting 44.69% of the population.
Ethnicity; (and Nationality): Most prostate cancer cases attending the SGMC were of people who were Akan (Figure 3). They constituted 55.52%. 14.91% were Ewe, 13.38% were Ga, 7.63% were northern Ghanaians, 8.57% were Foreigners (Nigerians, Togolese, Beniniois, Burkinabes, Sierra Leoneans, Guineans, Ivorians, Jamaicans, Caucasians, Asians).
Most of the clients were married; 70.6% (Table1, and Figure 4).
Most of the study participants had a high socio-economic status, (59.40%), followed by (13.50%) with a low socio-economic status (Table 1, and Figure 5). The rest were “Retired/data not available”, together, (27.10%).
Based on activity levels related to occupation, 31.07% were sedentary, 43.85% were non-sedentary; and 24.09% were retired or had data on that not available (Table 1).
Most of the clients, 40.33% were professionals, 13.60% engaged in manual work, 5.74% were businessmen, and 5.28% served in forces such as the military or police. Additionally, 3.52% were academics, 3.63% were clergy members, and a significant portion, 27.06%, were either retired or did not have their occupations specified in the data available. A small percentage, 0.82%, were unemployed (Table 1).
From Table 1, above, a majority of the men in the study were overweight 53.4%. Out of the remaining, 26.9% were of normal weight, 4.23% were underweight and the remaining 16.08% were obese or morbidly obese. 81.8% of the study participants were non-smokers. Smokers constituted 8.6%; and the rest did not have data available (Table 1). From the same table, we realise that apart from the 7.5% of the study participants that did not have data on alcohol intake available, 31.3% did drink some alcohol. 61.2% did not drink any alcohol. The percentage of smokers was much smaller, at 8.6%, (Table 1); with the rest either not smoking or not having records on that.
Anthropometry: From Table 2, the participants had an average weight of 76.8 kilograms, with a standard deviation of 12.7 kilograms. Weight ranged from a minimum of 38.9 kilograms to a maximum of 129.4 kilograms.
The participants also had an average height of approximately 1.71 meters, with a standard deviation of approximately 0.07 meters. Heights ranged from a minimum of 1.50 meters to a maximum of 1.99 meters. Body Mass Index (BMI), a key indicator of overall health, averaged at 26.3 kg/m², with a standard deviation of 4.1 kg/m². BMI values spanned from a minimum of 14.53 kg/m² to a maximum of 41.42 kg/m².
The Linear W-H ratio, which relates weight-to-height, averaged at 44.95 kg/m, with a standard deviation of 7.00 kg/m. This ratio ranged from a minimum of 24.46 kg/m to a maximum of 72.06 kg/m. Lastly, the Ponderal Index (PONDEREX), a measure of body mass relative to height-cubed, had an average value of 15.46 kg/m³, with a standard deviation of 2.62 kg/m³. PONDEREX values ranged from a minimum of 8.54 kg/m³ to a maximum of 25.18 kg/m³.
Trends of Prostate Cancer Cases (Temporal trends, trends in Ethnic-Rates-of-Disease, Disease trends amongst occupations, Disease severity trends, Spatial trends of disease):
Yearly Trends in Patient Visits: To help us understand the growing burden in prostate cancer cases we analyzed for distinct trends in patient visits over the years:
From 2011 to 2014, patient visits were relatively stable; 2 (0.23%) in 2011 to 62 (7.28%) in 2014. Between 2015 to 2018, patient visits continued to grow gradually, 73 (8.57%) in 2018. The final period of 2018 to 2023 saw a significant rise in patient visits, indicating an accelerating trend; with numbers exceeding 100 in 2022 (12.09%) and 103 in 2023 (6.69%). Overall, trend was a steady rise in prostate cancer cases/burden. The total number of cases of prostate cancer seen over the period formed 10.65 % (852/8000) of the total number of all cancer cases seen over the study period in that facility (see Figure 6).
Figure 1: Composite visualizations of prostate cancer patient trends over 12 years at SGMC.
Figure Legend:
Normal quantile plot showing temporal trends across the twelve-year period (2010–2022). The rising registration trend (N = 852) aligns with global cancer attendance projections, supporting data from Globacon (2020) and Adeloye et al. (2016), with prostate cases accounting for an estimated 10.65% of all cancer visits.
This density- distributional sunflower (trend) diagram, (Figure 7) above shows a gradual increase in cases over the years amongst the various ethnic groups but still depicts the observation that Akan predominated throughout the period under study.
This density- distributional sunflower (trend) diagram (Figure 8) depicts that, amongst the occupations, the cases were predominant amongst the professionals’ occupational group, a general trend that persisted over the study period.
This density- distributional sunflower (trend) diagram, (Figure 9) suggests that over the years, as the total number of prostate cancer patients increased, the number or proportion of metastatic prostate cancer patients also increased in unison.
Spatial trends of disease (Geospatial Analysis):
This geospatial analysis is derived from field records of 852 prostate cancer patients seen over a 12-year period at a leading cancer treatment center in Ghana. Each patient’s Place of Last Residence (PLR) was captured and analyzed to assess referral patterns and regional burden of disease. The results demonstrate a varied but concentrated spatial distribution, both domestically and internationally.
The dataset reveals a broad regional spread of patients across several key zones of Ghana and beyond. The Greater Accra Region, including Accra metropolis, contributed a high proportion of referrals, consistent with its urban population density and proximity to tertiary referral centers. The Volta Region also showed a significant representation, possibly due to structured outreach or referral linkages with urology services (Table 3 and Figure 10).
Regional Representation: A total of 29 distinct locations were identified in the dataset. Tabe 3 is the count of prostate cancer patients per reported region: Accra: 364 patients, Volta Region: 122 patients, Kumasi: 56 patients, Tema: 53 patients, Ho: 35 patients, Hohoe: 19 patients, Nigeria (ABUJA): 10 patients, Koforidua: 10 patients, Togolese Origin (Togo): 9 patients, Cape Coast: 9 patients, Takoradi: 7 patients, patients, Tamale: 5 patients, Sunyani: 5 patients, Bolgatanga: 3 patients, Navrongo: 3 patients, Lagos: 2 patients. These regions are all urban regions (85.92%). Other locations/areas (e.g., Aflao, Nkawkaw, Akatsi, Sogakope, Ashaiman, Kasoa: 6 and others) all periurban: 120 (14.08%) combined patients.
Pattern Summary: The majority of patients originated from the Greater Accra Region—primarily Accra (364) and Tema (53)—making up over 48% of all referrals. This reflects not only population density and urban concentration, but also proximity to specialized cancer services.
The Volta Region also contributed significantly, with 122 (14.32%) cases spread across Ho, Hohoe, Aflao, Akatsi, and nearby towns. This may reflect active referral pathways or better community linkage through regional urology clinics.
Kumasi (56) i.e., 6.73% and Cape Coast (9), 1.08%; indicate modest participation from the middle belt and western corridor. In contrast, northern zones such as Tamale (5), Bolgatanga (3), and Navrongo (3) were grossly underrepresented, indicating potential geographical and infrastructural barriers to access.
Notably, international referrals were captured from Nigeria (ABUJA and Lagos) and Togo, (a total of 21 patients making up 2.52% of the total) confirming cross-border recognition and utilization of the cancer center’s services (Figure 11).
The resulting geospatial heatmap confirms a dense southern referral pattern, particularly concentrated in Accra and the Volta corridor, with a sharp drop-off in the northern regions. These spatial insights highlight the need for targeted decentralization, community screening programs, and improved access to diagnostic services in underserved northern and peri-urban areas.
Clinicopathological features of Prostate cancer amongst participants:
The study analyzed various aspects of PSA levels, including PSA at diagnosis (Mean: 496.391, Std. Dev.: 2240.127), PSA at the beginning of treatment (Mean: 559.1982, Std. Dev.: 2664.561), lowest PSA (Nadir) (Mean: 154.75, Std. Dev.: 545.251), and PSA resolution (Mean: 233.983, Std. Dev.: 2065.528). Any negative PSA resolution (or its derivative) suggests that the PSA , at diagnoses failed to respond to the treatment given; Table 4.
This dataset provides key information about prostate-specific antigen (PSA) levels in 852 individuals. PSA is crucial in prostate cancer monitoring. At diagnosis, the median PSA level was 29.0 ng/ml, showing the extent of cancer (that at least 50% had a PSA of 29.0 ng/ml at diagnosis). PSA levels at the start of treatment varied widely, from 0.05 to 25000 ng/ml. See Table 4.
As is expected, some individuals received no radiation treatment, which is why the median dose is 0.000 Grays. The lowest PSA during treatment ranges from 0.02 to 5405.5 ng/ml, indicating different responses. PSA resolution varies widely, with an average of 233.983 ng/ml.
Examining the relationship between PSA and radiation dose, PSA per Gray ranges from -5393.28 (negative values suggest an outright no-response to treatment); to 15299.883 ng/ml per Gray. PSA resolution per treatment type varies, from -5360.5 to 24960 ng/ml. The highest measured total serum PSA values (during the disease course) range from 0.25 to 25000 ng/ml (0.58 to 2600 ng/ml). Finally, fail-resolution multiples (fail PSA during treatment, divided-by lowest PSA during treatment (Nadir PSA) varied from 0 to 512.821, offering insights into treatment outcomes; Table 4.
Comorbidity rates: Amongst our study participants, 78.43% did not have any comorbidities at all. Of those that had co-morbidities, hypertension predominated, with a combined percentage of 15.11% in various combinations with its other allied co-morbidities: diabetes, hyperlipidemia/hypercholesterolemia, obesity and heart disease. Unexpected conditions like anemia due to hematuria with urinary tract infections featured as well in 3.52%. the listed erectile dysfunction was not surprising due its known associations with age, androgen deprivation therapy, and some prostate cancer as well. (Table 5).
22.7% of study participants had records indicating the presence of prostate cancer in a male relative. 69.5% did not have any such history; and 7.7% did not have data available (Figure 12).
Concerning inherent risks (for localized disease) that depict disease severity and likelihood of treatment success based on PSA at diagnosis, 50.42% had low risk disease, and 33.05% had high risk disease. 16.53% had an intermediate risk disease. Digital Rectal Examination (DRE) categorization of the same property yielded similar results: low risk, 53.19%; high risk, 29.42%, and intermediate risk, 17.38% (Figure 13 and Table 6).
In our prostate cancer study group (Table 6), the International Society of Urological Pathology (ISUP) grades were observed as follows: out of the total of 554 that had data on this attribute available, Grade 1 was represented by 106 cases, constituting 19.13% of the total; Grade 2 had 119 cases, accounting for 21.48%; Grade 3 was comprised of 108 cases, making up 19.50% of the total. Grades 4 and 5 were represented by 114 cases (20.58%) and 107 cases (19.31%), respectively (Table 6).
Localised prostate cancer disease risk/severity categorization by histology on prostate core biopsy, yielded the following risk strata for our 852 study participants; 46.37%: low risk; 17.6%: high risk, 36.03% intermediate risk (Table 6).
Putting all the three risk categorization parameters, PSA, DRE and ISUP together, for comprehensiveness and completeness of disease severity classification in localized prostate cancer, we arrived at an overall-risk categorization distributions of low risk, 29.56%, intermediate risk, 25.69% and high risk, 44.75% (Figure 14). Among the 852 cases, 71.38% showed no evidence of metastasis while 28.72% had metastatic disease. Subgroup analysis of the non-metastatic prostate cancer disease showed that 53.19% had localized disease and 17.39% had locally advanced disease. Late-stage disease rate was therefore 46.81%. Amongst the localized non-metastatic disease, we had the following overall disease risk/severity assessment outcomes: 44.75% were “High risk,” 25.69% were “Intermediate risk,” and 29.56% were “Low risk” diseases (Figure 14).
Late diagnosis was common (46.81%). The metastatic prostate cancer disease rate was 28.72% over the period of study. This means that locally advanced disease would account for
External beam radiotherapy was the primary treatment (76.88%). We found out that these 79.48% did not need any adjuvant treatment. Of the remaining that took some adjuvant treatment in addition to their primary treatment, 18.29% had only one additional modality, whilst the last 2.23% had a combination of two adjuvant modalities, see Table 6.
The types of adjuvant therapy that clients benefited from at the SGMC over the study period were brachytherapy (3.72%), chemotherapy (8.85%), gold-seed insertion to guide radiation therapy (4.07%), and surgery (14.34%); and allied-surgery of various kinds (0.18%). Another 0.18% had chemoradiation, 3.54% had chemotherapy and surgery
Apart from its myriad other uses, PSA provides a measurable parameter for follow-up of patients and gauging how well a prostate cancer patient is responding to a certain modality of treatment for the disease. Very high PSAs during treatment often suggest that there may be a big challenge with disease eradication, and in our study group, concerning the highest PSAs, 8.33% had a highest PSA value of up to less than 10 ng/ml. These may represent the good group (low risk regarding PSA). The rest, 91.97% had their highest PSAs ranging from more than 10 to >100 ng/ml (and even some had values of up to 25000 ng/ml; 1.88%. The mean PSA response per unit of treatment dose was 31.60 ng/ml per Grey. The 50%-PSA-resolution response rate was 53.16%. Treatment toxicity was infrequent (6.09%), Table 6.
Summary of Determinants of Prostate Cancer Disease:
Initial test of associations with the help of 810 controls from urology clinics, that we combined with the 852 confirmed prostate cancer patients in this study showed that: 70.6% of the patients were married (OR= 1.6, p<0.01). Patients, aged > 65 years, (OR = 2.34, p = 0.022) and high BMI (OR = 2.34, p = 0.022), were more likely to have a high PSA. BMI, was associated with high-risk localized prostate cancer; but with a reduced propensity to metastatic prostate cancer. Ga and Ewe Ethnicities were associated with low risk localized prostate cancer on DRE (OR = 0.52, p = 0.049), Table 8. High socio-economic status (59.32%; OR=3.3; p<0.01), sedentary occupations (56.5%; OR=0.2, p<0.01) and urban residence (74.79%), predominated amongst patients. Family history (24.65%; OR=2.3, p<0.01) exhibited a strong association; whilst alcohol consumption (31.3%; 0.97; p=0.87), and tobacco use (8.6%; OR= 0.33, p<0.01) exhibited rather weak links with the disease. Generally, comorbidities were relatively uncommon amongst the patients; but hypertension (10.55%) was the most frequent comorbidity (Table 4, Table 5 and Table 6).
Further exploration of the determinants of prostate cancer through analysis involving chi-square tests, univariate logistic regression, and a final internally validated multivariate logistic regression model. Using a dataset composed of the 852 confirmed prostate cancer cases and 154 histological controls without cancer was done.
The chi-square analysis was done to identify bivariate associations between the diagnosis variable (DIAG) and independent predictors across variables ranging from AGE_CD to PSA. Among the tested predictors, several variables demonstrated statistically significant associations. Age category (AGE_CD) showed a highly significant association with prostate cancer diagnosis (Chi² = 92.78, df = 3, p < 0.0001). Family history of prostate cancer (FMH) was also significantly associated (Chi² = 21.37, df = 1, p < 0.0001), indicating a non-random distribution of cases among those with familial predisposition. Physical activity (ACT) had a modest but statistically significant association (Chi² = 7.81, df = 1, p = 0.0052), suggesting a potential protective role. Alcohol use (ALC), BMI category (BMI_CD), also contributed associations of varying strength, though some did not reach significance thresholds in the chi-square analysis, Table 9.
Univariate logistic regression was subsequently done to quantify the crude odds of prostate cancer associated with each variable. The odds of prostate cancer increased significantly with age: participants in higher age categories had odds ratios ranging from 1.84 to 4.22 compared to the reference group, with AGE_CD yielding an OR of 2.17 (95% CI: 1.95–2.42, z = 14.11, p < 0.0001). Family history (FMH) was associated with increased odds of prostate cancer with a crude OR of 1.96 (95% CI: 1.48–2.61, z = 4.63, p = <0.001). PSA levels, even when categorized, demonstrated a gradient of increasing risk: men with PSA values >500 ng/ml had substantially higher odds of disease compared to those with PSA ≤10 ng/ml, though exact ORs for each PSA_CD level varied. Conversely, BMI_CD yielded a non-significant OR of 0.98 (95% CI: 0.88–1.09, z = -0.44, p = 0.661). Physical activity (ACT) showed a protective trend with an OR of 0.78 (95% CI: 0.69–0.89, z = -3.87, p = <0.001), indicating that higher activity levels were associated with lower odds of prostate cancer in the unadjusted mode, Table 9.
In constructing the multivariate logistic regression model, an iterative process was required to avoid statistical artifacts such as perfect separation. Categorical PSA variables (PSA_CD) caused instability and were therefore replaced with the raw continuous PSA values. The final model included AGE_CD, BMI_CD, FMH, ACT, ALC, and PSA. This adjusted model revealed that age remained a strong and statistically significant predictor, with an adjusted OR of 2.51 (95% CI: 2.03–3.10, z = 8.55, p = <0.001). FMH also retained strong predictive power, with an adjusted OR of 4.49 (95% CI: 2.16–9.30, z = 4.04, p = <0.001). PSA, treated as a continuous variable, was positively associated with prostate cancer with an OR of 1.02 per unit increase (95% CI: 1.01–1.03, z = 3.42, p = <0.001), confirming its utility in disease discrimination. ACT had an OR of 0.86 (95% CI: 0.69–1.06, z = -1.42, p = 0.154), indicating a protective but non-significant trend after adjustment. BMI_CD had no significant effect in the multivariate context (OR = 0.92, 95% CI: 0.75–1.13, z = -0.77, p = 0.440), and alcohol use (ALC) also did not achieve significance (OR = 1.24, 95% CI: 0.94–1.63, z = 1.45, p = 0.147), Table 9.
Predictive performance metrics of the model demonstrated robust accuracy and discrimination. The model achieved an accuracy of 87.4%, precision of 88.3%, and recall (sensitivity) of 98.0%, yielding an F1-score of 92.9%. The area under the ROC curve (AUC) was calculated to be 0.806, reflecting excellent discriminative ability. The confusion matrix revealed 250 true positives, 13 true negatives, 5 false negatives, and 33 false positives. Calibration curve analysis showed that predicted probabilities were well aligned with observed probabilities across deciles of risk. The decision curve, using net benefit approximation across threshold probabilities, demonstrated positive clinical utility for a range of threshold settings. Additionally, a Youden’s Index analysis identified an optimal classification threshold of 0.57, which maximized the trade-off between sensitivity and specificity, Figure 15 A to D.
In summary, the most important determinants of prostate cancer in this study population were increasing age (adjusted OR = 2.51, p < 0.0001), positive family history (adjusted OR = 4.49, p < 0.0001), and elevated serum PSA levels (adjusted OR = 1.02 per unit, p = 0.0006). These findings underscore the critical role of age, inherited risk, and PSA surveillance in prostate cancer detection. While physical activity suggested a protective effect, this did not remain statistically significant in the fully adjusted model. Alcohol use and BMI showed no meaningful contribution to prostate cancer odds in this population. Overall, these results support the integration of PSA testing, age stratification, and family history evaluation in prostate cancer screening and risk prediction strategies.
Multivariate Logistic Regression Report
Logistic Regression Equation
\text{Logit}(P) = -1.8366 + 0.9203 \cdot \text{AGE_CD} - 0.0812 \cdot \text{BMI_CD} + 1.5011 \cdot \text{FMH} - 0.1538 \cdot \text{ACT} + 0.2124 \cdot \text{ALC} + 0.0239 \cdot \text{PSA}
Model Evaluation Metrics
Accuracy: 0.8738, Precision: 0.8834, Recall (Sensitivity): 0.9804, F1 Score: 0.9294, AUC: 0.8056
Confusion Matrix: ((13, 33), (5, 250)). Figure 15 A to D displays Model Evaluation Metrics, Calibration Plots, Decision Curve Analysis and Youden’s index.
Evaluation for overfitting: The diagnostic tests for model adequacy and validity yielded the following results: Hosmer-Lemeshow Test: Chi² = 2.558, df = 8, p = 0.959. Indicates excellent calibration (no significant difference between observed and predicted outcomes across deciles).
Model Chi-square Test (Overall Fit): Chi² = 189.389, df = 6, p < 0.00001. Suggests that the model significantly improves prediction compared to a null (intercept-only) model.
Pseudo R² (McFadden’s): 0.2228. Indicates a moderate but meaningful explanatory power (22.28%) for a logistic regression model.
Cross-validated Log Loss: –0.3293. Suggests robust internal generalizability with minimal overfitting across 5-folds.
These findings confirm that the logistic regression model is statistically sound, well-calibrated, and generalizable for predicting prostate cancer in the study population.
Assessment for Multicollinearity: The Variance Inflation Factor (VIF) analysis was conducted to evaluate the degree of multicollinearity among the independent variables in the regression model. The results demonstrated that all variables had VIF values close to 1, indicating minimal collinearity and confirming the stability of the regression estimates. Specifically, the constant term had a VIF of 1.028, showing that the model intercept was not influenced by excessive correlation among predictors. The age category variable (AGE_CD) had a VIF of 1.290, while the body mass index category (BMI_CD) recorded a VIF of 1.116. The family history of prostate cancer (FMH) variable had a VIF of 1.019, further confirming its independence from the other covariates. Similarly, physical activity (ACT) and alcohol use (ALC) had VIFs of 1.062 and 1.063, respectively, indicating very low levels of inter-variable correlation. The prostate-specific antigen (PSA), which is an important biomarker in prostate cancer risk assessment, showed the highest VIF at 1.321; however, this still lies well below the conventional threshold of concern (typically set at 5 or 10). These findings collectively affirm that multicollinearity is not a concern in this model and that the regression coefficients are likely to be stable, interpretable, and reliable for inference. All VIF values are well below 10, indicating no evidence of multicollinearity among predictors. The highest VIF is for PSA at 1.321, which is acceptable and does not threaten model stability.
Discussion
Summary of Findings: prostate cancer disease trends showed a steady rise over the period with 10% disease registration rate over the 12- year study period. The spatial trends showed that up to 48% of patients were from the Accra-Tema area; with up to 74.79% urban residence rate. Study participants, were all males; aged 55 and above (75%); modal age, 65 to 74(44.6%); ethnicity; (Akan; 55.52%, Ewe, 13.38% were Ga, 7.63% were northern Ghanaian Ethnicities); high PSA, BMI above 24.5Kg/m2 (79.48%); but overweight alone is (59.3%): married men; (70.6%); high socio-economic status,(59.3%); ‘professional’ occupation group; (40.38%; but also, retirees, 21.60%). A median PSA of 29ng/ml and above, explained more than fifty per cent of all the cases; and a third-quartile PSA of 12.9 ng/ml and above, which explained 75% of the cases i.e., (the 75th. Percentile). Metastasis rate was 28.7%, late disease rate was 46.8%, high risk localized disease rate was 44.8%, and treatment success/response rate was 22.8% (for sustained PSA drop-to-Nadir/drop to ≤ 0.5ng/ml) or 53.8% (for 50%-PSA drop). Linking to associations and relationships, the over 70.% of patients married linked with an OR= 1.73, p<0.001. Patients were more likely to be aged > 65 years, (OR = 2.12 to 2.51, p < 0.001), have a high linear weight-to-height (OR = 1.23, p = 0.0022), have a high PSA (OR=1.02, p<0.001), and a positive family history of prostate cancer (OR=2.18 to 4.49; p<0.001). Others were ethnicity (OR=0.799, p<0.001; compared to Akan), high socioeconomic status (OR=1.59 to 3.30, p<0.001), weight (OR=1.008 per kilogram, p=0.026). Sedentary occupations (56.5%; OR=0.89, p<039) and urban residence (74.79%), predominated amongst patients, whilst alcohol consumption (31.3%; 0.81; p=0.042), and tobacco use (8.6%; OR= 0.37, p<0.01) exhibited rather weak links with the disease. Generally, comorbidities were relatively uncommon amongst the patients; but hypertension (10.55%) was the most frequent comorbidity. BMI was associated with high-risk localized prostate cancer; but with a reduced propensity to metastatic prostate cancer. Ga and Ewe Ethnicities were associated with low risk localized prostate cancer on DRE compared to Akan (OR = 0.52, p = 0.049).
Comparison with Existing Literature
The present study examined 852 prostate cancer cases at the Sweden Ghana Medical Centre (SGMC), with a mean age of 67.5 years and a median age of 68.0 years, slightly lower than values reported by Kyei et al. [17]. This was not surprising because the Kyei et al., study in part, looked at screening-detected prostate cancer cases. Ethnic distribution was predominantly Akan (55.52%), followed by Ga (13.38%), Ewe (14.91%), Northern Ghanaian ethnicities (6.34%), and non-Ghanaians (9.85%), corroborating findings by Gyedu et al. [13]. The median PSA level at diagnosis was 29.0 ng/ml—markedly higher than what was reported by Kyei et al. [17].
Case-trend analysis (Temporal Trends) revealed a steady increase in prostate cancer diagnoses over the 12-year period, rising from 2 cases in 2011 to 103 in 2023, and a total prostate cancer registration rate of 10.65% in the study setting. This pattern aligns with data from GLOBOCAN 2020 [3], which places prostate cancer incidence at 8.9% among all male cancers in Ghana. Our results demonstrate a three-phase trend in patient volumes, starting with a gradual rise between 2011 and 2014, a moderate increase up to 2018, and a significant surge from 2019 onward, reaching a peak in 2023. This pattern mirrors global increases in prostate cancer incidence, especially in sub-Saharan Africa [18,19].
Advanced-stage disease presentations were common, with 28.72% metastatic and 16.81% locally advanced cases, yielding a total late presentation rate of 46.81%, consistent with Amoako et al. [8]. Only 53.19% presented with early-stage disease—far lower than Western countries, where early diagnosis rates exceed 80% [6]. These findings reflect systemic gaps in early detection programs in Ghana [3,4,19].
Advanced age remains a strong predictor of disease (OR = 2.12 to 2.21, p < 0.001), in line with international studies [22]. Participants had an average BMI of 26.3 kg/m^2. Surprisingly, while obesity (BMI > 30) is often associated with worse outcomes [24], our study showed a protective effect against metastasis (OR = 0.35, p = 0.026) and a higher risk for localized high-risk disease among those with normal BMI (OR = 2.54, p = 0.022), warranting further investigation.
Ethnic disparities were evident. The Akan ethnic group, overrepresented in our cohort (55.52% vs 45.7% nationally), exhibited higher odds of aggressive disease. Non-Akan groups, particularly Ga and Ewe men, had lower odds of high-risk disease (OR = 0.52, p = 0.049), and a lower odds of prostate cancer disease in general (OR=0.799, P<0.001) consistent with other ethnic variation studies [2,13,25].
Marital Status, Occupation, and Socioeconomic Factors: even though they had an OR = 1.73, p < 0.001 to prostate cancer disease, married patients showed better treatment outcomes, possibly due to enhanced psychosocial support aligning with findings by Aizer et al. [27]. High socioeconomic status (SES) was unexpectedly associated with greater prostate cancer risk (OR = 1.59 to 3.30, p < 0.001), contradicting studies that link lower socioeconomic status (SES) to worse outcomes [28,29]. This may be explained by the sedentary nature of many high-SES jobs. Our regression analysis suggested that high activity-level occupations had a protective effect against prostate cancer(OR= 0.89, p=0.035), and its metastasis, (p = 0.006), consistent with literature highlighting the benefits of physical activity [28,29].
Family History, Comorbidities, and PSA Associations: Family history of prostate cancer (FMH) was strongly associated with increased disease risk (OR = 2.312, p < 0.001), affirming the role of genetic predisposition as in Ashkenazi Jews [26]. Most patients had no comorbidities, but those with comorbid conditions had increased likelihood of requiring adjuvant therapy (p = 0.001) and paradoxically showed lower metastasis rates (OR = 0.59, p = 0.014), possibly due to increased health-seeking behavior.
PSA levels were positively associated with prostate cancer risk (OR = 1.024 to1.092, p < 0.001). The Kruskal-Wallis test confirmed significant differences in PSA by age (p = 0.003), ethnicity (p = 0.049), and nationality (p = 0.030), consistent with Hsing et al. [2].
Disease Severity and Treatment Response: Disease severity at presentation was notable, with 28.72% metastatic and 46.81% advanced-stage disease overall. Treatment response, using PSA resolution metrics, showed that 53.16% of patients achieved at least a 50% PSA reduction, lower than the 68% benchmark in Western studies [6]. The mean PSA reduction per Gy of external beam radiation therapy (EBRT) was 31.6 ng/ml.
Age was also linked to ISUP grade (p = 0.009), as were ethnicity (p = 0.049) and nationality (p = 0.030), reinforcing the multifactorial basis of prostate cancer progression [19].
Comorbidity presence was significantly associated with the need for adjuvant therapy (p = 0.001). Nationality influenced the number of treatment modalities received (p = 0.030), potentially due to treatment preference or access among international patients. Notably, younger patients experienced more toxicity (p = 0.001), as did patients with higher BMI (p = 0.034), reflecting challenges in organ targeting during treatment.
In sum, this study offers critical insights into the complex interplay of demographic, clinical, and biological factors influencing prostate cancer risk and outcomes in Ghana. It underscores the need for improved early detection strategies and tailored interventions sensitive to ethnic and socioeconomic contexts.
Limitations
Since secondary data was relied on, there was a high number of incomplete data points for some of the participants of the study. Some of the demographic characteristics that would have been desired, like the educational levels, and other risks like the extent of smoking, the quantities of alcohol consumed and whether patients were alive or dead at the time of data collection, could not be obtained. These limitations to some extent do limit the degree to which we can generalize our findings to the entire population. We therefore opine here that the results of our findings, even though robust, should still be applied bearing in mind these genuine limitations of the study. It also calls for prospectively collected data in the future, to provide data that is planned to provide the exact parameter needs for such a far-reaching study.
What is known about this study:
Prostate cancer is one of the leading cancers among men of African descent, including Ghanaian men, with globally recognized disparities in incidence and outcomes. In Ghana, most patients are diagnosed at advanced stages, contributing to poor survival rates. Biomarkers like PSA are commonly used for diagnosis, but their predictive value can be limited by access and variability across populations. Previous studies have highlighted general trends in prostate cancer burden in West Africa, but few have explored detailed demographic, ethnic, and socio-economic influences on disease presentation and outcomes in Ghana.
What this study adds:
This study provides a comprehensive analysis of prostate cancer cases over a 12-year period at a major cancer center in Ghana, revealing a steadily increasing burden and late presentation pattern. It identifies ethnicity, age, BMI, marital status, socioeconomic status, and occupational activity as key determinants of disease risk and severity. The findings underscore significant ethnic disparities, highlight the role of comorbidities in treatment decisions, and demonstrate suboptimal treatment outcomes linked to delayed diagnosis. By integrating PSA data with demographic and clinical variables, the study offers locally relevant insights to inform targeted screening strategies, early detection programs, and policy-level interventions for improved prostate cancer control in Ghana.
Conclusion
This study highlights age, family history, PSA, Linear-weight -to-Height ratio, ethnicity, marital status, sedentary occupation, and socioeconomic status as key determinants of prostate cancer among Ghanaian men. After adjusting the Odds Ratios, the enduring determinants were age (OR = 2.51, p<0.001), family history of prostate cancer, (OR= 4.49, p<0.001), and PSA, (OR=1.02, P<0.001). Despite reliance on secondary data, the findings reveal an increasing burden of prostate cancer, with a clear rise in patient visits between 2012 and 2023 at one of the country’s leading cancer centers. Nearly half of the cases (46.19%) presented at an advanced stage, leading to suboptimal outcomes—only 22.8% achieved sustained PSA remission, despite an initial 54.58% PSA response (measured as at least an initial PSA-halving-rate). Ethnic disparities were evident, particularly among Akan, Ga, and Northern Ghanaian men, and other important influences included marital status, occupational activity, family history, and alcohol use. Although comorbidities were infrequent, patients with hypertension or diabetes were more likely to receive adjuvant therapy but often presented with non-metastatic disease, suggesting heightened health-seeking behavior. PSA levels were notably elevated, with a median of 29 ng/ml accounting for over half the cases, and the 75th percentile PSA value of 12.9 ng/ml capturing 75% of all cases.
To improve prostate cancer outcomes in Ghana, urgent nationwide interventions are needed to increase awareness, particularly among high-risk ethnic groups, promote early detection, and address modifiable risk factors. Public health campaigns should focus on lifestyle modification, screening for men over 50, and culturally sensitive education strategies. Urban and sedentary populations require targeted health promotion efforts, while individuals with a family history of prostate cancer would benefit from access to genetic counseling. Finally, a national cancer registry must be established and maintained to guide health planning and resource allocation through robust data collection and monitoring of cancer trends.
Author Contributions
Conceptualization, Frank Obeng, Millicent Boateng, Lord Mensah, Emmanuel Frempong, Joyce Okai and Edward Sutherland; Data curation, Frank Obeng, Gideon Owusu, Steve Manortey, Lord Mensah, Emmanuel Frempong, Clement Edusa, Joyce Okai and Edward Sutherland; Formal analysis, Frank Obeng, Gideon Owusu, Lord Mensah and Edward Sutherland; Investigation, Frank Obeng, Selasie Owiafe, Millicent Boateng, Emmanuel Frempong, Clement Edusa and Edward Sutherland; Methodology, Frank Obeng, Millicent Boateng, Sandra Kushitor, Steve Manortey, Lord Mensah and Edward Sutherland; Project administration, Frank Obeng, Lord Mensah, Emmanuel Frempong, Clement Edusa and Joyce Okai; Resources, Frank Obeng, Selasie Owiafe, Gideon Owusu, Millicent Boateng, Sandra Kushitor, Clement Edusa, Joyce Okai and Edward Sutherland; Software, Selasie Owiafe, Gideon Owusu, Lord Mensah and Emmanuel Frempong; Supervision, Millicent Boateng, Sandra Kushitor, Steve Manortey, Lord Mensah, Clement Edusa and Edward Sutherland; Validation, Frank Obeng, Gideon Owusu, Sandra Kushitor, Steve Manortey, Lord Mensah, Clement Edusa, Joyce Okai and Edward Sutherland; Visualization, Frank Obeng, Selasie Owiafe, Gideon Owusu, Millicent Boateng, Sandra Kushitor, Steve Manortey and Edward Sutherland; Writing – original draft, Frank Obeng, Sandra Kushitor and Edward Sutherland; Writing – review & editing, Frank Obeng, Selasie Owiafe, Gideon Owusu, Millicent Boateng, Steve Manortey, Lord Mensah, Emmanuel Frempong, Clement Edusa and Joyce Okai. All authors have agreed to the submitted version of the manuscript.
Funding
This research received no external funding. The study was self-funded by the authors.
Institutional Review Board Statement
The study was conducted according to the guidelines of the Declaration of Helsinki and approved by the Ghana Health Service Research Ethics Committee (GHS-REC) under the protocol number GHS-ERC: 043/09/23.
Informed Consent Statement
Informed consent was obtained from all subjects involved in the study.
Data Availability Statement
The data that support the findings of this study are available from the corresponding author upon reasonable request.
Acknowledgments
The authors express their sincere gratitude to all study participants, community leaders, and health facility staff who supported data collection. Special thanks to the Urology Unit, Department of Surgery, University of Health and Allied Sciences, for technical guidance, and to the community volunteers who helped with participant mobilization. We also acknowledge the assistance of research assistants and data entry personnel whose work contributed to the success of this study.
Conflicts of Interest
The authors declare no conflict of interest. The funders had no role in the design of the study; in the collection, analyses, or interpretation of data; in the writing of the manuscript; or in the decision to publish the results.
References
- Laryea DO, Awuah B, Amoako YA et al. Cancer incidence in Ghana, 2012: evidence from a population-based cancer registry. BMC Cancer. 2014;14:362. Available from: https://bmccancer.biomedcentral.com/articles/10.1186/1471-2407-14-362. [CrossRef]
- Hsing AW, Tsao L, Devesa SS et al. International Trends and Patterns of Prostate Cancer Incidence and Mortality. Int J Cancer. 2000;85(1):60–67. Available from: https://doi.org/10.1002/(SICI)1097-0215(20000101)85:1<60::AID-IJC11>3.0.CO;2-B. [CrossRef]
- International Agency for Research on Cancer. Globocan. Cancer statistics, 2020 [Internet]. WHO/IARC; cited 2023 Mar 22. Available from: https://gco.iarc.fr.
- Ghana Statistical Service. Ghana Demographic and Health Survey 2014: Key Indicators. Accra: Ghana Statistical Service; 2014.
- Odedina FT, Akinremi TO, Chinegwundoh F et al. Prostate cancer disparities in black men of African descent: comparative literature review. Infect Agents Cancer. 2009;4(Suppl 1):S2. [CrossRef]
- Rebbeck TR, Haas GP, Colbert LE et al. Origins of human prostate cancer. Cancer J. 2014;20(3):196–201. [CrossRef]
- McLeroy KR, Bibeau D, Steckler A et al. An ecological perspective on health promotion programs. Health Educ Behav. 1988;15(4):351–377. [CrossRef]
- Amoako YA, Hammond EN, Assasie-Gyimah A et al. Prostate-specific antigen and risk of bone metastases in West Africans with prostate cancer. World J Nucl Med. 2019;18:143–148. [CrossRef]
- Catalona WJ, Partin AW, Sanda MG et al. [−2]pro-PSA combined with PSA and free PSA for prostate cancer detection in the 2.0–10.0 ng/ml range. J Urol. 2011;185(5):1650–1655. [CrossRef]
- American Society of Clinical Oncology. Prostate Cancer – Statistics. Prostate Cancer - Statistics [Internet]. 2018. Available from: https://www.cancer.net/cancer-types/prostate-cancer/statistics.
- Wiredu EK, Armah HB. Cancer mortality patterns in Ghana: a 10-year review of autopsies and hospital mortality. BMC Public Health. 2006;6:159. [CrossRef]
- Biritwum RB, Yarney J, Mensah G et al. Cancer incidence in Ghana, 2012: evidence from a population-based cancer registry. BMC Cancer. 2016;16:736. [CrossRef]
- Gyedu AA, Salazar K, Lee JJ et al. Ethnic and geographic variations in the epidemiology of prostate cancer in sub-Saharan Africa: systemic review. Int J Cancer. 2018;142(2):241–248. [CrossRef]
- Seibert TM, Garraway IP, Plym A et al. Genetic Risk Prediction for Prostate Cancer: Implications for Early Detection and Prevention. Eur Urol. 2023;83(3):241–248. [CrossRef]
- Rota M, Scotti L, Turati F et al. Alcohol consumption and prostate cancer risk: dose–risk meta-analysis. Eur J Cancer Prev. 2012;21(4):350–359. [CrossRef]
- Maamri A. Conceptual framework: the amount and various determinants of cancer in Morocco. OJPM. 2015;5(10):047. Available from: https://www.scirp.org/journal/paperinformation?paperid=60666. [CrossRef]
- Kyei MY, Mensah JE, Djagbletey R et al. Trifecta outcomes after open radical prostatectomy for localized prostate cancer in Ghana. Open J Urol. 2023;13(8):282–292. [CrossRef]
- Ferlay J, Colombet M, Soerjomataram I et al. Estimating global cancer incidence and mortality in 2018: sources and methods (GLOBOCAN). Int J Cancer. 2020;144(8):1941–1953. [CrossRef]
- Jemal A, Bray F, Forman D et al. Cancer burden in Africa and opportunities for prevention. Cancer. 2016;118(18):4372–4384. [CrossRef]
- Obeng F et al. Prostate cancer disease determinants, disease severity, and treatment outcomes in Ghana: retrospective study, SGMC-2023 [MPH thesis]. Kpong (Ghana): Ensign Global College; 2024. Available from: https://www.researchgate.net/publication/382690202_FULL_THESIS….
- Adeloye D, David RA, Aderemi AV et al. An estimate of the prevalence of prostate cancer in Africa: a systematic review and meta-analysis. PLoS One. 2016;11(4):e0153496. [CrossRef]
- Siegel RL, Miller KD, Jemal A. Cancer statistics, 2020. CA Cancer J Clin. 2020;70(1):7–30. [CrossRef]
- Dunstan DW, Howard B, Healy GN et al. Too Much Sitting—A Health Hazard. Diabetes Res Clin Pract. 2012;97(3):368–376. [CrossRef]
- Chinegwundoh F, Enver M, Lee A et al. Risk and presenting features of prostate cancer among African Caribbean, South Asian and European men in North East London. BJU Int. 2006;98(6):1216–1220. [CrossRef]
- Liede A, Malik IA, Aziz Z et al. Contribution of BRCA1 and BRCA2 mutations to breast and ovarian cancer in Pakistan. Am J Hum Genet. 2002;71(3):595–606. [CrossRef]
- Kirchhoff T, Kauff ND, Mitra N et al. BRCA mutations and risk of prostate cancer in Ashkenazi Jews. Clin Cancer Res. 2004;10(9):2918–2921. [CrossRef]
- Aizer AA, Chen MH, McCarthy EP et al. Marital status and survival in patients with cancer. J Clin Oncol. 2013;31(31):3869–3876. [CrossRef]
- Kenfield SA, Stampfer MJ, Giovannucci E et al. Physical activity and survival after prostate cancer diagnosis. J Clin Oncol. 2011;29(6):726–732. [CrossRef]
- Cao Y, Ma J, Zhang J et al. The role of obesity in prostate cancer. Front Oncol. 2018;8:743. [CrossRef]
- American Cancer Society. Cancer Facts & Figures 2021 [Internet]. Atlanta: American Cancer Society; 2021. Available from: https://www.cancer.org/content/dam/cancer-org/research/cancer-facts-and-figures/2021.pdf.
Figure 1.
Figure 1. Conceptual Framework diagram for the study. Figure Legend: adapted and modified from the socio-ecological model [7], and ‘the amount and various determinants of cancer in Morocco [16]. PSA1 = Prostate Specific Antigen; DRE2 = Stage of disease on Digital Rectal Examination at the clinics; ISUP3 = International Society of Urologic Pathologists grade of disease on histology.
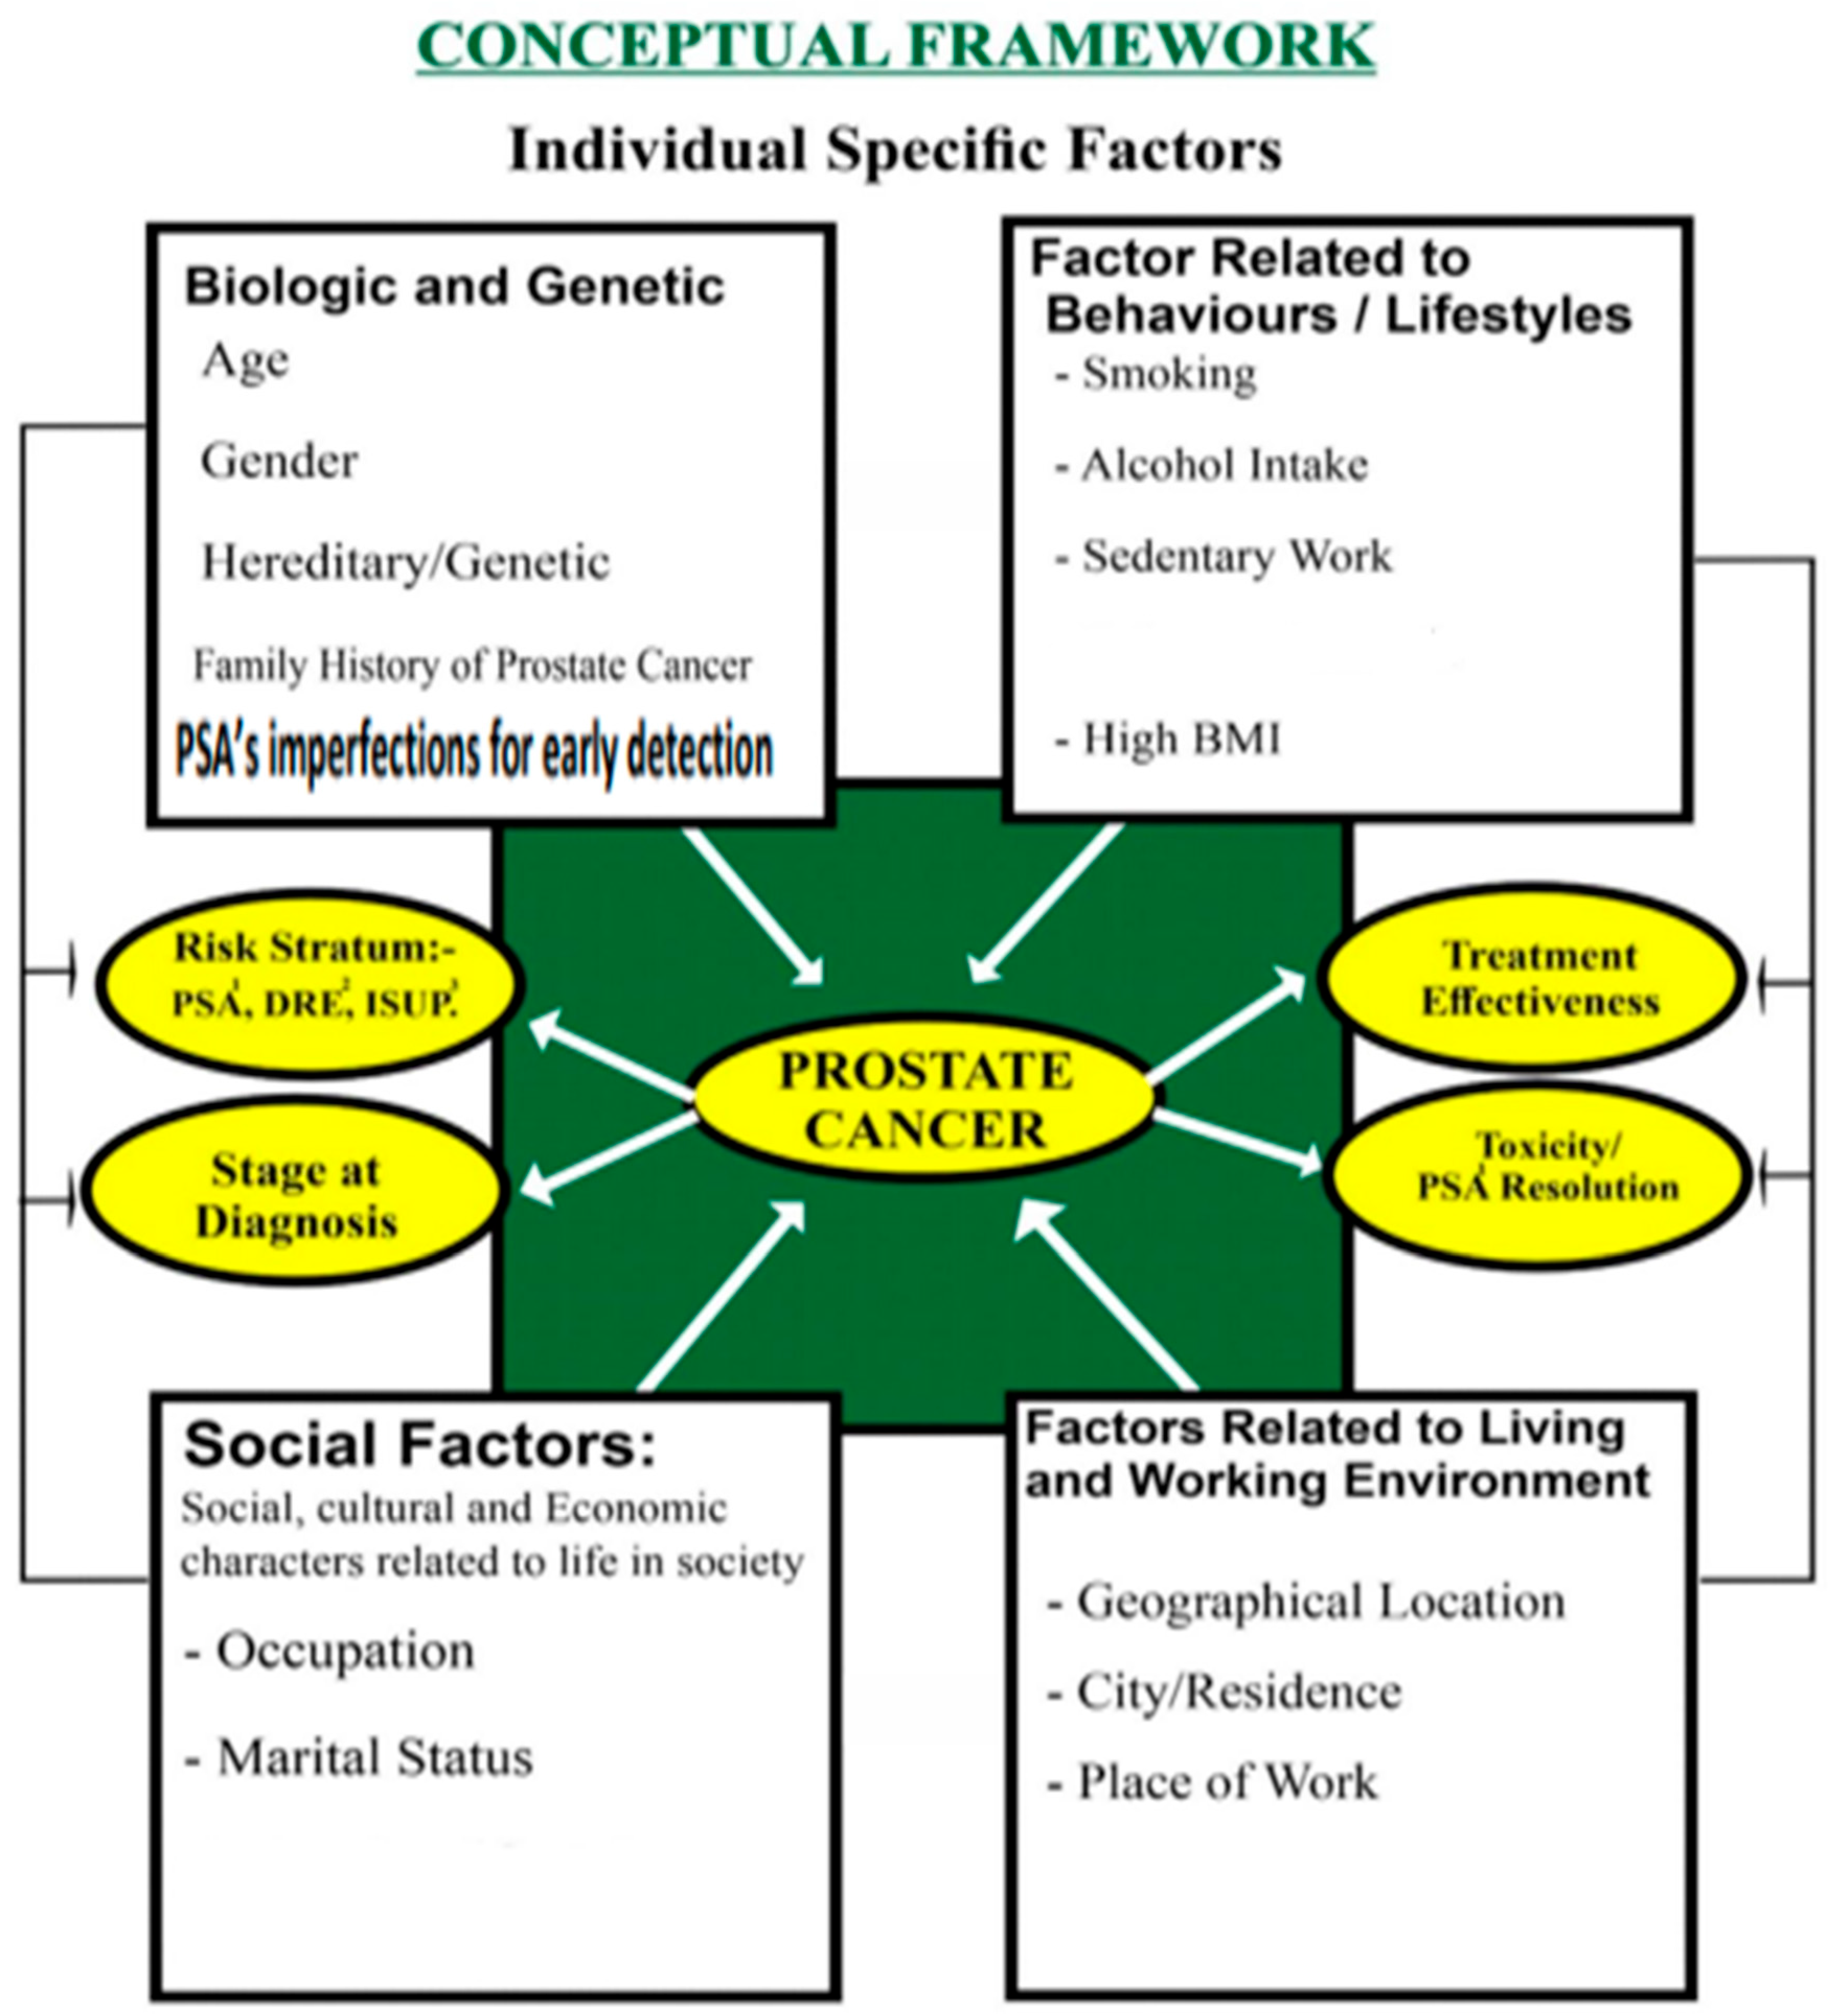
Figure 2.
Age Distribution (n=852).
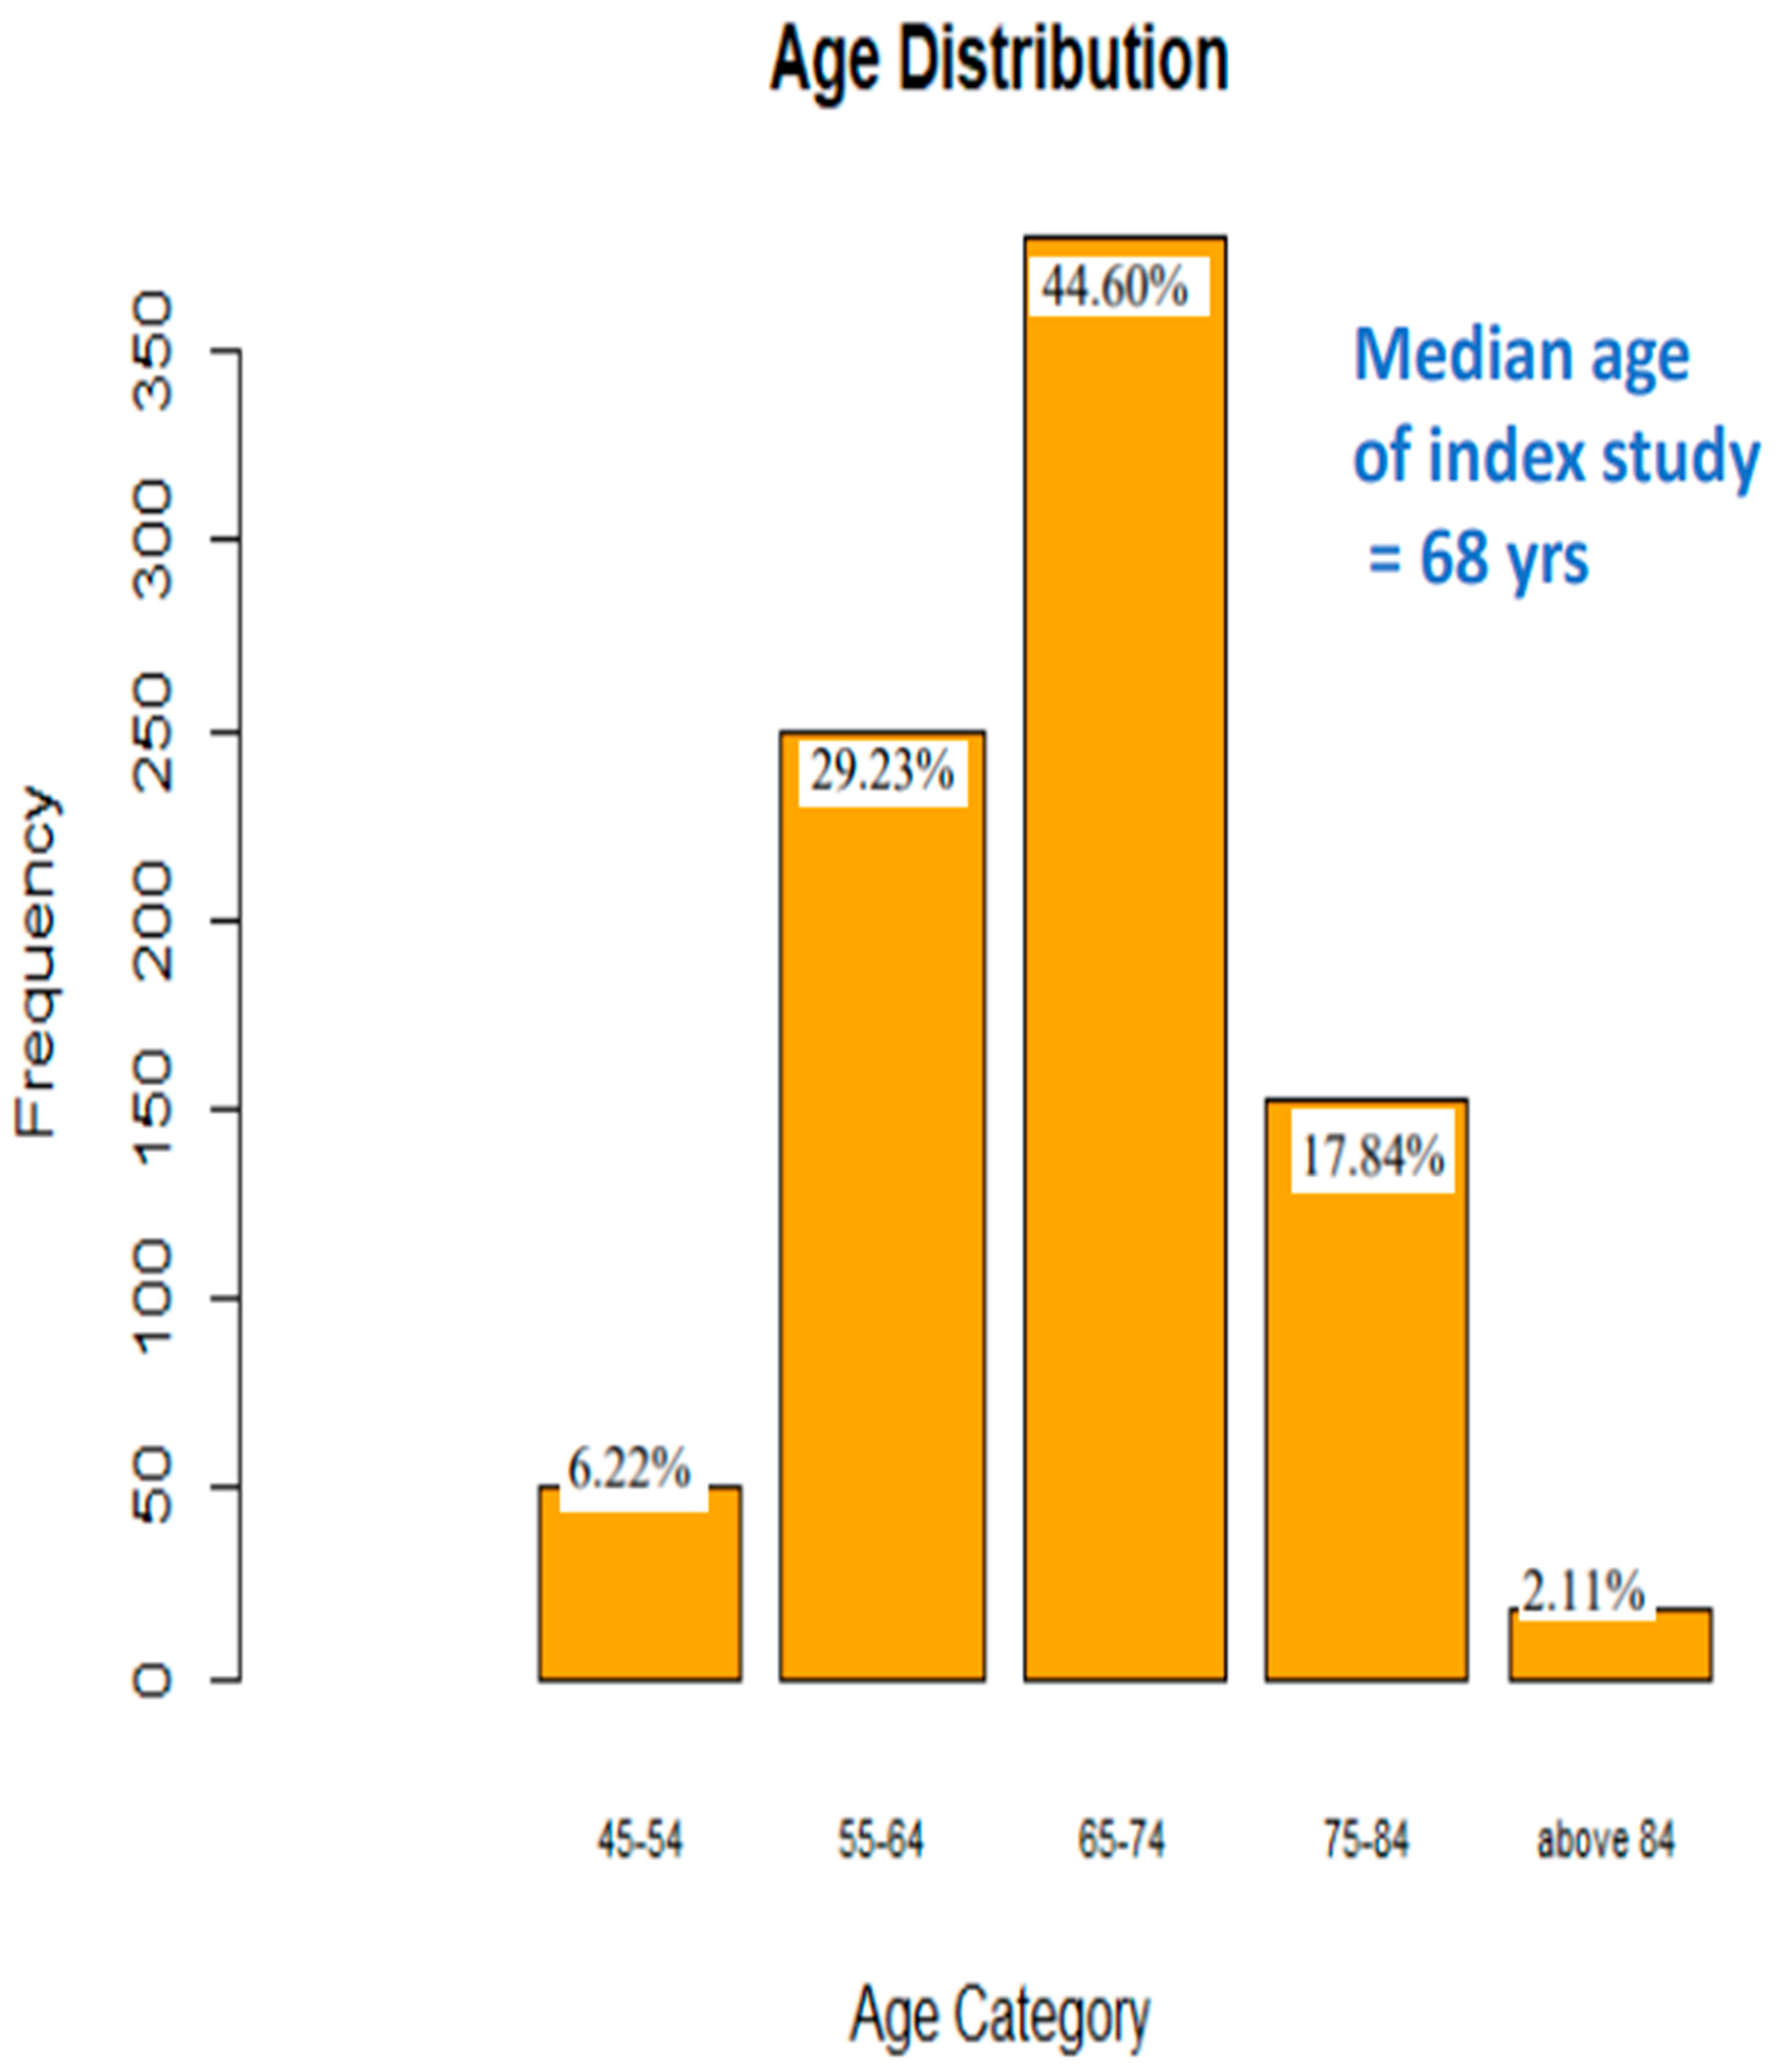
Figure 3.
Distribution of The Ethnicity of Study Group (N=852).
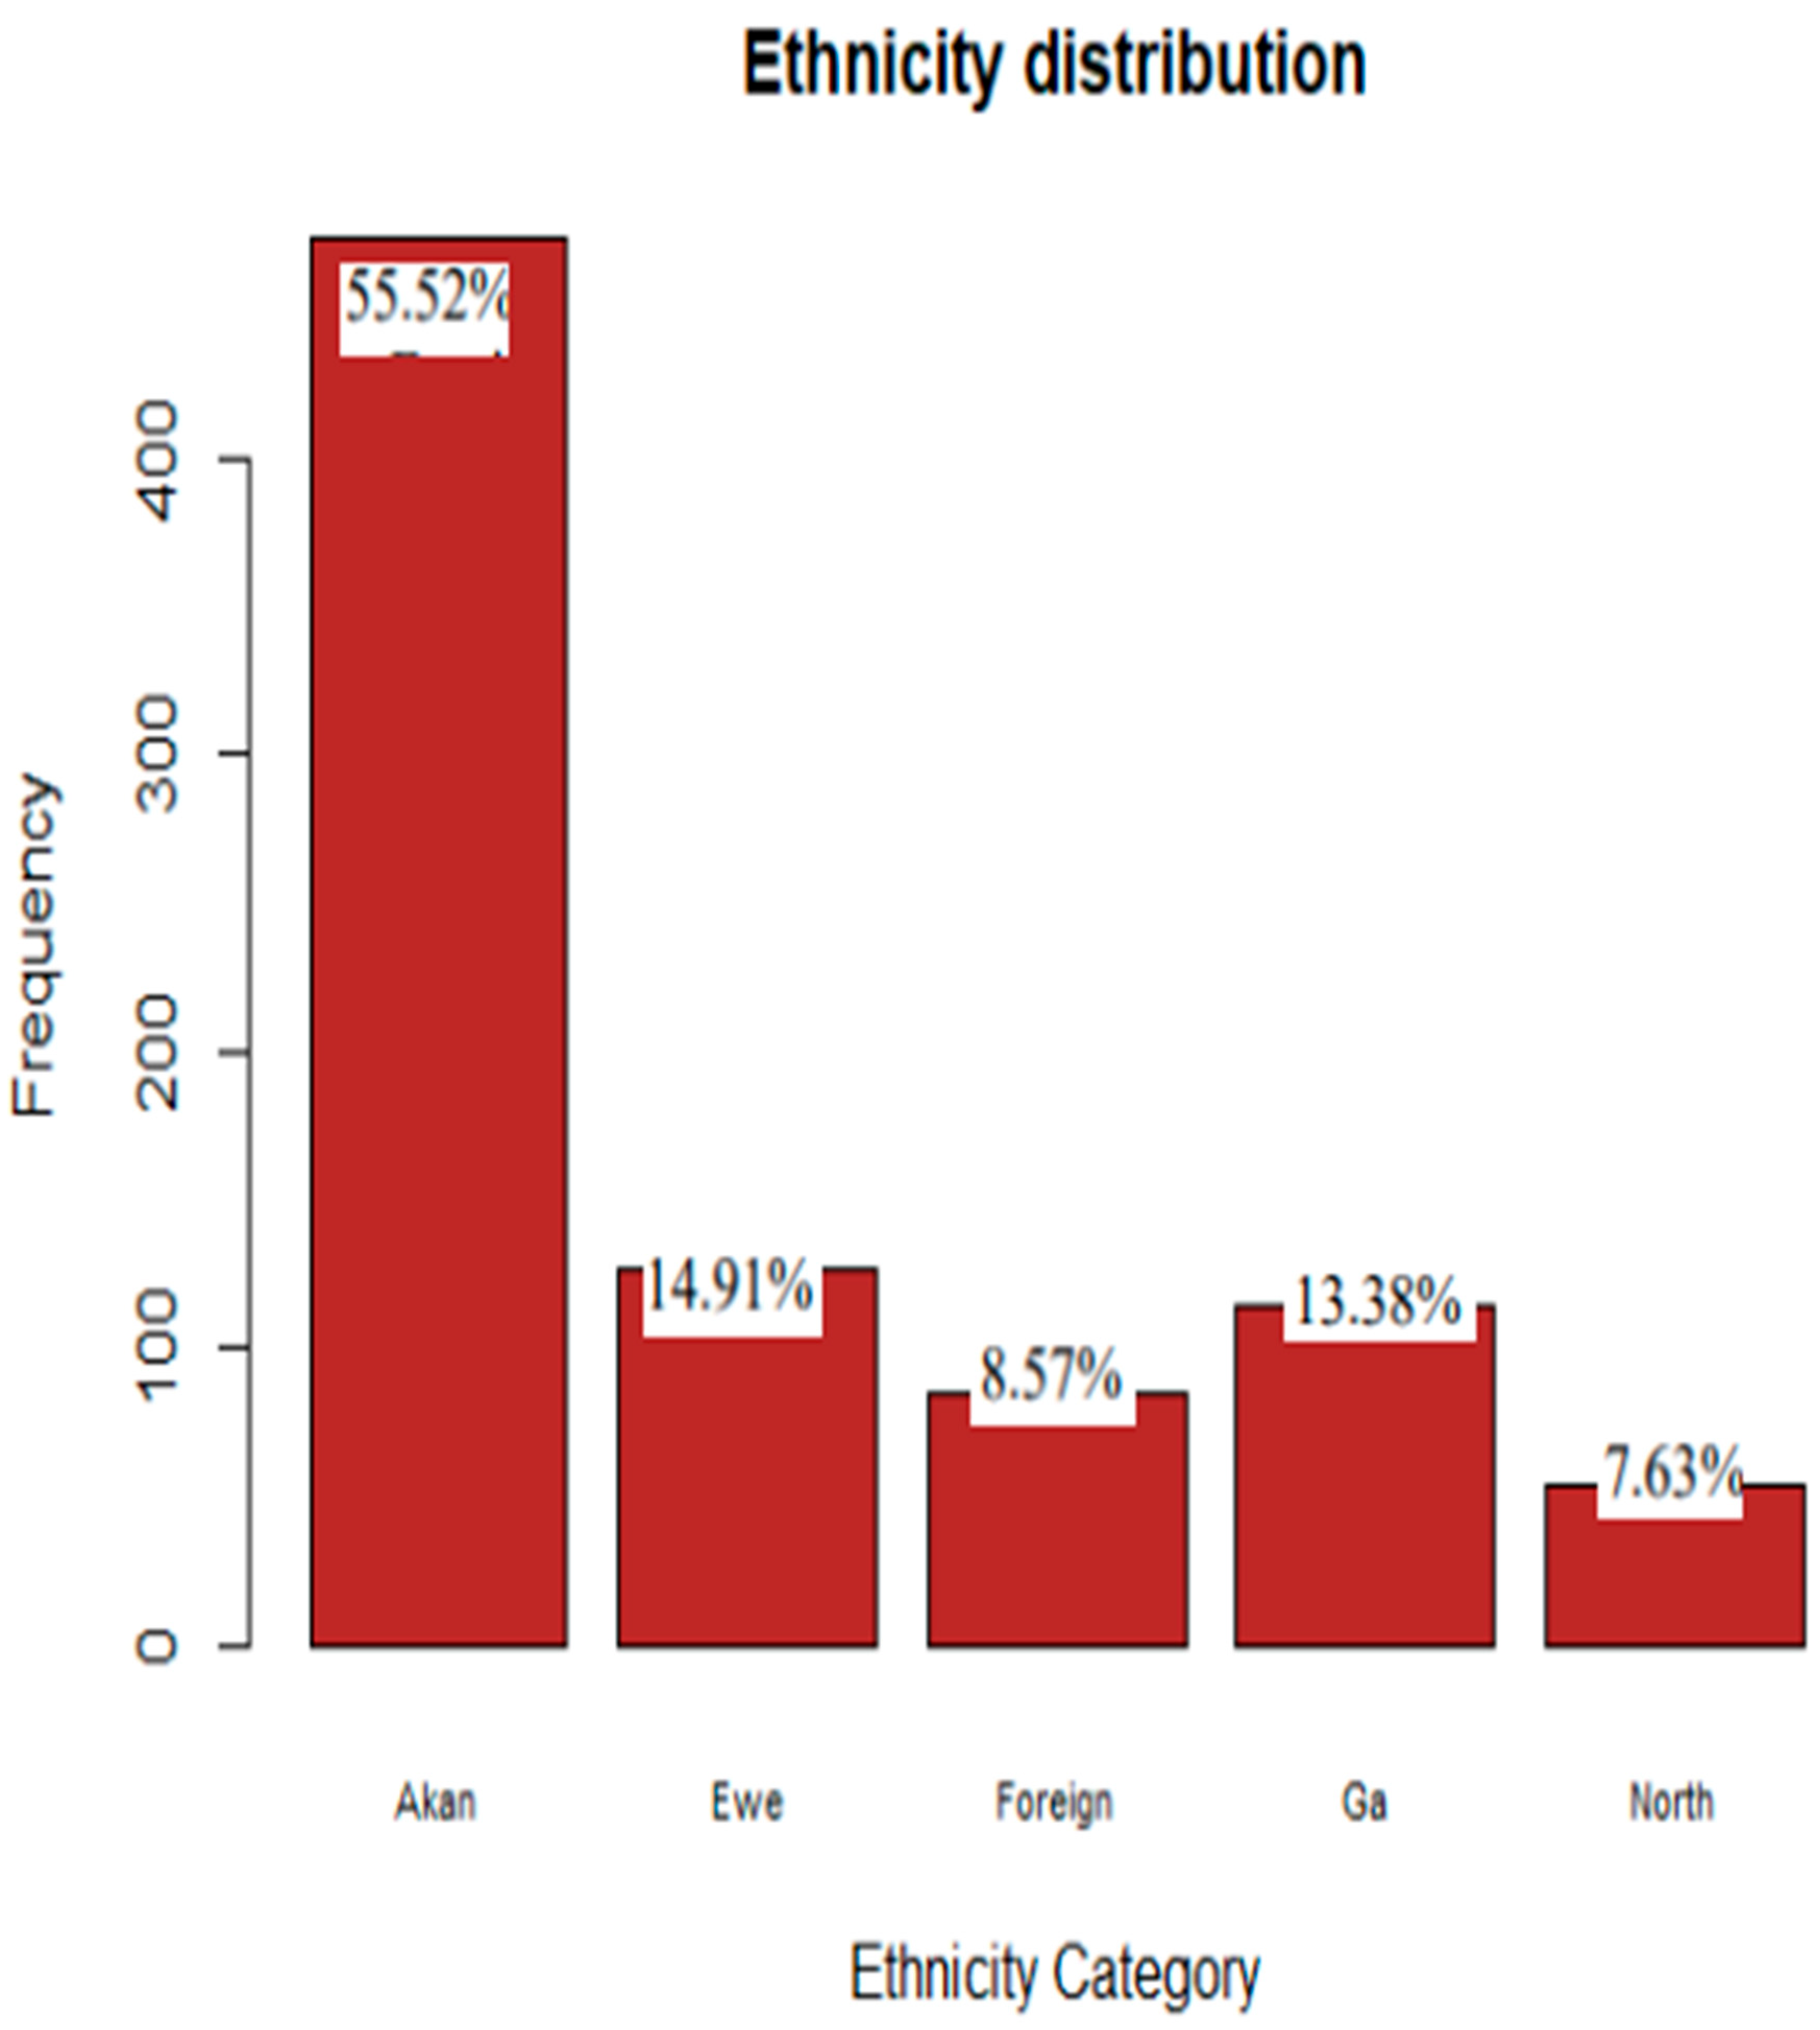
Figure 4.
Marital Status Distribution (N=852).
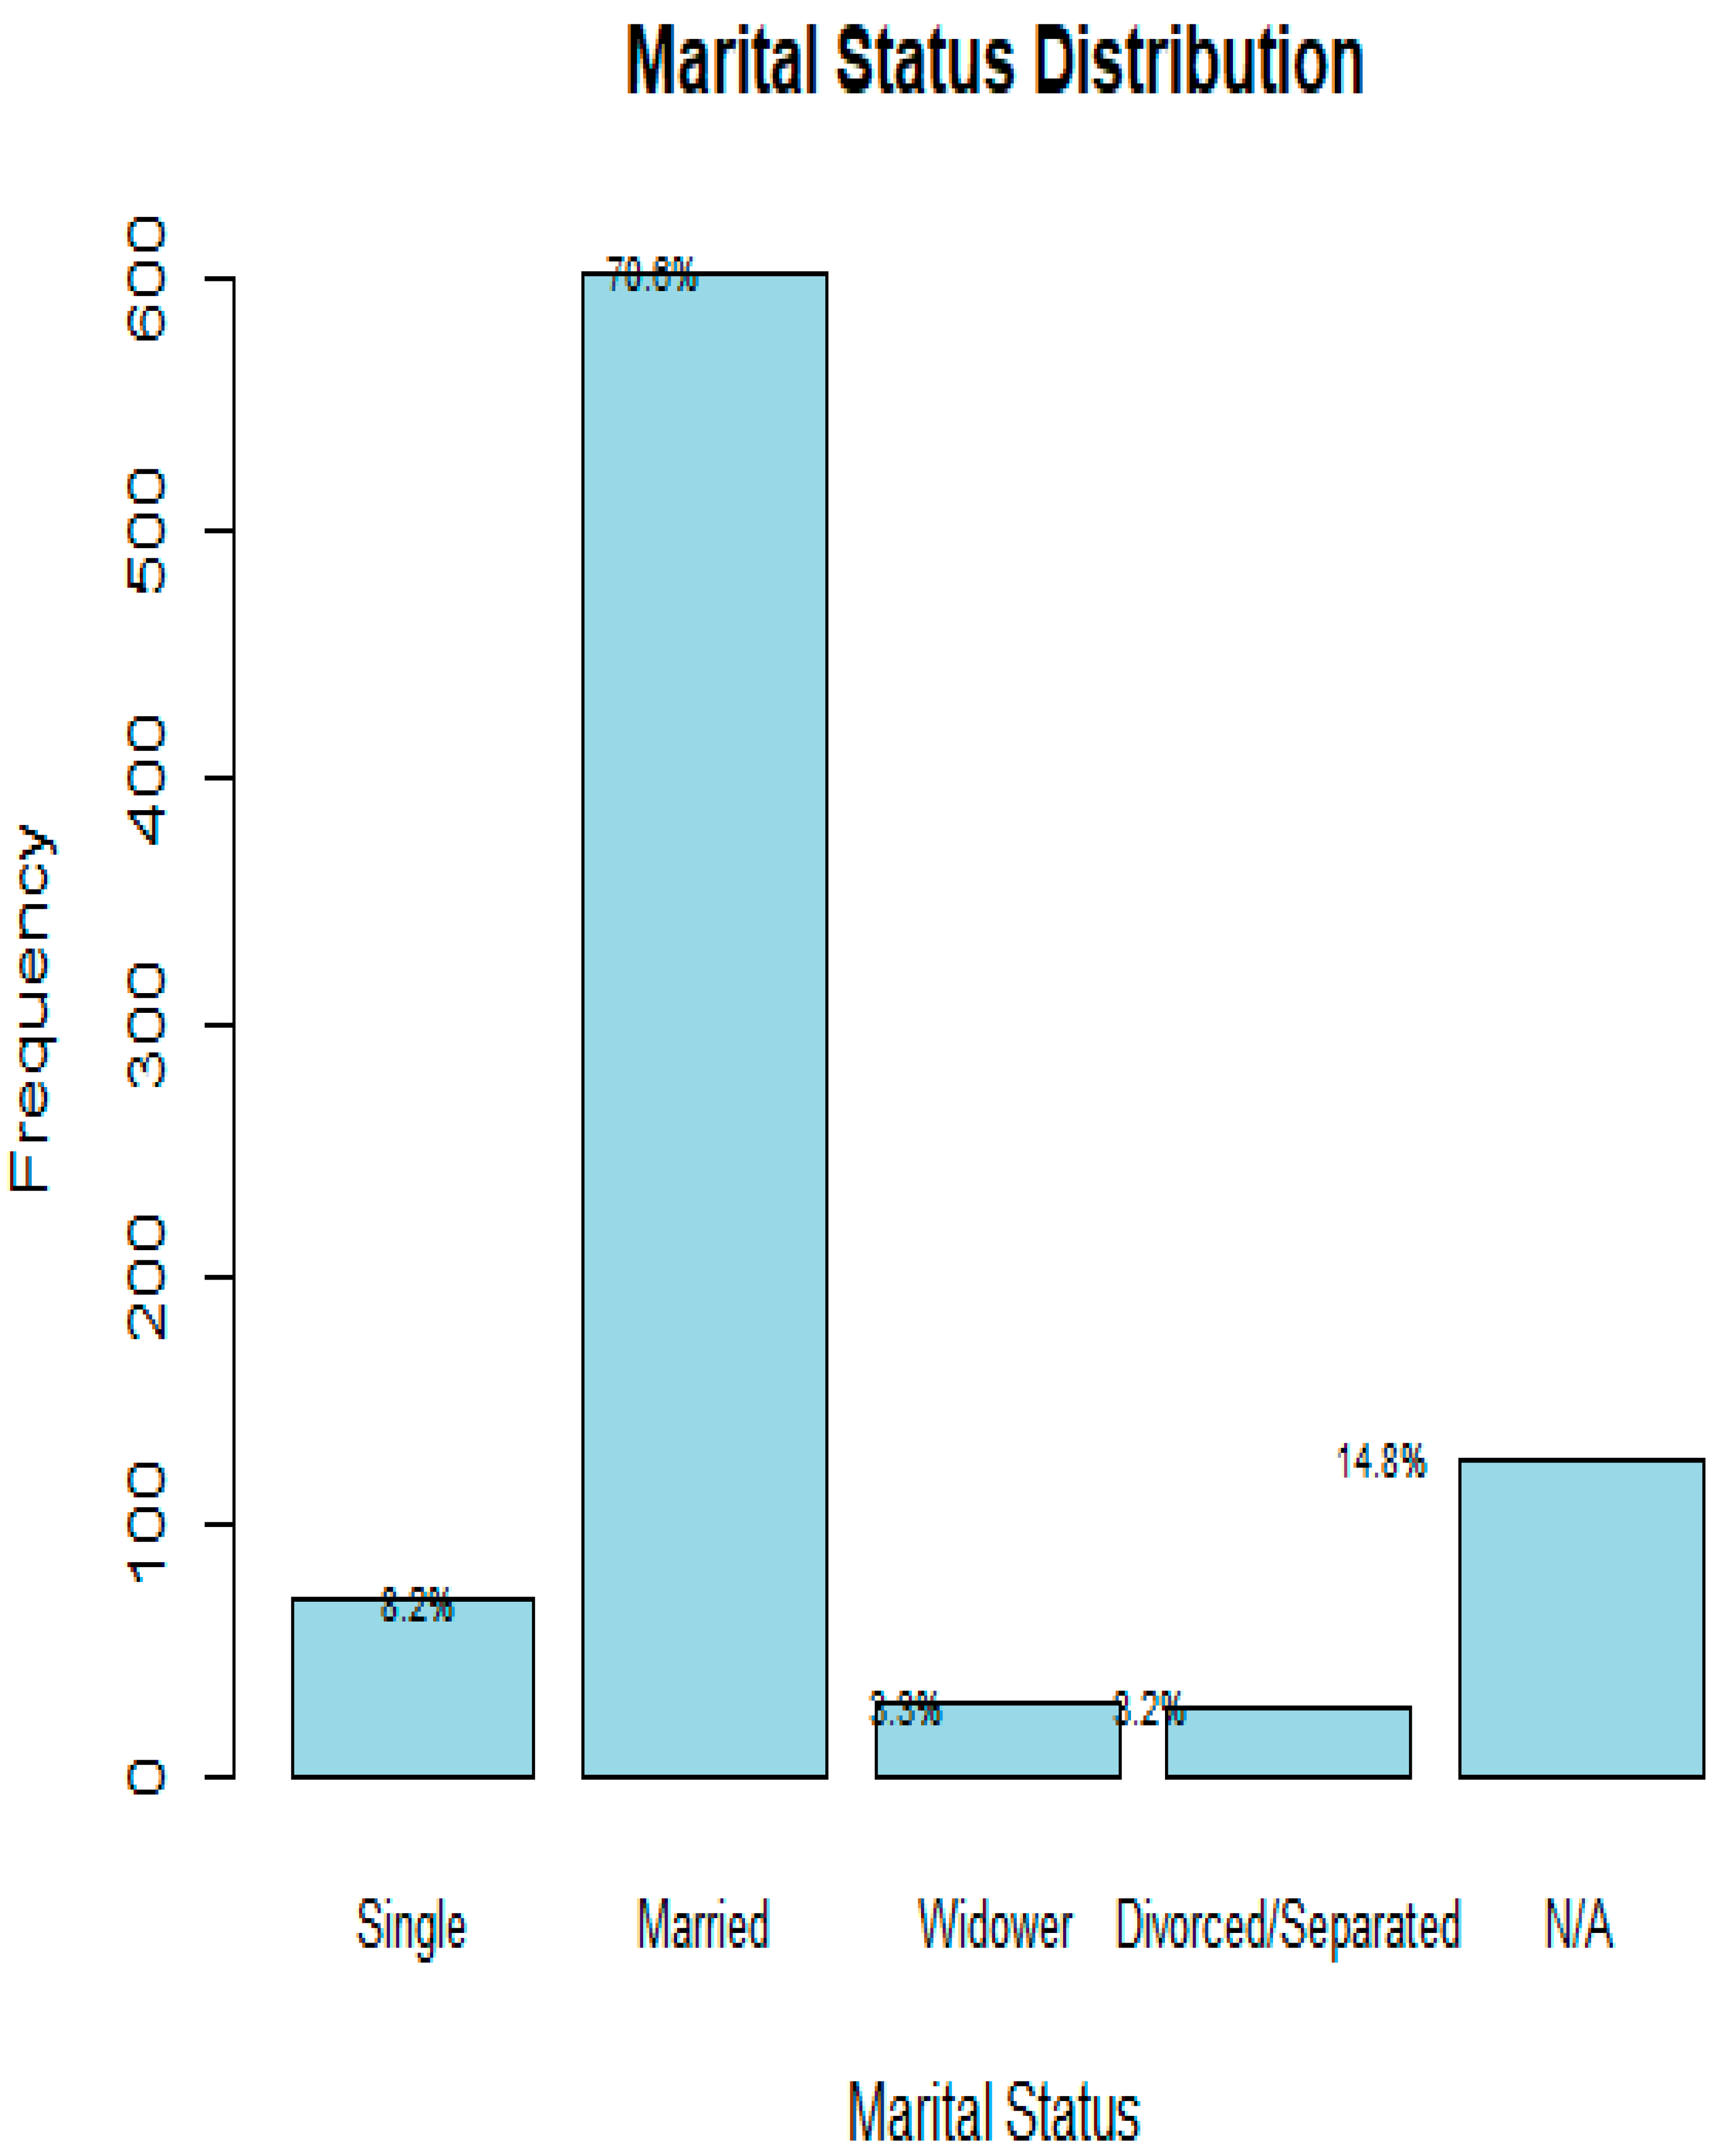
Figure 6.
A Normal Quantile Plot Showing The SGMC, prostate cancer case-trends, 2011 to 2023 (N=852).
Figure 6.
A Normal Quantile Plot Showing The SGMC, prostate cancer case-trends, 2011 to 2023 (N=852).
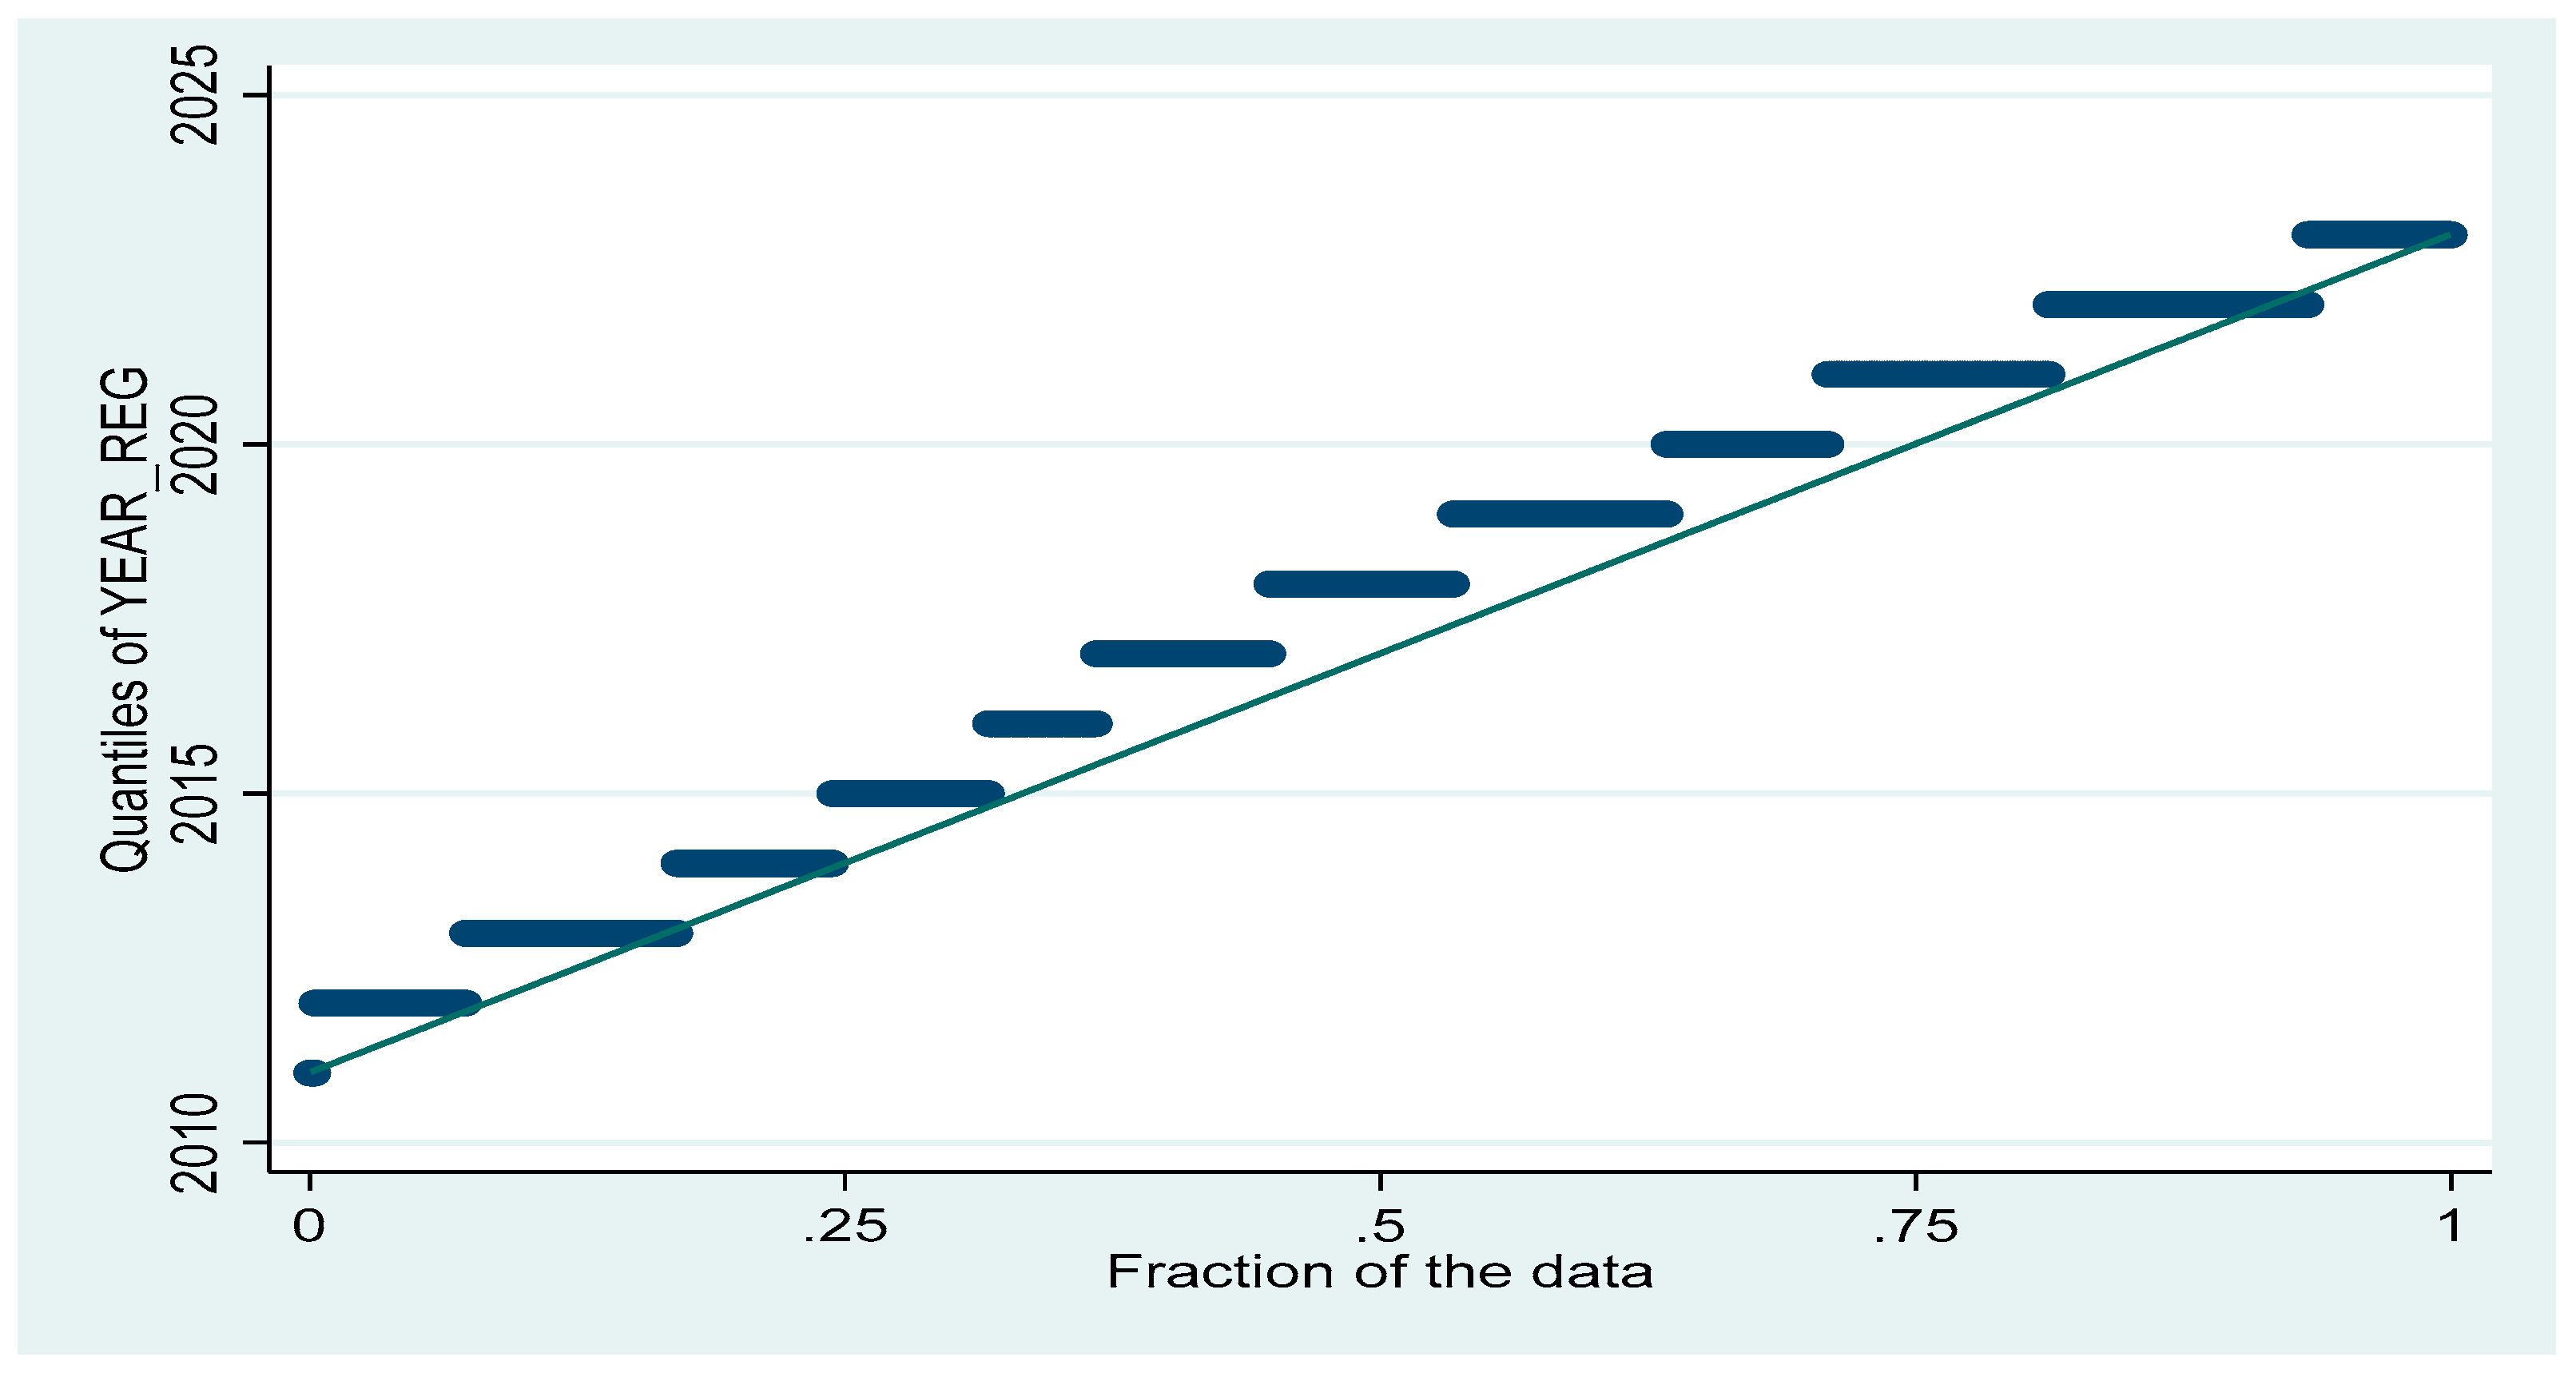
Figure 7.
A Density – Distribution Sunflower Plots for Time-Trends Amongst Ethnic Groups over the Study Period (N=852). Trends of disease across ethnicities over the same period. Different ethnic codes are represented along the Y-axis. Symbol size and shape denote observation count per category per year. NB: The darker the petal and the more the spokes/ radiates, the larger the number of observations in it.
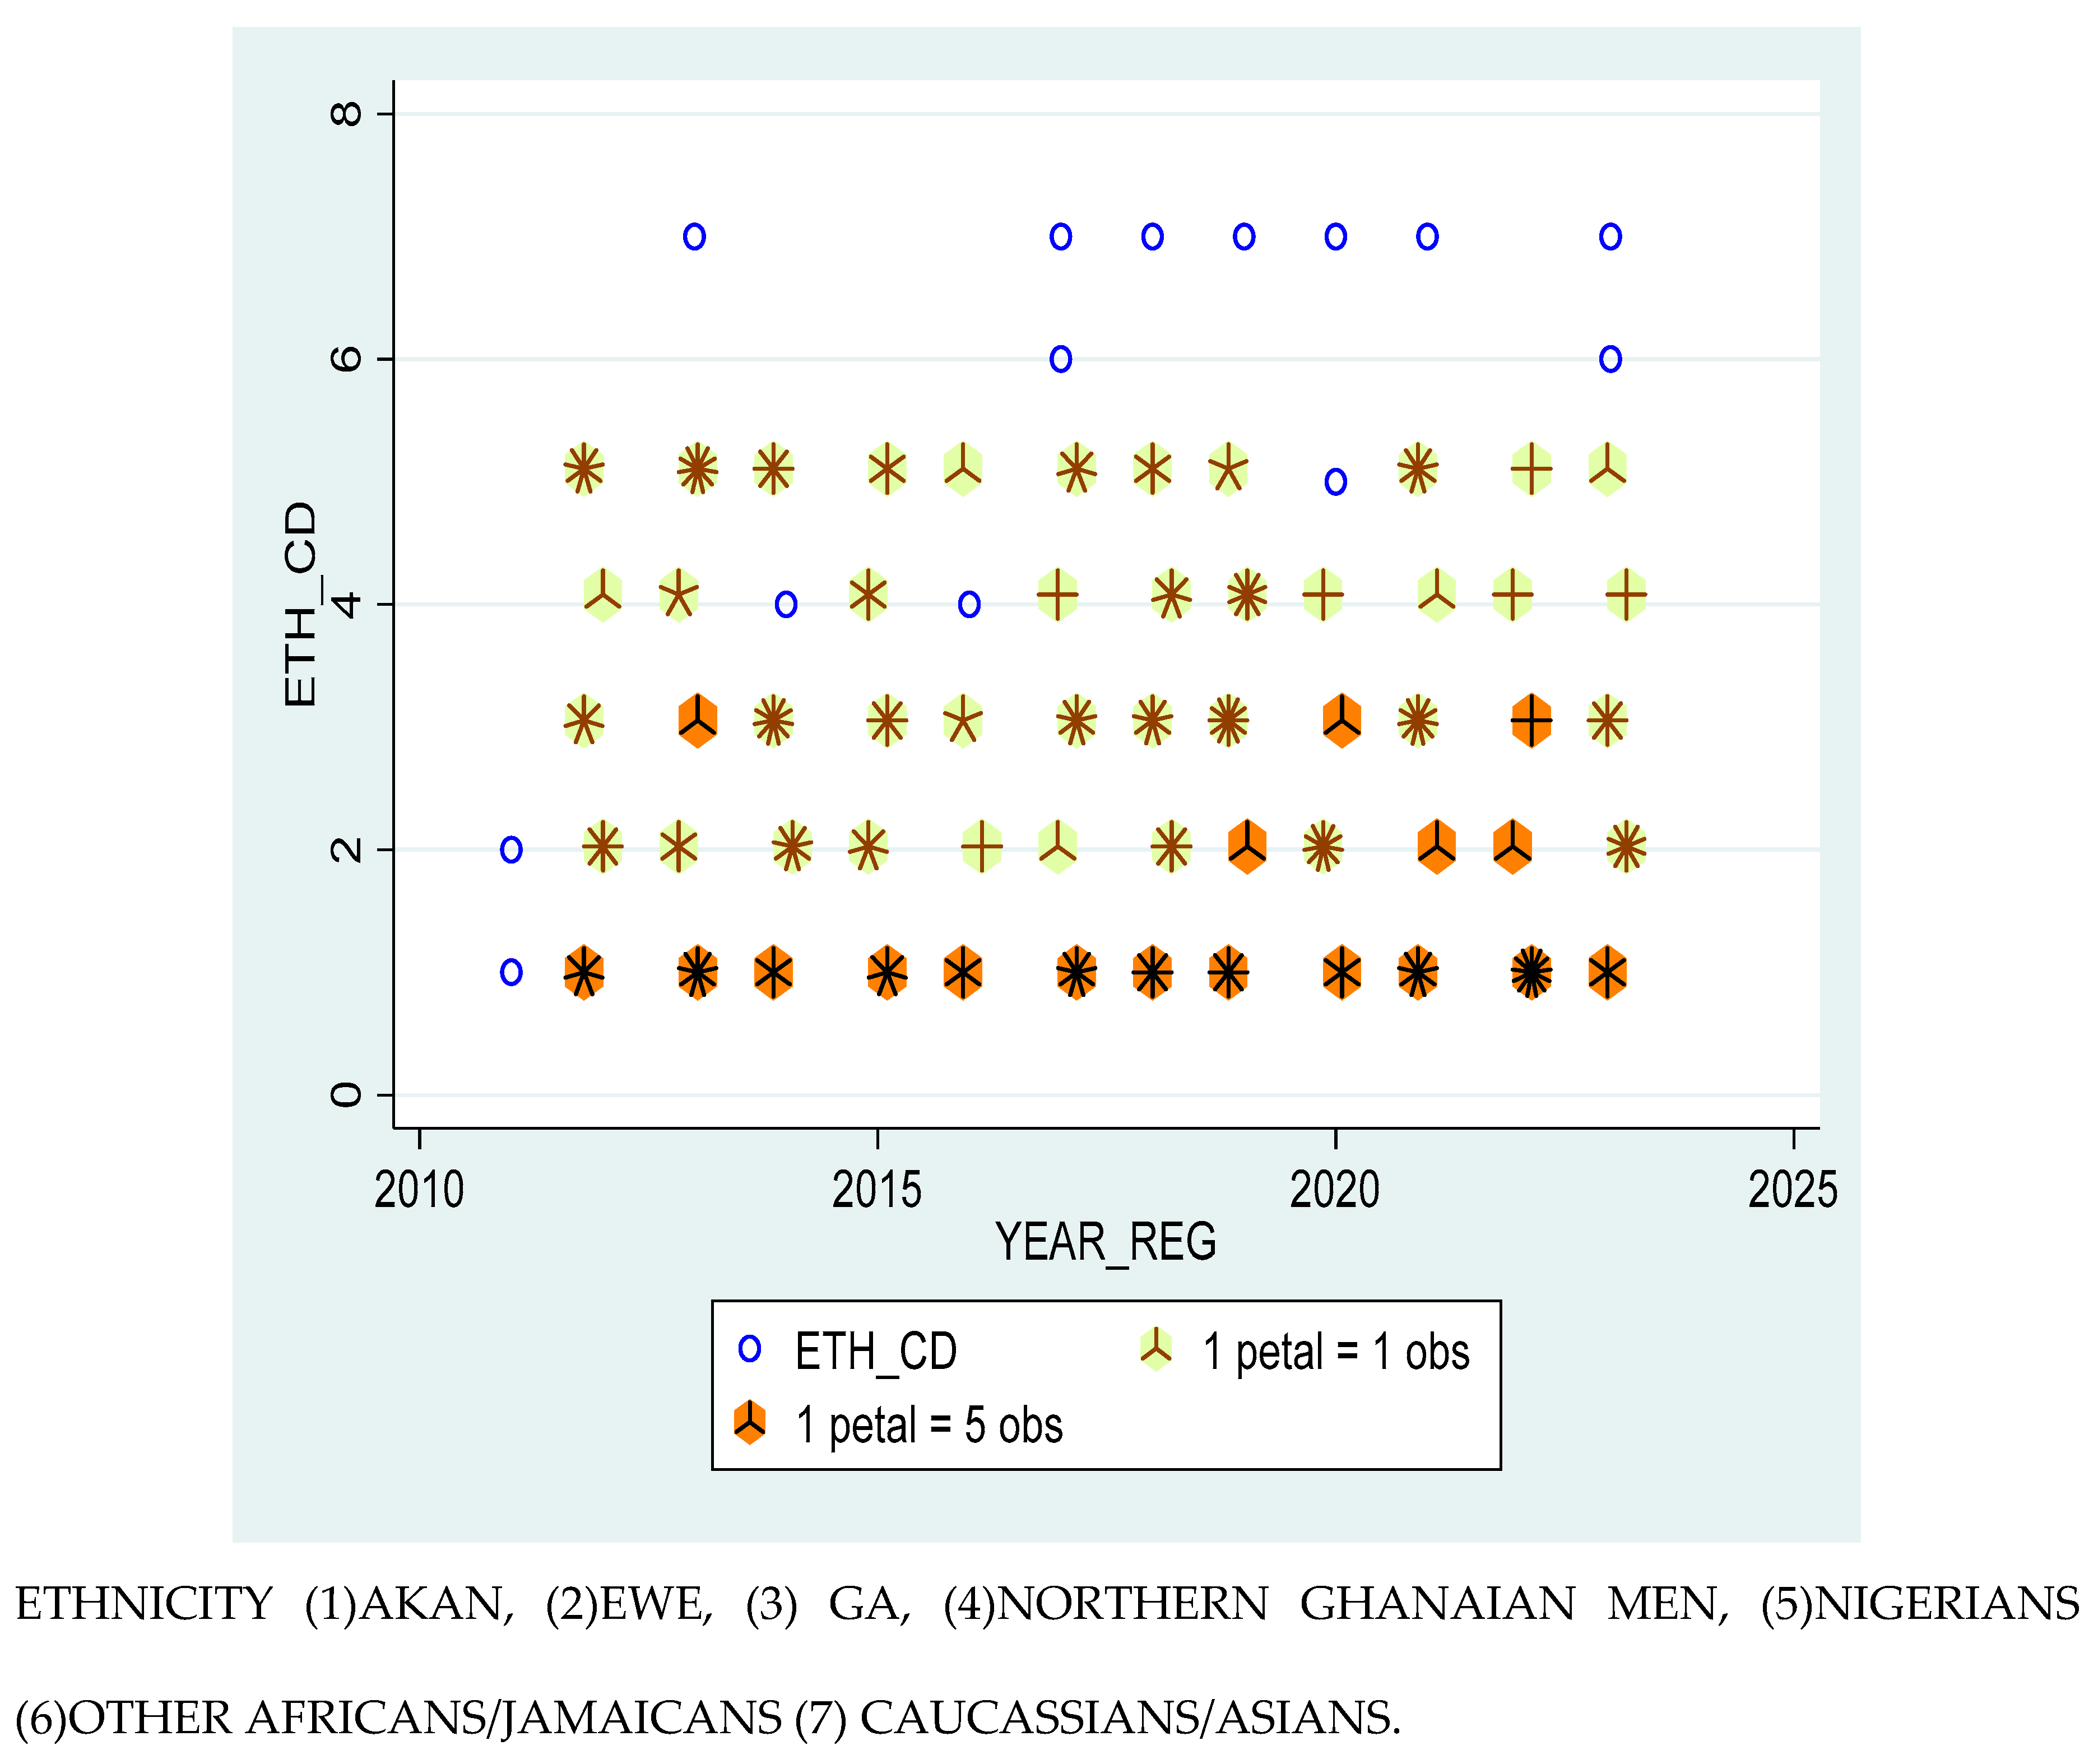
Figure 8.
A Density- Distributional Sunflower Plot showing Time-Trends for Prostate Cancer amongst the various Occupational Groups (N=852)ใ NB: The darker the petal and the more the spokes/ radiates, the larger the number of observations in it.
Figure 8.
A Density- Distributional Sunflower Plot showing Time-Trends for Prostate Cancer amongst the various Occupational Groups (N=852)ใ NB: The darker the petal and the more the spokes/ radiates, the larger the number of observations in it.
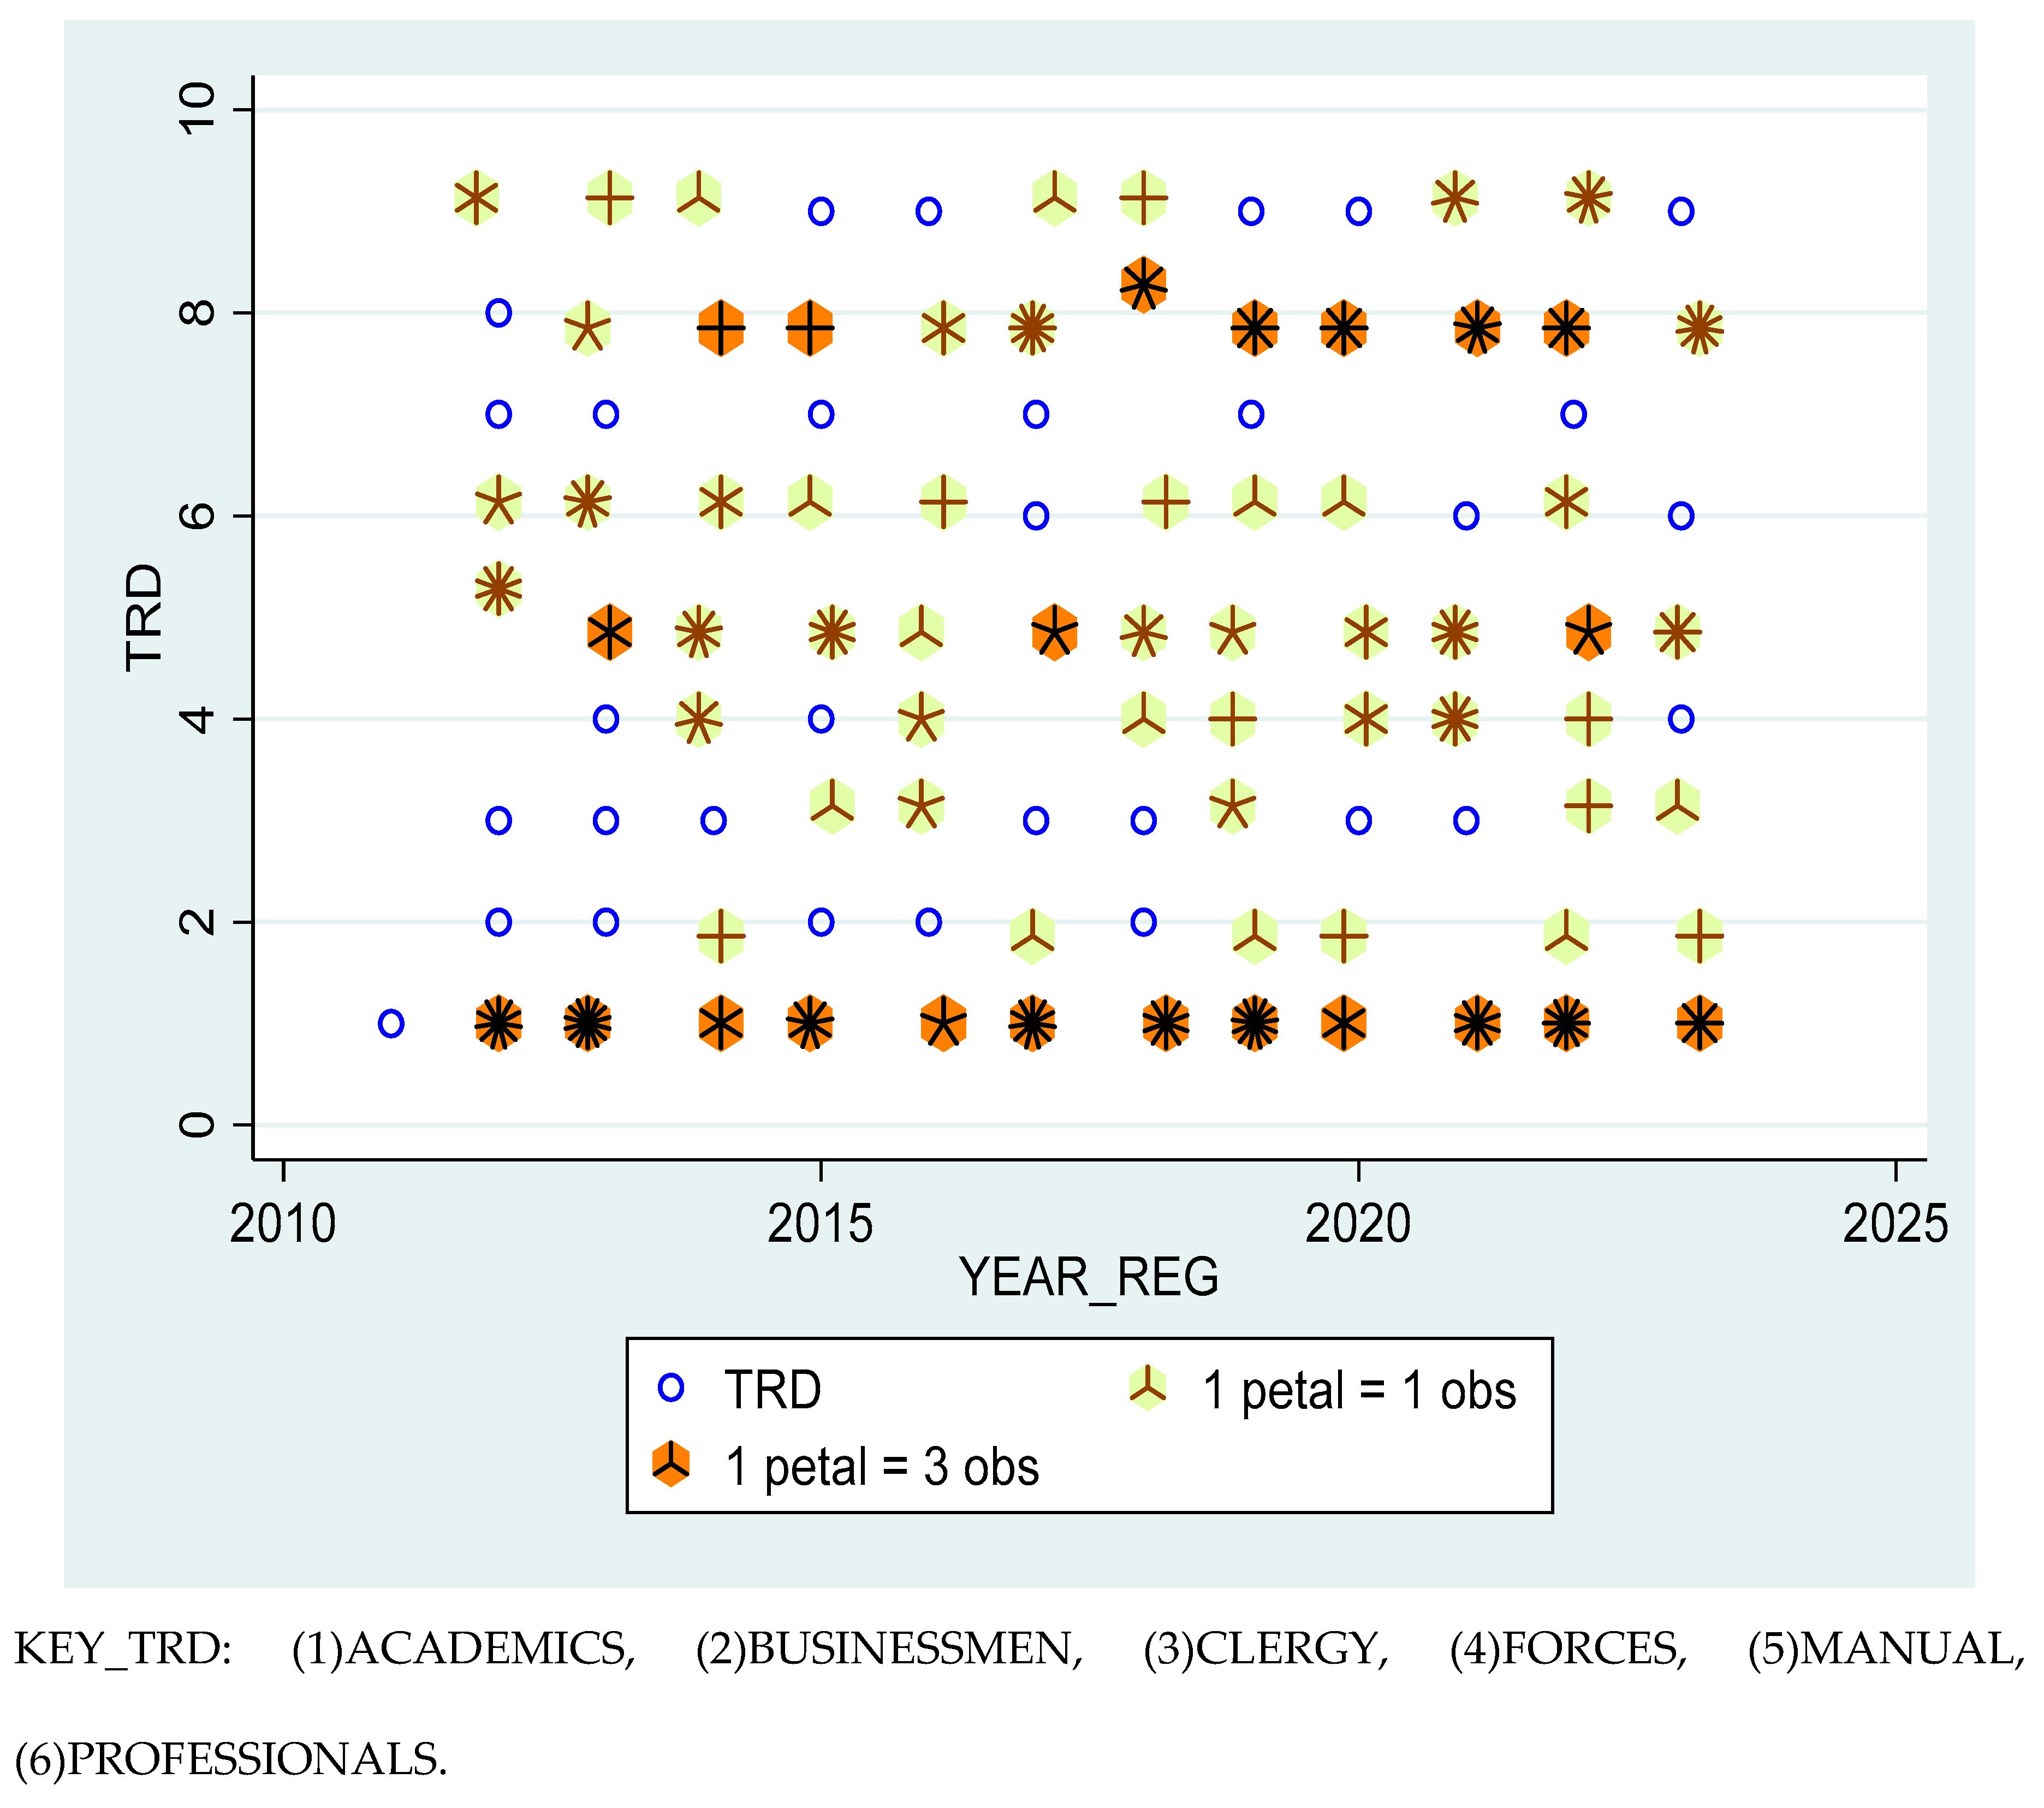
Figure 9.
Density- Distributional Sunflower Plot showing Time-Trends for Metastasised and Non-Metastasised Prostate Cancer cases over the Study Period (N=852). Trends in disease severity over the years. Severity was assessed by metastasis code (MET_CD), indicating an increasing burden of advanced-stage disease in recent years. Each petal indicates 1 or 5 observations. NB: The darker the petal and the more the spokes/ radiates, the larger the number of observations in it.
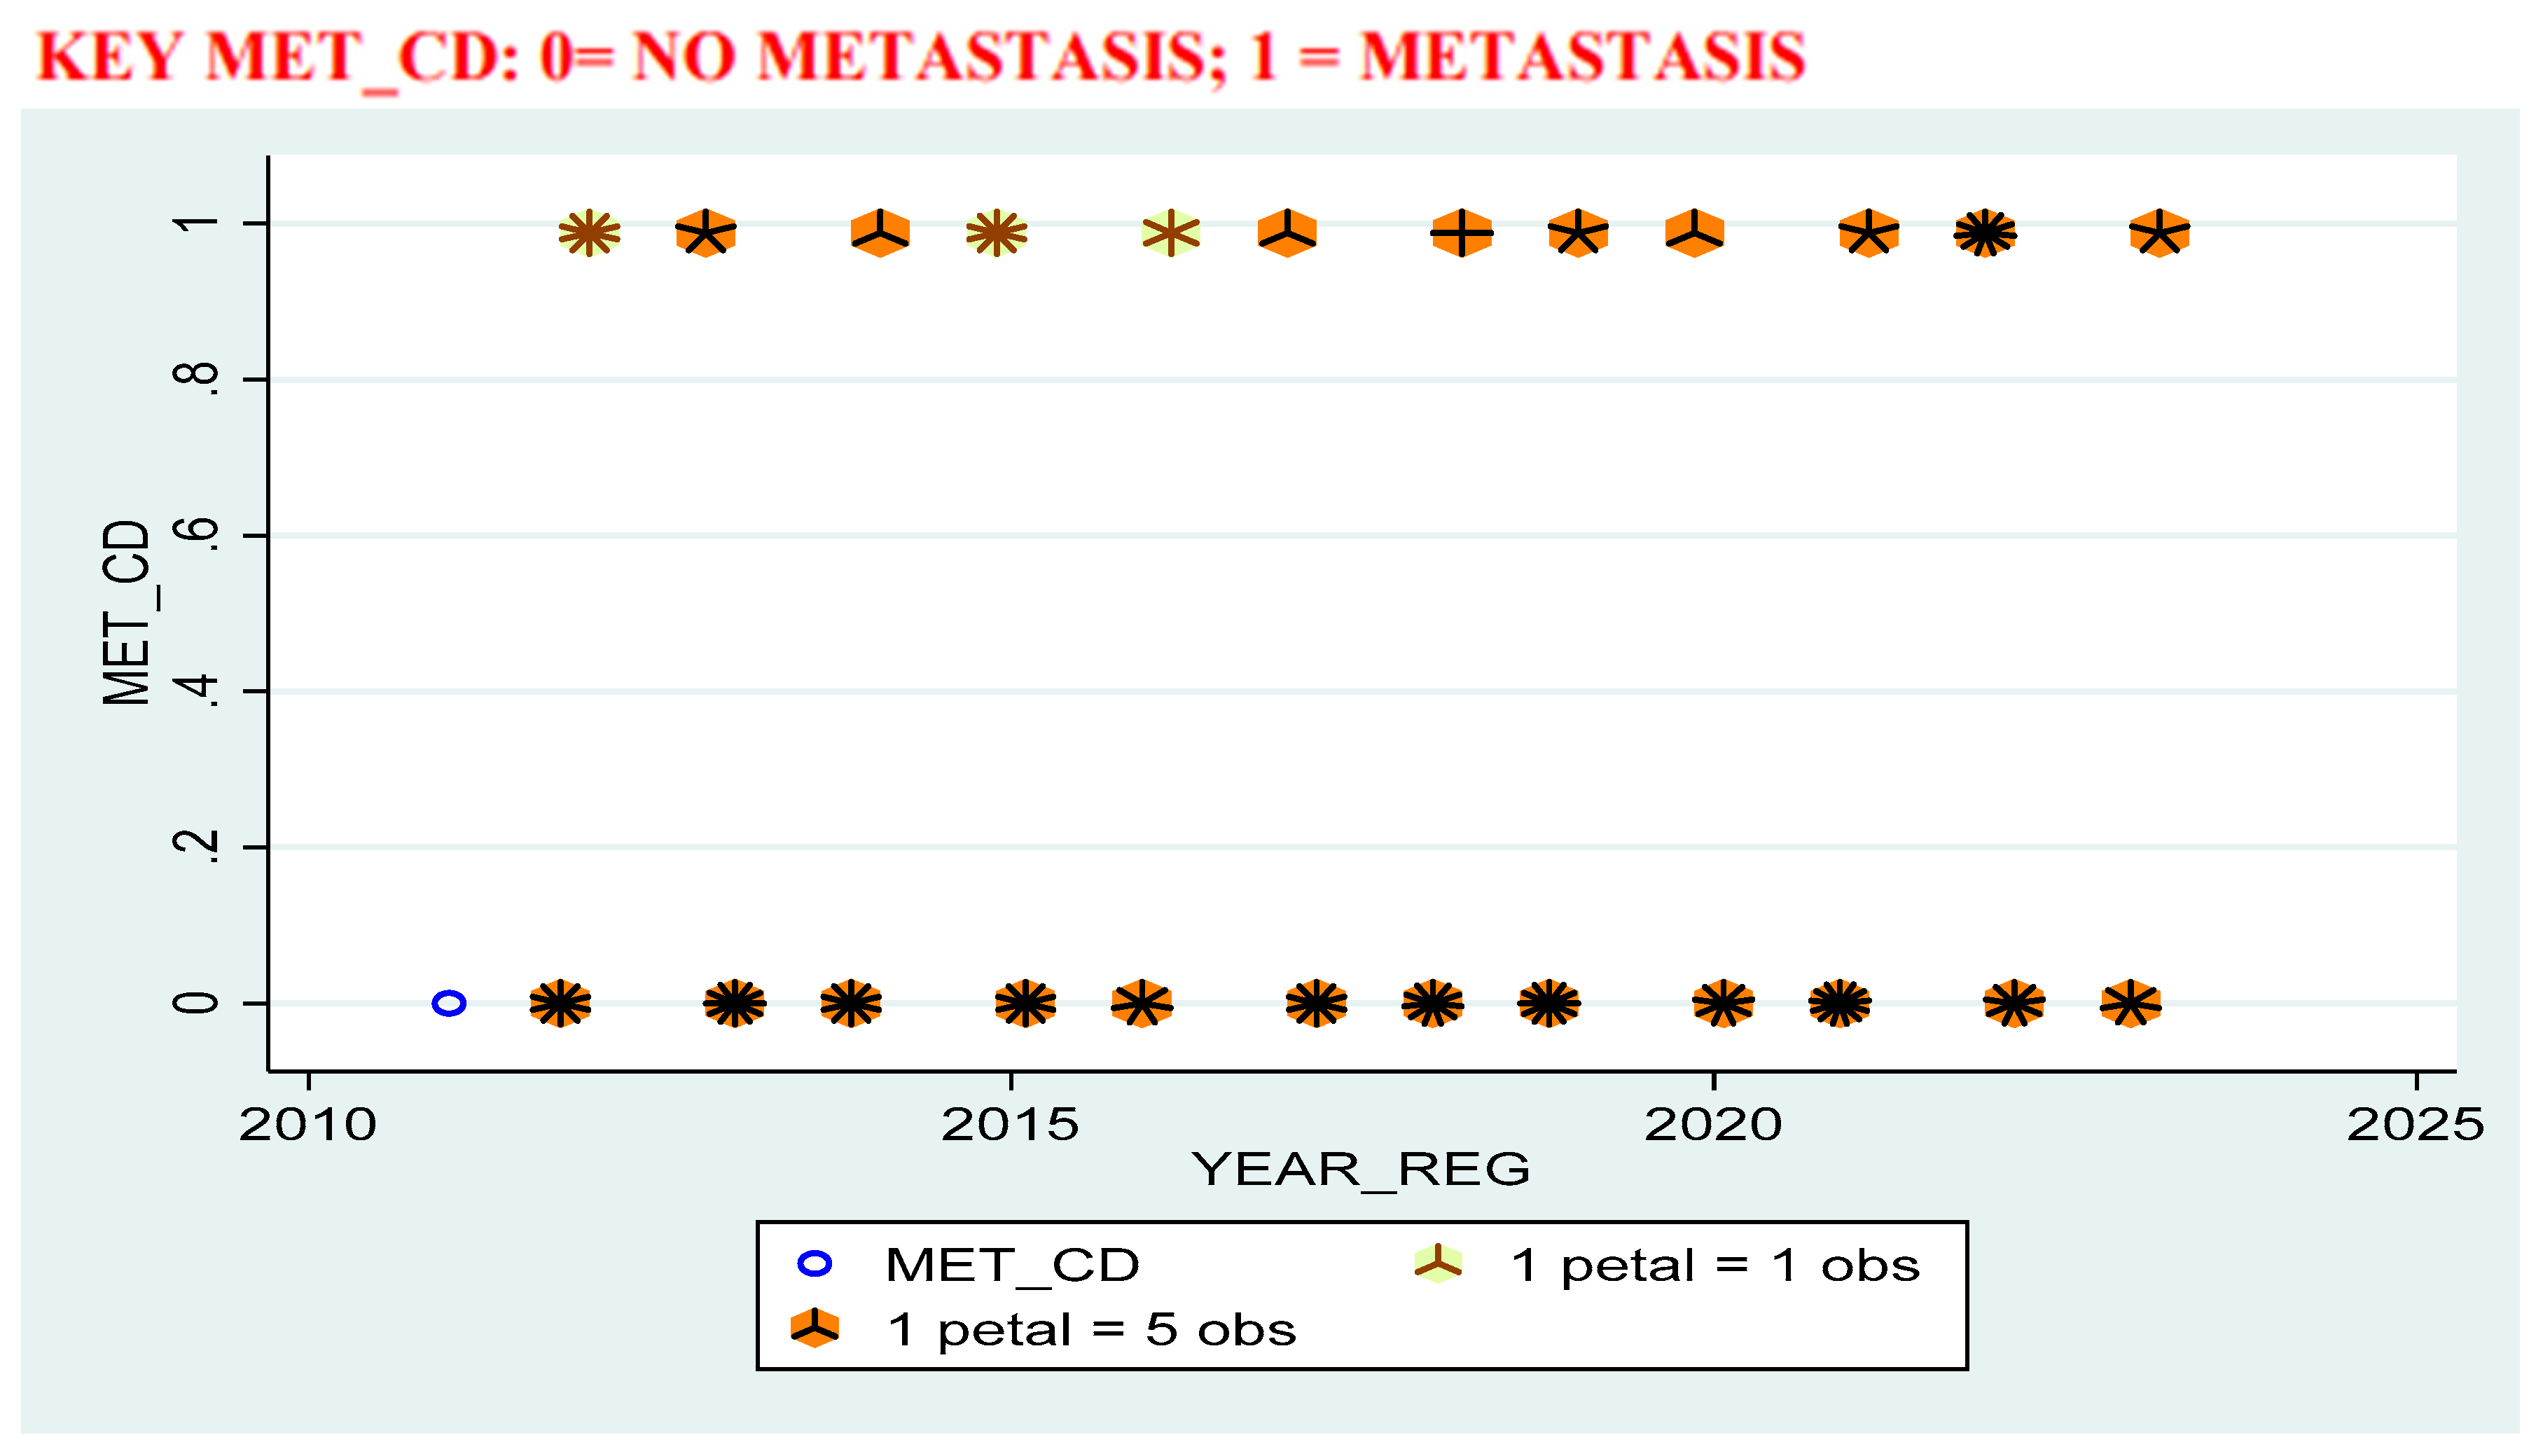
Figure 10.
Geospatial Analysis: a Geospatial Map from Field Data, Ghana (N=852).
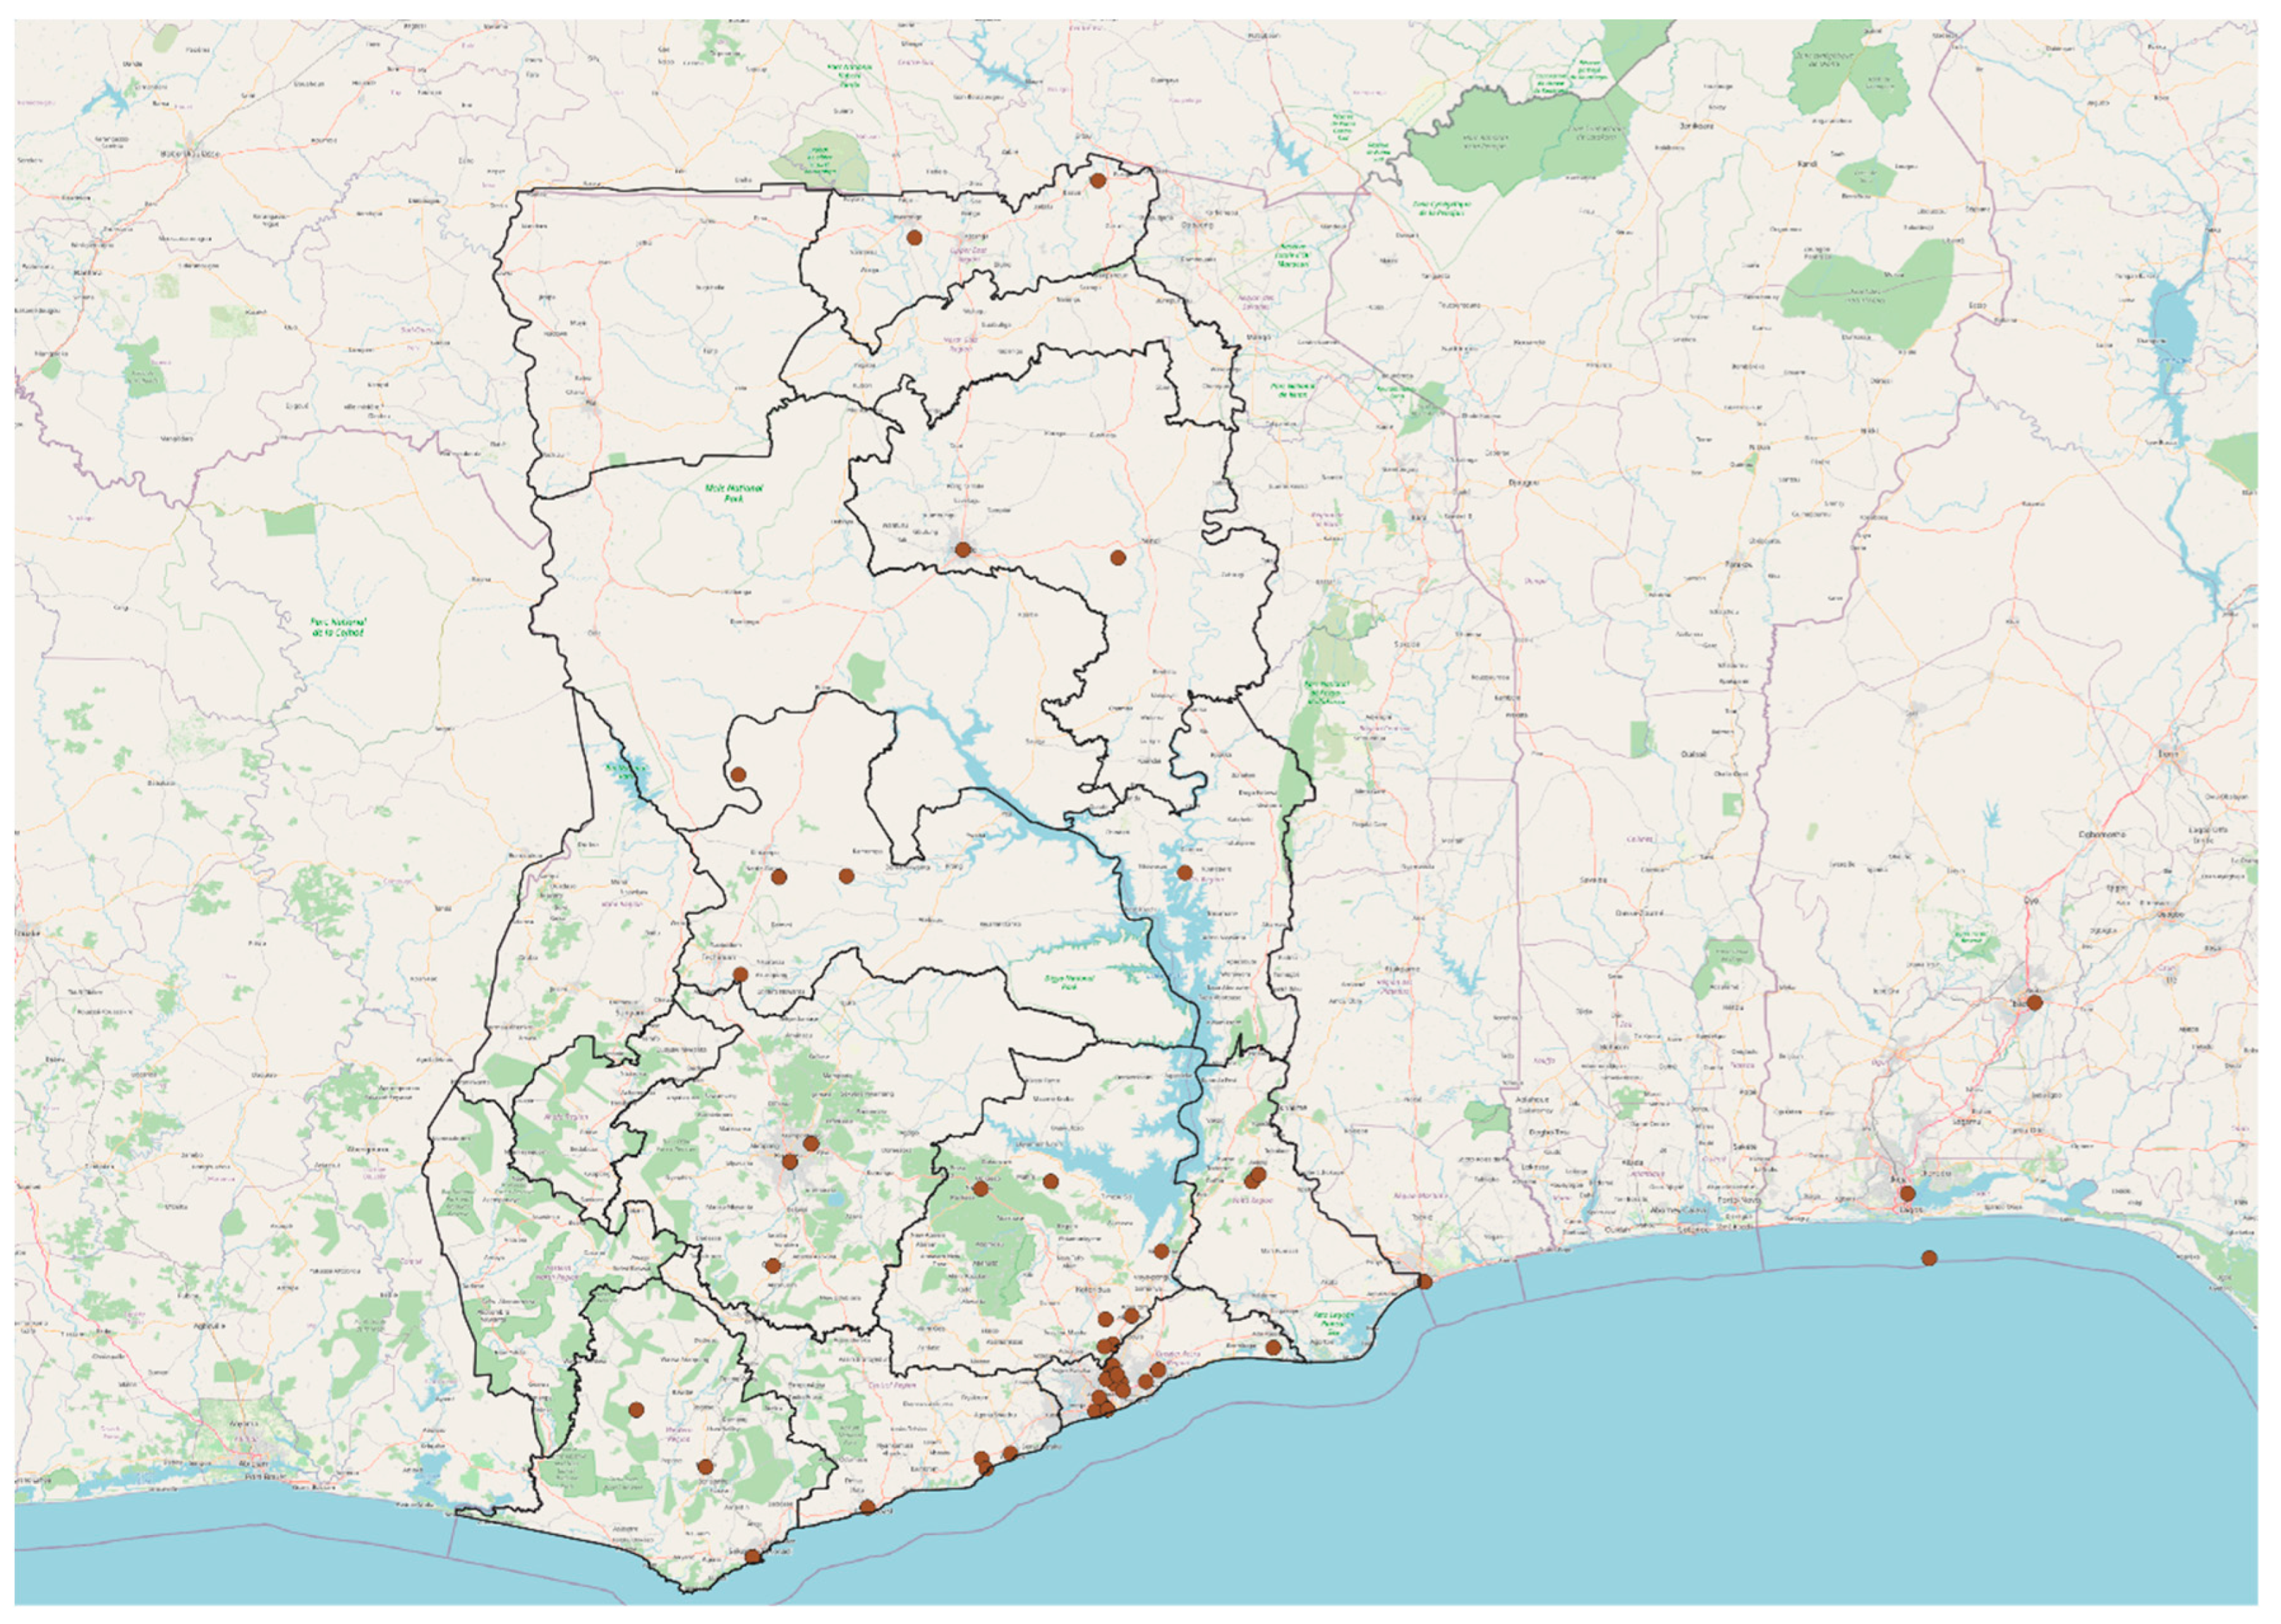
Figure 11.
Geospatial Analysis: a Geospatial Map from Field Data, Africa (N=852). Figure Legend: Mapped distributions (as per the geospatial figures provided) show clustered densities around: Southern Ghana (especially Accra and surrounding districts), The Volta corridor, extending through districts like Ho and Hohoe, A modest spread into central and northern zones, though underrepresented compared to the south.
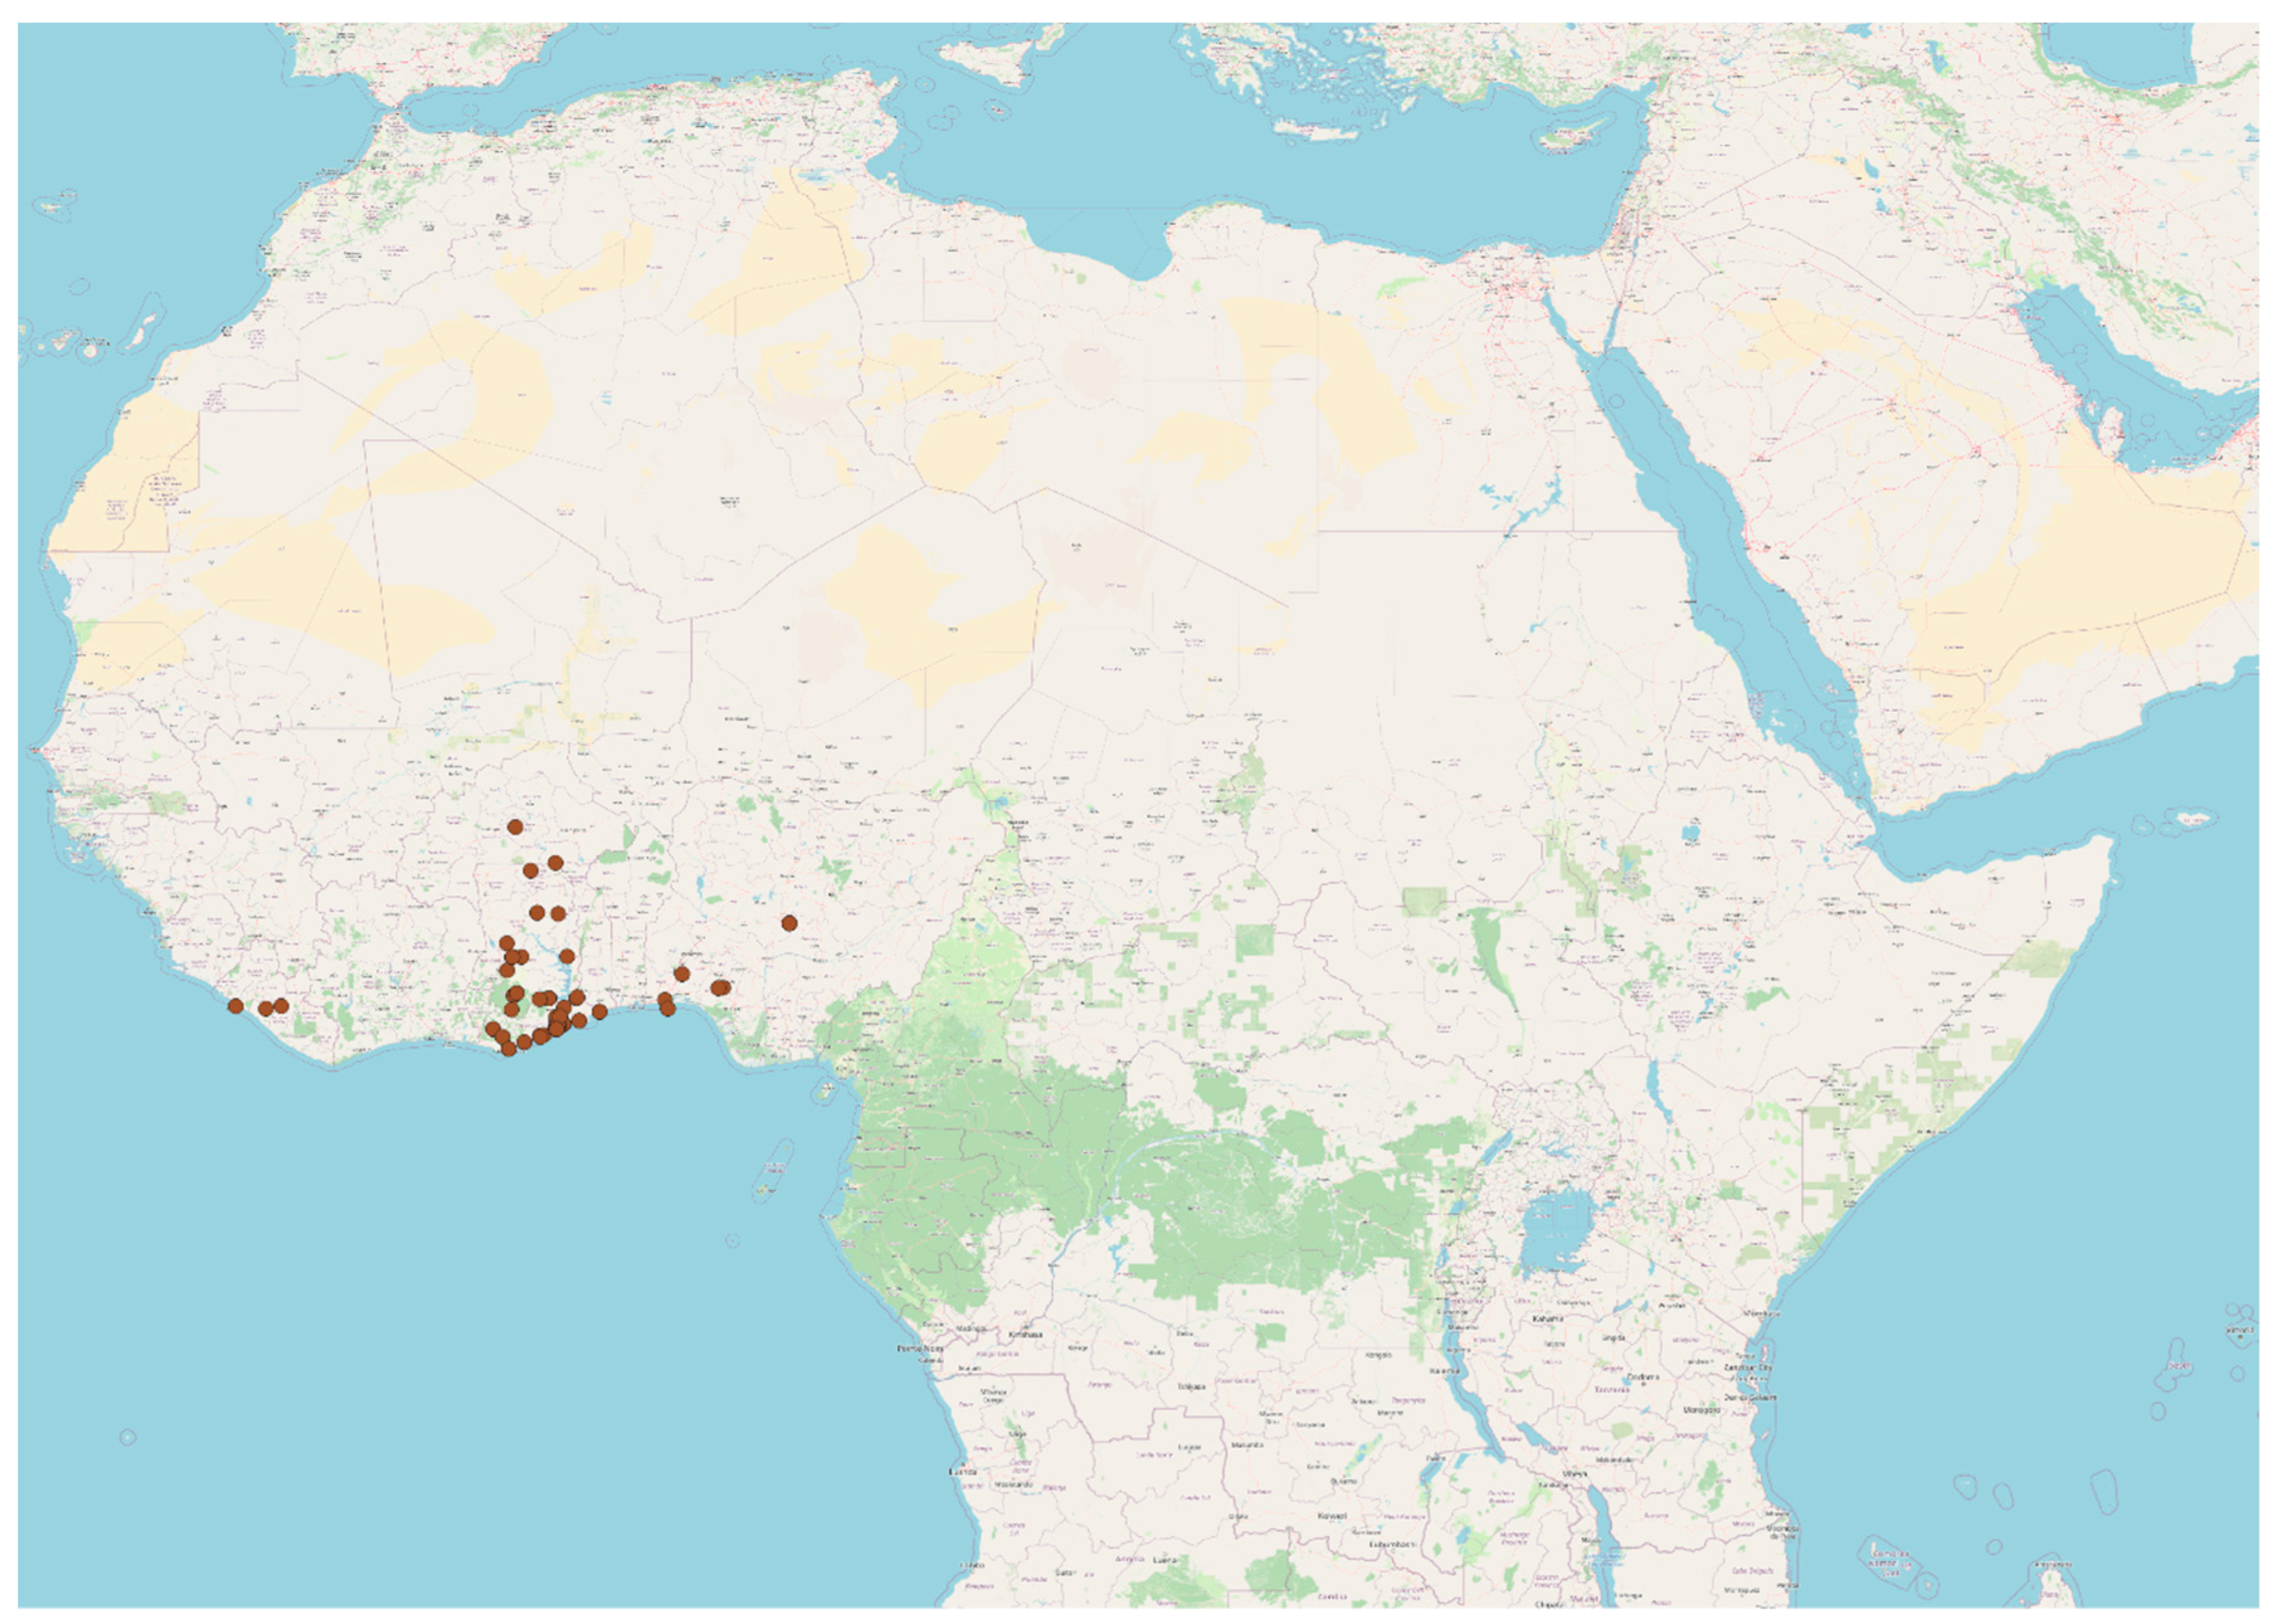
Figure 12.
Family History of Prostate Cancer among Study Group (N=852).
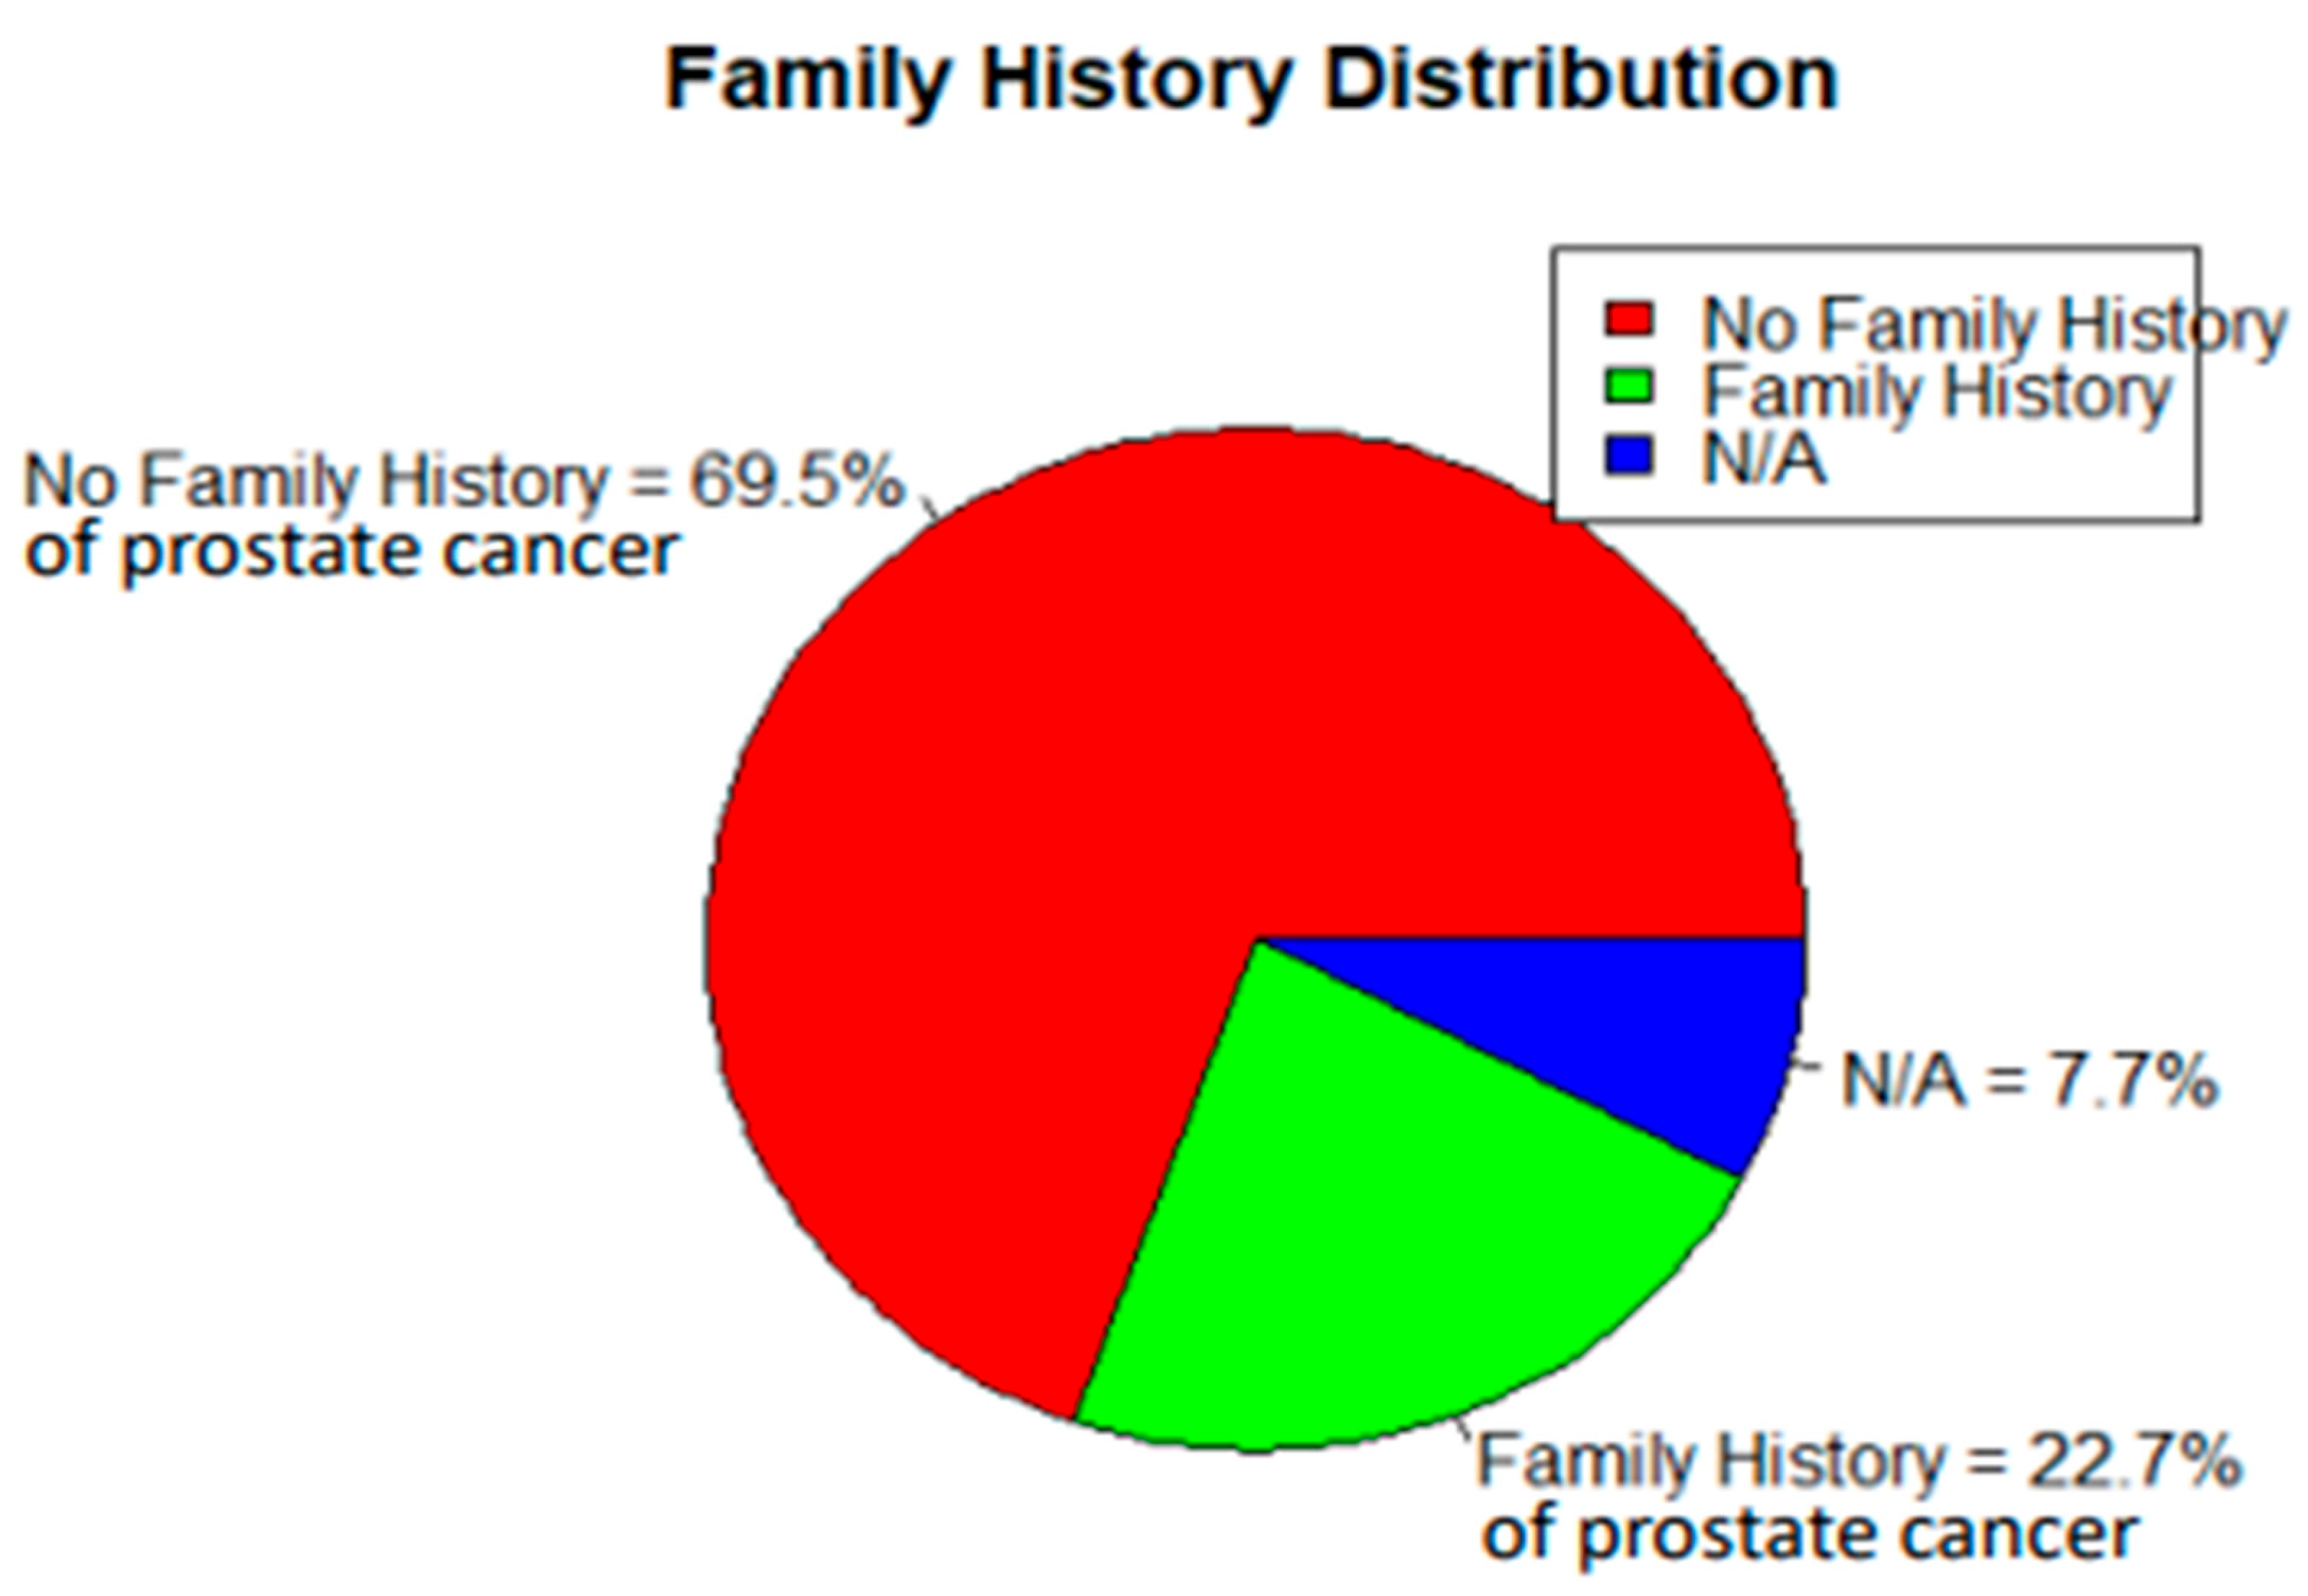
Figure 13.
PSA Risk Stratification of Disease (N=852).
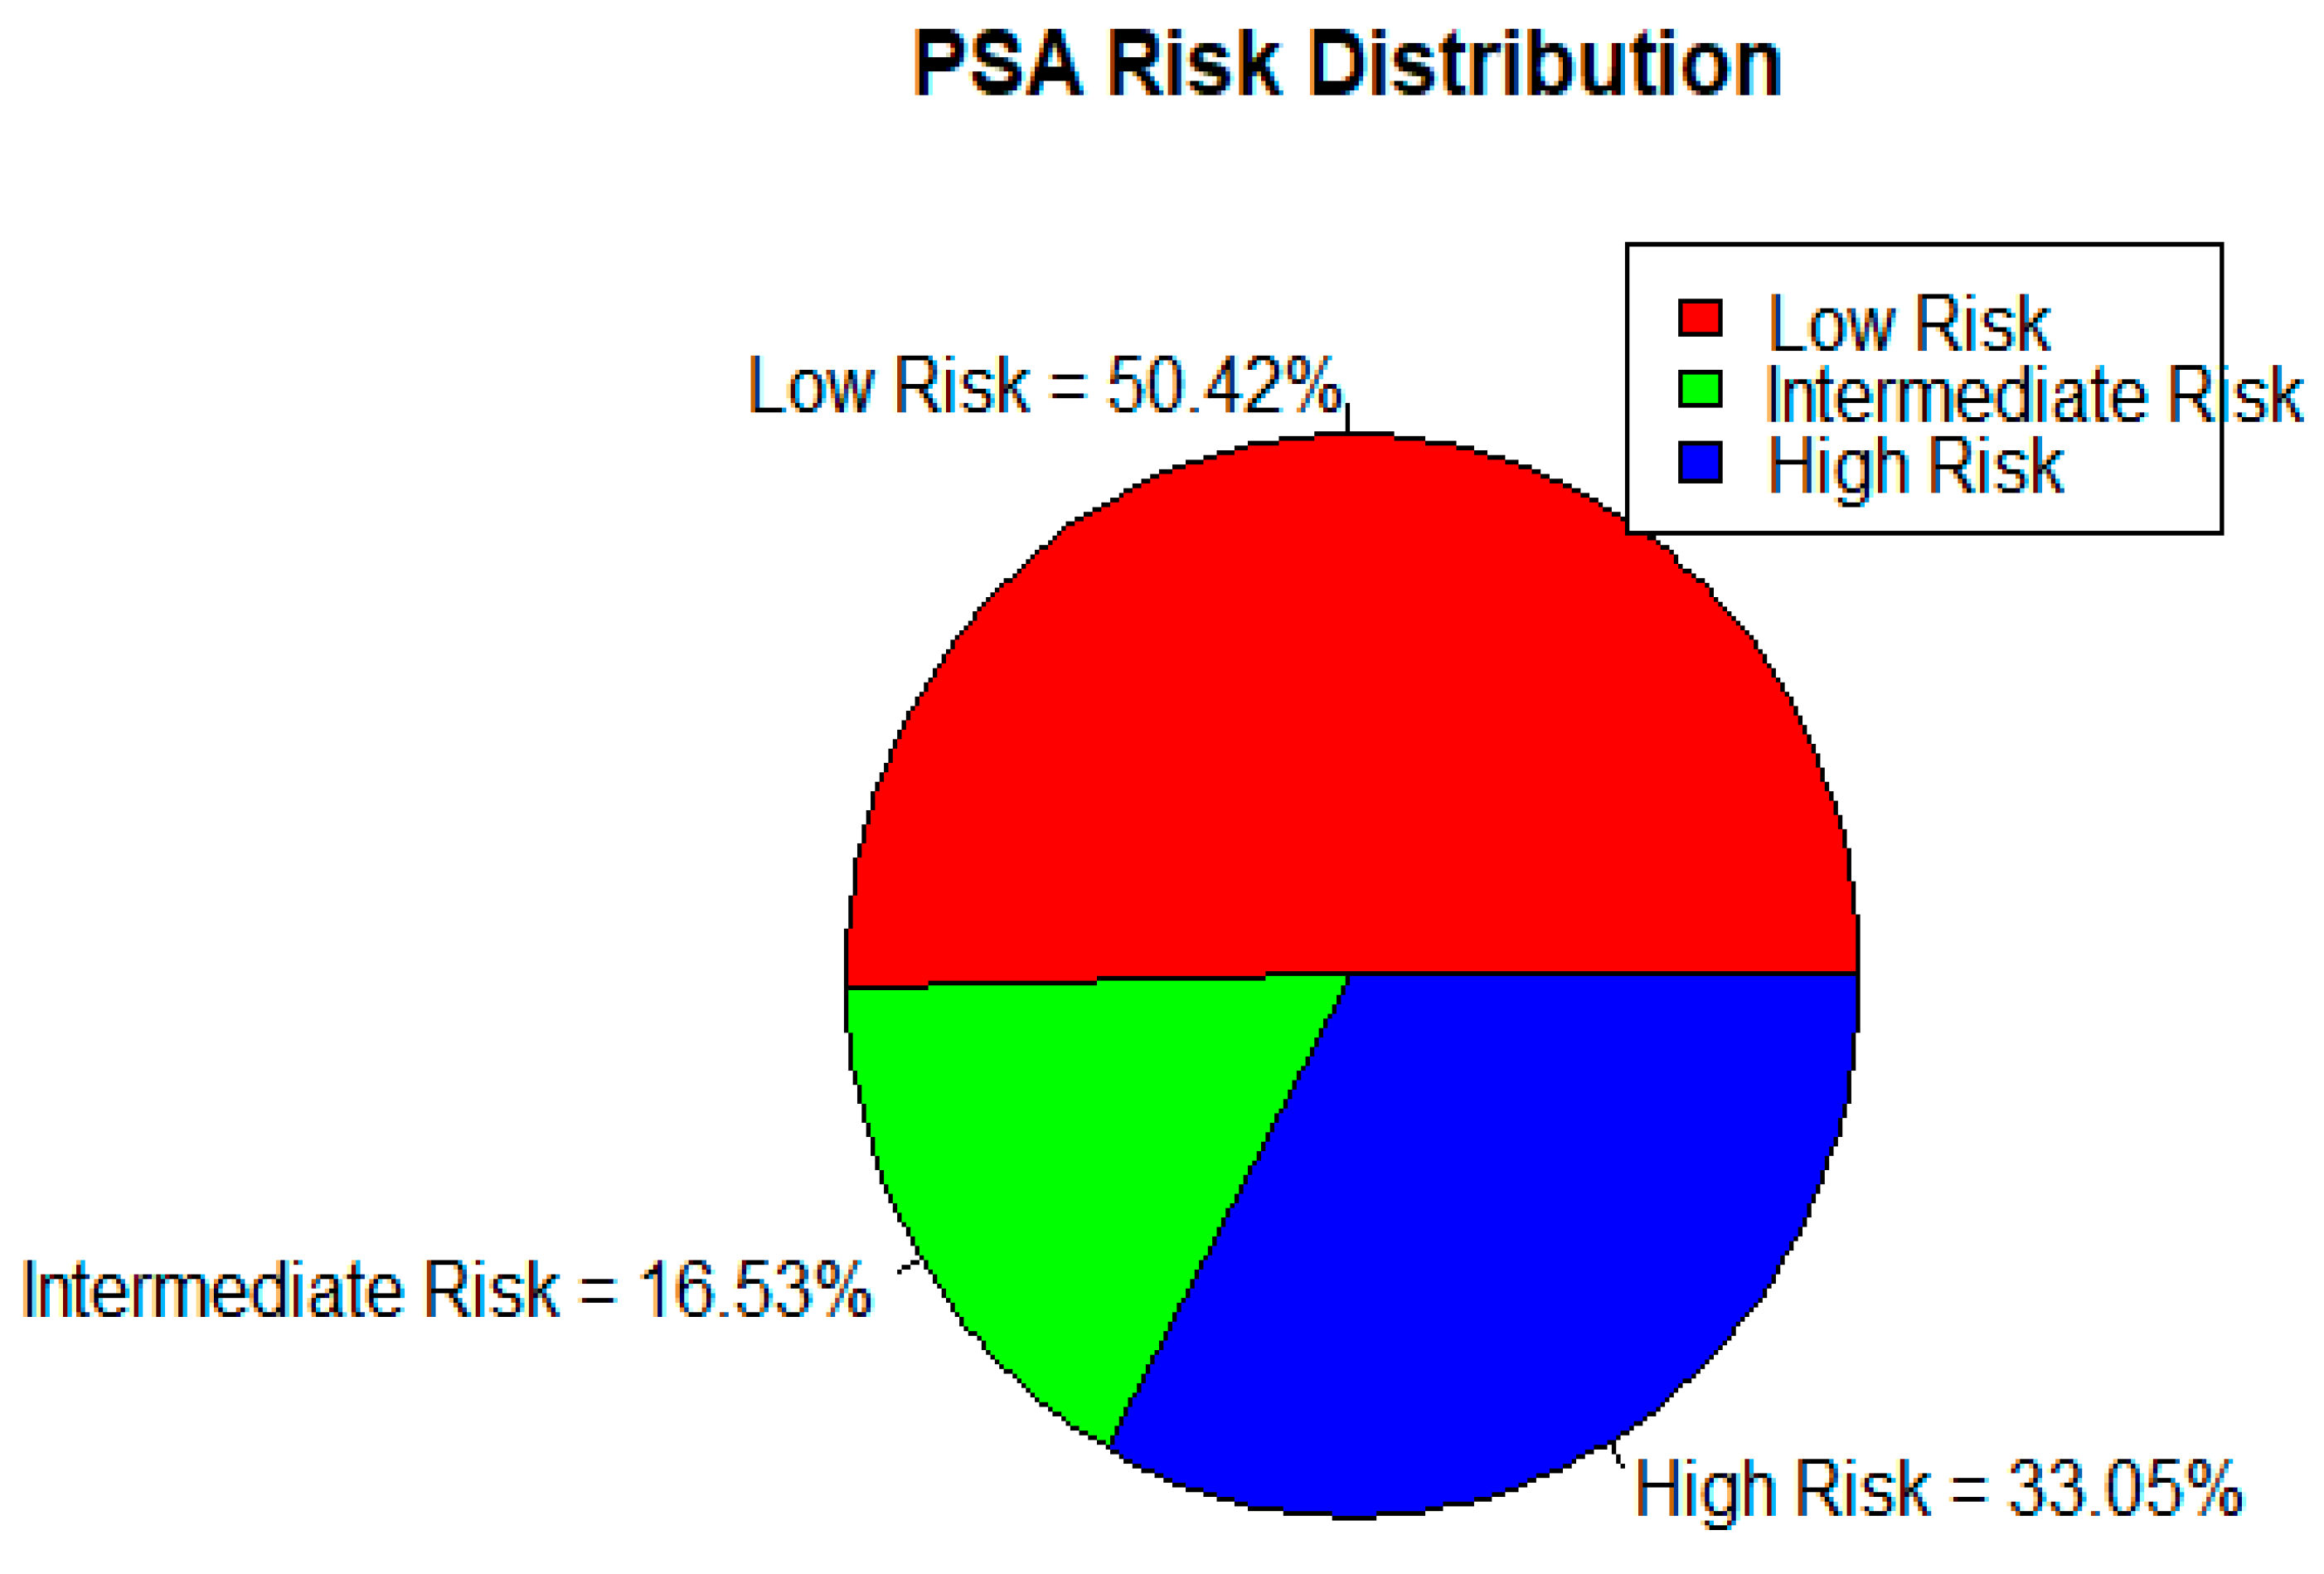
Figure 14.
Overall Prostate Cancer Risk Categorization (N=852).
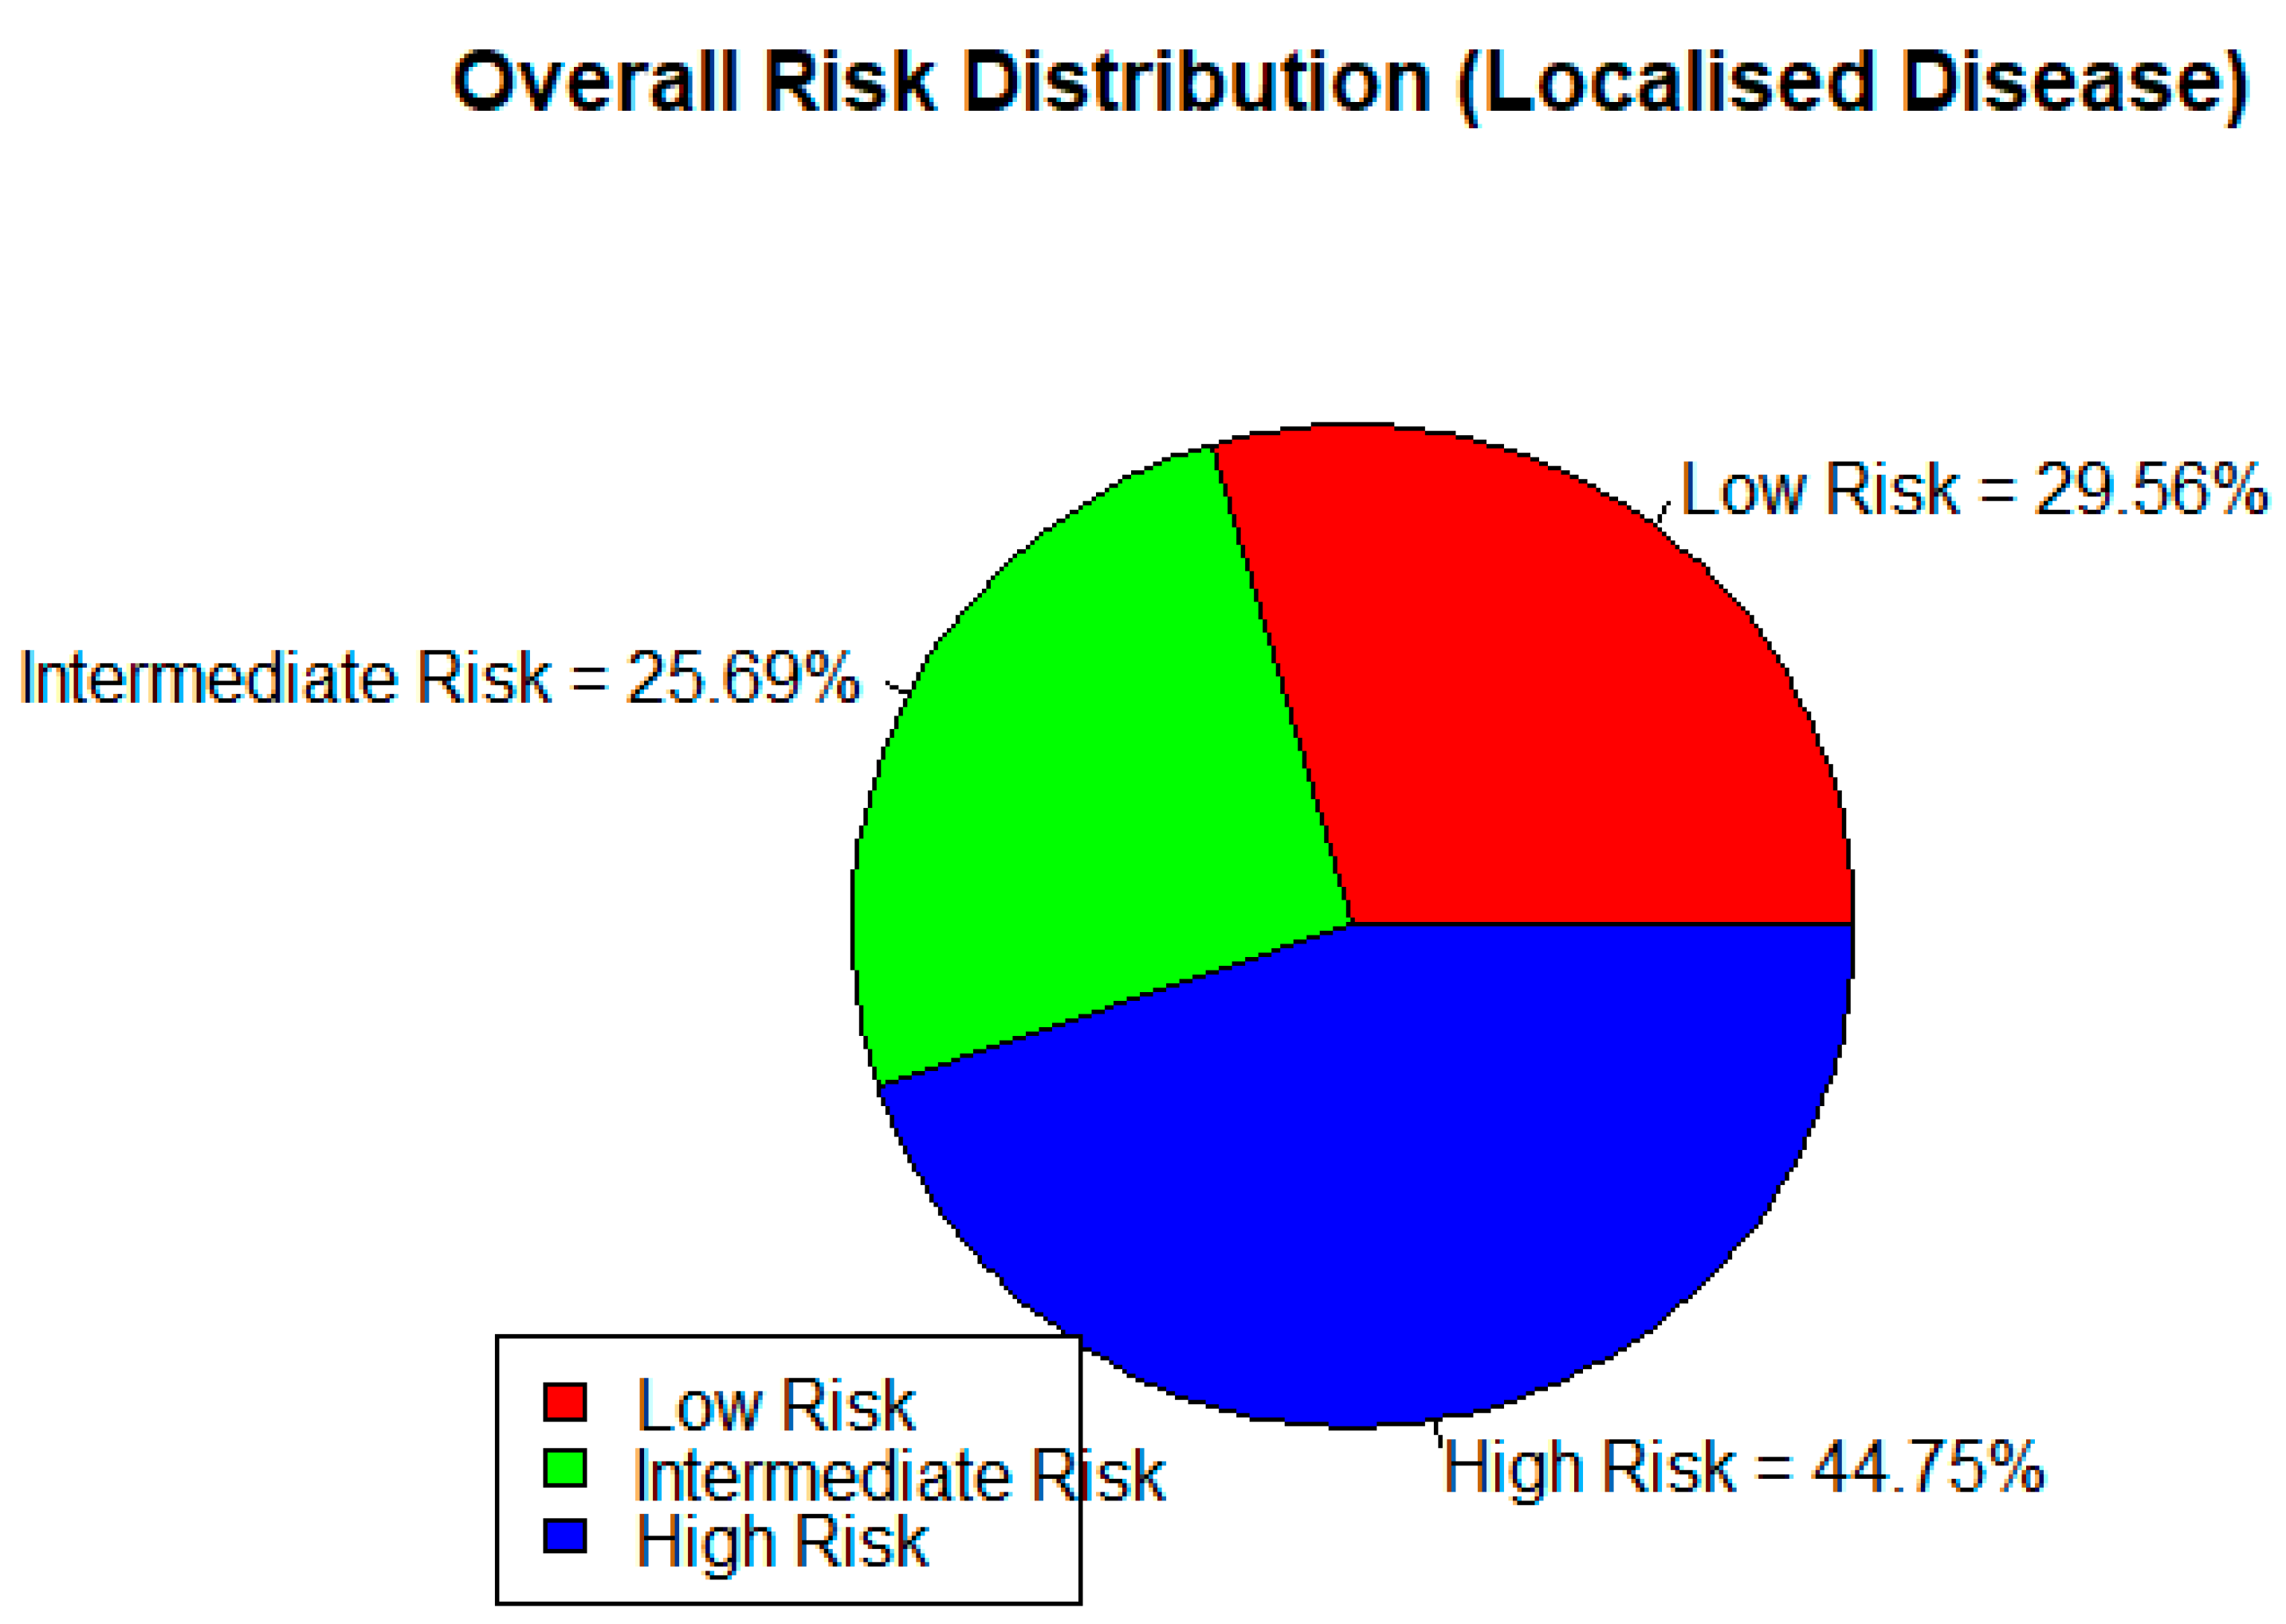
Figure 15.
Composite model evaluation plots illustrating calibration, clinical utility, classification performance, and multivariable effect size for the prostate cancer prediction model. Figure Legend: Top panel (A): Calibration Curve—this plot compares the predicted probabilities with the actual observed outcomes. The orange line represents the model’s calibration, while the red dashed line represents perfect calibration. Deviations from the diagonal indicate miscalibration, especially in the mid-range of predicted probabilities. Second panel(B): Decision Curve Analysis (Net Benefit)—this graph demonstrates the net clinical benefit of using the model across a range of threshold probabilities. The model provides the highest net benefit around thresholds of 0.57, supporting its utility in decision-making at that operating point. Third panel(C): Youden’s Index Curve—this curve identifies the threshold that optimizes the trade-off between sensitivity and specificity. The peak of the curve, marked with a red vertical line at a threshold of 0.57, indicates the optimal cutoff point based on Youden’s index. Bottom panel(D): Forest Plot from Multivariable Logistic Regression—this plot displays the adjusted odds ratios (with 95% confidence intervals) for each independent predictor. The red dashed line represents the null value (OR = 1) on a logarithmic scale. Variables such as PSA and family history (FMH) show notable effect sizes, while others like ACT and BMI_CD hover closer to the null.
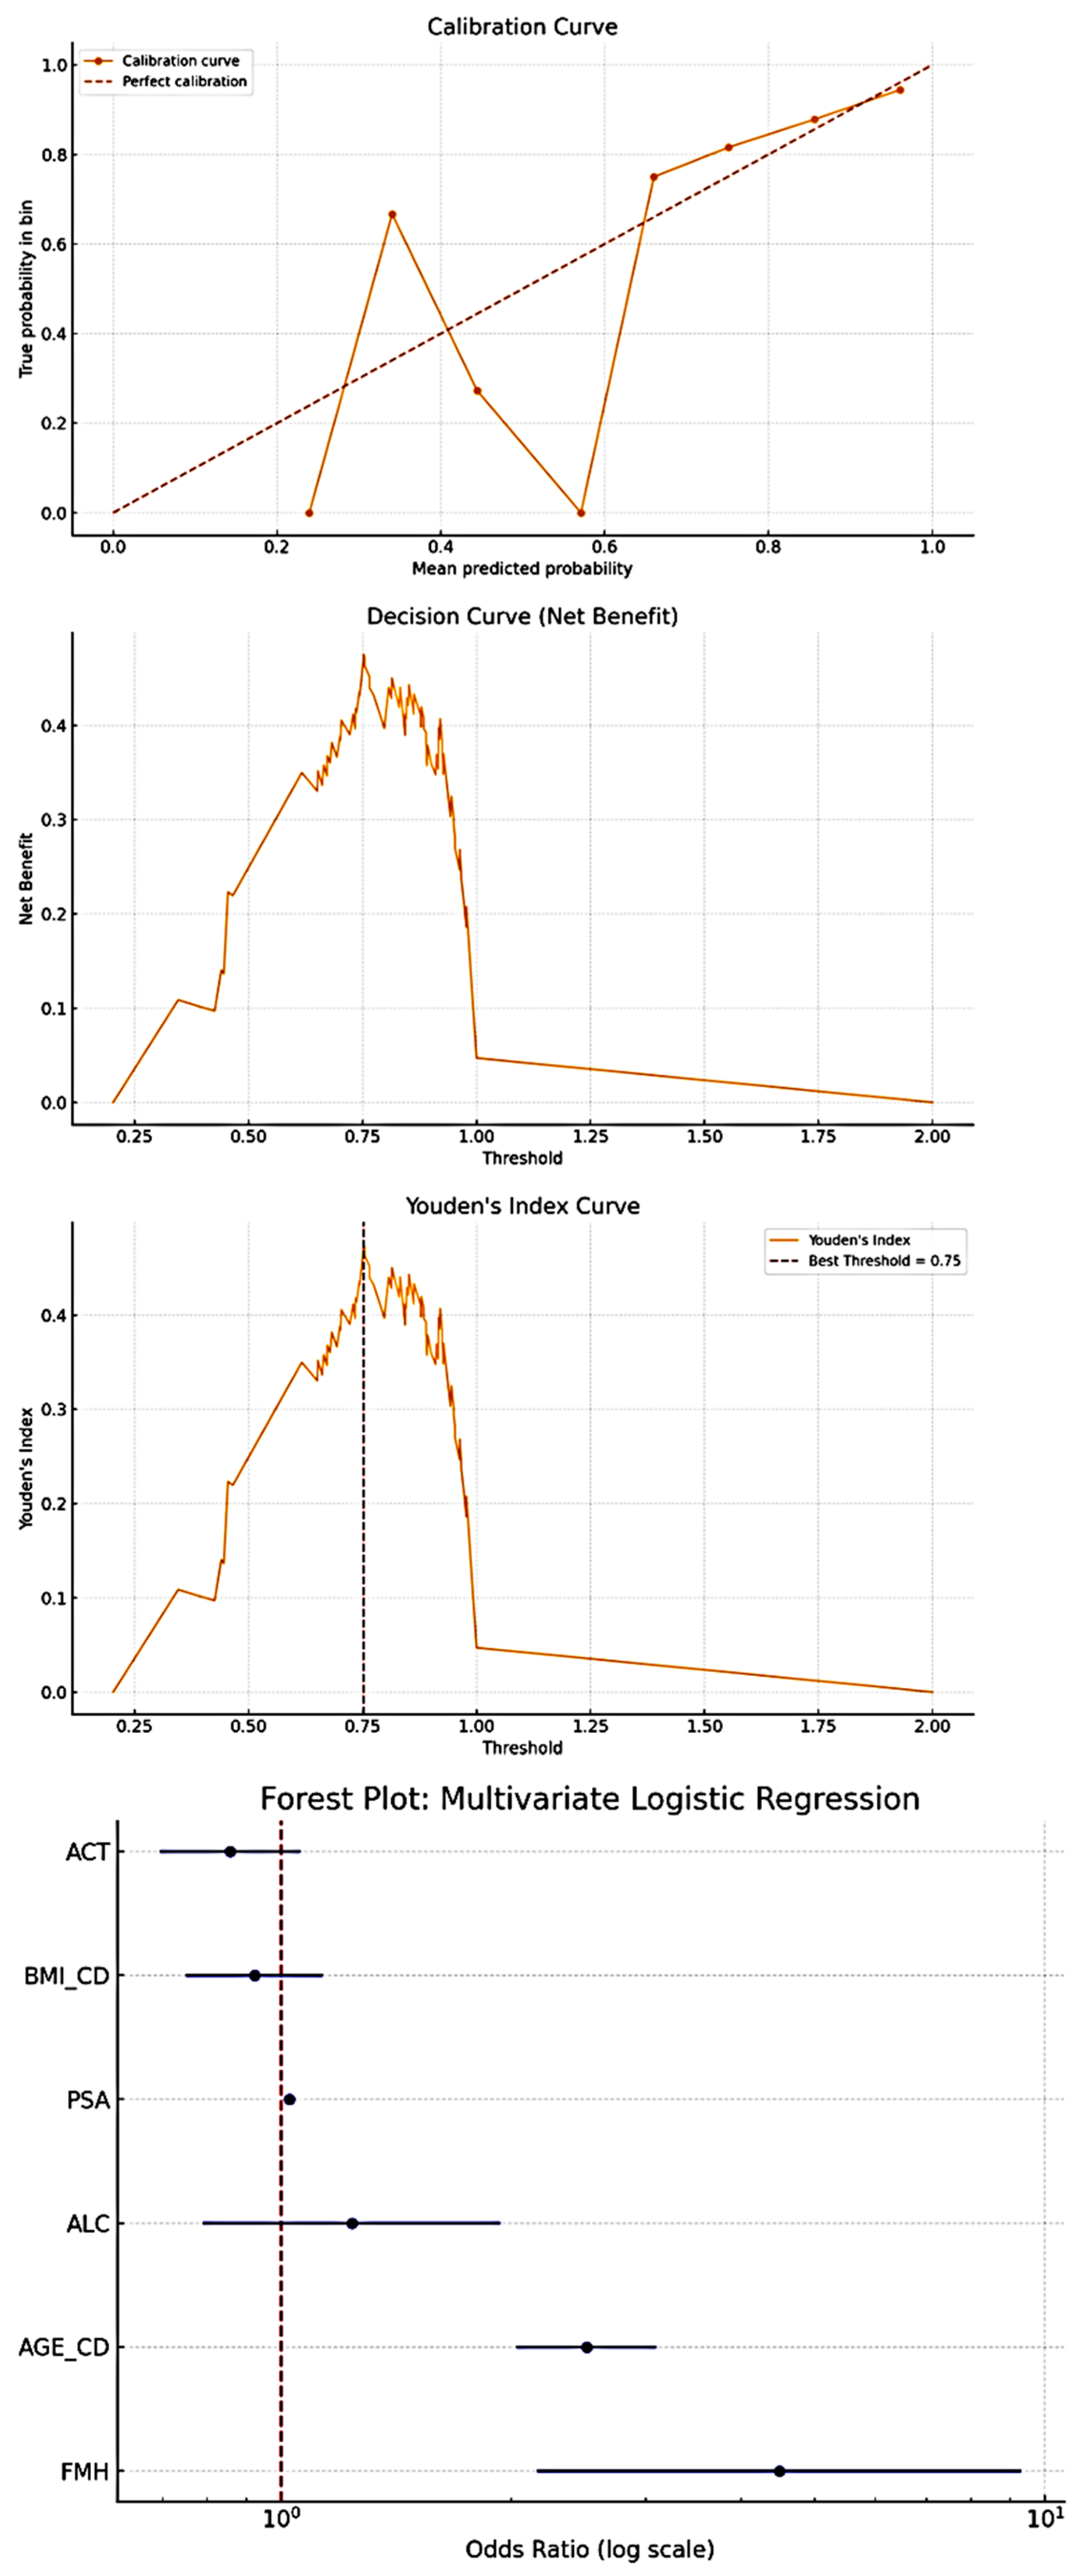

Table 1.
Summary table for categorical variables for disease determinants.
| ATTRIBUTE/ PARAMETER; and VARIABLES | TOTALS | ||||||||||
| OCCUPATION AS TRADITIONALLY CLASSIFIED | |||||||||||
| ACADEMICS | BUSINESS -MEN |
CLERGY | FORCES | MANUAL | PROFESSIONALS | RETIRED/NOT STATED | UNEMPLOYED | TOTAL | |||
| 3.52% | 5.74% | 3.63% | 5.28% | 13.60% | 40.33% | 27.06% | 0.84% | 100% | |||
| SOCIO-ECONOMIC STATUS (SES) BASED ON OCCUPATIONS∗ | |||||||||||
| LOW SES | HIGH SES | RETIRED | NOT STATED | TOTAL | |||||||
| 13.5% | 59.4% | 21.7% | 5.4% | 100% | |||||||
| ACTIVITY LEVELS BASED ON OCCUPATIONAL∗ | |||||||||||
| SEDENTARY | NON-SEDENTARY | - | RETIRED /NOT STATED/NA | TOTAL | |||||||
| 31.07% | 43.85% | - | 24.08% | 100% | |||||||
| BMI CATEGORIES | |||||||||||
| UNDERWEIGHT | NORMAL BMI | OVERWEIGHT | OBESE/ MORBIDLY OBESE |
TOTAL | |||||||
| 4.23% | 26.9% | 53.4% | 16.08% | 100% | |||||||
| SMOKING HABIT | |||||||||||
| YES | NO | NOT STATED | TOTAL | ||||||||
| 8.6% | 81.8% | 9.6% | 100% | ||||||||
| ALCOHOL HABIT | |||||||||||
| YES | NO | NOT STATED | TOTAL | ||||||||
| 31.3% | 61.2% | 7.5% | 100% | ||||||||
Table 2.
Summary Statistics for Various Parametric Independent Variables.
| PARAMETER | Obs | Mean | Std. Dev. | Min | Max |
| AGE (yrs) | 852 | 67.385 | 8.41 | 45 | 91 |
| WEIGHT(Kg) | 852 | 77.332 | 14.693 | 38.9 | 152.2 |
| HEIGHT(M) | 852 | 1.71 | 0.07 | 1.50 | 1.99 |
| BMI (Kg/M2) | 852 | 26.571 | 6.396 | 14.53 | 41.42 |
| LINEAR W-H (Kg/M) | 852 | 44.95 | 7.00 | 24.46 | 72.06 |
| PONDEREX (Kg/M3) | 852 | 15.46 | 2.62 | 8.54 | 25.18 |
Table 3.
Geospatial Analysis.
| Region | Patient Count | Percentage (%) | Cumulative (%) |
| Accra | 364 | 43.75 | 43.75 |
| Volta Region | 122 | 14.66 | 58.41 |
| Kumasi | 56 | 6.73 | 65.14 |
| Tema | 53 | 6.37 | 71.51 |
| Ho | 35 | 4.21 | 75.72 |
| Hohoe | 19 | 2.28 | 78 |
| Nigeria (Abuja) | 10 | 1.2 | 79.2 |
| Koforidua | 10 | 1.2 | 80.4 |
| Togo | 9 | 1.08 | 81.48 |
| Cape Coast | 9 | 1.08 | 82.56 |
| Takoradi | 7 | 0.84 | 83.4 |
| Kasoa | 6 | 0.72 | 84.12 |
| Tamale | 5 | 0.6 | 84.72 |
| Sunyani | 5 | 0.6 | 85.32 |
| Bolgatanga | 3 | 0.36 | 85.68 |
| Navrongo | 3 | 0.36 | 86.04 |
| Lagos | 2 | 0.24 | 86.28 |
| Other Regions | 114 | 13.72 | 100.00 |
Table 4.
Summary Statistics for Various Parametric Dependent Variables.
| PARAMETER | Obs | Mean | Std. Dev. | Min | Max |
| PSA AT DIAGNOSIS (ng/ml); Median value = 29.0 ng/ml | 852 | 496.391 | 2240.127 | .19 | 25000 |
| PSA AT THE BEGINNING OF TREATMENT (ng/ml) | 419 | 559.198 | 2664.561 | .05 | 25000 |
| DOSE OF RADIATION TREATMENT RECEIVED(Grays) | 852 | 0.000∗ ∗(Median) |
0.000∗ ∗ (Mode) |
0.00 | 78.00 |
| LOWEST PSA / NADIR (ng/ml) |
852 | 154.750 | 545.251 | .020 | 5405.50 |
| PSA RESOLUTION (ng/ml) | 852 | 233.983 | 2065.528 | -5393.28 | 249600 |
| PSA PER DOSE OF RADIATION (ng/ml- per Gray) | 852 | 31.602 | 905.751 | -5393.28 | 15299.80 |
| PSA RESOLUTION PER TREATMENT MODALITY (ng/ml) | 852 | 228.514 | 2034.179 | -5360.50 | 24960.00 |
| HIGHEST PSA (ng/ml) | 852 | 1210.764 | 3982.174 | .25 | 25000.00 |
| FAIL PSA (ng/ml) | 128 | 249.514 | 560.037 | .58 | 2600.00 |
| FAIL-RESOLUTION-MULTIPLES (unitless) | 852 | 4.579 | 39.794 | 0.00 | 512.80 |
Table 5.
Distribution of Comorbidities amongst the Patients.
| COMORBIDITY | FREQUENCY | PERCENTAGE | CUMMULATIVE PERCENTAGE |
| None | 668 | 78.43 | 78.43 |
| Hypercholesterolemia Alone | 1 | 0.12 | 78.55 |
| Diabetes Alone | 17 | 1.99 | 80.54 |
| Hypertension Alone | 90 | 10.55 | 91.09 |
| Hypertension And Hypercholesterolemia | 2 | 0.23 | 91.32 |
| Hypertension And Diabetes | 35 | 4.10 | 95.43 |
| Hypertension, Diabetes, Hypercholesterolemia | 2 | 0.23 | 95.66 |
| Hematuria/Urinary Tract Infection | 7 | 0.82 | 96.48 |
| Various Others (Asthma, Musculoskeletal pain, Erectile Dysfunction, Obesity, Weakness, Peptic Ulcer Disease, Gout) | 30 | 3.52 | 100.00 |
| Total | 852 | 100.00 |
Table 6.
Summary Table for Disease Severity, Treatment Modalities and Treatment Outcomes.
| DISEASE RISK STRATIFICATION BY PSA | ||||||||
| LOW RISK | INTERMEDIATE RISK | HIGH RISK | TOTAL | |||||
| 50.42% | 16.53% | 33.05% | 100% | |||||
| DISEASE RISK STRATIFICATION BY DRE | ||||||||
| LOW RISK | INTERMEDIATE RISK | HIGH RISK | TOTAL | |||||
| 53.19% | 17.38% | 29.43% | 100% | |||||
| ISUP GRADES DISTRIBUTION | ||||||||
| GRADE 1 | GRADE 2 | GRADE 3 | GRADE 4 | GRADE 5 | TOTAL | |||
| 19.13% | 21.48% | 19.50% | 20.58% | 19.31% | 100% | |||
| DISEASE RISK STRATIFICATION BY HISTOLOGY (GLEASON SCORE/ISUP) | ||||||||
| LOW RISK | INTERMEDIATE RISK | HIGH RISK | TOTAL | |||||
| 46.67% | 36.03% | 17.06% | 100% | |||||
| DISEASE TREATMENT; MODALITIES | ||||||||
| TYPE OF ADJUVANT/ALLIED THERAPY GIVEN TO THE PATIENTS | ||||||||
| NONE | BRACHY THERAPY |
CHEMO THERAPY |
CHEMO- RADIATION |
CHEMO and SURGERY |
GOLD SEEDS |
SURGERY MAIN; AND ALLIED |
TOTAL | |
| 65.12% | 3.72% | 8.85% | 0.18% | 3.54% | 4.07% | 14.52% | 100% | |
| TOTAL NUMBER OF ADJUVANT THERAPY GIVEN PER PATIENT | ||||||||
| None | One | Two | TOTAL | |||||
| 65.12% | 16.59% | 18.29% | 100% | |||||
| DISEASE TREATMENT OUTCOMES | ||||||||
| HIGHEST PSA PEAK DURING TREATMENT PERIOD; CATEGORISED (ng/ml) | ||||||||
| 10 or less | 10 to>100 | TOTAL | ||||||
| 8.33% | 91.67% | 100% | ||||||
| PSA RESOLUTION PER NUMBER TOTAL OF TREATMENT MODALITIES GIVEN (ng/ml- per modality given) | ||||||||
| <0.5 | 0.5 to 20 | >20 | TOTAL | |||||
| 41.78% | 26.76% | 31.96% | 100% | |||||
| LOWEST PSA ATTAINED DURING TREATMENT PERIOD (NADIR); CATEGORISED (ng/ml) | ||||||||
| <0.5 | 0.5 TO 4 | >4 | TOTAL | |||||
| 22.30% | 31.81% | 45.89% | 100% | |||||
| FAIL-PSA-REFRACTORY MULTIPLES (FAIL PSA DIVIDED BY LOWEST PSA) (ng/ml) | ||||||||
| <3 | 3.5 to 10 | 10.5 to 20 | 20.5 to 100 | >100 | TOTAL | |||
| 49.2% | 28.8% | 0.1% | 18.0% | 3.9% | 100% | |||
Table 8.
Test of Associations (used PSAs from 810 controls from urology clinics).
| Characteristic | Outcome | Test Statistic | p-value |
| Age (years) | PSA at diagnosis | Kruskal-Wallis | 0.003 |
| Ethnicity | PSA at diagnosis | Kruskal-Wallis | 0.049 |
| Nationality | PSA at diagnosis | Kruskal-Wallis | 0.030 |
| Marital Status | PSA at diagnosis | Kruskal-Wallis | 0.001 |
| Age (years) | ISUP grade | Kruskal-Wallis | 0.009 |
| Ethnicity | ISUP grade | Kruskal-Wallis | 0.049 |
| Nationality | ISUP grade | Kruskal-Wallis | 0.030 |
| Nationality | Total number of Treatment modality | Chi-squared test | 0.030 |
| Comorbidity Status | Adjuvant treatment | Pearson’s Chi-squared | 0.001 |
| Age (years) | Toxicity | Wilcoxon rank-sum | 0.001 |
| Body Mass Index (BMI) | Toxicity | Wilcoxon rank-sum | 0.034 |
| High BMI | High-risk Localised Prostate Cancer | (OR) 2.34 | 0.022 |
| High BMI | Propensity to Metastatic Prostate Cancer | (OR) 0.35 | 0.026 |
| Ethnicity (Ga and Ewe vs. Akans) | High Risk Localised Prostate Cancer on DRE | (OR) 0.52 | 0.049 |
| Socio-economic Status | Prostate Cancer Disease | (OR) 3.3 | <0.01 |
| Family History | Prostate Cancer Disease | (OR) 2.3 | <0.01 |
Table 9.
Determinants of prostate cancer: Associations and Relationships of Prostate Cancer to Physical and Socio-demographic parameters (used 154 Age-Matched PSAs from a public sector standard histopathology Laboratory in Ghana).
Table 9.
Determinants of prostate cancer: Associations and Relationships of Prostate Cancer to Physical and Socio-demographic parameters (used 154 Age-Matched PSAs from a public sector standard histopathology Laboratory in Ghana).
| CHI-QUARE: Variable | Chi2 | Dof | p-value | UNIVARIATE LOGISTIC REGRESSION: Variable | OR | CI Lower | CI Upper | Z | p-value | |
| ACT | 7.404548 | 3 | 0.060 | ACT | 0.887901 | 0.79468 | 0.992057 | -2.10087 | 0.035 | |
| AGE_CD | 277.1374 | 5 | <0.001 | AGE_CD | 2.122956 | 1.912975 | 2.355985 | 14.16693 | <0.001 | |
| ALC | 5.445207 | 2 | <0.001 | ALC | 0.810723 | 0.661849 | 0.993085 | -2.027 | 0.042 | |
| BMI_CD | 48.35092 | 4 | <0.001 | BMI_CD | 1.045975 | 0.950214 | 1.151386 | 0.917529 | 0.359 | |
| ETH_CD | 97.83927 | 6 | <0.001 | ETH_CD | 0.799188 | 0.749586 | 0.852072 | -6.85672 | <0.001 | |
| FMH | 34.5831 | 2 | <0.001 | FMH | 2.18415 | 1.676112 | 2.846176 | 5.783486 | <0.001 | |
| H | 209.0936 | 48 | <0.001 | H | 0.977944 | 0.904855 | 1.056935 | -0.56276 | 0.574 | |
| LIN_CD | 64.04639 | 5 | <0.001 | LIN_CD | 1.250279 | 1.112893 | 1.404625 | 3.760964 | 0.0002 | |
| MAR_CD | 955.2117 | 4 | <0.001 | MAR_CD | 1.72774 | 1.576975 | 1.892919 | 11.7379 | <0.001 | |
| PND_CD | 53.58187 | 5 | <0.001 | PSA | 1.024192 | 1.01424 | 1.034242 | 4.798184 | <0.001 | |
| PSA | 881.8912 | 294 | <0.001 | SES | 1.591092 | 1.420385 | 1.782315 | 8.020344 | <0.001 | |
| SES | 356.3435 | 3 | <0.001 | TBC | 0.371965 | 0.276924 | 0.499624 | -6.5693 | <0.001 | |
| TBC | 44.56501 | 1 | <0.001 | W | 1.007744 | 1.000935 | 1.014599 | 2.229992 | 0.026 | |
| W | 769.7882 | 316 | <0.001 | |||||||
| Multivariate Logistic Regression: | ||||||||||
| Variable | OR | CI Lower | CI Upper | z | p-value | |||||
| const | 0.159355 | 0.055841 | 0.454756 | -3.43279 | 0.000597 | |||||
| AGE_CD | 2.510028 | 2.032442 | 3.099838 | 8.546282 | <0.001 | |||||
| BMI_CD | 0.922045 | 0.750286 | 1.133123 | -0.77168 | 0.440304 | |||||
| FMH | 4.48667 | 2.164282 | 9.301103 | 4.035711 | <0.001 | |||||
| ACT | 0.857443 | 0.693877 | 1.059565 | -1.4242 | 0.15439 | |||||
| ALC | 1.236622 | 0.790181 | 1.935296 | 0.929418 | 0.352672 | |||||
| PSA | 1.024192 | 1.01424 | 1.034242 | 4.798184 | <0.001 | |||||
Disclaimer/Publisher’s Note: The statements, opinions and data contained in all publications are solely those of the individual author(s) and contributor(s) and not of MDPI and/or the editor(s). MDPI and/or the editor(s) disclaim responsibility for any injury to people or property resulting from any ideas, methods, instructions or products referred to in the content. |
© 2025 by the authors. Licensee MDPI, Basel, Switzerland. This article is an open access article distributed under the terms and conditions of the Creative Commons Attribution (CC BY) license (http://creativecommons.org/licenses/by/4.0/).
Copyright: This open access article is published under a Creative Commons CC BY 4.0 license, which permit the free download, distribution, and reuse, provided that the author and preprint are cited in any reuse.


