
Submitted:
30 July 2025
Posted:
11 August 2025
You are already at the latest version
Abstract
This study aimed to elucidate the protective effects and underlying mechanisms of 17β-estradiol (E2) in a mouse model of type 2 diabetes mellitus (T2DM) with comorbid non-alcoholic fatty liver disease (NAFLD). Methods: A T2DM+NAFLD mouse model was established using a high-fat diet combined with intraperitoneal injection of streptozotocin (STZ). Mice were randomly divided into the following groups (n=6 each): model, E2, E2+siNC, and E2+siPGC-1α. An additional control group (n=6) received a standard diet and citrate buffer. Mice in the E2, E2+siNC, and E2+siPGC-1α groups were intraperitoneally injected with 20 μg/kg E2 daily for 8 weeks. Additionally, mice in the E2+siNC and E2+siPGC-1α groups received tail vein injections of either an empty vector or a lentiviral vector targeting PGC-1α knockdown on weeks 1 and 5. After treatment, fasting blood glucose (FBG) was measured by glucometer, and fasting insulin (FINS) levels were determined using ELISA to calculate the homeostasis model assessment for insulin resistance (HOMA-IR). Serum levels of total cholesterol (TC), triglycerides (TG), low-density lipoprotein cholesterol (LDL-C), alanine aminotransferase (ALT), and aspartate aminotransferase (AST) were analyzed using commercial kits. Body and liver weights were recorded to calculate liver index. Hematoxylin-eosin (HE) and Oil Red O staining were performed to evaluate liver histology and lipid deposition. Western blotting was used to assess hepatic expression levels of PGC-1α and estrogen-related receptor alpha (ERRα), while immunofluorescence co-localization and chromatin immunoprecipitation (ChIP)-PCR were employed to analyze protein interaction and promoter binding. Results: Compared to the model group, the E2 group showed significantly reduced FBG, FINS, and HOMA-IR, as well as lower levels of TC, TG, LDL-C, ALT, and AST (P < 0.05). E2 also decreased body weight, liver index, hepatocyte necrosis, degeneration, inflammatory infiltration, and lipid accumulation. Expression levels and co-localization of PGC-1α and ERRα were significantly increased. In contrast, knockdown of PGC-1α in the E2+siPGC-1α group reversed these effects, resulting in aggravated liver pathology and reduced PGC-1α/ERRα expression and interaction (P < 0.05). ChIP-PCR confirmed greater enrichment of ERRα promoter regions by PGC-1α compared to IgG control (P < 0.05). Conclusion: E2 alleviates glucose and lipid metabolic dysfunction, hepatic injury, and lipid accumulation in T2DM+NAFLD mice. These effects may be mediated through activation of the PGC-1α/ERRα signaling axis.

Keywords:
type 2 diabetes mellitus
; non-alcoholic fatty liver disease
; 17β-estradiol
; PGC-1α
; ERRα
1. Introduction
Type 2 diabetes mellitus (T2DM) is a metabolic disorder characterized by chronic hyperglycemia, accounting for approximately 90-95% of all diabetes cases. Its global incidence has been increasing year by year in recent years [1]. T2DM is characterized by insulin resistance, leading to abnormal glucose regulation and multiple metabolic disorders. Non-alcoholic fatty liver disease (NAFLD) is a common complication of T2DM and one of the main causes of severe liver diseases such as liver cirrhosis and liver cancer [2]. It is estimated that up to 70% of T2DM patients also have NAFLD [3]. The development mechanism of NAFLD is complex, involving factors such as lipid accumulation in the liver, insulin resistance, oxidative stress, and inflammation [4]. T2DM combined with NAFLD not only aggravates the course of diabetes but also leads to further liver damage and functional decline, seriously affecting the quality of life and prognosis of patients [5]. Therefore, studying how to alleviate liver damage caused by T2DM combined with NAFLD is of great clinical significance for improving the metabolic health of patients and enhancing treatment outcomes.
17β-estradiol (17β-Estradiol, E2) is a type of estrogen widely present in the female body and plays an important role in various physiological and pathological processes. Studies have shown that E2 can regulate reproductive system function, protect the cardiovascular and nervous systems, etc. [6,7]. In addition, E2 can act on multiple tissues such as the liver, muscles, and fat to improve glucose tolerance and insulin sensitivity, inhibit fat accumulation, and reduce liver inflammation [8]. Although the role of E2 in regulating glucose and lipid metabolism has been revealed by previous studies, its specific role and underlying mechanism in T2DM combined with NAFLD remain unclear. Peroxisome proliferator-activated receptor γ coactivator 1α (PGC-1α) is a key transcriptional coactivator that participates in regulating cellular energy metabolism, mitochondrial function, and oxidative stress response. It maintains metabolic homeostasis in tissues such as muscle and liver by interacting with various transcription factors [9]. Estrogen-related receptor α (ERRα), as a member of the nuclear receptor family, mainly regulates the expression of genes related to intracellular energy metabolism. PGC-1α can bind to ERRα, enhance the transcriptional activity of ERRα, promote mitochondrial biogenesis and oxidative metabolism, and thereby increase the energy production capacity of cells. This mechanism has potential therapeutic significance in metabolic diseases [10]. Previous studies have shown that the expression of PGC-1α and ERRα decreases after liver injury induced by endotoxin, and restoring their expression can improve liver fatty acid oxidation and gluconeogenesis and enhance liver function [11]. Based on this, this study further explores the effect of E2 on T2DM combined with NAFLD in mice and analyzes whether it improves glucose and lipid metabolism and liver damage by regulating the PGC-1α/ERRα signaling axis, with the aim of providing theoretical basis and potential targets for the clinical treatment of T2DM combined with NAFLD.
2. Materials and Methods
2.1. Experimental Animals
A total of 40 specific pathogen-free (SPF) grade male C57BL/6J mice, aged 7–8 weeks and weighing 18–22 g, were housed at the institutional animal facility under controlled environmental conditions: constant temperature (22 ± 1°C), relative humidity (50 ± 10%), and a 12-hour light/dark cycle. Mice were provided ad libitum access to food and water and acclimatized for one week prior to experimentation.
2.2. Reagents and Materials
Standard and high-fat diets were purchased from Suzhou Xietong Technology Co., Ltd. Streptozotocin (STZ) and 17β-estradiol (E2) were obtained from Sigma-Aldrich (USA). Lentiviral vectors for PGC-1α knockdown and empty controls were purchased from Shanghai GeneChem Co., Ltd. Mouse insulin (FINS) ELISA kits were from Nanjing Jiancheng Bioengineering Institute. Kits for serum TC, TG, LDL-C, ALT, and AST were obtained from Roche (USA). HE and Oil Red O staining kits were from Wuhan Boster Biological Technology Co., Ltd. Protein extraction reagents were supplied by Shanghai Biyuntian Biotechnology Co., Ltd. BCA protein quantification kits, ECL reagents, bovine serum albumin (BSA), and DAPI were also from Biyuntian. Human HepG2 hepatocyte cell line was obtained from Wuhan Nuojing Gene Technology. Chromatin immunoprecipitation (ChIP) kits were purchased from eBioscience (USA). Primary antibodies against PGC-1α, ERRα, and GAPDH were from Abcam (UK). Secondary antibodies conjugated with horseradish peroxidase (HRP), Alexa Fluor 488, and Alexa Fluor 594 were obtained from Cell Signaling Technology (USA).
2.3. Methods
2.3.1. Animal Model, Grouping, and Treatment
According to the method described in reference [12], mice in the model group were fed a high-fat diet (60% fat, 20% protein, 20% carbohydrates), while control mice were fed a standard diet. After 8 weeks, model mice received intraperitoneal injections of streptozotocin (60 mg/kg) once daily for 3 consecutive days. Control mice received an equivalent volume of citrate buffer. After the final injection, all mice were fasted for 12 hours, and fasting blood glucose (FBG) was measured. Mice with FBG between 15–25 mmol/L and histologically confirmed hepatic steatosis were considered successfully modeled. These mice (n=24) were randomly divided into four groups: model, E2, E2+siNC, and E2+siPGC-1α (n=6 each). An additional 6 mice were used as the control group. Mice in the E2, E2+siNC, and E2+siPGC-1α groups received daily intraperitoneal injections of E2 (20 μg/kg) for 8 weeks [13]. The E2+siNC and E2+siPGC-1α groups received tail vein injections of either empty vector or lentivirus targeting PGC-1α knockdown (200 μL) on weeks 1 and 5.
2.3.2. Blood Glucose Measurement
At the end of treatment, all mice were fasted for 12 hours. Blood was collected from the tail tip, and FBG was measured using a glucometer. Serum insulin (FINS) was measured using ELISA. The insulin resistance index (HOMA-IR) was calculated as: HOMA-IR = (FBG × FINS) / 22.5.
2.3.3. Serum Lipid and Liver Function Analysis
Blood samples were collected from the abdominal aorta and centrifuged at 3000 rpm for 10 minutes. Serum was separated, and levels of TC, TG, LDL-C, ALT, and AST were measured using commercial kits according to the manufacturer’s instructions.
2.3.4. Body Weight and Liver Index Measurement
Mice were weighed, euthanized, and livers were harvested and weighed immediately. The liver index was calculated as follows: Liver Index (%) = liver weight / body weight × 100%.
2.3.5. Histopathological Evaluation of Liver Tissues
Liver tissues were fixed in 4% paraformaldehyde, dehydrated, embedded in paraffin, and sectioned for hematoxylin and eosin (HE) staining to assess liver morphology under a light microscope. For lipid deposition assessment, fixed tissues were embedded, cryosectioned, and stained with Oil Red O. Red staining indicated lipid accumulation. Images were captured and the lipid-positive area was quantified using ImageJ software.
2.3.6. Western Blot Analysis of PGC-1α and ERRα in Liver Tissue
Total protein was extracted from liver tissues and quantified using the BCA method. Equal amounts (40 μg) of protein were denatured, separated via SDS-PAGE, and transferred to PVDF membranes. Membranes were blocked with 5% skim milk for 1.5 h and incubated overnight at 4°C with primary antibodies against PGC-1α (1:1000), ERRα (1:1000), and GAPDH (1:1000). After TBST washing, membranes were incubated with HRP-conjugated secondary antibodies (1:5000) for 30 minutes at room temperature. Bands were visualized using ECL reagents and quantified using ImageJ software.
2.3.7. Immunofluorescence Double-Staining for PGC-1α and ERRα
Co-localization Paraffin-embedded liver sections were dewaxed, rehydrated, and subjected to antigen retrieval. Sections were blocked with 5% BSA for 1 hour at room temperature and incubated overnight at 4°C with primary antibodies against PGC-1α and ERRα (both diluted 1:200). After washing, Alexa Fluor-conjugated secondary antibodies (1:500) were added for 2 hours in the dark at room temperature. Nuclei were stained with DAPI for 10 minutes. After final washing, sections were mounted and observed under a confocal fluorescence microscope.
2.3.8. ChIP-PCR to Validate PGC-1α Binding to ERRα
HepG2 cells were fixed with 1% formaldehyde and sonicated for 2 hours to obtain chromatin fragments. Immunoprecipitation was performed using either anti-PGC-1α antibody or IgG as a negative control (Anti-IgG group and Anti-PGC-1α group, respectively). DNA fragments enriched by ChIP were collected and analyzed by qPCR to detect enrichment of the ERRα promoter.
2.4. Statistical Analysis
Data were analyzed using GraphPad Prism 8.0 and presented as mean ± standard deviation (SD). One-way ANOVA was used for multiple group comparisons, followed by LSD-t test for pairwise comparisons. A P value of < 0.05 was considered statistically significant.
3. Results
3.1. FBG, FINS, and HOMA-IR Levels in Each Group
After treatment, FBG, FINS, and HOMA-IR were measured. Compared with the control group, the model group exhibited significantly increased FBG, FINS, and HOMA-IR levels (P < 0.05). E2 treatment significantly reduced these indicators (P < 0.05) compared with the model group. Compared with the E2+siNC group, the E2+siPGC-1α group showed elevated FBG, FINS, and HOMA-IR levels (P < 0.05), indicating that PGC-1α knockdown attenuated the metabolic improvements conferred by E2 (see Table 1).

Table 1.
Comparison of FBG, FINS, and HOMA-IR levels among groups (x̄ ± s).
| Group | FBG (mmol/L) | FINS (mU/L) | HOMA-IR |
|---|---|---|---|
| Control | 5.73 ± 0.61 | 7.75 ± 0.76 | 1.97 ± 0.16 |
| Model | 27.69 ± 2.83* | 17.08 ± 1.69* | 21.02 ± 2.07* |
| E2 | 12.55 ± 1.19# | 10.88 ± 1.41# | 6.07 ± 0.59# |
| E2+siNC | 13.06 ± 1.27a | 10.64 ± 1.03a | 6.18 ± 0.73a |
| E2+siPGC-1α | 29.47 ± 2.90*b | 18.19 ± 1.82*b | 23.82 ± 2.43*b |
*P < 0.05 vs. Control group; # P < 0.05 vs. Model group; a P < 0.05 vs. Model group; b P < 0.05 vs. E2+siNC group.
3.2. Serum Lipids and Liver Function Indicators
Serum TC, TG, LDL-C, ALT, and AST levels were assessed after treatment. Compared with the control group, the model group showed significantly higher levels of these indicators (P < 0.05). E2 treatment significantly reduced serum TC, TG, LDL-C, ALT, and AST levels compared with the model group (P < 0.05). In the E2+siPGC-1α group, these values were significantly increased compared to the E2+siNC group (P < 0.05), indicating that PGC-1α knockdown diminished the hepatoprotective effects of E2.
Table 1.
Comparison of serum TC, TG, LDL-C, ALT and AST levels among groups of mice.
| Group | TC(mmol/L) | TG(mmol/L) | LDL-C(mmol/L) | ALT(U/L) | AST (U/L) |
|---|---|---|---|---|---|
| Control | 3.56±0.34 | 1.22±0.13 | 0.37±0.04 | 79.50±7.88 | 122.84±13.31 |
| Model | 8.15±0.82* | 3.57±0.36* | 1.12±0.13* | 178.36±17.23* | 267.91±25.48* |
| E2 | 6.04±0.57# | 1.92±0.18# | 0.71±0.09# | 97.13±9.92# | 185.39±19.34# |
| E2+siNC | 6.12±0.63 | 1.99±0.17 | 0.74±0.07 | 99.48±10.06 | 187.66±19.23 |
| E2+siPGC-1α | 8.71±0.89△ | 3.61±0.38△ | 1.16±0.11△ | 180.52±17.94△ | 265.79±25.87△ |
Compared with Control group,*P<0.05;Compared with Model group, #P<0.05;Compared with E2+siNC group,△P<0.05.
3.3. Body Weight and Liver Index in Each Group
Body weight and liver index were measured. Compared with the control group, the model group showed significantly increased body weight and liver index (P < 0.05). E2 treatment reduced these parameters compared to the model group (P < 0.05). Compared with the E2+siNC group, the E2+siPGC-1α group had significantly higher body weight and liver index (P < 0.05), indicating that PGC-1α knockdown attenuated the regulatory effect of E2 (see Table 3).
Table 2.
Comparison of Serum TC, TG, LDL-C, ALT, and AST Levels among Groups (x̄ ± s).
| Group | TC (mmol/L) | TG (mmol/L) | LDL-C (mmol/L) | ALT (U/L) | AST (U/L) |
|---|---|---|---|---|---|
| Control | 3.56 ± 0.34 | 1.22 ± 0.13 | 0.37 ± 0.04 | 79.50 ± 7.88 | 122.84 ± 13.17 |
| Model | 8.15 ± 0.82* | 3.57 ± 0.36* | 1.12 ± 0.13* | 184.36 ± 20.87* | 267.91 ± 25.41* |
| E2 | 6.04 ± 0.57# | 1.92 ± 0.18# | 0.71 ± 0.09# | 97.33 ± 8.72# | 160.98 ± 19.47# |
| E2+siNC | 6.12 ± 0.63a | 1.99 ± 0.17a | 0.73 ± 0.10a | 99.48 ± 6.01a | 162.20 ± 17.39a |
| E2+siPGC-1α | 8.71 ± 0.89*b | 3.61 ± 0.38*b | 1.16 ± 0.11*b | 180.52 ± 17.94*b | 265.79 ± 25.87*b |
* P < 0.05 vs. Control group; #P < 0.05 vs. Model group; a P < 0.05 vs. Model group; b P < 0.05 vs. E2+siNC group.
Table 3.
Comparison of Body Weight and Liver Index among Groups (x̄ ± s).
| Group | Body weight (g) | Liver/body weight (%) |
|---|---|---|
| Control | 22.47 ± 2.34a | 4.08 ± 0.39a |
| Model | 27.08 ± 2.81* | 6.30 ± 0.56* |
| E2 | 22.54 ± 2.17# | 4.32 ± 0.41# |
| E2+siNC | 23.11 ± 2.06a | 4.37 ± 0.44a |
| E2+siPGC-1α | 28.23 ± 2.93*b | 6.71 ± 0.74*b |
*P < 0.05 vs. Control group; #P < 0.05 vs. Model group; a P < 0.05 vs. Model group; b P < 0.05 vs. E2+siNC group.
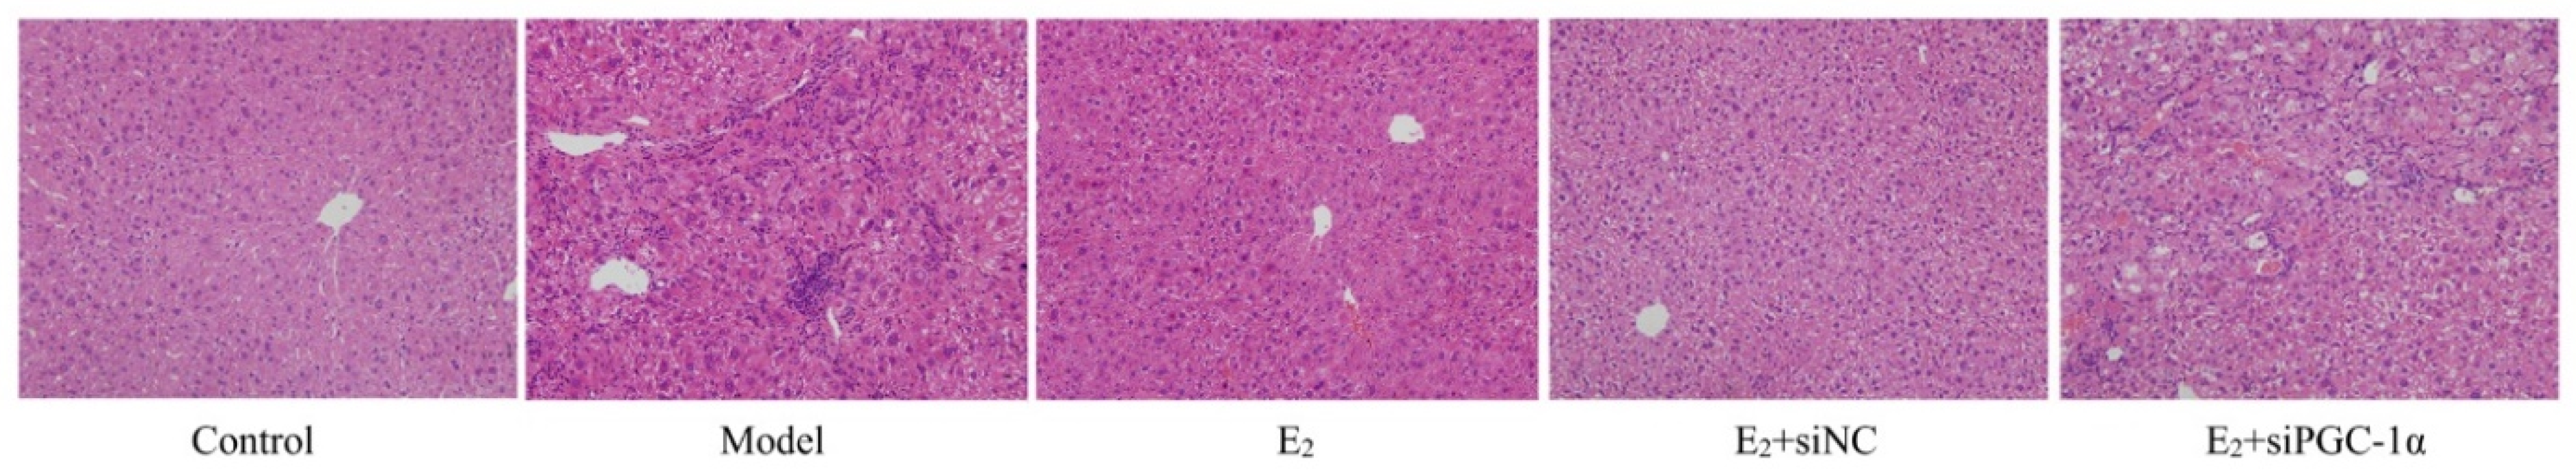
3.4. Histopathological Changes in Liver Tissues
HE staining showed normal hepatic architecture in the control group, with well-arranged hepatic cords and intact cellular morphology. The model group exhibited hepatocellular ballooning, cytoplasmic vacuolization, and inflammatory infiltration, indicating typical NAFLD pathological features. E2 treatment alleviated hepatocellular degeneration, reduced inflammatory infiltration and steatosis. The E2+siNC group showed similar histological improvements, whereas the E2+siPGC-1α group still exhibited marked hepatocellular degeneration and inflammation, comparable to the model group ((Figure 1).
Figure 1.
Histopathological changes of liver tissues in each group (HE staining, ×100).
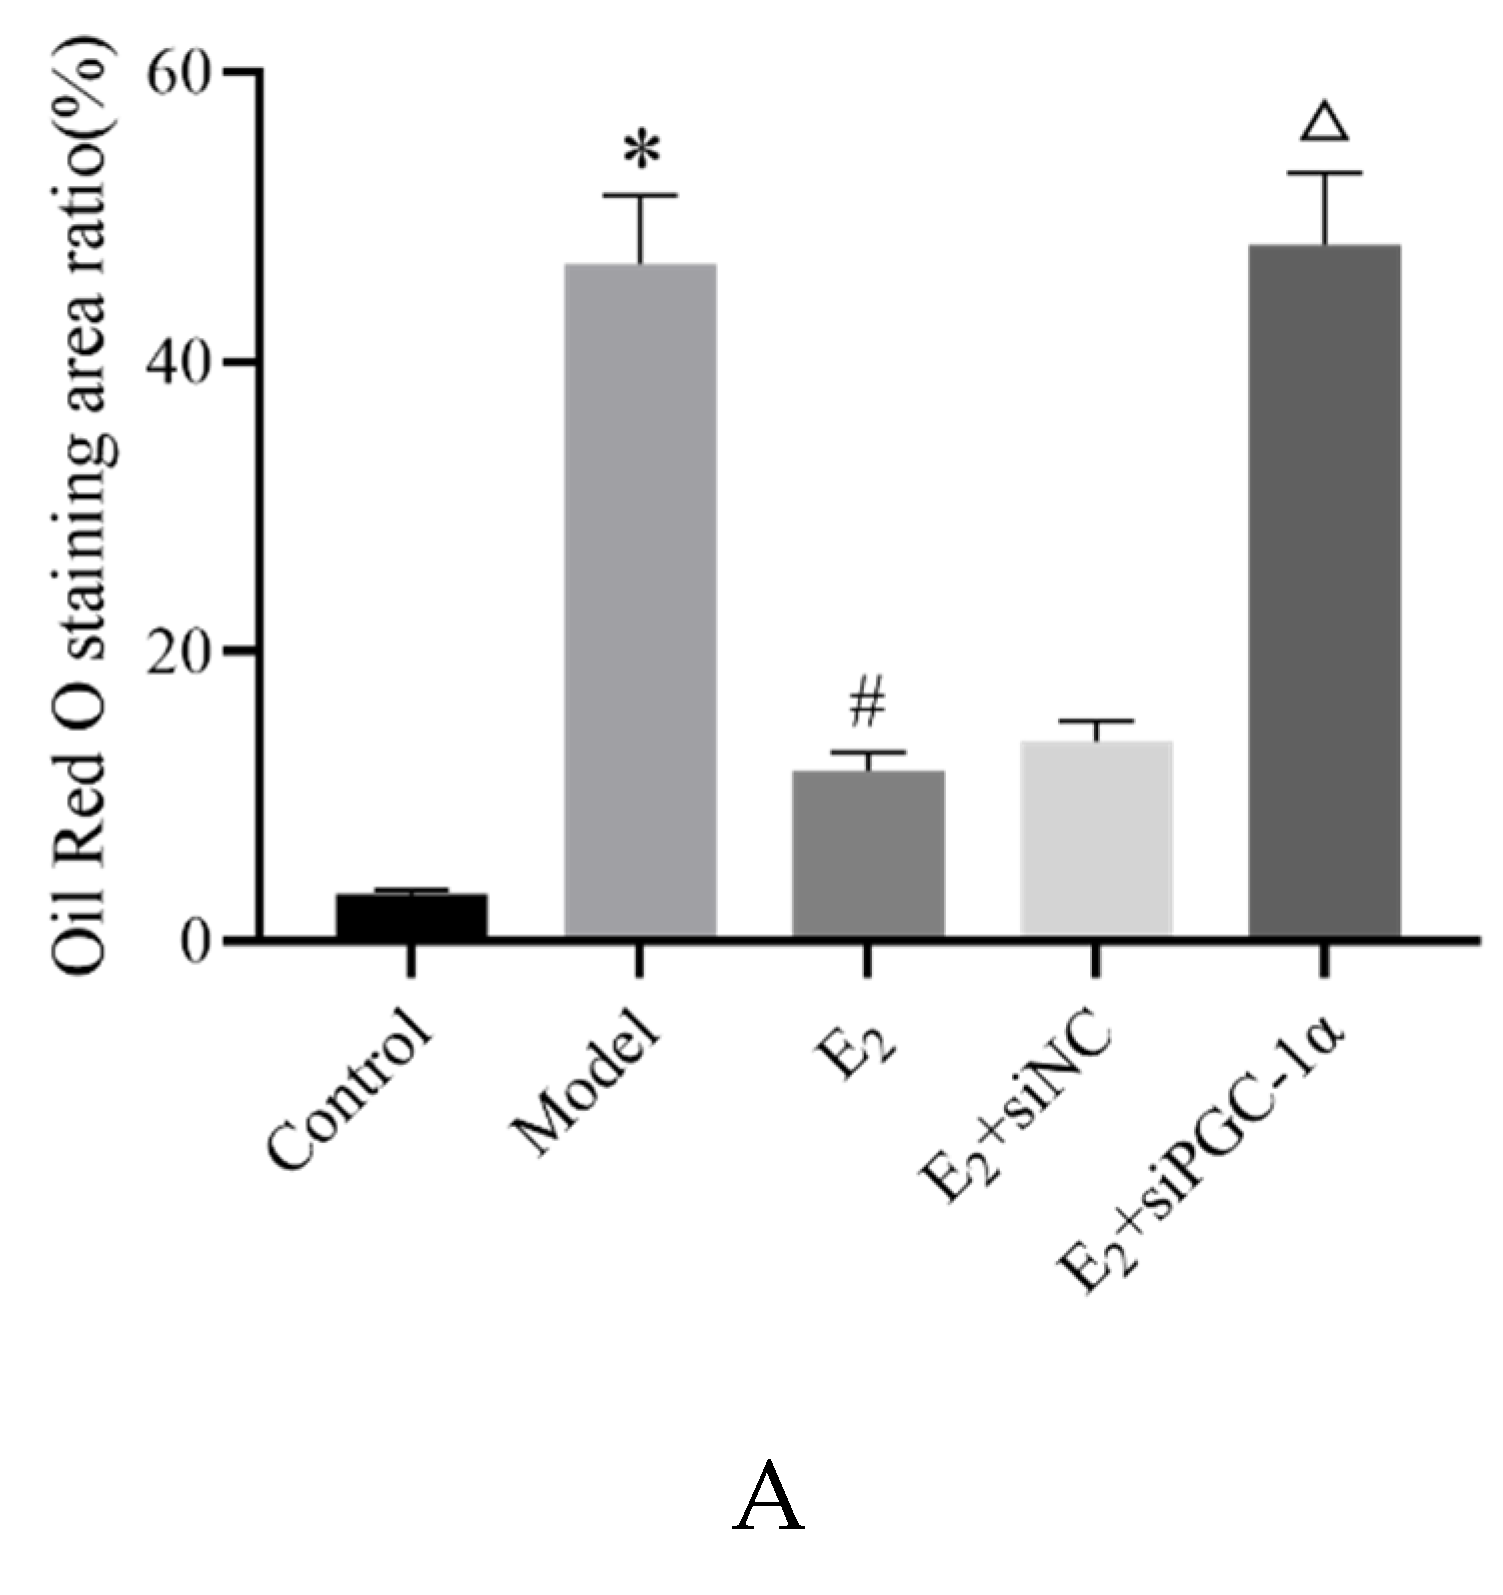
Oil Red O staining was used to assess hepatic lipid deposition. Compared with the control group, the model group exhibited substantial lipid accumulation in the hepatocyte cytoplasm, shown as large red-stained areas, with significantly increased lipid-positive area percentage (P < 0.05). Compared with the model group, E2 treatment reduced red-stained lipid accumulation areas and decreased the percentage of lipid-positive areas (P < 0.05). Compared with the E2+siNC group, the E2+siPGC-1α group showed increased lipid deposition and a significantly higher percentage of red-stained area (P < 0.05) (Figure 2).
Figure 2.
Oil Red O staining of hepatic lipid deposition in each group (×100). Compared with Control group,*P<0.05;Compared with Model group,#P<0.05;Compared with E2+siNC group,△P<0.05.
Figure 2.
Oil Red O staining of hepatic lipid deposition in each group (×100). Compared with Control group,*P<0.05;Compared with Model group,#P<0.05;Compared with E2+siNC group,△P<0.05.
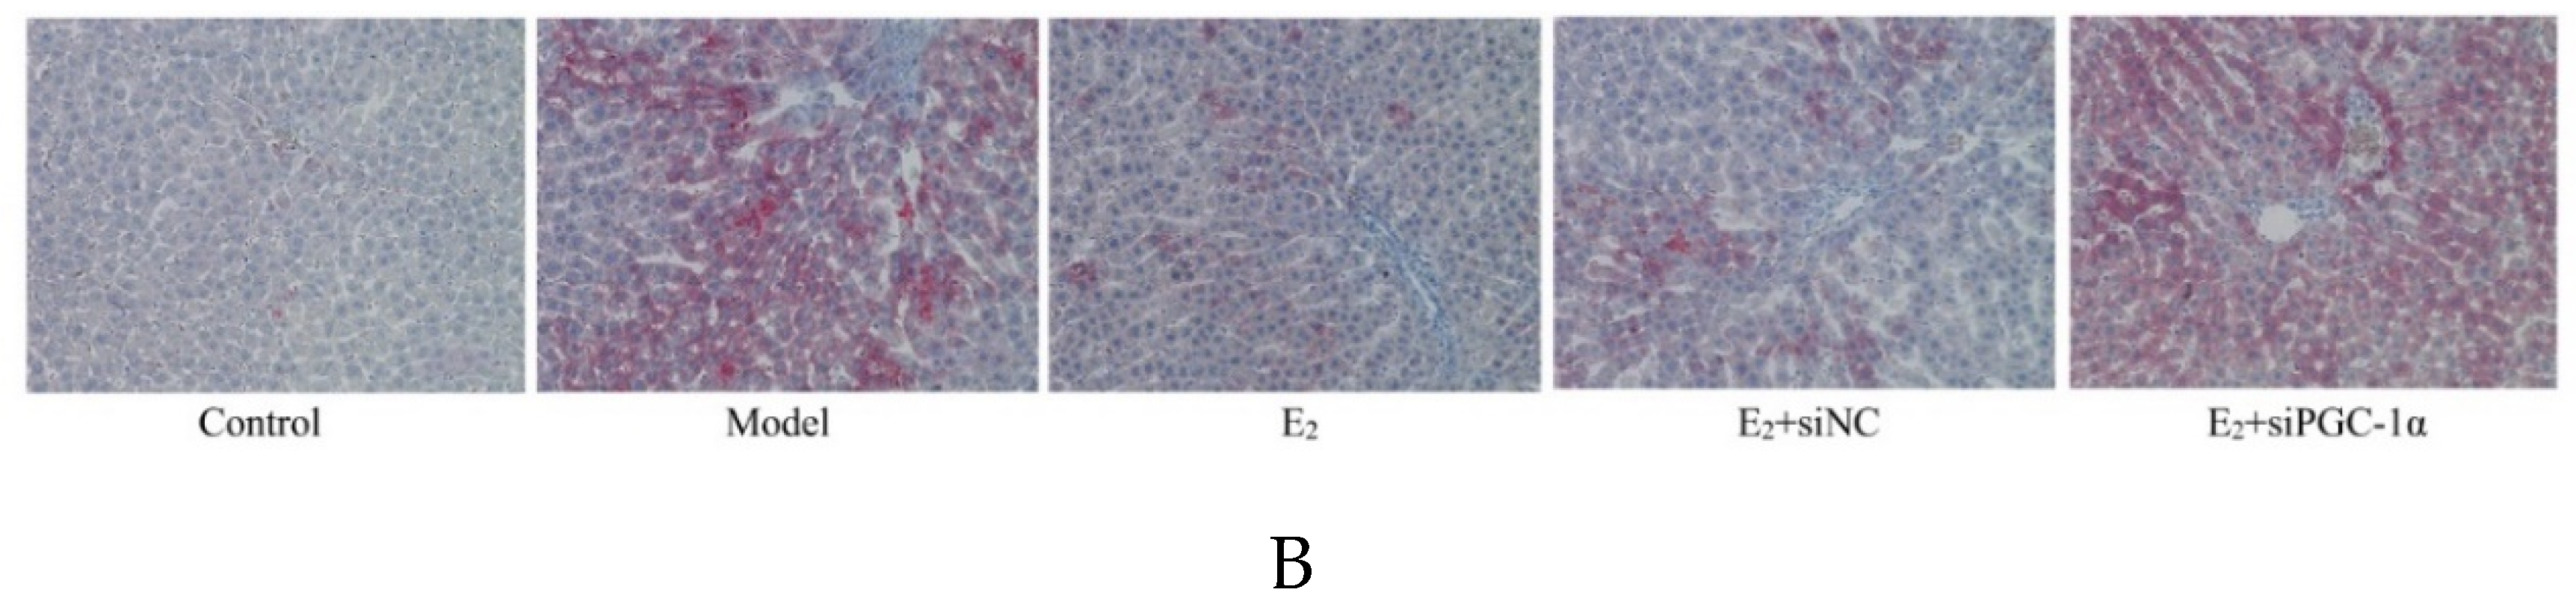
3.5. Protein Expression of the PGC-1α/ERRα Signaling Axis in Liver Tissues
Western blot analysis showed that the relative protein expression levels of PGC-1α and ERRα in liver tissues were significantly lower in the model group compared with the control group (P < 0.05). E2 treatment significantly upregulated the expression of both proteins compared with the model group (P < 0.05). Furthermore, the E2+siPGC-1α group exhibited significantly decreased PGC-1α and ERRα expression levels compared with the E2+siNC group (P < 0.05), indicating that the activation of the ERRα pathway by E2 is dependent on PGC-1α ( Figure 3).
Figure 3.
Protein expression of PGC-1α and ERRα in liver tissues of each group (Western blot). Compared with Control group,*P<0.05;Compared with Model group,#P<0.05;Compared with E2+siNC group,△P<0.05.
Figure 3.
Protein expression of PGC-1α and ERRα in liver tissues of each group (Western blot). Compared with Control group,*P<0.05;Compared with Model group,#P<0.05;Compared with E2+siNC group,△P<0.05.
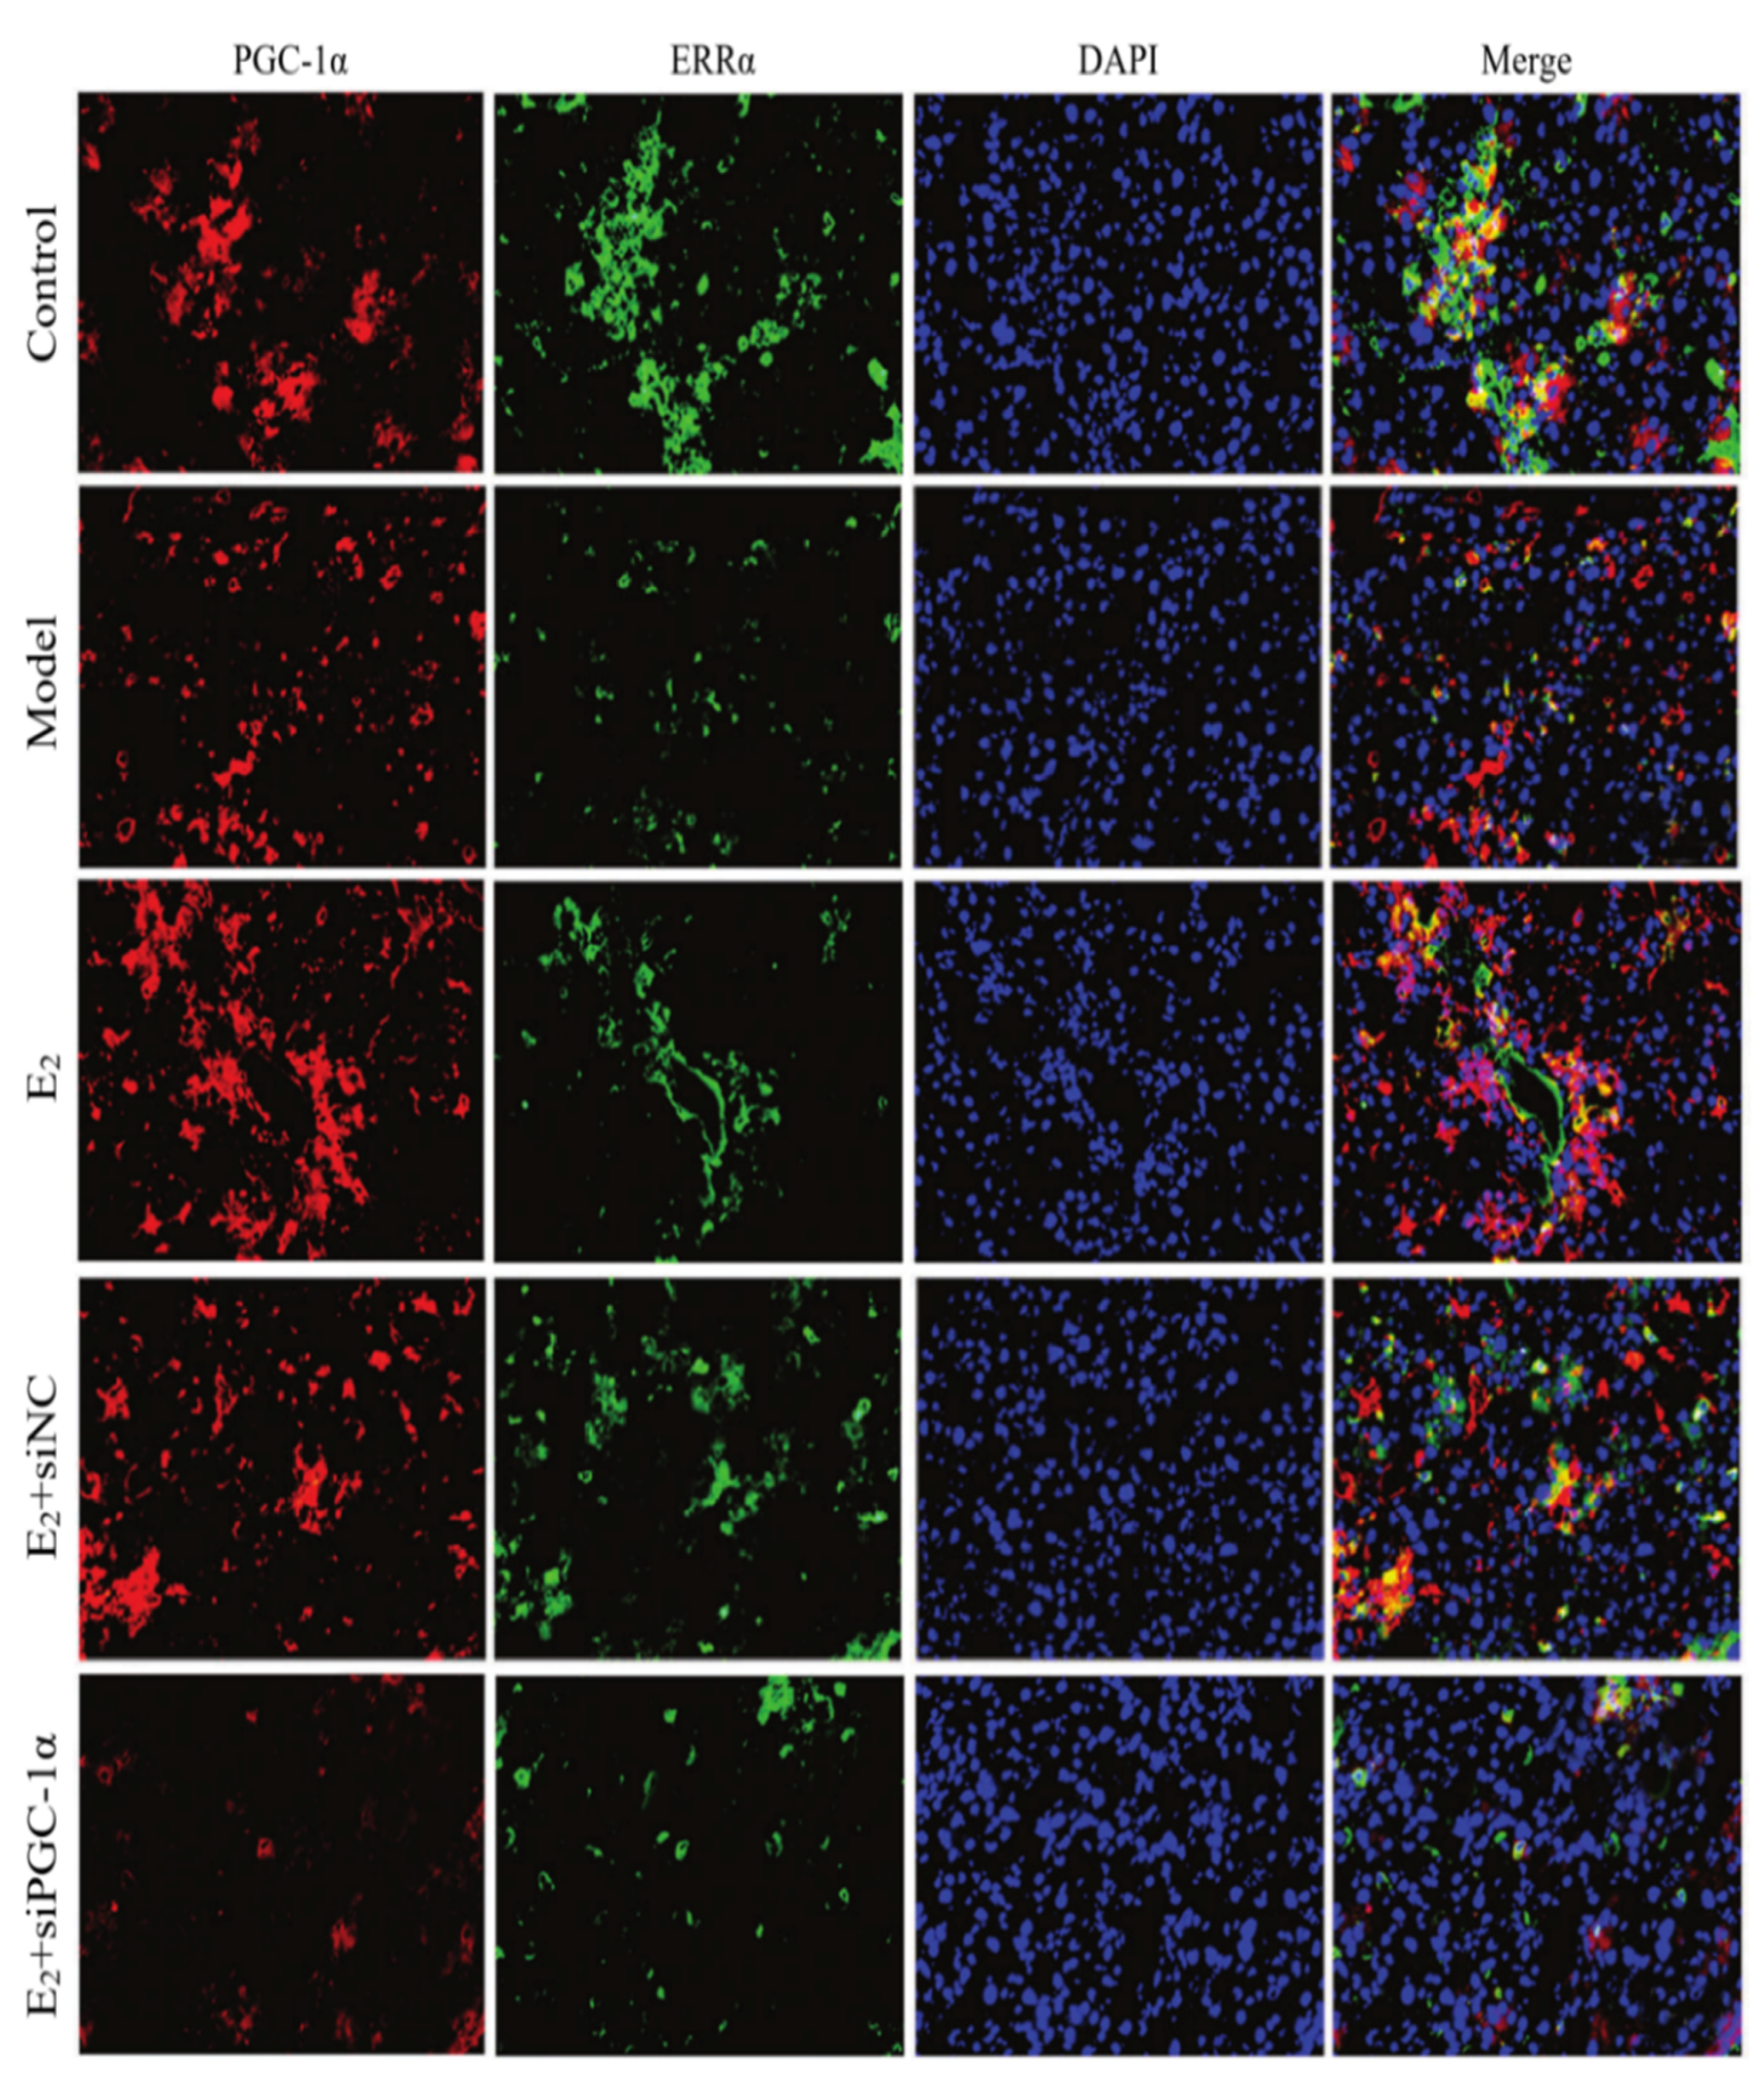
3.6. Interaction Between PGC-1α and ERRα
Confocal immunofluorescence microscopy revealed co-localization of PGC-1α and ERRα in mouse liver tissues. Compared with the control group, the model group exhibited a marked reduction in the overlapping signal of PGC-1α and ERRα. E2 treatment restored this co-localization, showing increased overlap between the two proteins compared to the model group. However, in the E2+siPGC-1α group, the extent of co-localization was notably decreased compared to the E2+siNC group, and appeared similar to the model group, suggesting a weakened interaction between the two proteins following PGC-1α knockdown (Figure 4).
Figure 4.
Co-localization of PGC-1α and ERRα in liver tissues of each group (immunofluorescence double staining, ×100).
Figure 4.
Co-localization of PGC-1α and ERRα in liver tissues of each group (immunofluorescence double staining, ×100).
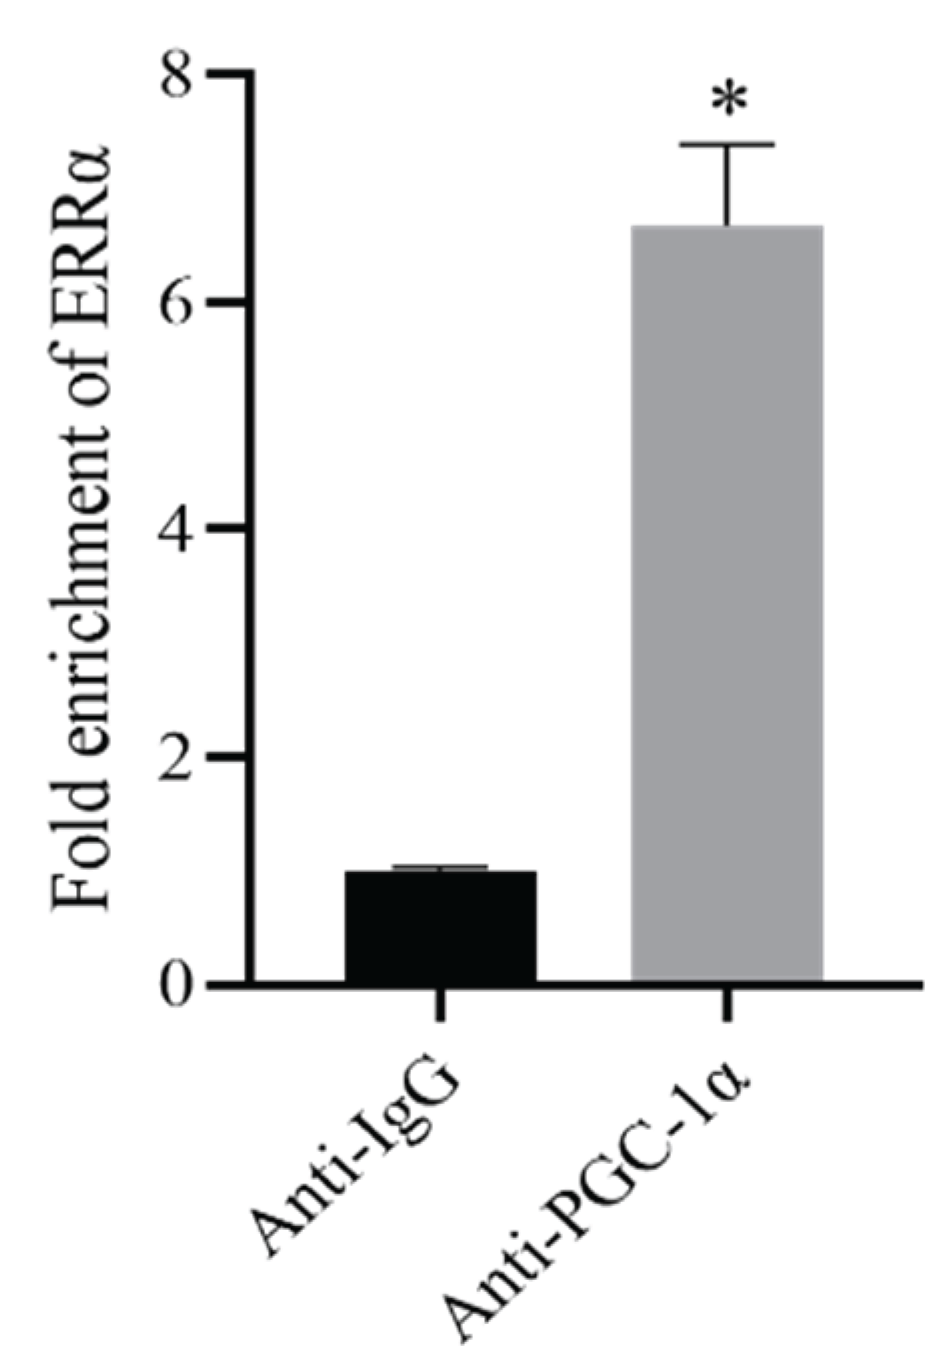
ChIP-qPCR analysis further confirmed the binding relationship between PGC-1α and the ERRα promoter region. Compared with the Anti-IgG group, the PGC-1α-specific antibody group (Anti-PGC-1α) exhibited significantly higher enrichment of the ERRα promoter (P < 0.05), indicating that PGC-1α is strongly enriched at the ERRα promoter site (Figure 5).
Figure 5.
Enrichment of ERRα promoter sequence by PGC-1α (ChIP-PCR). Compared with Control group,*P<0.05.
Figure 5.
Enrichment of ERRα promoter sequence by PGC-1α (ChIP-PCR). Compared with Control group,*P<0.05.
4. Discussion
The relationship between T2DM and NAFLD is complex and bidirectional, with both conditions frequently co-occurring. Insulin resistance and subsequent disturbances in glucose and lipid metabolism are considered major contributing factors to T2DM-associated NAFLD. Current therapeutic strategies primarily rely on lifestyle interventions such as exercise and dietary control, along with pharmacologic agents including insulin, metformin, and glucagon-like peptide-1 (GLP-1) receptor agonists. While these therapies help improve glycemic control and insulin sensitivity, their effects on hepatic injury and lipid deposition remain suboptimal, often associated with transient benefits or undesirable side effects. Therefore, elucidating the molecular mechanisms of T2DM with NAFLD and identifying novel therapeutic targets are critical.
17β-Estradiol (E2), a major estrogen, has emerged as a key regulator in various metabolic disorders, including obesity, diabetes, and NAFLD. E2 has been shown to counteract metabolic dysfunctions by enhancing fatty acid oxidation, promoting the browning of white adipose tissue, and increasing energy expenditure. It also contributes to improved insulin signaling, glucose metabolism, and vascular endothelial function, while mitigating lipid peroxidation and ferroptosis, thereby reducing cardiovascular risks. In the present study, E2 treatment significantly reduced FBG, FINS, and HOMA-IR levels in T2DM+NAFLD mice. E2 also lowered serum TC, TG, and LDL-C levels, suggesting improved glucose and lipid homeostasis and insulin sensitivity. Additionally, E2 administration led to reductions in ALT and AST levels, body weight, liver index, hepatocyte necrosis, inflammation, and fat accumulation in liver tissues. These findings indicate that E2 exerts protective effects on hepatic structure and function in T2DM with NAFLD.
Mechanistically, Western blot analysis revealed that PGC-1α and ERRα protein levels were significantly downregulated in the livers of T2DM+NAFLD mice, suggesting a dysregulated PGC-1α/ERRα axis in the disease state. E2 treatment restored PGC-1α and ERRα expression, implicating this pathway in the therapeutic mechanism of E2. Recent studies have highlighted the metabolic importance of the PGC-1α/ERRα signaling axis. For example, upregulation of PGC-1α was shown to alleviate acetaminophen-induced hepatic injury via regulation of lactate dehydrogenase B expression and mitochondrial quality control. Similarly, α-ketoglutarate was found to activate PGC-1α, mitigating oxidative stress and mitochondrial dysfunction in hyperlipidemia models. Pharmacological activation of ERRα has also demonstrated benefits in enhancing fatty acid oxidation, reducing adiposity, and improving glucose tolerance in metabolic disease models.
In the present study, enhanced co-localization of PGC-1α and ERRα following E2 treatment, along with direct binding of PGC-1α to the ERRα promoter demonstrated via ChIP-qPCR, further supports that E2 mediates its beneficial effects through the activation of the PGC-1α/ERRα axis. Importantly, knockdown of PGC-1α via lentiviral injection abolished these improvements, as evidenced by reduced expression of both PGC-1α and ERRα, decreased co-localization, and exacerbated metabolic and histological impairments. These results provide strong evidence for the role of the PGC-1α/ERRα axis in mediating E2's protective effects against T2DM-associated NAFLD.
In conclusion, this study demonstrates that E2 ameliorates glucose and lipid dysregulation, hepatic injury, and steatosis in T2DM+NAFLD mice, at least in part by activating the PGC-1α/ERRα signaling axis. These findings not only deepen our understanding of the molecular mechanisms underlying E2 action but also identify PGC-1α/ERRα as a promising therapeutic target for T2DM with NAFLD. Nonetheless, further research is needed to elucidate the downstream targets of this signaling axis and to validate these findings in clinical settings.
Institutional Review Board Statement
The study was conducted in accordance with the Declaration of Helsinki, and the protocol was approved by the Experimental Animal Ethics Committee of Xuzhou Medical University (project identification code: XZMC2023-021) on 10 June 2023.
References
- Bonnefond A, Florez JC, Loos RJF, et al. Dissection of type 2 diabetes: a genetic perspective. Lancet Diabetes Endocrinol 2025, 13, 149–164. [Google Scholar] [CrossRef] [PubMed]
- Younossi ZM, Golabi P, Price JK, et al. The global epidemiology of nonalcoholic fatty liver disease and nonalcoholic steatohepatitis among patients with type 2 diabetes. Clin Gastroenterol Hepatol 2024, 22, 1999–2010.e8. [Google Scholar] [CrossRef] [PubMed]
- Paraschou EM, Shalit A, Paschou SA. Non-alcoholic fatty liver disease in patients with type 2 diabetes: diagnostic and therapeutic considerations. Hormones (Athens) 2024, 23, 415–417. [Google Scholar] [CrossRef] [PubMed]
- Guo X, Yin X, Liu Z, et al. Non-alcoholic fatty liver disease (NAFLD) pathogenesis and natural products for prevention and treatment. Int J Mol Sci 2022, 23, 15489. [Google Scholar] [CrossRef]
- Targher G, Corey KE, Byrne CD, et al. The complex link between NAFLD and type 2 diabetes mellitus - mechanisms and treatments. Nat Rev Gastroenterol Hepatol 2021, 18, 599–612. [Google Scholar] [CrossRef]
- Mauvais-Jarvis F, Lindsey SH. Metabolic benefits afforded by estradiol and testosterone in both sexes: clinical considerations. J Clin Invest 2024, 134, e180073. [Google Scholar] [CrossRef]
- Zhang Y, Liu M, Yu D, et al. 17β-estradiol ameliorates postoperative cognitive dysfunction in aged mice via miR-138-5p/SIRT1/HMGB1 pathway. Int J Neuropsychopharmacol 2024, 27, pyae054. [Google Scholar] [CrossRef]
- Galmés-Pascual BM, Martínez-Cignoni MR, Morán-Costoya A, et al. 17β-estradiol ameliorates lipotoxicity-induced hepatic mitochondrial oxidative stress and insulin resistance. Free Radic Biol Med 2020, 150, 148–160. [CrossRef]
- Nomura K, Kinoshita S, Mizusaki N, et al. Adaptive gene expression of alternative splicing variants of PGC-1α regulates whole-body energy metabolism. Mol Metab, 2024, 86, 101968. [Google Scholar] [CrossRef]
- Nakadai T, Shimada M, Ito K, et al. Two target gene activation pathways for orphan ERR nuclear receptors. Cell Res 2023, 33, 165–183. [Google Scholar] [CrossRef]
- El Kebbaj R, Andreoletti P, El Hajj HI, et al. Argan oil prevents down-regulation induced by endotoxin on liver fatty acid oxidation and gluconeogenesis and on peroxisome proliferator-activated receptor gamma coactivator-1α, (PGC-1α), peroxisome proliferator-activated receptor α (PPARα) and estrogen related receptor α (ERRα). Biochim Open, 2015, 1, 51–59. [Google Scholar] [CrossRef]
- Guo T, Yan W, Cui X, et al. Liraglutide attenuates type 2 diabetes mellitus-associated non-alcoholic fatty liver disease by activating AMPK/ACC signaling and inhibiting ferroptosis. Mol Med 2023, 29, 132. [Google Scholar] [CrossRef]
- Tian Y, Hong X, Xie Y, et al. 17β-Estradiol (E2) upregulates the ERα/SIRT1/PGC-1α signaling pathway and protects mitochondrial function to prevent bilateral oophorectomy (OVX)-induced nonalcoholic fatty liver disease (NAFLD). Antioxidants (Basel) 2023, 12, 2100. [Google Scholar] [CrossRef]
- Zhao X, An X, Yang C, et al. The crucial role and mechanism of insulin resistance in metabolic disease. Front Endocrinol (Lausanne), 2023, 14, 1149239. [Google Scholar] [CrossRef] [PubMed]
- Portincasa P, Khalil M, Mahdi L, et al. Metabolic dysfunction-associated steatotic liver disease: from pathogenesis to current therapeutic options. Int J Mol Sci 2024, 25, 5640. [Google Scholar] [CrossRef]
- Muzurović EM, Volčanšek Š, Tomšić KZ, et al. Glucagon-like peptide-1 receptor agonists and dual glucose-dependent insulinotropic polypeptide/glucagon-like peptide-1 receptor agonists in the treatment of obesity/metabolic syndrome, prediabetes/diabetes and non-alcoholic fatty liver disease-current evidence. J Cardiovasc Pharmacol Ther, 2022, 27, 10742484221146371. [Google Scholar] [CrossRef]
- Xiao X, Kennelly JP, Feng AC, et al. Aster-B-dependent estradiol synthesis protects female mice from diet-induced obesity. J Clin Invest 2024, 134, e173002. [Google Scholar] [CrossRef]
- Yokota-Nakagi N, Omoto S, Tazumi S, et al. Estradiol replacement improves high-fat diet-induced insulin resistance in ovariectomized rats. Physiol Rep 2022, 10, e15193. [Google Scholar] [CrossRef]
- Lv Y, Zhang S, Weng X, et al. Estrogen deficiency accelerates postmenopausal atherosclerosis by inducing endothelial cell ferroptosis through inhibiting NRF2/GPX4 pathway. FASEB J 2023, 37, e22992. [Google Scholar] [CrossRef]
- Hong W, Zeng X, Wang H, et al. PGC-1α loss promotes mitochondrial protein lactylation in acetaminophen-induced liver injury via the LDHB-lactate axis. Pharmacol Res, 2024, 205, 107228. [Google Scholar] [CrossRef]
- Cheng D, Zhang M, Zheng Y, et al. α-Ketoglutarate prevents hyperlipidemia-induced fatty liver mitochondrial dysfunction and oxidative stress by activating the AMPK-pgc-1α/Nrf2 pathway. Redox Biol, 2024, 74, 103230. [Google Scholar] [CrossRef]
- Billon C, Schoepke E, Avdagic A, et al. A synthetic ERR agonist alleviates metabolic syndrome. J Pharmacol Exp Ther 2024, 388, 232–240. [Google Scholar] [CrossRef]
Disclaimer/Publisher’s Note: The statements, opinions and data contained in all publications are solely those of the individual author(s) and contributor(s) and not of MDPI and/or the editor(s). MDPI and/or the editor(s) disclaim responsibility for any injury to people or property resulting from any ideas, methods, instructions or products referred to in the content. |
© 2025 by the authors. Licensee MDPI, Basel, Switzerland. This article is an open access article distributed under the terms and conditions of the Creative Commons Attribution (CC BY) license (https://creativecommons.org/licenses/by/4.0/).
Copyright: This open access article is published under a Creative Commons CC BY 4.0 license, which permit the free download, distribution, and reuse, provided that the author and preprint are cited in any reuse.


